
Dietary Guidelines for Children and Adolescents in Australia Infant Feeding Guidelines for
C ONTENTS
Dietary Guidelines for Children and
Adolescents in Australia
incorporating the
Infant Feeding Guidelines for
Health Workers
Endorsed 10 April 2003
Dietary Guidelines for Children and Adolescents in Australia
i
C ONTENTS
© Commonwealth of Australia 2003
ISBN Print: 1864961538
Online:1864961473
This work is copyright. Apart from any use as permitted under the Copyright Act 1968,
no part may be reproduced by any process without prior written permission from AusInfo.
Requests and enquiries concerning reproduction and rights should be addressed to the
Manager, Legislative Services, AusInfo, GPO Box 1920, Canberra ACT 2601.
Email address: [email protected]
The strategic intent of the NHMRC is to provide leadership and work with other relevant
organisations to improve the health of all Australians by:
• fostering and supporting a high quality and internationally recognised research base;
• providing evidence based advice;
• applying research evidence to health issues thus translating research into better health
practice and outcomes; and
• promoting informed debate on health and medical research, health ethics and related
issues.
Materials including a poster, booklet and brochure for the general public and nutrition
educators are available by contacting the Population Health Publications Officer,
Commonwealth Department of Health and Ageing on toll free 1800 020 103 Ext 8654 or at
email: [email protected]
The Australian dietary guidelines and Food for Health information can also be found on the
internet at http://www.nhmrc.gov.au/publications/nhome.htm
Reliable information about food, nutrition and health is also available from:
• Nutrition Australia — www.nutritionaustralia.org
• Dietitians Association of Australia (DAA) — www.daa.asn.au
• Food Standards Australia New Zealand (FSANZ) — www.foodstandards.gov.au who also
produce The official shopper’s guide to food additives and labels: know what you are eating
at a glance (published by Murdoch)
• Local community health centres
• State Departments of health
• Baby, child and youth health centres
• Accredited practising dietitians in private practice (look in the yellow pages)or in hospitals
and community centres
• National Heart Foundation of Australia — www.heartfoundation.com.au
• Diabetes Australia — www.diabetesaustralia.com.au
Disclaimer
This document is a general guide to appropriate practice, to be followed only subject to the
clinician’s judgement in each individual case.
The guidelines are designed to provide information to assist decision–making and are based on
the best information available at the date of compilation.
It is planned to review this Guideline in 2008. For further information regarding the status of this
document, please refer to the NHMRC web address: http://www.nhmrc.gov.au
This document is sold through AusInfo Government Info Bookshops at a price which covers
the cost of printing and distribution only. For publication purchases please contact AusInfo
on their toll-free number 132 447.
ii
Dietary Guidelines for Children and Adolescents in Australia
C ONTENTS
CONTENTS
Preface
vii
The Working Party
xi
Assessing the evidence
xiii
The consultation process
xv
Dietary Guidelines for Children and Adolescents in Australia
xvii
BACKGROUND INFORMATION
1
Encourage and support breastfeeding
Terminology
Background
Scientific basis
Relationship to other guidelines
Conclusion
Evidence
References
1
1
1
4
14
14
14
15
2
Children and adolescents need sufficient nutritious foods
to grow and develop normally
Terminology
Background
Scientific basis
Practical aspects of this guideline
Relationship to other guidelines
Conclusion
Evidence
References
21
21
22
22
30
37
37
37
37
Enjoy a wide variety of nutritious foods
Terminology
Background
Scientific basis
Practical aspects of this guideline
Relationship to other guidelines
Conclusion
Evidence
References
45
45
45
46
51
61
62
62
62
3
Dietary Guidelines for Children and Adolescents in Australia
iii
C ONTENTS
3.1
Eat plenty of vegetables, legumes and fruits
Terminology
Background
Scientific basis
Practical aspects of this guideline
Relationship to other guidelines
Conclusion
Evidence
References
67
67
68
69
73
75
75
75
76
3.2
Eat plenty of cereals (including breads, rice, pasta and noodles),
preferably wholegrain
81
Terminology
81
Background
82
Scientific basis
83
Practical aspects of this guideline
88
Relationship to other guidelines
90
Conclusion
91
Evidence
91
References
91
3.3
Include lean meat, fish, poultry and/or alternatives
Terminology
Background
Scientific basis
Practical aspects of this guideline
Relationship to other guidelines
Conclusion
Evidence
References
99
99
100
104
114
115
116
116
116
3.4
Include milks, yoghurts, cheeses and/or alternatives
Terminology
Background
Scientific basis
Practical aspects of this guideline
Relationship to other guidelines
Conclusion
Evidence
References
123
123
124
126
134
134
136
136
136
3.5
Choose water as a drink
Background
Scientific basis
Practical aspects of this guideline
145
145
147
148
iv
Dietary Guidelines for Children and Adolescents in Australia
C ONTENTS
Relationship to other guidelines
Conclusion
Evidence
References
155
156
156
156
3.6
Limit saturated fat and moderate total fat intake
Terminology
Background
Scientific basis
Practical aspects of this guideline
Relationship to other guidelines
Conclusion
Evidence
References
161
161
162
166
171
171
172
172
172
3.7
Choose foods low in salt
Terminology
Background
Scientific basis
Practical aspects of this guideline
Relationship to other guidelines
Conclusion
Evidence
References
177
177
178
179
185
188
189
189
190
3.8
Consume only moderate amounts of sugars and foods
containing added sugars
Terminology
Background
Scientific basis
Practical aspects of this guideline
Relationship to other guidelines
Conclusion
Evidence
References
195
195
196
202
210
211
211
211
212
Care for your child’s food: prepare and store it safely
Background
Scientific basis
Practical aspects of this guideline
Relationship to other guidelines
Conclusion
Evidence
References
217
217
219
222
230
231
231
232
4
Dietary Guidelines for Children and Adolescents in Australia
v
C ONTENTS
SPECIAL CONSIDERATIONS
A
The foetal origins of disease hypothesis, or Barker hypothesis
Implications for public health
Postnatal growth and breastfeeding
Conclusion
References
237
241
242
242
243
B
Growth, growth references and obesity cut-off points
Definitions
Growth
Growth references
Classification of overweight and obesity in children and adolescents
References
245
245
245
246
250
254
C
The nutrition of Aboriginal and Torres Strait Islander peoples
Current health and nutritional status
Social determinants of Indigenous Australians’ health
Health aspects of traditional diets and lifestyles
Contemporary diet
Contemporary use of traditional foods
The National Aboriginal and Torres Strait Islander Nutrition Strategy
and Action Plan
Dietary guidelines for Australia’s Indigenous peoples
References
257
257
258
260
261
265
D
Social status, nutrition and the cost of healthy eating
Social status and nutrition
The cost of healthy eating
References
273
273
276
278
E
Dietary guidelines and the sustainability of food systems
References
279
281
INFANT FEEDING GUIDELINES FOR HEALTH WORKERS
vi
Dietary Guidelines for Children and Adolescents in Australia
265
266
267
P REFACE
P R E FAC E
The Australian government has been providing nutrition advice for more than 75
years. In the past two decades the National Health and Medical Research Council
has developed and disseminated public health guidelines providing dietary
advice for Australians. The first edition of the Dietary Guidelines for Children
and Adolescents in Australia was published in 1995. This current document is
the first revision of those guidelines; it also incorporates the revised Infant
Feeding Guidelines for Health Workers, which were originally published in 1996.
The Dietary Guidelines for Australian Adults and the Dietary Guidelines for
Older Australians have been published separately. All these guidelines seek to
promote the potential benefits of healthy eating, not only to reduce the risk of
diet-related disease but also to improve the community’s health and wellbeing.
The Australian Food and Nutrition Policy, endorsed in 1992, aims to improve the
health of Australians and reduce the burden of preventable diet-related death,
illness and disability through strategies that support the dietary guidelines. It is
estimated that the current economic cost to the nation of the principal dietrelated conditions—coronary heart disease, stroke and cancer—is about $6
billion a year, so the potential economic benefit of an effective nutrition-based
preventive strategy is enormous.
The Australian Food and Nutrition Policy is based on the principles of good
nutrition, ecological sustainability and equity. This edition of the Dietary
Guidelines for Children and Adolescents is consistent with these principles. The
food system must be economically viable and the quality and integrity of the
environment must be maintained. In this context, among the important
considerations are conservation of scarce resources such as topsoil, water and
fossil energy and problems such as salinity. Other important considerations have
been noted in Food for Health, the Nutrition Taskforce’s report to the New
Zealand Ministry of Health. They include change in consumer demand towards
foods that are fresher and lower in fat and the recent restructuring of the food
industry from a protected industry to an open, competitive one. Although this
has led to greater concentration of ownership, pricing strategy and policy
development in the food sector, it has also given health policy makers greater
access to the industry. In addition, globalisation is playing an increasing role in
framing the management of the Australian food supply.
This book describes the scientific rationale for the guidelines and is intended for
health professionals. Other documents will be produced in a format that is more
suitable for children, adolescents and their carers. The guidelines may also be
useful for health professionals wanting to develop diets for children and infants
in other health circumstances: it must always be remembered, however, that
Dietary Guidelines for Children and Adolescents in Australia
vii
P REFACE
these guidelines are for healthy children and adolescents and may not satisfy the
specific nutritional requirements of children and adolescents with particular
diseases or conditions. For the purposes of these Guidelines for Children and
Adolescents, infants are defined as children under the age of 12 months, toddlers
as children aged 1 to 2 years and preschoolers as children aged 3 to 5 years;
young child means a child aged 1 to 5 years, primary school age is 6 to 11 years,
and an adolescent is someone aged 12 to 18 years.
The Dietary Guidelines are an essential tool to support broader strategies to
improve nutrition outcomes in Australia as outlined in Eat Well Australia: An
Agenda for Action in Public Health Nutrition which was endorsed in 2001 by the
Australian Health Ministers
Compared with the previous edition, this edition of the guidelines focuses more
on food groups and lifestyle patterns, moving away from specific nutrients. In
particular, the references to the Australian Guide to Healthy Eating will make it
easier for children, adolescents, carers and nutrition educators to implement the
guidelines. The Australian Guide to Healthy Eating is not the only food guide in
use in Australia, and the Working Party recognises the potential for using other
suitable guides to promote diets consistent with these guidelines.
The guidelines apply to the total diet: they should not be used to assess the
‘healthiness’ of individual food items, nor should individual guidelines be taken
in isolation. Some of the guidelines detail the relationships between different
food groups as part of the total diet; others deal with aspects of nutrition where
more care is needed and further aspects of nutrition and a healthy lifestyle
Two of the guidelines relate to the quantity and quality of the food needed by
children and adolescents—getting the right types of foods in the appropriate
amounts to grow and to meet the body’s nutrient needs. The ‘variety’ guideline
creates a positive setting for nutrition and reflects the fact that good, nutritious
food is one of the great pleasures of life. The sections of this guideline detail the
relationships between different food groups as part of the total diet. Given the
major epidemic of obesity we are currently experiencing in Australia, especially
among children, the other of these two guidelines deals with appropriate
amounts of food for growth whilst also encouraging children and adolescents to
be active. Another of the guidelines stresses the need to be vigilant in terms of
food safety and, given the increasing awareness of the importance of early
nutrition, there is a guideline encouraging everyone to support and promote
breastfeeding.
The guidelines are not ranked in order of importance; rather, they form a
consistent and complete package when considered together. Detailed information
about requirements for specific nutrients in the Australian diet is provided in the
NHMRC’s Recommended Dietary Intakes for Use in Australia. The recommended
dietary intakes and the dietary guidelines complement each other in providing
comprehensive nutrition advice for the Australian community.
The revision process involved extensive consultation with the Australian
community, the food industry and experts. The guidelines are based on the best
viii
Dietary Guidelines for Children and Adolescents in Australia
P REFACE
evidence available, although the Working Party notes that in some cases the
evidence for each guideline statement is not complete. In these instances,
guidance is provided with the community’s safety and health as the primary
concern. The guidelines are a distillation of current knowledge about the
relationship between diet, growth and development, and disease; the nutrients
available in the Australian food supply; and the contribution diet can make to
optimising quality of life and reducing the levels of morbidity and mortality
among Australians. Their implementation will result in significant health gains for
the community.
Each guideline is supported by background information prepared by members of
the Working Party, with some additional assistance, as detailed in the next
section. Dr Katrine Baghurst, from CSIRO Health Sciences and Nutrition, and
Professor Colin Binns, from the School of Public Health at Curtin University of
Technology, chaired the Working Party.
Katrine Baghurst
Colin Binns
September 2002
Dietary Guidelines for Children and Adolescents in Australia
ix
P REFACE
T H E W O R K I N G P A RT Y
The Working Party developed the guidelines in accordance with National Health
and Medical Research Council procedures and in keeping with the following
terms of reference established by the NHMRC.
TERMS
•
•
OF REFERENCE
Undertake a review of the Dietary Guidelines for Australians … and the
Dietary Guidelines for Children and Adolescents … and other related
NHMRC dietary guidelines as identified.
Undertake broad consultation to develop a suite of resources for both sets
of guidelines including:
–
•
•
comprehensive scientific background papers explaining the rationale
for each guideline
– appropriate consumer resources.
Produce a Dissemination and Evaluation Plan for both sets of guidelines.
Report to the Health Advisory Committee.
MEMBERS
OF THE
W O R K I N G P A RT Y
Dr Katrine Baghurst (Co-chair)
CSIRO Health Sciences and Nutrition
Prof. Colin Binns (Co-chair)
School of Public Health, Curtin University of Technology
Prof. A Stewart Truswell
Human Nutrition Unit, University of Sydney
Dr Amanda Lee
Public Health Services, Queensland Department of Health
Dr Peter Williams
Smart Foods Centre, School of Nutrition and Dietetics, University of Wollongong
Dr Ivor Dreosti
CSIRO Health Sciences and Nutrition
Assoc. Prof. Malcolm Riley
Nutrition & Dietetics Unit, Monash University
Dietary Guidelines for Children and Adolescents in Australia
xi
W ORKING P ARTY
Ms Isobel Brown
Government Relations Australia Ltd
Dr Merelie Hall
Royal Australian College of General Practitioners
Dr Geoff Davidson
Gastroenterology Unit, Women’s and Children’s Hospital, Adelaide
Ms Pat Crotty
Consumer representative
Ms Sue Jeffreson
Food Standards Australia New Zealand
Secretariat
Ms Karina Desarmia, Ms Lorraine O’Connor, Ms Tess Hill and Ms Linda Robertson
National Health and Medical Research Council
Ms Jacinta Dugbaza, Ms Leticia White, Ms Michelle Coad
Commonwealth Department of Health and Ageing
OTHER
C O N T R I B U TO R S
A number of the chapters were co-authored by experts, and the Working Party
thanks them for their contribution.
Dr Trevor Beard
Menzies Centre for Population Health Research, University of Tasmania
Dr Tim Gill
International Taskforce on Obesity, Human Nutrition Unit, University of Sydney
Ms Kirsti McVay, Ms Rochelle Finlay and Ms Patricia Blenman
Food Standards Australian New Zealand
Dr Mi Kyung Lee
School of Public Health, Curtin University of Technology
Assoc. Prof. David Forbes
Department of Child Health, University of Western Australia
The Working Party expresses particular thanks to Ms Dympna Leonard (Tropical
Public Health Unit, Queensland Health, Cairns) for her contribution to the
section on the nutrition of Aboriginal and Torres Strait Islander peoples.
Ms Leanne Lester (School of Public Health, Curtin University of Technology), and
Ms Sally Record (CSIRO Health Sciences and Nutrition) helped with statistical
analysis of the results of the 1995 National Nutrition Survey.
xii
Dietary Guidelines for Children and Adolescents in Australia
W ORKING P ARTY
ASSESSING THE EVIDENCE
The National Health and Medical Research Council has released a guide called
How to Use the Evidence Assessment and Application of Scientific Evidence. This
guide relates, however, to evidence assessment in connection with clinical
practice. In many cases evidence-based guidelines for clinical practice deal with
evidence associated with a specific disease and a specific therapeutic agent.
Similar criteria are not easily used for evidence assessment related to food and
the maintenance of general community health and wellbeing, which is the
primary focus of dietary guidelines.
A number of initiatives are under way around the world to try to develop an
evidence-based approach to nutrition and health, but this has generally been in
response to the need for ‘proof’ in relation to health claims for food components.
Food Standards Australia New Zealand (formerly the Australia New Zealand Food
Authority) has developed a set of proposed levels of evidence for food or health
claims that is similar to, but somewhat broader in scope than, the NHMRC
approach for clinical guidelines. Nevertheless, the FSANZ set is still primarily
intended for assessing evidence of the efficacy of individual nutrients or food
components in relation to a specific health outcome.
The Working Party considered, however, that it would still be useful to consider
the NHMRC designation of levels of evidence for clinical practice in relation to
the scientific data discussed in this document. These levels of evidence are
outlined in the box.
NHMRC levels of evidence
I
Evidence obtained from a systematic review of all relevant randomised controlled
trials.
II
Evidence obtained from at least one properly designed randomised controlled trial.
III-1
Evidence obtained from well-designed pseudo-randomised controlled trials
(alternate allocation or some other method).
III-2
Evidence obtained from comparative studies (including systematic reviews of such
studies) with concurrent controls and allocation not randomised, cohort studies,
case-control studies, or interrupted time series with a control group.
III-3
Evidence obtained from comparative studies with historical control, two or more
single-arm studies, or interrupted time series without a parallel control group.
IV
Evidence obtained from case series, either post-test or pre-test/post-test.
Source: National Health and Medical Research Council. A guide to the development,
implementation and evaluation of clinical practice guidelines. Canberra: NHMRC, 1999.
Dietary Guidelines for Children and Adolescents in Australia
xiii
A SSESSING
THE EVIDENCE
Six levels of evidence are designated by the NHMRC. Level I is based on a
systematic review of all relevant randomised controlled trials and Level II is
based on evidence obtained from at least one properly designed randomised
controlled trial. There are very few Level I and Level II food-based nutrition
trials, although some nutrient-supplement trials fall into these categories. Most
food–health studies fall into Level III, the level of evidence that includes study
designs such as cohort studies, case-control studies, and comparative ecological
studies with historical controls.
Because of the nature of the dietary guidelines, the background papers were
developed as a result of a process of comprehensive, rather than systematic,
reviewing of the literature. At the conclusion of each guideline, there is a
summary of the NHMRC levels of evidence for the literature cited.
The NHMRC notes, ‘A decision should be made about what is feasible and
appropriate in a given situation and the extent to which reasonable standards
have been met by the available body of evidence’.
The evidence base for the background papers was developed using a variety of
data bases and search terms. The literature was assessed using data bases and
abstracting systems including the Cochrane Data Base for Randomised Control
Trials; Medline, HealthStar, CINAHL using ‘systematic review’ filter, PubMed,
Embase, Food & Technology Abstracts, Emerald, BioSis, Australasian Medical
Index, Science Direct, Current Contents and searches of citations found in
identified papers. Terms used in searches included food groupings such as fruits,
vegetables, nuts & seeds, legumes, cereals, meat, poultry, fish, dairy, milk,
yoghurt, cheeses, soy, water, alcohol, breastmilk (and breast feeding) and
dietary/food intake patterns as well as nutrients such as fats (total and types),
carbohydrates sugars, starches, protein, iron, zinc, B12, calcium and salt as well
as physical activity. These were investigated where relevant in relation to health
outcomes such as overweight, obesity, growth, heart disease, cancers of various
sorts, diabetes, bone density and osteoporosis, cognition and ageing. Whilst
searches concentrated on human studies and those available in the English
language, findings from some animal studies were included to provide evidence
on possible mechanisms. The reviews were completed in January 2002 but some
key papers published since then have been included.
xiv
Dietary Guidelines for Children and Adolescents in Australia
A SSESSING
THE EVIDENCE
T H E C O N S U LTAT I O N P R O C E S S
Development of the Dietary Guidelines for Children and Adolescents,
incorporating the Infant Feeding Guidelines for Health Workers, involved
consultation with the Australian community and with experts working in the
fields of public health and nutrition. Preliminary consultation took place from
December 2000 until May 2001 and involved the following:
•
analysis of 104 completed and returned questionnaires dealing with the
content and use of the first edition of the dietary guidelines
•
establishment of an interactive website providing information about the
review of the guidelines
•
several meetings with stakeholders.
The public consultation process took place between July and August 2001,
allowing about six weeks for consideration of the draft guidelines and
preparation and lodgment of submissions. Notification was published in the
Commonwealth of Australia Gazette and on the NHMRC website. Copies of draft
documents and supporting information were available free of charge from the
Office of the NHMRC and the website. In addition, notices were placed in other
publications and with media such as newspapers and radio and circulated to
bodies expected to be interested.
The Dietary Guidelines for Children and Adolescents in Australia, incorporating
the Infant Feeding Guidelines for Health Workers, were jointly submitted for
consultation with the Dietary Guidelines for Australian Adults. Ninety-three
submissions were received. The Working Party met in September 2001 to
consider the submissions; initial revisions were made by the end of December
2001 and were then reconsidered by the Working Party.
Additional specialist comment was obtained from Dr Peter Hartman (University
of Western Australia), Dr Jane Scott (University of Glasgow), Dr Karen Cashell
(University of Canberra), Ms Anne Croker (Australian Breastfeeding Association—
formerly the Nursing Mothers Association of Australia), Ms Judy Seal (Strategic
Inter-Governmental Nutrition Alliance and Tasmania Health), Dr Wendy Oddy
(NHMRC fellow, Curtin University of Technology) and Dr Gulnara Semonova
(Director, Australian Breastfeeding Association Lactation Resource Centre).
The document was then technically edited by Ms Chris Pirie.
Dietary Guidelines for Children and Adolescents in Australia
xv
A SSESSING
xvi
THE EVIDENCE
Dietary Guidelines for Children and Adolescents in Australia
A SSESSING
THE EVIDENCE
D I E TA RY G U I D E L I N E S F O R C H I L D R E N A N D
ADOLESCENTS IN AUSTRALIA
Encourage and support breastfeeding
Children and adolescents need sufficient nutritious foods to grow and
develop normally
•
•
Growth should be checked regularly for young children
Physical activity is important for all children and adolescents
Enjoy a wide variety of nutritious foods
Children and adolescents should be encouraged to:
•
•
•
•
Eat plenty of vegetables, legumes and fruits
Eat plenty of cereals (including breads, rice, pasta and noodles), preferably
wholegrain
Include lean meat, fish, poultry and/or alternatives
Include milks, yoghurts, cheese and/or alternatives
–
•
Reduced-fat milks are not suitable for young children under 2 years,
because of their high energy needs, but reduced-fat varieties should
be encouraged for older children and adolescents
Choose water as a drink
–
Alcohol is not recommended for children
and care should be taken to:
•
Limit saturated fat and moderate total fat intake
•
•
– Low-fat diets are not suitable for infants
Choose foods low in salt
Consume only moderate amounts of sugars and foods containing added sugars
Care for your child’s food: prepare and store it safely
These guidelines are not in order of importance.
Each one deals with an issue that is key to optimal health.
Two relate to the quantity and quality of the food we eat—getting the right types of foods
in the right amounts to meet the body’s nutrient needs and to reduce the risk of chronic
disease. Given the epidemic of obesity we are currently experiencing in Australia, one of
these guidelines specifically relates to the need to be active and to avoid overeating.
Another guideline stresses the need to be vigilant about food safety, and, in view of the
increasing awareness of the importance of early nutrition, there is a further guideline that
encourages everyone to support and promote breastfeeding.
Dietary Guidelines for Children and Adolescents in Australia
xvii
A SSESSING
THE EVIDENCE
Background information
Dietary Guidelines for Children and Adolescents in Australia
xix
1. E NCOURAGE
1
AND SUPPORT BREASTFEEDING
E N C O U R A G E A N D S U P P O RT
BREASTFEEDING
Colin Binns
TERMINOLOGY
Exclusive breastfeeding
Exclusive breastfeeding means that an infant is receiving only breastmilk, which
includes expressed breastmilk and milk from a wet nurse. The infant might also
receive medications and vitamins or minerals, as required.
Complementary food
Complementary food means any food—be it manufactured or locally prepared—
that is suitable as a complement to breastmilk or infant formula when either
becomes insufficient to satisfy an infant’s nutritional requirements. Such food is
also commonly called weaning food or breastmilk supplement.1
Research methodology and data collection
A variety of methods are used to study and record breastfeeding rates. Reported
studies use different sampling methods and may rely on mothers’ memory of
past events. Studies that use frequent interviews of a representative cohort and
use standard definitions are more accurate.2
B AC K G RO U N D
Breastfeeding is the normal and most appropriate method for feeding infants and
is closely related to immediate and long-term health outcomes. Exclusive
breastfeeding to the age of six months gives the best nutritional start to infants
and is now recommended by a number of authorities.3–6 The World Health
Organization reviewed breastfeeding duration and identified more than 3000
references <www.who.int/inf-pr-2001/en/note2001-07.html>. The WHO Expert
Consultation then recommended exclusive breastfeeding for six months, then
introduction of complementary foods and continued breastfeeding thereafter. It is
recommended that breastfeeding continue until 12 months of age and thereafter
as long as mutually desired.5 In many societies breastfeeding continues well
beyond the age of 12 months, with benefit to both infant and mother.7,8
If for any reason breastmilk is discontinued before 12 months of age, a
commercial infant formula should be used—instead of cow’s milk—as the main
source of milk. Breastmilk from a healthy, well-nourished mother is adequate as
Dietary Guidelines for Children and Adolescents in Australia
1
1. E NCOURAGE
AND SUPPORT BREASTFEEDING
the sole source of nutrients for full-term infants from birth until about six months
of life. Low-birthweight infants should have their nutritional needs assessed by a
paediatrician.
Apart from their nutritional suitability, colostrum and mature human milk are
hygienic and provide immunoglobulins and other anti-infective agents, which
play a major role in protecting infants against infection and disease. Breastmilk
also contains a number of unique growth factors9 and is a convenient,
inexpensive food source posing no environmental cost. (See the Infant Feeding
Guidelines for Health Workers, which are incorporated in the Dietary Guidelines
for Children and Adolescents in Australia, for a more detailed discussion of
breastfeeding.)
Current practices
Although the majority (80–90 per cent) of women in Australia commence
breastfeeding, just under a third of them have introduced other foods or have
stopped breastfeeding by three months.8 There is also evidence of considerable
variation between socio-economic groups in terms of both the acceptance and
the maintenance of breastfeeding in the Australian community: women in higher
socio-economic groups are more likely to breastfeed.10,11 Support and
encouragement from family members, friends and the whole community are
required if breastfeeding rates and the duration of breastfeeding are to be
maximised.
From a public health viewpoint, there is considerable room for improvement in
both the rates and the duration of breastfeeding in Australia; such improvements
offer benefits for maternal, infant and child health. An initiation rate in excess of
90 per cent, and 80 per cent of mothers breastfeeding at six months, are
achievable goals in Australia. Of the developed countries, Norway consistently
reports the highest breastfeeding rates, ones that Australia should strive to
achieve:
•
Ninety-two per cent of mothers are breastfeeding their child when it is
three months of age.
•
Eighty per cent are breastfeeding their child at six months.
•
Forty per cent are still breastfeeding their child at 12 months.12
The advantages of breastfeeding continue beyond the six-month period, and
Australians other than mothers can play an important part in making
breastfeeding an easy and viable option. Encouragement and support—from a
combination of hospitals and health centres, families, friends, social groups and
places of work—will ensure that women can breastfeed successfully.
Breastfeeding is included in these Dietary Guidelines for Children and
Adolescents in acknowledgment of the nutritional, health, social and economic
benefits it provides for the Australian community and of the need for family and
community support. Breastfeeding promotion should be combined with other
health-promotion programs.13
2
Dietary Guidelines for Children and Adolescents in Australia
1. E NCOURAGE
AND SUPPORT BREASTFEEDING
Historically, breastfeeding or the use of a wet nurse was the only way to feed an
infant. Rickets, scurvy and hypernatraemia were associated with early artificial
feeding: knowledge of infant requirements was limited before the development
of modern infant formula. In reviews of infant feeding in Australia, Hitchcock
and Lund-Adams and Heywood14 describe the decline in breastfeeding rates in
Australia and other developed countries that occurred during the 20th century.
Breastfeeding reached a low point in Australia in the 1960s; records from Victoria
show that only 50–60 per cent of mothers were breastfeeding on discharge from
hospital and only 21 per cent after three months.16 In the early 1970s
breastfeeding rates started to rise again in Australia and comparable overseas
countries, beginning in the higher socio-economic groups. By 1983 both the
prevalence and the duration of breastfeeding in Australia were among the
highest in the western world, with 85 per cent at discharge and 54–55 per cent
three months later.17 Breastfeeding has remained around this level for the past
two decades. In 1984–85 a joint survey in Western Australia and Tasmania
indicated a continued trend to increasing breastfeeding rates and duration.
During the preceding five years, prevalence rates at hospital discharge rose from
82 to 86 per cent in Western Australia and from 72 to 81 per cent in Tasmania. At
six months after discharge 45 per cent of mothers in both states were still
breastfeeding.18
In 1992–93 in Western Australia and in 1995–96 in Queensland, Scott et al.11
conducted a survey that found a continuing trend to increased breastfeeding
rates and duration in those states. In the preceding years the hospitals had a
breastfeeding discharge rate of 82 per cent, and at six months 46 per cent of
mothers were still breastfeeding. Women born in Australia or New Zealand were
almost twice as likely to be breastfeeding at discharge compared with women
born in other countries.
Donath and Amir10 analysed the data from the 1995 National Nutrition Survey
and found that breastfeeding rates were 81.8 per cent on discharge from hospital
and 57.1 per cent fully breastfed at three months. At six months, it is estimated
that 18.6 per cent of babies are fully breastfed and 46.2 per cent fully or partially
breastfed. At one year of age, 21.2 per cent of infants are receiving some
breastmilk. Thus, in Australia at present fewer than 20 per cent are achieving the
goal of being exclusively breastfed to age six months.
Australia has a long history of promoting and supporting breastfeeding in its
public health policy. The importance of breastfeeding led to its inclusion in the
Dietary Guidelines for Australians endorsed by National Health and Medical
Research Council in June 1982. In 1981 Australia became a signatory to the WHO
International Code of Marketing of Breast-milk Substitutes, the stated aim of
which was:
… to contribute to the provision of safe and adequate nutrition for infants,
by the protection and promotion of breastfeeding and by ensuring the
proper use of breastmilk substitutes, when these are necessary, on the
basis of adequate information and through appropriate marketing and
distribution. 14
Dietary Guidelines for Children and Adolescents in Australia
3
1. E NCOURAGE
AND SUPPORT BREASTFEEDING
The Infant Feeding Guidelines for Health Workers provide more information on
the WHO Code and its implications for health workers. In 1987 the Nutrition
Taskforce of the Better Health Commission set targets for the year 2000 of
increasing the prevalence of breastfeeding at discharge from hospital to 95 per
cent and increasing the proportion still breastfeeding at three months to 80 per
cent.19 The rationale behind the targets was to continue the promotion of
breastfeeding, so that rates in at-risk groups would increase, the average period
of breastfeeding would be lengthened, and overall levels of breastfeeding would
be maintained. With current knowledge of the benefits of breastfeeding and the
health risks for infants not receiving breastmilk, extending the goal to 80 per
cent breastfeeding at six months would be appropriate.
SCIENTIFIC
BASIS
Breastfeeding physiology
Milk production and secretion are under endocrine and autocrine control.20 When
the infant suckles at the breast, mechano-receptors are stimulated, resulting in
the release of oxytocin and prolactin into the blood, from the posterior and
anterior pituitary respectively. Oxytocin stimulates the contraction of cells and
secretion of milk from the alveolus; prolactin is responsible for milk production
in the alveolus. The commonly termed let-down reflex can also be stimulated by
seeing the infant or hearing its cries; it can be inhibited by stress such as pain or
anxiety.21 Close mother–child contact immediately after birth helps to establish
lactation, and frequent suckling or feeding on demand helps to maintain it.22,23
Milk synthesis is related to the rate at which the breast is emptied.20
A review of early contact practices found, ‘Mothers should have contact with
their babies as soon after birth and for as long as they wish. Interventions aimed
at either delaying or speeding up the time of the first feed should be avoided’.24
Hospital practices at the time of birth can be the first line of support for a new
mother: difficulties encountered can be quickly resolved by staff with
appropriate experience, and hospitals can encourage ‘rooming-in’ to facilitate
frequent mother–child contact.
Breastmilk is uniquely suited to the needs of infants throughout the duration of
lactation and provides all the nutrients required for at least the first six months of
life. The composition of breastmilk is compromised only in mothers with severe
malnutrition. Breastmilk is a living tissue that cannot be duplicated by any other
means. It is very important for pre-term infants.
Colostrum, the secretion produced in the first few days after giving birth,
provides all the nutrients, including water, required by the neonate. In
composition, it differs from both transitional milk and mature milk, containing
higher levels of protein, vitamin A and vitamin B12 and less fat. It also contains
lactoferrin, immunoglobulin A, enzymes, maternal antibodies, living cells—
leukocytes, neutrophils and macrophages—and non-pathogenic bacteria, which
4
Dietary Guidelines for Children and Adolescents in Australia
1. E NCOURAGE
AND SUPPORT BREASTFEEDING
act in the gut of the newborn to limit the growth of pathogenic bacteria and
viruses and to protect against illness.22,25
The composition of this first secretion after birth gradually changes as lactation is
established and production of milk begins in the breast tissue. By seven to
fourteen days after birth, lactation should be established and the transition from
colostrum to mature milk should be under way. The nutrient composition of
mature expressed human milk shows variation in and between individuals—
depending on maternal diet and the stage of lactation—although mean ranges
are remarkably consistent for the species. The energy content is based on the fat,
protein and carbohydrate levels and varies between 270 and 315 kilojoules (65–
75 kcal) per 100 millilitres, largely as a result of variation in the fat content. Fat
typically increases three- to four-fold during a single feed and also shows diurnal
variation. It provides much of the energy and omega-3 and omega-6 long-chain
polyunsaturated fatty acids; it also carries the fat-soluble vitamins A, D, E and K,
as well as prostaglandins.22,25 This fat is typically better absorbed by the infant’s
gastrointestinal tract than the fat in cow’s milk, and the lipase present increases
the efficiency of absorption. Mature milk continues to provide immune factors
and enzymes to the infant. (For details of milk composition see the Infant
Feeding Guidelines for Health Workers.)
Breastmilk also provides all the major minerals and trace elements known to be
essential for healthy full-term infants. Although the levels of some micronutrients appear to be low in comparison with other milks, the high
bioavailability of these components in human milk ensures that no deficiencies
occur. Infants’ actual nutrient requirements are not precisely known, but the
nutrients in human milk have obviously been adequate for infants for thousands
of years. As a result, the composition of infant formula 26 and the recommended
dietary intakes for groups of infants in Australia are based on the nutrient
composition of human milk.27 No infant formula can exactly mimic breastmilk,
though. Breastmilk is constantly changing—throughout lactation and throughout
the feed. In addition, constituents of breastmilk are still being discovered, and
many of them cannot be replicated.28
The health benefits of breastfeeding
There are many benefits to be gained from breastfeeding—for the infant, the
mother and the community. These benefits are summarised in Box 1.1 (see also
the Infant Feeding Guidelines for Health Workers for an expanded version).
Costs to the community of not breastfeedung are also discussed later in this
section. Increasingly, there is interest in the long-term effects of perinatal
nutrition, commonly referred to as the foetal origins of disease, or Barker
hypothesis. Inadequate or inappropriate foetal and early infant nutrition has been
linked with subsequent chronic disease in adulthood.29,30
Dietary Guidelines for Children and Adolescents in Australia
5
1. E NCOURAGE
AND SUPPORT BREASTFEEDING
Box 1.1 Health advantages of breastfeeding for infants and mothers31–34
Infant
Mother
•
reduced incidence and duration of
diarrhoeal illnesses
•
•
protection against respiratory infection
and reduced prevalence of asthma
•
reduced occurrence of otitis media and
recurrent otitis media
•
possible protection against neonatal
necrotising enterocolitits, bacteraemia,
meningitis, botulism and urinary tract
infection
promotion of maternal recovery
from childbirth—accelerated
uterine involution and reduced
risk of haemorrhaging (thus
reducing maternal mortality) and
preservation of maternal
haemoglobin stores through
reduced blood loss, leading to
improved iron status
•
prolonged period of post-partum
infertility, leading to increased
spacing between pregnancies
•
possible accelerated weight loss
and return to pre-pregnancy body
weight
•
reduced risk of pre-menopausal
breast cancer
•
possible reduced risk of ovarian
cancer
•
possible improved bone
mineralisation and thereby
decreased risk of post-menopausal
hip fracture.
•
possible reduced risk of auto-immune
disease, such as type 1 diabetes and
inflammatory bowel disease
•
reduced risk of developing cow’s milk
allergy
•
possible reduced risk of adiposity later
in childhood
•
improved visual acuity and
psychomotor development, which may
be caused by polyunsaturated fatty
acids in the milk, particularly
decosahexaenoic acid
•
higher IQ scores, which may be the
result of factors present in the milk or
of greater stimulation
•
reduced malocclusion as a result of
better jaw shape and development.
Breastfeeding’s protective effects against mortality are obviously of greater
magnitude in countries with higher infant mortality rates. A pooled study by a
WHO working group has illustrated just how valuable the protection conferred
by breastfeeding can be, especially in developing countries, where these studies
were undertaken (see Figure 1.1). The odds ratios for mortality from all causes
and from infectious diseases show substantial benefit until the age of six months.
The Promotion of Breastfeeding Intervention Trial (or PROBIT), undertaken in
Belarus, is the largest cluster-randomised controlled trial of breastfeeding
promotion and outcomes to have been published.36 A total of 17 046 mother–
infant pairs—consisting of full-term singleton infants weighing at least
2500 grams and their healthy mothers, who intended to breastfeed—were
studied. The 31 hospitals involved were randomised to receive a health-
6
Dietary Guidelines for Children and Adolescents in Australia
1. E NCOURAGE
AND SUPPORT BREASTFEEDING
Figure 1.1 Odds ratio for not breastfeeding: all mortality and mortality from infection, by age
promotion program based on the WHO–UNICEF Baby Friendly Hospital
initiative. Compared with the control group, the infants from the intervention
group were much more likely to be breastfed at 12 months and exclusively
breastfed at three and six months. The intervention group also showed a
significant reduction in the risk of one or more gastrointestinal tract infections
(9.1% vs 13.2%; adjusted OR:0.60; 95%CI: 0.40–0.91) and of atopic eczema (3.3%
vs 6.3%; adjusted OR: 0.54; 95%CI: 0.31–0.95) but no significant reduction in
episodes of respiratory tract infection.
The psychological and behavioural aspects of breastfeeding are also important.
Breastfeeding is largely a pleasurable and positive interaction between mother
and baby. The maternal hormones prolactin and oxytocin stimulate the
development of maternal behaviour and bonding and also reduce the response
to stress.37
Breastmilk has also been shown to be the most suitable way of feeding lowbirthweight infants in a trial of 108 infants. The unique properties of human milk
promote an improved host defense and gastrointestinal function compared with
infant formula. The benefits of improved health (less sepsis and necrotising
enterocolitis) associated with feeding of fortified breastmilk outweighed the
slower rate of growth observed, suggesting that feeding of fortified breastmilk
should be actively promoted in premature infants. 38 Other types of human milk
fortifier can enhance growth rates.39
Dietary Guidelines for Children and Adolescents in Australia
7
1. E NCOURAGE
AND SUPPORT BREASTFEEDING
Pre-lacteal feeds are commonly given in some cultures. Best practice in Australia
is to place the infant at the breast as soon as practicable after delivery and to
offer it colostrum. Although respect is always due to other cultures, an infant has
no need for any other solid or liquid for around six months.
Factors affecting the initiation and duration of breastfeeding
An extensive review of the literature has documented the demographic, social
and economic factors associated with breastfeeding.40 There is a higher
prevalence and a longer duration of breastfeeding among mothers from higher
socio-economic groups who are better educated, are older, and have previously
breastfed.10,41–45 In the Australian studies, age was not found to increase
breastfeeding in the rural sample.46
In a longitudinal study, Scott, Aitken et al.11 confirmed the known demographic
factors (as just mentioned) that influence breastfeeding rates and duration.
Among other factors that were found to have influenced a mother’s decision to
breastfeed and the duration of breastfeeding were the perceptions of partners
and other family members, the mother’s decision to breastfeed prior to
pregnancy, and the mother’s age and country of birth. Scott, Gowans et al.47 also
found that a mother who had more than one child, intended to return to work or
study within six months, or had an infant in a special care nursery was less likely
to breastfeed. In Australia, boys are breastfed for a shorter time than their
sisters.48 Further research is needed to understand the reasons for this.
Box 1.2 summarises the factors involved in the initiation and duration of
breastfeeding in the two Australian studies and that by Landers et al.46, which all
used the same methodology (cohort studies with frequent interviews). The
studies demonstrate the importance of family support, particularly from the
father, and of early parental education about the benefits of breastfeeding.
McIntyre et al.49 analysed social support and found that social support for
breastfeeding—as provided by fathers, grandmothers and the general
community—in a low socio-economic area is not strong, particularly in relation
to breastfeeding in public, combining breastfeeding and work, and appropriately
managing breastfeeding.
Most women experience a number of other difficulties while breastfeeding (see
the Infant Feeding Guidelines for Health Workers). If appropriate advice and
support are not given, a mother may prematurely terminate breastfeeding. In
studies in Australia and other developed countries, the main reason for
termination cited by women is a perceived insufficient milk supply.21 The actual
number of mothers who may be physiologically incapable of providing sufficient
milk is, however, extremely low.50 For the remainder of women who prematurely
terminate breastfeeding, there are numerous causes—both biological and
psychological—the majority of which are temporary and can be resolved with
experienced advice or avoided by better preparation, hospital management or
appropriate support. For example, rooming-in of infants while in hospital
facilitates frequent feeding and thus the establishment of lactation.51
8
Dietary Guidelines for Children and Adolescents in Australia
1. E NCOURAGE
AND SUPPORT BREASTFEEDING
Breastfeeding is disrupted when the infant is housed away from the mother in
the hospital, so the rooming-in option is offered by most hospitals today.52
Box 1.2 Factors associated with the initiation and duration of
breastfeeding in a rural population compared with an urban
population11,46,47
Factors associated with the decision
to breastfeed
Factors associated with risk of ceasing
breastfeeding
In a Rural area, breast feeding was more
likely if:
In a Rural area risk of early cessation of
breastfeeding was higher:
•
fathers preferred breastfeeding
•
in younger mothers
•
mothers were younger
•
•
mothers decided pre-pregnancy
to breastfeed
in mothers who planned to
breastfeed for less than two months
•
where fathers did not prefer
breastfeeding
•
in mothers who did not decide to
breastfeed before becoming pregnant
•
in mothers whose infants received
complementary formula feeds in
hospital.
•
mothers were primiparous.
In an Urban area, breast feeding was more
likely if:
In an Urban area, risk of early cessation of
breastfeeding was higher:
•
fathers preferred breastfeeding
•
in younger mothers
•
maternal grandmothers
preferred breastfeeding
•
in less educated mothers
•
•
mothers decided pre-pregnancy
to breastfeed
•
mothers were primiparous
in mothers born in Australia,
New Zealand or the United Kingdom
compared with mothers born in the
Middle East or Africa
•
mothers were born in Australia,
the United Kingdom, Asia, the
Middle East or North Africa
•
in mothers who planned to
breastfeed for less than four months
•
when maternal grandmothers were
ambivalent or preferred formula
feeding
•
when mothers received conflicting
advice on infant feeding while in
hospital.
•
husbands were professional or
administrators.
Note: See reference 46 for details of odds ratios and their confidence intervals.
Another difficulty is that modern hospital practice involves discharging mothers
too early (often within 24–48 hours of delivery); this means hospital staff will
have had insufficient time to help establish breastfeeding. A cohort study has
Dietary Guidelines for Children and Adolescents in Australia
9
1. E NCOURAGE
AND SUPPORT BREASTFEEDING
demonstrated the importance of a supportive health system in successful
breastfeeding.53 A review of negative hospital practices—such as distribution of
commercial publicity packs—has shown that these can have a detrimental effect
on breastfeeding.54 (See the Infant Feeding Guidelines for more details.)
Frequent stimulation and frequent emptying are required to maintain breastmilk
production, which is a very good reason for discouraging the use of
complementary food or pacifiers (dummies). Feeding according to need—that is,
feeding on demand—offers the best way of maintaining lactation, and if this is
prevented by lack of facilities or social acceptance, lactation can be adversely
affected.
The Australian Breastfeeding Association (formerly the Nursing Mothers
Association of Australia) and other similar organisations have an important role
to play within the health care system, providing the one-to-one support that is
needed to overcome transient problems with lactation, particularly after hospital
discharge.55 The association also provides breastfeeding education classes, access
to a local network of mothers and group discussion meetings, and a variety of
publications dealing with all aspects of breastfeeding. In addition, it has a range
of strategies designed to promote breastfeeding in the community, among them
the following:
•
community education sessions run by local groups all around Australia
•
promotion of breastfeeding in local areas during Breastfeeding Awareness
Month
•
encouragement to the community to support breastfeeding through ‘Baby
Care Room’ awards, ‘Mother Friendly Workplace’ accreditation, and
‘Breastfeeding Welcome Here’ stickers
•
participation in consultations relating to policies affecting breastfeeding
•
access for the community and health professionals to comprehensive and
readily usable information and resources dealing with all aspects of human
lactation through the Lactation Resource Centre. <www.aba.asn.au>
Breastfeeding and paid employment need not be mutually exclusive, although in
some cases work may be a reason for women not to commence
breastfeeding.21,56,57 A longitudinal study of 10 500 mothers found that planning to
return to employment earlier than six weeks post-partum reduces the likelihood
of initiating breastfeeding.58 For successful lactation to continue after returning to
work, supportive worksite health-promotion policies are required that provide
education and facilitate either frequent feeding or frequent expression and
storage of breastmilk, as required. A recent publication provides helpful
information for mothers and employers (see Balancing Breastfeeding and Work
<www.health.gov.au/hfs/pubhlth/strateg/brfeed/index>). Although it is not an
ideal situation, many mothers who return to work are unable to breastfeed
exclusively and, rather than using expressed breastmilk, carers use infant
formulae for some feeds. Although mothers should be supported in this
decision—any breastfeeding is better than none—every effort should be made to
change the conditions of our society and so make exclusive breastfeeding
10
Dietary Guidelines for Children and Adolescents in Australia
1. E NCOURAGE
AND SUPPORT BREASTFEEDING
possible for working mothers. The message should be that many mothers
successfully combine breastfeeding and paid employment.
Breastfeeding and special circumstances
[This subject is discussed in detail in the Infant Feeding Guidelines for Health
Workers.]
There are few contra-indications to breastfeeding. Most medications a mother
might need are compatible with breastfeeding, but each drug should be
specifically checked in a reliable reference59 or with your GP.
Some disease situations—for example, if a mother has HIV or AIDS—can be
absolute contra-indications.60 Research is progressing rapidly, however, and this
may change. Studies have now shown that exclusive breastfeeding to six months,
combined with the use of antiretroviral drugs, substantially reduces the risk of
HIV transmission.61
Exclusive breastfeeding for periods much beyond six months of age may result in
under-nutrition and micro-nutrient deficiency.6 Supplementation with solid foods
is necessary after about this time. In particular, beyond the age of six months
additional sources of iron are required, usually from iron-fortified cereals and
pureed foods containing meat.62 Mothers who are vegans or strict vegetarians can
be at risk of vitamin B12 and other nutrient deficiencies. (See Sections 3.2 and 3.3
for more information about this.)
Breastfeeding and community support
Community efforts associated with breastfeeding should focus on strategies and
policies that will:
•
influence the proportion of mothers who intend to breastfeed—the earlier
the decision is made, before or during the pregnancy, the greater the
likelihood of successful breastfeeding
•
influence the intended duration of breastfeeding through education,
example and support
•
influence the attitudes and beliefs of the mother’s support network,
particularly the father
•
provide antenatal and postnatal education about the day-to-day
practicalities of breastfeeding
•
promote breastfeeding as the social norm, with support and the provision
of adequate facilities in social situations and the workplace
•
include the father and/or other support people in as much of the antenatal
preparation as possible
•
provide post-discharge support for minor problems—from community
services, the medical profession and support organisations
•
enhance support for lactation in the workplace, to allow working mothers
to continue to breastfeed.
Dietary Guidelines for Children and Adolescents in Australia
11
1. E NCOURAGE
AND SUPPORT BREASTFEEDING
In a meta-analysis of postnatal support for mothers in the community, Sikorski
and Renfrew showed that ‘one more mother will breastfeed for two months if
support is provided for nine women and one more woman will breastfeed
exclusively if support is given to nine women’.63
The media have an important role in portraying the importance of breastfeeding
and in supporting it in the community as the norm. The Australian media often
portray breastfeeding in a negative way.64 In the United Kingdom it was found
that television and press coverage routinely implies that breastfeeding is
problematic, funny or embarrassing or associates it with ‘particular types of
women’. On the other hand, bottle-feeding is seen as ‘largely normalised,
socially integrated, associated with “ordinary” and “normal” families and
represented as being problem-free’.65
Provision of physical facilities that are adequate for breastfeeding is important;
such facilities are often lacking in places mothers and their infants need to
visit—for example, shopping centres and other public places.66
Recent research has shown how important it is for fathers to encourage the
initiation and duration of breastfeeding. The fathers of infants who were
breastfed were found to have three particular characteristics:
•
They had other children who had been breastfed.
•
They attended antenatal classes.
•
They discussed breastfeeding antenatally with their partner.
In general, however, fathers have poor knowledge about the practical aspects of
breastfeeding11, and it is important to include them in discussion about
breastfeeding. Fathers also need to provide practical help—such as occupying
other children and doing household chores—and emotional support for
breastfeeding mothers. They should attend antenatal classes and learn about the
nutritive and protective advantages of breastfeeding and some of the potential
practical difficulties.
All health professionals need to constantly promote the benefits of breastfeeding.
The benefits should be discussed with mothers (or potential mothers) at the earliest
opportunity, such as the first antenatal visit. Health professionals should ensure that
their patients know about the protective properties of breastmilk and the risks
involved when infants do not receive it. They should also ensure that their activities
do not discourage mothers from breastfeeding. In a program to promote ‘babyfriendly doctors’ offices’, workshops were conducted for office staff and resulted in
positive changes in breastfeeding promotion. The changes were maintained at six
and 12 months after the intervention.67 In a controlled trial in an obstetrician’s office,
the negative effect of exposure to formula-promotion materials was also
demonstrated. Educational materials about infant feeding should unequivocally
support breastfeeding as optimal nutrition for infants.68
The Health Technology Assessment Program69 has undertaken a systematic
review of health promotion for breastfeeding (see Table 1.1). The reviewers
were very strict about inclusion criteria. For example, the introduction of paid
12
Dietary Guidelines for Children and Adolescents in Australia
1. E NCOURAGE
AND SUPPORT BREASTFEEDING
maternity leave in Norway (one year on 80 per cent of pay or 46 weeks on full
pay) has been associated with an increase in breastfeeding by working mothers.
Similarly, introduction of the WHO International Code of Marketing of Breastmilk Substitutes has been associated with improved breastfeeding outcomes, yet
no studies meeting the reviewers’ criteria were found. Despite this, the reviewers
found three types of intervention to be effective: small-group health education
(antenatal); peer support programs (antenatal and postnatal); and one-to-one
health education (low-income groups).69
Table 1.1
Classification of breastfeeding health-promotion studies69
Areas of health-promotion actiona
Types of intervention to promote the
uptake of breastfeeding
Public policy
No studies identified
Supportive environments
No studies identified
Community action
Peer support activities
Development of personal skills
Health education and media programs
Reorientation of health services
Health sector initiatives
Multi-faceted studies
a.
Using the classification of the Ottawa Charter framework for health promotion studies, plus an
additional category of multi-faceted studies.
A meta-analysis found that distribution of commercial information packs (with or
without samples of formula) to mothers while in hospital reduces the number of
women exclusively breastfeeding but does not affect the earlier termination of
non-exclusive breastfeeding.54
Costs to the community of not breastfeeding
There have been many studies of the economic benefits to be gained from
breastfeeding. On the basis of longitudinal studies in Arizona and Scotland, it
was estimated that for each 1000 infants who were never breastfed there is an
excess of 2030 doctor visits and more than 200 inpatient days and 600
prescriptions compared with infants exclusively breastfed for more than three
months.71 In addition, in the first year of life the total health care costs for infants
who were not breastfed were estimated to be $331 000 greater than those for
breastfed infants. Ball and Bennet have proposed a comprehensive model for
documenting the economic impact of breastfeeding; they showed that a
breastfeeding education program reduced medical claims by $1435 per infant
and saved three days a year of maternal sick leave.72 (Note: costs are in 2001 US
dollars and are not adjusted for inflation.)
In another study in the United States, Weimer73 estimated that a minimum of
$3.6 billion would be saved if breastfeeding were increased from current US
Dietary Guidelines for Children and Adolescents in Australia
13
1. E NCOURAGE
AND SUPPORT BREASTFEEDING
levels (64 per cent breastfed in hospital, 29 per cent breastfed at six months) to
the targets recommended by the US Surgeon General (75 per cent and 50 per
cent respectively). This figure of $3.6 billion is probably an underestimation of
the total savings because it represents cost savings from the treatment of only
three childhood illnesses—otitis media, gastroenteritis and necrotising
enterocolitis.
The health costs of weaning 30 per cent of infants onto infant formula by three
months of age could be around $290 million a year in Australia; this is based on
an analysis of just five illnesses for which breastfeeding is proven to have
protective effects.74
The total value of breastfeeding to the community makes it one the most costeffective primary prevention measures available and well worth the support of
the entire community.
R E L AT I O N S H I P
TO OT H E R G U I D E L I N E S
The Infant Feeding Guidelines for Health Workers, provide detailed advice on
adolescent pregnancy and breastfeeding; indications for the introduction of
solids; breastfeeding initiation and management; problems encountered in
breastfeeding; health professionals’ responsibilities under the WHO Code; and
the use of infant formula.
CONCLUSION
Breastfeeding is very important for infant nutrition. Exclusive breastfeeding until
around six months should be the aim for every infant. If that is not possible,
mothers should be encouraged to breastfeed as much, and for as long, as they
can. Breastfeeding beyond six months is of continuing value to baby and mother,
although the maximum benefits of breastfeeding are in the earliest months of
life.
Promotion of breastfeeding is an important public health strategy. Support and
encouragement at all levels of the community are essential to maintaining and
improving initiation rates and the duration of breastfeeding by Australian
women, particularly those who are disadvantaged. Breastfeeding is included in
both the Dietary Guidelines for Australian Adults and for Children and
Adolescents because it will contribute to the health of all Australians from birth.
EVIDENCE
There are three relevant Cochrane reviews24,54,63 which support this guideline and
further National Technology Centre reviews of health education for
breastfeeding.
14
Dietary Guidelines for Children and Adolescents in Australia
1. E NCOURAGE
AND SUPPORT BREASTFEEDING
For ethical reasons, it is not possible to do randomised control trials of
breastfeeding.
There is Level III and Level IV for the following:
•
the effect of early, as opposed to delayed, initiation of breastfeeding
(reference 24)
•
the effect of commercial hospital discharge packs for breastfeeding women
(reference 54)
•
community support for breastfeeding (reference 63)
•
the biological suitability of breastmilk (reference 5)
•
exclusive breastfeeding to about six months (reference 6)
•
the role of breastfeeding in prevention of infant mortality in less
developed countries (reference 35)
There is Level III evidence for the effect of baby-friendly initiatives
(reference 67); for the effect of prenatal advertising of formula (reference 68);
and for factors associated with breastfeeding in women in Australia
(references 11, 47 and 48).
REFERENCES
1.
World Health Organization. International Code of Marketing of Breast-milk
Substitutes. Geneva: WHO, 1981.
2.
Scott JA, Binns CW. Breastfeeding in Perth—recent trends. Aust J Publ Hlth
1996;20(2):210–11.
3.
Royal Australian College of General Practitioners Council. RACGP
breastfeeding position statement. Melbourne: RACGP Council, 2000.
4.
American Academy of Pediatrics. Breastfeeding and the use of human milk.
Pediatrics 1997;100:1035–9.
5.
Michaelsen KF, Weaver L, Branca F, Robertson A. Feeding and nutrition of
infants and young children: guidelines for the WHO European region, with
emphasis on the former Soviet countries. Copenhagen: WHO Regional
Office for Europe, 2000.
6.
World Health Organization. The optimal duration of exclusive
breastfeeding. Geneva: WHO, 2001.
7.
Dettwyler K. A time to wean. In: Stuart-Macadam P, Dettwyler K, eds.
Breastfeeding: biocultural perspectives. New York: Aldine de Gruytyer, 1995.
8.
Binns CW. Food, sickness and death in children of the highlands of Papua
New Guinea. J Trop Pediatr Environ Child Hlth 1976;22(1):9–11.
9.
Binns CW. Infant feeding and growth. In: Ulijaszek SJ, Johnston FE, Preece
MA, eds. Cambridge encyclopedia of human growth and development.
Cambridge, UK: University of Cambridge Press, 1998.
Dietary Guidelines for Children and Adolescents in Australia
15
1. E NCOURAGE
AND SUPPORT BREASTFEEDING
10.
Donath S, Amir LH. Rates of breast feeding in Australia, by state and
socioeconomic status: evidence from the 1995 National Health Survey. J
Paediatr Child Hlth 2000;36(2):164–8.
11.
Scott JA, Aitkin I, Binns CW, Aroni RA. Factors associated with the duration
of breastfeeding amongst women in Perth, Australia. Acta Paediatr Scand
1999;88(4):416–21.
12.
Brundtland GH. WHO Director-General’s speech on infant feeding. Geneva:
WHO, 2000.
13.
Redman S, Watkins J, Evans L, Lloyd D. Evaluation of an Australian
intervention to encourage breast feeding in primiparous women. Hlth
Prom Int 1995;10(2):101–13.
14.
Hitchcock NE. Infant feeding in Australia: an historical perspective. Part
2: 1900–1988. Aust J Nutr Diet 1989;46(4):102–8.
15.
Lund-Adams M, Heywood P. Breastfeeding in Australia. Wld Rev Nutr Diet
1995;78:74–113.
16.
Lester I. Australia’s food and nutrition. Canberra: Australian Government
Publishing Service, 1994.
17.
Palmer N. Breastfeeding: the Australian situation. J Food Nutr 1985;42:13–18.
18.
Hitchcock NE, Coy JF. Infant feeding practices in Western Australia and
Tasmania: a joint survey, 1984–1985. Med J Aust 1988;148:114–17.
19.
English R (comp.). Towards better nutrition for Australians: report of the
Nutrition Taskforce of the Better Health Commission. Canberra: Australian
Government Publishing Service, 1987.
20.
Hartmann P, Sherriff J, Kent J. Maternal nutrition and the regulation of milk
synthesis. Proc Nutr Soc 1995;54(2):379–89.
21.
Simopoulos AP, Dutra de Oliveira JE, Desai ID, eds. Behavioral and
metabolic aspects of breastfeeding. Basel: Karger, 1995.
22.
Department of Health and Social Security. Present day practice in infant
feeding: third report. Report of a working party of the Panel on Child
Nutrition, Committee on Medical Aspects of Food Policy. London: HMSO,
1988.
23.
Ogle KS, Alfano MA. Common problems of initiating breast-feeding. The
physician’s role in encouraging success for the ‘nursing’ couple. Postgrad
Med 1987;82(6):159–62, 165–7.
24.
Renfrew MJ, Lang S, Woolridge MW. Early versus delayed initiation of
breastfeeding (Cochrane Review). Oxford: Cochrane Library, 2000.
25.
Akre J, ed. Infant feeding: the physiological basis. Bull Wld Hlth Org
1989;67(suppl.):S1–S108.
26.
National Health and Medical Research Council. Food Standards Code.
Canberra: Australian Government Publishing Service, 1990.
16
Dietary Guidelines for Children and Adolescents in Australia
1. E NCOURAGE
AND SUPPORT BREASTFEEDING
27.
National Health and Medical Research Council. Recommended dietary
intakes for use in Australia. Canberra: Australian Government Publishing
Service, 1991.
28.
Newburg D, Street J. Bioactive materials in human milk: milk sugars
sweeten the argument for breast-feeding. Nutr Today
1997;32(5):September–October.
29.
Cox SE. The fetal origins hypothesis: an overview and implications. Nutr
Abs Revs 1999;69(10):929–37.
30.
Robinson R. The protective effect of childhood infections. BMJ
2001;322:376–7.
31.
Michaelsen KF, Weaver L, Branca F, Robertson A. Feeding and nutrition of
infants and young children: guidelines for the WHO European region.
Copenhagen: World Health Organization, 2000.
32.
Heinig MJ, Dewey KG. Health advantages of breastfeeding for infants: a
critical review. Nutr Res Rev 1996;9:89–110.
33.
Heinig MJ, Dewey KG. Health effects of breastfeeding for mothers: a
critical review. Nutr Res Rev 1997;10:35–56.
34.
Oddy W, Holt P, Sly P, Read A, Landau L, Stanley F et al. Association
between breastfeeding and asthma in 6 year old children: findings of a
prospective birth cohort study. BMJ 1999;319:815–19.
35.
WHO Collaborative Study Team on the Role of Breastfeeding in the
Prevention of Infant Mortality. Effect of breastfeeding on infant and child
mortality due to infectious diseases in less developed countries: a pooled
analysis. Lancet 2000;355(February):451–5.
36.
Kramer M, Chalmers B, Hodnett E, Sevkovskaya E, Dzihovich I, Shapiro S
et al. The Promotion of Breastfeeding Intervention Trial (PROBIT): a
randomized trial in the Republic of Belarus. JAMA 2001;285(4):413–20.
37.
Unvas-Moberg K, Eriksonn M. Breastfeeding: physiological, endocrine and
behavourial adaptions caused by oxytocin and local neurogenic activity in
the nipple and mammary gland. Acta Paediatr Scand 1996;85:525–30.
38.
Schanler R, Shulman R, Lau C. Feeding strategies for premature infants:
beneficial outcomes of feeding fortified human milk versus preterm
formula. Pediatrics 1999;103(6):1150–7.
39.
Reis B, Hall R, Schanler R, Berseth C, Chan G, Ernst J et al. Enhanced
growth of preterm infants fed a new powdered human milk fortifier: a
randomized, controlled trial. Pediatrics 2000;106(3):581–8.
40.
Scott JA, Binns CW. Factors associated with the initiation and duration of
breast feeding. Aust J Nut Diet 1998;55(2):51–61.
41.
Hartmann PE. Lactation and reproduction in Western Australian women. J
Reprod Med 1987;32(7):543–7.
Dietary Guidelines for Children and Adolescents in Australia
17
1. E NCOURAGE
AND SUPPORT BREASTFEEDING
42.
Hitchcock NE, Coy JF. The growth of healthy Australian infants in relation
to infant feeding and social group. Med J Aust 1989;150:306–11.
43.
Kocturk T, Zetterstrom R. Breastfeeding and its promotion. Acta Paediatr
Scand 1988:183–90.
44.
Milligan RA, Pugh LC, Bronner YL, Spatz DL, Brown LP. Breastfeeding
duration among low income women. J Midwif Women’s Hlth
2000;45(3):246–52.
45
Simopoulos AP, Grave GD. Review of research on the factors associated
with choice and duration of infant feeding practice. Pediatrics
1984;74:S603–S614.
46.
Landers M, Hughes RM, Graham K. The Darling Downs Breastfeeding
Study. Toowoomba, Qld: Darling Downs Public Health Unit, 1998.
47.
Scott JA, Gowans MC, Hughes RM, Binns CW. Psychosocial factors
associated with breastfeeding at discharge and duration of breastfeeding
amongst two populations of Australian women. Proc Nut Soc Aust
2000;25:240.
48.
Scott JA, Binns CW. Breastfeeding: are boys missing out? Birth
1999;26:276–7.
49.
McIntyre E, Hiller JE, Turnbull D. Attitudes towards infant feeding among
adults in a low socioeconomic community: what social support is there for
breastfeeding? Breastfeeding Rev 2001;9(1):13–24.
50.
Baghurst KI. Infant feeding: public health perspectives. Med J Aust
1988;148(2):112–13.
51.
Yamauchi Y, Yamanouchi I. The relationship between rooming-in/not
rooming-in and breastfeeding variables. Acta Paediatr Scand
1990;79:1017–22.
52.
Auerbach KG. Evidence-based care and the breastfeeding couple: key
concerns. J Midwif Women’s Hlth 2000;45(3):205–11.
53.
Kuan L, Britto M, Decolongon J, Schoettker P, Atherton H, Kotagal U.
Health system factors contributing to breastfeeding success. Pediatrics
1999;104(3):e28.
54.
Donnelly A, Snowden HM, Renfrew MJ, Woolridge MW. Commercial
hospital discharge packs for breastfeeding women (Cochrane Review).
Oxford: Cochrane Library, 2000.
55.
Kyenkya-Isabirye M, Magalheas R. The mothers’ support group role in the
health care system. Int J Gynecol Obstet 1990;31(suppl. 1):S85–S90.
56.
Barber-Madden R, Petschek MA, Pakter J. Breastfeeding and the working
mother: barriers and intervention strategies. J Publ Hlth Policy
1987;8(4):531–41.
18
Dietary Guidelines for Children and Adolescents in Australia
1. E NCOURAGE
AND SUPPORT BREASTFEEDING
57.
James J. Working and breastfeeding: a contemporary workplace dilemma.
Aust Coll Midwives 1999;12(4):8–11.
58.
Noble S, Team TAS. Maternal employment and the initiation of
breastfeeding. Acta Paediatr 2001;90:423–8.
59.
Ito S. Drug therapy for breast-feeding women. N Engl J Med 2000;343:118–28.
60.
American Academy of Pediatrics. Human milk, breastfeeding, and
transmission of human immunodeficiency virus in the United States.
Pediatrics 1995;96:977–9.
61.
Coutsoudis A. Promotion of exclusive breastfeeding in the face of the HIV
pandemic. Lancet 2000;356:1620–1.
62.
Calvo EB, Galindo AC, Aspres NB. Iron status in exclusively breastfed
infants. Pediatrics 1992;90:375–9.
63.
Sikorski J, Renfrew MJ. Support for breastfeeding mothers. In: Cochrane
database of systematic reviews, 2000. <www.cochrane.org/cochrane/
revabftr/mainindex.htm>.
64.
Henderson AM. Mixed messages about the meanings of breast-feeding
representations in the Australian press and popular magazines. Midwifery
1999;15(1):24–31.
65.
Henderson L, Kitzinger J, Green J. Representing infant feeding: content
analysis of British media portrayals of bottle feeding and breastfeeding.
BMJ 2000;321(7270):1196–8.
66.
McIntyre E, Turnbull D, Hiller JE. Breastfeeding in public places. J Hum
Lact 1999;15(2):131–5.
67.
Shariff F, Levitt C, Kaczorowski J, Wakefield J, Dawson H, Sheehan D et al.
Workshop to implement the baby-friendly office initiative: effect on
community physicians’ offices. Canad Fam Phys 2000;46(May):1090–7.
68.
Howard C, Howard F, Lawrence R, Andresen E, De Blieck E, Weitzman M.
Office prenatal formula advertising and its effect on breast-feeding
patterns. Obstet Gynecol 2000;95:296–303.
69.
Fairbank L, O’Meara S, Renfrew MJ, Woolridge M, Sowden AJ, Lister-Sharp D.
A systematic review to evaluate the effectiveness of interventions to promote
the initiation of breastfeeding. Hlth Technol Assess 2000;4(25):1–171.
70.
World Health Organization. Ottawa Charter for Health Promotion. Health
Promotion 1987;1:3–4.
71.
Ball T, Wright A. Health care costs of formula feeding in the first year of
life. Pediatrics 1999;103:870–6.
72.
Ball T, Bennett D. The economic impact of breastfeeding. Pediatr Clin Nth
Amer 2001;48(1):253–69.
73.
Weimer J. The economic benefits of breastfeeding: a review and analysis.
Food Assistance and Nutrition Research Report no.13. Washington, DC:
Department of Agriculture, 2001.
74.
Smith J. Mother’s milk, money and markets. Ann Congress Perinatal Soc
Aust NZ 2001.
Dietary Guidelines for Children and Adolescents in Australia
19
2. C HILDREN &
2
ADOLESCENTS NEED SUFFICIENT NUTRITIOUS FOODS TO GROW AND DEVELOP NORMALLY
CHILDREN AND ADOLESCENTS NEED
S U F F I C I E N T N U T R I T I O U S F O O D S TO
G R O W A N D D E V E L O P N O R M A L LY
• Growth should be checked regularly for young
children
• Physical activity is important for all children
and adolescents
Colin Binns, Geoff Davidson and David Forbes
TERMINOLOGY
Growth
Growth refers to the acquisition of tissue and the consequent increase in body
size.
Development
Development refers to the increased ability of the body to function physically and
intellectually. Physical and intellectual development proceed at different rates in
different individuals.
Age ranges
As noted in the preface, the terminology used for the various age ranges is as
follows:
•
infant—up to 12 months
•
toddler—1 to 2 years
•
preschool child—3 to 5 years
•
young child—1 to 5 years
•
primary school age—6 to 11 years
•
adolescent—12 to 18 years.
CDC growth reference
The CDC growth reference is a data set based on several US studies. It has been
adopted by the World Health Organization and in Australia by the National
Health and Medical Research Council.
Dietary Guidelines for Children and Adolescents in Australia
21
2. C HILDREN &
ADOLESCENTS NEED SUFFICIENT NUTRITIOUS FOODS TO GROW AND DEVELOP NORMALLY
B AC K G RO U N D
Weight gain and an increase in body size are integral parts of normal growth and
development during childhood and adolescence. At this life stage the focus is on
maintaining a rate of physical growth that is consistent with the expected norms
for age, sex and stage of physiological maturity. Physical growth is best assessed
by the conventional measures of weight, length or height, and head
circumference. Maintenance of a positive energy and nutrient balance is critical
in achieving and sustaining normal growth and development. During periods of
rapid growth, any intentional restriction of weight gain—through dieting, for
example—is usually inappropriate.
In recent years there has been increasing awareness of the importance of
perinatal nutrition in terms of the development of disease in adulthood; this is
known as the foetal origins of disease or Barker hypothesis3,4—see part A of the
‘Special considerations’ section. In addition, there is increasing evidence of the
importance of growth and nutrition in relation to cognitive development.5,6
Growth during infancy also influences future bone mass.7
SCIENTIFIC
BASIS
Growth
Between birth and 18 years of age, a person’s body weight increases about
twenty-fold. During early childhood, the rate of increase in weight and length is
essentially linear: the rate of increase in weight generally keeps pace with the
rate at which length increases. During infancy and adolescence, however, the
rate of growth changes rapidly over time; for example, it decelerates rapidly
during the first year of life, while during adolescence it first accelerates over a
period of one to three years and then decelerates rapidly until growth in height
ceases at about 16 years of age in girls and 18 years in boys. Secular changes in
growth and maturation have been well documented in many countries, and
Australia is no exception. Loesch et al.8 compared the data on height and body
weight obtained in 1992 to 1993 from 1804 Melbourne school students aged 5
to17 years with historical data collected from white Australians during the last
100 years. Australians have been getting taller every decade and, although the
increase in height has significantly slowed down during the last two decades, the
increase in body weight is continuing and is more pronounced in females.
Children
[For information about infants and nutrition, see Chapter 1.]
Children between the ages of 1 and 5 years are still considered nutritionally
vulnerable, although their growth rate is slower than in infancy and their
nutritional needs in relation to their body size are proportionally reduced.
Relative to their body weight, however, children’s nutrient and energy
requirements are still greater than those of adults.9
22
Dietary Guidelines for Children and Adolescents in Australia
2. C HILDREN &
ADOLESCENTS NEED SUFFICIENT NUTRITIOUS FOODS TO GROW AND DEVELOP NORMALLY
Compared with adults, young children are unable to exert as much control over
what they eat. Too little or too much food, or an imbalance of nutrients or
energy over a period, can alter the natural progress of physical growth. A child’s
rate of growth is a fundamental indicator of dietary adequacy and health, and
parents and other carers must be aware of and responsive to the developmental
and nutritional needs of children. Growth is the most important indicator of good
nutrition. In Australia, if a child’s growth follows expected norms it is unlikely
that nutrition is a problem.
Childhood is a period of continuous education about eating and good nutrition,
and appropriate use of food is important in establishing lifetime nutrition
practices. Food intake may drop off during the second year of life, and parents’
skills of encouragement and example will be needed. After starting school,
children are subject to an increasing array of influences from outside the home.
They experience peer pressure in many areas, including food, and group
behaviour becomes the norm.
Adolescents
During adolescence there is a marked increase in the rate of gain in both weight
and length—referred to as the adolescent growth spurt. The spurt in height
begins on average at 10 to 11 years in girls and at 12 to 13 years in boys,
although there is wide variation in this. During the adolescent growth spurt boys
gain an average of 20 centimetres in height and 20 kilograms in weight and girls
around 16 centimetres and 16 kilograms respectively.2 The peak velocity for
weight gain tends to occur about three months after that for height. In girls, the
onset of menstruation generally occurs after the peak in height velocity; in boys,
the development of secondary sexual characteristics is less closely related to the
adolescent growth spurt.
Adolescence is an important period for calcium absorption and the optimum
period for gaining bone density, particularly for girls.10 The efficiency of calcium
absorption increases during puberty, and the majority of bone formation occurs
at this time. Data from balance studies suggest that for most healthy adolescents
the maximal net calcium balance (plateau) is achieved with intakes of between
1200 and 1500 milligrams a day11; that is, at intake levels above this almost all
the additional calcium is excreted and not used.
In the United States adolescents’ milk consumption declined by 36 per cent
between 1965 and 199612, being replaced by increased consumption of soft
drinks and juices. A similar decline has occurred in Australia.13,14 The increased
phosphorus excretion associated with this change in diet may compromise bone
building and maintenance.15,16
Assessment of body weight and growth rate
The most practical measures of nutritional status in childhood are comparisons
with reference growth charts that show the normal ranges for weight for age,
height for age and weight for height, by sex. When only a single measurement of
Dietary Guidelines for Children and Adolescents in Australia
23
2. C HILDREN &
ADOLESCENTS NEED SUFFICIENT NUTRITIOUS FOODS TO GROW AND DEVELOP NORMALLY
weight and height is available, the traditional method has been to establish the
percentile of the growth reference. In some situations it is more appropriate to
use the Z scores (standard deviations above or below the mean), and growth
reference charts are available in both formats or a calculator is available on the
internet.17,18 If weight and height are measured on several occasions, the
measurements are most usefully interpreted by plotting them on reference
growth charts.19 In Australia, the US National Center for Health Statistics (NCHS)
growth charts are recommended for this purpose for all ethnic groups. The charts
are included in the personal health records produced by various organisations for
use as a continuing record of a child’s health. The US Centers for Disease Control
recently revised the growth reference to eliminate some minor anomalies around
2 years of age2,20—see part B of the ‘Special considerations’ section.
The suitability of the WHO–NCHS values for use as an international standard has
been debated because many of the children on whom the values were based
were not breastfed. In an international study, which included Australian children,
the growth of breastfed infants was slightly below the WHO–NCHS reference. In
1993 the World Health Organization established a working group to develop new
internationally applicable standards based on the growth of infants who were
breastfed according to the WHO protocol.21,22 In Australia, however, the growth
rate for Indigenous infants who are exclusively breastfed follows the WHO–
NCHS reference until 6 months of age then begins to fall away.23,24 This suggests
that the difference between breastfed infants and the CDC–WHO reference is not
very significant for Australia, particularly if it is used as a reference for
monitoring growth and not as a standard.
Generally, if a child is growing normally the lines connecting the plotted values
will proceed along or parallel to one of the percentile lines on the charts. If the
plotted values show a markedly irregular pattern, this could signify a problem,
although some of the measurements might have been inaccurate or the data
might have been plotted incorrectly. This possibility should always be checked at
the first opportunity. The extent to which serial data for a child can deviate from
a given percentile range before concern is warranted depends on the age of the
child, the child’s position in the percentile range, the length of time for which
the rate of growth deviates from the norm, and the coexistence of any medical
condition. In general, the more pronounced the change in growth rate, the
younger the child and the more extreme the percentile, the greater is the
concern.
Skinfold measurements—a measure of the amount of fat in the subcutaneous
compartment—is another index of under- or over-nutrition, although generation
of reliable measurements depends to a large extent on the use of trained
operators and calibrated instruments, and not all are reliable. DEXA (dual energy
X-ray absorptiometry) and ultrasound provide the most accurate measurements,
but cost limits their application to experimental use and to clinical settings where
more accurate diagnosis is required for management. Measurement and recording
of weight and height at regular intervals remain the best way of monitoring
growth.
24
Dietary Guidelines for Children and Adolescents in Australia
2. C HILDREN &
ADOLESCENTS NEED SUFFICIENT NUTRITIOUS FOODS TO GROW AND DEVELOP NORMALLY
Body mass index—weight (kg) / height (m)2—is the most common measurement
used to define overweight and obesity in adults, and centile charts for children
are now available.25 In children, BMI has now become accepted as a useful tool
for identification and monitoring of obesity.26 Deitz and Bellizzi26 suggested using
the common adult cut-off points of 25 (overweight) and 30 (obese) as the cut-off
points for children. However, Cole et al.27 used pooled data on 192 727 subjects
aged from birth to 25 years from a number of countries to develop for each age
cut-off points that reflect the changes in BMI with age and correspond with the
adult levels of overweight and obesity. These cut-off points are a big
improvement on current alternatives and should help to provide internationally
comparable prevalence rates for overweight and obesity in children (see
Table B.2 in the ‘Special considerations’ section). The results of three studies of
Australian children and adolescents (a total of about 11 000 subjects) were reanalysed using the Cole criteria28, and the prevalence of overweight and obesity
was found to be between 19 and 23 per cent. BMI has not been validated in the
assessment of under-nutrition in children and adolescents but may prove a useful
screening measure.29,30
Physical activity
Physical activity is a normal component of everyday life for children and
adolescents, including those with physical and other handicaps. It plays an
important part in physical growth and the development of a wide range of skills,
and it provides a mechanism for balancing energy intake and energy output.
Physical activity in girls is related to subsequent bone density in adulthood.31 The
Western Australian Child Health Survey found a cross-sectional association
between mental health and physical activity in children and adolescents.32
In sedentary societies, obesity that develops during childhood or adolescence is
often thought to be a consequence of a high energy intake in association with
reduced energy expenditure, although there is relatively little evidence that
obese children as a group consume more energy than their non-obese peers.
There is, however, evidence that obese children are less active than lean
children and that inactivity is associated with an increased prevalence of
obesity.33,34
Between the ages of 12 and 18 years the average amount of regular physical
activity decreases by 50 per cent; boys are consistently more active and fitter
than girls.35 A similar pattern of fitness was evident in the Health and Fitness
Survey of Australian Schoolchildren in 1985: when compared with boys, girls had
a significantly lower mean level of aerobic fitness, and 15-year-old girls were the
least fit of all.36 Activity patterns that develop during childhood and adolescence
carry over to later life and affect morbidity and longevity.37,38 It is obviously
important to ensure that children and those who interact with them are aware of
the role that regular physical activity can play—not only in terms of ‘fitness’ and
‘fatness’ in childhood and adolescence but also in terms of later susceptibility to
chronic diseases.
Dietary Guidelines for Children and Adolescents in Australia
25
2. C HILDREN &
ADOLESCENTS NEED SUFFICIENT NUTRITIOUS FOODS TO GROW AND DEVELOP NORMALLY
The US Surgeon General reached the following conclusions about the importance
of physical activity:
Children become far less active as they move through adolescence. Obesity
is increasing among children, at least in part related to physical inactivity.
Data indicate that obese children and adolescents have a high risk of
becoming obese adults, and obesity in adulthood is related to coronary
artery disease, hypertension, and diabetes. Thus, the prevention of
childhood obesity has the potential of preventing cardiovascular disease in
adults. 39
The Surgeon General also made the point that all children, adolescents and
young adults—both male and female—benefit from physical activity.
Physical activity does not need to be strenuous to be beneficial. A moderate
amount of daily physical activity is recommended for everyone. This amount can
be attained in longer sessions of moderately intense activities (such as brisk
walking for 30 minutes)39 or in shorter sessions of more intense activities (such
as jogging or playing basketball for 15 to 20 minutes).39 The Physical Activity
Guidelines for Australians <www.health.gov.au/hfs/pubhlth/strateg/active/
index.htm> make the following recommendations:
•
Think of movement as an opportunity, not an inconvenience.
•
Be active every day in as many ways as possible.
•
Put together at least 30 minutes of moderate-intensity physical activity on
most, preferably all, days.
•
If possible, also enjoy some regular, vigorous exercise for extra health and
fitness. (Children and teenagers under 18 should follow this guideline
routinely.)
The guidelines also emphasise the importance of maintaining a physical
environment where it is convenient and safe for children to exercise: ‘Encourage
opportunities for children to be physically active out of school hours by
supporting the development and maintenance of safe school routes and parks’.40
Physical activity and the impact of television, computers and video
games
A study of Geelong adolescents41 found that the average number of hours of
television viewing per week (16 hours for boys and 18 for girls) greatly
exceeded the number of hours spent in physical activity, although the time spent
watching television was not as high as that reported for 11–12 year olds in
Pennsylvania.42 Williams and Handford43 noted a direct inverse relationship
between the time spent watching television and the time spent engaged in active
sport, while Tucker44 found that adolescent boys who watched television for less
than two hours a day had significantly greater cardiovascular fitness than their
peers who watched more than four hours of television daily. In a study of 4069
children in the United States, the prevalence of obesity was found to be lowest
26
Dietary Guidelines for Children and Adolescents in Australia
2. C HILDREN &
ADOLESCENTS NEED SUFFICIENT NUTRITIOUS FOODS TO GROW AND DEVELOP NORMALLY
in children watching one hour or less of television a day and highest among
those watching four hours or more a day. In girls, television watching was
positively associated with obesity, even after controlling for age, race/ethnicity,
family income, weekly physical activity, and energy intake.45 A randomised
controlled trial of reducing children’s television and video watching—which did
not specifically target physical activity—found a reduction in BMI and other
indices.46
The American Academy of Pediatrics has recently reviewed the role of television
from the paediatrics perspective, including its impact on the nutritional status of
children and adolescents.47 It concluded, ‘Research has shown primary negative
health effects on violence and aggressive behaviour; sexuality; academic
performance; body concept and self-image; nutrition, dieting, and obesity; and
substance use and abuse patterns.’ The academy makes a number of
recommendations for health care workers and parents, among them limiting
television viewing to one to two hours a day, which is less than half current
viewing patterns in the United States. The increasing prevalence of computers
and video games in the home also has an impact on children’s activity levels.
Overweight and obesity
Australia is part of a worldwide obesity epidemic, which is affecting children of
all ages as well as adults. Detailed comparisons of obesity rates in children are
often difficult to obtain because different criteria have been used to define
overweight and obesity in different age groups and different growth references
have been used. Lazarus et al.48 compared data from two population-based
surveys (in 1985 and 1997) of 7–12 year old children in Victoria; they found that
the children had become more obese in the 12 years between the surveys and,
of particular concern, that the increase in BMI was most marked at the heavier
end of the distribution. Mean BMI increased by 1.03kg/m2 for boys and 1.04kg/
m2 for girls. In the United States in the past two decades the prevalence of
overweight has increased by 80 per cent in children and 100 per cent in
adolescents.49 In the United Kingdom rates of overweight in children have
doubled over a similar period.50
Prevention remains very important because obesity is hard to treat and has
adverse physical and psychological outcomes. Overweight children are more
likely to become obese adults51, and an overweight school-aged child with an
obese parent has more than a 70 per cent chance of being obese in young
adulthood.52
Metabolic consequences of obesity
Obese children and adolescents can show early signs of metabolic and clinical
consequences—such as hyperinsulinaemia and hypertriglyceridaemia—that are
well recognised in obese adults.53 Additionally, obese children and adolescents
have been shown to have reduced exercise tolerance and so obtain reduced
Dietary Guidelines for Children and Adolescents in Australia
27
2. C HILDREN &
ADOLESCENTS NEED SUFFICIENT NUTRITIOUS FOODS TO GROW AND DEVELOP NORMALLY
benefits from exercise.54 Non-alcoholic steatohepatitis is well recognised in adults
as a complication of obesity; it is now occurring in children and adolescents and
is related to the increasing prevalence of obesity and associated insulin
resistance.55
Psychological problems of obesity
The main ill-effects of obesity during childhood are social and emotional.54
Obese people are stigmatised and labelled with undesirable behavioural
characteristics ranging from social deviance to an inordinate desire for selfgratification.54 In 1967 Stunkard and Burt (cited by Johnston56) suggested that the
disturbance of body image reported among obese adults seems to have its origin
during adolescence, when belittlement and peer pressure have particularly
deleterious effects.
Underweight, failure to thrive and dietary restriction
The most serious consequences of an inappropriate food intake in infancy and
early childhood are underweight and failure to thrive. In Australia, in recent
years, concern about the prevalence of underweight and failure to thrive in
infancy and childhood has largely focused on Indigenous communities, where
the aetiology of the problem rests in a complex mix of social and economic
factors.57,58 Failure to thrive among other sections of the community is also most
commonly a result of psychosocial factors, including poor living conditions.59
Psychosocial failure to thrive—which at its most extreme is a manifestation of
child neglect—is the most common form of failure to thrive in both inpatient and
outpatient populations in the non-Indigenous community.60 The literature
provides evidence that from time to time cases of failure to thrive also occur in
more affluent sections of the community as a consequence of parents
inappropriately restricting the dietary intake of young children because of fears
about obesity and atherosclerosis or the development of ‘unhealthy’ dietary
habits.61 Such cases are, however, relatively rare compared with the problem of
dietary restriction in older children and adolescents.62
Perception of body image
A Sydney study of 133 girls aged 12 to 14 years found that while 18 per cent
could be classified as ‘underweight’ and 26 per cent as ‘overweight’, 37 per cent
thought they were too fat and 42 per cent were on a diet to lose weight.63 Data
from the 1985 National Dietary Survey of Schoolchildren64 showed that girls
increased their energy intake by less than 10 per cent between the ages of 10
and 15 years, whereas over the same age range boys increased theirs by some
45 per cent. Although the data probably exaggerate the real extent of the energy
restriction because of the tendency for reported dietary intakes to underestimate
habitual intakes65, the data do suggest that there is a need for information and
support to combat the fear of weight gain in this age group. First, adolescents
28
Dietary Guidelines for Children and Adolescents in Australia
2. C HILDREN &
ADOLESCENTS NEED SUFFICIENT NUTRITIOUS FOODS TO GROW AND DEVELOP NORMALLY
need reassurance that appreciable weight gain, changes in body shape and
increases in food intake are quite normal at this time; second, they need to be
aware that any extreme dietary practices that limit the intake of nutrients are
highly undesirable in relation to both their current and their longer term health.
Dieting and concerns about body size
Characteristics of disordered eating—such as restrained eating, binge eating, fear
of fatness, purging and distortion of body image—are commonly reported in
adolescents.66,67 There are also reports of children exhibiting similar weightrelated behaviours.61 These characteristics are more prevalent in females than
males. A Melbourne study of year 11 students found that 57 per cent of the
females had dieted to lose weight, while only 18 per cent of the males had done
so.68 Another study of women aged 15 to 27 years found that most of the study
population had dieted at some time. Several strategies were adopted to lose
weight; they ranged from exercising and not eating between meals to selfinduced vomiting and abuse of laxatives and diuretics.69 Similar weight-control
practices have been reported among 15-year-old New Zealand girls 70 and
Adelaide women aged 18 to 86 years.71 Abraham and Mira69 consider that most
adolescent females experience a phase of ‘disordered’ or ‘abnormal’ eating
behaviour, which they attribute to the social pressure on young women to be
slim and the association of slimness with health, happiness and attractiveness.
This pressure is combined with the biological changes—widening of the hips and
deposition of fat on the hips and breasts—that females experience during
adolescence.
There are only limited estimates of the prevalence of anorexia nervosa and
bulimia nervosa in Australia. These conditions are often described as affecting
large numbers of adolescent girls and young women, although, in a study of the
prevalence of anorexia nervosa in a population of 5705 South Australian girls
aged 12 to 18 years, Ben-Tovim and Morton72 found that true anorexia nervosa
was a relatively rare disorder, with a prevalence of 1.05 cases per 1000 of the
population studied. This study adopted quite rigorous criteria for the definition
of anorexia nervosa and did not describe the prevalence of more general eating
disorders that might lead to the development of anorexia nervosa or bulimia
nervosa. Nevertheless, the study lasted a year and the authors stated that none of
the milder variants of anorexia nervosa in the study population became more
severe during the study period.
An earlier study, by Ben-Tovim et al.73, of the prevalence of bulimia nervosa
found a similar situation. When the widely used criteria for the diagnosis of
bulimia (a syndrome of secretive and subjectively hard-to-control binge overeating) were used with three community and two hospital populations in South
Australia, 13 per cent of females aged 16 to 45 years in the community samples
could be categorised as bulimic. In contrast, when the term was defined with
reference to the behaviour of patients undergoing treatment for bulimia nervosa
(who not only binge over-ate but also acted to prevent the weight gain caused
by their overeating), a very different picture emerged: the prevalence of bulimia
among females in the community samples was about 1 to 2 per cent.
Dietary Guidelines for Children and Adolescents in Australia
29
2. C HILDREN &
ADOLESCENTS NEED SUFFICIENT NUTRITIOUS FOODS TO GROW AND DEVELOP NORMALLY
More recently, Patton et al.74 have reported that 3.3 per cent of female
adolescents and 0.3 per cent of male adolescents in a Victorian cohort exhibited
features of an eating disorder. Over the three-year study period the rate of
development of new eating disorders was 21.8 per 1000 person-years of
observation in females and 6.0 in males. The most important predictors of the
development of eating disorders were early dieting and psychiatric morbidity.
Thus, it would appear that, although only a small proportion of the female
population develops clinical eating disorders, a great many more display
disrupted eating behaviour and weight-control problems. There are indications
that children also exhibit some characteristics of disordered eating and concerns
about body weight, so preventive action should be aimed at children and young
women. Such action would be designed to help young women to accept a wide
range of weights and body shapes as normal and to develop mechanisms for
coping with the prevailing societal attitudes to weight and body shape69, as well
as dealing with more general matters relating to self-esteem, healthy family
function and recognition of the early features of psychiatric disability.69,75,76
PRACTIC AL
ASPECTS OF THIS GUIDELINE
Development
Children’s nutritional needs should be considered in the context of normal
childhood development. The following characteristics of normal childhood
development are identified in the Canadian guidelines Promoting Nutritional
Health During the Preschool Years.1
Throughout early childhood, children are:
• rapidly changing, not only growing in stature but developing in ability
and personality.
• keenly curious and learning at a rapid rate. Exploring the environment
through play takes up a large part of the young child’s time.
• continually challenging the relationship with the primary caregiver,
asserting independence while needing guidance and protection.
• gradually moving beyond the parent’s primary care to others in the
family, community and society.
• exploring food as part of their development.
Boxes 2.1 and 2.2 summarise the developmental characteristics of toddlers and
preschoolers in relation to food.
30
Dietary Guidelines for Children and Adolescents in Australia
2. C HILDREN &
ADOLESCENTS NEED SUFFICIENT NUTRITIOUS FOODS TO GROW AND DEVELOP NORMALLY
How is normal development assessed?
Unlike growth, there are no simple measures of development. A range of tests
can be used for assessing aspects of psychosocial development such as
intelligence, personality and emotional adjustment, but they require special
training. Such assessment is done by primary health care workers, with reference
to developmental milestones or screening tests (see, for example, reference 78).
Each child is unique, and this is reflected in individual rates of normal
development. Development is a gradual process of growth and expansion of
skills, moving from a low level of complexity to a more advanced level. It is
achieved through the processes of growth, maturation and learning.
Understanding how children and young people approach eating
The role of caregivers
The early years of life are critical in establishing food attitudes and habits.75
Caregivers can foster the formation of sound food habits by understanding eating
behaviour as part of a child’s normal pattern of development. They play a central
role in providing a safe environment that offers opportunities for exploration and
learning. The feeding and nutritional care of a child are an integral part of the
complex interaction between the primary caregiver and the child and are vital to
the child’s physical and emotional development.1,77 Contemporary lifestyle
patterns may mean that children have several different caregivers: good
communication between these caregivers helps to ensure that they can assess
and respond to a child’s individual needs.
Box 2.1 Developmental characteristics of toddlers1,78
The toddler years bring:
•
a time of exploration.Toddlers explore their surroundings by touching, seeing, listening,
smelling and tasting. Food is of immense interest to most of them—but not always to
eat
•
greater autonomy but at the same time a fear of new experiences. Between 18 and 24
months most toddlers can handle a spoon and cup for feeding themselves, although spills
often occur. ‘No’ becomes a favourite word. Inconsistency is also a common feature: one
day they insist on feeding themselves and the next day they insist on being fed
•
a need for a sense of security.The need for ritual and a sense of security is very strong in
toddlers. A desire for the familiar—a special toy or food—often dictates their daily
routine. This is an integral part of the normal transition from infancy to childhood
•
a limited attention span. Easily distracted, toddlers may be unable to sit at the family table
for the normal duration of a meal
•
awareness of others. Although not skilled in cooperative play, 2- and 3-year-olds are
gradually developing social skills. They often imitate people close to them. Watching
another child or adult who enjoys the food is a powerful influence on the toddler’s
acceptance of foods.
Dietary Guidelines for Children and Adolescents in Australia
31
2. C HILDREN &
ADOLESCENTS NEED SUFFICIENT NUTRITIOUS FOODS TO GROW AND DEVELOP NORMALLY
Box 2.2 Developmental characteristics of preschoolers1,78
In general, in preschoolers there is:
•
progressive acquisition of new skills. Preschoolers are striving for independence and
gaining competence in such activities as tying their shoes, brushing their teeth and
pouring milk. A preschooler’s oral motor development and manual dexterity should be
considered so that foods of appropriate texture, consistency and ease of eating are
chosen for them
•
energy. Sitting still for more than a few minutes might be difficult. Preschoolers need
plenty of time for active play and opportunities to develop gross motor coordination
•
more effective communication. Language is important. Peers become increasingly
important. Most preschoolers enjoy sharing food with friends and carers
•
a keen curiosity.‘Why’ has usually replaced ‘no’ as the favourite spoken word. The kitchen
provides an opportunity for experiments, crafts, and participation in food preparation
•
comfort with the familiar but willingness to try new challenges. Food fads are common
at this time. Preschoolers might insist on having a particular food prepared in a
particular way for several days then, once it has been experienced to the full, become
infatuated with another food. This has been called ‘fussiness’, but it is actually
characteristic of normal development. Although variety may be limited while the fad
persists, the preschooler is gradually expanding their food choices.
Food intake
Caregivers often appear to be more concerned with the amount of food
consumed rather than the type of food offered or even the feeding
environment.79 But obviously a balance between the amount, type and variety of
foods is necessary. Caregivers’ responsibility lies in buying the food, setting the
times of meals and snacks, preparing meals, presenting foods in suitable forms,
maintaining standards of behaviour at the table, and making meal times pleasant.
The nutritional quality of the diet is important to ensure that the child receives
the levels of nutrients specified in the recommended dietary intakes.9,80
The following are general characteristics of a child’s developing eating pattern:
•
Small amounts of foods eaten frequently. Because their stomach capacity is
small, children tend to eat small amounts frequently throughout the day.
•
Routine in daily life. Most children need some structure and routine to
their day. Generally, they prefer meals and snacks at regular times, as
governed by the family’s lifestyle.
•
Considerable variation in appetite. Children’s appetites normally fluctuate
from day to day, depending on their rate of growth and level of physical
activity. Many parents find their children eat better at certain times of the
day. Tiredness and irritability can prevent children from eating, especially
at the evening meal.
•
A preference for simplicity. Many children like simply prepared, mildtasting foods that they can easily identify. They prefer foods they can
manage—for example, cut-up vegetables they can eat with their fingers
and soups they can drink from a cup.
32
Dietary Guidelines for Children and Adolescents in Australia
2. C HILDREN &
•
•
ADOLESCENTS NEED SUFFICIENT NUTRITIOUS FOODS TO GROW AND DEVELOP NORMALLY
An association of food with more than eating. Foods have specific
meanings determined by a child’s associations with them; for example,
sweets may mean a reward for good behaviour in the supermarket.
Caregivers should be aware that early impressions associated with various
uses of food affect food-related attitudes and practices that can last
throughout life.
Dawdling over meals. It is quite normal for children—who have no
concept of time—to lose interest in an activity very quickly.1
A number of strategies can be adopted to encourage good eating habits and
monitor food intake:
•
Establish routines where the child and caregiver sit down together and talk
during meal times and snacks.
•
Establish habits—such as milk with a meal and water at bedtime—that will
help ensure variety and nutritional adequacy.
•
Keep in the fridge or on the kitchen bench a ‘snack-box’—containing
healthy snack foods such as pieces of fruit, vegetables, cheese and small
sandwiches—that the child can either use independently or have offered to
them. This helps to monitor what the child is eating between meals.
•
Introduce the practice of having the child at the table for meal times as
soon as he or she is able to sit up and grasp foods.
•
Do not give the child too large a serving. It is better to offer small amounts
and have more available if they want it.
•
Provide foods the child likes, plus a new food to try. Be accepting if the
child does not like particular foods, but remember that likes and dislikes
change over time. Do not avoid serving a food that the child dislikes but
that the rest of the family likes: continue to serve it, placing only a small
amount on the child’s plate, and accept it if they do not eat it.
‘Fussy eating’ is common among toddlers and often worries parents. Usually it is
a stage in normal development, but it can be aggravated by parental response.
When growth and development are normal and a variety of foods are offered to
the child, simple reassurance from the child’s parents may be all that is needed.81
An adequate intake of fluids is important at all ages. Children should be
encouraged to drink as much water as possible, in preference to other fluids.
Milk is an important source of calcium and, because it has a high protein
content, has a greater satiating effect than other drinks.82
Food preferences
Parents and peers
Parental influences on food patterns are critical in the development of food
preferences83, and parental pressure, even if it is positive, can affect a child’s
food acceptance.77 Using foods as rewards or presenting them paired with adult
attention increases a child’s preference for that food (Birch, cited by Sigman-
Dietary Guidelines for Children and Adolescents in Australia
33
2. C HILDREN &
ADOLESCENTS NEED SUFFICIENT NUTRITIOUS FOODS TO GROW AND DEVELOP NORMALLY
Grant79); when foods are simply presented at snack time or when they are
offered without a social context, food preferences do not appear to be
influenced. Another influence on food preferences is the frequency with which
children see a particular food. It is important for caregivers to present new foods
frequently: continued exposure promotes acceptance. Further, when children
observe adults consuming a food, it is more likely that the children will start to
consume the food.79 Peer influence can also affect children’s food preferences as
they age79; adolescents are particularly susceptible to peer pressure.84
Television advertising
In addition to its effects on physical activity, television exposes children to
numerous food advertisements. There has been much speculation in recent years
about the effects of that advertising, and of the media in general, on children’s
food preferences and intakes. Public health experts and nutrition educators have
expressed concern that many of the food advertisements on television directed at
children are for a narrow range of products that are high in fats, sugars and/or
salt and low in dietary fibre.85,86 Producers of basic foods such as vegetables and
fruits and agencies involved in promoting healthy diets often lack the funds to
advertise and so provide some balance in the range of products promoted.
A US study found that television commercials were important influences on the
types of food children ask their parents to buy and the foods they buy for
themselves.87 (Otherwise, why would advertisers bother?) Sweetened breakfast
cereals, candy, desserts, low-nutrient beverages, and salty snack foods were the
products most commonly advertised to children and are also the items most
frequently requested of parents. Kraak and Pelletier suggest that building
children’s and teenagers’ skills in processing consumer information is one
strategy—when combined with parental guidance and environmental support
(including government–industry partnerships)—that can help young consumers
make ‘healthful’ dietary choices before undesirable dietary behaviours have
developed.
Table 2.1 outlines some typical physical and social/personal characteristics
related to the eating practices of preschool children.
34
Dietary Guidelines for Children and Adolescents in Australia
2. C HILDREN &
Table 2.1
ADOLESCENTS NEED SUFFICIENT NUTRITIOUS FOODS TO GROW AND DEVELOP NORMALLY
Typical physical and social/personal characteristics related to
eating during the preschool years1,78
Age
Physical characteristics
Social/personal characteristics
12–18 months
Grasps and releases foods
with fingers
Holds spoon but use poor
Turns spoon in mouth
Uses cup but release poor
Wants food others are eating
Loves performing
18 months–2 years
Appetite decreases
Likes eating with hands
Likes experimenting with textures
Ritual becomes important
Displays food preferences
Distracts easily
Develops negative behaviour
2–3 years
Holds glass in hand
Places spoon straight in mouth
Spills a lot
Chews more foods but choking
still a hazard
Definite likes and dislikes
Insists on doing it ‘myself ’
Ritualistic
Dawdles
Food fads
Demands foods in certain shapes
and whole foods
Likes to help in the kitchen
3–4 years
Holds handle on cup
Improved appetite and interest
Pours from small jug
in food
Uses fork
Favourite foods requested
Chews most foods
Likes shapes, colours, ABCs
Able to choose between two
alternative foods
Influenced by television commercials
Likes to copy food preparer
Imaginative play
4–5 years
Uses knife and fork
Good use of cup
Good self-feeder
Rather talk than eat
Food fads continue
Motivated to eat by incentives
Likes to help
Interested in nature of food and
where it comes from
Peer influence increasing
5–6 years
Independent at feeding
Conforming
Less suspicious of mixtures but
still prefers plain foods
Social influence outside home
increasing
Food important part of special
occasions
Dietary Guidelines for Children and Adolescents in Australia
35
2. C HILDREN &
ADOLESCENTS NEED SUFFICIENT NUTRITIOUS FOODS TO GROW AND DEVELOP NORMALLY
Changing adolescents’ diets
Adolescents continue to eat diets that do not meet the dietary guidelines. The
following factors are important determinants of adolescent eating behaviour:
•
peer-group norms that devalue healthy eating behaviour
•
participation in other risky behaviours
•
low competency—actual and perceived—in sports, food selection and food
preparation
•
familial and cultural expectations.88
Management of obesity
The National Health and Medical Research Council’s Acting on Australia’s
Weight89 provides information about recognising and managing different types of
obesity during childhood and adolescence and about preventing nutritional
obesity. It stresses the need for full assessment of all children who appear to be
obese, in order to obtain a diagnosis that adequately explains the obesity and
determines the most suitable management strategy.
Inappropriate advice—such as a recommendation to participate in weight-loss
programs designed for adults—is likely to be not only harmful but also
ineffective. The most successful weight-reduction programs are those that
combine diet and exercise within a framework of behaviour modification.50
Children should be encouraged to reduce their consumption of sweetened
beverages86 and eat fewer high-fat snacks. Programs designed to reduce the
amount of time engaged in sedentary activity—television watching, for
example—have been successful in reducing weight gain and improving
fitness.90,91
Social change
Some social trends can also influence the food preferences and intakes of
children and adolescents:
•
the increasing number of meals bought and consumed outside the home.
Children and adolescents, either as part of the family or independently,
buy and consume foods from a wide variety of outlets, including childcare
centres and school canteens—see Chapter 3 for more discussion of this
•
the many foods and beverages that now come into the home in ready-toeat or convenience form. Packages of snack foods, biscuits and drinks are
all easily accessible in the home
•
working parents, increased use childcare facilities and the diversity of
cuisines available (including packaged and ready-to-eat meals).
36
Dietary Guidelines for Children and Adolescents in Australia
2. C HILDREN &
ADOLESCENTS NEED SUFFICIENT NUTRITIOUS FOODS TO GROW AND DEVELOP NORMALLY
R E L AT I O N S H I P
TO OT H E R G U I D E L I N E S
This guideline on growth and development relates to almost all of the other
guidelines: a balanced, nutritious diet is the basis of healthy growth and
development.
Encourage and support breastfeeding
Chapter 1 discusses failure to thrive in breastfed infants.
Include milks, yoghurts, cheeses and/or alternatives
Section 3.4 discusses the importance of adequate intakes of calcium and of
physical activity in achieving peak bone mass.
CONCLUSION
An appropriate diet and plenty of physical activity are essential for growth and
development that optimise health during childhood, adolescence and the later
years of life.
EVIDENCE
There is Level III evidence of the relationship between foetal and perinatal nutrition
and adult type 2 diabetes (reference 4), heart disease (references 3 and 4) and
cognition (reference 6). There is Level II (ref 10) and Level III evidence for the
effect of calcium intakes and exercise throughout the development period on
subsequent bone density (references 7, 15 and 16; see also ‘Evidence’ in
Section 3.4). There is also Level III evidence of the relationship between body
fatness, inactivity and selected dietary factors in children (references 45, 47 and 91).
REFERENCES
1.
Network of the Federal/Provincial/Territorial Group on Nutrition &
National Institute of Nutrition. Promoting nutritional health during the
preschool years: Canadian guidelines. 1989.
2.
Centers for Disease Control and Prevention. CDC growth charts: United
States. Advance data. No. 314. 2000;1–28.
3.
Forsen T, Eriksson J, Tuomilehto J, Osmond C, Barker D. Growth in utero
and during childhood among women who develop coronary heart disease:
longitudinal study. BMJ 1999;319:1403–7.
Dietary Guidelines for Children and Adolescents in Australia
37
2. C HILDREN &
ADOLESCENTS NEED SUFFICIENT NUTRITIOUS FOODS TO GROW AND DEVELOP NORMALLY
4.
Harding JE. The nutritional basis of the foetal origins of adult disease. Int J
Epid 2001;30:15–23.
5.
Makrides M. Early childhood nutrition and cognitive outcome. Proc Nutr
Soc Aust 1998;22:216–22.
6.
Richards M, Hardy R, Kuh D, Wadsworth MEJ. Birth weight and cognitive
function in the British 1946 birth cohort: longitudinal population based
study. BMJ 2001;322:199–203.
7.
Cooper C, Fall C, Egger P, Hobbs R. Growth in infancy and bone mass in
later life. Ann Rheum Dis 1997;56:17–21.
8.
Loesch DZ, Stokes K, Huggins RM. Secular trend in body height and
weight of Australian children and adolescents. Am J Phys Anthrop
2000;111:545–56.
9.
National Health and Medical Research Council. Recommended dietary
intakes for use in Australia. Canberra: Australian Government Publishing
Service, 1991.
10.
Bonjour JP, Carrie AL, Ferrari S, Clavien H, Slosman D, Theintz G et al.
Calcium enriched foods and bone mass in prepubertal girls. J Clin Invest
1997;99:1287–94.
11.
American Academy of Pediatrics. Calcium requirements of infants, children,
and adolescents. Pediatrics 1999;104:1152–7.
12.
Cavadini C, Siega-Riz AM, Popkin BM. US adolescent food intake trends
from 1965 to 1996. Arch Dis Child 2000;83:18–24.
13.
Australian Bureau of Statistics. National Nutrition Survey: selected
highlights, Australia, 1995. Canberra: ABS, 1997.
14.
Australian Bureau of Statistics. Apparent Consumption of Foodstuffs, 1997–
98 and 1998–99, Australia. Canberra: ABS, 2000.
15.
Wyshak G, Frisch RE. Carbonated beverages, dietary calcium, the dietary
calcium/phosphorus ratio, and bone fractures in girls and boys. J Adolesc
Health 1994;15(3):210–15.
16.
Wyshak G. Teenaged girls, carbonated beverage consumption, and bone
fractures. Arch Pediatr Adolesc Med 2000;154(6):610–13.
17.
Dibley MJ, Goldsby JB, Staehling NW, Trowbridge FL. Development of
normalized curves for the international growth reference: historical and
technical considerations. Am J Clin Nutr 1987;46:736–48.
18.
WHO Working Group. Use and interpretation of anthropometric indicators
of nutritional status. Bull Wld Hlth Org 1986;64:929–41.
19.
Hamill PVV, Drizd TA, Johnson CL, Reed RB, Roche AF, Moore WM.
Physical growth: National Centre for Health Statistics percentiles. Am J Clin
Nutr 1979;32:607–29.
38
Dietary Guidelines for Children and Adolescents in Australia
2. C HILDREN &
ADOLESCENTS NEED SUFFICIENT NUTRITIOUS FOODS TO GROW AND DEVELOP NORMALLY
20.
Ogden C, Kuczmarski R, Flegal K, Mei Z, Guo S, Wei R et al. Centers for
Disease Control and Prevention 2000 growth charts for the United States:
improvements to the 1977 National Center for Health Statistics version.
Pediatrics 2002;109(1):45–60.
21.
Dewey KG, Peerson JM, Brown KH, Krebs NF, Michaelsen KF, Persson LA
et al. Growth of breast-fed infants deviates from current reference data: a
pooled analysis of US, Canadian and European data sets. Pediatrics
1995;96: 495–503.
22.
WHO Working Group on the Growth Reference Protocol. WHO Working
Group on the Growth Reference Protocol and WHO Task Force on
Methods for the Natural Regulation of Fertility Growth Patterns of
Breastfed Infants in Seven Countries. Acta Paediatr 2000;89(2):215–22.
23.
Binns CW. Infant feeding and growth. In: Ulijaszek SJ, Johnston FE, Preece
MA, eds. Cambridge encyclopedia of human growth and development.
Cambridge: Cambridge University Press; 1998:320–9.
24.
Smith RM, Smith PA, McKinnon M, Gracey M. Birthweights and growth of
infants in five Aboriginal communities. ANZ J Pub Hlth 2000;24:124–35.
25.
Grummer-Strawn L, Garza C, Johnson CL. Childhood growth charts.
Pediatrics 2002;109:141–2.
26.
Dietz WH, Bellizzi MC. Introduction: the use of body mass index to assess
obesity in children. Am J Clin Nutr 1999;70(suppl.):123S–125S.
27.
Cole TJ, Bellizi MC, Flegal KM, Dietz WH. Establishing a standard
definition for child overweight and obesity worldwide: international
survey. BMJ 2000;320:1240–3.
28.
Booth M, Wake M, Armstrong T, Chey T, Hesketh K, Mathur S. The
epidemiology of overweight and obesity among Australian children and
adolescents. ANZ J Pub Hlth 2001;25:162–9.
29.
Hebebrand J, Himmelmann GW, Heseker H, Schafer H, Remschmidt H. Use of
percentiles for the body mass index in anorexia nervosa: diagnostic,
epidemiological and therapeutic considerations. Int J Eat Dis 1996;19:359–69.
30.
Turner J, Forbes D, Mcdermott B, Martin C, Potts J, Palmer L et al. Use of
body mass index (BMI) in the assessment of medical complications of girls
with eating disorders. J Paediatr Ch Hlth 1997;33:A35.
31.
Lloyd T, Chinchilli VM, Johnson-Rollings N, Kieselhorst K, Eggli DF, Marcus
R. Adult female hip bone density reflects teenage sports-exercise patterns
but not teenage calcium intake. Pediatrics 2000;106(1):40–4.
32.
Zubrick S, Silburn S, Garton A et al. Western Australian Child Health
Survey: Developing Health and Well-being in the Nineties. Perth: Australian
Bureau of Statistics & Institute for Child Health Research, 1995.
33.
Dietz WH, Gortmaker SL. Do we fatten our children at the TV set?
Television viewing and obesity in children and adolescents. Pediatrics
1985;75:807–12.
Dietary Guidelines for Children and Adolescents in Australia
39
2. C HILDREN &
ADOLESCENTS NEED SUFFICIENT NUTRITIOUS FOODS TO GROW AND DEVELOP NORMALLY
34.
Garaulet M, Martinez A, Victoria F, Perez-Llamas F, Ortega R, Zamora S.
Differences in dietary intake and activity level between normal-weight and
overweight or obese adolescents. J Pediatr Gastro 2000;30:253–8.
35.
Meredith CN, Dwyer JT. Nutrition and exercise: effects on adolescent
health. Ann Rev Nutr 1991;12:309–33.
36.
Gliksman M, Dwyer T, Wlodarczyk J. Differences in modifiable
cardiovascular disease risk factors in Australian schoolchildren: the results
of a nation-wide survey. Prev Med 1990;19:291–304.
37.
Must A, Jacques PF, Dallal G, Bajema CJ, Dietz WH. Long-term morbidity
and mortality of overweight adolescents. A follow-up of the Harvard
Growth Study of 1922 to 1935. N Eng J Med 1992;327:1350–5.
38.
Paffenbarger RS, Hyde RT, Wing AL, Hsieh CC. Physical activity, all-cause
mortality and longevity of college alumni. N Eng J Med 1986;314:605–13.
39.
Department of Health and Human Services. Physical activity and health: a
report of the Surgeon General. Atlanta, GA: DHHS, Centers for Disease
Control and Prevention & National Center for Chronic Disease Prevention
and Health Promotion, 1996.
40.
Department of Health and Aged Care. Developing an active Australia: a
framework for action for physical activity and health. Canberra: DHAC,
1998.
41.
Tienboon P, Rustihauser I, Wahlqvist M. A family study of coronary risk
factors in Geelong. Aust J Pub Hlth 1992;16:20–5.
42.
Shannon B, Peacock J, Brown M. Body fatness, television viewing and
calorie intake of a sample of Pennsylvania sixth grade children. J Nut Educ
1991;23:262–8.
43.
Williams TM, Handford AG. Television and other leisure activities. In:
Williams T, ed. The impact of television: a natural experiment in three
communities. New York: Academic Press; 1986:87–142.
44.
Tucker LA. The relationship of television viewing to physical fitness and
obesity. Adolescence 1986;21:797–806.
45.
Crespo CJ, Smit E, Troiano RP, Bartlett SJ, Macera CA, Andersen RE.
Television watching, energy intake, and obesity in US children: results
from the third National Health and Nutrition Examination Survey, 1988–
1994. Arch Ped Adol Med 2001;155:360–8.
46.
Robinson TN. Reducing children’s television viewing to prevent obesity: a
randomised controlled trial. JAMA 1999;282:1561–7.
47.
American Academy of Pediatrics. Children, adolescents, and television
(Statement RE0043). Pediatrics 2001;107(2):423–6.
48.
Lazarus R, Wake M, Hesketh K, Waters E. Change in body mass index in
Australian primary school children, 1985–1997. Int J Obes Relat Metab
Disord 2000;24(6):679–84.
40
Dietary Guidelines for Children and Adolescents in Australia
2. C HILDREN &
ADOLESCENTS NEED SUFFICIENT NUTRITIOUS FOODS TO GROW AND DEVELOP NORMALLY
49.
Field AE, Colditx GA. Overweight, central adiposity, and cardiovascular
disease risk patterns in children. J Pediatr 1999;135:409–10.
50.
Fruhbeck G. Childhood obesity: time for action, not complacency. BMJ
2000;320:328–9.
51.
Baughcum AE, Chamberlin LA, Deeks CM, Powers SW, Whitaker RC.
Maternal perceptions of overweight preschool children. Pediatrics
2000;106:1380–6.
52.
Whitaker RC, Wright JA, Pepe MS, Seidel KD, Dietz WH. Predicting obesity
in young adulthood from childhood and parental obesity. N Engl J Med
1997;337:869–73.
53.
Court JM. The development of obesity in childhood. Med J Aust
1979;2:248–50.
54.
Mossberg HO. Forty year follow-up of overweight children. Lancet
1989;1:491–3.
55.
Manton NN, Lipsett J, Moore DJ, Davidson GP, Bourne AJ, Couper RT.
Non-alcholic steatohepatitis in children and adolescents. MJA
2000;173:476–9.
56.
Johnston FE. Health implications of childhood obesity. Annals Intern Med
1985;103:1068–72.
57.
Gracey M, Murray H, Hitchcock NE, Murphy BP. The nutrition of Australian
Aboriginal infants and young children. Nut Res 1983;3:133–47.
58.
National Health and Medical Research Council. Statement on obesity in
childhood and adolescence. Canberra: NHMRC, 1986.
59.
Oates RK, Yu JS. Children with non-organic failure to thrive—a community
problem. Med J Aust 1971;2:199–203.
60.
Oates RK. Non-organic failure to thrive. Aust Paed J 1984;20:95–100.
61.
Pugliese MT, Weyman-Daum M, Moses N, Lifshitz F. Parental health beliefs
as a cause of non-organic failure to thrive. Paediatrics 1987;80:175–82.
62.
Gustafson-Larson A, Terry RD. Weight-related behaviors and concerns of
fourth-grade children. JADA 1992;92:818–22.
63.
O’Dea J. Poor body image and women: what are the adverse effects? Paper
presented at Fat or Fiction? National Conference on Dieting, Body Image
and Women’s Health. Sydney, July 1992.
64.
Department of Community Services and Health. National dietary survey of
schoolchildren (aged 10–15 years), 1985. No. 2: nutrient intakes. Canberra:
AGPS, 1989.
65.
Black AE, Goldberg GR, Jebb SA, Livingstone MBE, Cole TJ, Prentice AM.
Critical evaluation of energy intake data using fundamental principles of
energy physiology. 2: evaluation of the results of published surveys. Eur J
Clin Nutr 1991;45:583–99.
Dietary Guidelines for Children and Adolescents in Australia
41
2. C HILDREN &
ADOLESCENTS NEED SUFFICIENT NUTRITIOUS FOODS TO GROW AND DEVELOP NORMALLY
66.
Centers for Disease Control. Body-weight perceptions and selected weight
management goals and practices of high school students—United States.
JAMA 1990;266:2811–12.
67.
Mellin LM, Irwin CE, Scully S. Prevalence of disordered eating in girls: a
survey of middle-class children. JADA 1992;92:851–3.
68.
Crawford M, Selwood T. The nutritional knowledge of Melbourne high
school students. J Food Nutr 1983;40:25–34.
69.
Abraham S, Mira M. Hazards of attempted weight loss. Med J Aust
1988;148:324–5.
70.
Worsley A, Worsley AJ, McConnon S, Silva P. The weight control practices
of 15 year old New Zealanders. J Paediatr Ch Hlth 1990;26:41–5.
71.
Crawford DA, Worsley A. Dieting and slimming practices of South
Australian women. Med J Aust 1990;148:325–7, 330–1.
72.
Ben-Tovim DI, Morton J. The epidemiology of anorexia nervosa in South
Australia. ANZ J Psych 1990;24:182–6.
73.
Ben-Tovim DI, Subbiah N, Sachets B, Morton J. Bulimia: symptoms and
syndromes in an urban population. ANZ J Psych 1989;23:73–80.
74.
Patton GC, Selzer R, Coffey C, Carlin JB, Wolfe R. Onset of adolescent
eating disorders: population based cohort study over 3 years. BMJ
1999;318:765–8.
75.
O’Dea JA, Abraham S. Improving the body image, eating attitudes, and
behaviors of young male and female adolescents: a new educational
approach that focuses on self- esteem. Int J Eat Dis 2000;28:43–57.
76.
Paxton SJ. A prevention program for disturbed eating and body
dissatisfaction in adolescent girls: a 1 year follow-up. Hlth Educ Res
1993;8:43–51.
77.
Satter LM. The feeding relationship. JADA 1986;86:353–6.
78.
Kilham H, Isaacs D, eds. The New Children’s Hospital handbook.
Westmead: New Children’s Hospital, 1999.
79.
Sigman-Grant M. Feeding preschoolers: balancing nutritional and
developmental needs. Nutr Today 1992;27:13–17.
80.
Lewis J, Pollard C, Miller M. Recommendations for nutritionally adequate
food for children one to five years in long day care centres. Perth: WA
Health Department & School of Public Health, Curtin University, 1999.
81.
Thompson SM. Fussy eaters: advising parents of toddlers. Mod Med
1999;42(3):18–22.
82.
Bray G. Afferent signals regulating food intake. Proc Nut Soc 2000;59:373–84.
83.
Klesges RC, Stein RJ, Eck LH, Isbell TR, Klesges LM. Parental influence on
food selection in young children and its relationships to childhood obesity.
Am J Clin Nutr 1991;53:859–64.
42
Dietary Guidelines for Children and Adolescents in Australia
2. C HILDREN &
ADOLESCENTS NEED SUFFICIENT NUTRITIOUS FOODS TO GROW AND DEVELOP NORMALLY
84.
Rolls B. Food beliefs and food choices in adolescents. Med J Aust
1988;148(suppl.):S9–S13.
85.
Byrd-Bredbenner C, Grasso D. Health, medicine, and food messages in
television commmercials during 1992 and 1998. J School Hlth 2000;70:61–5.
86.
Pincus G. Food advertisements and nutrition. Paper presented at
conference Children and Advertising: a fair game? Sydney, July 1994.
87.
Kraak V, Pelletier DL. The influence of commercialism on the food
purchasing behavior of children and teenage youth. Family Ec Nutr Rev
1998;11:15–23.
88.
Adams LB. An overview of adolescent eating behavior barriers to
implementing dietary guidelines. Annals of the New York Academy of
Sciences 1997;817:36–48.
89.
National Health and Medical Research Council. Acting on Australia’s
weight. Canberra: NHMRC, 1997.
90.
Epstein LH, Paluch RA, Gordy CC, Dorn J. Decreasing sedantary behaviors
in treating pediatric obesity. Arch Pediatr Adolesc Med 2000;154:220–6.
91.
Gortmaker S, Cheung L, Peterson K, Chomitz G, Cradle J, Dart H et al.
Impact of a school-based interdisciplinary intervention on diet and
physical activity among urban primary school children. Arch Pediatr
Adolesc Med 1999;153:975–83.
Dietary Guidelines for Children and Adolescents in Australia
43
3. E NJOY
3
A WIDE VARIETY OF NUTRITIOUS FOODS
E N J OY A W I D E VA R I E T Y O F
NUTRITIOUS FOODS
Colin Binns and Mi Kyung Lee
TERMINOLOGY
Food variety
Food variety can be defined in terms of foods that are biologically diverse or
foods that are nutritionally distinct from each other. Eating a variety of nutritious
foods means consuming different food types in appropriate amounts—as
illustrated by the Australian Guide to Healthy Eating (see Figure 3.1)—to obtain
all the required nutrients without excess energy intake.1 Variety further refers to
choosing a range of items from within each food group, particularly from the
plant-based food groups (vegetables, fruits and cereals). Although variety is an
important nutritional principle, the evolution of modern sedentary society means
that if variety is to be maintained a reduction in serving sizes needs to be
considered, particularly for more energy dense foods with limited nutrient
content (see ‘Practical aspects of this guideline’).
Nutritious foods
The term nutritious foods is used to describe foods that make a substantial
contribution to providing a range of nutrients, have an appropriate nutrient
density, and are compatible with the overall aims of the dietary guidelines. The
nutrients that are essential for human life are found in varying amounts in many
different foods, and a varied diet is essential to obtain sufficient quantities of all
required nutrients (known and not yet known), to increase consumption of
protective factors (phytochemicals), and to minimise exposure to toxicants.
Weaning
The word weaning can confuse because it is used in various contexts in the
literature. In this guideline the term introduction of solids is used instead.
B AC K G RO U N D
Eating a wide variety of nutritious foods is important in childhood, when growth
and maturation are occurring and future eating habits are being established.
Variety is a primary factor in the development of lifelong healthy eating
behaviours. Consumption of a wide variety of foods makes it less likely that
excessive or inadequate amounts of any particular nutrient or other food
Dietary Guidelines for Children and Adolescents in Australia
45
3. E NJOY
A WIDE VARIETY OF NUTRITIOUS FOODS
component will be consumed. Adolescence is a period of rapid growth and
lifestyle changes, but it is also an important period for maintaining optimal
nutrition. The first word of this guideline is enjoy, and eating should be an
enjoyable activity for all children. Childhood is a time when an appreciation of
the pleasures of good food can be developed, in a context of healthy nutrition.
Good eating habits begin in childhood. Parents and other caregivers can set an
example for children by offering a wide variety of foods, setting regular meal
patterns, and providing sufficient ‘training’ to establish good dietary behaviour.
The word mother is often used in this guideline when referring to infants and
young children. In all cases other than in connection with breastfeeding, parent
or caregiver could be substituted.
SCIENTIFIC
BASIS
Infants
In infants up to the age of 6 months, breastmilk universally provides the ideal
food, meeting all nutritional requirements (for scientific rationale, see Section 1
of this document and the accompanying Infant Feeding Guidelines for Health
Workers). There is no universal model of feeding for older infants, but a growing
number of studies provide guiding principles. Different cultures introduce
different foods at different ages.
Introduction of solid foods
The expression introduction of solids describes the process whereby an infant,
having previously been fed solely milk, gradually becomes accustomed to a
variety of other foods until he or she can deal with the general family diet. The
expression is preferable to weaning because it more accurately conveys the idea
that the process does not involve cessation of breastfeeding.2
Four
•
•
•
•
main questions arise in connection with the introduction of solid foods:
At what age should solid foods be introduced?
What foods should be introduced?
How should foods be introduced?
How can the risk of infection be reduced?
When should solid foods be introduced?
Breastfeeding provides sufficient nutrients until around the age of 6 months for
most infants. There is almost universal agreement that solids should not be
started before the age of 4 months and that they should not be delayed much
beyond the age of 6 months. Resolutions from the World Health Assembly in
1990 and 1992 advise ‘4–6 months’, while a 1994 resolution recommends ‘about
6 months’. In several more recent publications from WHO and UNICEF both
46
Dietary Guidelines for Children and Adolescents in Australia
3. E NJOY
A WIDE VARIETY OF NUTRITIOUS FOODS
expressions have been used. In a 1992 WHO review, Lutter3 concluded that the
scientific basis for recommending 4–6 months was not adequately documented;
in a 1998 WHO report on complementary feeding in developing countries, it was
recommended that full-term infants be exclusively breastfed to about 6 months
of age.4 A number of observational studies and two randomised trials have not
identified any benefits from the introduction of solid foods before the age of 6
months.4–6
The debate about the timing and extent of exposure to complementary foods
focuses on immune function, the acquisition of immuno-tolerance, and the
functional imprinting of intestinal function, its microflora and systemic
metabolism.7
In the past when the term 4–6 months has been used, some mothers may have
felt that their child was more advanced and introduced solids at an earlier age.
Using 6 months promotes an improved public health outcome. In 1999 the WHO
European Region Division summarised the recent thinking thus:
All infants should be exclusively breastfed from birth to about 6 months of
age, and at least for the first 4 months of life. Breastfeeding should
preferably continue beyond the first year of life, and in populations with
high rates of infection continued breastfeeding throughout the second year
and longer is likely to benefit the infant.8
In 2001 the report of a WHO Expert Consultation recommended exclusive
breastfeeding for about 6 months, with the introduction of complementary foods
and continued breastfeeding thereafter <www.who.int>. The 2001 World Health
Assembly brought together these various recommendations in one resolution
recommending exclusive breastfeeding until 6 months of age.
Six months of age is a suitable time for most infants to begin to adapt to
different foods, food textures and modes of feeding.9 Gradual inclusion of solid
foods allows an infant to become used to different foods and textures. Six
months of age has been identified as a time when:
•
An infant’s appetite and nutritional requirements are generally no longer
satisfied by breastmilk or infant formula alone.10,11 At this time stores of
several nutrients—for example, iron and zinc—are often falling in
exclusively milk-fed infants (both breast- and formula-fed).11 Iron status is
a particular concern; it is discussed in detail in Section 3.3.
•
The development of feeding behaviour has progressed from sucking to
biting—and, by 7–9 months, chewing.10 This is attributable to the
disappearance of the tongue-extrusion reflex2,12 and the infant’s increasing
ability to sit without support, which allows greater manipulation of food
before swallowing, so that thicker foods can be handled.9,12,13
•
The digestive system matures. An infant’s digestive system cannot cope
with foods other than milk in the early months. Salivary amylases are
present at birth, but it appears that pancreatic amylases are essentially
absent up to at least 3 months of age and remain inadequate up to 6
Dietary Guidelines for Children and Adolescents in Australia
47
3. E NJOY
•
A WIDE VARIETY OF NUTRITIOUS FOODS
months. As a result, the ability to digest starches is limited, if not absent,
until the middle of the first year of life.2
Most infants have developed an interest in their environment, and this
prompts a willingness to accept new textures and flavours. It is useful to
exploit this exploratory phase by gradually introducing new food tastes
and textures.
Cultural, social and medical factors also appear to influence the age at which
solids are introduced. Different cultures have their own traditions about what
food is most suitable to begin with, and culturally appropriate foods and
preparation methods should be encouraged when they are nutritionally
adequate.
Introducing solid foods too soon can lead to several problems:
•
If less time is spent on the breast, maternal milk production may decline
because of reduced stimulation. In extreme cases under-nutrition could
result.14
•
If solid foods are introduced before an infant is developmentally ready—
while the tongue-extrusion reflex is still strong—the infant will reject the
spoon (a hard object). The mother might then feel that the infant is
rejecting the food, when in fact it is rejecting the object placed in its
mouth. Early introduction of foods does not lead to earlier loss of the
tongue-extrusion reflex: it just prolongs the length of introduction.
•
Food allergies can develop.
•
Exposure to pathogens present in foods can cause increased rates of
diarrhoeal diseases and other problems.
Introducing solid foods too late can also cause problems:
•
Growth can falter because breastmilk alone is insufficient after 6 months.
•
Immune protection can be compromised.
•
Micronutrient deficiencies—especially of iron and zinc—can develop
because of breastmilk’s inability to meet requirements.
•
Optimal development of motor skills such as chewing can be delayed and
the infant may be unwilling to accept new tastes and textures.
Although exclusive breastfeeding to 6 months of age is recommended, more
experience is needed to identify any subgroups that require earlier introduction
of solids (but never before 4 months).15 Six months should be regarded as a
group recommendation.
A longitudinal study of 506 Swedish infants showed how long it can take to
introduce solid foods. Infants took a median of 28 days from the first
introduction of solids to consumption of more than 10 millilitres daily; it was 46
days before the infants ate 100 millilitres of solids in one day for the first time.
Most infants in this study were given solids at ages between 4 and 6 months. The
younger the infant was at the time of introduction of solids, the longer it took to
introduce them.16 Delaying the introduction of solids until 6 months will
considerably shorten this period.
48
Dietary Guidelines for Children and Adolescents in Australia
3. E NJOY
A WIDE VARIETY OF NUTRITIOUS FOODS
Current Australian practices
In a study of infants in Melbourne, Graham et al.17 found that the majority of
mothers were following the 4–6 months recommendation current at the time of
the study: the mean age for the introduction of solids was 4.3 months. The
average age for the introduction of cow’s milk was 10.3 months, although some
ethnic groups introduced it earlier. The groups most likely to introduce solids
before 4 months were very young mothers, first-time mothers and mothers
speaking languages other than English. In an Adelaide study, 40 per cent of
infants under 4 months of age were having solid foods and the majority of these
were not being breastfed.18
Infant formulas and other milks
Modern infant formulas provide a suitable form of nutrition when an infant, for
whatever reason, does not have access to breastmilk. Traditional formulas are
based on cow’s milk, with varying proportions of casein and whey proteins.
More recently, formulas based on soy or goat’s milk and lactose-free formulas
have been developed for infants who cannot tolerate cow’s milk or lactose.
Chapter 1 discusses the advantages of breastmilk as opposed to infant formulas.
Table 3.1 shows the composition of human milk and cow’s milk and the
recommended composition of infant formulas.
Table 3.1
Composition of mature human milk and cow’s milk (per
100ml) and recommended composition for infant formula
Component
Energy (kJ)
Energy (kcal)
Protein (g)
Mean value for
mature human milk
280
Cow’s milk
Infant formula a
276
273–285
67
66
65–68
1.3b
3.2
1.5–1.7
Fat (g)
4.2
3.9
3.6–3.9
Carbohydrate (g)
7.0
4.6
7.0–7.6
Sodium (mg)
15
55
14–17
Chloride (mg)
43
97
40–68
Calcium (mg)
35
120
42–55
Phosphorus (mg)
15
92
21–32
Iron (µg)
76c
60
700–1200d
Vitamin A (µg)
60
35
60–92
Vitamin C (mg)
3.8
1.8
5.4–7.1
Vitamin D (µg)
0.01
0.08
0.85–1.40
a.
b.
Acceptable range.
True protein = 0.85g per 100ml (excluding non-protein nitrogen), although a proportion of the nonprotein nitrogen is used for maintenance and growth in infants.
c.
Iron in breastmilk is highly bioavailable, with absorption of 50–70 per cent.
d.
Iron in infant formula is poorly bioavailable, with absorption of only about 10 per cent.
Note: Appendix G in the Infant Feeding Guidelines for Health Workers provides more detailed information.
Dietary Guidelines for Children and Adolescents in Australia
49
3. E NJOY
A WIDE VARIETY OF NUTRITIOUS FOODS
Follow-on formulas
Breastmilk is the preferred milk for infants up to at least 12 months of age and
offers benefits beyond this time. When, for whatever reason, breastmilk cannot
be offered, a standard infant formula should form the main milk component of
the diet for infants up to 12 months of age. The main advantage of ‘follow-on
formulas’ lies in their iron content: infants at this age should ideally be getting
iron from a varied and expanding range of solid foods, including meatcontaining products. But, although the iron fortification contained in follow-on
formulas is an advantage for infants who are receiving inadequate amounts of
solid food, other compositional changes in protein, fat, carbohydrate, sodium
and calcium have no clearly established superiority over ordinary formula
provided together with appropriate solid foods.19 The Infant Feeding Guidelines
for Health Workers provide more information about infant formulas.
Cow’s milk
Cow’s milk is not recommended for infants younger than 12 months of age for a
number of reasons:
•
It is a poor source of iron and the iron it does contain is poorly absorbed.
Introducing cow’s milk before 12 months of age predisposes an infant to
iron deficiency at an age when their iron stores become depleted.20,21
•
The composition of cow’s milk is not ideal for infants. Compared with
breastmilk and infant formula, cow’s milk contains higher levels of protein,
sodium, potassium, phosphorous and calcium22–24 and lower levels of iron,
vitamin C and linoleic acid, adding to the difficulty of providing a
balanced diet for older infants.
•
The high phosphorous and calcium content of cow’s milk may decrease
the bioavailability of iron from other dietary sources such as infant
cereals.20–22
•
The higher levels of protein, sodium and potassium in cow’s milk have
been associated with an increase in renal solute load in infants fed cow’s
milk.23,25
•
Feeding with cow’s milk has been shown to lead to increased
gastrointestinal tract blood loss in a large proportion of normal infants,
exacerbating the problem of iron deficiency.26 The problem can be severe
enough to result in unnecessary surgery.27 In a longitudinal study of 6209
Swedish infants, 1.9 per cent were found to develop IgE cow’s milk
antigens; the proportion was lower for exclusively breastfed infants.28
•
Early introduction of cow’s milk may be associated with increased rates of
subsequent adult disease such as type 2 diabetes.29–31
A prospective study in Adelaide showed no association between the duration of
breastfeeding or the introduction of cow’s milk and the development of islet
auto-immunity in high-risk children.32 Overall, infants fed cow’s milk have low
intakes of iron, linoleic acid and vitamin E and excessive intakes of sodium,
potassium and protein. Iron status and deficiency is discussed in more detail in
Section 3.3.
50
Dietary Guidelines for Children and Adolescents in Australia
3. E NJOY
A WIDE VARIETY OF NUTRITIOUS FOODS
Given all these factors, cow’s milk is not recommended for use as the main
source of milk for infants aged less than 12 months. Small amounts of cow’s milk
in foods such as breakfast cereal, yoghurt, cheese and custards that are prepared
for the rest of the family can, however, be given after about 9 months.
PRACTIC AL
ASPECTS OF THIS GUIDELINE
Infants
In terms of the practicalities of this guideline as it relates to infants, the
questions of what foods to introduce and how to introduce them arise.
What foods should be introduced?
Generally, in Australia the introduction of solid foods starts with iron-enriched
infant cereals at about 6 months. Vegetables, fruits, meats, poultry and fish are
then added gradually. There are no set rules about the order in which the latter
group should be introduced. Nutrient content is most important; another
important determinant is the food’s texture. The foods that are introduced should
be of high nutrient density. Fruit and vegetable purees are of low energy density,
and choices should be varied even at this early age to ensure adequate energy
and nutrient supply. An increasing range and quantity of foods should be offered
as the infant moves towards 12 months of age. Table 3.2 shows examples of
foods suited to an infant’s developmental stages.
Solid foods should provide an increasing proportion of the energy intake
because infants continue to grow rapidly during this time. Variety is likely to
meet the need for most nutrients and provide a basis for healthy eating habits.
By the end of the first year of life, an infant should be consuming a wide variety
of family foods, having progressed from pureed or mashed foods to foods that
are chopped into small pieces.2,12
Dietary Guidelines for Children and Adolescents in Australia
51
3. E NJOY
A WIDE VARIETY OF NUTRITIOUS FOODS
Table 3.2
Developmental stages and examples of foods8,33
Age (months)
Reflexes and skills
Types of food
Examples of foods that
can be consumed
0–6
Suckling, sucking and
swallowing
Liquids
Breastmilk
6–7 (if needed
earlier, not before
4 months)
Appearance of early
chewing
Increased strength of suck
Movement of gag reflex
from mid to posterior third
Pureed foods
Start with gluten-free
cereals (e.g. rice), then
add other foods such
as vegetable (e.g. carrot)
and fruit (e.g. apple,
banana) purees, mashed
potato, and well-cooked
pureed liver and meat
Toast fingers, rusks
8–12
Clearing spoon with lips
Biting and chewing
Lateral movements of
tongue and movement
of food to teeth
Mashed or chopped
foods and finger foods
Interested in an
extended range of
foods and textures
Well-cooked fish, minced
liver and meat
Mashed cooked vegetables
and fruit
Chopped raw fruit and
vegetables (e.g. banana,
melon, tomato)
Egg yolk, cereals (e.g. wheat,
oats), bread, pasta, cheese,
custards, yoghurt
From 12 months
Rotary chewing
movement
Jaw stability
Family foods
Plain pasteurised milk
Note: Table shows the types of food that can be consumed and swallowed successfully; it does not
necessarily show precisely when they should be offered.
If there is a strong history of family allergy, introduction of cheese, yoghurt, icecream, fish and wheat cereal should be delayed until 12 months of age. If there
is a strong history of peanut allergy, peanut products (including peanut butter)
should be avoided until after 3 years of age. Peanut allergy is common and can
be very severe. Peanut allergan can be found in breastmilk, and if there is a
family history of peanut allergy breastfeeding mothers should avoid peanuts.34
How should foods be introduced?
The following are general recommendations for the introduction of foods:
•
Foods should be introduced individually, and no salt, sugar or other
flavourings should be added. Water, breastmilk or infant formula can be
mixed with cereals. If cow’s milk is used at all, only small amounts of it
should be used for mixing with foods.2
•
Initially, new foods should be offered no more often than each five to 10
days, to avoid confusion and rule out the (remote) possibility of food
allergy or sensitivity.2,9,11
52
Dietary Guidelines for Children and Adolescents in Australia
3. E NJOY
•
•
•
A WIDE VARIETY OF NUTRITIOUS FOODS
Once most foods have been successfully introduced, the types of foods
offered should be changed frequently. This helps to ensure that the infant
receives a good balance of nutrients. It may also play a part in their
choosing a broader range of foods later on. Using family foods will help
the child become used to eating like the rest of the family.9
Care should be taken early on to choose foods of a texture that is suitable
for the child’s age and stage of development.9 Small, hard pieces of food,
such as nuts and seeds, should be avoided because they can be inhaled
and cause choking.35 In the absence of allergy, however, nut pastes can be
given.
Persistence may be required; in one study infants given 10 opportunities to
try foods increased their acceptance.
The first foods introduced should be soft and smooth-textured. An infant will
quickly learn to cope with foods of different textures and will accept food that
has been mashed with a fork or minced. It is important at this stage to encourage
the infant to chew. Once they are able to hold things, ‘finger foods’ such as
pieces of fruit, vegetables and bread can be offered. Other foods, such as meats,
can be chopped into small pieces. Feeding bottles are best used only for
breastmilk or infant formula. ‘Comfort sucking’ on a bottle can become a habit
that is hard to reverse. Feeding cups or lidded cups are preferred for liquids
other than breastmilk or formula from 6 months of age.
Foods that are unsuitable or that should be used with care
A number of foods are unsuitable for infants or should be used with care. Among
them are honey, tea, nuts, fruit juices and reduced-fat milks.
Honey
Honey can contain the spores of Clostridium botulinum and—unless it has been
carefully sterilised during processing—has been prohibited in foods for infants in
Australia for many years. After the age of 12 months, children are less
susceptible to this bacterium.37,38
Tea
Tea contains tannins and other compounds that bind iron and other minerals,
thereby reducing their bioavailability. Furthermore, sugar is often added to tea,
which increases the risk of dental caries.
Nuts
Foods such as nuts pose a problem for small children because of the risk of
inhalation and choking. In addition, peanuts present a risk of allergy: it is
estimated that 0.6 per cent of the US population (that is, 1.6 million people)
suffer from peanut allergy.34 Nut pastes are in common use, however, for
children who do not come from atopic families.
Dietary Guidelines for Children and Adolescents in Australia
53
3. E NJOY
A WIDE VARIETY OF NUTRITIOUS FOODS
Fruit juices
Fruit juices produced from compressed fruit contain all the nutrients present in
fruits but not the dietary fibre. Historically, fruit juices have been given to
children to prevent vitamin C deficiency and scurvy.
An Adelaide study found that, in addition to milk, fruit juice and water were the
main fluids given to infants aged less than 8 months.18 This was especially the
case for non-breastfed infants. Eighty-five per cent of the infants drinking juice
had started to do so by the age of 6 months.
In spite of this, fruit juice offers no nutritional benefits to infants under 6 months
of age and its consumption may lead to a reduced nutrient intake from
breastmilk. After 6 months, consumption of whole fruit is recommended
instead.39 Fruit juices are suitable for children in modest quantities, but excessive
consumption by young children has been associated with gastrointestinal
symptoms, failure to thrive, decreased appetite and loose stools.40–42 If pure fruit
juice is given to infants, it can be diluted with an equal amount of water. Fruit
juices that are commercially prepared for infants and young children have
usually been already diluted to less than 4 per cent total sugars. For older
children and adolescents, questions about sugar-containing drinks and the risk of
obesity arise. Milk drinks or water are good substitutes.
The following recommendations apply to the use of fruit juice39:
•
Juice should not be introduced into the diet of infants before 6 months of
age.
•
Infants should not be given juice from bottles or easily transportable
covered cups that allow them to consume juice easily throughout the day.
•
Infants should not be given juice at bedtime.
•
For children aged 1 to 6 years, the intake of fruit juice should be limited to
about 150 millilitres a day. For children aged 7 to 18 years, juice intake
should be limited to 240–360 millilitres a day (two servings a day).
•
Children should be encouraged to eat whole fruits to meet their
recommended daily fruit intake.
Reduced-fat milks
In Australia reduced-fat milks are recommended for older children and for all
adults as part of a healthy diet. They are not generally recommended for very
young children. In the United Kingdom, for example, semi-skimmed milk is not
normally recommended before the age of 2 years, and fully skimmed milk is not
recommended until a child is more than 5 years old.43 (See Sections 3.4 and 3.6
for a more detailed discussion.)
By the time children reach 2 years of age they can share in the reduced-fat dairy
products consumed by the rest of the family.
54
Dietary Guidelines for Children and Adolescents in Australia
3. E NJOY
A WIDE VARIETY OF NUTRITIOUS FOODS
Summary
A number of recommendations have been made to help parents meet the
nutritional needs of breastfed infants and young children aged 6 months to 2
years:44
•
Continue to breastfeed as often as the infant desires—to avoid
displacement of breastmilk by complementary foods and to maximise
nutrients and immunological benefits.
•
Aim for a variety of complementary foods—fruit, vegetables, meat, fish,
poultry and eggs. Iron-fortified infant cereals are good sources of iron.
Iron in meat is bioavailable, and meat is also a good source of zinc and
vitamin B12.
•
The best source of calcium is dairy products, although cow’s milk should
generally be avoided before 12 months.
•
Avoid too much fruit juice—a maximum of 120 millilitres a day before 12
months and 240 millilitres a day after 12 months.
•
Seek advice if the infant’s appetite, growth or developmental milestones
are impaired and further assessment is required.
•
Infants eating a balanced, varied diet do not usually require nutritional
supplements. Low-birthweight infants are an exception to this.
•
Meals are to be enjoyed. Parents who model enjoyment of good dietary
practices set the scene for good nutrition throughout childhood and
beyond.
•
Reduce the risk of infection. Attention to food hygiene is very important
when preparing foods for infants and children. See Chapter 4 for more
details.
Children
Toddlers and preschoolers
As discussed in Chapter 2, the period between a child’s first and fifth birthdays is
a time of rapid social, intellectual and emotional growth.45 It is also characterised
by a slowdown in the child’s growth rate, which may be reflected in a less
reliable appetite. In addition, at this age children are discovering their
independence and testing their choice in food selection, and this can lead to
reduced interest in eating what the rest of the family eats.
These factors combine to give the impression that some younger children are
‘poor’, ‘difficult’ or ‘fussy’ eaters.45 Generally, this does not compromise normal
growth or health, but if additional constraints are placed on the diet—such as the
application of restrictive diets (including cholesterol-lowering diets) and the
exclusion of particular foods for some reason—nutritional deficiencies can occur.
It is typical for children of this age to exhibit enormous variation in the amount
of food they eat at different meal times. However, although their intake varies
from meal to meal, their daily energy intake is relatively constant because they
Dietary Guidelines for Children and Adolescents in Australia
55
3. E NJOY
A WIDE VARIETY OF NUTRITIOUS FOODS
adjust their energy intake at successive meals.46 Food intake also varies greatly
between individuals.45
To grow normally, toddlers and preschoolers must regularly consume adequate
amounts of energy. Caregivers should be reassured that a child’s perceived
‘erratic’ eating behaviour is not unusual for this age and that the best way of
dealing with the situation is to offer and encourage consumption of a wide
variety of foods. A number of diets that are recommended for and consumed by
adults in the interest of good health may be unsuitable for young children. This
applies particularly to inadequate intakes of fat for this age group—see
Section 3.6 for details. Good eating habits begin at home, but consideration
should also be given to foods consumed outside the home.
Many children in this age group are being cared for outside the home in a
variety of settings—by relatives or family friends or in day-care centres
(including long day–care centres). In 1996, 177 700 children attended long day–
care centres in Australia; when compared with the 113 100 children in 1990, this
is a 36 per cent increase.47,48
In two separate studies, weight records were used to determine whether long
day–care centres were meeting the 50 per cent of the recommended dietary
intakes for nutrients advised by the New South Wales Department of Health.
With the exception of energy, iron, calcium and zinc, both studies showed that
the nutrient content of the food served in the centres met the department’s
guidelines.49,50 A survey of all 330 long day–care centres in Western Australia
resulted in a series of recommendations to improve nutrition and food safety.51 In
a further study, involving children attending long day–care centres and a control
group of non-attending children, three-day weighed food intake records were
collected for each child in order to determine the nutrient intake provided by
food in the different care environments. The results showed no statistically
significant difference in the total daily intake of energy, protein and
carbohydrate between the two groups of children.52 The authors concluded that
the current recommendation that children receive 50 per cent of the
recommended dietary intakes at long day–care centres should stand.
School children
The period between a child’s fifth birthday and the onset of puberty is
characterised by slow, steady growth. Thus, all a child’s nutritional needs should
be met by the continued consumption of a wide variety of foods, the amounts
consumed being increased gradually to meet increasing energy needs.
Two important considerations apply to this age group:
•
School children select and consume food without supervision. Unlike
preschoolers, whose food consumption is determined and supervised by
caregivers, school children experience new-found independence in food
consumption, and at times food selection, for at least one meal of the day.
This is also an age at which children often earn pocket money, which
provides them with the means to buy foods they find desirable. A variety
56
Dietary Guidelines for Children and Adolescents in Australia
3. E NJOY
•
A WIDE VARIETY OF NUTRITIOUS FOODS
of factors will influence this perception of desirability, among them family,
friends and the media.
The school canteen gives children the opportunity to choose their own food.
Depending on the frequency with which children buy their food from the
canteen, this could make an important contribution to their views about
food and to their nutrient intake. In recent years there has been a shift
towards offering healthier food choices in school canteens. This has often
been combined with the introduction of broader school education
programs on nutrition and health, which provide the information that helps
children choose and consume a healthy, varied diet.51,53
Adolescents
Adolescence is a transitional stage when the structure of food habits loosens.11 It
is a time of new independence and diminished family influence, especially over
food intake. Variety is of primary importance to this age group, which is
characterised by the pubertal growth spurt that leads to an increase in
requirements for energy and almost every nutrient. This is recognised in the
Australian Guide to Healthy Eating.1 The increasing prevalence of obesity in
adolescents is a concern; at this age, prevention of excessive weight gain is
important (see Chapter 2).
Adolescence is often perceived as a time of erratic eating behaviour. Truswell11
identified those facets of eating behaviour that are different or more pronounced
in adolescents than in other people and may cause adults to be concerned; these
are listed in Table 3.3.
Table 3.3
Facets of eating behaviour that are different or more
pronounced in adolescents than in other people and may cause
adults to be concerned11
Behaviour
Comment
Missing meals
Especially breakfast
Eating snacks and confectionery
The major snack is usually in the afternoon after school
Takeaway foods, unconventional meals
Those eaten in combinations and permutations that
other members of the family do not approve of but
that often add up to adequate nutritional mix
Experimentation with alcohol, soft drinks
and other ‘fun’ drinks
Soft drinks and other ‘fun’ drinks are preferable if
they are an alternative to alcohol, but otherwise
they displace water and milk
Distinctive likes and dislikes, high
energy intakes
Occurs near peak height velocity in girls (age 12)
but in boys may come later than peak height
velocity (age 14)
Low levels of intake of some nutrients,
dieting
Iron, calcium and, in some studies, vitamins A and C
and zinc
Dietary Guidelines for Children and Adolescents in Australia
57
3. E NJOY
A WIDE VARIETY OF NUTRITIOUS FOODS
There are two matters of particular concern in adolescence: dieting and concerns
about body image (discussed in Chapter 2) and pregnancy.
Pregnancy in adolescence
Adolescence is a period of high nutrient needs, and dietary intakes below the
recommended amounts are commonly reported for both pregnant and nonpregnant adolescent girls.54 Nutrient demands are higher and the consequences
of inadequate nutrition more serious for pregnant adolescents than they are for
pregnant adults. In particular, pregnant adolescents face increased risks of preeclampsia, low-birthweight infants and perinatal infant death.55
Studies of the individual effects of maternal factors—socio-economic and
behavioural factors, reproductive maturity, maternal emotional stress, nutritional
deficiencies, and so on—on birthweight indicate that maternal weight gain is one
of the most important indicators of infant birthweight, especially among
adolescents.56 It has been proposed that encouraging adolescents to gain more
weight than the standard recommendation of 9 to 14 kilograms during pregnancy
may be one way of decreasing their risk of delivering low-birthweight infants.
This proposal is based on an assumption that, compared with adult mothers,
adolescent mothers may need to gain more weight during pregnancy because
they might still be growing and have nutritional requirements that compete with
and pre-empt those of the foetus. This concept is, however, controversial: it is
not known whether adolescents continue to grow during pregnancy.56
Deficient intakes of iron, calcium, zinc, vitamins A and C and folate are
commonly reported to be of concern in the diets of pregnant adolescents.56,57
This would appear to reflect inadequate intakes of fruit, vegetables, cereals and
dairy products. Deficiencies of iron and folate increase the risk of anaemia
during pregnancy and are associated with a higher risk of low birthweight.
Additionally, the reported low intakes of folate are of concern given the
relationship between low intakes of dietary folate and the higher risk of neural
tube defects such as spina bifida.58 Because these deficiencies have been
reported to occur with increased frequency in adolescent pregnancies, it has
been suggested that a safer and more appropriate way of reducing the incidence
of low-birthweight deliveries among adolescents would be to deal with these
specific nutritional deficiencies rather than aim to increase total maternal weight
gain.56
There is limited evidence to suggest that adolescents improve the quality of their
diets during pregnancy. Skinner and Carruth54 compared dietary data from
different groups of pregnant and non-pregnant adolescents and found that the
former group consumed more milk and dairy products, citrus fruits and juices; it
was suggested that these foods substituted for carbonated beverages and tea and
coffee. Pregnant adolescents also consumed more breads, cereals, vegetables and
confectionery. The study did not, however, measure the actual changes that
adolescents make to their diets once they become pregnant.
58
Dietary Guidelines for Children and Adolescents in Australia
3. E NJOY
A WIDE VARIETY OF NUTRITIOUS FOODS
Nutrition supplements
Vitamin and mineral supplements are not necessary for healthy, full-term infants
or children.9 The only exception to this may be fluoride for children living in
areas without fluoridated water.
If infant formula is used, it is assumed that the formula will be prepared using
fluoridated water. Where fluoridated water is not available the fluoride content
of the formula is consequently lower. In the absence of fluoridated water or if
bottled water is used to prepare feeds, further supplementation will be
required.59
Special diets
Vegetarianism
A vegetarian diet that is adequate for adults is not necessarily suitable for infants
and young children, who face constraints such as limited stomach capacity and
higher needs for nutrients per unit weight.60 Each diet must be assessed
separately for its suitability for children; if the regimen is very restrictive in terms
of the type and amount of animal proteins consumed, it is essential to plan a diet
carefully so as to avoid deficiencies.60 In general, lacto-vegetarian and lacto-ovovegetarian diets provide adequate nutrition if they are properly planned. Vegan
diets pose a risk if care is not taken to ensure that the diet provides adequate
energy, vitamin B12, protein and iron.60,61 Plant foods can provide some iron and
zinc, albeit with lower bioavailability, but vitamin B12 is found only in animal
products. Chapter 1 discusses the vitamin B12 status of vegan mothers and its
effect on the B12 status of breastfed infants.
Food allergy and intolerance
The subject of food and drink allergies in children has received widespread
attention in recent years. This has resulted in a number of misconceptions about
the manifestations and incidence of such disorders and the use of elimination
diets.62 The National Health and Medical Research Council62 recommends as
follows:
• The diagnosis of a food or drink allergy can only be based on a
reproducible response to a controlled challenge with the suspected
allergen, following an adequate period of exclusion (at least 1 week).
• The relationship between behaviour and food allergies is unclear. The
reliance on dietary manipulation as an initial step in the management of
behavioural problems may delay the use of more appropriate strategies
and exacerbate the problem.
• There are no laboratory tests on which to base a diagnosis of food
allergy. It is inappropriate to undertake the management of children on
the basis of laboratory test results alone without consideration of a
properly supervised clinical challenge with suspected foods.
• Foods should only be eliminated from the diet after these diagnostic
procedures have been carried out.
Dietary Guidelines for Children and Adolescents in Australia
59
3. E NJOY
A WIDE VARIETY OF NUTRITIOUS FOODS
• If it is necessary to adopt an elimination diet or to exclude nutritionally
significant foods from the diet, then nutritional advice should be sought
to ensure that elimination is complete and that the diet is nutritionally
adequate.
Healthy eating for children and adolescents
The Australian Guide to Healthy Eating1 provides guidance on the types of
foods that can be included in a typical Australian diet to meet the dietary
guidelines and the recommended dietary intakes. Table 3.4 shows sample
servings for children and adolescents, as suggested in the guide.
60
Dietary Guidelines for Children and Adolescents in Australia
3. E NJOY
Table 3.4
A WIDE VARIETY OF NUTRITIOUS FOODS
The Australian Guide to Healthy Eating1: suggested sample
servings for children and adolescents
Food group (serving size)
Cereals
(including
breads, rice
pasta and
noodles)
Vegetables
(including
legumes)
Children 4–7 years
5–7
3–4
Children 8–11 years
Adolescents
12–18 years
Age group
Fruit
Milk
yoghurt,
cheese
Lean meat,
fish, poultry,
nuts and
legumes
Extra
foods
2
4
1
2
2
3
˚
˚ –1
1–2
1–2
6–9
4–6
3
4–5
1
1–2
2
3
1
1–1˚
1–2
1–2
5–11
4–7
3
3–4
3
3–4
3
3–5
1
1–2
1–3
1–3
Notes: The sample serves allow for two different eating patterns in each age group: the top row includes a
relatively large amount of cereals the bottom row includes less cereals and more of the other food
groups.
Examples of serving sizes are 2 slices (60g) bread, 1 medium bread roll, 1 cup cooked rice, pasta or
noodles; ˚ cup (75g) cooked vegetables or legumes, 1 cup salad vegetables, 1 small potato; 1 mediumsized piece (150g) of fruit, 1 cup diced pieces or canned fruit, ˚ cup fruit juice; 1 cup (250ml) fresh milk, 2
slices (40g) cheese, 1 small carton (200g) yoghurt; and 65–100g cooked meat or chicken, 80–120g cooked
fish fillet, 2 small eggs, ˚ cup cooked legumes, 1/3 cup nuts, ˘ cup sesame seeds.
R E L AT I O N S H I P
TO OT H E R G U I D E L I N E S
Encourage and support breastfeeding
Chapter 1 discusses the use of infant formulas if for some reason breastmilk is
not available.
Children and adolescents need sufficient nutritious food to grow and
develop normally
Chapter 2 discusses concerns relating to dieting and body image among
adolescents.
Include lean meat, fish, poultry and/or alternatives
Section 3.3 discusses iron deficiency in childhood and adolescence.
Include milks, yoghurts, cheese and/or alternatives
Dietary Guidelines for Children and Adolescents in Australia
61
3. E NJOY
A WIDE VARIETY OF NUTRITIOUS FOODS
Limit saturated fat and moderate total fat intake
Inappropriate restriction of fat in infancy and early childhood is discussed in
Section 3.6.
The Dietary Guidelines for Australian Adults
The guideline discussed here should be read in conjunction with Chapter 1 in
the Dietary Guidelines for Australian Adults. A varied diet, in keeping with the
Australian Guide to Healthy Eating1 is the cornerstone of good nutrition. In early
childhood it is important to establish patterns of eating that promote good
nutrition. These should then continue through to adulthood.
CONCLUSION
Apart from infancy where exclusive breastfeeding is recommended until about 6
months of age, variety in the diet is important for children and adolescents. In
Australia, a range of cuisines is available that add variety to the ‘traditional’
Australian diet and have been associated with health gains. Recommending that
children and adolescents ‘enjoy a wide variety of nutritious foods’ will not only
help ensure appropriate intakes of major dietary components such as protein,
carbohydrates and fats but also help ensure adequate and appropriate intakes of
vitamins and minerals, individual fatty acids and amino acids. Enjoying a variety
of nutritious foods remains an important message for all age groups.
Experimenting with other cuisines, and incorporating new and traditional foods
will encourage variety in the diet, help meet nutrient requirements, and provide
some protection against non-communicable chronic diseases later in life. Serving
sizes of more energy dense foods may need to be reduced to accommodate
variety (see the Dietary Guidelines for Australian Adults for a more detailed
review of the links to chronic disease patterns).
EVIDENCE
For ethical reasons, randomised control trials cannot be undertaken in relation to
breastfeeding. For evidence levels related to the suitability of breastmilk as the
normal food for infants see Section 1. There is Level II evidence for the optimal
age of introduction of complementary foods (references 5 and 6). and Level III
(references 28 to 30) and Level IV (reference 26) evidence linking some infant
feeding practices with subsequent disease.
REFERENCES
1.
Department of Health and Family Services. The Australian guide to healthy
eating: background information for nutrition educators. Canberra: DHFS,
1998.
62
Dietary Guidelines for Children and Adolescents in Australia
3. E NJOY
A WIDE VARIETY OF NUTRITIOUS FOODS
2.
Birkbeck J. Weaning: a position statement. NZ Med J 1992;105:221–4.
3.
Lutter C. Recommended length of exclusive breastfeeding, age of
introduction of complementary foods and the weaning dilemma. Geneva:
World Health Organization, 1992.
4.
World Health Organization. Complementary feeding of young children in
developing countries: a review of current scientific knowledge. Geneva:
WHO, 1998
5.
Cohen RJ, Brown KH, Canahuati J, Riviera LL, Dewey KG. Effect of age of
introduction of complementary foods on infant breast milk intake, total
energy intake, and growth: a randomised intervention study in Honduras.
Lancet 1994;344:288–93.
6.
Dewey KG, Cohen RJ, Brown KH, Riviera LL. Age of introduction of
complementary foods and growth of term, low-birth-weight, breast-fed
infants: a randomised intervention study in Honduras. Am J Clin Nutr
1999;69:679–86.
7.
Aggett P. Research priorities in complementary feeding: International
Paediatric Association (IPA) and European Society of Paediatric
Gastroenterology, Hepatology, and Nutrition (ESPGHAN) workshop.
Pediatrics 2000;106(5S):1271.
8.
WHO European Region Division. Infant nutrition. Geneva: WHO, 1999.
9.
Hervada AR, Newman DR. Weaning: historical perspectives, practical
recommendations, and current controversies. Current problems in
pediatrics 1992;22:223–41.
10.
Department of Health and Social Security. Present day practice in infant
feeding: report of a working party of the Panel on Child Nutrition,
Committee on Medical Aspects of Food Policy. London: HMSO, 1988.
11.
Truswell AS. ABC of nutrition. 2nd edn. London: BMJ, 1992.
12.
Hendricks KM, Badruddin SH. Weaning recommendations: the scientific
basis. Nutr Rev 1992;50:125–33.
13.
Kleinman R. Complementary feeding and neuromuscular development.
Pediatrics 2000;106(suppl.):S1279.
14.
Cunningham AS, Jelliffe D, Jelliffe EFP. Breast-feeding and health in the
1980s: a global epidemiological review. J Pediatr 1991;118:659–66.
15.
Lanigan J, Morgan J. New global strategy on infant feeding needs to be
flexible. BMJ 2001;323:632.
16.
Hornell A, Hofvander Y, Kylber E. Introduction of solids and formula to
breastfed infants: a longitudinal prospective study in Uppsala, Sweden.
Acta Paediatr 2001;90:477–82.
17.
Graham VA, Gibbons K, Marraffa C, Henry L, Myers J. Filling the gap:
weaning practices of children aged 0-2 years in western metropolitan
Melbourne. J Paediatr Ch Hlth 1998; 34(6):513–17.
Dietary Guidelines for Children and Adolescents in Australia
63
3. E NJOY
A WIDE VARIETY OF NUTRITIOUS FOODS
18.
Retallack SJ, Simmer K, Gibson RA. Infant weaning practices in Adelaide:
the results of a shopping complex survey. J Paediatr Ch Hlth
1994;30(1):28–32.
19.
American Academy of Pediatrics Committee on Nutrition. Follow-up or
weaning formulas. Pediatrics 1989;83(6):1067.
20.
Canadian Paediatric Society Nutrition Committee. Meeting the iron needs of
infants and young children: an update. Can Med Assoc J 1991;144:1451–4.
21.
Dallman PR. Iron deficiency in the weanling: a nutritional problem on the
way to resolution. Acta Paediatr Scand 1986;323(suppl.):59–67.
22.
American Academy of Pediatrics Committee on Nutrition. The use of whole
cow’s milk in infancy. Pediatrics 1992;89:1105–9.
23.
Committee on Nutrition. Comment on the composition of cow’s milk based
follow-up formulas. Acta Paediatr Scand 1990;79(suppl.):250–4.
24.
Montalto MB, Benson JD, Martinez GA. Nutrient intakes of formula-fed
infants and infants fed cow’s milk. Pediatrics 1985;75:343–51.
25.
Martinez GA, Ryan AS, Malec DJ. Nutrient intakes of American infants and
children fed cow’s milk or infant formula. Am J Dis Child 1985;139:1010–18.
26.
Ziegler EE, Fomon SJ, Nelson SE, Rebouche CJ, Edwards BB, Rogers RR et
al. Cow milk feeding in infancy: further observations on blood loss from
the gastrointestinal tract. J Pediatr 1990;116:11–18.
27.
Willetts IE, Dalzell M, Puntis JW, Stringer MD. Cow’s milk enteropathy:
surgical pitfalls. J Pediatr Surg 1999;34(10):1486–8.
28.
Saarinen KM, Savilahti E. Infant feeding patterns affect the subsequent
immunological features in cow’s milk allergy. Clin Exper Allergy
2000;30(3):400–6.
29.
Hypponen E, Kenward MG, Virtanen SM, Piitulainen A, Virta-Autio P,
Tuomilehto J et al. Infant feeding, early weight gain, and risk of type 1
diabetes. Diab Care 1999;22(12):1961–5.
30.
Pettitt DJ, Forman MR, Hanson RL, Knowler WC, Bennett PH. Breastfeeding
and incidence of non-insulin-dependent diabetes mellitus in Pima Indians.
Lancet 1997;350(9072):166–8.
31.
Udall JNJ, Suskind RM. Cow’s milk versus formula in older infants:
consequences for human nutrition. Acta Paediatr 1999;88(430)(suppl.):61–7.
32.
Couper JJ, Steele C, Beresford S, Powell T, McCaul K, Pollard A et al. Lack of
association between duration of breast-feeding or introduction of cow’s milk
and development of islet autoimmunity. Diab Care 1999;48(11):2145–9.
33.
Ministry of Health. Food and nutrition guidelines for healthy infants and
toddlers (aged 0–2): a background paper. Wellington, NZ: Ministry of
Health, 1999.
64
Dietary Guidelines for Children and Adolescents in Australia
3. E NJOY
A WIDE VARIETY OF NUTRITIOUS FOODS
34.
Sicherer SH. New insights on the natural history of peanut allergy. Ann
Allergy Asthma Immun 2000;85(Dec):435–7.
35.
Kleinman RE. American Academy of Pediatrics recommendations for
complementary feeding. Pediatrics 106(5S):1274.
36.
Sullivan SA, Birch LL. Infant dietary experience and acceptance of solid
foods. Pediatrics 1994;93(2):271–7.
37.
Australia New Zealand Food Authority. Proposal P215: foods for infants
and young children. Canberra: ANZFA, 1999.
38.
National Center for Infectious Disease. Botulism in the United States.
Atlanta, GA: Centers for Disease Control and Prevention, 1998.
39.
American Academy of Pediatrics. The use and misuse of fruit juices in
pediatrics. Pediatrics 2001;107:1210–13.
40.
Hourihane J, Rolles C. Morbidity from excessive intake of high energy
fluids: the squash drinking syndrome. Arch Dis Child 1995;72:141–3.
41.
Lifshitz F, Ament ME, Kleinman RE, Klish W, Lebenthal E, Perman J et al.
Role of juice carbohydrate malabsorption in chronic non-specific diarrhoea
in children. J Pediatr 1992;120(5):825–9.
42.
Smith MM, Lifshitz F. Excess fruit juice consumption as a contributing
factor in nonorganic failure to thrive. Pediatrics 1994;93:438–43.
43.
Department of Health. Weaning and the weaning diet. Report of the
Working Group on the Weaning Diet, Committee on Medical Aspects of
Food Policy. Report no. 45. London: Department of Health, 1994.
44.
Dewey KG. Nutrition, growth and complementary feeding of breastfed
infants. Pediatr Clin Nth Amer 2001;48(1):87–104.
45.
Sigman-Grant M. Feeding preschoolers: balancing nutritional and
developmental needs. Nutr Today 1992;27:13–17.
46.
Birch LL, Johnson MS, Andrensen G, Peters JC, Schulte MC. The variability
of young children's energy intake. New Eng J Med 1991;324:232–5.
47.
Australian Bureau of Statistics. Childcare, Australia, 1990. Canberra: ABS,
1992.
48.
Department of Health and Family Services. The development of a national
planning framework for childcare: discussion paper. Canberra: DHFS, 1996.
49.
Gelissen IC, Wall PM, Lilburne A, Truswell AS. Dietary intake of Australian
preschool children at long day care centres. Aust J Nutr Dietet 1992;49:49–52.
50.
Williams L, Bunney C, Bradley S, Bartl R. Caring for children-meeting their
nutritional needs during long day care. Proc Nutr Soc 1992;17:86.
51.
Pollard C, Lewis J, Miller M. Food service in long day child care centres.
ANZ J Pub Hlth 1999;23:606–10.
Dietary Guidelines for Children and Adolescents in Australia
65
3. E NJOY
A WIDE VARIETY OF NUTRITIOUS FOODS
52.
Soanes R, Miller M, Begley A. Nutrient intakes of 3 year-old children: a
comparison between attenders and non-attenders of long day care centres.
Aust J Nutr Diet 2001;58:114–20.
53.
McVeagh P, Mortensen A, O'Loughlin EV. Growing healthy children.
Melbourne: Longman Cheshire, 1992.
54.
Skinner JD, Carruth BR. Dietary quality of pregnant and nonpregnant
adolescents. JADA 1991;91:718–20.
55.
Adelson PL, Frommer MS, Pym MA, Rubin G. Teenage pregnancy and
fertility in New South Wales: an examination of fertility trends, abortion
and birth outcomes. Aust J Pub Hlth 1992;16:238–44.
56.
Stevens-Simon C, McAnarney ER. Adolescent maternal weight gain and low
birth weight: a multifactorial model. Am J Clin Nutr 1988;47:948–53.
57.
Cherry FF, Sandstead HH, Rojas P, Johnson LK, Batson HK, Wang XB.
Adolescent pregnancy: associations among body weight, zinc nutriture,
and pregnancy outcomes. Am J Clin Nutr 1989;50:945–54.
58.
National Health and Medical Research Council. Statement on the
relationship between dietary folic acid and neural tube defects such as
spina bifida. Canberra: NHMRC, 1993.
59.
National Health and Medical Research Council. The effectiveness of water
fluoridation. Canberra: AGPS, 1991.
60.
Jacobs C, Dwyer JT. Vegetarian children: appropriate and inappropriate
diets. Am J Clin Nutr 1988;48:811–18.
61.
Sanders AB. Growth and development of British vegan children. Am J Clin
Nutr 1988;48:822–5.
62.
National Health and Medical Research Council. Food allergies in children.
Canberra: NHMRC, 1991.
66
Dietary Guidelines for Children and Adolescents in Australia
3.1 E AT
3.1
PLENTY OF VEGETABLES , LEGUMES AND FRUIT
E AT P L E N T Y O F V E G E TA B L E S ,
LEGUMES AND FRUITS
Ivor Dreosti
TERMINOLOGY
Vegetables
Vegetables includes all leafy green vegetables (for example, spinach, lettuce,
silver beet and bok choi), members of the crucifer family (for example, broccoli,
cabbages and brussels sprouts), all root and tuber vegetables (for example,
carrots, yams and potatoes), edible plant stems (for example, celery and
asparagus), gourd vegetables (for example, pumpkin and cucumber), allium
vegetables (for example onion, garlic and shallot) and corn, although this last
food is usually regarded as a cereal. Some vegetables are eaten raw; others are
best cooked because this makes them more palatable and digestible.
Fruits
The term fruit generally applies to the sweet, fleshy edible portion of a plant
that arises from the base of the flower and surrounds the seeds; apples, oranges,
plums, berries, tomatoes and avocados are examples. Most fruit is eaten raw,
although in some cases cooking can offer a tasty alternative.
Legumes
Legumes refers also to pulses and includes all forms of prepared beans and
peas—dried, canned and cooked legumes, bean curd, tofu, and legume-flour
products such as pappadams. Among the well-known edible legumes are butter
beans, haricot (navy) beans, red kidney beans, soybeans, mung beans, lentils,
chick peas, snow peas and various other fresh green peas and beans. Legumes
are generally cooked: this improves their nutritional value and reduces the risk
of toxicity that occurs with some legumes because of the presence of heat-labile
toxins. Occasionally, however, they can be eaten raw; snow peas are an
example. Strictly speaking, legumes are specialised forms of fruit since the pod
surrounds the seeds and arises from the base of the flower, as occurs with fruit.
But, because the main food material in legumes is the seeds, they are generally
placed in a separate category.
Dietary Guidelines for Children and Adolescents in Australia
67
3.1 E AT
PLENTY OF VEGETABLES , LEGUMES AND FRUIT
B AC K G RO U N D
Each year in Australia about 40 per cent of all deaths can be attributed to
diseases of the circulatory system and 27 per cent to cancer, accounting for
annual health care costs of around $4 billion and $2 billion respectively.1
Scientific surveys of populations around the world have consistently provided
good epidemiological evidence that people who regularly eat diets high in fruits
and vegetables (including legumes) have substantially lower risks of coronary
heart disease2–4, stroke2,5, several major cancers6,7 and possibly hypertension8,9,
type 2 diabetes mellitus10,11, cataract12,13, and macular degeneration of the eye.14,15
A large number of experimental studies with model systems have afforded
further evidence of a protective effect of fruits and vegetables against these noncommunicable chronic diseases and offer some clues about the actual substances
in these foods that may be protective as well as the mechanisms by which they
may act. Accordingly, a new term, phytochemicals, has been added to the
vocabulary of nutritionists; it refers to the many different substances occurring in
plant foods in small amounts (in addition to the well-established nutrients) and
which appear to contribute significantly to reducing the risk of noncommunicable chronic diseases.
The Australian Guide to Healthy Eating16 recognises the importance of fruits and
vegetables in a healthy diet for all sections of the population and recommends
consumption of between one and two servings of fruit and two to four of
vegetables each day for children aged 4–7 years; one to two servings of fruit and
three to five of vegetables each day for children aged 8–11 years; and three to
four servings of fruit and four to nine of vegetables each day for adolescents
(12–18 years).
For older children and adolescents, this is generally in keeping with the
minimum five servings of vegetables and two of fruit established by the core
food group analysis endorsed by the National Health and Medical Research
Council.17 It should be noted, however, that average current fruit and vegetable
consumption in Australia falls significantly short of this recommendation, as
shown in Table 3.1.1.
68
Dietary Guidelines for Children and Adolescents in Australia
3.1 E AT
Table 3.1.1
Age
group
Mean intakes of fruits and vegetables in Australian in children
and adolescents in relation to the NHMRC core food group
recommendations
Fruit
Vegetables
Mean intake
(% recommended)
Mean intake
(% recommended)
Including
juice
M
PLENTY OF VEGETABLES , LEGUMES AND FRUIT
Excluding
juice
F
M
F
Including
potato/
legumes
Without
potato/
legumes
(g/day)
M
F
M
F
(g/day)
Recommended
Recommended
4–7
165
154
98
92
150
76
80
45
40
150
8–11
62
57
37
33
300–450
71
73
32
32
225
12–15
57
63
34
36
300–450
74
64
33
33
300
16–18
49
65
26
29
300–450
98
66
42
29
300
Note: Mean intake data are from the 1995 National Nutrition Survey. One serve of fruit equals
150g; one serve of vegetables equals 75g; where recommendations are a range, the mid-point
has been used for calculations.
SCIENTIFIC
BASIS
Original and recent studies
Cardiovascular disease
In 1997, 28 studies in humans of fruit and vegetable consumption and the risk of
cardiovascular disease were reviewed, and good evidence was found of a
protective effect associated with higher intakes of plant foods.2 Some years
earlier, in 1993, the US Food and Drug Administration allowed a health claim to
the effect that diets low in saturated fat and cholesterol and rich in fruits,
vegetables and grain products containing fibre, particularly soluble fibre, may
reduce the risk of coronary heart disease19, although a similar claim was not
allowed by the Canadian food authority. A subsequent large study in females
also reported a significant inverse association between fruit and vegetable intake
and cardiovascular disease.3
Recent experimental studies suggest that protection against heart disease may
arise in several ways, including through the presence of antioxidant
phytochemicals (for example, bioflavonoids and carotenoids) and antioxidant
vitamins (for example, vitamins E and C) at significant levels in fruits and
vegetables, which may reduce the risk of cholesterol becoming oxidised in
coronary blood vessels and deposited to form atheromatous plaques.20
Importantly, a review of the effect of beta-carotene on coronary heart disease in
several observational and intervention studies suggests protection only in the
observational studies, highlighting the possibility that the benefit reported in
some studies may be related to foods rich in beta-carotene and other
Dietary Guidelines for Children and Adolescents in Australia
69
3.1 E AT
PLENTY OF VEGETABLES , LEGUMES AND FRUIT
antioxidants and micro-nutrients—or indeed other confounding factors—rather
than to the beta-carotene alone.21 Also important is the apparent capacity of
vegetable protein to reduce blood cholesterol levels in people habitually
consuming an omnivorous diet.22
Particular emphasis is being focused at present on the importance of the vitamin
folate in reducing blood levels of the compound homocysteine, which is a
possible risk factor for coronary heart disease.4,23 Especially noteworthy is the
fact that a major source of dietary folate is green, leafy vegetables, and studies
suggest that many adults have folate intakes well below the level needed to
minimise the risk associated with raised levels of homocysteine.24
Stroke
A systematic review of 14 studies including ecological, case-control and cohort
studies dealing with stroke and fruit and vegetables found strong evidence of a
protective effect associated with higher intakes of plant foods.2 The mechanism
for this apparent protection is not clear, but it appears to exist for strokes of both
haemorrhagic and ischaemic origin.5 In one large study extending over eight
years, protection was associated with vegetable intake rather than fruit,25
although generally both types of plant food are considered to be likely
protective agents.26
Hypertension
Because plant foods contribute significantly to the intake of potassium and
magnesium—both of which have been proposed to be associated with a lower
blood pressure—diets high in fruits and vegetables will increase the daily intake
of both minerals and may help prevent or control hypertension.6,27 In a study
with women in the United States, lowered blood pressure was found to be
associated with higher intakes of fruits and vegetables, fibre and magnesium8;
more recently, data from the Dietary Approaches to Stop Hypertension (DASH)
randomised clinical trial have indicated that diets rich in fruits and vegetables,
with or without low-fat dairy products, significantly reduced ambulatory blood
pressure after an eight-week intervention period28, especially in AfricanAmericans and people with hypertension.29 Similar results were found with US
adolescents who had elevated blood pressures: blood pressure was lower in
those subjects with higher intakes of a combination of nutrients including
potassium, calcium, magnesium and vitamins, as provided by diets rich in fruits
and vegetables and low-fat dairy products.30
Cancer
Health researchers have estimated that at least 30 per cent of many major
cancers have a strong dietary link and that the link may be even stronger for
some cancers.6 Among the dietary factors underlying this association are
substances that may aggravate the development of cancer and, very importantly,
substances that reduce cancer risk. Dietary components in the latter group
include fibre, fruits and especially vegetables. In fact, the association between
fruits and vegetables is sufficiently widely recognised that the US Food and Drug
70
Dietary Guidelines for Children and Adolescents in Australia
3.1 E AT
PLENTY OF VEGETABLES , LEGUMES AND FRUIT
Administration has allowed a health claim to the effect that diets low in fat and
rich in fruit and vegetables may reduce the risk of some cancers.19
Not surprisingly, the protective effect of fruit and vegetables has been noted
especially in relation to the oral cavity, oesophagus, stomach and large bowel,
where local contact may be a factor, although significant risk reduction has also
been observed for cancers of the lung and possibly the breast, endometrium and
pancreas.6,7 Many factors in fruit and vegetables have been proposed to account
for the foods’ protective effect and many potential mechanisms suggested. Much
emphasis is currently placed on the many novel phytochemicals found in plant
foods (for example, carotenoids, bioflavonoids, isothiocyanates and indole
carbinols) and on several established vitamins and minerals (for example,
vitamins C and E, folate, selenium and calcium). Proposed mechanisms range
from reduced formation of cancer-promoting substances in the gastrointestinal
tract (through antioxidant activity) to the part played by phytochemicals and
micro-nutrients in detoxification of carcinogenic substances, and to functions
relating to the containment and destruction of existing cancer cells by means of a
variety of physiological processes and improved immunological activity against
cancer cells.6,7,31
In the 1997 World Cancer Research Fund and American Institute for Cancer
Research (WCRF–AICR) global review of nutrition and cancer prevention7,
prevention by fruit and vegetables was rated to be ‘convincing’ for cancers of the
mouth, pharynx, oesophagus, stomach, colon, rectum and lung; ‘probable’ for
the larynx, pancreas, breast and bladder; and ‘possible’ for the ovaries, cervix,
endometrium, thyroid, liver, prostate and kidney. Since that report, data
generally confirming these findings have become available from a number of
further case-control and cohort studies. In particular, lower risks of cancer have
again been found for the oral cavity32,33, stomach34 and colon and rectum35 in
relation to higher vegetable and fruit intake, although a recent study found no
evidence that one extra serving of fruit and vegetables provides any measurable
additional protection.36
Two recent studies on lung cancer also consistently indicate that a high intake of
fruit and vegetables is protective, particularly with respect to brassicae
vegetables, tomatoes, lettuce and cabbage.37,38 Further suggestive evidence of
protection by fruits and vegetables has been noted for cancer of the bladder39,40,
breast41,42 and, to a lesser extent, prostate, notably in relation to the carotenoid
lycopene.43,44
It should be noted, however, that although considerable emphasis has been
placed on the WCRF–AICR review, attention should be paid to the study by the
UK Department of Health Committee on the Medical Aspects of the Food Supply
(COMA), which also reviewed the evidence concerning the potential protection
against cancer afforded by fruit and vegetables.45 The COMA study ranked the
evidence into four categories, the top two being ‘strong’ and ‘moderate’. No
‘strong’ association was found between fruit and vegetable consumption and
cancer at any site, while a ‘moderate’ association was noted for cancers of the
stomach, colon and rectum. In contrast, the WCRF–AICR rated as ‘convincing’ the
Dietary Guidelines for Children and Adolescents in Australia
71
3.1 E AT
PLENTY OF VEGETABLES , LEGUMES AND FRUIT
evidence for an association for the mouth/pharynx, stomach, colon, rectum and
lung.7 Convincing was defined to mean that the evidence of causal relationships
was conclusive and sufficient for making dietary recommendations. Clearly,
COMA’s interpretation of the data is more cautious than the WCRF–AICR
interpretation, but both bodies recognise the importance of these foods in
reducing cancer risk. The WCRF–AICR is currently updating its analysis to
incorporate studies published since 1997.
Type 2 diabetes mellitus
At the population level, an association has been noted between increased
consumption of plant foods and lower incidence of obesity (which is a risk factor
for diabetes) and type 2 diabetes itself, although it is not clear at this stage
whether this apparent protection arises principally from a lower body weight. In
the dietary control of type 2 diabetes, vegetables are likely to be of particular
value because of their content of fibre and low–energy density carbohydrates
and their possible hypoglycaemic activity.6,10 Recently, a cross-sectional study in
the United Kingdom revealed an inverse association between the risk of type 2
diabetes and frequent consumption of vegetables throughout the year, although
the effect did not appear to be significant during the summer months.46
Cataract and macular degeneration of the eye
Several studies in humans have reported that the risk of developing ocular
cataracts is significantly higher in people with low dietary intakes of fruit and
vegetables, vitamins C and E, and beta-carotene.12,47 A similar increased risk was
observed in people with low levels of vitamins C and E in their blood.
Experimental studies with model systems have added further support to the
notion that above-average intakes of antioxidant nutrients may delay the onset of
senile cataract.12 More recently, a modest protective effect against the
development of cataracts has been observed for higher intakes of the carotenoids
lutein and zeaxanthin.48
Age-related degeneration of the macula—the colour-sensitive yellow spot on the
retina of the eye—is another serious cause of acute blindness in the elderly and
is not reversible. Findings from a number of human studies suggest that people
with low levels of carotenoids and the antioxidant vitamins C and E in their
blood, and who smoke, are at increased risk of developing macular
degeneration. Experimental studies indicate that two carotenoids in particular—
lutein and zeaxanthin—appear to be accumulated by the macula, and in a human
study when the dietary intake of carotenoids was analysed the sum of the intake
of lutein and zeaxanthin had the strongest protective effect against macular
degeneration. Taken together, these findings suggest that in many cases macular
degeneration may be prevented by eliminating smoking and ensuring an
adequate intake of fruit and vegetables.14 Of particular interest are several recent
reports that highlight the presence of lutein and zeaxanthin in precise but
different orientations in the membranes of the macula, which suggests that these
two carotenoids may serve a special role in reducing the risk of age-related
macular degeneration.49,50
72
Dietary Guidelines for Children and Adolescents in Australia
3.1 E AT
PRACTIC AL
PLENTY OF VEGETABLES , LEGUMES AND FRUIT
ASPECTS OF THIS GUIDELINE
For toddlers, the generally lower energy density of fruits and vegetables in
comparison with cereal and animal products should be borne in mind: very
young children have a higher energy requirement than older children and their
stomach capacity is smaller. Nevertheless, development of healthy eating habits
needs to be encouraged progressively in this age group.
For children and adolescents, fruits and vegetables each contribute about 7 per
cent to total energy and 14–22 per cent and 25 per cent respectively of dietary
fibre.51 Generally, fruit consumption increases with age—especially for boys—but
there is a tendency in this group to consume a high proportion of fruit juices,
which are of lower nutritional value than the whole fruit. Young people should
be encouraged to eat salads, stir-fried vegetables and fruits because it is likely
that the protection afforded by these foods against the degenerative diseases of
adulthood begins at an early age.
A wide variety of fruits is recommended, including apples and pears, citrus
fruits, melons, tomatoes, berries, grapes, bananas, and stone fruits such as
apricots and peaches. The Australian Guide to Healthy Eating’s
recommendations for fruit include raw, stewed or canned varieties, with rather
less emphasis on fruit juices and dried fruit since they tend to be lower in fibre
and more energy dense respectively, although a modest intake of both (say, one
serving a day) is acceptable.
A variety of vegetables is also recommended, including dark green vegetables
such as spinach and broccoli; orange or yellow vegetables such as pumpkin and
carrots; crucifers such as broccoli, cauliflower and cabbage; starchy vegetables
such as potatoes, yams and the cereal food corn; and salad vegetables and fruits
such as lettuce, tomato, cucumber and capsicum.
Vegetable consumption increases with age in children, but the dominance of
potatoes as a source of vegetables in Australia—among both children and
adults—is of some concern: they are not as rich in phytochemicals as many other
vegetables and some of the more popular forms (such as French fries and chips)
can also be relatively high in fat.
Where do nuts and seeds fit in ?
Many nuts and seeds are similar to fruits except that the seed is the main edible
component and the whole structure becomes dry on maturing. Most nuts and
seeds provide a wide range of nutrients and are generally pleasantly flavoured,
so they can usefully be included with fruits and vegetables in plant-based dishes
or other dishes such as stir-fries and in desserts. These foods are of particular
value in providing significant levels of protein and essential fatty acids, both the
n-6 fatty acids and, in some cases (such as walnuts, canola and flaxseed), the n-3
fatty acids.
Dietary Guidelines for Children and Adolescents in Australia
73
3.1 E AT
PLENTY OF VEGETABLES , LEGUMES AND FRUIT
Whole nuts are not recommended for young children because of the possibility
of choking; they can, however, be fed as a paste.
Preparation of fruit and vegetables
Certain nutrients and phytochemicals in plant foods are damaged by cooking;
others are not. In fact, in some cases the availability of a nutrient may be
increased by the cooking process; for example, carotenoids are absorbed better
from cooked tomatoes than raw ones. As a general rule, fruit and vegetables may
be eaten in the manner most palatable to the consumer, although a good
proportion should always be eaten raw.
When vegetables are cooked they should not be overcooked since this will cause
loss of nutrients. Stir-frying is an effective method of cooking vegetables: it tends
to minimise nutrient loss and provides a tasty product with good texture. Light
microwaving and steaming are also better than deep-frying or prolonged boiling.
Generally, when cooking vegetables it is useful to use a small amount of oil
because this enhances absorption of the fat-soluble vitamins (for example,
vitamins A and E) as well as other fat-soluble dietary components such as the
carotenoids.
It should be noted that eating the variety of fruits and vegetables recommended
in the Australian Guide to Healthy Eating will ensure an adequate intake of
some of the less widely distributed dietary components—for example, green
leafy vegetables for folate; yellow and orange fruits and vegetables for
carotenoids; cruciferous vegetables for dithiolthiones and isothiocyanates, which
improve the body’s detoxification capacity; the allium vegetable family for allyl
sulfides, which also improve detoxification processes; fruit for bioflavonoids,
which appear to serve many beneficial functions in the body, including acting as
antioxidants; and citrus fruit and capsicum for vitamin C. Where necessary,
frozen and canned fruits and vegetables are acceptable since good levels of
nutrients are retained by both processes, especially freezing.
Vegetarians
The objective of the fruit and vegetable guideline is not to encourage people to
eat only vegetarian meals; rather, it is to highlight the important health benefits
to be derived from regular consumption of plant-based meals together with
individual fresh and cooked fruits and vegetables. For vegetarians, however,
particular emphasis should be given to regularly including legumes and nuts, in
order to increase the iron and protein intake from plant sources. It is also
important that fruit juices or fruits be consumed in the same meal as cereals,
legumes or other sources of iron, in order to provide vitamin C, which will
increase iron absorption.
74
Dietary Guidelines for Children and Adolescents in Australia
3.1 E AT
R E L AT I O N S H I P
PLENTY OF VEGETABLES , LEGUMES AND FRUIT
TO OT H E R G U I D E L I N E S
Enjoy a wide variety of nutritious foods
In order to obtain optimal health benefits from fruit and vegetables, a wide
variety of nutritious foods should be consumed.
Eat plenty of cereals (including breads, rice, pasta and noodles),
preferably wholegrain
Apart from providing a good source of energy, cereal-based foods contribute a
number of protective factors to the diet, complementing and extending many of
the benefits derived from fruit and vegetables.
Limit saturated fat and moderate total fat intake
Fruit and vegetables are low in saturated fat.
Choose foods low in salt
Fruits and vegetables are low in salt (sodium) but are good suppliers of
potassium.
CONCLUSION
Strong evidence now exists that many compounds in fruit and vegetables
(phytochemicals) help to protect against a number of non-infectious degenerative
diseases, among them cancer, cardiovascular disease, type 2 diabetes, and
cataract and macular degeneration of the eye.
Children are encouraged to consume on average at least two helpings of fruit
and five of vegetables each day; both the fruits and the vegetables should be
selected from a wide variety of types and colours and be served cooked or raw,
as appropriate.
EVIDENCE
There is Level II evidence (reference 9) and Level III evidence (references 3, 4,
8 and 27) in relation to the benefits of fruit and vegetable consumption and
coronary heart disease, hypertension and stroke. There is Level III evidence
(references 29 to 41) in relation to fruit and vegetable consumption and cancer
of various kinds.
Dietary Guidelines for Children and Adolescents in Australia
75
3.1 E AT
PLENTY OF VEGETABLES , LEGUMES AND FRUIT
Although current evidence concerning the benefit of vegetables and fruit in
protecting against several degenerative diseases is strongly persuasive, it is
largely based on retrospective observational studies. Further prospective
intervention studies are needed, although it is recognised that these are difficult,
and costly, to carry out. Nevertheless, a considerable number are already under
way and they will provide invaluable information in the coming decade. In
addition, more needs to be established concerning the roles of the various
phytochemicals in disease prevention, as well as their interaction with the range
of genotypes found in the human population.
REFERENCES
1.
Australian Parliament. National Health Priority Areas initiative. Current
Issues Brief 18, 1999–2000. <www.aph.gov.au/library/pubs/cib/
1999-2000cib18.htm>, viewed February 2002.
2.
Ness AR, Powles JW. Fruit and vegetables, and cardiovascular disease: a
review. Int J Epidemiol 1997;26:1–13.
3.
Liu S, Manson JE, Lee IM, Cole SR, Hennekens CH, Willett WC et al. Fruit
and vegetable intake and risk of cardiovascular disease: the Women’s
Health Study. Am J Clin Nutr 2000;72:922–8.
4.
Law MR, Morris JK. By how much does fruit and vegetable consumption
reduce the risk of ischaemic heart disease? Eur J Clin Nutr 1998;52:549–56.
5.
Gillman MW, Cupples LA, Gagnon D, Posner BM, Ellison RC, Castelli WP,
Wolf PA. Protective effects of fruits and vegetables on development of
stroke in men. JAMA 1995;273:113–17.
6.
Steinmetz KA, Potter JD. Vegetables, fruit and cancer prevention: a review.
J Am Diet Assoc 1996;96:1027–39.
7.
World Cancer Research Fund & American Institute for Cancer Research.
Vegetables and fruits. In: Food, nutrition and the prevention of cancer: a
global perspective. Washington, US: American Institute for Cancer Research
1997;436–46.
8.
Ascherio A, Hennekens C, Willett WC, Sacks F, Rosner B, Manson J et al.
Prospective study of nutritional factors, blood pressure and hypertension
among US women. Hypertension 1996;27:1065–72.
9.
Moore TJ, Vollmer WM, Appel LJ, Sacks FM, Svetkey LP, Vogt TM et al.
Effects of dietary patterns on ambulatory blood pressure: results from the
Dietary Approaches to Stop Hypertension (DASH) trial. Hypertension
1999;34:472–7.
10.
Platel K, Srinivasan K. Plant foods in the management of diabetes mellitus:
vegetables as potential hypoglycaemic agents. Nahrung 1997;41:68–74.
76
Dietary Guidelines for Children and Adolescents in Australia
3.1 E AT
PLENTY OF VEGETABLES , LEGUMES AND FRUIT
11.
Williams DE, Wareham DJ, Cox BD, Byrne CD, Hales CN, Day NE.
Frequent salad vegetable consumption is associated with a reduction in the
risk of diabetes mellitus. J Clin Epidemiol 1999;52:329–37.
12.
Taylor A. Cataract: relationship between nutrition and oxidation. J Am Coll
Nutr 1993;12:138–46.
13.
Brown L, Rimm EB, Seddon JM, Giovannucci EL, Chasan-Taber L,
Spiegelman D et al. A prospective study of carotenoid intake and risk of
cataract extraction in US men. Am J Clin Nutr 1999;70:517–24.
14.
Snodderly DM. Evidence for protection against age-related macular
degeneration by carotenoids and antioxidant vitamins. Am J Clin Nutr
1995;62:1448S–1461S.
15.
Goldberg J, Flowerdew G, Smith E, Brody JA, Tso MO. Factors associated
with age-related macular degeneration: an analysis of data from the first
National Health and Nutrition Examination Survey. Am J Epidemiol
1998;128:700–10.
16.
Department of Health and Family Services. The Australian guide to healthy
eating. Canberra: DHFS, 1998.
17.
Cashel K, Jeffreson S. The core food groups. Endorsed by the National
Health and Medical Research Council. Canberra: Australian Government
Publishing Service, 1995;83.
18.
Baghurst P, Beaumont-Smith N, Baghurst KI, Cox D. The relationship
between the consumption of fruits and vegetables and health status. Report
to Department of Health and Aged Care. Adelaide: CSIRO, 1999:75.
19.
Kurtzweil P. Staking a claim to good health. FDA Consumer Magazine
1998;Nov/Dec:1–7.
20.
Hamilton CA. Low-density lipoprotein and oxidised low-density
lipoprotein: their role in the development of atherosclerosis. Pharmacol
Therapeut 1997;74:55–72.
21.
Tavani A, LaVerchia C. Beta-carotene and risk of coronary heart disease: a
review of observational and intervention studies. Biomed Pharmacother
1999;53:409–16.
22.
Jenkins DJ, Popovich DG, Kendall CW, Vidgen E, Tariq N, Ranson TP et al.
Effect of a diet high in vegetables, fruit and nuts on serum lipids.
Metabolism 1997;46:530–7.
23.
Verhoef P, Stampfer MJ, Rimm EB. Folate and coronary heart disease.
Current Opinion in Lipidology 1998;9:17–22.
24.
Brussaard JH, Lowik MR, van der Berg H, Brants HA, Goldbohm RA. Folate
intake and status among adults in the Netherlands. Europ J Clin Nutr
1997;51(suppl. 3):S46–S50.
Dietary Guidelines for Children and Adolescents in Australia
77
3.1 E AT
PLENTY OF VEGETABLES , LEGUMES AND FRUIT
25.
Manson JE, Willett WC, Stampfer MJ, Colditz GA, Speizer FE, Hennekens
CH. Vegetable and fruit consumption and incidence of stroke in women.
Circulation 1994;89:932.
26.
Van Duyn MA, Pivonka E. Overview of the health benefits of fruit and
vegetable consumption for the dietetics professional: selected literature. J
Am Diet Assoc 2000;100:1511–21.
27.
Kawano Y, Matsuoka H, Takashita S, Omae T. Effects of magnesium
supplementation in hypertensive patients: assessment by office, home and
ambulatory blood pressures. Hypertension 1998;32:260–5.
28.
Moore TJ, Vollmer WM, Appel JL, Sacks FM, Svetkey LP, Vogt TM et al.
Effect of dietary patterns on ambulatory blood pressure: results from the
Dietary Approaches to Stop Hypertension (DASH) Trial Collaborative
Research Group. Hypertension 1999;34:472–7.
29.
Svetkey LP, Simons-Morton D, Vollmer WM, Appel LJ, Conlin PR, Ryan DH
et al. effects of dietary patterns on blood pressure: subgroup analysis of
the Dietary Approaches to Stop Hypertension (DASH) randomised clinical
trials. Arch Intern Med 1999;159:285–93.
30.
Falkner B, Sherif K, Michel S, Kushner H. Dietary nutrients and blood
pressure in urban minority adolescents at risk for hypertension. Arch
Pediat Adolesc Med 2000;154:918–22.
31.
Dreosti IE. What do our guidelines do for cancer prevention? Cereals,
vegetables including legumes and fruit guideline. Aust J Nutr Diet
2000;57:221–2.
32.
Franceschi S, Favero A, Conti E, Talamini R, Volpe R, Negri E et al. Food
groups and oils and butter, and cancer of the oral cavity and pharynx. Brit
J Cancer 1999;80:614–20.
33.
Bosetti C, Negri E, Franceschi S, Conti E, Levi F, Tomei F et al. Risk factors
for oral and pharyngeal cancer in women: a study from Italy and
Switzerland. Brit J Cancer 2000;82:204–7.
34.
Ekstrom AM, Serafini M, Nyren O, Hansson LE, Ye W, Wolk A. Dietary
antioxidant intake and the risk of cardia cancer and non-cardia cancer in
Sweden. Int J Cancer 2000;87:133–40.
35.
Franceschi S. Nutrients and food groups and large bowel cancer in Europe.
Europ J Cancer Prev 1999;9:549–52.
36.
Michels KB, Giovannucci E, Joshipura KJ, Rosner BA, Stampfer MJ, Fuchs
CS et al. Prospective study of fruit and vegetable consumption and
incidence of colon and rectal cancer. J Nat Cancer Inst 2000;92:1740–52.
37.
Voorrips LE, Goldbohm RA, Verhoeven DT, van Popper GA, Sturmans F,
Herman RJ et al. Vegetable and fruit consumption and lung cancer risk in
the Netherlands cohort study on diet and cancer. Cancer Causes and
Control 2000;11:101–15.
78
Dietary Guidelines for Children and Adolescents in Australia
3.1 E AT
PLENTY OF VEGETABLES , LEGUMES AND FRUIT
38.
Michaud DS, Feskanich D, Rimm EB, Colditz GA, Speizer FG, Willett WC et
al. Intake of specific carotenoids and risk of lung cancer in two
prospective US cohorts. Am J Clin Nutr 2000;72:990–7.
39.
Steinmaus CM, Nunez S, Smith AH. Diet and bladder cancer: a metaanalysis of six dietary variables. Am J Epdiemiol 2000;151:693–703.
40.
Nagano J, Kano S, Preston DL, Moriwaki H, Sharp GB, Koyama K et al.
Bladder cancer incidence in relation to vegetable and fruit consumption: a
prospective study of atomic bomb survivors. Int J Cancer 2000;86:132–8.
41.
Ronco A, De Stefani E, Boffetta P, Deneo-Pellegrini H, Mendilaharsu M,
Leborgne F. Vegetables fruits and related nutrients and risk of breast
cancer: a case control study in Uruguay. Nutr & Cancer 1999;35:111–19.
42.
Gandini S, Merzenich H, Robertson L, Boyle P. Meta-analysis of breast
cancer risk and diet: the role of fruit and vegetable consumption and the
intake of associated micronutrients. Europ J Cancer 2000;36:636–46.
43.
Jain MG, Hislop GT, Howe GR, Ghadirian P. Plant foods, antioxidants and
prostate cancer risk. Nutr and Cancer 1999;34:173–84.
44.
Cohen JH, Kristal AR, Stanford JL. Fruit and vegetable intake and prostate
cancer risk. J Nat Cancer Inst 2000;92:61–8.
45.
UK Department of Health: Nutritional aspects of the development of cancer:
report of the Working Group on Diet and Cancer of the Committee on
Medical Aspects of Food and Nutrition Policy. Norwich, UK: The Stationery
Office, 1998.
46.
Williams DE, Wareham NJ, Cox BD, Byrne CD, Hales CN, Day NE.
Frequent salad vegetable consumption is associated with a reduction in the
risk of diabetes mellitus. J Clin Epidemiol 1999;52:329–35.
47.
Tavani A, Negri E, LaVecchia C. Food and nutrient intake and cataract. Ann
Epidemiol 1996;6:41–6.
48.
Brown L, Rimm EB, Seddon JM, Giovannucci EL, Chasan-Taber L,
Spiegelman D et al. A prospective study of carotenoid intake and risk of
cataract extraction in US men. Am J Clin Nutr 1999;70:517–24.
49.
Bone RA, Landrum JT, Friedes LM. Distribution of lutein and zeaxanthin
stereoisomers in the human retina. Expl Eye Res 1997;64:211–18.
50.
Sommerburg EG, Siems WG, Hurst JS, Lewis JW, Kliger DS, van Kuijktu.
Lutein and zeaxanthin are associated with photoreceptors in the human
retina. Curr Eye Res 1999;19:491–5.
51.
National Health and Medical Research Council. Recommended dietary
intakes for use in Australia. Canberra: Australian Government Publishing
Service, 1991.
Dietary Guidelines for Children and Adolescents in Australia
79
3.2 E AT
PLENTY OF CEREALS
3.2
( INCLUDING
BREADS , RICE , PASTA AND NOODLES ), PREFERABLY WHOLEGRAIN
E AT P L E N T Y O F C E R E A L S
( I N C L U D I N G B R E A D S , R I C E , PA S TA
A N D N O O D L E S ) , P R E F E R A B LY
WHOLEGRAIN
Peter Williams
TERMINOLOGY
Cereals
Cereals refers to the entire class of cereal foods, including whole or partially
processed cereal grains (for example, rice, oats, corn and barley), breads,
breakfast cereals, pasta, noodles, and other plain cereal products such as flour,
polenta, semolina, burgul, bran and wheatgerm. It excludes cereal-based
products with a significant amount of added fat and sugar—cakes, pastries,
biscuits, and so on.
Breads
Breads refers to leavened and unleavened wholemeal, white, mixed-grain, rye
and fruit breads, as well as rolls, bagels, English muffins, crispbreads, crumpets
and low-fat crackers.
Pasta and noodles
Pasta and noodles includes a wide range of Italian and Asian products based on
sheets of dough made from flours—usually wheat or rice flour—and water,
sometimes with egg added. Examples are plain spaghetti, lasagne, fettuccine,
udon and Hokkien noodles, rice paper and wonton wrappers. The term excludes
some instant noodles and flavoured pasta mixes with significant amounts of
added fat and salt.
Wholegrain
Wholegrain refers to cereal foods that incorporate all the components of the
natural grain, including the bran and germ. Foods that contain at least 51 per
cent by weight of any combination of whole grains can be termed wholegrain.1
This definition includes such foods as wholemeal breads and crispbreads, many
high-fibre breakfast cereals, oatmeal, wholemeal pasta, brown rice and popcorn.
Dietary Guidelines for Children and Adolescents in Australia
81
3.2 E AT
PLENTY OF CEREALS
( INCLUDING
BREADS , RICE , PASTA AND NOODLES ), PREFERABLY WHOLEGRAIN
B AC K G RO U N D
From an evolutionary perspective, consumption of cereal grain is relatively
recent, dating from only 5000 to 10 000 years ago, yet today eight cereals—
wheat, maize, rice, barley, sorghum, oats, rye and millet—provide more than
56 per cent of the energy and 50 per cent of the protein consumed on earth.2
Many traditional hunter–gatherer societies had diets with a relatively low
proportion of energy from carbohydrate (22–40 per cent) and only small amounts
of grain,3 although Indigenous Australians may have consumed large quantities of
grain in some areas. However, it is difficult to base conclusions about desirable
dietary patterns for modern societies simply from an assessment of traditional
eating patterns of hunter-gatherers. Many things such as activity patterns,
availability of various foods and genetic background can influence food
consumption patterns or dietary needs. recommendations made in a recent UN
report recommends that carbohydrate should provide more than 55 per cent of
energy for optimal health.4
Cereal grains form the basis of diets in many different cultures and cuisines.
They are generally an excellent source of carbohydrate and dietary fibre and are
also an important source of protein (ranging from 8 to 16 grams per 100 grams).
They are mostly low in fat and are good sources of B-group vitamins, vitamin E
and many minerals, notably iron, zinc, magnesium and phosphorus. Eating
enough cereal foods helps ensure an adequate nutritional intake. They can also
be stored safely for long periods and are relatively inexpensive: in 1998–99
purchases of cereal products accounted for only 7 per cent of household food
expenditure.5 Ecologically, a high-carbohydrate diet based on cereals makes
good use of the world’s resources, since grain crops require relatively few input
resources per unit of food energy produced.6 For these reasons all current dietary
guides have cereal foods as the largest component of the recommended daily
food intake.
Apparent consumption of cereal foods in Australia (an estimate of intake based
on national food-disappearance data), has remained relatively constant since the
1930s. In 1998–99 apparent consumption was 138.1 kilograms per person.7
There have, however, been changes in the mix of products since the 1930s.
Consumption of rice and breakfast cereals has increased significantly and
consumption of flour has fallen. The 1995 National Nutrition Survey, which used
24-hour diet recall, found that over 95 per cent of children and adolescents had
eaten cereal foods on the day of the survey, the most commonly consumed
cereal foods being bread and breakfast cereals.8 Table 3.2.1 shows the mean
daily intakes for children and adolescents.
Table 3.2.1
Mean intake of cereal foods (grams/day): children and
adolescents, by age and gender, 19958
Age (years)
Gender
2–3
4–7
8–11
12–15
16–18
Male
136
168
208
250
270
Female
132
140
176
176
195
82
Dietary Guidelines for Children and Adolescents in Australia
3.2 E AT
PLENTY OF CEREALS
( INCLUDING
BREADS , RICE , PASTA AND NOODLES ), PREFERABLY WHOLEGRAIN
The National Nutrition Survey also found that for children and adolescents cereal
foods are important sources of energy, carbohydrate, dietary fibre, thiamin, iron
and magnesium, providing about 20 per cent or more of the total daily intake of
these nutrients (see Table 3.2.2). They also provided more than 10 per cent of
the daily intakes of protein, polyunsaturated fat, riboflavin, niacin, folate,
calcium, phosphorus and zinc.
Table 3.2.2
Percentage of nutrient intake provided by cereal foods:
children and adolescents, 1995
Age (years)
Nutrient
2–11
%
12–18
%
Energy
Male
Female
20.1
19.4
19.7
19.2
Carbohydrate
Male
Female
28.9
28.1
29.7
28.4
Dietary fibre
Male
Female
34.2
32.1
34.1
31.0
Thiamin
Male
Female
44.3
42.4
44.3
39.6
Riboflavin
Male
Female
22.1
20.8
25.1
17.3
Niacin
Male
Female
23.3
21.9
21.7
18.3
Folate
Male
Female
20.6
19.6
19.4
19.1
Iron
Male
Female
40.8
38.1
39.8
32.1
Magnesium
Male
Female
25.1
23.5
24.6
23.2
Note: Biscuits, cakes and other cereal-based items are excluded.
SCIENTIFIC
BASIS
Although it is uncommon for many of the chronic diseases discussed in this
section to express themselves in childhood or adolescence, for many of them the
precursors and risk factors—for example, elevated cholesterol or blood
Dietary Guidelines for Children and Adolescents in Australia
83
3.2 E AT
PLENTY OF CEREALS
( INCLUDING
BREADS , RICE , PASTA AND NOODLES ), PREFERABLY WHOLEGRAIN
pressure—can be identified at an early age. In addition, establishment of good
eating practices at an early age is recommended to avoid development or
expression of these conditions in later life.
There have been many experimental studies with individual nutritional
components provided by cereal foods—such as dietary fibre, starch and vitamin
E—but relatively few prospective studies or controlled experimental trials have
used whole foods to find support for this dietary guideline. It is difficult to gain
people’s acceptance of long-term changes to the largest staple component of
their diets—and generally impossible to do so in a double-blind manner. As a
result, most of the available evidence comes from ecological, cross-sectional,
case-control and cohort studies. Even in these the dietary methodology is often
inadequate for analysing the consumption of different types of cereals or
quantifying dose-responses.
All recent reviews have supported the beneficial effects of cereal fibre and
whole grains in relation to decreased risk of coronary heart disease and some
cancers1,10–13, and data from several countries suggest that higher intakes of
breads and cereals help people achieve dietary targets for lower fat
consumption.14,15 Cereals are also a major source of resistant starch in the diet,
which is important for colon health. In 1999 the US Food and Drug
Administration approved the health claim that ‘diets rich in whole-grain foods
and other plant foods and low in total fat, saturated fat and cholesterol may
reduce the risk of heart disease and certain cancers’.13
Coronary heart disease
The published results of over 200 human trials have led to the general
conclusion that foods rich in soluble fibre can lower plasma cholesterol.17–19 The
National Heart Foundation of Australia has stated, ‘The consumption of dietary
fibre, especially cereal fibre, is associated with a lower risk of CHD’.20 Metaanalyses of intervention trials with two cereal foods, oats and psyllium, have
shown that these are particularly effective in reducing serum cholesterol.21,22 By
contrast, controlled human trials with supplements of isolated wheat fibre have
consistently shown no effect on plasma cholesterol.17
A large prospective study of male health professionals in the United States found
that dietary fibre intake was strongly associated with reduced rates of myocardial
infarction and that cereal fibre was apparently more protective than fibre from
fruits or vegetables.23 The study reported a 29 per cent reduction in coronary
heart disease for every 10-gram increase in daily intake of cereal fibre. Other
studies have also found a stronger association between cereal fibre and reduced
risk of coronary heart disease than with fibre from fruit or vegetables.24–26
Analysis of a prospective study of 31 284 post-menopausal women in Iowa
found the relative risk of CHD was 0.76 (95%CI: 0.55–1.05) among women in the
highest quintile of dietary fibre intakes compared with the lowest.10
The principal mechanism is probably viscous polysaccharides acting in the
gastrointestinal tract to decrease reabsorption of biliary cholesterol27, but other
84
Dietary Guidelines for Children and Adolescents in Australia
3.2 E AT
PLENTY OF CEREALS
( INCLUDING
BREADS , RICE , PASTA AND NOODLES ), PREFERABLY WHOLEGRAIN
components may be involved in the protective effect of wholegrain cereals:
vitamin E, folate, selenium, phytoestrogens and phytic acid may all be
important.28 In the Nurses Health Study, wholegrain consumption was associated
with significant reductions in risk of both CHD29 and ischaemic stroke.30
Dietary carbohydrates may also exert an influence on cardiovascular disease risk
via their effect on insulin response. High–glycaemic index (or high-GI)
carbohydrates are characterised by rapid absorption and high post-prandial
glucose and insulin responses and may result in decreased insulin sensitivity 31, a
risk factor for CHD.32 At least three cross-sectional studies have also found an
inverse relationship between HDL cholesterol and the dietary glycaemic load.33–35
(The glycaemic index is discussed in detail in Appendix I to the Dietary
Guidelines for Older Australians.)
Obesity
Although total energy intake and overall nutrient density appear to be the most
important factors affecting weight regulation, a high-fibre, low-fat diet is
recommended for maintenance of body weight and prevention of obesity.36–38
Obesity is associated with low fibre intake.39 When high-starch, high-sucrose and
high-fat ad libitum diets were compared, energy intake was lowest on the highstarch, high-fibre diet.40 In children, strict diets or rigid fat restriction are not
desirable, but choosing lower fat foods and eating a wide variety of breads and
cereals, fruits and vegetables is encouraged.41
There are several ways high-fibre cereals can reduce energy intake and help
maintain weight: they take longer to eat; they decrease the energy density of a
meal; and some fibres may slow gastric emptying and affect gastrointestinal
hormones that influence food intake.42 Compared with low-GI choices,
consumption of high-GI carbohydrates promotes a more rapid return of hunger
and increases subsequent energy intake, and slower digestion of carbohydrate is
associated with higher satiety.43 Thus, consumption of wholegrain and lower GI
cereals, instead of highly refined cereals, may help prevent excess weight
gain.44,45
Diabetes
The joint WHO–FAO consultation on carbohydrates concluded that foods rich in
slowly digested, or resistant, starch or high in soluble fibre might be protective
against diabetes.4 Recent large prospective studies of men and women have
found cereal fibre intake was inversely associated with the risk of developing
type 2 diabetes and that the protective effect was even greater when combined
with a low total glycaemic load.26,46
A large prospective study of adult women in the United States found that a lower
risk of type 2 diabetes was associated with higher intakes of all cereal grains (RR
0.75; 95%CI: 0.63–0.89) and wholegrains in particular (RR 0.73; 95%CI: 0.63–
0.85), whereas a higher intake of refined grain was related to increased risk (RR
Dietary Guidelines for Children and Adolescents in Australia
85
3.2 E AT
PLENTY OF CEREALS
( INCLUDING
BREADS , RICE , PASTA AND NOODLES ), PREFERABLY WHOLEGRAIN
1.26; 95%CI: 1.08–1.46).47 The individual foods associated with the strongest
protective effects were wholegrain breakfast cereal, brown rice and bran.
However, in that study refined grain included a wide range of higher fat cerealbased foods such as cakes, desserts and pizzas, and wholegrain foods included
some that are relatively refined (such as couscous).
Cancer
Two major reviews of the relationship between cereal consumption and cancer
prevention have been published.48,49 It is difficult to evaluate many studies
because of the paucity of biological markers; the inadequacy of many foodintake measurements, which often do not distinguish the degree of refinement of
cereal foods; and the low overall intakes of cereal fibre in many of the studies
from the United States. There is, however, emerging agreement on the probable
protective role of cereals in relation to some important cancer types. In
particular, it appears that wholegrain intake confers benefits. In a review of 40
case-control studies of 20 cancers, the pooled odds ratio for high versus low
wholegrain intake was 0.66 (95%CI: 0.60–0.72).50 Among the protective
components in wholegrains may be fermentable carbohydrates, oligosaccharides,
flavonoids, phenolics, phytoestrogens, lignans, protease inhibitors, saponins and
selenium.51–53
Colorectal cancer
Prospective data from the large Health Professionals Follow-up Study suggest
that dietary fibre intake is inversely associated with the risk of colorectal
adenoma in men, the relative risk in the highest versus the lowest quintile being
0.36. All sources of dietary fibre were protective, but the effect was stronger for
grain sources than for fruit or vegetables.54 The World Cancer Research Fund
review concluded that diets high in both starch and dietary fibre could possibly
decrease the risk of colorectal cancer 48, and a recent consensus statement from
the European Cancer Prevention Organisation, based on a review of 58
epidemiological studies, concluded, ‘A diet rich in high-fibre cereal is associated
with a reduced risk of colorectal cancer’.49 This conclusion is supported by a
meta-analysis of case-control studies of wholegrain intake and colorectal cancer,
which calculated a pooled odds ratio of 0.79 (95%CI: 0.69–0.89) when high and
low intakes of wholegrains were compared.50
Resistant starch may also favourably affect some of the faecal markers of colon
cancer risk, in a way similar to dietary fibre.16 Cereal foods are estimated to
provide 42 per cent of the resistant starch in the Australian diet.55
The most recent Cochrane Database systematic review of five intervention
studies concluded that there is currently no evidence from RCTs to suggest that
increased dietary fibre intake will reduce the incidence of adenomatous polyps
within a two to four year period.56 However, most of the studies that were
considered used isolated dietary supplements rather than whole foods an the
consistent findings of a protctive association from high fibre diets in the case-
86
Dietary Guidelines for Children and Adolescents in Australia
3.2 E AT
PLENTY OF CEREALS
( INCLUDING
BREADS , RICE , PASTA AND NOODLES ), PREFERABLY WHOLEGRAIN
control and cohort studies suggest that the mechanisms may not be fully
understood at this stage.
Breast cancer
Fibre may reduce the intestinal reabsorption of oestrogen, and bioactive cereal
components such as lignans may be protective through their action as weak
phytoestrogens. A comparison of national consumption data from various
countries suggests that energy from cereals is inversely related to breast cancer
risk57, and a meta-analysis of 12 case-control studies found a significant reduction
in risk with increasing dietary fibre.58 The World Cancer Research Fund report
concluded that dietary fibre possibly decreases the risk of breast cancer48 and the
European Cancer Prevention Organisation consensus meeting agreed that there is
evidence to suggest cereal fibre provides protection against breast cancer49,
although this is still uncertain.59
Stomach cancer
In relation to stomach cancer, the World Cancer Research Fund report concluded
from the evidence of six case-control studies that there was a possible protective
association for consumption of wholegrain cereals and cereal products but that
the evidence for cereals as a whole was inconsistent and inconclusive.48
Other cancers
One large cross-national study has found that prostate cancer mortality is
inversely associated with estimated consumption of cereals60, and case-control
studies suggest that wholegrain foods are protective.59 A few case-control studies
report a protective effect of wholegrain consumption on oral and pharyngeal
cancers61,62, but data from human intervention studies are not available for any of
these cancers.
Constipation and diverticular disease
Constipation is a common clinical complaint in childhood.63 There is a strong
correlation between dietary fibre intake and mean daily stool weight64, and
cereal fibre has been found to improve bowel function by increasing faecal bulk
and reducing transit time, resulting in softer, larger stools and more frequent
bowel action.65–67 For children aged 2 years and over, a minimal dietary fibre
intake of (age + 5) grams a day up to a maximum of (age + 10) grams a day has
been recommended.68 The mean intakes recorded in the 1995 National Nutrition
Survey were at the upper end of this range69, but the lowest quartile of intakes
was below the minimum recommendation, especially for adolescents.9 Diets rich
in insoluble fibre—such as that present in wholegrain cereals and breads—are
associated with a low prevalence of constipation and diverticular disease.
Dietary Guidelines for Children and Adolescents in Australia
87
3.2 E AT
PLENTY OF CEREALS
( INCLUDING
BREADS , RICE , PASTA AND NOODLES ), PREFERABLY WHOLEGRAIN
Hypertension
Hypertension remains an important risk factor for cardiovascular and
cerebrovascular morbidity and mortality, and a reduction in sodium intake is one
of the primary preventive measures. Cereals in their natural state are very low in
salt and have a favourable potassium–sodium ratio, but processed cereal foods,
especially bread, are major sources of salt in the Australian diet. Both dietary
fibre and magnesium may be protective against hypertension, and cereal foods
are important sources of both these nutrients; but fruit sources of fibre appear
more protective than cereal sources.70,71
Nutrient density
Two of the main cereal foods, breakfast cereals and breads, are often fortified
with vitamins and minerals that can be marginal in the diet. Children who eat
breakfast cereals generally have better overall nutrient intakes.72–76 Bread has
long been a useful staple for fortification, and some breads are now sources of
additional fibre, iron, folate and omega-3 fats. Because they are generally low in
fat and energy but nutrient dense, cereal foods used as snacks are ideal for
helping to meet the higher energy needs of growing children and adolescents.78
PRACTIC AL
ASPECTS OF THIS GUIDELINE
Relationship to the Australian Guide to Healthy Eating
The Australian Guide to Healthy Eating recommends that breads, cereals, rice,
pasta and noodles form the basis of a healthy diet, with the greatest proportion
of food coming from this group.79 The recommended number of cereal servings
for children aged 4–7 years is three to seven a day; for children aged 8–11 years
it is four to nine; and for adolescents aged 12–18 years it is four to 11,
depending on energy needs and the preferred pattern of eating. A serving
equates to two slices of bread; one cup of cooked rice, pasta or noodles; one
cup of porridge; one-and-a-third cups of breakfast cereal; or half a cup of
muesli. Cereal-based foods such as cakes, biscuits and pastries—which can have
high levels of added fats and sugars—are not included in this recommendation
and should be regarded as occasional treats only.
There are some easy ways of achieving these recommended targets:
•
consuming breads with each meal
•
regularly using rice, couscous, pasta or noodles to accompany hot dishes
•
eating breakfast cereals daily
•
including wholegrain cereals as extenders to soups and casseroles
•
using oats in crumble toppings on desserts
•
choosing grain-based snacks such as low-fat cereal bars, muffins and
popcorn.
88
Dietary Guidelines for Children and Adolescents in Australia
3.2 E AT
PLENTY OF CEREALS
( INCLUDING
BREADS , RICE , PASTA AND NOODLES ), PREFERABLY WHOLEGRAIN
Sodium intake
Bread is the most commonly consumed cereal food in Australia; it has a typical
sodium content of around 450 milligrams per 100 grams. The mean daily
consumption of regular and fancy breads by children and adolescents reported in
the 1995 National Nutrition Survey ranged from 60 to 110 grams a day (see
Table 3.2.3), which would contribute from 271 to 496 milligrams of sodium—
around 20 per cent of the recommended maximum sodium intake80; this
compared with these foods’ contribution of only 10 per cent to the daily energy
intake.9 Greater consumption of cereal foods with high salt levels could make it
more difficult for people to limit their sodium intake, but this is not a reason to
recommend against plentiful consumption of cereals. Children and adolescents
seeking to increase their cereal intake should opt for cereals that are lower in
salt—such as rice, oats, couscous, pasta, and many lower salt varieties of
breakfast cereals and breads.
Table 3.2.3
Contribution of breads to sodium intake of children and
adolescents, 19959
Age (years)
Intake
2–3
4–7
8–11
12–15
16–18
Mean bread intake (g/day)
60.3
79.1
96.6
100.1
110.2
Sodium (mg) from breads
271
356
435
451
496
320–1150
460–1730
600–2300
920–2300
920–2300
24
21
19
20
22
RDI (mg/day)
Sodium from breads as
% of maximum RDI
Note: RDI = recommended dietary intake.
Glycaemic index
The glycaemic index of a food is a physiologically based classification of
carbohydrate-containing foods according to their potential to raise blood glucose.
Various factors can affect the GI value of a food, among them the particle size of
milled grains; the ratio of amylose to amylopectin; the degree of starch
gelatinisation; and the presence of other food components such as viscous
soluble fibres, fat, protein and organic acids. Lower GI diets may possibly be
protective against both diabetes and heart disease and low-GI diets may help
with weight control.
Many processed starchy cereal foods—such as most breads, rices and breakfast
cereals—tend to have high GI values. This does not mean that high-GI cereal
foods need to be avoided altogether: the glycaemic load of a diet can be
balanced by combining high- and low-GI carbohydrate sources in the same meal.
Exchanging half the carbohydrate from high to low GI will lower the GI of the
overall diet by about 15 units, sufficient to bring about clinical improvements in
glucose metabolism in people with diabetes.81
Dietary Guidelines for Children and Adolescents in Australia
89
3.2 E AT
PLENTY OF CEREALS
( INCLUDING
BREADS , RICE , PASTA AND NOODLES ), PREFERABLY WHOLEGRAIN
To achieve a lower GI diet, consumption of slowly digested cereal foods, such as
grainy breads, pasta, low-GI breakfast cereals and high-amylose rice, is
preferred. Choosing lower GI foods from wholegrain foods with low levels of
saturated fat will also increase the protective cereal fibre and phytochemical
content of the diet.
R E L AT I O N S H I P
TO OT H E R G U I D E L I N E S
In the 1995 edition of the Dietary Guidelines for Children and Adolescents, the
guideline relating to cereal foods was ‘Eat plenty of breads and cereals
(preferably wholegrain), vegetables (including legumes) and fruits’.82 The 2002
guidelines make two separate recommendations, one relating to vegetables and
fruit and one relating to cereals—to give both groupings greater prominence.
The emphasis on ‘wholegrain’ has been retained because of the growing
evidence of the health benefits of wholegrain cereal products as compared with
refined ones.
Enjoy a wide variety of nutritious foods
Different cereals provide differing amounts and types of dietary fibre, as well as
differing levels of potentially active phytochemicals and nutritive antioxidants.83
The levels of some nutrients (such as selenium) in cereals vary considerably
according to the growing region: it is important to eat a wide variety of cereal
foods to maximise their nutritional benefits.
Limit saturated fat and moderate total fat intake
Cereals are naturally very low in saturated fat, so increased cereal consumption
is consistent with this guideline as long as the amount of fat added—in the form
of fat spreads on bread, oil added to pasta, fried rice, and so on—is limited. Care
also needs to be taken to limit the intake of other cereal-based foods such as
biscuits, cakes and pastries and some instant noodles: they can contain high
levels of added saturated fat and are treated as ‘extra foods’ in the Australian
Guide to Healthy Eating.
Choose foods low in salt
Standard commercial breads and some breakfast cereals are major sources of salt
in the diet. To cut down on salt intake, lower salt cereal products and
unprocessed whole grains should be preferred.
90
Dietary Guidelines for Children and Adolescents in Australia
3.2 E AT
PLENTY OF CEREALS
( INCLUDING
BREADS , RICE , PASTA AND NOODLES ), PREFERABLY WHOLEGRAIN
CONCLUSION
All breads and cereals are economical foods that are an important source of
essential macro- and micro-nutrients. Wholegrain cereal choices, which generally
are higher in dietary fibre, and cereals with a lower glycaemic index should be
preferred. The words ‘eat plenty’ are used to encourage children and adolescents
to choose these foods liberally as the basis of their daily diet.
EVIDENCE
There is Level I evidence of the cholesterol-lowering properties of oats and
psyllium (references 21 and 22), of the cholesterol-lowering properties of cereal
fibres generally (reference 19) and of the preventive effect of dietary fibre on
constipation (reference 66).
There is Level III evidence for the following:
•
low-GI diets and improved lipid profile and glycaemic control in diabetics
(references 33 to 35 and 84 to 86)
•
cereal fibre and reduction in risk factors for colorectal cancer (reference
87)
•
wholegrain cereal and reduced risk of coronary heart disease (references
29, 30 and 88)
•
wholegrain cereal and reduced risk of diabetes (reference 47)
•
cereal fibre and reduced risk of coronary heart disease (references 10, 23
to 25 and 46)
•
cereal fibre and reduced risk of breast cancer (references 56, 57 and 89)
•
wholegrain cereal and reduced risk of cancers (references 50, 54, 58 to 61
and 90 to 92)
•
cereal and weight control (references 40 and 93)
•
dietary fibre and reduced risk of diverticular disease (reference 94).
REFERENCES
1.
Jacobs D, Pereira M, Slavin J, Marquart L. Defining the impact of wholegrain intake on chronic disease. Cereal Foods World 2000;45:51–3.
2.
Cordain L. Cereal grains: humanity’s double-edged sword. World Rev Nutr
Diet 1999;84:19–73.
3.
Cordain L, Brand Miller J, Eaton S, Mann N, Holt S, Speth J. Plant–animal
subsistence ratios and macronutrient energy estimations in worldwide
hunter–gatherer diets. Am J Clin Nutr 2000;71:682–92.
4.
UN Food and Agriculture Organization. Carbohydrates in human nutrition:
report of a joint FAO–WHO expert consultation. Rome: FAO, 1998.
Dietary Guidelines for Children and Adolescents in Australia
91
3.2 E AT
PLENTY OF CEREALS
( INCLUDING
BREADS , RICE , PASTA AND NOODLES ), PREFERABLY WHOLEGRAIN
5.
Australian Bureau of Statistics. Household Expenditure Survey: detailed
expenditure items, Australia, 1998–99. Canberra: ABS, 2000.
6.
Connor W. The benefits of a high-carbohydrate diet. In: Wardlaw G, ed.
Perspectives in nutrition. Boston: McGraw-Hill, 1999:86–7.
7.
Australian Bureau of Statistics. Apparent consumption of foodstuffs,
Australia, 1997–98, 1998–99. Canberra: ABS, 2000.
8.
McLennan W, Podger A. National Nutrition Survey: foods eaten, Australia,
1995. Canberra: Australian Bureau of Statistics, 1999.
9.
McLennan W, Podger A. National Nutrition Survey: nutrient intakes and
physical measurements, Australia, 1995. Canberra: Australian Bureau of
Statistics, 1998.
10.
Kushi L, Meyer K, Jacobs D. Cereals, legumes, and chronic disease risk
reduction: evidence from epidemiological studies. Am J Clin Nutr
1999;70(suppl.):451S–458S.
11.
Munoz de Chavez M, Chavez A. Diet that prevents cancer:
recommendations from the American Institute for Cancer Research. Int J
Cancer 1998;11:85–9.
12.
Truswell A. Cereal grains and coronary heart disease. Eur J Clin Nutr
2002;56:1–14.
13.
Anderson J, Hanna T, Peng X, Kryscio R. Whole grain foods and heart
disease. J Am Coll Nutr 2000;19:291S–299S.
14.
Pryer J, Brunner E, Elliott P, Nichols R, Dimond H, Marmot M. Who
complied with COMA 1984 dietary fat recommendations among a
nationally representative sample of British adults in 1986–87 and what did
they eat? Eur J Clin Nutr 1995;49:718–28.
15.
Haraldsdottir J. Dietary guidelines and patterns of intake in Denmark. Br J
Nutr 1999;81(suppl. 2):S43–S48.
16.
Topping D, Clifton P. Short chain fatty acids and human colonic function
roles of resistant starch and nonstarch polysaccharide. Physiol Rev
2001;81:1031–64.
17.
Truswell A. Dietary fibre and blood lipids. Curr Opin Lipidol 1995;6:14–19.
18.
Glore S, van Treek D, Kneehams A, Guild M. Soluble fibre and serum
lipids: a literature review. J Am Diet Assoc 1994;94:425–36.
19.
Brown L, Rosner B, Willett W, Sacks F. Cholesterol-lowering effects of
dietary fibre: a meta-analysis. Am J Clin Nutr 1999;69:30–42.
20.
National Heart Foundation. Dietary fibre: a policy statement prepared by
the Diet and Heart Disease Advisory Committee for the National Heart
Foundation. Canberra: NHF, 1997.
21.
Ripsin C, Keenan J, Jacobs D, Elmer P, Welch R, Van Horn L et al. Oat
products and lipid lowering: a meta-analysis. JAMA 1992;267:3317–25.
92
Dietary Guidelines for Children and Adolescents in Australia
3.2 E AT
PLENTY OF CEREALS
( INCLUDING
BREADS , RICE , PASTA AND NOODLES ), PREFERABLY WHOLEGRAIN
22.
Olson B, Anderson S, Becker M, Anderson J, Hunninghake D, Jenkins D et
al. Psyllium-enriched cereals lower blood total cholesterol and LDL
cholesterol, but not HDL cholesterol in hypercholesterolemic adults: results
of a meta-analysis. J Nutr 1997;127:1973–80.
23.
Rimm E, Ascherio A, Giovannucci E, Spiegelman D, Stampfer M, Willett W.
Vegetable, fruit, and cereal fibre intake and risk of coronary heart disease
among men. JAMA 1996;275:447–51.
24
Pietinen P, Rimm E, Korkohnen P, Hartmen A, Willett W, Albanes D et al.
Intake of dietary fibre and risk of coronary heart disease in a cohort of
Finnish men. The a-Tocopherol, b-Carotene Cancer Prevention Study.
Circulation 1996;94:2720–7.
25.
Wolk A, Manson J, Sampfer M, Colditz G, Hu F, Speizer F et al. Long-term
intake of dietary fiber and decreased risk of coronary heart disease. JAMA
1999;281:1998–2004.
26.
Salmeron J, Ascherio A, Rimm E, Colditz G, Spiegelman D, Jenkins D et al.
Dietary fiber, glycaemic load and risk of NIDDM in men. Diab Care
1997;20:545–50.
27.
Van Horn L. Fiber, lipids, and coronary heart disease: a statement for
healthcare professionals from the Nutrition Committee, American Heart
Foundation. Circulation 1997;95:2701–4.
28.
Anderson J, Hanna T. Whole grains and protection against coronary heart
disease: what are the active components and mechanisms? Am J Clin Nutr
1999;70:307–8.
29
Liu S, Stampfer M, Hu F, Giovannucci E, Rimm E, Manson J et al. Wholegrain consumption and risk of coronary heart disease: results from the
Nurses’ Health Study. Am J Clin Nutr 1999;70:412–19.
30.
Liu S, Manson J, Stampfer M, Rexrode K, Hu F, Rimm E et al. Whole grain
consumption and risk of ischemic stroke in women: a prospective study.
JAMA 2000;284:1534–40.
31.
Wolever T. The glycemic index. World Rev Nutr Diet 1990;62:120–85.
32.
Despres J, Lamarache B, Mauriege P, Cantin B, Dagenais G, Mooranji S et
al. Hyperinsulinemia as an independent risk factor for ischemic heart
disease. New Engl J Med 1996;334:952–7.
33.
Frost G, Leeds A, Dore C, Madeiros S, Brading S, Dornhorst A. Glycaemic
index as a determinant of serum HDL-cholesterol concentration. Lancet
1999;353:1045–8.
34
Buyken A, Toeller M, Heitkamp G, Karamanos B, Rottiers R, Muggeo M et
al. Glycemic index in the diet of European outpatients with type 1
diabetes: relations to glycated hemoglobin and serum lipids. Am J Clin
Nutr 2001;73:574–81.
35.
Liu S, Manson J, Stampfer M, Holmes M, Hu F, Hankinson S et al. Dietary
glycemic load assessed by food-frequency questionnaire in relation to
Dietary Guidelines for Children and Adolescents in Australia
93
3.2 E AT
PLENTY OF CEREALS
( INCLUDING
BREADS , RICE , PASTA AND NOODLES ), PREFERABLY WHOLEGRAIN
plasma high-density-lipoprotein cholesterol and fasting plasma
triacylglycerols in postmenopausal women. Am J Clin Nutr 2001;73:560–6.
36.
Rolls B, Hill J. Carbohydrates and weight management. Washington, DC:
ILSI Press, 1998.
37.
Franklin J, Caterson I. Setting the record straight—the role of carbohydrates
in weight control. Sydney: Grains Research and Development Corporation
& BRI Australia, 1999.
38.
Yao M, Roberts S. Dietary energy density and weight regulation. Nutr Rev
2001;59:247–58.
39.
Alfieri M, Pomerleau J, Grace D, Anderson L. Fiber intakes of normal
weight, moderately obese and severely obese subjects. Obes Res
1995;3:541–7.
40.
Raben A, Macdonald I, Astrup A. Replacement of dietary fat by sucrose or
starch: effects of a 14d ad libitum energy intake, energy expenditure and
body weight in formerly obese and never-obese subjects. Int J Obes
1997;21:846–59.
41.
Gibbons K. What is the most useful eating style for children to promote
health and to prevent weight gain? Med J Aust 2000;173:S10.
42.
Levine A, Billington C. Dietary fiber: does it affect food intake and body
weight? In: Fernstrom J, Miller G, eds. Appetite and body weight regulation:
sugar, fat and macronutrient substitutes. Boca Raton, FL: CRC Press, 1994.
43.
Holt S, Brand Miller J. Particle size, satiety and the glycaemic response.
Eur J Clin Nutr 1994;48:496–502.
44.
Roberts D. High glycemic index foods, hunger and obesity: is there a
connection? Nutr Rev 2000;58:163–9.
45.
Astrup A, Ryan L, Grunwals G, Storgaard M, Saris W, Melanson E et al. The
role of dietary fat in body fatness: evidence from a preliminary metaanalysis of ad libitum low-fat dietary intervention studies. Br J Nutr
2000;83:S25–S32.
46.
Salmeron J, Manson J, Stampfer M, Colditz G, Wing A, Willett W. Dietary
fiber, glycaemic load, and risk of non-insulin-dependent diabetes mellitus
in women. JAMA 1997;277:472–7.
47.
Liu S, Manson J, Stampfer M, Hu F, Giovannucci E, Colditz G et al. A
prospective study of whole-grain intake and risk of type 2 diabetes
mellitus in US women. Am J Pub Hlth 2000;90:1409–15.
48.
World Cancer Research Fund & American Institute for Cancer Research.
Food, nutrition and the prevention of cancer: a global perspective.
Washington, DC: American Institute for Cancer Research, 1997.
49.
European Cancer Prevention Organisation Consensus Panel on Cereals and
Cancer. Consensus statement on cereals, fibre and colorectal and breast
cancers. Eur J Cancer Prev 1998;7(suppl. 2):S1–S2.
94
Dietary Guidelines for Children and Adolescents in Australia
3.2 E AT
PLENTY OF CEREALS
( INCLUDING
BREADS , RICE , PASTA AND NOODLES ), PREFERABLY WHOLEGRAIN
50.
Jacobs D, Marquart L, Slavin J, Kushi L. Whole-grain intake and cancer: an
expanded meta-analysis. Nutr Cancer 1998;20:85–96.
51.
Slavin J, Martini M, Jacobs D, Marquart L. Plausible mechanisms for the
protectiveness of whole grains. Am J Clin Nutr 1999;70(suppl.):459S–463S.
52.
Slavin J, Marquart L, Jacobs D. Consumption of whole-grain foods and
decreased risk of cancer: proposed mechanisms. Cereal Foods World
2000;45:54–8.
53.
Slavin J. Mechanisms for the impact of whole grain foods on cancer risk. J
Am Coll Nutr 2000;19:300S–307S.
54.
Giovannucci E, Stampfer M, Colditz G, Rimm E, Willett W. Relationship of
diet to risk of colorectal adenoma in men. J Nat Cancer Inst 1992;84:91–8.
55.
Baghurst P, Baghurst K, Record S. Dietary fibre, non-starch polysaccharides
and resistant starch: a review. Food Aust 1996;48:S1–S36.
56.
Asano T, McLeod RS. Dietary fibre for the prevention of colorectal
adenomas and carcinomas. Cochrane Database of Systematic Reviews
2002. Issue 4.
57.
Caygill C, Charlett A, Hill M. Relationship between intake of high-fibre
foods and energy and the risk of cancer of the large bowel and breast. Eur
J Cancer Prev 1998;7(suppl. 2):S11–S17.
58.
Howe G, Hirohata T, Hislop T, Iscovich J, Yuan J, Katsouyanni E. Dietary
factors and risk of breast cancer: combined analysis of 12 case-control
studies. J Nat Cancer Inst 1990;82:561–9.
59.
La Vecchia C, Chatenoud L. Fibres, whole-grain foods and breast and other
cancers. Eur J Cancer Prev 1998;7(suppl. 2):S25–S28.
60.
Herbert J, Hurley T, Olendzki B, Teas J, Ma Y, Hampl J. Nutritional and
socioeconomic factors in relation to prostate cancer mortality: a crossnational study. J Nat Cancer Inst 1998;90:1637–47.
61.
McGlaughlin J, Gridley G, Block G, Winn D, Preston-Martin S, Schoenberg
J et al. Dietary factors in oral and pharyngeal cancer. J Nat Cancer Inst
1988;80:1237–43.
62.
Bosetti C, Negri E, Franceschi A, Conti E, Levi F, Tomel F et al. Risk factors
for oral and pharyngeal cancer in women: a study from Italy and
Switzerland. Br J Cancer 2000;82:204–7.
63.
McClung H, Boyne L, Heitling L. Constipation and dietary fibre intake in
children. Pediatrics 1995;96:999–1001.
64.
Cummings J, Bingham S, Heaton K, Eastwood M. Fecal weight, colon
cancer risk, and dietary intake of nonstarch polysaccharides (dietary fiber).
Gastroenterology 1992;103:1783–9.
65.
Trowell H. Dietary fiber and hypothesis that it is a protective factor in
certain disease. Am J Clin Nutr 1978;29:417–27.
Dietary Guidelines for Children and Adolescents in Australia
95
3.2 E AT
PLENTY OF CEREALS
( INCLUDING
BREADS , RICE , PASTA AND NOODLES ), PREFERABLY WHOLEGRAIN
66.
Muller-Lissner S. Effect of wheat bran on weight of stool and
gastrointestinal transit time: a meta-analysis. BMJ 1988;296:615–17.
67.
Cummings J. Non-starch polysaccharides (dietary fibre) including bulk
laxatives in constipation. In: Kamm M, Lennard-Jones J, eds. Constipation.
Petersfield, UK: Wrightson Biomedical Publishing, 1994:307–14.
68.
Williams C, Bollella M, Wynder E. A new recommendation for dietary fibre
in childhood. Pediatrics 1995;96:985–8.
69.
McLennan W, Podger A. National Nutrition Survey: selected highlights,
Australia, 1995. Canberra: Australian Bureau of Statistics, 1997.
70.
Ascherio A, Rimm E, Giovannucci E, Colditz G, Rosner B, Willett W. A
prospective study of nutritional factors and hypertension among US men.
Circulation 1992;86:1475–84.
71.
Ascherio A, Hennekens C, Willett W, Sacks F, Rosner B, Manson J et al.
Prospective study of nutritional factors, blood pressure and hypertension
among US women. Hypertens 1996;27:1065–72.
72.
Gibson S, O’Sullivan K. Breakfast cereal consumptiuon patterns and
nutrient intakes of British schoolchildren. J Roy Soc Hlth 1995;115:336–70.
73.
Morgan L, Zabik M, Leveille G. The role of breakfast in the nutrient intake
of 5 to 12 year old children. Am J Clin Nutr 1981;34:1418–27.
74.
Zabik M. Impact of ready-to-eat cereal consumption on nutrient intake.
Cereal Foods World 1987;32:234–9.
75.
Preziosi P, Galan P, Deheeger M, Yacoub N, Drewnowski A, Hercberg S.
Breakfast type, daily nutrient intakes and vitamin and mineral status of
French children, adolescents and adults. J Am Coll Nutr 1999;18:171–8.
76.
Ortega R, Requejo A, Redondo R, Lopez-Sobaler A, Andres P, Ortega A et
al. Influence of the intake of fortified breakfast cereals on the dietary
habits and nutritional status of Spanish schoolchildren. Annls Nutr Metab
1996;40:146–56.
77.
Pearn J. Panis populi—bread and public health in Australia. ANZ J Publ
Hlth 1998;22:282–5.
78.
Gibbons K. Should snacking be encouraged in children? Med J Aust
2000;173:S5.
79.
Department of Health and Family Services. The Australian guide to healthy
eating: background information for nutrition educators. Canberra: DHFS,
1998.
80.
National Health and Medical Research Council. Recommended dietary
intakes for use in Australia. Canberra: Australian Government Publishing
Service, 1991.
81.
Brand J, Colagiuri S, Crossman S, Allen A, Roberts D, Truswell A. Low
glycaemic index foods improve long term glycaemic control in NIDDM.
Diab Care 1991;14:95–101.
96
Dietary Guidelines for Children and Adolescents in Australia
3.2 E AT
PLENTY OF CEREALS
( INCLUDING
BREADS , RICE , PASTA AND NOODLES ), PREFERABLY WHOLEGRAIN
82.
National Health and Medical Research Council, Dietary guidelines for
children and adolescents. Canberra: Australian Government Publishing
Service, 1995.
83.
Andlauer W, Furst P. Antioxidant power of phytochemicals with special
reference to cereals. Cereal Foods World 1998;43:356–60.
84.
Jarvi A, Karlstrom B, Granfeldt Y, Bjorck I, Asp N, Vessby B. Improved
glycemic control and lipid profile and normalized fibrinolytic activity on a
low-glycemic index diet in type 2 diabetic patients. Diab Care 1999;22:10–18.
85.
Luscombe N, Noakes M, Clifton P. Diets high and low in glycemic index
versus high monounsaturated fat diets: effects on glucose and lipid
metabolism in NIDDM. Eur J Clin Nutr 1999;53:473–8.
86.
Clapp J. Effect of dietary carbohydrate on the glucose and insulin response
to mixed caloric intake and exercise in both nonpregnant and pregnant
women. Diab Care 1998;21(suppl. 2):B107–B112.
87.
Grasten S, Juntunen K, Poutanen K, Gylling H, Miettinen T, Mykkanen H.
Rye bread improves bowel function and decreases concentrations of some
compounds that are putative colon cancer risk markers in middle-aged
women and men. J Nutr 2000;130:2215–21.
88.
Jacobs D, Meyer K, Kushi L, Folsom A. Whole-grain intake may reduce the
risk of ischemic heart disease death in post-menopausal women: the Iowa
Women’s Health Study. Am J Clin Nutr 1998;68:248–57.
89.
Saxe G, Rock C, Wicha M, Schottenfeld D. Diet and risk of breast cancer
recurrence and survival. Breast Cancer Research and Treatment
1999;53:241–53.
90.
Levi F, Pasche C, Lucchini F, Chatenoud L, Jacobs D, La Vecchia C. Refined
and whole grain cereals and the risk of oral, oesophageal and laryngeal
cancer. Eur J Clin Nutr 2000;54:487–9.
91.
Chatenoud L, La Vecchia C, Franceschi A, Tavani A, Jacobs D, Parpinel M
et al. Refined-cereal intake and risk of selected cancers in Italy. Am J Clin
Nutr 1999;70:1107–10.
92.
Fuchs C, Giovannucci E, Colditz G, Hunter D, Stampfer M, Rosner B et al.
Dietary fibre and the risk of colorectal cancer and adenoma in women.
New Eng J Med 1999;340:169–76.
93.
Brunner E, Wunsch H, Marmot M. What is an optimal diet? Relationship of
macronutrient intake to obesity, glucose tolerance, lipoprotein cholesterol
levels and the metabolic syndrome in the Whitehall II Study. Int J Obes
2001;25:45–53.
94.
Aldoori W, Giovannucci E, Rockett H, Sampson L, Rimm E, Willett W.
A prospective study of dietary fiber types and symptomatic diverticular
disease. J Nutr 1998;128:714–19.
Dietary Guidelines for Children and Adolescents in Australia
97
3.3 I NCLUDE
3.3
LEAN MEAT , FISH , POULTRY AND / OR ALTERNATIVES
I N C L U D E L E A N M E AT, F I S H , P O U LT RY
A N D / O R A LT E R N AT I V E S
Katrine Baghurst
TERMINOLOGY
Meat
Meat includes all or part of the carcass of any cattle, sheep, goat, buffalo,
kangaroo, camel, deer, goat, pig or rabbit. For the purpose of this guideline, the
term refers to the muscle component only; it excludes offal such as liver and
kidney.
Red meat
For the purpose of this guideline, red meat refers to the muscle meat from cattle,
sheep, goat and kangaroo. It does not include pork, ham or bacon; in other parts
of the world—such as the United States, the United Kingdom and Europe—red
meat includes pig meat.
Poultry
Poultry refers to chicken, duck, turkey and all other avian foods except eggs.
Alternatives
Alternatives refers to other protein-rich foods, such as eggs, liver and kidney,
shellfish, legumes, nuts and nut pastes, and certain seeds, such as sunflower and
sesame seeds.
Anaemia
There are a number of forms of anaemia. Microcytic anaemia (referring to small
red blood cells) is a deficiency of red blood cells or their haemoglobin; it is
often, but not always, related to iron deficiency. Macrocytic anaemia (referring to
large red blood cells) is prevalent in some groups (such as Indigenous
Australians) and may in some cases be associated with deficiencies of other
nutrients, especially folate and vitamin B12.
Dietary Guidelines for Children and Adolescents in Australia
99
3.3 I NCLUDE
LEAN MEAT , FISH , POULTRY AND / OR ALTERNATIVES
Iron deficiency
Iron deficiency refers to a condition of low body iron, which may manifest itself
as low serum iron, low serum ferritin, high serum iron–binding capacity, a
reduced transferrin saturation index and/or high–free erythrocyte protoporphyrin.
It can cause fatigue, listlessness and pallor and may progress to anaemia. It can
also have widespread non-haematological effects on behaviour, cognition and
motor development, physical work performance, and body temperature
regulation.
B AC K G RO U N D
Meats, fish, poultry and their alternatives contribute a number of important
nutrients, some of which are marginal in the Australian diet. The foods in this
food group are very valuable sources of protein as well as being a major source
of a number of minerals and vitamins, such as iron, zinc, vitamin B12 (see Table
3.3.1) and, in the case of fish, n-3 fats.
Red meats
Red meats are a valuable source of dietary protein and the best source of
bioavailable iron in the Australian diet. They provide substantial amounts of zinc
and vitamin B12 and the lean varieties provide from 2 to 5 grams per 100 grams
of dietary fat, with almost equal contributions from saturated and monounsaturated fats and a small amount of polyunsaturated fat.
Pork and poultry
Pork and poultry contain amounts of protein equivalent to those in red meats—
about 20 grams per 100 grams. They are also valuable sources of bioavailable
iron and zinc, but their content of these minerals is less than half that of the red
meats per unit weight. Their vitamin B12 content is also substantially less (see
Table 3.3.1). The fat content of lean pork and skinless chicken is in the same
range as that for lean red meats; lean pork has equal amounts of saturated and
mono-unsaturated fats but a higher proportion of polyunsaturated fats compared
with lean red meats. Skinless chicken has a higher proportion of both monounsaturates and polyunsaturates compared with the other meats.
Fish
Fish contain amounts of protein equivalent to those in red meats, pork and
poultry. They also provide bioavailable iron and zinc, but at markedly lower
levels than red meats. In contrast, the vitamin B12 level of fish is similar to that of
red meat or even higher, depending on the species. Fish are also a valuable
source of iodine, which is in marginal supply in some areas of Australia. The fat
100
Dietary Guidelines for Children and Adolescents in Australia
3.3 I NCLUDE
LEAN MEAT , FISH , POULTRY AND / OR ALTERNATIVES
content of fish is variable (see Table 3.3.1), ranging from 1 per cent to 10 per
cent or more by weight for oily fish. Fish, particularly the oily fish, are a very
rich source of n-3 polyunsaturated fats, which are also found in some other
muscle meats but at very much lower levels. These n-3 fats have been shown to
provide specific health benefits, notably in relation to brain development and
function and cardiovascular health (see ‘Scientific basis’ in this guideline and
Section 3.6).
Alternatives
A number of foods can provide some of the key nutrients found in meats, fish
and poultry, among them eggs, liver and kidney, shellfish, and plant foods such
as legumes, nuts and some seeds. These foods are generally good sources of
protein but have highly variable amounts of bioavailable iron, zinc and vitamin
B12. Consumption of legumes, nuts and seeds is encouraged for everyone; for
vegetarians, additional serves of these foods, together with cereals, can also
contribute many of the nutrients provided by meats, poultry and fish in an
omnivore diet.
Eggs
Eggs have slightly lower protein content than the muscle meats. They are a good
source of vitamin B12 and provide substantial amounts of iron and zinc, although
the iron is not as bioavailable. They also contain substantial amounts of
cholesterol, which might be important for some individuals, but they represent a
valuable occasional protein alternative to muscle foods.
Shellfish
Shellfish have a nutrient profile similar to that of eggs, although the cholesterol
content is variable, with prawns and squid having relatively high levels, mussels,
crab and lobster being intermediate, and scallops having low levels.
Liver and kidneys
Liver and kidneys are also good protein sources, very high in bioavailable iron
and zinc and particularly high in vitamin B12; they are, however, somewhat high
in cholesterol.
Legumes, nuts and certain seeds
Legumes, nuts and certain seeds are also valuable sources of protein and, to a
lesser degree, iron and zinc. Whole nuts are not suitable for young children
because of potential problems with choking, but they can be fed in paste form.
Iron and zinc from plant sources are less bioavailable than they are from animal
sources. Legumes, nuts and certain seeds, along with other plant foods, have
been shown to offer specific health benefits (see Section 3.1) and their inclusion
in the diet is recommended for everyone. They are particularly valuable in a
vegetarian diet as an alternative source of protein and other important nutrients.
Dietary Guidelines for Children and Adolescents in Australia
101
3.3 I NCLUDE
LEAN MEAT , FISH , POULTRY AND / OR ALTERNATIVES
Other health benefits are thought to relate to their glycaemic properties
(legumes), their phytoestrogen content (soybeans) or their fatty acid profile (nuts
and certain seeds). The plant-based alternatives to meat, fish and poultry do not
naturally provide any vitamin B12, but fortified products are available. For
vegetarians, these foods, together with cereal foods, can provide most (but not
all) of the nutrients provided by meats, fish and poultry. Other key nutrients,
such as vitamin B12 and n-3 fatty acids, may need to be obtained through
fortified foods or supplements.
Current intakes of of meat, fish, poultry and alternatives
The Australian Guide to Healthy Eating1—which is based on the NHMRC’s core
food group model2—recommends between a half and one serving of this food
group a day for children aged 4–7 years, depending on the pattern of intake of
other foods; one to one-and-a-half servings for 8–11 year olds; and one to two
servings for adolescents. A sample serve equates to 65–100 grams of cooked
meat or chicken; half a cup (cooked) of dried beans, lentils, chick peas, split
peas or canned beans; 80–120 grams of cooked fish fillet; two small eggs; onethird of a cup of almonds or peanuts; or a quarter of a cup of sunflower or
sesame seeds.
The Australian Guide to Healthy Eating recommends that red meat be eaten
three to four times a week; less than this and high-iron replacement foods will
be required. The guide adds that this is especially important for girls, women,
vegetarians and athletes.
The National Nutrition Survey of 19953 showed that children aged 2–7 years were
consuming 60–80grams/day of meat, poultry and game products and dishes with
this rising to about 108 g/day at 8–11yrs, 130g/day at 12–15 yrs and 160 g/day at
16–18yrs. Of this, muscle meat contributed 10–15g in 2–7 yr olds, 25g in 8–11yr
olds and about 40g/day in 12–18yr olds. Poultry ranged from 8–10 g/day in 2–
11yr olds, to 18g/day in 12–15 yr olds and 31g/day in 16-18yr olds. Sausages
and processed meats combined, ranged from 13–17g/day at all ages.
Fish and seafood products and dishes intake averaged 6.7g/day in 2–3yr olds,
12–13g/day in 4–11yr olds and 16–18g/day in 12–18yr olds with eggs averaging
4–6g/day in 2–15 yr olds and 8g/day in 16–18yr olds. Legumes and pulse
products and dishes averaged about 7g/day in 2–7yr olds, 4g/day in 8–11yr olds
and 10–13g/day in 12–18yr olds.
102
Dietary Guidelines for Children and Adolescents in Australia
3.3 I NCLUDE
Table 3.3.1
LEAN MEAT , FISH , POULTRY AND / OR ALTERNATIVES
Nutrient content per 100 grams of sample lean meats, fish,
poultry and alternatives
Energy
(kJ)
Protein
(g)
Iron
(mg)
Zinc
(mg)
Vitamin B12
µ g)
(µ
Lean beef
450
21.6
2.40
3.6
2.50
Lean lamb
501
20.4
2.30
3.4
0.96
Lean pork
438
21.6
1.00
2.2
0.70
Fresh flathead
395
21.1
0.20
0.6
1.50
Canned red salmon
815
21.9
1.20
0.9
4.00
Skinless chicken
466
20.4
0.95
1.4
0.41
Liver—lamb
680
21.4
9.40
4.3
84.00
Eggs
632
13.2
1.80
0.9
1.10
Soybeans (dry-cooked)
537
13.5
2.20
1.6
–
Canned baked beans
285
4.6
1.60
0.5
–
2455
20.0
3.50
3.6
–
Almonds
Total fat
(g)
Saturated
Monofat
unsaturated
(g)
(g)
Polyunsaturated Total n-3
(g)
(g)
Lean beef
1.8
0.87
0.82
0.21
0.07
Lean lamb
4.2
1.35
1.41
0.34
0.13
Lean pork
1.7
0.50
0.51
0.36
0.04
Fresh flathead
1.0
0.36
0.29
0.52
0.43
12.0
2.21
2.46
2.69
2.50
Skinless chicken
3.3
0.92
1.37
0.39
0.04
Liver—lamb
7.5
2.20
2.00
1.30
1.13
10.9
3.10
4.30
1.00
0.06
Soybeans (dry-cooked)
7.7
1.10
1.20
4.80
0.17
Canned baked beans
0.5
0.10
0.10
0.30
0.03
55.3
3.55
36.05
13.10
–
Canned red salmon
Eggs
Almonds
– Zero.
Note: Figures are for raw meats.
Sources: National Nutrition Survey nutrient data file; Nuttab ’95; NZ food database; T Spadek,
Chemistry Centre, WA (fatty acids in soybean); reference 50.
Dietary Guidelines for Children and Adolescents in Australia
103
3.3 I NCLUDE
LEAN MEAT , FISH , POULTRY AND / OR ALTERNATIVES
SCIENTIFIC
BASIS
Although this food group is a major provider of a number of important
nutrients—protein, zinc, vitamin B12 and, for fish, n-3 fatty acids—it is as a
source of bioavailable iron that it plays its most unique public health role.
Iron
The effects of anaemia and iron deficiency on brain development in infancy and
very early childhood are well documented4–7; randomised trials are also
producing evidence of their effects on cognitive processes—verbal learning and
memory—in adolescence.8 Iron deficiency in childhood and adolescence may
also be associated with reduced work capacity, a less efficient response to
exercise, and impaired immune function.9,10
As part of the haemoglobin in red blood cells, iron helps to transport oxygen
around the body. As part of the enzymes of the electron transport chain, it is
necessary for the production of energy from glucose, the main fuel for both the
brain and the rest of the body. Iron is also a vital component of enzymes
responsible for brain development and essential for the synthesis of key
neurotransmitters required for normal brain function.11 Low iron intakes—
coupled with increased requirements among population subgroups such as
adolescent girls, vegetarians and pregnant women—make iron deficiency a
significant public health concern.
Infancy and early childhood
From birth to the age of 6 months, iron stores are heavily influenced by the
mother’s iron status during pregnancy. Between the ages of 6 and 12 months, a
stage of rapid psychomotor development, poor feeding practices place many
infants at risk of iron deficiency. The effects of anaemia and iron deficiency on
brain development in infancy and very early childhood are well documented.4–7
Toddlers and preschoolers often have limited food habits, yet their energy and
iron demands for growth are high. Iron stores can be affected by the duration of
exclusive breastfeeding, delayed introduction of solids, and excessive use of
cow’s milk.
Iron intakes appear to be low in the diets of very young children in Australia:
the 1995 National Nutrition Survey found that one in three 2–3 year olds had
intakes below the recommended dietary intake on the day of the survey and one
in 10 were below 70 per cent of the RDI. About 50 per cent of adolescent girls
and 20 per cent of adolescent boys also did not meet the RDI for iron on the day
of the survey; further, some 25 per cent of the girls and 6–8 per cent of the boys
had intakes below 70 per cent of the RDI.12
Studies of the extent of the problem of iron deficiency in children and
adolescents in Australia have been done only on relatively small groups of
children to date, but the results suggest that significant numbers of children (up
to 35 per cent), particularly young children, may be iron-depleted. Aboriginal
104
Dietary Guidelines for Children and Adolescents in Australia
3.3 I NCLUDE
LEAN MEAT , FISH , POULTRY AND / OR ALTERNATIVES
children appear to be especially at risk.13,14 A study of Adelaide children found
that 20 per cent of 6–12 month old infants and 35 per cent of 12–24 month old
toddlers were ‘iron deficient’, with serum ferritin levels less than 16 micrograms
per litre.15 Another study, of 479 young Australian children aged 1–3 years, found
that a lower intake of haem iron (found in muscle meat) was a major risk factor
for iron depletion—depletion being defined as plasma ferritin less than or equal
to 10 micrograms per litre. In this study16, children eating less than 0.7 milligrams
a day of haem iron (the amount provided by about 50 grams of lean beef) were
three times more likely to be iron-depleted. A recent Sydney study of 403
children of mothers born in Arabic-speaking countries found rates of 23 per cent
for iron depletion, 9 per cent for iron deficiency without anaemia, and 6 per cent
for iron deficiency anaemia.17
Adolescence
There are only limited statistics on the prevalence of iron deficiency in Australian
adolescents, and there has been no recent national assessment of iron status in
this group. However, if the results obtained from two surveys of adolescent girls
and young women in Western Australia18,19 and data from a national survey from
the mid-1980s20 can be generalised to the current adolescent and young adult
population in Australia, low iron stores or iron deficiency without anaemia could
be relatively common in adolescent girls and young women (see Table 3.3.2).
Table 3.3.2
Percentages of females with low iron status from three
Western Australian studies18–20
Subjects
Status
265 female university students
aged 15–30 years18
Iron deficiency
Serum ferritin <16mg/L
Serum ferritin <12mg/L
Serum ferritin <12mg/L and
transferrin saturation <16%
19.8
12.5
7.2
Anaemia
Hb<12g/dL
Hb<12g/dL serum ferritin <12mg/L
and transferrin saturation <16%
10.2
4.5
211 women aged 15–30 years19
National Dietary Survey of
Schoolchildren, 1985
15-year-old girls20
% of subjects
Low iron stores
Serum ferritin <30mg/L
42.7
Iron deficiency
Serum ferritin <16mg/L
14.2a
Iron deficiency
Serum ferritin <12mg/L
9.2
20.0
a. Of these, 1.4% were anaemic.
During adolescence an adequate supply of iron is critical, not only for
maintaining haemoglobin levels but also for increasing the total iron mass during
Dietary Guidelines for Children and Adolescents in Australia
105
3.3 I NCLUDE
LEAN MEAT , FISH , POULTRY AND / OR ALTERNATIVES
this period of rapid growth. Iron requirements for boys increase during the
‘growth spurt’ as new muscle is laid down; with the slowing of growth at the end
of puberty, iron requirements decline. Although girls develop less extra muscle
tissue than boys, the onset of menstruation increases the need for iron and this
increased need continues throughout reproductive life. 21 Adolescent girls are
therefore at risk of developing iron deficiency as a consequence of the combined
effects of continuing growth, menstrual iron losses, and a low intake of dietary
iron.
A South Australian study has shown that adolescent girls have a tendency to
restrict their intake of meat—a major source of bioavailable iron—or avoid it
altogether, often because of an interest in vegetarianism, environmentalism,
fashion or body appearance. The study showed that up to 37 per cent of teenage
girls restricted their intake of meat, particularly beef and lamb.22
Sources of iron, promotors, inhibitors and bioavailability
Western mixed diets contain 1.0 to 1.4 milligrams of iron per 1000 kilojoules.23
Hence most adults will ingest over 10 milligrams of iron daily, which,
theoretically, should be sufficient to meet the needs of most of the population.24
But only a small, and variable, proportion (5–20 per cent) of dietary iron is
absorbed. Haem iron is approximately 25 per cent absorbed, and non-haem iron
(found in plants) is about 15 per cent absorbed.25 Consumption of meat, fish or
poultry increases absorption of haem iron and, even in relatively small amounts
(50–75 grams) in a mixed meal, can increase absorption from the plant foods in
the meal up to twofold.26 Non-tissue animal foods such as eggs and milk do not
appear to enhance iron absorption and can decrease non-haem iron absorption.27
Addition of foods rich in vitamin C or fruit juices to a meal can also greatly
increase the absorption of iron from that meal in a dose-dependent manner—a
factor of five or greater.28
Conversely, certain plant foods can contain inhibitors to absorption. Bothwell et
al.29 have extensively reviewed the bioavailability of iron from various natural
plant sources. Polyphenols (such as tannins), which are a component of all plant
tissue, have an inhibitory action29,30, the degree of inhibition correlating well with
the polyphenol content of individual vegetables. Tea and, to a lesser extent,
coffee also profoundly inhibit iron absorption by binding the iron to form
insoluble compounds with tannins.31 Whilst most alcoholic drinks appear to assist
iron absorption, this does not apply to some red wines, because of the tannin
content.26,31 Phytates are also inhibitory and are present in substantial quantities
in many cereals and legumes; the quantitative relation between these compounds
and iron absorption is, however, less clear cut.29
Calcium supplements have been shown to inhibit iron absorption32, and some
practitioners recommend consumption of primary iron and calcium sources on
different meal occasions to optimise absorption. However, addition of milk to a
cereal-based meal has been shown to have no effect on iron absorption in a
group of young women33, and long-term calcium supplementation has been
shown not to lower plasma ferritin concentration in human subjects.34
106
Dietary Guidelines for Children and Adolescents in Australia
3.3 I NCLUDE
LEAN MEAT , FISH , POULTRY AND / OR ALTERNATIVES
Where the plant-based foods from this category are preferred, care is therefore
necessary, so that iron intake is sufficient to overcome the lower bioavailability
and the inhibitory components in plant foods. A wide range of iron-fortified food
products are now available—with varying, but often unknown, iron
bioavailability.
Recommended intakes and current consumption of iron
The current Australian recommended dietary intakes of iron24 for infants, children
and adolescents range from 0.5 milligrams a day for breastfed infants to 3mg/day
for formula-fed infants, 9mg/day for 7–12 month olds, 6–8mg/day for 1–11 year
olds, and 10–13mg/day for 12–18 year olds.
The recent review of the US recommended dietary allowances (RDAs) set an
adequate intake for iron of 0.27mg/day for infants aged 0–6 months because it
was felt that sufficient data were not available to set an estimated average
requirement (EAR) or RDA. The review set an EAR of 6.9mg/day and an RDA
(EAR+2SD) of 11mg/day for infants aged 7–12 months; an EAR of 3mg/day and
an RDA of 7.0mg/day for children aged 1–3 years; an EAR of 4.1mg/day and an
RDA of 10.0mg/day for 4–8 year olds; EARs of 5.9mg/day for boys aged 9–13
years and 5.7mg/day for girls of that age and, for both genders, an RDA of
8.0mg/day; an EAR of 7.7mg/day and an RDA of 11.0mg/day for boys aged 14–
19 years and an EAR of 7.9mg/day and an RDA of 15.0mg/day for girls of that
age. The US recommended dietary allowance for vulnerable adolescent girls is
thus considerably higher than the current Australian recommended dietary intake
for iron.
The US review also set recommended dietary allowances for vegetarians, at
almost double those for omnivores because of the lower bioavailability of iron
from plant sources.
In the 1995 National Nutrition Survey in Australia35, the ‘meat, poultry, game,
products and dishes’ category provided 14–19 per cent of the iron in the diets of
children and adolescents, depending on age and gender, and fish and seafood
provided an additional 1–2 per cent. Red meats were the main contributor, and
they also contributed over 55 per cent to haem iron.12 The other important
contributor to iron intake (mostly non-haem iron) was the ‘cereal and cereal
products’ category (at about 40 per cent); vegetables contributed 8–12 per cent.
Zinc
Zinc is important in a number of major metabolic processes, among them the
synthesis of protein and nucleic acid and the synthesis and action of insulin. It is
involved in immune function and cell growth and repair. The long-term effects of
mild zinc deficiency are unclear but may include delayed wound healing,
impaired immune function, and problems with taste and smell acuity.36
Strong homeostatic mechanisms regulate zinc, and this, together with a lack of
sensitive indicators of zinc status, means it is difficult to determine the
Dietary Guidelines for Children and Adolescents in Australia
107
3.3 I NCLUDE
LEAN MEAT , FISH , POULTRY AND / OR ALTERNATIVES
prevalence of zinc deficiency in a community and to set recommended intakes.
Furthermore, the bioavailability of zinc varies markedly between foods and, as
with iron, is affected by the composition of the diet. Zinc from animal sources,
including eggs, is generally better absorbed than zinc from plant foods. For
example, 21–26 per cent of the zinc in beef is absorbed, compared with 11–
14 per cent of the zinc in wholemeal bread.37 Absorption of zinc is reduced by
phytate in plant foods such as peanuts and soybeans.38 While calcium and iron
can potentially reduce zinc absorption, the effect caused by food intake of these
minerals is likely to be relatively small.39
Recommended and current intakes of zinc
The Australian recommended dietary intake for zinc24 ranges from 3.0 milligrams
a day for breastfed infants and 3–6mg/day for formula-fed infants to 4–5mg/day
for children aged from 7 months to 3 years, 6.0mg/day for 4–7 year olds, 9.0mg/
day for 8–11 year olds, and 12.0mg/day for 12–18 year olds.
The recent review of the US recommended dietary allowances concluded that
only an estimate could be made of the adequate intake for infants aged to 6
months; this was set at 2.0mg/day. For infants and young children aged 7 months
to 3 years, an EAR of 2.2mg/day and an RDA of 3.0mg/day were set; for children
aged 4–8 years, an EAR of 4.0mg/day and an RDA of 5.0mg/day were set; for 9–
13 year olds, the EAR was 7.0mg/day and the RDA 8.0mg/day; and for 14–18
year olds, an EAR of 8.5mg/day and an RDA of 11mg/day were set for boys and
an EAR of 7.5mg/day and an RDA of 9.0mg/day were set for girls. In contrast to
the iron recommendations, the US recommended dietary allowances for
adolescent girls are markedly lower than the current Australian recommended
dietary intake for zinc and slightly less for adolescent boys.
The 1995 National Nutrition Survey35 showed that nearly three-quarters of
adolescent girls and women had zinc intakes less than the recommended dietary
intake of 12.0mg/day and almost half had intakes below 70 per cent of the RDI
on the day of the survey. For 2–3 year olds, 8 per cent of boys and 7 per cent of
girls had intakes less than 70 per cent of the RDI, and the proportion rose
steadily up to the age of 12–15 years, where 24 per cent of boys and 56 per cent
of girls consumed less than 70 per cent of the RDI on the day of the survey.
It is of interest to note that the new US recommended dietary allowance of zinc
for women (8.0mg/day) is one-third lower than the current Australian
recommended dietary intake for women (12mg), which was set in 1991. The
figures for men are about the same—11.0mg in the United States and 12.0mg in
Australia. It is therefore possible that the large proportion of women in Australia
apparently at risk of low zinc intake might, in part, be due to an overestimate of
requirements as a consequence of the limited data available at the time of setting
the Australian RDIs.
In the National Nutrition Survey12,35, the ‘meat, poultry and game products and
dishes’ category provided 28–35 per cent of the zinc in the diets of children and
adolescents. Muscle meats provided 10–15 per cent; poultry, 2–3 per cent; and
fish and seafood, 1–2 per cent. The proportion of the population recording a low
108
Dietary Guidelines for Children and Adolescents in Australia
3.3 I NCLUDE
LEAN MEAT , FISH , POULTRY AND / OR ALTERNATIVES
zinc intake in the survey was inversely related to red meat consumption on the
day of the survey.12
Vitamin B12
Vitamin B12 plays an important biochemical role in the maintenance of myelin in
the nervous system and, in conjunction with folate, in the synthesis of DNA.
CSIRO research has demonstrated the importance of vitamin B12 in maintaining
genetic stability: chromosome damage was shown to be lower with higher
plasma vitamin B12 levels and lower plasma homocysteine levels.
Supplementation with folate and vitamin B12 (at 3.5 to 10 times the
recommended dietary intake) can also reduce such chromosome damage.40 It is
not clear, however, what the overall health implications are in relation to the
associations seen between vitamin B12 and genetic damage.
Another CSIRO study demonstrated that non-vegetarian males aged 20–40 years
had a significantly lower rate of genetic damage than vegetarian males of the
same age.41 This is thought to be a result of the protective effects of vitamin B12
in the diet of non-vegetarians.
The main forms of vitamin B12 available to humans come from animal products
in which the vitamin has accumulated from bacterial synthesis. Although
occasional contamination of soil or water with microbes that produce vitamin B12
occurs, plant foods are usually devoid of the active form of the vitamin. Because
of the importance of animal foods as a source of this vitamin, dietary vitamin B12
deficiency can be a problem in vegetarians.42
The most prevalent deficiency of vitamin B12 is sub-clinical deficiency,
recognised by changes in biochemical levels in the blood. The normal serum
vitamin B12 is usually taken as 200 picograms per millilitre (or 150 picomoles per
litre). Low vitamin B12 levels (as well as low folate and low B6) have been shown
to correlate with raised plasma homocysteine43,44, which is a risk factor for
cardiovascular disease. However, the importance of dietary intake of vitamin B12
in prevention (or correction) of raised plasma homocysteinuria is not clear.
In one Melbourne study, Mann et al. measured serum vitamin B12, homocysteine
and folate in healthy men aged 20–55 years45 eating a wide range of diets, from
high-meat to vegan, and found a strong negative correlation (r = –0.37) between
serum vitamin B12 and plasma homocysteine in the combined subjects of the four
groups. All meat-eaters in the study had serum vitamin B12 in the normal range
(200–1100pg/ml), but 23 per cent of the lacto-ovo-vegetarians and 65 per cent of
the vegans had serum vitamin B12 below 200pg/ml. It is not certain how
representative these figures might be of the sub-populations involved since they
were based on 18 vegans, 43 lacto-ovo-vegetarians, 60 meat-eaters and 18 high
meat-eaters, but they do indicate marked differences across eating styles. If
homocysteine levels are higher in vegetarians or vegans as a result of lower B12
levels, it is unclear whether normalising this would bring them cardiovascular
benefits additional to those sometimes seen with vegetarian diets.
Dietary Guidelines for Children and Adolescents in Australia
109
3.3 I NCLUDE
LEAN MEAT , FISH , POULTRY AND / OR ALTERNATIVES
Low vitamin B12 status has also been associated with impaired cognitive
function46 in relation to fluid intelligence (the ability to assimilate and use new
information) in adolescents who had previously been long-term vegans, and in
relation to memory performance in adult women from the Australian population.
There are, however, only limited data on the vitamin B12 status of Australian
children and adolescents.
Recommended and current intakes of vitamin B12
The Australian recommended dietary intake of vitamin B12 is 0.3 micrograms a
day for breastfed and formula-fed infants, 0.7µg/day for infants aged 7–12
months, 1.0µg/day for 1–3 year olds, 1.5µg/day for 4–11 year olds, and 2.0µg/
day for 12–18 year olds.24
The recent review of the US recommended dietary allowances48 established an
adequate intake of 0.4µg/day for infants aged to 6 months and 0.5µg/day for
infants aged 7–12 months. An estimated average requirement of 0.7µg/day and
an RDA of 0.9µg/day were set for 1–3 year olds; for 4–8 year olds the EAR was
set at 1.0µg/day and the RDA at 1.2µg/day; for 9–13 year olds the EAR was set at
1.5µg/day and the RDA at 1.8µg/day; and for 14–18 year olds the EAR was set at
2.0µg/day and the RDA at 2.4µg/day.
An analysis of the 1995 National Nutrition Survey12, using the vitamin B12 food
database from the United States, gave an estimated daily intake of 3.0µg for 2–3
year olds, 2.8µg for 4–7 year olds, 3.6µg for 8–11 year olds, 4.3µg for 12–15 year
olds, and 4.6µg for 16–18 year olds.
Protein
Proteins are the fundamental structural compounds of cells, antibodies, enzymes
and many hormones. An adequate intake of protein containing all the essential
amino acids is therefore crucial for optimal growth and development in children
and adolescents. Protein may also play a role in satiety, and it constitutes almost
the sole form in which humans can replace nitrogen. Twenty-three amino acids
are used to construct proteins; of these, eight are classified as essential since
they must be supplied in food.
Proteins vary in their digestibility. The protein from meats, fish and poultry is
highly digestible (90 per cent or more); this compares with a digestibility of
78 per cent in beans and 86 per cent in whole wheat.49
Net protein utilisation50 is generally higher for animal protein sources (NPU 0.75–
0.8) compared with many, but not all, plant foods (NPU 0.5–0.6).
Recommended and current intakes of protein
Protein recommendations for children and adolescents must take account of
maintenance requirements as well as the increasing assimilation requirements of
young children and the growth spurts of older children and adolescents. There is
no recommended intake for breastfed infants aged less than 6 months, but for
110
Dietary Guidelines for Children and Adolescents in Australia
3.3 I NCLUDE
LEAN MEAT , FISH , POULTRY AND / OR ALTERNATIVES
formula-fed infants the RDI is 2.0 grams per kilogram of body weight and for all
infants aged 7–12 months it is 1.6g/kg. By 1–3 years of age, the RDI is 14–
18 grams per day, rising to 18–24g/day at 4–7 years, 27–39g/day at 8–11 years,
42–60g/day for boys aged 12–15 years and 44–55g/day for girls of this age, and
64–70g/day for 16–18 year old boys and 57g/day for girls of this age. The
Australian RDI was developed in the late 1980s.24 The US review set an adequate
intake figure of 9.1g/day or 1.52g/kg/day for infants aged 0–6 months; an RDA
of 1.5g/kg/day for infants aged 7–12 months; and an RDA of 13g/day for
children aged 1–3 years, 19g/day for those aged 4–8 years, and 34g/day for
those aged 9–13 years. For boys aged 14–18 years, an RDA of 52g/day was set,
and for girls of that age the RDA was set at 46g/day.
According to the 1995 National Nutrition Survey35, 2–3 year olds were consuming
on average 55 grams of protein a day; 4–7 year olds some 64g/day; 8–11 year
olds 82g/day; 12–15 year old boys 88g/day and girls that age 74g/day; and 16–18
year old boys 101g/day and girls of that age 80g/day. The survey found that the
‘meat, poultry and game products and dishes’ category provided a mean of
25 per cent of the protein in 2–11 year olds and just over 30 per cent in 12–18
year olds. Other major sources were the dairy group (25 per cent in 2–11 year
olds and 19 per cent in 12–18 year olds), and cereal and cereal products (18 per
cent in 2–11 year olds and 16 per cent in 12–18 year olds).
Total and saturated fats
Meats are often perceived as a major source of dietary fat and saturated fat.
However, although some individual cuts or products can be relatively high in fat,
an analysis of the 1995 National Nutrition Survey showed that meats do not
contribute as much fat as is commonly believed. For instance, the analysis
showed that red meat per se contributes an average of only 6 per cent of the
total fat in adults’ diets, 9 per cent of the saturated fat, 12 per cent of the
unsaturated fats (mainly mono-unsaturated), and 17 per cent of the cholesterol.12
Changes in both the meat supply and consumer preferences in Australia are
affecting the contribution of meats to fat and saturated fat intakes.
Excess dietary fat (and saturated fat) intake has been linked to a number of
adverse health outcomes (see Chapter 2 and Section 3.6). However, the
confounding of fat intake with the intake of certain components of this food
group, notably meats, has led to some confusion in interpretation of
epidemiological data linking dietary components to chronic disease outcomes,
particularly in relation to cancer. In the United States, where much of the
epidemiological research data comes from, the fat content of meat is
considerably higher than in Australia52–54, and meats contribute more markedly to
overall fat and saturated fat intake.
An important 1997 publication claimed a role for fat and meat in colon cancer55,
but the recent European Conference on Nutrition and Cancer56 concluded there
was no association between fresh red meat and colorectal cancer. In addition,
three recent Australian reviews of the cancer epidemiology literature have largely
Dietary Guidelines for Children and Adolescents in Australia
111
3.3 I NCLUDE
LEAN MEAT , FISH , POULTRY AND / OR ALTERNATIVES
exonerated fresh meats per se from a role in cancer causation and, in particular,
colon cancer. An expert panel review of the role of red meat in colon cancer
concluded that the balance of epidemiological evidence indicates that prevailing
levels of lean red meat consumption in Australia are not linked with the
development of cancer.57 This conclusion is consistent with that of the National
Health and Medical Research Council concerning diet and colorectal cancer—
which recommends a reduction in total fat intake but makes no recommendation
about meat intake58—and with that of an earlier review of red meat and various
cancers.59 The Cancer Council of Australia’s National Cancer Prevention Policy
2001–2003 also supports this view.60 Recent research in Europe suggests,
however, that caution may still be necessary in connection with certain foodpreparation techniques and the consumption of cured and smoked meats56,
although the Cancer Council of Australia concluded that there was insufficient
evidence at present to support a causal relationship.60
An expert review of red meat and health also concluded that diets rich in lean
red meat could still be low in fat and saturated fat and not adversely affect
plasma cholesterol levels and that lean red meat could be included in
management strategies for the prevention and treatment of obesity.61 The
conclusions of the review concur with nutrition statements from the National
Heart Foundation of Australia and have the support of the Dietitians Association
of Australia as a useful summary of the contribution of red meat to healthy
eating.
n-3 fats
Found predominantly in fish, n-3 fats appear to have a number of beneficial
actions, notably in relation to brain development and function and cardiovascular
health. (The role of n-3 fats in the diet is discussed in more detail in
Section 3.6.) Australians’ intake of long-chain n-3 fatty acids has been estimated
to be less than 200 milligrams a day (an average of about 100mg), and most
authorities recommend an intake of 214–650mg/day.63 Fish and seafood are by
far the richest sources of n-3 fats. However, Ollis et al.64 found in a study of 83
healthy Australian adults that meat was also a major contributor to the dietary
intake of very long chain n-3 fats—contributing 29 per cent of the total. They
attributed this to what they called the ‘relatively high’ meat intake of the group,
which averaged 164 grams a day. The principle n-3 fatty acid from vegetables is
alpha-linolenic acid. Vegetarians have significantly lower plasma and platelet n-3
levels65,66 since alpha-linolenic acid is not as effective a source of long-chain n-3
fatty acids as is the direct consumption of eicosapentaenoic acid (EPA),
docosapentaenoic acid (DPA) and decosahexaenoic acid (DHA)66 from fish and
meat. There is, however, no evidence that this results in higher cardiovascular
risk in vegetarians: other beneficial dietary factors might offset the low n-3
levels.
112
Dietary Guidelines for Children and Adolescents in Australia
3.3 I NCLUDE
LEAN MEAT , FISH , POULTRY AND / OR ALTERNATIVES
Special groups
Adolescent girls
In comparison with boys, men and post-menopausal women, menstrual loss
virtually doubles the iron requirement of adolescent girls.24 Adolescents have the
added demands of growth. Iron balance in these circumstances is problematic
and requires a substantial food intake, as well as an appropriate composition of
meals. The National Nutrition Survey data35 suggest that some females may be
limiting their overall food intake, possibly because of concerns about body
weight. Increased activity would allow greater food intake, thus increasing the
likelihood of adequate iron intake whilst maintaining a desirable body weight.
Pregnancy in adolescence
Pregnancy places females at higher risk of inadequate iron and zinc intake
because of their increased needs and the potential for morning sickness to
reduce nutrient availability. Pregnant adolescents are at additional risk because
of their own growth needs.67
Infants born to women with low iron stores will themselves have low iron stores
and, if exclusively breastfed for a prolonged period68, will be more likely to
develop anaemia. In addition, low iron status in early pregnancy is more likely
to result in premature birth and low birthweight.69,70
Low maternal serum zinc levels have been associated with congenital
malformations, prematurity, foetal growth retardation (leading to low-birthweight
babies) and maternal morbidity.36 However, the results have not always been
consistent.
Vegetarians
With the exception of vitamin B12, a balanced vegetarian diet can be adequate in
all nutrients; indeed, some vegetarian communities have been shown to have
health advantages over the general population—notably in the cardiovascular
area, with reductions in risk factors such as plasma cholesterol, antioxidant
status, clotting factors and blood pressure.71–81 It is thus possible to have a
healthy diet without using foods derived from animal sources. There are,
however, several micro-nutrients for which meat, fish and poultry are the
dominant and most bioavailable source and, as discussed, care needs to be taken
if these foods are excluded. The American Dietetic Association recommends that
vegetarians regularly consume B12-fortified food products. Protein from diverse
sources—legumes, nuts, cereals and dairy (if eaten)—should be included to
attain the appropriate mix of amino acids and give variety.
Legumes are a valuable source of protein, fibre and micronutrients—not only for
vegetarians but also for the wider community. Included in the legume category
are beans such as soybeans, kidney beans, broad beans and haricot beans, as
well as mature dried peas, lentils and chick peas, and foods made from this
produce; for example, hummus, falafel, bean burrito, soy and lentil burgers, soy
Dietary Guidelines for Children and Adolescents in Australia
113
3.3 I NCLUDE
LEAN MEAT , FISH , POULTRY AND / OR ALTERNATIVES
schnitzels, vegetarian sausages, soy slices, nutmeat, textured vegetable protein,
baked beans and tofu. The evidence of potential benefits for cardiovascular and
bone health conferred by isoflavones (found in soybeans) has recently been
reviewed by Messina82, but there has been very little research on children and
adolescents.
Nuts and certain seeds also provide some protein and other nutrients and can
help improve the unsaturated–saturated fat ratio in the diet. Because of their
fatty acid profile, nut consumption has been investigated in relation to the
potential to promote heart health. Several large prospective cohort studies have
examined the relationship between nut consumption and the risk of coronary
heart disease, and all found an inverse relationship.83–85 These findings and
related epidemiological and clinical studies have been reviewed by Sabate86 and
Hu and Stampfer.87 Nuts and seeds are, however, energy dense, so should be
consumed in moderate amounts. Whole nuts should not be given to young
children because of the risk of choking.
Athletes
Recent heightened interest in the relationship between iron status and athletes’
performance has revealed an increased requirement for iron in that group,
mainly because of increased intestinal losses.88,89 Because of their overall
requirements, female athletes are particularly vulnerable.
PRACTIC AL
ASPECTS OF THIS GUIDELINE
This guideline specifically refers to the inclusion of lean cuts of meat and
poultry. Some meats and some meat and poultry products or dishes that are
popular in Australia—such as pies; sausages; crumbed and fried meats, fish or
poultry; and mettwurst and salami—can contain significant amounts of saturated
fat, either from the ingredients themselves (including non-meat components such
as pastry or fillers) or from added cooking fats. These foods can be included
occasionally in a balanced diet, but care does need to be taken with the rest of
the diet, so as to avoid overconsumption of saturated fats. In addition, these
types of products do not provide the same level of iron, zinc and vitamin B12 as
the lean cuts. Selection of lean mince and removal of visible fat from meat and
poultry cuts before cooking can also help to limit fat intake.
Whilst consumption of a variety of foods from this food group is encouraged, the
Australian Guide to Healthy Eating1 recommends inclusion of red meat three to
four times a week; otherwise, high-iron replacement foods will be needed. This
is especially the case for females and athletes. One Australian study90 showed
that in young female students an intake of 1.6 milligrams of haem iron a day (the
amount in about 100 grams of lean beef) reduced the odds of having low iron
stores in the body by 60 per cent. There was no relationship between iron status
and total iron intake.
114
Dietary Guidelines for Children and Adolescents in Australia
3.3 I NCLUDE
LEAN MEAT , FISH , POULTRY AND / OR ALTERNATIVES
Inclusion of two to three meals a week of fish high in n-3 fats—pilchards,
sardines, salmon, tuna, herring, mackerel, and so on—has also been
recommended by some health authorities. However, with limited fish supplies,
this recommendation may not be attainable, or sustainable, at a population level,
and n-3 fatty acid intake may have to be achieved through foods fortified with n3 fats, in addition to natural fish sources.
Vegetarians should choose from a variety of legumes, nuts and seeds to obtain
protein, iron and zinc. Wholegrain or wholemeal cereals are also good sources
of zinc and iron, and supplemented varieties are available. Drinking fruit juice or
eating fruit at the same meal increases absorption of iron and zinc.
R E L AT I O N S H I P
TO OT H E R G U I D E L I N E S
Earlier editions of the dietary guidelines included a guideline encouraging the
consumption of ‘iron-rich foods’. In this revision—to more clearly define the
concept of variety, to provide advice consistent with the Australian Guide to
Healthy Eating, and to take a more consistent food-based approach—this
guideline has been replaced by one encouraging inclusion of lean meats and
fish, poultry or their alternatives, with an emphasis on these foods’ value as a
source of dietary iron, zinc and B12 as well as protein.
Physical activity is important for all children and adolescents
Obesity is increasing in many countries. Although many genetic, environmental
and lifestyle factors contribute to this, dietary fat intake can also be a major
factor in the development of obesity through its effect on the energy density of
the diet.91 A CSIRO analysis of the National Nutrition Survey showed a high
correlation between energy density and fat content of the diet on the day of
survey, with dietary fat (both grams per day and percentage of fat) being a major
determinant of energy density. Choosing low-fat varieties and low-fat cooking
techniques is therefore encouraged.
Limit saturated fat and moderate total fat intake
Lean meats and poultry and low-fat cooking methods are recommended.
Australian red meat cuts are generally much leaner than their equivalents from
countries such as the United States.
Care for your child’s food: prepare and store it safely
Illness caused by food-borne bacteria is a public health concern. All foods are
potential vectors of pathogens. In Australia the risk of food-borne illness in
primary food industries is managed across the food chain, with industry,
government and consumers sharing responsibility for the delivery of
microbiologically safe products. Nevertheless, some foods from the meat, fish
Dietary Guidelines for Children and Adolescents in Australia
115
3.3 I NCLUDE
LEAN MEAT , FISH , POULTRY AND / OR ALTERNATIVES
and poultry group have been implicated in outbreaks of food-borne disease92,93,
and constant vigilance is required.
CONCLUSION
Inclusion of lean meats, fish, poultry and alternatives in the daily diet will help
to ensure adequate iron, zinc and vitamin 12 intake as well as providing a
valuable source of protein. Lean red meats are a particularly valuable source of
iron, zinc and B12 and fish is a particularly good source of omega-3 fats. Whilst
well planned vegetarian diets can provide both iron and zinc in adequate
amounts, care needs to be taken to ensure intake of adequate iron and zinc from
the less bioavailable plant sources and particular attention has to be paid to
alternative vitamin B12 sources.
EVIDENCE
The scientific rationale for this guideline is based on a variety of evidence
sources, among them the following:
•
two well-designed randomised controlled trials (Level IIIevidence) relating
to iron supplementation and cognition (references 8,8)
•
a meta-analysis of case-control and cohort studies (Level III evidence)
assessing the effects of red meat on cancer (reference 59); of iron
deficiency on cognition (reference 6); of vitamin B12 on cognition
(reference ); of red meat consumption on cardiovascular disease risk
factors (reference 74); of nut consumption on cardiovascular disease
(references 83 and 85-87); of various foods, drinks or nutrients on iron or
zinc bioavailability and absorption (references 28,31–34, 37,39); and of
diet on homocysteine status (references 43 to 45).
Evidence was also obtained from a number of cross-sectional population studies,
as well as human experimentation relating to bioavailability and nutrient
requirements and intakes, and expert reviews of selected issues.
REFERENCES
1.
Children’s Health Development Foundation & Deakin University. The
Australian guide to healthy eating. Canberra: Australian Government
Publishing Service, 1998.
2.
Cashel K, Jefferson S. The core food groups. the scientific basis for
developing nutrition education tools. Canberra: Australian Government
Publishing Service, 1995.
3
Australian Bureau of Statistics. National Nutrition Survey. Foods Eaten.
Australia 1995. ABS Canberra , Australian Bureau of Statistics, 1999
116
Dietary Guidelines for Children and Adolescents in Australia
3.3 I NCLUDE
LEAN MEAT , FISH , POULTRY AND / OR ALTERNATIVES
4.
Walter T, Kovalsky SJ, Stekel A. Effect of a mild iron deficiency on infant
mental development scores. J Paediat 1983;102:519–22.
5.
Lozoff B, Brittenham GM, Wolf AW, McClish DK, Kuhnert PM, Jimenez E et
al. Iron deficiency anaemia and iron therapy effects on infant development
test performance. Paediatrics 1987;79:981–95.
6.
De Andraca I, Walter T, Castillo M, Pino P, Rivera P, Cobo C. Iron
deficiency anaemia and its effects upon psychological development at
preschool age: a longitudinal study. Nestle Foundation annual report,
1990;53–62.
7.
Lozoff B, Jimenez E, Wolf AW. Long term developmental outcome of
infants with iron deficiency. New Engl J Med 1991;325(10):687–94.
8.
Bruner AB Joffe A,Duggan AK,Casella JF, Brandt J. Randomised study of
cognitive effects of iron supplementation in non-anaemic, iron-deficient
adolescents Lancet 1996;348:992–996.
9.
Dallmann PR. Iron deficiency: does it matter? J Int Med 1982;226:367–72.
10.
Sherman AR. Zinc, copper and iron nutriture and immunity. J Nutr
1992;122:604–9.
11.
Shoham S, Glinka Y, Tanne Z, Youdim MBH. Brain iron: function and
dysfunction in relation to cognitive processes. In: Hallberg L, Asp NG, eds.
Iron nutrition in health and disease. London: John Libbey & Co.,
1996:205–17.
12.
Baghurst KI, Record SJ, Leppard P. Red meat consumption in Australia:
intakes, nutrient contribution and changes over time. Aust J Nutr Diet
2000;57(4)(suppl.):S1–S36.
13.
Harris MF, Cameron B, Florin S. Iron deficiency in Bourke children. Aust
Paediatr J 1988;24:45-7.
14.
Holt AR, Spargo RM, Iveson JB, Faulkner GS, Cheek DB. Serum and
plasma zinc, copper and iron concentrations in Aboriginal communities of
north western Australia. Am J Clin Nutr 1980;33:119-32.
15.
Oti-Boateng P, Seshadri R, Petrick S, Gibson RA, Simmer K. Iron status and
dietary iron intake of 6-24-month-old children in Adelaide. J Paediatr Child
Hlth 1998;34(3):250–3.
16.
Mira M, Alperstein G, Karr M, Ranmuthugala G, Causer J, Niec A et al.
Haem iron intake in 12–36 month old children depleted in iron: casecontrol study. BMJ 1996;312:881–3.
17.
Karr MA, Mira M, Alperstein G, Labib S, Webster BH, Lammi AT et al. Iron
deficiency in Australian-born children of Arabic background in central
Sydney. Med J Aust 2001;174:165–8.
18.
Rangan AM, Blight GD, Binns CW. Factors affecting iron status in 15–30
year old female students. Asia Pacific J Clin Nut 1997;6(4):291–5.
Dietary Guidelines for Children and Adolescents in Australia
117
3.3 I NCLUDE
LEAN MEAT , FISH , POULTRY AND / OR ALTERNATIVES
19.
Sadler S, Blight G. Iron status and dietary iron intake of young women.
Proc Nut Soc Aust 1996;20:216.
20.
English RM, Bennett SA. Iron status of Australian children. Med J Aust
1990;152:582–6.
21.
Wharton B, Wharton P. Nutrition in adolescence. Nutrition and Health
1978;4:195–203.
22.
Worsley A, Skrzypiec G. Teenagers’ social attitudes and red meat
consumption. Proc Roy Soc NZ, Miscellaneous series 36, Wellington, May
1996.
23.
UN Food and Agriculture Organization. Apparent consumption data: iron
in western diets. Rome: FAO.
24.
National Health and Medical Research Council. Recommended dietary
intakes for use in Australia. Canberra: AGPS, 1991.
25.
Hulten L, Gramatkowski E, Gleerup A, Halberg L. Iron absorption from the
whole diet: relation to meal composition, iron requirements and iron
stores. Eur J Clin Nutr 1995;49:794–808.
26.
Hurrel LRF. Bioavailability of different iron compounds used to fortify
formulas and cereals: technological problems. In: Stekel A, ed. Iron
nutrition in infancy and childhood. New York: Raven Press, 1984:158–65.
27.
Rossander L. Hallberg L, Bjorn-Rasmussen E. Absorption of iron from
breakfast meals. Am J Clin Nutr 1979;32:2484–9.
28.
Ballot D, Baynes RD, Bothwell TH, Gillooly M, MacFarlane BJ, MacPhail
AP et al. The effects of fruit juices and fruits on the absorption of iron
from a rice meal. Brit J Nutr 1987;57:331–43.
29.
Bothwell TH, Baynes RD, MacFarlane BJ, Macphail AP. Nutritional iron
requirements and food iron absorption. J Int Med 1989;226:357–65.
30.
Brune M, Rossander L, Hallberg L. Iron absorption and phenolic
compounds: importance of different phenolic structures. Eur J Clin Nutr
1989;43:547–58.
31.
Hallberg L, Rossander L. Effect of different drinks on the absorption of nonheme iron from composite meals. Hum Nutr: Appl Nutr 1982;36a:116–23.
32.
Cook JD, Dassenko SA, Whitaker P. Calcium supplementation: effect on
iron absorption Am J Clin Nutr 1991;53:106–11.
33.
Kretsch MJ, Keys WR, Shah AG. Milk’s effect on the bioavailability of iron
from cereal-based diets in young women by use of in vitro and in vivo
methods. Am J Clin Nutr 1990;52:373–8.
34.
Minihane AM, Fairweather-Tait SJ. Effect of calcium supplementation on
daily nonheme iron absorption and long term iron status. Am J Clin Nutr
1998;68(1):96–102.
35.
Australian Bureau of Statistics. National Nutrition Survey: nutrient intakes
and physical measurements, Australia, 1995. Cat. no. 4805.0. Canberra:
ABS, 1998.
118
Dietary Guidelines for Children and Adolescents in Australia
3.3 I NCLUDE
LEAN MEAT , FISH , POULTRY AND / OR ALTERNATIVES
36.
King JC, Keen CL. Zinc. In: Shils ME, Olson JA, Shike M, eds. Modern
nutrition in health and disease. Philadelphia PA: Lea and Febiger,
1994:214–30.
37.
Sandstrom B, Kivisto B, Cederblad A. Absorption of zinc from soy protein
meals in humans. Nutr 1987;117:321–7.
38.
Gibson RS. Content and bioavailability of trace elements in vegetarian
diets. Am J Clin Nutr 1994;59:1223S–1232S.
39.
Wood R, Zheng J. Calcium supplementation reduces intestinal zinc
absorption and balance in humans. FASEB Journal 1995;9:A1640.
40.
Fenech M, Aitken C, Rinaldi J. Folate, vitamin B12, homocysteine status and
DNA damage in young Australian adults. Carcinogenesis 1998;19(7):1163–71.
41.
Fenech M, Rinaldi J. A comparison of lymphocyte micronuclei and plasma
micronutrients in vegetarians and non-vegetarians. Carcinogenesis
1995;16(2):223–30.
42.
Immerman AM. Vitamin B-12 status on a vegetarian diet: a critical review.
World Rev Nutr and Diet 1981;37:38–54.
43.
Verhoef P, Stampfer MJ, Buring JE, Gaziano JM, Allen RH, Stabler SP et al.
Homocysteine metabolism and risk of myocardial infarction: relation with
vitamins B6 and B12 and folate. Am J Epid 1996;143:845–59.
44.
Ubbink JB, van der Merwe A, Vermaak WJH, Delport R.
Hyperhomocysteinuria and the response to vitamin supplements. Clin
Investig 1993;71:993–8.
45.
Mann NJ, Li D, Sinclair AF, Dudman NPB, Guo XW, Wilson AK et al. The
effect of diet on plasma homocysteine concentrations in healthy male
subjects. Eur J Clin Nutr 1999;53:895–9.
46.
Li D, Sinclair AJ, Mann NJ, Turner A, Ball MJ. Selected micro-nutrient
intake and status in men with differing meat intakes, vegetarians and
vegans. Asia Pac J Clin Nutr 2000;9:18–23.
47.
Louwman MW, van Dusseldorp M, van de Vijver FJ, Thomas CM, Schneede
J, Ueland PM et al. Signs of impaired cognitive function in adolescents
with marginal cobalamin status. American Journal of Clinical Nutrition
2000;72:762–9.
48.
Institute of Medicine. Dietary reference intakes for thiamine,
riboflavin,niacin,vitamin B6, folate, vitamin B12, pantothenic acid, biotin
and choline. Washington DC: National Academy Press, 1998:306–56.
49.
Bhutta ZA. Protein: digestibility and availability. In: Sadler MJ, Strain JJ,
Caballero B, eds. Encyclopedia of human nutrition. San Diego: Academic
Press, 1999:1646–54.
50.
Bender A. Meat and meat products in human nutrition in developing
countries. Food and Nutrition paper 53. Rome: Food Policy and Nutrition
Division, 1992.
Dietary Guidelines for Children and Adolescents in Australia
119
3.3 I NCLUDE
LEAN MEAT , FISH , POULTRY AND / OR ALTERNATIVES
51
Institute of Medicine. Dietary reference Intakes for energy, carbohydrate,
fiber, fat, fatty acids, cholesterol, protein and amino acids. Washington DC:
National Academy Press, 2002
52.
USDA Nutrient Database for Standard Reference. <www.nal.usda.gov/fnic/
cgi-bin/nut_search.pl> February 2002.
53.
Sadler MF, Lewis JL, Buick DR. Composition of trim lamb. Food Australia
1993;45:S3–S12.
54.
Watson MA, Mann NJ, Sinclair AJ, O’Dea K. Fat content of untrimmed beef
and lamb cuts. Food Australia 1992;44:511–14.
55.
World Cancer Research Fund & American Institute for Cancer Research.
Food, nutrition and the prevention of cancer: a global perspective.
Washington, DC: American Institute for Cancer Research, 1997.
56.
Riboli E. Meat, processed meat and colorectal cancer. Presentation at
European Conference on Nutrition and Cancer. Lyon, France, 2001.
57.
Truswell AS. Report of an expert workshop on meat intake and colorectal
cancer risk convened in December 1998 in Adelaide, South Australia. Eur J
Cancer Prev 1999;8:175–81.
58.
National Health and Medical Research Council. Guidelines for the
prevention, early detection and management of colorectal cancer: a guide
for patients, their families and friends. Canberra: NHMRC, 1999.
59.
Baghurst PA. Does red meat cause cancer? Aust J Nutr Diet 1997;54(4):S1–S44.
60.
Cancer Council of Australia. National Cancer Prevention Policy 2001–2003.
Sydney: Cancer Council of Australia, 2001.
61.
Expert Panel on Red Meat and Health. The role of red meat in a healthy
diet. Sydney: Meat and Livestock Australia, 2001.
62.
Sinclair AJ, Vingrys AJ. Estimation of the long chain n-3 fatty acid status of
Australians. Proc Nutr Soc Aust 1998;22:196.
63.
Simpopoulos AP, Leaf A, Salem Jnr N. Workshop statement on the
essentiality of and recommended dietary intakes for omega 6 and omega 3
fatty acids. Prostaglandins, leucotrienes and essential fatty acids
2000;63:119–21.
64.
Ollis TE, Meyer B, Howe PRC. Food sources and intakes of omega-6 and
omega-3 polyunsaturated fatty acids consumed by adults in the Illawarra
region of NSW. Proc 2nd South West Pacific Nutrition and Dietetic
Conference. Auckland, New Zealand, 1999.
65.
Conquer JA, Holub BJ. Dietary docosahexaenoic acid as a source of
eicosapentaenoic acid in vegetarians and omnivores. Lipids 1997;32:341–5.
66.
Li D, Sinclair AJ, Wilson A, Nakkote S, Kelly F, Abedin L et al. Effect of
dietary alpha-linolenic acid intake on thrombotic risk factors in vegetarian
men. Am J Clin Nutr 1999;69:872–82.
120
Dietary Guidelines for Children and Adolescents in Australia
3.3 I NCLUDE
LEAN MEAT , FISH , POULTRY AND / OR ALTERNATIVES
67.
Australian Iron Status Advisory Panel. Iron and pregnancy: recommended
guidelines. Sydney: AISAP, 1997.
68
Institute of Medicine. Dietary reference intakes for vitamin A, vitamin K,
arsenic, boron, chromium, copper, iodine, iron, manganese, molybdenum,
nickel, silicon, vanadium and zinc.. Washington DC: National Academy
Press, 2001; 290-393
69.
Kim I, Hungerford DW, Yip R, Kuester SA, Zyrkowski C, Trowbridge FL.
Pregnancy nutrition surveillance system: United States, 1979–1990. MMWR
CDC Surveillance Summaries 1992;41:25–41.
70.
Scholl TO, Hediger ML, Fischer RL, Shearer JW. Anaemia vs iron
deficiency: increased risk of preterm delivery in a prospective survey. Am
J Clin Nutr 1992;55:985–8.
71.
Burr ML, Butland BK. Heart disease in British vegetarians. Am J Clin Nutr
1988;48:830–2.
72.
Fonnebo V. The Tromso heart study: diet, religion and risk factors for heart
disease. Am J Clin Nutr 1988;48:826–9.
73.
Fraser GE. Determinants of ischaemic heart disease in Seventh Day
Adventists. Am J Clin Nutr 1988;48:833–6.
74.
Kestin M, Rouse IL, Correll R, Nestel PJ. Cardiovascular disease risk factors
in free-living men: comparison of two prudent diets, one based on
ovolacto-vegetarianism and the other allowing red meat. Am J Clin Nutr
1989;50:280–7.
75.
Reddy S, Sanders TAB. Lipoprotein risk factors in vegetarian women of Indian
descent are unrelated to dietary intake. Atherosclerosis 1992;95:223–9.
76.
Pronczuk A, Kipervarg Y, Hayes KC. Vegetarians have higher plasma
alpha-tocopherol relative to cholesterol than do non-vegetarians. J Am Coll
Nutr 1992;11:50–5.
77.
Prasad K, Reddy S, Sanders TAB. Plasma ubiquinone (Q10) concentrations
in female vegetarians and omnivores. Proc Nutr Soc 1993;52:332A.
78.
Haines AP, Chakraharti R, Fisher D, Meade TW, North WR, Stirling Y.
Haemostatic variables in vegetarians and non vegetarians. Thromb Res
1980;19:139–48.
79.
Sanders TAB, Key TJA. Blood pressure, plasma rennin activity and
aldosterone concentrations in vegans and omnivore controls. Hum Nutr:
Appl Nutr 1987;41:101–8.
80.
Armstrong BK, Clarke H, Martin C, Ward W, Norman N, Masarei J. Urinary
sodium and blood pressure in vegetarians. Am J Clin Nutr 1979;32:2472–6.
81.
Margetts BM, Beilin LJ, Vandongen R, Armstrong BK. Vegetarian diet in
mild hypertension: a randomised controlled trial. BMJ 1986;293:129–33.
82.
Messina MJ. Legumes and soybeans: an overview of their nutritional
profiles and health effects. Am J Clin Nutr 1999;70(suppl.):439S–450S.
Dietary Guidelines for Children and Adolescents in Australia
121
3.3 I NCLUDE
LEAN MEAT , FISH , POULTRY AND / OR ALTERNATIVES
83.
Fraser GE, Sabate J, Beeson WL, Strahan TM. A possible protective effect
of nut consumption on risk or coronary heart disease: the Adventist Health
Study. Arch Intern Med 1992;152:1416–24.
84.
Kushi LH, Folsom AR, Prineas RJ, Mink PJ, Wu Y, Bostick RM. Dietary
antioxidant vitamins and death from coronary heart disease in post
menopausal women. N Engl J Med 1996;334:1156–62.
85.
Hu FB, Stampfer MJ, Manson JE, Rimm EB, Colditz GA, Rosner BA et al.
Frequent nut consumption and risk of coronary heart disease: prospective
cohort study. BMJ 1998;317:1341–5.
86.
Sabate J. Nut consumption, vegetarian diets, ischaemic heart disease risk
and all-cause mortality: evidence from epidemiologic studies. Am J Clin
Nutr 1999;70(suppl.):500S–503S.
87.
Hu FB, Stampfer MJ. Nut consumption and risk of coronary heart disease: a
review of epidemiologic evidence. Current Athero Rep 1999:1:205–10.
88.
Snyder AC, Dvorak LL, Roepke JB. Influence of dietary source on measures
of iron status among female runners. Med Sci Sports Exerc 1989;21:7–10.
89.
Haymes EM, Lamanca JJ. Iron loss in runners during exercise: implications
and recommendations. J Sports Med 1989;7:277–85.
90.
Australian Institute of Health and Welfare. Australia’s food and nutrition.
Canberra: AGPS, 1994.
91.
Lissner L, Heitman BL. Dietary fat and obesity: evidence from
epidemiology. Eur J Clin Nutr 1995;49:79–90.
92.
Riley LW, Remis RS, Helgerson SD, McGee HB, Wells JG, Davis BR et al.
Hemorrhagic colitis associated with a rare Escherichia coli serotype. New
Engl J Med 1983;308:681–5.
93.
Centers for Disease Control and Prevention. Community outbreak of hemolytic
uremic syndrome attributable to Escherichia coli 0111:NM—South Australia,
1995. Morbidity and Mortality Weekly Report 1995;44:157–60.
94.
Bryan J, Calvaresi E, Hughes D. The effect of short term folate, B12 and B6
supplementation and dietary intake on cognition and mood in women. J
Geront: Psych Sci 2001 (in press).
122
Dietary Guidelines for Children and Adolescents in Australia
3.4 I NCLUDE
3.4
MILKS , YOGHURTS , CHEESES AND / OR ALTERNATIVES
I N C L U D E M I L K S , YO G H U R T S ,
C H E E S E S A N D / O R A LT E R N AT I V E S
• Reduced-fat varieties should be chosen where
possible
• Reduced-fat milks are not suitable for young
children under 2 years, because of their high
energy needs, but reduced-fat varieties should
be encouraged for older children and
adolescents
Katrine Baghurst
TERMINOLOGY
Milks, yoghurts and cheeses
The term milks, yoghurts and cheeses, as used in this guideline, generally refers
to cow’s milk and the yoghurt and cheese produced from it but can also include
milks, yoghurts and cheeses from goat and sheep milks. Goat and sheep milks
have overall nutrient profiles that are similar to that of cow’s milk, although
goat’s milk is slightly more ‘watery’ (less nutrient dense), whereas sheep’s milk is
almost twice as concentrated as cow’s milk, containing more calcium per unit
weight but also more fat and energy. In addition, goat and sheep milks are
generally not pasteurised and can constitute a health risk. Milks, and products
made from them, are good sources of a number of nutrients—for example,
protein, riboflavin and vitamin B12—but notably calcium.
Alternatives
Inclusion in the ‘alternative’ category is based primarily on calcium content,
although most of the alternatives also provide substantial amounts of protein.
Alternatives includes milk-based custards, ice-creams and evaporated milks, as
well as fortified soy milk and derivatives. Sardines and other fish whose bones
are eaten, and certain nuts (such as almonds), also contain moderate to good
amounts of calcium and protein and in this respect can be considered occasional
‘alternatives’. Table 3.4.1 shows the calcium content and the content of other key
nutrients for a selection of milks, yoghurts, cheeses and alternatives.
Milk foods
For the purposes of this guideline, where milk foods is used it generally refers to
cow’s milk (fresh, long-life, reconstituted dried and evaporated) and products
made from it, such as yoghurts, ice-creams, cheeses and milk-based custards,
Dietary Guidelines for Children and Adolescents in Australia
123
3.4 I NCLUDE
MILKS , YOGHURTS , CHEESES AND / OR ALTERNATIVES
which are good sources of calcium as well as a range of other nutrients. The
‘milk foods’ category is a major source of saturated fat in children’s and
adolescents’ diets, so—with the exception of children aged less than 2 years—
reduced-fat varieties are encouraged. In the 1995 National Nutrition Survey, a
category called ‘milk products and dishes’ was used; this category included the
foods listed here as ‘milk foods’ as well as cream and soy alternatives such as
soy milks and cheeses.
Reduced-fat products
Reduced-fat milks, yoghurts and cheeses generally contain 75 per cent (or less)
of the fat in the equivalent full-fat product. It is important to note that soft
cheeses such as cottage cheese and ricotta, whilst low in fat, contain very little
calcium.
Reduced-fat milks are not suitable for children aged less than 2 years: milk is a
major energy source in these children, who are in a period of rapid growth.
Reduced-fat milks are, however, recommended for older children and
adolescents when the diet has diversified.
Osteoporosis
Osteoporosis, a condition of low bone mass, can lead to bone fragility and
increased risk of fractures. Most fractures in older adults are related to
osteoporosis; in young adults, trauma is the primary cause of fractures.1
Clinically, osteoporosis is measured in terms of bone mineral density that is
below the age-adjusted reference range. Individuals are considered osteoporotic
if their bone mineral density is 2.5 SD or more below the young adult mean.2
This criterion identifies about 30 per cent of all post-menopausal women as
having osteoporosis and, of these, more than 50 per cent will have suffered a
previous fracture.2
Clinical expression of osteoporosis is not generally seen in childhood or
adolescence, but inadequate development of peak bone mass during this period
is a primary risk factor.
B AC K G RO U N D
Milk foods are a major source of nutrients in the Australian diet. Milk itself is one
of the most complete of all foods, containing nearly all the constituents of
nutritional importance to humans. Milk foods are a key source of protein,
calcium, vitamin A, riboflavin, vitamin B12 and zinc. They do, however, also
provide about one-third of the saturated fat in the diet of children and
adolescents3; milk itself provides about 20 per cent of the saturated fat in
children and 14 per cent in adolescents, and cheeses provide a further 6–7 per
cent in both children and adolescents. For this reason—and with the exception
of children under 2 years of age—reduced-fat varieties are recommended.
124
Dietary Guidelines for Children and Adolescents in Australia
304
766
607
Yoghurt: regular fat, plain
Ice-cream: regular
Ice-cream: reduced-fat
8.1
21.8
21.8
20.0
304
952
767
2455
2618
Tofu: cooked, fat not added
in cooking
Sardine: canned in oil, drained
Sardine: canned in water, drained
Almond: raw
Almond: roasted
60.5
55.3
10.7
15.7
4.2
0.5
3.5
33.8
6.0
10.6
3.4
0.1
0.2
1.4
3.8
Fat
(g)
4.2
3.6
2.8
5.1
0.6
0.1
0.4
21.5
3.9
6.9
2.2
0.1
0.1
0.9
2.5
Sat. fat
(g)
Cheese: cottage
Dietary Guidelines for Children and Adolescents in Australia
5.8
0.3
2.1
42.8
3.8
0.0
0.3
28.3
73
12
13
60
40
59
27
200
6
6
608
608
7
40
59
656
95
86
77
54
66
58
51
Sodium
(mg)
–
–
0.2
–
1.0
1.2
0.3
0.3
–
0.2
0.2
0.0
0.3
0.3
0.3
0.2
0.3
0.2
0.2
Vitamin
B2 (mg)
–
1.5
0.1
0.2
0.0
0.0
28.0
28.0
–
0.3
0.5
0.2
0.4
0.4
0.3
0.3
0.3
0.3
0.3
Vitamin
B12 (µg)
–
–
580
65
1
2
65
65
–
39
39
390
80
140
39
0
5
14
48
Vitamin A
equiv (µg)
0.3
0.3
0.3
0.5
3.3
3.6
1.8
1.8
0.7
0.2
0.2
3.6
0.4
0.3
0.5
0.4
0.5
0.4
0.4
Zinc
(mg)
0.4
0.4
0.1
0.0
3.3
3.5
2.7
2.7
1.2
0.5
0.5
0.0
0.1
0.1
0.1
0.1
0.1
0.1
0.1
Iron
(mg)
– Zero.
Note: The milk analysis is for cow’s milk.
Source : AUSTNUT food composition tables (FSANZ, 1999) for all nutrients except salt (Nuttab ’95) and vitamin B12 (British food tables—McCance & Widdowson).
2.5
2.5
Soy beverage: unfortified, unflavoured 164
Soy beverage: low-fat, unfortified 110
15.3
1.9
512
1660
Cream: pure (fat >35%)
218
235
380
380
330
110
116
775
130
119
171
123
160
137
114
Calcium
(mg)
Examples of milk-based and soy foods with limited calcium content
18.6
3.5
175
Soy beverage: low-fat,
fortified with calcium
3.5
260
25.4
4.5
3.5
4.7
3.6
4.6
3.9
3.3
Protein
(g)
Soy beverage: fortified, unflavoured
1690
145
Milk: fluid, skim or non-fat
(fat <0.16%)
Cheese: cheddar
203
190
Milk: fluid, reduced-fat (fat 1–2%)
Milk: fluid, low-fat (fat <1.1%)
272
Energy
(kJ)
Nutrient content per 100 grams: milk, yoghurts, cheeses and calcium-rich alternatives
Milk: fluid, whole
Food
Table 3.4.1
3.4 I NCLUDE
MILKS , YOGHURTS , CHEESES AND / OR ALTERNATIVES
125
3.4 I NCLUDE
MILKS , YOGHURTS , CHEESES AND / OR ALTERNATIVES
In particular, milk foods are the richest source of calcium in the Australian diet3;
few other foods provide such a readily absorbable and convenient source of this
nutrient. Calcium is required for the normal development and maintenance of the
skeleton.4 It is stored in the teeth and bones, where it provides structure and
strength. In western cultures low intakes of calcium have been associated with
osteoporosis, which often results in bone fracture and is one of the main causes
of morbidity among older Australians, particularly women. It is worth noting,
however, that osteoporosis has its origins in childhood and adolescence.
In the light of the ageing of Australia’s population, in 1986, it was estimated that
by 2011 hospital admissions for osteoporotic fractures would increase by 84 per
cent.5 The Dubbo Osteoporosis Epidemiology Study found that, after the age of
60 years, about 60 per cent of women and 30 per cent of men suffer
osteoporotic fractures.6 The most common fracture sites related to the condition
are the hip, vertebrae and wrist; hip fractures have the greatest overall public
health impact. Considerable morbidity and mortality are associated with hip
fractures, and they lead to a substantial decline in physical function.7 In 2001 it
was estimated that the cost of osteoporosis in Australia was $1.9 billion in direct
health care costs and a further $5.6 billion in indirect costs associated with loss
of earnings, volunteer carers, modifications and equipment.8
Current intake of milk and milk foods
The 1995 National Nutrition Survey used a 24-hour recall technique
supplemented by a qualitative food-frequency questionnaire. The survey had a
category of consumption called ‘milk products and dishes’, which includes items
such as milks, yoghurts, cheese, cream, ice-cream and milk-based custards, as
well as milk substitutes such as soy milks and soy cheeses. On the day of the
survey, about 30 per cent of participating children and adolescents aged 2 to 18
years consumed less than one serve of milk products and dishes (where a serve
is equivalent to one cup of milk, 35 grams of cheese, 200 grams of yoghurt, or
the calcium equivalent). A further 51 per cent consumed between one and three
serves, and 20 per cent consumed three or more serves. Intakes were particularly
low in 16–18 year old girls, where some 44 per cent consumed less than one
serve on the day of the survey and only 12 per cent consumed three serves or
more. The Australian Guide to Healthy Eating9—which is based on the NHMRC
core food groups analysis10—recommends two to three serves a day for children
aged 4–11 years and three to five for adolescents, depending on their preferred
eating patterns.
SCIENTIFIC
BASIS
Although milk foods are valuable sources of a number of nutrients, including
protein, retinol, riboflavin, vitamin B12 and zinc11, the primary rationale for
including this food group in the dietary guidelines lies in its role as a rich source
of calcium.
126
Dietary Guidelines for Children and Adolescents in Australia
3.4 I NCLUDE
MILKS , YOGHURTS , CHEESES AND / OR ALTERNATIVES
The scientific basis for this guideline thus centres on the role of the milk foods
as a key source of readily absorbable dietary calcium and the role of calcium (in
conjunction with a number of other factors) in attaining peak bone mass and in
preventing osteoporosis in later life.
The role of human milk, cow’s milk and milk substitutes in infant nutrition is
covered in the Infant Feeding Guidelines for Health Workers, so is not discussed
here.
The importance of peak bone mass
The skeleton is in a phase of rapid growth throughout childhood and
adolescence. Between birth and puberty it increases in mass about seven-fold
and a further three-fold during adolescence.12 Studies of factors influencing the
accumulation of bone mass in childhood and adolescence have been summarised
in a recent review by Zhu et al.13; among these factors are racial and genetic
inheritance, body weight, physical activity, nutritional intake (including calcium)
and endocrine factors.
The best protection against age-related bone loss and consequent fracture risk is
the attainment of a high peak bone mass at skeletal maturity, between 19 and 30
years of age, after which bone mass gradually declines, at a rate that varies from
person to person. Calcium seems to be the pre-eminent nutritive factor
determining peak bone mass in young adults.4,12
Because approximately 60 per cent of the weight of mature bone is mineral
(mainly in the form of calcium phosphate), and because mineralisation occurs as
bone matrix is laid down, a continuous supply of calcium in amounts
appropriate to the changing needs of growth is essential for healthy bone
development during childhood and adolescence.12
It is important to achieve a high peak bone mass: the greater the mass before
age-related loss begins the less likely it is that the mass will decrease to levels
where fractures may occur.1,4 During the adolescent growth spurt, the required
calcium retention is two to three times greater than the average level required
for the development of peak bone mass.14 It is particularly important therefore
that an adequate diet is consumed during this period Restricted food intakes at
this age are therefore of particular concern, and young girls with very heavy
exercise regimes and who restrict their total food intake are at heightened risk of
developing an inadequate peak bone mass. During the period that peak bone
mass is developing, it is necessary to ingest sufficient calcium to maintain
positive balance. This quantity will vary from person to person, depending on
individual efficiency of intestinal calcium absorption. Once peak bone mass is
achieved, it is maintained without much change for 10 to 20 years.
Dietary Guidelines for Children and Adolescents in Australia
127
3.4 I NCLUDE
MILKS , YOGHURTS , CHEESES AND / OR ALTERNATIVES
Calcium balance and bone mass
On balance, evidence suggsts that calcium intake in childhood can have long
lasting effects on bone mass but also suggest that adequate intakes must be
maintained throughout the period of peak bone mass accretion.
Intervention trials in which children were randomised to different calcium
intakes have shown short-term changes in bone mineral content. In one trial, in
twins averaging 7 years of age, a significant increase in bone mineral density
was seen in the radius and lumbar spine after three years of treatment. The
controls ingested approximately 900 milligrams a day on average and their twins
ingested 1600 milligrams.15 This higher level was, however, not sustained when
they returned to their previous diets.16 Lee17 found a similar result in 7-year-old
Chinese children receiving a 300-milligram calcium supplement as opposed to a
placebo. In this case, there was a significant increase in bone mineral content at
mid-shaft radius after 18 months of treatment, but the gain disappeared after an
18-month follow-up period without supplementation.18 Similar improvements
with supplementation have been reported in pre-pubertal children.19,20 There is,
however, mounting evidence from randomised clinical trials that the bone mass
gained in childhood and adolescence through calcium or milk supplementation is
not retained after such intervention16,18,21 and that optimal calcium intakes need to
be retained throughout the period of attainment of peak bone mass.
Several retrospective studies do suggest that higher calcium intakes throughout
childhood are associated with greater bone mass in adulthood.22–25
Most cross-sectional studies of children and adolescents have also shown a
positive correlation between dietary calcium and bone mass density26–33, but
some have found little or no relationship.34–41 It has been proposed that these
discrepancies may relate to a threshold below which calcium intake will
influence accumulation of bone mass and above which it will not. It has been
claimed that for children aged 9–17 years this threshold might be around
1500 milligrams a day.42
Studies in adults also confirm the link between calcium and bone mass. A metaanalysis of 27 cross-sectional, two longitudinal and four intervention studies
assessing the effect of calcium intake on bone mass in young and middle-aged
females and males43 concluded that overall there was evidence that calcium
intakes were positively associated with bone mass in pre-menopausal women,
although calcium intake alone accounted for only a small part of the variance in
bone mass.
Consequences of low bone density
The consequences of low bone density are mostly expressed at older ages.
However, in a 1998 study in New Zealand, Goulding et al.44 showed that low
bone density was more common throughout the skeleton in girls with forearm
128
Dietary Guidelines for Children and Adolescents in Australia
3.4 I NCLUDE
MILKS , YOGHURTS , CHEESES AND / OR ALTERNATIVES
fractures than in those who had never broken a bone; this supports the view that
low bone density may also contribute to the risk of fracture in childhood.
Low bone density in adults is associated with an increased risk of fracture: the
lower the bone density, the greater the risk. There is evidence that a high
calcium intake at older ages slows the rate of bone loss and may reduce the risk
of fracture. A number of randomised trials have shown that calcium supplements
are effective in slowing bone loss in older women45–48 but a meta-analysis of nine
randomised controlled trials of the effect of calcium supplementation on bone
density in post-menopausal women49 concluded that, whilst the rate of bone loss
was less in supplemented women in the first year of treatment, in the second
year it was not. Only a limited number of randomised controlled trials of calcium
supplementation have used fracture end-points50–53; these studies have, however,
consistently shown a reduction in risk, albeit ranging from 26 to 70 per cent. A
systematic review of 14 studies—randomised and non-randomised controlled
trials, case-control studies and cohort studies—also concluded that calcium
supplements and dietary calcium probably reduce the risk of osteoporotic
fractures in women.54
Milk consumption in childhood and adolescence and adult bone mass
density
A number of retrospective studies have shown that milk consumption in early
life has positive effects on adult bone mass density25,55–59, although a study by
Ulrich et al. showed no effect.60 A study by Du et al.61, in Chinese girls aged 12–
14 years, showed that the intake of milk and milk products was a determinant of
bone mineral content—independent of protein, calcium or vitamin D intake—but
the significance of this finding in the Australian context is unclear.
Some factors affecting calcium needs
Bioavailability
For food sources of calcium, content is of greater importance than bioavailability.
Calcium absorption efficiency is similar from most foods, but it may be poor
from foods rich in oxalic acid (for example, spinach, rhubarb and beans) and
phytic acid (seeds, nuts, grains, raw beans and soy isolates). Soybeans have large
amounts of phytate but absorption of calcium is still quite high.62 Compared with
milk, calcium absorption from dried beans is about half; from spinach it is about
one-tenth. Bioavailability from non-food sources such as supplements depends
on the dose and whether taken with a meal. In standardised studies of 250milligram calcium supplements given with a breakfast meal, calcium citrate
malate gave a fractional absorption rate of 35 per cent, calcium carbonate 27 per
cent, and tricalcium phosphate 25 per cent; this compares with a rate of 29 per
cent for calcium from milk.63–66 Efficiency of absorption of calcium from
supplements is greatest at doses of 500 milligrams.67,68
Dietary Guidelines for Children and Adolescents in Australia
129
3.4 I NCLUDE
MILKS , YOGHURTS , CHEESES AND / OR ALTERNATIVES
Physical activity
It is generally accepted that weight-bearing exercise determines the strength,
shape and mass of bone69, although the mechanisms are still not clear. It is also
unclear whether calcium intake influences the benefit gained from exercise. With
complete immobilisation, rapid bone loss occurs despite a high calcium intake.70
In an intervention study in children, calcium and exercise both affected bone
mineralisation but the effects appeared to be independent.71 A review of 16
studies in adults, mostly women, concluded that high calcium intakes (over
1000 milligrams) enhanced the bone mineral density benefits of exercise to
different degrees in various parts of the skeleton.72 The review of calcium
requirements undertaken for development of the US dietary reference values73
concluded there was insufficient evidence to justify different calcium
requirements for people with different activity levels.
Sodium
Sodium and calcium excretion are linked in the kidney tubules. A high salt
intake increases urinary sodium, resulting in increased obligatory loss of urinary
calcium. In post-menopausal women, 500 milligrams of excreted sodium draws
10 milligrams of calcium into the urine.74 In children and adolescents, urinary
sodium is an important determinant of urinary calcium excretion75,76, but no
association has been shown between salt intake or excretion and skeletal
development in children. One longitudinal study in post-menopausal women did,
however, show a link between high urinary sodium and increased hip bone
loss.77 No study has yet shown a direct link between sodium intake and bone
loss or fracture rates. The US dietary reference intakes committee examining
calcium requirements73 concluded that, despite the relatively high salt intake in
the United States, the available evidence did not warrant the setting of different
calcium requirements for people with different sodium intakes.
Protein
Protein increases urinary calcium excretion but its effect on calcium retention is
unclear. Walker and Linkswiler78 found that urinary calcium increased by about
0.5 milligrams for each gram of dietary protein over about 47 grams a day; the
data for children are limited. The US review of calcium requirements 73 concluded
that evidence of the effect of protein intake on calcium requirement was not
sufficient to recommend different calcium intakes for different intakes of protein.
Requirements and recommended intakes for calcium
Calcium requirements are largely determined by skeletal needs, which increase
during periods of rapid growth (such as childhood and adolescence), during
pregnancy and lactation, and in later life. Needs can be assessed in a number of
ways, among them balance studies, a factorial estimate approach, and changes in
bone mineral density or content.79
130
Dietary Guidelines for Children and Adolescents in Australia
3.4 I NCLUDE
MILKS , YOGHURTS , CHEESES AND / OR ALTERNATIVES
In Australia the calcium requirement has been used to estimate the
recommended dietary intake, which is traditionally set to meet the requirements
of the majority of the population.80 The NHMRC’s current recommended intake of
dietary calcium, which was set over a decade ago, in 1991, increases from
700 milligrams a day in 1–3 year old boys, to 800mg/day in boys aged 4–11
years, 1200mg/day in boys aged 12–15 years and 1000mg/day in boys aged 16–
18 years. For girls, the recommended intakes are set at 700mg/day at 1–3 years
of age, 800mg/day at 4–7 years, 900mg/day at 8–11 years, 1000mg/day at 12–15
years and 800mg/day at 16–18 years.
The continuing revision of the US recommended dietary allowances, or RDAs, is
being undertaken by a group of committees under the auspices of the Institute of
Medicine.73 A new multi-stage form of expression for the recommendations is
being used, similar to that first used in the United Kingdom in the early 1990s.81
This includes an evidence-based determination of an ‘estimated average
requirement’, or EAR, for individuals, the mean and variance of which is used to
derive the more familiar recommended dietary allowance for individuals (RDA =
EAR + 2SDEAR).
The committee assessing calcium concluded that there was insufficient evidence
to establish an evidence-based estimated average requirement for calcium, for
any age or gender group. As a result, it did not produce recommended dietary
allowances for calcium but instead estimated what it called an ‘adequate intake’
(AI) figure for each age and gender group. An AI for a nutrient is set as an
alternative to the RDA where the data are considered insufficient (or not certain
enough) to develop a reliable variance estimate for the population. The AI is
believed to cover the needs of most people in the population, although the
percentage of the population covered by this recommended intake level cannot
be specified with confidence.
The AI for calcium for infants aged to 6 months was set at 210 milligrams a day;
for infants aged 7–12 months it was set at 270mg/day, for children aged 1–3
years it was 500mg/day, and for children aged 4–8 years it was 800mg/day. For
both boys and girls aged 9–18 years the AI was set at 1300mg/day, a figure
considerably higher than the current Australian recommended dietary intake, set
in 1991.
One group in Australia that may need to pay particular attention to calcium
requirements is recent migrants from countries where the background diet is
traditionally lower in protein and salt than in Australia and where everyday
physical activity may be greater—for example, some Asian countries. If these
migrants and their children adopt Australian dietary and lifestyle patterns, their
calcium requirement will increase. This group may be at particular risk of
developing osteoporosis in the future.
Dietary Guidelines for Children and Adolescents in Australia
131
3.4 I NCLUDE
MILKS , YOGHURTS , CHEESES AND / OR ALTERNATIVES
Current intakes of calcium and other nutrients
The National Nutrition Survey found that the mean daily intake of calcium in 2–3
year olds was 834 milligrams; from this, the intake fell to 769mg at age 4–7
years, then rose to 868mg at age 8–11 years, 943mg at 12–15 years and 1047mg
at 16–18 years. There was, however, a large differential in the intakes of boys
and girls, particularly in adolescence, when girls’ intake was about two-thirds
that of boys. Milk products and dishes provided two-thirds of the calcium intake
of children and adolescents; milk itself provided about 43 per cent of the intake
in 2–11 year olds and 35 per cent in adolescents.
In addition, the National Nutrition Survey found that, apart from their role as a
source of calcium, milk products and dishes provided some 18 per cent of
dietary energy in children aged 2–11 years and 15 per cent in adolescents,
25 per cent of protein in children and 19 per cent in adolescents, 28 per cent of
vitamin A in children and 21 per cent in adolescents, 41 per cent of riboflavin
(vitamin B2) in children and 35 per cent in adolescents, 52 per cent of vitamin
B12 in children and 45 per cent in adolescents82 and 24 per cent of zinc in
children and 18 per cent in adolescents.
The importance of protein, zinc and vitamin B12 in the diet is discussed in more
detail in relation to Section 3.3. Retinol is the preformed form of vitamin A; it is
found only in foods of animal origin, although beta-carotene from plant sources
can be converted in the body to retinol. It is essential for maintaining epithelial
integrity: deficiency can lead to a variety of eye conditions, ranging from
inability to see in dim light to conditions causing blindness. Riboflavin is a B
vitamin that is important in cell respiration. Deficiency can lead to oedema of the
pharynx and oral mucosa, cheliosis, glossitis, angular stomatitis, conjunctivitis,
corneal vascularisation and some forms of anaemia. Deficiency has been
documented in both industrialised and developing nations and across varying
demographic groups.83,84
The National Nutrition Survey found that on the day of the survey the ‘milk
products and dishes’ category accounted for 26 per cent of total fat in children’s
diets and 22 per cent in adolescents, as well as 38 per cent of saturated fat in
children and 33 per cent in adolescents, emphasising the need to promote the
low- or reduced-fat varieties. Dairy milk itself provided some 14 per cent of total
fat for children and 21 per cent of their saturated fat; for adolescents it provided
9 per cent of total fat and 14 per cent of saturated fat. Cheeses provided 5 per
cent of total fat and 6–7 per cent of saturated fat in both children and
adolescents. Section 3.6 provides more information on dietary fats and their
health effects.
132
Dietary Guidelines for Children and Adolescents in Australia
3.4 I NCLUDE
MILKS , YOGHURTS , CHEESES AND / OR ALTERNATIVES
Special groups
Adolescent girls
Because of the importance of attaining a good peak bone mass, it is essential
that intakes of calcium in adolescence are maintained. As already noted,
however, data from the 1995 National Nutrition Survey show that substantial
numbers of adolescent girls consumed less than one serving of calcium on the
day of the survey; this compares with a recommendation of three to five servings
for adolescents.
Vegetarians
Vegetarian children and adolescents who do not drink milk or consume calciumfortified soy products should seek advice about whether they need to take
calcium supplements. Adherence to a vegetarian diet can influence calcium
needs because of the diet’s relatively high oxalate and phytate content. Recent
short-term studies have, however, indicated that isoflavone-rich soy protein may
have a beneficial effect in terms of bone loss.85 More research is needed in this
area to establish whether there are in fact any long-term benefits for bone health
in humans. On balance, lacto-ovo-vegetarians appear to have calcium intakes
similar to those of omnivores86–88 and similar urinary excretion.89,90 One five-year
study in post-menopausal lacto-ovo-vegetarians and omnivores with similar
calcium intakes showed that these groups lost radius bone mineral density at
similar rates.88 Data on the bone health of strict vegetarians are not available.
Children and adolescents with lactose intolerance
Lactose intolerance is high in Asian communities (at 80–90 per cent) but
relatively low in Caucasians (at 10–20 per cent). A 1994 review found limited
data available on the extent of lactose intolerance in Australians.91 At that time,
most studies of adult Caucasians showed a rate of 17–20 per cent for lactose
maldigestion, with one study showing a rate of only 4 per cent. Data for
Aboriginal adults showed rates of 80 per cent or more; for Asian-Australian
adults the figure was 80–90 per cent. For children, figures of 3–9 per cent were
obtained for Caucasians, 50–90 per cent for various studies in Aboriginal
children, and about 50 per cent for children of Mediterranean background. Study
numbers for both adults and children were, however, generally very limited.
Small amounts of milk or dairy foods can often be tolerated by people with
lactose intolerance, but lactose-free dairy products are available now. Lactoseintolerant people often avoid milk products, although this may not be necessary.
Fortified soy milks can also be used for people with lactose intolerance.
Adolescent girls with amenorrhea
Amenorrhea resulting from anorexia is associated with lowered calcium
absorption, higher urinary calcium excretion, and a lower rate of bone
formation.92 Exercise-induced amenorrhea results in reduced calcium retention
and lower bone mass.93,94
Dietary Guidelines for Children and Adolescents in Australia
133
3.4 I NCLUDE
MILKS , YOGHURTS , CHEESES AND / OR ALTERNATIVES
PRACTIC AL
ASPECTS OF THIS GUIDELINE
As noted, although milk foods are rich in calcium, they are also high in saturated
fat, so it is recommended that reduced-fat varieties and reduced-fat alternatives
be encouraged for older children and adolescents. In the case of children aged
less than 2 years, reduced- or low-fat milk is not recommended: milk usually
forms a much higher proportion of their diet and is a major energy source during
this period of rapid growth. As the child grows older and relies less heavily on
milk as a source of energy and nutrients, reduced-fat varieties can be introduced,
as appropriate.
A variety of calcium-enriched milks that are low in fat are readily available. Lowand reduced-fat yoghurts and cheeses are also available, but low-fat soft cheeses
such as cottage cheese and ricotta have very little calcium and cannot be
counted as a ‘serving’, even though they may add variety to a low-fat diet.
Low-lactose milks and milk products are now available for people with lactose
intolerance. However, children and adolescents who are lactose intolerant can
usually consume a sufficient amount of milk, yoghurt and cheese products
without developing significant symptoms. If children and adolescents do not
want to, or cannot, eat milk foods, the following are examples of what can be
substituted in terms of calcium equivalents:
•
a cup of calcium- (and vitamin B12–) fortified soy beverage containing
100 milligrams of calcium per 100 millilitres—non-fortified soy beverages
do not provide sufficient calcium
•
a cup of almonds—although not suitable for young children because of the
risk of choking
•
five sardines or half a cup of pink salmon (with bones)
•
a cup of calcium-fortified breakfast cereal.
Among other ways of encouraging calcium consumption are using milk or
calcium-fortified alternatives on breakfast cereals; offering milk-based desserts
(puddings, custards or yoghurts), adding skim-milk powder to mashed potatoes
and other vegetables; adding milk-based sauces to casseroles and pasta dishes;
sprinkling grated cheese on mashed potato, cauliflower, and other vegetables;
and substituting cheese spread or plain fromage frais for other fat spreads in
sandwiches and on dry biscuits, savoury muffins and toast.
R E L AT I O N S H I P
TO OT H E R G U I D E L I N E S
In the earlier dietary guidelines—for adults, children and older Australians—
there was one guideline dealing with variety in food choice and others
encouraging consumption of calcium-rich and iron-rich foods.
134
Dietary Guidelines for Children and Adolescents in Australia
3.4 I NCLUDE
MILKS , YOGHURTS , CHEESES AND / OR ALTERNATIVES
For this revision of the dietary guidelines, it was felt that the previous ‘variety’
guideline should be more closely linked to the Australian Guide to Healthy
Eating, which recommends daily consumption of a variety of foods from five
basic food groups:
•
vegetables and legumes
•
fruit
•
breads, cereals and grain
•
milk, yoghurt, cheese and alternatives
•
meats, fish, poultry and alternatives.
Guidelines on consumption of vegetables (including legumes) and fruit and of
breads, cereals and grains were included in earlier guidelines. In this revision,
guidelines are included for milks, yoghurts, cheeses and alternatives and for
meats, fish, poultry and alternatives. It was also felt that a food-based—rather
than a nutrient-based—approach to the guidelines would be more consistent
with international trends in the setting of dietary guidelines. As a consequence,
calcium-rich foods are included in the milks, yoghurts, cheeses and alternatives
guideline and iron-rich foods are included in the meat, fish, poultry and
alternatives guideline.
Physical activity is important for all children and adolescents
Regular weight-bearing exercise is an important factor in bone mineralisation.
Participation in regular physical activity from early childhood will contribute not
only to a healthy body weight but also to the attainment of peak bone mass.
Enjoy a wide variety of nutritious foods
Milks, yoghurts, cheeses and alternatives are recommended as part of a varied
diet to achieve the balance of nutrients required for optimal health. The
NHMRC’s core food group analysis10 confirms a central role for these foods in the
Australian diet in this context. As noted, the Australian Guide to Healthy Eating
includes the milk group as one of its five core food groups.9
Limit saturated fat and moderate total fat intake
The 1995 National Nutrition Survey3 found that milk products and dishes
contributed some 17 per cent of total fat and 27 per cent of saturated fat to the
diet. But these foods are valuable sources of other nutrients, so it is appropriate
to choose low- or reduced-fat varieties rather than reducing overall intake in
order to limit fat intake. Serves of full-fat cheeses should be limited to three or
four times a week. Children under 2 years of age should not be given reducedor low-fat milks.
Dietary Guidelines for Children and Adolescents in Australia
135
3.4 I NCLUDE
MILKS , YOGHURTS , CHEESES AND / OR ALTERNATIVES
Choose foods low in salt
There is evidence that high intakes of sodium increase urinary calcium loss.
Conservation of calcium is thus an additional reason for following the salt
guideline. This is more important for older people, whose ability to absorb
dietary calcium may be impaired.
CONCLUSION
The health costs associated with hospital admissions for osteoporotic fractures
are high in Australia. An adequate intake of calcium during childhood and
adolescence will help attain peak bone mass and delay bone loss and the onset
of osteoporosis, consequently reducing the number of related fractures in older
people. Milk, yoghurt and cheeses are the most reliable sources of calcium and
are readily available and convenient to use. They are also valuable sources of
protein, riboflavin, vitamin A, vitamin B12 and zinc. If foods that are high in
calcium are part of children’s and adolescents’ daily diet, the physiological,
financial and social costs associated with a low-calcium diet will be reduced.
EVIDENCE
The scientific rationale for this guideline is based on a variety of evidence
sources, among them the following:
•
meta-analyses of randomised controlled trials (Level I evidence) relating
calcium supplementation to bone density (reference 46)
•
well-designed, individual randomised controlled trials (Level II evidence)
relating calcium supplementation to bone loss and bone density or fracture
(references 34 to 40, 42 to 45 and 48 to 50)
•
Level III evidence—a meta-analysis of case-control and cohort studies
relating calcium intake to bone mass (reference 41) and a longitudinal
study relating sodium and calcium and bone density (reference 75).
Evidence was also obtained from a number of cross-sectional and population
studies, as well as human experimentation relating to bioavailability and nutrient
requirements and intakes.
REFERENCES
1.
Geelhoed EA, Criddle A, Prince RL. The epidemiology of osteoporotic
fracture and its causative factors. Clin Biochem Rev 1994;15:173–8.
2.
World Health Organization. Assessment of fracture risk and its application
to screening for postmenopausal osteoporosis. Technical Report Series no.
843. Geneva: WHO, 1994.
136
Dietary Guidelines for Children and Adolescents in Australia
3.4 I NCLUDE
MILKS , YOGHURTS , CHEESES AND / OR ALTERNATIVES
3.
Australian Bureau of Statistics. National Nutrition Survey: nutrient intakes
and physical measurements, Australia, 1995. Cat. no. 4805.0. Canberra:
ABS, 1998.
4.
Heaney RP. Nutrition and risk for osteoporosis. In: Marcus R, Feldman D,
Kelsey J, eds. Osteoporosis. San Diego: Academic Press, 1996:483–509.
5.
Lord SR, Sinnett PF. Femoral neck fractures: admissions, bed use, outcome
and projections. Med J Aust 1986;145:493–6.
6.
Eisman JA. Symptomatic fracture incidence in elderly men and women: the
Dubbo Osteoporosis Epidemiology Study (DOES). Osteoporosis Int
1994;4:277–82.
7.
Marottoli RA, Berkman LF, Cooney LM. Decline in physical function
following hip fracture. J Am Geriatr Soc 1992;40:861–6.
8.
Access Economics. The burden of brittle bones: costing osteoporosis in
Australia. Report prepared for Osteoporosis Australia. Canberra: Access
Economics, 2001.
9.
Children’s Health Development Foundation & Deakin University. The
Australian guide to healthy eating. Canberra: AGPS, 1998.
10.
Cashel K, Jefferson S. The core food groups: scientific basis for developing
nutrition education tools. Canberra: AGPS, 1995.
11.
ANZFA. Australian Food and Nutrient Database 1999. Canberra 1999.
12.
Peacock M. Calcium absorption efficiency and calcium requirements in
children and adolescents. Am J Clin Nutr 1991;54(suppl.)261S–265S.
13.
Zhu K, Greenfield H, Du X, Fraser D. Improvement of bone health in
childhood and adolescence. Nutr Res Rev 2001;14:119–51.
14.
Nordin BEC, Horseman A, Marshall DH, Simpson M, Waterhouse GM.
Calcium requirement and calcium therapy. Clin Orthop 1979;140:216–46.
15.
Johnston CC Jr, Miller JZ, Slemenda CW, Reister TK, Hui S, Christian JC et
al. Calcium supplementation and increases in bone mineral density in
children. N Eng J Med 1992;327:82–7.
16.
Slemender CW, Peacock M, Hui S, Zhou IO, Johnston CC. Reduced rates of
skeletal remodelling are associated with increased bone mineral density
during the development of peak skeletal mass. J Bone Miner Res
1997;12:676–82.
17.
Lee WT, Leung SS, Wang SH, Xu YC, Zeng WP, Lau J et al. Double blind
controlled calcium supplementation and bone mineral accretion in children
accustomed to a low calcium diet. Am J Clin Nutr 1994;60:744–50.
18.
Lee WT, Leung SS, Leung DM, Cheng JC. Follow up study on the effects of
calcium supplement withdrawal and puberty on bone acquisition of
children. Am J Clin Nutr 1996;64:671–7.
Dietary Guidelines for Children and Adolescents in Australia
137
3.4 I NCLUDE
MILKS , YOGHURTS , CHEESES AND / OR ALTERNATIVES
19.
Lloyd T, Andon MB, Rollings N, Martel JK, Landis JR, Demers LM et al.
Calcium supplementation and bone mineral density in adolescent girls. J
Am Med Assoc 1993;270:841–4.
20.
Chan GM, Hoffman K, McMurray M. Effects of dairy products on bone and
body composition in pubertal girls. J Pediatr 1995;126:527–56.
21.
Fehily AM, Coles RJ, Evans WD, Elwood PC. Factors affecting bone density
in young adults. Am J Clin Nutr 1992;.56:579–86.
22.
Halioua I, Anderson JJ. Lifetime calcium intake and physical activity habits:
interdependent and combined effects on the radial bone of healthy
premenopausal Caucasian women. Am J Clin Nutr 1989;49:534–41.
23.
Matkovic V, Jelic T, Wardlaw GM, Ilich JZ, Goel PK, Wright JK et al. Timing
of peak bone mass in Caucasian females and its implications for the
prevention of osteoporosis J Clin Invest 1994;93:799–808.
24.
Nieves JW, Golden AL, Sirs E, Kelsey JL, Lindsay R. Teenage and current
calcium intake are related to bone mineral density of the hip and forearm
in women aged 30–39 years. Am J Epid 1995;141:342–51.
25.
Sandler RB, Slemenda CW, LaPorte RE, Cauley JA, Schramm MM, Barresi
ML et al. Postmenopausal bone density and milk consumption in childhood
and adolescence Am J Clin Nutr 1985;42:270–4.
26.
Sentipal JM, Wardlaw GM, Mahan J, Matkovic V. Influence of calcium
intake and growth indexes on vertebral bone mineral density in young
females Am J Clin Nutr 1991;54:425–8.
27.
Fehily AM, Coles RJ, Evans WD, Elwood PC. Factors affecting bone density
in young adults. Am J Clin Nutr 1992;56:579–86.
28.
Turner JG, Gilchrist NL,Ayling AM, Hooke EA, Sadler WA. Factors affecting
bone mineral density in high school girls NZ Med J 1992:105Z:95–6.
29.
Rubin K, Schuirduan V, Gendreau P, Sarfarazi M, Mendola R, Dalsky J.
Predictors of axial and peripheral bone mineral density in healthy children
and adolescents, with special attention to the role of puberty. J Pediatrics
1993;123:863–70.
30.
Gunnes M. Bone mineral density in the cortical and trabecular distal forearm
in healthy children and adolescents Acta Paediatrica 1994;83:463–7.
31.
Ruiz JC, Mandel C, Gartabedian M. Influence of spontaneous calcium
intake and physical exercise on the vertebral and femoral bone mineral
density of children and adolescents. J Bone Min Res 1995;10:675–82.
32.
Pettifor HM, Moodley JP. Appendicular bone mass in children with a high
prevalence of low dietary calcium intakes J Bone Min Res 1997;12;1824–32.
33.
Illich JZ, Skuger M, Hangartner T, Baoshe A, Matkovic V. Relation of
nutrition, body composition and physical activity to skeletal development:
a cross-sectional study in preadolescent females. J Am Coll Nutr
1998;17:136–47.
138
Dietary Guidelines for Children and Adolescents in Australia
3.4 I NCLUDE
MILKS , YOGHURTS , CHEESES AND / OR ALTERNATIVES
34.
Kristinsson Jo, Valdimarsson O, Sigurdsson G, Franzson L, Olafson I,
Steingrimsdottir L. Serum 25-hydroxyvitamin D levels and bone mineral
density in 16–20 year old girls: lack of association. J Int Med 1998;243:381–8.
35.
Kardinaal A, Ando S, Charles P, Charzewska J et al. Dairy calcium and
bone density in adolescent girls and young women in Europe. J Bone Min
Res 1999;14:583–92.
36.
Kardinaal A, Ando S, Charles P, Charzewska J, Rotily M, Vaanenen K et al.
Determinants of bone mass and bone geometry in adolescent and young
adult women Cal Tiss Int 2000;66:81–9.
37.
Glastre C, Braillon P, David L, Cochat P, Meunier PJ, Delmas PD et al.
Measurement of bone mineral content of the lumbar spine by dual energy
X ray absorbtiometry in normal children: correlations with growth
parameters. J Clin Endo Metab 1990;70:1330–3.
38.
Katzman DK, Bachrach LK, Carter DR, Marcus R. Clinical and
anthropometric correlates of bone mineral acquisition in healthy
adolescent girls. J Clin Endo Metab 1991;73:1332–9.
39.
Lonzer MD, Imrie R, Rogers D, Worley D, Licata A, Secic M. Effects of
heredity, age, weight, puberty, activity and calcium intake on bone
mineral density in children. Clin Pediatrics 1996;35:185–9.
40.
Uusi-Rasi K, Haapasalo H, Kanmus P, Pasanen M, Sievanen H, Oja P et al.
Determinants of bone mineralization in 8–20 year old Finnish females.
Europ J Clin Nutr 1997;51:54–9.
41.
Bonofiglio D, Maggiolini M, Catalano S, Marsic S, Aquilina S et al.
Parathyroid hormone is elevated but bone markers and density are normal
in young female subjects who consume inadequate dietary calcium Br J
Nutr 2000;84:111–16.
42.
Matkovic V, Heaney RP. Calcium balance during human growth: evidence
for threshold behaviour. J Clin Nut 1992;55:992–6.
43.
Welken DC, Kemper HC, Post GB, van Staveren,W. A meta-analysis of the
effect of calcium intake on bone mass in young and middle-aged females
and males. J Nutr 1995;125(11):2802–13.
44.
Goulding A, Cannan R, Williams SM, Gould EJ, Taylor RW, Lewis-Barned
NJ. Bone mineral density in girls with forearm fractures. J Bone Res
1998;13:143–8.
45.
Prince R, Devine A, Dick I, Criddle A, Kerr D, Kent N et al. The effects of
calcium supplementation (milk powder or tablets) and exercise on bone
density in postmenopausal women. J Bone Miner Res 1995;10:1068–75.
46.
Elders PJM, Lips P, Netelenbos JC, van Ginkel FC, Khoe E, van der Vijgh
WJF et al. Long-term effect of calcium supplementation on bone loss in
perimenopausal women. J Bone Miner Res 1994;9:963–70.
Dietary Guidelines for Children and Adolescents in Australia
139
3.4 I NCLUDE
MILKS , YOGHURTS , CHEESES AND / OR ALTERNATIVES
47.
Dawson-Hughes B, Dallal GE, Krall EA, Sadowski L, Sahyoun N,
Tannenbaum S. A controlled trial of the effect of calcium supplementation
on bone density in postmenopausal women. N Engl J Med 1990;323:878–83.
48.
Reid IR, Ames RW, Evans MC, Gamble GD, Sharpe SJ. Effect of calcium
supplementation on bone loss in postmenopausal women. N Engl J Med
1993;328:460–4.
49.
Mackerras D, Lumley T. First and second year effects in trials of calcium
supplementation on loss of bone density in postmenopausal women. Bone
1997;21(6):527–33.
50.
Chapuy MC, Arlot ME, Dubeoeuf F, Brun J, Crouzet B, Arnaud S et al.
Vitamin D and calcium to prevent hip fractures in elderly women. N Engl J
Med 1992;327:1637–42.
51.
Reid IR, Ames RW, Evans MC, Gamble GD, Sharpe SJ. Long-term effects of
calcium supplementation on bone loss and fractures in postmenopausal
women: a randomized controlled trial. Am J Med 1995;98:331–5.
52.
Chevalley T, Rozzoli R, Nydegger V, Slossman D, Rapin CH, Michel JP et
al. Effects of calcium supplements on femoral bone mineral density and
vertebral fracture rate in vitamin-D-replete elderly patients. Osteopor Int
1994;4:245–52.
53.
Recker R, Hinders S, Davies KM, Heaney RP, Stegman MR, Lappe JM et al.
Correcting calcium nutritional deficiency prevents spine fractures in elderly
women. J Bone Min Res 1996;11:1961–6.
54.
Cumming RG, Nevitt MC. Calcium for prevention of osteoporotic fracture
in postmenopausal women. J Bone Min Res 1987;12(9):1321–9.
55.
Stracke H, Renner E, Knie G, Leidig G, Minne H, Federlin K. Osteoporosis
and bone metabolic parameters in dependent upon calcium intake through
milk and milk products. Europ J Clin Nutr 1993;47:617–22.
56.
Murphy S, Khaw KT, May H, Compston JE. Milk consumption and bone
mineral density in middle aged and elderly women. Br Med J
1994;308:939–41.
57.
Renner E. Dairy calcium, bone metabolism and prevention of osteoporosis.
J Dairy Res 1994;77:3489–505.
58.
New SA, Bolton-Smith C, Grubb D, Reid D. Nutritional influences on bone
mineral density; a cross-sectional study in premenopausal women. Am J
Clin Nutr 1997;65:1831–9.
59.
Teegarden D, Lylke RM, Proulx W, Johnston C, Weaver C. Previous milk
consumption is associated with greater bone density in young women. Am
J Clin Nutr 1999;69:1014–17.
60.
Ulrich CM, Georgiou CC, Snow-Harter CM, Gillis DE. Bone mineral density
in mother–daughter pairs: relations to lifetime exercise, lifetime milk
consumption and calcium supplements. Am J Clin Nutr 1996;63:72–9.
140
Dietary Guidelines for Children and Adolescents in Australia
3.4 I NCLUDE
MILKS , YOGHURTS , CHEESES AND / OR ALTERNATIVES
61.
Du X, Greenfield H, Fraser DR, Ge KY. Food intake and bone mineral
status of Beijing adolescent girls. Proc Nut Soc Aust 1998;57:125A.
62.
Heaney RP, Weaver CM, Fitzsimmons ML. Soybean phytate: content effect
on calcium absoption. Am J Clin Nutr 1991;53:745–7.
63.
Heaney RP, Recker RR, Stegman MR, Moy AJ. Calcium absorption in
women: relationship to calcium intake, oestrogen status and age. J Bone
Min Res 1989;4:469–75.
64.
Heaney RP, Recker RR, Weaver CM. Absorbability of calcium sources: the
limited role of solubility. Calcif Tissue Int 1990;46:300–4.
65.
Miller JZ, Smith DL, Flora L, Slenda C, Jiang X, Johnston CC. Calcium
absorption from calcium carbonate and a new form of calcium in healthy
male and female adolescents. Am J Clin Nutr 1988;138:225–36.
66.
Smith KT, Heaney RP, Flora L, Hinders SM. Calcium absorption from a new
calcium delivery system. Calcif Tissue Int 1987;41:351–2.
67.
Heaney RP, Saville PD, Recker RR. Calcium absorption as a function of
calcium intake. J Lab Clin Med 1975;85:881–90.
68.
Heaney RP, Recker RR, Hinders SM. Variability of calcium absorption. Am J
Clin Nutr 1988;47:262–4.
69.
Frost HM. The mechanostat: a proposed pathogenic mechanism of
osteoporosis and the bone mass effects of mechanical and nonmechanical
agents. Bone Min 1987;2:73–85.
70.
LeBlanc A, Schneider V, Spector E, Evans H, Rowe R, Lane H et al.
Calcium absorption, endogenous excretion, and endocrine changes during
and after long bed rest. Bone 1995;16:301S–304S.
71.
Slemenda CW, Reister TK, Hui SL, Miller JZ, Christian JC, Johnston CC.
Influences on skeletal mineralisation in children and adolescents: evidence
for varying effect of sexual maturation and physical activity. J Paediat
1994;125:201–7.
72.
Specker BL. Evidence for an interaction between calcium intake and
physical activity on changes in bone mineral density. J Bone Min Res
1996;11:1539–44.
73.
Institute of Medicine. Dietary reference intakes for calcium, phosphorus,
magnesium, vitamin D and fluoride. Washington, DC: National Academy
Press, 1997.
74.
Nordin BEC, Polley KJ. Metabolic consequences of the menopause: a crosssectional, longitudinal and intervention study on 557 normal
postmenopausal women. Calcif Tissue Int 1987;41:S1–S59.
75.
Matkovic V, Illich JZ, Andon MB, Hseih LC, Tzagournis MA, Lagger BJ et
al. Urinary calcium, sodium, and bone mass of young females. Am J Clin
Nutr 1995;62:417–25.
Dietary Guidelines for Children and Adolescents in Australia
141
3.4 I NCLUDE
MILKS , YOGHURTS , CHEESES AND / OR ALTERNATIVES
76.
O’Brien KO, Abrams SA, Stuff JE, Liang LK, Welch TR. Variables related to
urinary calcium excretion in young girls. J Paed Gastro Nutr 1996;23:8–12.
77.
Devine A, Criddle RA, Dick IM, Kerr DA, Prince RL. A longitudinal study of
the effect of sodium and calcium intakes on regional bone density in
postmenopausal women. Am J Clin Nutr 1995;62:740–5.
78.
Walker RM, Linkswiler HM. Calcium retention in the adult human male is
affected by protein intake. J Nutr 1972;102:1297–1302.
79.
Bullmore JR, Gallagher JC, Wilkinson R, Nordin BEC. Effect of age on
calcium absorption. Lancet 1970;2:535–7.
80.
National Health and Medical Research Council. Recommended dietary
intakes for use in Australia. Canberra: AGPS, 1991.
81.
Committee on Medical Aspects of Food and Nutrition Policy. Dietary
reference values for food energy and nutrients for the United Kingdom:
report of the panel on dietary reference values. London: HMSO, 1991.
82.
Cobiac L, Record S, Syrette J. Dairy foods in the Australian diet: results
from the 1995/6 National Nutrition Survey. Adelaide: CSIRO, 1999.
83.
Komindr S, Nichoalds GE. Clinical significance of riboflavin deficiency. In:
Brewster MA, Naito HK, eds. Nutritional elements and clinical
biochemistry. New York: Plenum Press, 1980;15–68.
84.
Nichoaulds GE. Riboflavin. In: Labbae RF, ed. Symposium on laboratory
assessment of nutritional status clinics in laboratory medicine series. Vol.
1. Philadelphia: WB Saunders, 1981:685–98.
85.
Alekel DL, Germain AS, Peterson CT, Hanson KB, Stewart JW, Toda T.
Isoflavone-rich soy protein isolate attenuates bone loss in the lumbar spine
of perimenopausal women. Am J Clin Nutr 2000;72(3):844–52.
86.
Marsh AG, Sanchez TV, Midkelsen O, Keiser J, Mayor G. Cortical bone
density in adult lacto-ovo-vegetarian and omnivorous women. J Am Diet
Assoc 1980;76:148–51.
87.
Pedersen AB, Bartholomew MJ, Dolence IA, Aljadir LP, Netteburg KL, Lloyd
T. Menstrual differences due to vegetarian and nonvegetarian diets. Am J
Clin Nutr 1991;53:879–85.
88.
Reed JA, Anderson JJ, Tylavsky FA, Gallagher PN. Comparative changes in
radial bone density of elderly female lacto-ovo-vegetarians and omnivores.
Am J Clin Nutr 1994;59:1197S–1202S.
89.
Lloyd T, Schaeffer JM, Walker MA, Demers LM. Urinary hormonal
concentrations and spinal bone densities of premenopausal vegetarian and
non vegetarian women. Am J Clin Nutr 1991;54:1005–10.
90.
Tesar R, Notelowitz M, Shim E, Kauwell G, Brown J. Axial and peripheral
bone density and nutrient intakes of postmenopausal vegetarian and
omnivorous women. Am J Clin Nutr 1992;56:699–704.
142
Dietary Guidelines for Children and Adolescents in Australia
3.4 I NCLUDE
MILKS , YOGHURTS , CHEESES AND / OR ALTERNATIVES
91.
Cobiac L. Lactose: a review of intakes and of importance to health of
Australians and New Zealanders. Food Australia 1994;46(7)(suppl.):S1–S28.
92.
Abrams SA, Silber TJ, Esteban NV, Vierira NE, Stuff JE, Meyers R et al.
Mineral balance and bone turnover in adolescents with anorexia nervosa. J
Paediat 1993;123:326–31.
93.
Drinkwater B, Bruemner B, Chestnut C. Menstrual history as a determinant
of current bone density in young athletes. JAMA 1990;263:545–8.
94.
Marcus RT, Cann C, Madvig P, Minkoff J, Goddard M, Bayer M et al.
Menstrual function and bone mass in elite women distance runners:
endocrine and metabolic features. Ann Intern Med 1985;102:158–63.
Dietary Guidelines for Children and Adolescents in Australia
143
3.5 C HOOSE
3.5
WATER AS A DRINK
C H O O S E WAT E R A S A D R I N K
Alcohol is not recommended for children
K i r s t i M c Va y a n d S u e J e f f r e s o n
B AC K G RO U N D
Water is an essential nutrient for life. All biochemical reactions occur in it. It fills
the spaces in and between cells and helps form structures of large molecules
such as protein and glycogen. Water is also required for digestion, absorption
and transportation and as a solvent for nutrients, and for elimination of waste
products and thermoregulation.
Fluid requirements depend on body size. In the Australian climate very young
children (and older adults are at particular risk of dehydration. Solid foods
contribute some water; an additional amount comes from the water produced by
the body’s metabolism (water of oxidation). The remainder needs to come from
free water or other fluids, or both.
A balance between fluid intake and output is essential for effective body
function and for the maintenance of good health. In the Australian climate,
children—particularly young children—are often at risk of dehydration. A child’s
fluid needs are best met by water and milk, although fruit juice in limited
quantities is good and can provide valuable nutrients. Excessive consumption of
fruit juice and soft drinks should be discouraged: these liquids have a high sugar
and energy content, which may displace other nutrients in the diet and
contribute to dental caries.
Beverage consumption among Australian children and adolescents
The 1995 National Nutrition Survey1,2, which used a 24-hour recall method,
collected information about food and beverage consumption from 13 858
respondents aged over 2 years. Table 3.5.1 shows the results for consumption of
beverages (excluding fluids consumed as ingredients of other foods) among
children and adolescents.
In all age groups from 2 to 18 years, mineral waters and water (mainly
consumed as plain drinking water) made the greatest contribution to fluid intake
and contributed at least 50 per cent to the mean daily intake of non-alcoholic
beverages. Consumption of other beverages varied by age. Milk consumption
was greatest in the 2–3 years age group, whereas soft drink consumption was
greatest in the 16–18 years group.
Dietary Guidelines for Children and Adolescents in Australia
145
3.5 C HOOSE
WATER AS A DRINK
Relatively high amounts of fruit and vegetable juices were consumed in all age
groups. Tea and coffee were not consumed in large amounts, although coffee
consumption increased markedly in the 16–18 years age group, as did alcohol
consumption.
Of the beverages consumed by Australian children and adolescents, milk made
the greatest contribution to energy intake—about 10 per cent on average in
children aged 2–11 years and 6–7 per cent in adolescents (see Table 3.5.2). Fruit
and vegetable juices contributed 4–6 per cent to energy intake, as did soft drinks
and mineral water for adolescents. Alcoholic beverages made a very small
contribution to energy intake in adolescents.
Table 3.5.1
Mean daily beverage intake (grams/person) of Australian
children and adolescents, 19952
Age group (years)
Beverage
2–3
(n=383)
4–7
(n=799)
8–11
(n=739)
Milk products
416.7
301.0
307.1
320.2
327.8
Dairy milk
388.0
277.7
283.3
293.3
288.9
Milk substitutes
16.5
3.7
4.3
1.5
–
Flavoured milk
12.2
19.6
19.5
25.4
38.9
808.5
976.9
1168.8
1457.9
1817.8
9.9
11.8
22.7
33.3
48.0
–
3.0
4.8
16.4
113.3
Fruit and veg. juices/drinks
285.8
312.8
278.0
298.6
278.0
Mineral waters and water
453.8
540.6
687.9
845.2
959.7
Soft drinks, flavoured mineral
water and electrolyte drinks
58.3
108.4
174.7
264.1
417.5
Non-alcoholic beverages
Tea
Coffee and coffee substitutes
12–16
(n=653)
Alcoholic beverages
16–18
(n=433)
115.5
Beers
–
–
–
–
83.5
Wines
–
–
–
–
14.6
Spirits
–
–
–
–
3.5
Other
–
–
–
–
13.9
– Zero.
146
Dietary Guidelines for Children and Adolescents in Australia
3.5 C HOOSE
Table 3.5.2
WATER AS A DRINK
Contribution of beverages to energy intake and intake of
selected nutrients in Australian children and adolescents, 19951
2–11 years
Nutrient
Males
%
12–18 years
Females
%
Males
%
Females
%
10.3
9.7
7.5
5.9
Fruit and vegetable juices/drinks
6.2
6.8
4.8
5.0
Soft drinksa
2.6
2.2
5.2
4.1
–
–
–
–
–
–
1.2
0.7
0.2
1.0
0.3
0.1
16.1
15.4
11.9
9.4
14.9
13.9
10.1
7.9
Dairy milk
11.4
10.7
9.5
7.5
Fruit and vegetable juices/drinks
22.2
23.9
18.4
18.5
9.8
8.1
20.6
16.2
44.1
42.5
38.4
31.6
48.8
47.1
36.9
48.0
17.0
15.0
11.4
7.4
Energy
Dairy milk
Alcoholic beverages
Beers
Wines
Protein
Dairy milk
Fat
Dairy milk
Total sugars
Soft drink
Calcium
Dairy milk
Vitamin C
Fruit and vegetable juices/drinks
Vitamin A
Dairy milk
– Zero.
a. Includes flavoured mineral water and electrolyte drinks.
Note: Only average contributions greater than 10% are listed for nutrients other than energy.
SCIENTIFIC
BASIS
Water is an essential nutrient for life. All biochemical reactions occur in it, and it
fills the spaces in and between cells and helps form the structures of large
molecules such as proteins and glycogen. Water is also required for digestion,
absorption and transportation and as a solvent for nutrients, elimination of waste
products and thermo-regulation.3
About 60 per cent of the adult human body is made up of water, and about 2.5
litres of water are needed each day to replace water lost from the body.
Dietary Guidelines for Children and Adolescents in Australia
147
3.5 C HOOSE
WATER AS A DRINK
Beverages are the main source of this water, although water is also obtained
from a range of other foods, such as fruit and vegetables.2
Water lost from the lungs and skin is responsible for half of the total water
turnover; the remainder is lost in urine and faeces. The normal daily turnover of
water is about 4 per cent of body weight in adults and 15 per cent in infants.
Dehydration is defined as a 1 to 2 per cent loss of body weight caused by fluid
losses. Among the factors contributing to dehydration are a poor thirst
mechanism, dissatisfaction with the taste of water, and increased fluid losses as a
result of alcohol and caffeine consumption, exercise, and environmental
conditions such as high altitude and low humidity.3
Infants are especially susceptible to dehydration because of the high proportion
of their body weight that is water, the high rate of turnover, their relatively large
surface area, and their poor thirst mechanism.3 Dehydration can occur in
formula-fed infants, particularly when over-concentrated formula has been used.
In breastfed infants, however, dehydration is rare—even in very hot weather—
provided that the infant has free access to breastfeeding.4
Children who are very physically active are more prone to dehydration than
adults because they have a relatively low circulating blood volume and a poor
thirst mechanism. Any fluids lost through perspiration should be promptly
replaced.5
Dehydration has been shown to link to a number of health outcomes such as
increased risk of kidney stones, increased risk of urinary tract and colon cancer,
diminished physical and mental performance as well as increased risk of
childhood obesity. Details of these studies are given in the accompanying
Dietary Guidelines for Australian Adults.
PRACTIC AL
ASPECTS OF THIS GUIDELINE
Different beverage types and their importance for the nutritional
health of children and adolescents
Water
Sports Medicine Australia6 has recommended that children consume 150–
200 millilitres (and adolescents 300–400ml) of fluid 45 minutes before exercise
and 75–100ml (and adolescents 150–200ml) each 20 minutes whilst exercising.
Although plain water is considered the most economical source of fluid,
flavoured drinks or sports drinks may be more palatable and facilitate fluid
replacement. A study by Meyer et al.7 found that sufficient fluid intake to offset
sweat losses in children aged 9 to 13 years occurred only when flavoured drinks
were ingested. The children in the study preferred grape- and orange-flavoured
drinks over apple flavour. The management of diarrhoeal disease—which is still
148
Dietary Guidelines for Children and Adolescents in Australia
3.5 C HOOSE
WATER AS A DRINK
a common cause of mortality and morbidity in children—has been revolutionised
by the use of oral rehydration fluids containing both water and electrolytes.
Guidelines have been developed to cover the safety and quality of drinking
water in Australia. The water must meet microbiological, physical, chemical and
radiological standards to ensure that it satisfies public health requirements. 8
Milk
Milk is an excellent source of many nutrients, particularly calcium, protein,
riboflavin and vitamin B129, Calcium-fortified soy beverages can be used as
alternatives to dairy milk. Dietary calcium is important for skeletal growth and in
the attainment of peak bone mass in adolescence.10 Attainment of a high peak
bone mass at skeletal maturity is considered the best protection against agerelated bone loss and fracture. Section 3.4 provides detailed information about
current intakes of dairy foods, calcium and other key nutrients in dairy foods and
about the importance of dietary calcium.
During the first year of life in non-breastfed infants, infant formula should be
given as the main source of milk. Cow’s milk is not recommended for infants.
Skim milk and reduced-fat milk should not be used for children aged less than
2 years because these children have higher energy requirements from fat.
Between the ages of 2 and 5 years, there is a gradual reduction in the energy
requirement from fat, so reduced-fat milks are suitable; skim milk should,
however, not be given (see Chapter 2 and Section 3.6). Section 3.6 discusses
recommended fat intakes during infancy, childhood and adolescence.
The Australian Guide to Healthy Eating9 recommends that children and
adolescents consume two to three servings daily from the dairy group. One glass
of milk (250ml) represents one serving.
Soft drinks
Soft drinks have minimal nutritional value and contain large amounts of sugar
and energy.11 They come within the ‘extra foods’ category, as defined in the
Australian Guide to Healthy Eating.9 ‘Extra foods’ should be consumed only
sometimes or in small amounts.
Trends in beverage consumption among children and adolescents over the past
few decades suggest that the consumption of soft drinks is increasing and may
be replacing more nutritious beverages such as milk and possibly fruit juices.12 In
the United States, 12–19 year old females have doubled, and males have tripled,
their consumption of soft drinks and have reduced their consumption of milk by
more than 40 per cent.
Consumption of cola beverages, in particular, has been associated with bone
fractures in physically active girls attending a US high school (mean age 15
years); this may be because of the high phosphoric acid content in cola drinks.13
In addition, caffeine increases the rate of elimination of calcium from the body.14
Dietary Guidelines for Children and Adolescents in Australia
149
3.5 C HOOSE
WATER AS A DRINK
A low ratio of calcium to phosphorus in the diet may adversely affect calcium
balance and increase the risk of bone fractures and osteoporosis in later life.15
A study by Harnack et al.12 found that energy intake was positively associated
with consumption of non-diet soft drinks in children and adolescents. This has
implications for childhood obesity. The authors also suggested that soft drinks
displace milk and fruit juice and the nutrients concentrated in these beverages.
The intake of some nutrients in milk (calcium, riboflavin, vitamin A and
phosphorus) and fruit juices (folate and vitamin C) tended to be lower among
adolescents in the highest category of soft drink consumption compared with
those in the lower categories.
Obesity rates have risen in conjunction with the increase in soft drink
consumption.11 A two-year prospective study of 548 school children (mean age
11.7 years) of diverse ethnic background suggested a positive relationship
between increased soft drink consumption and obesity. It is possible that the
additional energy obtained from drinks does not displace energy obtained from
solid foods at subsequent meals. The authors also showed that consumption of
diet soft drinks was inversely associated with obesity.16
Fruit juice
Fruit juice is an important part of the diet of young children.17 It is a good source
of vitamins such as vitamin C and folate and also provides carbohydrates,
particularly natural sugars. Some varieties of fruit juice contribute small amounts
of fibre.9 If fruit juice is consumed in excess, however, it can detract from a wellbalanced diet and/or lead to problems such as obesity18, failure to thrive19, dental
erosion20 and dental caries.21
Malabsorption of carbohydrate from juice can contribute to chronic non-specific
diarrhoea in children.22 The main carbohydrates present in fruit juice are
fructose, glucose and sorbitol. A higher ratio of fructose to glucose and the
presence of sorbitol in juice—compared with juices that lack sorbitol and contain
equal amounts of fructose and glucose—have been implicated in decreased
carbohydrate absorption. Apple juice contains less sorbitol and is better absorbed
than grape juice, despite a similar fructose–glucose relationship, suggesting that
sorbitol may be the most important component associated with malabsorption.17
Excess fruit juice consumption can lead to several outcomes depending on
whether the fruit juice displaces other foods or is consumed in addition to an
adequate diet. Excess fruit juice consumption has been associated with poor
appetite, poor weight gain and loose stools (the ‘squash-drinking syndrome’)22
and with failure to thrive in early childhood.19 The latter study (1994) suggests
that large intakes of apple juice—12–30 ounces a day (about 350–850ml)—may
displace foods that are more energy and nutrient dense and/or contribute to
malabsorption of carbohydrates or sugars. Both these factors could adversely
affect growth, contributing to the development of decreased weight or height, or
both. However, a more recent study did not find a higher prevalence of obesity
or stunted stature in children consuming 12 ounces or more of fruit juice daily.23
150
Dietary Guidelines for Children and Adolescents in Australia
3.5 C HOOSE
WATER AS A DRINK
In another study, excessive fruit juice consumption has been linked to obesity in
toddlers: 2-year-olds consuming excessive amounts of fruit juice (more than
350ml/day) were shown to have a higher energy intake, which was associated
with excessive weight gain.18
The Australian Guide to Healthy Eating9 recommends that children and
adolescents consume approximately two serves daily from the fruit group. Half a
cup of juice supplies one serve from this group. It is important to note, however,
that, because of their lower fibre content and their added sugars, fruit juices
should not be used as a substitute for fresh fruit.
Caffeine
Caffeine is a naturally occurring substance found in many plant species. It is
known to stimulate the central nervous system and at high doses can cause
nervousness, irritability, anxiety, and disturbances of heart rate and rhythm.
Effects on blood pressure, coronary circulation, urine production and secretion of
gastric acids have also been documented.24
Caffeine is found in beverages and foods such as tea, coffee, chocolate, colatype soft drinks and ‘energy drinks’. Coffee contains about three or four times as
much caffeine as an equal volume of cola soft drink. The main dietary source of
caffeine in Australian children aged 2–12 years is cola-type soft drinks; in
adolescents it is coffee. Cola soft drinks may contain added caffeine up to
145 milligrams per kilogram, or 54 milligrams per 375-millilitre can.24
A review of caffeine consumption found that mean daily caffeine consumption
among Australian children aged 10–15 years was 1.3 milligrams per kilogram of
body weight per day, of which 0.8mg was obtained from soft drinks.24 This is
well within the level of 95mg (3mg/kg/day) at which behavioural changes such
as decreased reaction times, increased motor activity and increased restlessness
have been observed in children aged 5–12 years. More recent studies have,
however, indicated that the earlier studies suffered from methodological
problems and used dose levels that were far greater than doses of caffeine
consumed by children. Overall, the evidence to suggest that caffeine has adverse
behavioural effects on children at current intake levels is inconclusive.24
Energy drinks
The term energy drinks refers to a group of non-alcoholic water-based beverages
characterised by the addition of ‘energy-enhancing’ ingredients. Among these
ingredients are a number of water-soluble B vitamins, amino acids and other
substances, and caffeine. Most energy drinks contain caffeine levels of up to
80mg/250ml, the equivalent of a strong cup of coffee.25
Energy drinks are a relatively new product in the marketplace in Australia,
although they are well established in Europe and the United States. Their
marketing is not directed specifically at children, but there is evidence that
younger consumers are becoming aware of the product and are attracted to it by
the image portrayed.25
Dietary Guidelines for Children and Adolescents in Australia
151
3.5 C HOOSE
WATER AS A DRINK
Current data on the consumption of energy drinks in Australia are limited. One
Australian survey assessed the prevalence of consumption during a two-week
period in 1999 but it did not record the quantities consumed or the frequency of
consumption.26 The survey found as follows:
•
Of the sample of 141 males and females aged 8–12 years, 27 per cent of
males and 12 per cent of females had consumed energy drinks.
•
Of the sample of 240 males and females aged 12–18 years, 24 per cent of
males and 20 per cent of females had consumed energy drinks.
Energy drinks are not considered suitable for children, primarily because of their
high caffeine content. At high consumption levels, caffeine and other biologically
active substances may exceed known safety levels in children.25
Drinks and dental health
Dental caries, or tooth decay, is the result of repeated acid attacks by bacteria in
dental plaque. Fermentable carbohydrates in food and drinks provide the
necessary substrate for acid production by bacteria. Acidic drinks such as citrusbased and other juices, carbonated and uncarbonated drinks, sports drinks and
herbal teas are likely to exacerbate dental erosion, particularly when associated
with habits such as slow sipping and swishing and swilling before swallowing,
which cause prolonged contact of acid with tooth surfaces.27,28 Drinking practices
that minimise beverages’ contact with the teeth—such as using a straw or
squeeze bottle and rapid ingestion—may be important in avoiding the potential
erosive effects of these beverages.28
Early childhood caries, a recognised problem in infants and toddlers, is
characterised by extensive and rapid tooth decay. Prolonged sessions of bottle
feeding in infants and toddlers are generally thought to provide the carbohydrate
substrate that enables high acid production by bacteria. Liquids containing
sucrose are the most cariogenic; the potential cariogenicity of milk and infant
formula is unclear.29 Infants and toddlers should therefore not be allowed
prolonged access, during the day or night, to a bottle containing anything other
than water.30
The relationship between optimal fluoride intake and improved dental health is
well established.31 Recent Australian data indicate that exposure to fluoridated
water during childhood confers significant benefits in preventing dental caries in
both deciduous and permanent teeth. There is no evidence of adverse health
effects caused by drinking fluoridated water at current optimal levels.32
Children and adolescents and alcohol
Alcohol is a powerful drug and is not recommended for children. Excessive,
long-term alcohol consumption is associated with a variety of adverse health
effects. Alcohol consumption among adolescents has increased, and more
adolescents are drinking at harmful levels. The National Alcohol Action Plan
152
Dietary Guidelines for Children and Adolescents in Australia
3.5 C HOOSE
WATER AS A DRINK
1999–2000 to 2002–03 identifies a range of strategies to help reduce alcoholrelated harm in high-risk groups, including young people.
The effect of alcohol on childhood and adolescent morbidity and mortality
Alcohol is high in energy—at 29 kilojoules per gram—but is deficient in
important nutrients such as vitamins and minerals.9 High alcohol consumption
can depress the appetite, displace other foods from the diet, and interfere with
digestion and absorption of nutrients, leading to nutritional deficiencies.33
Long-term alcohol consumption is associated with a variety of adverse health
consequences, among them cirrhosis of the liver, mental illness, cancer, obesity,
and foetal growth retardation. The acute and chronic effects of excess alcohol
consumption are described in Section 1.8 of the Dietary Guidelines for
Australian Adults. Among the adverse social effects related to excess alcohol
consumption are drink-driving injuries and fatalities, aggressive behaviour, family
disruption and reduced productivity.34
Children are more vulnerable to alcohol than adults for a variety of reasons.
Because of their smaller physique they metabolise alcohol more slowly. They
also lack experience of drinking alcohol and its effects and so have a lower
tolerance. This, coupled with increased risk-taking behaviour, can considerably
heighten the potential for harm associated with alcohol consumption in
adolescents.35
Young people, particularly females, are most likely to consume alcohol in a
hazardous and harmful way. In 1998 two-thirds of young women aged less than
25 years who drank alcohol reported consuming, on average, more than two
glasses a day.34 Regular and excessive alcohol consumption in the early months
of pregnancy can cause foetal alcohol syndrome, which results in intellectual and
physical irregularities in the foetus.34 If they are consuming alcohol, females
should also be aware of the possibility of drinks being contaminated with other
substances for the purpose of inducing stupor and should ensure that they are
not put at risk in social situations.
Alcohol consumption at all levels in younger age groups is associated with
increased mortality, predominantly through violence and accidental injury.34 It
has been estimated that, in people aged 15 to 34 years, 47 per cent of alcoholrelated deaths were the result of road injuries.36
Alcohol consumption is often associated with drug use; in these situations the
effects of the alcohol or other drug(s) can be exaggerated or moderated.34
Adolescents have reported that alcohol removes their inhibitions and alters their
judgment, increasing their likelihood of experimenting with other drugs.37 In
1998, 47 per cent of 14–19 year old recent drinkers also smoked marijuana; this
was the highest proportion across all age groups.38
Dietary Guidelines for Children and Adolescents in Australia
153
3.5 C HOOSE
WATER AS A DRINK
Young Australians’ alcohol consumption
Alcohol plays a fundamental role in adolescent culture and features strongly in
most social and recreational activities. Although levels of alcohol consumption
among Australian adults have decreased in the last 10 years, more young people
are drinking alcohol, drinking at an earlier age, and drinking at higher levels.35
The 1998 National Drug Strategy Household Survey found that over two-thirds of
adolescents aged 14–19 years were recent drinkers (that is, had consumed
alcohol in the past 12 months). Of these, 30 per cent were regular drinkers
(consumed alcohol at least once a week) and 41 per cent were occasional
drinkers (consumed alcohol less than weekly). More adolescent males (33 per
cent) than females (27 per cent) were regular drinkers.38
Adolescents do not necessarily view drunkenness as harmful and are the group
most likely to consume alcohol in a hazardous or harmful way or to deliberately
drink to the point of intoxication. Binge drinking is common among under-age
drinkers.37 In 1998 one in 10 teenagers who were regular drinkers drank more
than 12 standard drinks in a typical day, and this was more common among
males (14 per cent) than females (6 per cent).38
The type of alcohol consumed varies between males and females. In 1998,
among adolescent males the most popular alcoholic beverage was regular beer
(67 per cent), whilst bottled spirits were the beverage of choice for females
(63 per cent); low-alcohol beer was the least favoured beverage (9 per cent). 38
Influences on alcohol consumption
Peer-group norms are an important influence on the use of alcohol in
adolescence.37 Under-age adolescent drinkers are most commonly introduced to
their first alcoholic drink by a friend or acquaintance.38 Other factors contributing
to alcohol consumption during adolescence are the perceived benefits, such as
alcohol’s relaxant qualities, enjoyment, to gain confidence, to bond with a peer
or social group, to experiment, to lose control, and to get drunk.37
Family life in early childhood is believed to be an influential factor in the
establishment of alcohol misuse in later life. Among the risk factors are parents’
substance abuse, ineffective parenting, inconsistent or harsh discipline, lack of
support, and lack of mutual attachments and nurturing.34 Exposure to alcohol
before the age of 6 years and lax parental attitudes to alcohol may also increase
vulnerability to frequent heavy drinking in adolescence.39
Research has shown that, in cultures where alcohol is introduced to young
people in a supportive family setting, alcohol-related problems tend not to arise
in adolescence; this contrasts with countries where alcohol is officially not
available.35
Public health strategies
The National Alcohol Action Plan 1999–2000 to 2002–03 identifies key strategy
areas for helping to reduce alcohol-related harm.
154
Dietary Guidelines for Children and Adolescents in Australia
3.5 C HOOSE
WATER AS A DRINK
Young people are seen as one of a number of groups in the Australian
community who are at higher risk of harm caused by alcohol consumption. As a
result, young people drinking is the focus of a number of harm-minimisation
educational initiatives, such as the National Alcohol Campaign. The campaign
was developed through qualitative and quantitative research, involving detailed
examination of prevailing attitudes, perceptions and behaviours among
adolescents. Other National Alcohol Action Plan strategies that are directed at
young people are alcohol education programs in schools and tertiary institutions,
drink-driving campaigns, and the development of guidelines for ‘responsible’
drinking behaviour. The National Health and Medical Research Council has
recently reviewed the 1992 Responsible Drinking Guidelines35 to provide
population groups with up-to-date guidance on safe levels of alcohol
consumption.
Among the action plan’s other strategies for reducing alcohol-related harm in
adolescents are the use of identity cards providing proof of age; controlling the
price, availability and advertising of alcohol; labelling alcoholic beverages with
alcohol-content information; and devotion of resources to discouraging drinkdriving.34
R E L AT I O N S H I P
TO OT H E R G U I D E L I N E S
Children and adolescents need sufficient nutritious foods to grow and
develop normally
A balance of nutrients and energy is important for appropriate growth in children
and adolescents. Excessive consumption of soft drinks and fruit juice can
contribute significantly to energy intake and detract from a well-balanced diet,
leading to an increased risk of obesity or underweight.
Enjoy a wide variety of nutritious foods
Food contains water. A varied diet contributes to meeting water requirements in
children and adolescents.
Eat plenty of vegetables, legumes and fruits
Fruit juice should not be consumed as a substitute for fresh fruit. Fresh fruit is a
good source of dietary fibre and is of higher nutritional value than fruit juice.
Include milks, yoghurts, cheese and/or alternatives
Dairy foods and their alternatives (such as calcium-fortified soy drinks) are a rich
source of calcium, protein, riboflavin and vitamin B12. Calcium is important in the
attainment of peak bone mass during adolescence and in the prevention of
osteoporosis. Reduced-fat milks are not suitable for children aged less than
2 years.
Dietary Guidelines for Children and Adolescents in Australia
155
3.5 C HOOSE
WATER AS A DRINK
Limit saturated fat and moderate total fat intake
Cow’s milk is unsuitable for children aged less than 12 months. Skim milk and
reduced-fat milk should not be given to children aged less than 2 years; over
that age, reduced-fat milks are appropriate.
Consume only moderate amounts of sugars and foods containing
added sugars
Excessive consumption of sugar-sweetened beverages can contribute to obesity
and dental caries in children. Prolonged sucking from a bottle containing
carbohydrate-rich fluids is a possible risk factor for caries in infants and toddlers.
Flavoured carbohydrate drinks such as sports drinks may be more palatable and
promote higher fluid intakes in exercising children.
CONCLUSION
Adequate fluid consumption is an integral component of a healthy diet. Water is
a good source of fluids as it can hydrate without adding additional energy to the
diet. Nevertheless other drinks such as milks, fruit juices, low energy soft drinks
beverages can add variety and in some cases (eg milks and juices) can add
valuable nutrients to the diet. Intakes of fluids containing substantial amounts of
added sugars should be moderated. Alcohol is not suitable for children.
EVIDENCE
There is Level III evidence of the effect of hydration on thirst and on drink
preference (reference 7); of the effect of carbonated beverages on bone fracture
in adolescence (references 13 and 15); of a link between sugar-sweetened drinks
and childhood obesity (reference 16); and of excessive fruit juice consumption in
preschoolers compromising stature and obesity (reference 18) and causing failure
to thrive (references 19 and 22), although one recent study (reference 23)
showed no relationship to childhood growth.
Some of the other consequences of low fluid intakes have been studied primarily
in adults; the evidence for this is discussed in the Dietary Guidelines for
Australian Adults and the Dietary Guidelines for Older Australians. Evidence
relating to health effects of alcohol is discussed in the Dietary Guidelines for
Australian Adults.
REFERENCES
1.
Australian Bureau of Statistics & Department of Health and Aged Care.
National Nutrition Survey: nutrient intakes and physical measurements,
Australia, 1995, Canberra: ABS, 1998.
156
Dietary Guidelines for Children and Adolescents in Australia
3.5 C HOOSE
WATER AS A DRINK
2.
Australian Bureau of Statistics & Department of Health and Aged Care.
National Nutrition Survey: foods eaten, Australia, 1995. Canberra: ABS,
1999.
3.
Kleiner SM. Water: an essential but overlooked nutrient. JADA
1999;99(2):200–6.
4.
Brobribb W ed. Breastfeeding management in Australia, Melbourne:
Nursing Mothers Association of Australia, 1997.
5.
Watson AS. Children in sport. In: Bloomfield J, Fricker PA, Fitch KD eds.
Science and medicine in sport, 2nd edn. Melbourne: Blackwell Science,
1995:497.
6.
Sports Medicine Australia. Safety guidelines for children in sport and
recreation. Canberra: Sports Medicine Australia, 1997.
7.
Meyer F, Bar-Or O, Salsberg A, Passe D. Hypohydration during exercise in
children: effect on thirst, drink preferences and rehydration. Int J Sports
Nutr 1994;4:22–35.
8.
National Health and Medical Research Council & Agriculture and Resource
Management Council of Australia and New Zealand. Australian drinking
water guidelines. Canberra: AGPS, 1996.
9.
Department of Health and Family Services. The Australian guide to healthy
eating. Canberra: DHFS, 1998.
10.
Halioua L, Anderson JJ. Lifetime calcium intake and physical activity
habits: independent and combined effects on the radial bone of healthy
premenopausal Caucasian women. Am J Clin Nutr 1989;49:534–41.
11.
Jacobson MF. Liquid candy: how soft drinks are harming Americans’
health. Washington DC: Center for Sciences in the Public Interest, 1998.
12.
Harnack, L, Stang, J, Story, R. Soft drink consumption among US children
and adolescents: nutritional consequences. JADA 1999;99(4):436–41.
13.
Wyshak G. Teenaged girls, carbonated beverage consumption, and bone
fractures. Arch Pediatr Adolesc Med 2000;154:610–13.
14.
Smith PF, Smith A, Miners J, McNeil J, Proudfoot A. Report from the Expert
Working Group on the Safety Aspects of Dietary Caffeine. Canberra:
Australia New Zealand Food Authority, 2000.
15.
Wyshak G, Frisch RE. Carbonated beverages, dietary calcium, the dietary
calcium/phosphorus ratio, and bone fractures in girls and boys. J Adolesc
Hlth 1994;15:210–15.
16.
Ludwig DS, Peterson KE, Gortmaker SL. Relation between consumption of
sugar-sweetened drinks and childhood obesity: a prospective,
observational analysis. Lancet 2001;357:505–8.
17.
Nobigrot T, Chasalow FI, Lifshitz MD. Carbohydrate absorption from one
serving of fruit juice in young children: age and carbohydrate composition
effects. J Amer Coll Nutr 1997;16(2):152–8.
Dietary Guidelines for Children and Adolescents in Australia
157
3.5 C HOOSE
WATER AS A DRINK
18.
Dennison B, Rockwell HL, Baker SL. Excess fruit juice consumption by
preschool-aged children is associated with short stature and obesity.
Pediatrics 1997;99(1):15–22.
19.
Smith MM, Lifshitz F. Excess fruit juice consumption as a contributing
factor in nonorganic failure to thrive. Pediatrics 1994;93(3):438–43.
20.
O’Sullivan EA, Curzon MEJ. A comparison of acidic dietary factors in
children with and without dental erosion. J Dent Children 2000;67:187–92.
21.
Seow K. Biological mechanisms of early childhood caries. Comm Dent Oral
Epidem 1998;26(suppl. 1):8–27.
22.
Hourihane JO’B, Rolles CJ. Morbidity from excessive intake of high energy
fluids: the ‘squash drinking syndrome’. Arch Dis Child 1995;72:141–3.
23.
Skinner JD, Carruth BR, Moran J, Houck K, Coletta F. Fruit juice intake is
not related to children’s growth. Pediatrics 1999;103(1):58–64.
24.
Australia New Zealand Food Authority. Application A344—caffeine in nonalcoholic beverages: full assessment report and regulation impact
statement. Canberra: ANZFA, 1999.
25.
Australia New Zealand Food Authority. Application A394—formulated
caffeinated beverages: full assessment report and regulation impact
statement. Canberra: ANZFA, 2000.
26.
O’Dea J, Rawstone, P. Consumption of dietary supplements and energy
drinks by schoolchildren. Med J Aust 2000;173:389.
27.
Sank L. Dental nutrition. Nutr Issues Abs 1999;19:1–2.
28.
Murray R, Drummond B. Are there risks to dental health with frequent use
of carbohydrate foods and beverages? Aust J Nutr Diet
1996;53(suppl. 4):S47.
29.
Tinanoff N, O’Sullivan DM. Early childhood caries: overview and recent
findings. Pediatr Dent 1997;19:12–16.
30.
Whitney EN, Rolfes SR. Understanding nutrition, 7th edn. St Paul: West
Publishing Company, 1996:585.
31.
Wei, P. Diet and dental caries. Asia Pac J Clin Nutr 1995; 4(suppl. 1):S45–S50.
32.
Ahokas JT, Demos L, Donohue DC, Killalea S, McNeil J, Rix CJ. Review of
water fluoridation and fluoride intake from discretionary fluoride
supplements : report to NHMRC. Melbourne: Key Centre for Applied and
Nutritional Toxicology & Department of Applied Chemistry, RMIT, &
Department of Epidemiology and Preventive Medicine, Monash University,
1999.
33.
Lieber CS. Alcohol and nutrition. Alcohol Hlth Res Wld 1989;13(3):197–203.
34.
National Expert Advisory Committee on Alcohol. Alcohol in Australia:
issues and strategies. Consultation draft. Canberra: NEACA, 2000.
158
Dietary Guidelines for Children and Adolescents in Australia
3.5 C HOOSE
WATER AS A DRINK
35.
National Health and Medical Research Council. Australian alcohol
guidelines: health risks and benefits. Canberra: NHMRC, 2001.
36.
Australian Institute of Health and Welfare. Statistics on drug use in
Australia, 1998. Canberra: AIHW, 2000.
37.
Shanahan P, Hewitt N. Developmental research for a national alcohol
campaign. Canberra: Department of Health and Aged Care, 1999.
38.
Australian Institute of Health and Welfare. 1998 National Drug Strategy
Household Survey: detailed findings. Canberra: AIHW, 2000.
39.
Fergusson DM, Lynskey MT, Horwood LJ. Childhood exposure to alcohol
and adolescent drinking patterns. Addiction 1994;89:1007–16.
Dietary Guidelines for Children and Adolescents in Australia
159
3.6 L IMIT
3.6
SATURATED FAT AND MODERATE TOTAL FAT INTAKE
L I M I T S AT U R AT E D FAT A N D
M O D E R AT E T OTA L FAT I N TA K E
Low-fat diets are not suitable for infants
Geoffrey Davidson
TERMINOLOGY
Fats
Chemically, most of the fats in foods are triglycerides, made up of a unit of
glycerol (glycerine) combined with three fatty acids, which may be the same or
different. The differences between one fat and another are largely a consequence
of the fatty acids they contain, which together make up 90 per cent of the weight
of the molecule. Fats in the diet can be ‘visible’ or ‘invisible’. Among the visible
fats are butter, margarine, cooking oils, and the fat on meat. Invisible fats occur
in foods such as cheese, sauces, mayonnaise, biscuits, cakes, pastries and nuts.
In most diets, about half the fats are visible and half invisible.
Fats are the most concentrated form of energy—37 kilojoules per gram. They are
the chemical form in which most of the energy reserve of animals and some
seeds is stored.
Saturated fats
In saturated fats the majority of the fatty acids, in chemical terms, contain no
double bond; that is, they are fully saturated with hydrogen. Saturated fats are
usually solid at room temperature. They are the main type of fat in milk, cream,
butter and cheese, in some meats (most of the land animal fats), and in palm oil
and coconut oil. Most predominantly saturated fats contain one or more of the
fatty acids palmitic (16:0), myristic (14:0) and lauric (12:0). When these
predominate in dietary fat, they tend to raise plasma cholesterol.
Mono-unsaturated fats
In mono-unsaturated fats the main fatty acid is oleic acid (18:1), which has one
(mono) double (unsaturated) bond. Olive, canola and peanut oils are rich in
oleic acid.
Dietary Guidelines for Children and Adolescents in Australia
161
3.6 L IMIT
SATURATED FAT AND MODERATE TOTAL FAT INTAKE
Polyunsaturated fats
In polyunsaturated fats the main fatty acid contains two or more (poly) double
(unsaturated) bonds. These fats are liquid at room temperature; that is, they are
oils. The most common polyunsaturated fatty acid is linoleic acid (18:2); its
double bonds are in the n-6 position, and it occurs in seed oils—for example,
sunflower oil, safflower oil and corn oil. Smaller amounts of polyunsaturated
fatty acids with double bonds in the n-3 position also occur in the diet; best
known are those in fatty fish, their names abbreviated to EPA (20:5
eicosapentaenoic) and DHA (22:6 docosahexaenoic). Another n-3
polyunsaturated fatty acid, ALA (18:3 alpha linolenic), occurs in small amounts in
leafy vegetables; there is more of it in canola oil and most in flaxseed oil.
B AC K G RO U N D
Fat is the nutrient that provides the most concentrated source of energy and is an
essential source of fat-soluble vitamins and essential fatty acids. The guideline on
fat intake for the adult population is not suitable for young children, particularly
children to the age of 2 years. Restriction of the fat intake of children aged up to
2 years may interfere with optimal energy intake and reduce the supply of
essential fatty acids needed by developing nervous tissue, thus adversely
affecting growth and development.
Neurological development is particularly rapid in the first two years of life.
Growth and tissue replacement require 30 per cent of energy intake in infants,
compared with only 5 per cent in adults. Thus even a small energy deficit during
this period of rapid growth may affect growth.1
As children grow older, however, another problem emerges—the increasing
prevalence of overweight and obesity in our community. There is evidence of a
significant increase in overweight and obesity in the 2–6 year age group.2 A
high-fat diet is very energy dense, contributing to an excess energy intake and
the development of obesity. Even at a young age, a diet high in saturated fats
may predispose to the development of cardiovascular disease later in life.
A 1997 Finnish randomised prospective clinical trial showed that in the under 2
age group a fat intake of less than 30 per cent of total calories did not
compromise nutrient intake or lead to an increased sucrose intake.3 The study
also suggests that current recommendations for fat intake in the first two years of
life are an overstatement. The total fat intake data were similar to those for
Australian children.2 These new guidelines do not recommend a change for the
under 2 age group, but in the 2–5 year age group a lower fat intake is
recommended.
Another important factor in recommending change concerns the educational
process. Optimal dietary habits should be inculcated early in life. A 1995
Australian study found no difference in the relative amount of fat in the diet of
children aged 3 months to 8 years.4 Evidence from the Finnish study that a
162
Dietary Guidelines for Children and Adolescents in Australia
3.6 L IMIT
SATURATED FAT AND MODERATE TOTAL FAT INTAKE
targeted dietary intervention program can bring about a change in children’s
intake of saturated fat3 suggests that a health-oriented dietary intervention
program for children, with a particular emphasis on fat, should be supported.
Current fat intake and sources of fat in the diet
About 50 per cent of the energy in breastmilk is fat. In older infants and
children, milk becomes a less important source of fat, being replaced by the fat
content of solid foods. The 1995 National Nutrition Survey5 found that in children
and adolescents aged 2 to 18 years fat contributed about 33 per cent of energy
intake (see Table 3.6.1). This is very similar to the total fat intake recorded in the
1985 National Dietary Survey. The previous edition of the Dietary Guidelines for
Children and Adolescents recommended for children aged 2–5 years a fat intake
of 35–40 per cent of total energy intake; the current data put the intake at 33 per
cent of total fat intake. Similarly, for children aged 5–14 years the
recommendation was a fat intake providing 35 per cent of total calories, which
has already been achieved. The recommendation for adolescents was 30 per cent
of total calories from fat; this level has not yet been achieved.
Table 3.6.1 also shows the contributions of saturated, mono-unsaturated and
polyunsaturated fatty acids to the diet in children and adolescents; at all ages
saturated fats account for the highest proportion of fat intake. The figures are
similar to those obtained from dietary surveys of children in Adelaide6 and
Western Australia.7
Table 3.6.1
Percentage contribution of fatty acids and total fat to energy
intake: 1995 National Nutrition Survey, by age and gender5
Age (years)
Category
2–3
%
4–7
%
8–11
%
12–15
%
16–18
%
Males
Saturated fatty acids
15.3
14.5
13.9
14.2
13.7
Mono-unsaturated fatty acids
10.7
11.3
11.4
11.6
12.1
Polyunsaturated fatty acids
3.8
4.1
4.3
4.2
4.4
Total fat
33.2
32.9
33.2
33.6
33.2
Females
Saturated fatty acids
16.1
14.4
14.7
13.8
13.2
Mono-unsaturated fatty acids
10.9
11.1
11.8
11.5
10.9
Polyunsaturated fatty acids
3.7
4.0
4.3
4.3
4.0
Total fat
34.1
32.4
34.2
33.2
31.9
Note: Saturated, mono-unsaturated and saturated fatty acids together account for about 90 per
cent of total fat.
Dietary Guidelines for Children and Adolescents in Australia
163
3.6 L IMIT
SATURATED FAT AND MODERATE TOTAL FAT INTAKE
Table 3.6.2
Percentage of total fat contributed by selected food groups and
foods: 1995 National Nutrition Survey, by age and gender5
2–11 years
Food group or food
Males
%
Females
%
12–18 years
Males
%
Females
%
Cereals and cereal products
6.1
5.8
5.7
5.9
Regular breads and rolls
3.3
3.0
2.9
3.3
19.3
18.1
20.0
20.0
3.4
3.3
2.2
2.1
8.2
8.6
11.8
9.8
7.5
7.7
10.5
7.8
26.6
26.4
22.8
20.6
14.9
13.9
10.1
7.9
4.6
4.7
4.9
5.1
Meat, poultry and game products and dishes 14.9
Cereal-based products and dishes
Sweet biscuits
Vegetable products and dishes
Potatoes
Milk products and dishes
Dairy milk
Cheese
14.0
17.5
18.0
2.7
2.3
4.5
3.9
Fish and seafood products and dishes
1.1
1.7
1.2
1.9
Egg products and dishes
1.3
1.6
1.4
1.0
Muscle meat
Snack foods
Potato snacks
Confectionery
4.3
4.7
3.7
4.3
2.3
2.8
2.3
2.5
3.6
4.2
3.6
4.8
Chocolate and chocolate-based confectionery 2.4
3.2
3.1
4.3
1.9
2.7
1.2
1.5
1.9
2.7
1.1
1.5
Fats and oils
9.8
9.6
8.6
8.3
Dairy fats
1.6
1.8
1.4
1.8
Margarine
7.8
7.4
6.8
5.8
Seed and nut products and dishes
Nuts and nut products
164
Dietary Guidelines for Children and Adolescents in Australia
3.6 L IMIT
SATURATED FAT AND MODERATE TOTAL FAT INTAKE
Figure 3.6.1 Foods contributing to saturated fat intake: 1995 National Nutrition Survey, by age5
Table 3.6.2 shows the proportion of total fat obtained from selected food groups
by children and adolescents. The main sources of fat in both these age groups
were milk products and dishes and cereals and cereal products. The intake of
milk products and dishes decreased in adolescent girls. Particular foods’
contribution to fat intake varied according to the type of fat. For example, milk
products accounted for about 30–40 per cent of saturated fat intake, and fats and
oils accounted for about 5–10 per cent8; in contrast, milk products accounted for
about 5 per cent of polyunsaturated fat intake, whereas fats and oils accounted
for about 20 per cent. Snack foods such as sweet biscuits, cakes, buns and
pastries were moderate sources of fat intake at all ages but their contribution has
increased since the 1985 dietary survey, now amounting to 18–20 per cent of
total fat intake. This is most noticeable in the younger age group, where the
1985 survey showed a contribution of around 15 per cent for the under 10 age
group.9
Figure 3.6.1 shows that among children aged 2–11 years dairy milk was a major
source of saturated fat. For adolescents, milk products provided 30–40 per cent
of the saturated fat intake. This proportion decreased significantly in adults.
Dietary Guidelines for Children and Adolescents in Australia
165
3.6 L IMIT
SATURATED FAT AND MODERATE TOTAL FAT INTAKE
SCIENTIFIC
BASIS
Role of fat in the diet
Fat is an integral part of the diet. It provides a concentrated form of energy for
growth and development and constitutes about 50 per cent of energy intake in
early infancy. It also provides essential fatty acids, particularly the n-3
polyunsaturated fatty acids required by the body for cell structure, membrane
function and the development of the central nervous system. Further, it is a
source of precursors for eicosanoid synthesis—for example, prostaglandins,
thromboxanes and leukotrienes—and a vehicle for transporting fat-soluble
vitamins. In addition to these nutritional functions, fat contributes to the taste,
texture and palatability of foods.10
There is some evidence that an adequate intake of cholesterol during the growth
period is important for cholesterol metabolism later in life and for myelinisation
of the nervous system, neurologic development in general, the formation of
hormones essential for growth and sexual maturation, and the production of bile
acids.11,12 However, this largely ignores the fact that the human body is capable
of synthesising sufficient cholesterol for all its metabolic needs.13,14 It is also well
established that the cholesterol-elevating effect of dietary cholesterol is rather
less than that of saturated fats.15
Overweight and obesity in children and adolescents: prevalence and
contributing factors
Excess body weight is the most common medical problem in Australia.2 It is also
a major global public health concern.3,16
The most practical way of measuring obesity and overweight in clinical practice
is to use the body mass index—weight (kilograms)/height (metres)2. In
childhood, BMI changes with age, so age-related reference charts are needed.
This complicating factor has recently been addressed by the International
Obesity Task Force, which has published BMI-for-age reference values setting
the childhood percentile for overweight and obesity on the basis of adult BMI
ranges.17 As a result, national data can now be analysed to determine point
prevalence, identify secular trends, and allow meaningful international
comparisons.
According to the most recent National Health and Nutrition Examination Survey
in the United States, approximately 25 per cent of children in that country are
overweight or obese.18 In Australia, there is evidence that the prevalence of
obesity in children is increasing2,19,20, although current national prevalence figures
are not available. Ethnicity21 and socio-economic status22 are important factors
contributing to obesity in Australian children. In a recently published review of
the prevalence of overweight and obesity in Australian children and adolescents,
data from two national samples taken 10 years apart were reviewed and the new
International Obesity Task Force definition applied.2 Depending on age, 13–26 per
166
Dietary Guidelines for Children and Adolescents in Australia
3.6 L IMIT
SATURATED FAT AND MODERATE TOTAL FAT INTAKE
cent of boys aged 2–18 years and 19–23 per cent of girls of that age are
overweight or obese, the prevalence peaking at 12–15 years in boys and 7–11
years in girls. These rates, for both overweight and obesity, are higher than those
for all the international reference populations and considerably higher than those
in Australia in 1985.2
Overweight and obesity in childhood constitute a risk factor for a range of
immediate and long-term problems, among them diabetes, high cholesterol
levels, hypertension, sleep apnoea, musculoskeletal problems, liver disease23 and
psychological problems (particularly in girls).24 Children who are overweight
beyond the age of 7 years are at greater risk of obesity and cardiovascular
disease in adulthood.25 The global epidemic of increasing overweight and obesity
is attributed to changing lifestyle—decreasing activity26, increasing inactivity and
increasing food energy intake.
Management of childhood obesity is difficult and relies heavily on the parents
and a lifestyle change, particularly a change in the whole family’s eating habits,
increased habitual physical activity, and decreased inactivity.27 A recent Adelaide
study suggests that parents or guardians of overweight or obese children may not
perceive the children as having a fat or obese body shape, and nor might the
children themselves.28 This has implications in terms of families seeking advice
about management of overweight or obese children.
Recommendations on children’s fat intakes
Although there is concern that limiting fat in the diet of young children may
compromise growth and development—which seems unlikely29—the most
controversial area in this regard concerns fat’s connection with the development
of coronary heart disease in adulthood. There is, however, good evidence that
overweight and obese children and adolescents are at greater risk of obesity in
adulthood.30
A number of overseas organisations have recommended a general decrease in fat
intake—to between 30 and 35 per cent of energy intake—for adults and for
children over 2 years of age. Among those making this recommendation are the
Canadian Paediatric Society31, the American Heart Association32, the American
Health Foundation13, the National Cholesterol Education Program Expert Panel on
Blood Cholesterol Levels in Children and Adolescents33 and the National
Institutes of Health Consensus Development Panel.34 The basis for the
recommendation can be summarised as follows:
•
Compared with their counterparts in many other countries, US children and
adolescents have higher blood cholesterol levels and higher intakes of
saturated fatty acids and cholesterol, and adults have higher blood
cholesterol levels and higher rates of morbidity and mortality from
coronary heart disease.33,34
•
Autopsy studies show that early coronary atherosclerosis or its precursors
often begin in childhood and adolescence.13,33
Dietary Guidelines for Children and Adolescents in Australia
167
3.6 L IMIT
•
•
•
•
•
•
SATURATED FAT AND MODERATE TOTAL FAT INTAKE
High serum total low-density lipoprotein and very low density lipoprotein
cholesterol levels and low high-density lipoprotein cholesterol levels are
correlated with the extent of early atherosclerotic lesions in adolescents
and young adults.33
Children and adolescents with elevated serum cholesterol, particularly LDL,
often come from families in which there is a high incidence of coronary
heart disease among adult members.33
High blood cholesterol aggregates in families as a result of both shared
environments and genetic factors.33
Children and adolescents with high cholesterol levels are more likely than
the general population to have high cholesterol levels as adults.13,33
Dietary behaviour—the principal modifiable contributor to
atherosclerosis—particularly an excessive intake of saturated fats,
originates in childhood and probably has an impact, physiologically and
behaviourally, early in life.13
The importance of plasma cholesterol in coronary heart disease has been
confirmed by many trials with cholesterol-lowering drugs, even in people
with average US plasma cholesterol levels.35
On the other hand, a number of individuals and other organisations—such as the
American Academy of Paediatrics Committee on Nutrition, the Dietitians
Association of Australia, the Australian College of Paediatrics, and the UK
Committee on Medical Aspects of Food Policy—advocate a more cautious
approach in applying adult fat-intake guidelines to children and adolescents.11,36–39
Australian recommendations also support caution because many foods with a
significant fat content are rich in nutrients and are important components of a
healthy diet.40
The following views have been expressed about adoption of the diet
recommended by the American Heart Association and other groups:
•
Epidemiological studies are not of themselves sufficient to establish causeand-effect relationships.11
•
In diseases of multiple aetiology involving genetic factors, it is necessary
to understand the extent to which dietary intervention and individual
responses are related.11
•
Successful implementation of a public health nutrition program requires
the active support of the health-related professions.11
•
The safety of diets that are designed to decrease consumption of fat and
cholesterol has not been established for growing children.11–13
•
It has not been demonstrated directly, by appropriately controlled studies,
that dietary modification in children will alter the incidence of coronary
heart disease in later life.34,36–38,41,42
•
Children who have cholesterol levels in the high range will not necessarily
have levels in the same range when they reach adulthood.42
168
Dietary Guidelines for Children and Adolescents in Australia
3.6 L IMIT
SATURATED FAT AND MODERATE TOTAL FAT INTAKE
On balance, however, the accumulating evidence of the increased incidence of
overweight and obesity in our community2, suggests that recommendations
should now be made about taking care with children’s fat intakes. The evidence
supports giving advice on fat intakes at an early age, and certainly under
5 years.2,4 There is also evidence that introducing healthy eating patterns in early
childhood influences dietary patterns in later childhood.3 Previous discussions
have targeted cholesterol and the potential hazards of cholesterol-lowering diets,
but the aim of this guideline is to reduce total fat, particularly saturated fat, in
the diet.
Implications of the recommendations on children’s fat intakes
Unsupervised restriction of infants’ and young children’s dietary fat intake can
lead to growth failure12,41,43–45 and chronic non-specific diarrhoea.46 A high
proportion of hypercholesterolaemic patients who were advised to eat a low-fat
diet chose diets that would not sustain normal pubertal growth and weight
gain46; for example, they consumed too little milk, other dairy products, meat
and eggs. Additionally, the diets often provided insufficient energy and
inappropriate quantities of the vitamins and minerals that are essential for
normal growth and development. The findings of these studies have been
attributed to inadequate consumption of energy36 or inadvertent starvation of
children by misinformed parents.45 The reports highlight the need to distinguish
between two particular situations: a clinical need to reduce fat intake because of
potential risk in a known disease state; and dietary recommendations for an
otherwise healthy group of individuals who are overweight or obese.
In older children with a strong family history of cardiovascular disease or familial
hypercholesterolaemia, where treatment is indicated the diet should aim to
reduce total and saturated fat, substitute polyunsaturated and mono-unsaturated
fats for saturated fat, and decrease dietary cholesterol. Carbohydrate can replace
some of the energy from fat, but an experienced dietitian and a paediatrician
must carefully monitor the children’s growth and development.29,40,41
Low-fat diets and the need for supervision
When restricting fat in children’s diets, careful attention needs to be paid to
educating parents about the importance of a well-balanced diet, taking account
of the alterations needed for adequate intakes of nutrients. Children should be
monitored to ensure that they are consuming a suitable diet.12,14,29,40,42,44,45
Recommended targets for fat intakes during infancy, childhood and
adolescence
The recommendations that follow propose a further drop in the total fat content
of young children’s and adolescents’ diets. This can be justified on the basis of
the increasing incidence of overweight and obesity and the role played by high-
Dietary Guidelines for Children and Adolescents in Australia
169
3.6 L IMIT
SATURATED FAT AND MODERATE TOTAL FAT INTAKE
fat foods. The Finnish study3 also showed that many children obtain less than
30 per cent of total calories from fat without detrimental effects.29
The following guidelines cover the paediatric age periods of birth to 2 years, 2
to 5 years, 5 to 14 years, and adolescence.
A.
Birth to 2 years
In the first six months of life fat is an important source of energy. In breastfed
and formula-fed infants, fat intake should make up approximately 50 per cent of
energy intake.
For non-breastfed infants, infant formula—not cow’s milk—should be the primary
milk feed in the first year of life. This is because formula has a higher iron
content and a complete nutrient profile (see Chapter 3 for further discussion). In
the latter part of the first year of life and during the second year of life, the
target should be approximately 40 per cent of energy as fat.
The fat content of milk becomes less important with age because other foods
that contribute fats and oils are eaten. However, skim milk (less than 0.5 per
cent fat) and reduced-fat milk (1.5–2.5 per cent fat) should not be used in
children aged less than 2 years.
B.
Two to 5 years
Between the ages of 2 and 5 years there will be a gradual increase in the
proportion of energy derived from carbohydrate and a gradual reduction in the
proportion of energy from fat. Children in this age group are already consuming
a diet containing 33 per cent fat, so a target of 30 per cent is recommended—
with no more than 10 per cent from saturated fat. Reduced-fat milks should be
used but skim milk should not be used for children aged less than 5 years.47 This
should not prevent its use, however, in family meals—for example, in custard
and ice-cream.
C.
Five to 14 years
For children between the ages of 5 and 14 years, approximately 30 per cent of
energy intake as fat—with no more than 10 per cent coming from saturated fat—
is appropriate. This will have no deleterious effects on nutrition or growth.48 The
use of skim milk as a major dairy source is appropriate in this age group.
D.
Adolescence
For adolescents, approximately 30 per cent of energy intake as fat—with no
more than 10 per cent coming from saturated fat—is desirable. This should be
accompanied by emphasis on physical activity and a balanced nutrient intake.
Section 1.6 of the Dietary Guidelines for Australian Adults is relevant to
adolescents.
170
Dietary Guidelines for Children and Adolescents in Australia
3.6 L IMIT
PRACTIC AL
SATURATED FAT AND MODERATE TOTAL FAT INTAKE
ASPECTS OF THIS GUIDELINE
For infants under the age of 6 months, breastmilk provides a suitable amount
and type of fat.
When solid foods are introduced, the advice given in Chapters 2 and 3 here
should be followed.
Reduced-fat milk may be used from the age of 2 years, when milk plays a less
dominant role in the diet of the child.
Strategies for modifying the type and amount of fat consumed, as outlined in
Section 1.6 of the Dietary Guidelines for Australian Adults, are important for
older children and adolescents. Reid et al. offer a number of suggestions for
fostering positive attitudes and practices in relation to moderating fat intake:
•
Encourage children to be moderate in their use of high-fat sauces, salad
dressings, and spreads such as butter and margarine.
•
Trim visible fat from children’s meat.
•
Limit the use of processed meats such as hot dogs, luncheon meats and
sausages.
•
Limit fried foods such as French fries and fried fish or chicken to very
occasional use, and use polyunsaturated and mono-unsaturated cooking
oils when preparing them.
•
Choose lower fat foods when eating at fast-food restaurants—for example,
milk instead of milkshakes, single meat patties and pasta instead of pizza.
•
Provide fruit and vegetables or bread as snacks, rather than potato crisps,
biscuits or pastries. Use crisps and pastries as ‘treat foods’ only.
•
Use reduced-fat or low-fat dairy foods for all children over the age of
5 years.
R E L AT I O N S H I P
TO OT H E R G U I D E L I N E S
Children and adolescents need sufficient nutritious foods to grow and
develop normally
•
•
Growth should be checked regularly
Physical activity is important for all children and adolescents
Activity has a positive effect on weight control, and obesity is often related to
overeating, including overeating of high-fat foods.
Dietary Guidelines for Children and Adolescents in Australia
171
3.6 L IMIT
SATURATED FAT AND MODERATE TOTAL FAT INTAKE
Include milks, yoghurts, cheese and/or alternatives
Section 3.4 highlights the point that dairy foods are a major contributor of both
total fat and saturated fat. But dairy foods are also a valuable source of other
nutrients—particularly calcium—so it is important for older children and
adolescents to choose low- or reduced-fat products where possible. Reduced-fat
milks are not suitable for children aged less than 2 years.
CONCLUSION
In the first six months of life fat is an important source of energy. In breastfed
and formula-fed infants, fat intake should make up approximately 50 per cent of
energy intake. Between the ages of 2 and 5 years there will be a gradual
increase in the proportion of energy derived from carbohydrate and a gradual
reduction in the proportion of energy from fat. For children above the age of 5
yrs and for adolescents approximately 30 per cent of energy intake as fat—with
no more than 10 per cent coming from saturated fat—is desirable.
EVIDENCE
The evidence for chronic disease outcomes related to high intakes of saturated
fat is discussed in Section 1.6 of the Dietary Guidelines for Australian Adults.
In addition, there is also Level III evidence that overweight or obesity in
childhood increases the risk of obesity and cardiovascular disease in adulthood
(references 25 and 30). There is Level IV evidence of a relationship between
obesity and liver disease (reference 23) and psychological problems
(reference 24) in children and Level IV evidence that growth failure can result
from low-fat, low-cholesterol diets in young children (reference 12). Because of
concerns about maintaining adequate growth and development in early
childhood, it is not possible to conduct randomised trials dealing with intakes of
fat and saturated fat in early childhood. There are, however, several Level III
studies from Finland (references 3 and 29) showing no deleterious effects on
growth or neurological development of limiting fat intake in children followed
from age 7 months to 5 years.
REFERENCES
1.
Suskind RM, LeWinter-Suskind L eds. Textbook of paediatric nutrition, 2nd
edn. New York: Raven Press, 1993.
2.
Magarey AM, Daniels LA, Boulton TJC. Prevalence of overweight and
obesity in Australian children and adolescents: reassessment of 1985 and
1995 data against new standard international definitions. Med J Aust
2001;174:561–4.
172
Dietary Guidelines for Children and Adolescents in Australia
3.6 L IMIT
SATURATED FAT AND MODERATE TOTAL FAT INTAKE
3.
Lagstrom H, Jokinen E, Seppanen R, Rönnemaa T, Viikari J, Välimäki I et
al. Nutrient intakes by young children in a prospective randomised trial of
a low–saturated fat, low-cholesterol diet. Arch Pediatr Adolesc Med
1997;151:181–8.
4.
Boulton TJC, Magarey AM. Effects of differences in dietary fat on growth,
energy and nutrient intake from infancy to eight years of age. Acta
Paediatr 1995;84:146–50.
5.
McLennan W, Podger A. National Nutrition Survey: nutrient intake and
physical measurements. Canberra: Australian Bureau of Statistics, 1997.
6.
Magarey A, Nichols J, Boulton TJC. Food intake at age 8: energy, macroand micronutrients. Aust Paediatr J 1987;23:173–8.
7.
Jenner DA, Miller MR. Intakes of selected nutrients in year 7 Western
Australian children: comparison between weekdays and weekend days and
relationships with socio-economic status. Aust J Nutr Dietet 1991;48:50–5.
8.
McLennan W, Podger A. National Nutrition Survey: selected highlights,
Australia, 1995. Canberra: Australian Bureau of Statistics, 1997.
9.
Department of Community Services and Health. National dietary survey of
school children (aged 10–15 years), 1985. No. 2: nutrient intakes.
Canberra: AGPS, 1989.
10.
National Health and Medical Research Council. The role of polyunsaturated
fats in the Australian diet. Canberra: AGPS, 1992.
11.
American Academy of Pediatrics Committee on Nutrition. Toward a
prudent diet for children. Pediatrics 1983;71:78–80.
12.
Lifshitz F, Moses N. Growth failure: a complication of dietary treatment of
hypercholesterolaemia. Am J Dis Child 1989;143:537–42.
13.
American Health Foundation. Coronary artery disease prevention. Prev Med
1989;18:324–409.
14.
Nicklas TA, Webber LS, Koschak M, Berenson CS. Nutrient adequacy of
low fat intakes for children: the Bogalusa Heart Study. Pediatrics
1992;89:221–8.
15.
Beynen AC, Katan MB. Impact of dietary cholesterol and fatty acids on
serum lipids and lipoproteins in man. In: Vergroesen AJ, Crawford M eds.
The role of fats in human nutrition. 2nd edn. London: Academic Press,
1989:237–84.
16.
World Health Organization. Obesity—preventing and managing the global
epidemic: report of a WHO consultation on obesity, Geneva, 3–5 June 1996.
Geneva: WHO, 1998.
17.
Cole TJ, Bellizzi MC, Flegal KM, Dietz WH. Establishing a standard
definition for child overweight and obesity worldwide: international
survey. BMJ 2000;320:1240–43.
Dietary Guidelines for Children and Adolescents in Australia
173
3.6 L IMIT
SATURATED FAT AND MODERATE TOTAL FAT INTAKE
18.
Triano RP, Flegal KM. Overweight children and adolescents: description
epidemiology and demographics. Pediatrics 1998;101:497–504.
19.
Wake M, Lazarus R, Hasketh R, Waters E. Are Australian children getting
fatter? J Pediat Child Hlth 1999;35–47(abstract).
20.
Booth ML, Wake M, Armstrong T, Chey T, Hesketh K, Mathur S. The
epidemiology of overweight and obesity among Australian children and
adolescents, 1995–1997. Aust NZ J Pub Hlth 2001;25:162–9.
21.
Booth ML, Macaskill P, Lazaras R, Baur LA. Socio demographic distribution
of measures of body fatness among children and adolescents in New South
Wales, Australia. Int J Obes Relat Metab Disord 1999;23:456–72.
22.
Lynch J, Wang XL, Wilcken DEL. Body mass index in Australian children:
recent changes and relevance of ethnicity. Arch Dis Child 2000;52:16–20.
23.
Manton ND, Lipsch J, Moore DJ, Davidson GP, Bourne AJ, Couper RTL.
Non-alcoholic steatohepatitis in children and adolescents. Med J Aust
2000;173:476–9.
24.
Hill AJ, Lissau I. Psychosocial factors and consequences of child obesity.
In: Burniat WT, Cole TJ, Lissau I eds. The obese and overweight child.
Cambridge, UK: Cambridge University Press, in press.
25.
Dietz WH. Childhood weight affects adult morbidity and mortality. J Nutr
1998;128(suppl.):5411–14.
26.
Dollman J, Olds T, Norton K, Stuart D. The evaluation of fitness and
fatness in 10–11 year old Australian children: changes in distributional
characteristics between 1985 and 1997. Pediatr Exer Sci 1999;11:108–21.
27.
Smith A, Kellett E, Schmerlaib Y. The Australian guide to healthy eating.
Canberra: Department of Health and Family Services, 1998.
28.
Moore D, Stratton J, Wilson K, Bahurst P, Couper J, Jureidini J et al.
Perception of body shape in overweight/obese children attending a
paediatric outpatient department. J Gastroenterol Hepatol
2000;15:J76(abstract).
29.
Rask-Nissila L, Jokinen E, Terho P, Tammi A, Lapinleimu H, Ronnemaa T et
al. Neurological development of 5-year-old children receiving a low–
saturated fat, low-cholesterol diet since infancy: a randomized controlled
trial. JAMA 2000;284:993–1000.
30.
Power C, Lake JK, Cole TJ. Measurements of long term health risks of child
and adolescent fatness. Int J Obes Relat Metab Disord 1997;21:507–26.
31.
Nutrition Committee of the Canadian Pediatric Society. Children’s diet and
atherosclerosis. Can Med Assoc J 1981;124:1545–8.
32.
Weidman W, Kwiterovich P, Jesse MJ, Nugent E. Diet in the healthy child:
Task Force of the Nutrition Committee and Cardiovascular Disease in the
Young Council of the American Heart Association. Circulation
1983;67:1411A–1414A.
174
Dietary Guidelines for Children and Adolescents in Australia
3.6 L IMIT
SATURATED FAT AND MODERATE TOTAL FAT INTAKE
33.
Expert Panel on Blood Cholesterol Levels in Children and Adolescents.
National Cholesterol Education Program: report. Pediatrics
1992;89(suppl.):525–83.
34.
National Institutes of Health. Lowering blood cholesterol to prevent heart
disease. JAMA 1985;253:2080–6.
35.
Sacks FM, Pfeffer MA, Moye LA, Rouleau JL, Rutherford JD, Cole TG et al.
The effect of pravastatin on coronary events after myocardial infarction in
patients with average cholesterol levels. N Engl J Med 1996;335:1001–9.
36.
American Academy of Pediatrics Committee on Nutrition. Prudent life-style
for children: dietary fat and cholesterol. Pediatrics 1986;78:521–5.
37.
Magarey AM, Boulton TJC, Daniels L, Davidson GP. Recommendations for
dietary intervention in the prevention and treatment of hyperlipidaemia in
childhood: a consensus statement from the Dietitians Association of
Australia and the Australian College of Paediatrics. Aust J Nutr Diet
1994;51:191–8.
38.
Taitz LS. Diet of young children and cardiovascular disease. BMJ
1987;294:912–17.
39.
Department of Health and Social Security Committee on Medical Aspects of
Food Policy. Diet and cardiovascular disease. London: HMSO, 1984.
40.
Magarey AM, Daniels LA, Boulton TJC. Reducing the fat content of
children’s diets: nutritional implications and practical recommendations.
Aust J Nutr Diet 1993;50:69–74.
41.
Kaplan RM, Toshima MT. Does a reduced fat diet cause retardation in child
growth? Prev Med 1992;21:33–52.
42.
Finberg L. Dietary advice: responsibility for monitoring. Am J Dis Child
1989;143:531.
43.
Holtzman NA. The great god cholesterol. Pediatrics 1991;87:943–5.
44.
Tarlow MJ. Cholesterol and diet. Arch Dis Child 1989;64:647–8.
45.
Pugliese MT, Weyman-Daum M, Moses N, Lifshitz F. Parental health beliefs
as a cause of non organic failure to thrive. Pediatrics 1987;80:175–82.
46.
Cohen SA, Hendricks K, Mathis R, Laramee S, Walker WA. Chronic nonspecific diarrhoea: complication of dietary fat restriction. Pediatrics
1979;64:402–7.
47.
Fomon SJ, Filer LJ, Ziegler EE, Bergmann KE, Bergmann Rl. Skim milk in
infant feeding. Acta Paediatr Scand 1979;65:17–30.
48.
Gleuck CJ, Mellies MJ, Dine M, Perry T, Laskarszewski P. Safety and
efficiency of long term diet and diet plus bile acid binding resin
cholesterol lowering therapy in 73 children heterozygous for familial
hypercholesterolaemia. Pediatrics 1986;78:338–48.
49.
Reid J, George J, Pears R. Fat. In: Food and nutrition guidelines for
children aged 2–12 years. Wellington, NZ: Department of Health, 1992.
Dietary Guidelines for Children and Adolescents in Australia
175
3.7 C HOOSE
3.7
FOODS LOW IN SALT
C H O O S E F O O D S L O W I N S A LT
Malcolm Riley and Tr evor Beard
TERMINOLOGY
Salt and sodium
Dietary salt is an inorganic compound consisting of sodium and chloride ions. It
is found naturally in many foods, but it is also added to many foods because of
its preservative and flavouring characteristics. Research has shown that both the
sodium and the chloride can be detrimental to health when consumed in excess.1
About 90 per cent of all the sodium added to food is sodium chloride, so dietary
intake of sodium represents intake of sodium chloride for practical purposes.
Sodium in the diet of Australian adults comes mostly from processed foods,
although sodium added in cooking, at the table, in medications and naturally
present in foods can contribute to the total dietary intake.
Recommended intake for sodium
The current National Health and Medical Research Council recommendations for
sodium intakes among Australian children and adolescents are 140–280 milligrams a
day for infants, 460–1730mg/day for 1–3 year olds, 600–2300mg/day for 4–7 year
olds, and 920–2300mg/day for children aged 8 years and over and for adolescents.2
This last amount is the same as the recommendation for adults.
One thousand milligrams of sodium is contained in about 3 grams of common
salt, or just over half a teaspoon.
Low-salt food
Food Standards Australia New Zealand defines a low-salt food as a food with a
sodium concentration of up to 120 milligrams per 100 grams (Joint Australia and
New Zealand Food Code, clause 17 of Standard 1.2.8).
The following are the conversion factors for the units used to express the sodium
content of food:
1mmol = 23 milligrams
1 gram = 43mmol
One gram of sodium chloride (NaCl) contains 17mmol, or 391 milligrams, of
sodium.
Dietary Guidelines for Children and Adolescents in Australia
177
3.7 C HOOSE
FOODS LOW IN SALT
B AC K G RO U N D
Cardiovascular disease is the largest cause of premature death and death overall
in Australia; it accounted for 50 797 deaths, or 40 per cent of all deaths, in 1998.3
Most of these deaths are caused by coronary heart disease (55 per cent),
followed by stroke (24 per cent). Each year about 40 000 Australians have a
stroke; 70 per cent of these are first-ever strokes. Stroke is the cause of nearly
25 per cent of all chronic disability in Australia.4 Hypertension is the problem
most frequently seen by general practitioners, accounting for 5.7 per cent of all
problems they see.5 In 1995 an estimated 2.8 million Australians aged 18 years
and over reported a recent and/or long-term cardiovascular condition. High
blood pressure was the most common condition for both males and females.6
The prevalence of cardiovascular conditions increased with age, reaching 61 per
cent among people aged 75 years and over.
Although male and female death rates from cardiovascular disease in Australia
declined by about 3.6 per cent a year between 1985 and 1996, the number of
people with the disease is expected to increase in the next few decades as the
number of older people increases and life-sustaining treatments improve. The
total direct costs to Australia of cardiovascular disease were estimated to be
$3719 million in 1993–94, which represents 12 per cent of total health care costs
for all diseases.7
It is now well accepted that a reduction in dietary sodium intake will decrease
the mean population blood pressure and reduce the prevalence of hypertension.
It has not yet been conclusively demonstrated that a mean dietary sodium intake
within the range recommended for Australian adults will result in lower
morbidity and mortality rates than at present8, but the balance of evidence
suggests it will. Similarly, it has not been demonstrated that maintaining a mean
dietary sodium intake within the range recommended for Australian adults will
result in a lower incidence of hypertension—that is, prevent the occurrence of
hypertension—but, again, the balance of evidence suggests it will. It has been
said that ‘few measures in preventive medicine are as simple and economical
and yet can achieve so much’.9 There is strong evidence that other components
of the diet also influence blood pressure; this guideline focuses, however, on the
independent influence of sodium.
The risk of stroke and ischaemic heart disease increases continuously with blood
pressure, as shown by nine major prospective cohort studies.10 Within the range
of diastolic blood pressure studied (about 70–110mmHg), there is no evidence of
a threshold below which the relationship alters. If dietary salt were decreased by
an average of 3 grams (50mmol sodium) a day, the average systolic blood
pressure of people aged over 50 years of age would be expected to fall by about
5mmHg; diastolic blood pressure would be lowered by about half as much. The
minority who are hypertensive would experience a greater average blood
pressure fall, but the reduction in the number of new cases of cardiovascular
disease would be greatest for the large proportion who are close to average
blood pressure. It has been estimated that a reduction in dietary salt by an
average of 3 grams a day in an entire western population would reduce age-
178
Dietary Guidelines for Children and Adolescents in Australia
3.7 C HOOSE
FOODS LOW IN SALT
specific stroke mortality by about 22 per cent and ischaemic heart disease
mortality by about 16 per cent.9,11
A recent review12 has pointed to a number of health conditions other than raised
blood pressure that are associated with excess sodium intake. Among them are
any condition exacerbated by water retention (including heart failure, cirrhosis,
nephrotic syndrome, and idiopathic and cyclical oedema), stroke (independently
of blood pressure), gastric cancer and left ventricular hypertrophy. Excess
sodium intake also increases the rate of deterioration in kidney function in
patients with renal disease, is associated with urinary stones, and may aggravate
asthma13 and osteoporosis. Excretion of sodium is associated with an obligatory
loss of calcium as a result of interference with the tubular reabsorption of
calcium. Calcium is conserved on low salt intakes and wasted on high salt
intakes. This has relevance to calcium stones of the urinary tract (the commonest
variety of stone) and osteoporosis.
For infants, ingestion of foods high in sodium can lead to death because the
kidneys are not fully developed until many months after birth. In July 1999 the
press reported that a British coroner had heard, from two paediatricians at
Sheffield Children’s Hospital, evidence that a 3-month-old baby boy had died of
hypernatraemia after an attempt at weaning him onto solid foods containing too
much salt. The parents found the recommended baby food too expensive, so
used a standard (adult) breakfast cereal plus instant mashed potatoes and gravy.
The gravy was made with ordinary commercial gravy granules, which are very
high in sodium.
Weaning is not recommended until 6 months of age, and most makers of canned
baby foods offer them for use from this age. The new Food Standards Code for
Australia and New Zealand stipulates the total amount of sodium allowed in
foods for infants (Standard 2.9.2). The maximum amount is 100 milligrams per
100 grams in flours, pasta and ready-to-eat foods, but the limitations of
contemporary food technology are at present being accommodated by an
allowance of 300mg/100g for biscuits and 350mg/100g for teething rusks. In
comparison, the sodium content of breastmilk is 18mg/100g.
Little is known about cuirrent intakes of salt in Australian children and
adolescents.
SCIENTIFIC
BASIS
It is uncommon for high blood pressure to express itself in children and
adolescents, although the precursors of and risk factors for the condition can be
identified from an early age. It is recommended that good eating practices be
established at an early age, so as to avoid the development or expression of high
blood pressure in later life.
Food preferences seem to emerge early in life, although the nature of the
progression of these preferences to adulthood is not clear.14 Children’s food
Dietary Guidelines for Children and Adolescents in Australia
179
3.7 C HOOSE
FOODS LOW IN SALT
preferences are influenced by food exposure, parents’ food preferences, parental
role modelling, family approaches to food buying and cooking, media exposure,
and parent–child interaction regarding food.15
Breastmilk contains about 8mmol per litre of sodium14, so breastfed infants
receive about 7mmol of sodium each day. Infants’ immature kidneys have
difficulty excreting an overload of salt, and their diet needs to comply with the
adult dietary guideline to choose low-salt foods, which are defined in the Food
Standards Code as foods with a sodium content up to 120 milligrams per
100 grams. Compliance with the adult guideline would also help prevent young
children from becoming habituated to the taste of foods with a high salt content;
this habituation develops within a few weeks of exposure.16
Studies of the association between sodium intake and blood pressure are more
common in adults than children, but at least one study suggests that early
exposure to dietary sodium may have lasting effects. In a six-month randomised
trial of almost 500 bottle-fed newborns, the group whose sodium intake was
reduced by 50 per cent had a 2.1mmHg lower systolic blood pressure than the
control group.17 Of the 35 per cent of subjects who could be traced 15 years
later, those originally receiving the low-sodium formula had a blood pressure
that was on average 3.6mmHG (systolic) and 2.2mmHg (diastolic) lower.18
The evidence that dietary sodium is associated with blood pressure in children
is, however, inconsistent. A cohort study19 of 233 children examined the
association between sodium and potassium intakes and change in blood
pressure. The subjects were followed for an average of seven years, each
providing at least six annual, timed overnight urine collections. Urinary sodium
was found to be unrelated to change in blood pressure over time; urinary
potassium and the urinary sodium–potassium ratio were related to a rise in
systolic blood pressure.
Adolescents are particularly prone to an increased sodium intake because their
energy needs increase greatly, resulting in a commensurate increase in food
intake, and their increased independence and disposable income encourage a
greater intake of foods prepared outside the home, which may be more heavily
salted than foods prepared at home.
Increased excretion of calcium in response to a higher intake of sodium may be
more important in childhood and adolescence than in adulthood because of the
need to develop the highest possible peak bone mass during adolescence. Peak
bone mass is one of the determinants of the development of osteoporosis in later
life.
The scientific literature relating dietary sodium intake to blood pressure is
extensive and dates back more than 100 years.20 Here it is possible only to
summarise the state of current knowledge, highlight important studies, and draw
attention to important considerations. The literature provides evidence that
different commentators can interpret similar scientific results quite differently,
but there is general consensus on most issues.
180
Dietary Guidelines for Children and Adolescents in Australia
3.7 C HOOSE
FOODS LOW IN SALT
It is generally agreed that the extent to which a reduction in dietary sodium
intake reduces blood pressure depends on age and initial blood pressure; it is
greater with age and at higher blood pressures.21,22 Law et al.22 found that the full
effect of dietary sodium reduction on blood pressure is not seen for at least five
weeks after the dietary change.
Among the major original studies are animal studies and human studies.
Controlled experiments in chimpanzees have shown an important effect of
dietary salt reduction on blood pressure23, consistent with earlier experiments on
rats.24 For chimpanzees that were allocated a high-sodium diet for only two
years, up to six months of a return to their normal low-sodium diet was required
before blood pressure lowering had reached its greatest extent.
In relation to human populations, three recent reviews8,11,25 are in agreement that
dietary sodium reduction is associated with reduction in blood pressure. Kuller25
and Law11 have called for a public health approach to lowering salt in the diet—
that is, for the average salt intake of the population to be lowered through
reducing the amount of salt entering the food supply. Alderman 8, however, calls
for randomised controlled studies of the long-term health benefits and safety of
dietary sodium reduction and concludes, ‘Without knowledge of the sum of the
multiple effects of a reduced sodium diet, no single universal prescription for
sodium intake can be scientifically justified’. The mass addition of salt to the
food supply depends on technology, however, and is a relatively recent
phenomenon; further, it has never been scientifically justified. Societies without
the necessary technology for mass addition of salt to the food supply still exist—
and their members are all normotensive throughout life, with little, if any,
increase in blood pressure with age.26
Meta-analyses of sodium and hypertension trials
Law et al. took an approach that differs from a standard meta-analysis. They
analysed cross-sectional data from 24 communities worldwide, involving more
than 47 000 people22, and derived relationships between dietary sodium intake
and blood pressure that depended on age, centile in the blood pressure
distribution, and the level of development of the community. They tested the
relationships on 14 studies examining the association of blood pressure with
sodium intake within populations—importantly, after adjusting for the large
effect of regression dilution bias.27 They found that the within-population
associations were consistent with the relationships estimated using betweenpopulation data. Finally, they examined how closely the results from 68
crossover trials and 10 randomised controlled trials conformed to the
relationships they originally estimated from the between-population studies.9
They found that, for the 33 trials lasting five weeks or more, the observed
reductions in blood pressure were similar to the predicted values (within a
95 per cent confidence interval for 30 of the trials). For trials lasting less than
five weeks, they found that the predicted fall in blood pressure was less than the
observed fall, which led them to conclude that dietary sodium reduction does
not have its full effect on blood pressure until at least five weeks after
Dietary Guidelines for Children and Adolescents in Australia
181
3.7 C HOOSE
FOODS LOW IN SALT
intervention begins. The consistency of results from different study types and in
different populations has increased the investigators’ confidence in their
estimates for the relationship between dietary sodium intake and blood
pressure.9
Cutler et al.’s meta-analysis, published in 199728, updates an earlier meta-analysis
conducted by Cutler and others.29 They included 32 trials in their analyses and
concluded, ‘The blood pressure reduction that would result from a substantial
lowering of dietary sodium in the US population could reduce cardiovascular
morbidity and mortality’. Midgley et al.30 included a total of 56 trials in their
analysis and concluded, ‘Dietary sodium restriction might be considered, but the
evidence in the normotensive population does not support current
recommendations for universal dietary sodium restriction’. Graudal et al.21
included 58 trials of hypertensive people and 56 trials of normotensive people in
their analysis and concluded, ‘These results do not support a general
recommendation to reduce sodium intake … but ideally trials with hard end
points such as morbidity and survival should end the controversy’. It is important
to note that the mean duration of the studies in the Midgley et al. meta-analysis
was only two weeks, and in the Graudal et al. analysis it was seven days.
Table 3.7.1 summarises the results of the meta-analyses.
Table 3.7.1
Decrease in systolic and diastolic blood pressure on reduction
of dietary sodium: meta-analyses of randomised controlled
trials21,28,30
Diastolic
blood pressure
(mmHg)
Systolic
blood pressure
(mmHg)
Normotensive subjects (weighted average
125mmol difference in dietary sodium)
0.5
1.6
Hypertensive subjects (weighted average 95mmol
difference in dietary sodium)
3.8
5.9
Normotensive subjects (weighted average
71mmol difference in dietary sodium)
0.8
1.5
Hypertensive subjects (weighted average
76mmol difference in dietary sodium)
2.1
3.8
Normotensive subjects (weighted average
160mmol difference in dietary sodium)
0.3
1.2
Hypertensive subjects (weighted average
118mmol difference in dietary sodium)
1.9
3.9
Meta-analysis
Midgley et al. 1996
Cutler et al. 1997
Graudal et al. 1998
182
Dietary Guidelines for Children and Adolescents in Australia
3.7 C HOOSE
FOODS LOW IN SALT
The question is how to interpret the different conclusions between metaanalyses. The first point to be made is that the estimated effects are not greatly
different from one another. The overall effects are lower than what might be
expected with full dietary compliance because the inclusion of all randomised
subjects (‘intention to treat’ analysis) dilutes the number of subjects actually
complying with the intervention treatment. In determining the extent to which
change in dietary sodium will change blood pressure, there are four effectmodifying factors: the magnitude of the change in sodium intake; the age of the
subjects; the initial blood pressure of the subjects; and the duration of the
intervention. Ideally, one would like to conduct meta-analyses at different levels
of these factors, as has been done for normotension versus hypertension.
Many of the studies included in the meta-analyses were of short duration and
conducted on young people. This would tend to decrease the effect observed.
The studies involving larger reductions in dietary sodium also tended to be the
shorter ones because of the current difficulty in maintaining a free-living
population at a low sodium intake for a long period. In addition, technical
factors—such as how to weight individual trials and how to construct a summary
regression line—differed between meta-analyses. The choice of methodology
alters the summary estimates considerably.
In effect, the meta-analyses indicate what might be expected from a dietary
sodium reduction intervention undertaken in the current food environment,
where avoiding dietary sodium is relatively difficult. Even under these
circumstances, there is a fall in blood pressure for both hypertensive and
relatively young normotensive subjects.
No randomised controlled trials have been conducted to test the effectiveness of
dietary sodium reduction for primary prevention of hypertension. Furthermore,
there is little information from randomised controlled trials about the effect of
dietary sodium reduction on mortality or morbidity from cardiovascular disease.8
Two large randomised controlled trials whose results were published after the
meta-analyses—the DASH-Sodium trial31 and the TONE study32—warrant
discussion.
DASH-Sodium was a sequel to the first DASH (Dietary Approaches to Stop
Hypertension) study.33 Both were multi-centre randomised controlled trials for a
dietary period of 30 days. The first study held sodium constant at 130mmol/day
and compared the standard American diet with an ‘ideal’ diet that emphasised
fruits, vegetables, low-fat dairy foods, fish, legumes, nuts, and lean meat and
poultry; DASH-Sodium repeated the experiment at three sodium levels—
104mmol/day (approximately the US guideline) plus or minus 39mmol/day (that
is, 143, 104 and 65mmol/day). The first DASH study observed a highly significant
fall in blood pressure with the ‘ideal’ diet, indicating the benefits of a diet that
decreased total and saturated fat and cholesterol and increased dietary
potassium, calcium, magnesium, fibre and protein in relation to the standard
American diet. The DASH-Sodium study demonstrated incremental further falls in
Dietary Guidelines for Children and Adolescents in Australia
183
3.7 C HOOSE
FOODS LOW IN SALT
blood pressure at 104mmol/day and 65mmol/day of sodium, confirming that an
otherwise ideal diet is more effective when it includes a sodium-reduction
guideline. All the food was provided to the participants, thus enabling better
control of the important confounding variable of dietary compliance; this is an
important difference between DASH-Sodium and previous sodium studies.
The mean decrease in systolic blood pressure when changing from 143mmol/day
on the control diet to 65mmol/day on the DASH diet was 7.1mmHg in
normotensives and 11.5mmHg in hypertensives, the latter deriving as much
benefit as they might expect from antihypertensive medication.34 While on the
control diet only and changing from 143mmol/day to 65 mmol/day, the change
in systolic blood pressure was 9.8mmHg for African-Americans with hypertension
and 6.8mmHg for other racial groups with hypertension. The mean decrease in
diastolic blood pressure between the high and low sodium intakes was –3.5mmHg
(95%CI: –2.6 to –4.3) on the control diet and –1.6mmHg (95%CI: –0.8 to –2.5) on
the DASH diet. The combined effects on blood pressure of low sodium intake
and the DASH diet were greater than the effects of either intervention alone and
were substantial.
The first DASH trial was widely misinterpreted as having negated the importance
of other factors in hypertension such as overweight, alcohol and sodium intake31,
but the design of the first study deliberately omitted the well-established factors
in order to test the other general dietary guidelines.34 Long-term health benefits
of the DASH-Sodium diet remain to be demonstrated, but this large randomised
controlled trial with high subject retention rates and excellent compliance with
dietary protocols has provided compelling evidence that true reduction of dietary
sodium has a substantial effect on blood pressure. The effect on normotensives
was enough to justify it as a guideline for the whole population and to predict a
substantial effect at the population level.34,35
The TONE study was a randomised controlled trial of reduced sodium intake or
weight loss in hypertensives aged 60 to 80 years.32 Of the 975 subjects, 585 were
obese and 390 were not. Withdrawal of hypertensive medication was a goal for
all subjects. Follow-up visits at nine, 12 and 30 months had attendance rates of
91, 86 and 86 per cent respectively.
The sodium-reduction group reduced their intake by a mean of only 46.6mmol/
day at nine months, 49.3mmol/day at 18 months, and 39.5mmol/day at 30
months. The goal for sodium reduction was a total intake of 80mmol/day or less,
and only about 38 per cent of the subjects met this target at each visit, compared
with about 11 per cent in the control groups. This modest compliance rate
resulted in about a 30 per cent decrease in the need for antihypertensive
medication in the sodium-reduction group and a better result in subjects who
combined weight loss with sodium reduction. The modest dietary sodium
reduction of about 40mmol/day was well tolerated and sustained, and the
subjects reported no adverse effects.32
184
Dietary Guidelines for Children and Adolescents in Australia
3.7 C HOOSE
FOODS LOW IN SALT
Special groups
Children of hypertensives
The children of a hypertensive person are at particular risk because of the
genetic link and/or shared environment. From earliest childhood and throughout
life they have a heightened need for low-salt foods that comply with the adult
dietary guideline for salt. Such an eating pattern is easier to maintain when the
whole family has the same diet.
Specific population groups
Mortality from cardiovascular disease is higher among Indigenous Australians, in
rural areas and among socio-economically disadvantaged groups.7 Little
information is available on the salt intake of Indigenous Australians. A survey of
the food habits of adults living in Victoria36 found that Indigenous Australians—
whether living in the city or in rural towns—were much more likely than
European Australians to add salt to cooked food.
PRACTIC AL
ASPECTS OF THIS GUIDELINE
Relationship to the Australian Guide to Healthy Eating
The Australian Guide to Healthy Eating37 focuses on food and food selection.
Individuals should avoid choosing higher salt foods and replace them with foods
in the same group that are lower in salt. Much of the salt intake of Australians
comes from recommended foods—such as bread, cereals and cheese—and other
frequently consumed foods such as butter, margarine and snack foods. Although
equivalent studies have not been conducted in Australia, it has become apparent
that the source of most dietary sodium in western countries is not discretionary
salt.38–42 In particular, cooking salt is a much less important source than was once
thought. James et al.38 used lithium as a marker and found that only a quarter of
cooking salt actually enters the consumed food: the rest is discarded with the
cooking water. Table 3.7.2 shows the origin of dietary sodium as measured in
the two studies.
Although it is important to advise people to consume less salt and to buy lowsalt foods, the widespread use of salt in processed food and food prepared away
from home is a major barrier to achieving any meaningful reduction in dietary
sodium intake. If the important public health objective of reducing the mean
intake of sodium for all people to at least the top end of the recommended
dietary intake range42 is to be achieved, far-reaching action is necessary. Realistic
medium-term policy objectives would include a gradual reduction in the amount
of salt added to processed food and consumer-friendly labelling showing the
sodium content of food.
Dietary Guidelines for Children and Adolescents in Australia
185
3.7 C HOOSE
FOODS LOW IN SALT
Table 3.7.2
Estimated percentages of sodium intake from different
sources
in two studies
Sodium source
James et al.38
Edwards et al.39
Natural
10.0
18.5
Added in food manufacturing
75.0
65.0
Discretionary
Cooking
9.0
9.0
At table
6.0
6.0
A recommendation that food manufacturers reduce the amount of salt added to
their products is not without precedent. In 1982 the NHMRC Working Party on
Sodium43 recommended that food manufacturers be asked to do this; foods such
as bread, cheese, butter, margarine, processed meats and snack foods were
named as items of critical importance. Food manufacturers responded to this call
with the range of reduced- and low-salt alternatives now available. A 1995
survey of 63 brands of processed food sold in Australian supermarkets found an
overall decrease in sodium concentration of 10 per cent compared with 15 years
previously, the greatest change being evident in convenience foods, cheeses,
potato crisps and breakfast cereals.44
In 1993 the US National High Blood Pressure Education Program Working Group
called for food processors to lower the sodium content of their products45, and
there is at least some evidence that a modest reduction may have occurred.46
Information on sodium content is now included on food labels (in terms of
density or standard serve), but it is easy to confuse salt and sodium and
consumers may not be aware of the definition of a low-salt food. As with other
nutrients, the sodium content usually needs to be considered in terms of the
actual amount of the food consumed. It is particularly difficult for consumers to
obtain compositional information on prepared food such as takeaway foods and
restaurant meals.
When consumers reduce the amount of salt in their diet, the rated intensity of
salt in a solid food increases and the concentration of salt in soup and crackers
that previously produced maximum pleasantness decreases.47,48 The effects are
observed within two months, although they may take many months to reach their
full extent. In clinical trials, moderate sodium reduction was not associated with
physical complaints or with impairment of quality of life.49,50
Sodium sensitivity
The sensitivity of people’s blood pressure response to dietary sodium varies50–52,
and salt sensitivity may be related to mortality independently of blood pressure.53
Salt sensitivity appears to be a continuous phenomenon54, and its definition is
186
Dietary Guidelines for Children and Adolescents in Australia
3.7 C HOOSE
FOODS LOW IN SALT
arbitrary; however, it appears to be reproducible in individuals.55 A clinically
practical means of identifying salt sensitivity is yet to be found.52 It has been
shown that the prevalence of sensitivity increases with age54, raising doubts
about the persistence of a determination of being ‘insensitive’ to dietary salt. Salt
sensitivity is also associated with defective endothelial-dependent vasodilation in
people with hypertension56, although the reason for this is not understood. Salt
sensitivity is an area of active research, and a better understanding of the
mechanisms involved will probably improve our understanding of the health
effects of dietary salt intake.
Changes needed to current diet
The recommended dietary intake for Australian adults for sodium is 40–
100mmol/day (920–2300mg), with no extra recommendation for pregnancy or
lactation.42 The following are the recommendations for children and adolescents:
•
for children aged to 6 months, 6–12mmol (140–280mg) per day
•
for children aged 7–12 months, 14–25mmol (320–580mg) per day
•
for 1–3 year olds, 20–75mmol (460–1730mg) per day
•
for 4–7 year olds, 26–100mmol (600–2300mg) per day
•
for 8–18 year olds, 40–100mmol (920–2300mg) per day—the same as for
adults.
To achieve this intake, children and adolescents should consume fresh food,
foods normally processed without salt, and low-salt or no-added-salt groceries,
and they should avoid adding salt to food.57 Among the substitutes for salt are
acidic ingredients such as vinegar, lemon, lime, plum and other fruit juices; curry
spices; garlic and onion; and herbs.57 These flavour substitutes may, however, be
inappropriate for children who have never been habituated to salt: parents
should take care not to rely on their own taste perception of salt when
flavouring food for their children.
Sodium intake is poorly measured by many dietary survey methods that are used
to measure other food components because foods of similar type vary widely in
their sodium content (for example, breakfast cereals) and dietary addition can be
discretionary but not easily quantifiable (for example, adding salt when cooking
and at meals). Measuring sodium output in urine over a 24-hour period is an
accurate way of estimating sodium intake: about 93 per cent of dietary sodium is
recovered in the urine.38 Day-to-day variation in sodium intake is high26,58, so
intake for a single day generally does not accurately reflect a person’s usual
long-term intake.
The sodium intake of Australian children and adolescents has not been measured
in large population surveys. As a consequence, the extent to which this
population group meets the recommended intake for each age is not known. But
it is known that most adults overconsume salt by a large amount—as discussed
in the Dietary Guidelines for Adult Australians—and it is likely that the same
applies to children and adolescents.
Dietary Guidelines for Children and Adolescents in Australia
187
3.7 C HOOSE
FOODS LOW IN SALT
People wanting to achieve a low sodium intake should choose low-salt foods—
that is, with a sodium content up to 120 milligrams per 100 grams. Fresh foods
such as fruit, vegetables, meat, milk and yoghurt are well under the sodium limit
but most manufactured foods are well over it.59 Breads have a sodium content
typically as high as 400–725 milligrams per 100 grams. ‘Salt-free’ bread can be
difficult to find, but it (and other low-salt products) should be sought out. People
used to a higher salt intake will at first miss the taste of salt when they begin a
lower salt intake. But the palate adapts to lower sodium levels, and people will
find that the intensity of salt in food increases and their ‘preferred saltiness’ of
food reduces.47,48 Changes will be noticed within a week and taste change will
continue for many months.
Salt in relation to prevention of iodine deficiency
Iodine deficiency disorders were once common in several Australian states, and
a traditional control measure has been the sale of iodised salt. Only table salt is
iodised, however, and its use has declined to the point where in a Hobart survey
in 1995 over 50 per cent of both sexes stated that they neither cooked with salt
nor used it at the table.60 Mild iodine deficiency is now regarded as an important
cause of preventable mental retardation, and it is alarming that urinary excretion
has revealed moderate to severe iodine deficiency, even in a survey of
outpatients (including pregnant women) at a metropolitan hospital in Sydney.61
Adherence to the salt guideline reduces salt’s availability as a vehicle for iodine,
and iodine fortification of one or more staple foods, such as bread, may need to
be considered.
R E L AT I O N S H I P
TO OT H E R G U I D E L I N E S
The first edition of the Dietary Guidelines for Children and Adolescents2
contained the guideline ‘Choose low-salt foods’. This current review concurs that
the most rational way of achieving a lower sodium intake is through choosing
low-salt foods, but the wording of the guideline has been changed slightly to
emphasise that many foods are naturally low in salt and that consumption of
specially manufactured ‘low-salt’ foods is not the only way to limit one’s salt
intake. Although discretionary use of salt is an important source of dietary
sodium for many people, a single-focus, simple message is considered an
important priority for this guideline.
This dietary guideline is consistent with each of the other guidelines presented
here. Many manufactured foods have a large amount of salt added: these should
be avoided while maintaining (or attaining) a healthy intake of breads and
cereals and fruit and vegetables. A lower dietary sodium intake would be much
more easily achieved if manufacturers in general were to decrease the amount of
salt added to their products—following the lead that some manufacturers have
set—and consumers were easily able to assess the sodium content of
manufactured food.
188
Dietary Guidelines for Children and Adolescents in Australia
3.7 C HOOSE
FOODS LOW IN SALT
Many diet-related factors are likely to be helpful in treating hypertension and
limiting the risk of developing the condition. Among these are maintaining a
healthy body weight, a moderate alcohol intake, and a relatively high potassium
intake, and opting for a diet high in fruits and vegetables and low-fat dairy
products (the DASH diet).
CONCLUSION
The past decade has seen the emergence of international consensus that a
modest reduction in dietary sodium intake for people with normal and raised
blood pressure has a sufficiently large effect on blood pressure (and therefore
health) to justify a guideline advising restraint for the entire population.62 This
consensus is strongly supported by a large and well-conducted randomised
controlled trial27 in which subject retention was high and dietary compliance was
optimised by providing all of the food throughout the trial period.
The proportion of the population who would benefit at older ages from a lower
intake of dietary sodium is becoming increasingly large, yet salt in foods is
difficult to avoid, mainly because of the large amount added by food
manufacturers. A lifelong intake of dietary sodium within the recommended
range would obviate the often-stated difficulty of reducing dietary sodium intake
in later life. The Australian diet contains an unnecessarily large amount of salt,
and a gradual reduction will certainly benefit the large numbers of people
currently destined to develop hypertension; it would probably also benefit a
substantial proportion of people who will otherwise develop disease—in
particular, cardiovascular disease.
Primary prevention of hypertension poses one of the greatest challenges for
public health in the 21st century, and reducing dietary salt is a leading
population health strategy for achieving this goal.
EVIDENCE
There is strong evidence that reducing dietary sodium reduces average blood
pressure in groups of people whose blood pressure is raised. The evidence
comes from well-conducted randomised controlled trials and is supported by
meta-analyses of these—Level I evidence (references 21 and 28 to 30). The size
of the effect is clinically important and is larger for older individuals and at
higher blood pressures. The effect appears to be evident for ‘high-normal’ blood
pressure; that is, when blood pressure is not high enough to be categorised
‘hypertensive’. The evidence is relevant even though randomised controlled trials
have not been conducted to assess mortality or morbidity outcomes other than
change in blood pressure.
There is also Level II evidence (references 9, 24, 31 to 33, 47 and 48), Level III
evidence (references 10, 20 and 52) and Level IV evidence (reference 49) of the
relationship between blood pressure and salt reduction. Further, there is Level II
Dietary Guidelines for Children and Adolescents in Australia
189
3.7 C HOOSE
FOODS LOW IN SALT
evidence of a relationship between sodium intake and blood pressure in infants
(references 17 and 18) and Level III evidence that urinary sodium–potassium
ratios relate to rising blood pressure in children (reference 18).
The evidence that reducing dietary sodium levels to the recommended intake of
40–100mmol (920-2300 mg) a day causes adverse health effects is weak. Adverse
health effects have not been observed in the randomised controlled trials
conducted to date. Adverse health effects that become apparent over long
periods seem unlikely, given the low dietary sodium intake observed in many
populations without apparent specific ill-effect and the presumed low dietary
sodium intake by humans—by analogy with other terrestrial mammals—over
much of their history.
REFERENCES
1.
Kurtz TW, Al-Bander H, Morris RC. ‘Salt-sensitive’ essential hypertension in
man. Is the sodium ion alone important? New Engl J Med 1987;317:1043–8.
2.
National Health and Medical Research Council. Dietary guidelines for
children and adolescents. Canberra: Australian Government Publishing
Service, 1995.
3.
Australian Institute of Health and Welfare. Australia’s health 2000: the
seventh biennial health report of the Australian Institute of Health and
Welfare. Canberra: AIHW, 2000.
4.
National Health and Medical Research Council. Clinical practice guidelines:
prevention of stroke—the role of anticoagulants, antiplatelet agents and
carotid endoarterectomy. Canberra: AGPS, 1997.
5.
Britt H, Sayer GP, Miller GC, Charles J, Scahill S, Horn F et al. General
practice activity in Australia, 1998–99. General Practice Series no. 2. Cat.
no. GEP2. Canberra: Australian Institute of Health and Welfare, 1999.
6.
Australian Institute of Health and Welfare. Heart, stroke and vascular
diseases: Australian facts. Cardiovascular Disease Series no. 10. Cat. no.
CVD 7. Canberra: AIHW, National Heart Foundation of Australia & National
Stroke Foundation of Australia, 1999.
7.
Department of Health and Aged Care & Australian Institute of Health and
Welfare. National health priority areas report: cardiovascular health,
1998—summary. AIHW cat. no. PHE 12. Canberra: DHAC & AIHW, 1999.
8.
Alderman MH. Salt, blood pressure and human health. Hypertension
2000;36:890–3.
9.
Law MR, Frost CD, Wald NJ. By how much does dietary salt reduction
lower blood pressure? III. Analysis of data from trials of salt reduction. BMJ
1991;302:819–24.
190
Dietary Guidelines for Children and Adolescents in Australia
3.7 C HOOSE
FOODS LOW IN SALT
10.
MacMahon S, Peto R, Cutler J, Collins R, Sorlie P, Neaton J et al. Blood
pressure, stroke and coronary heart disease. Part 1. Prolonged differences
in blood pressure: prospective observational studies corrected for the
regression dilution bias. Lancet 1990;335:765–74.
11.
Law MR. Epidemiologic evidence on salt and blood pressure. Am J
Hypertens 1997;10:42S–45S.
12.
MacGregor GA. Salt—more adverse effects. Am J Hypertens 1997;10:37S–41S.
13.
Carey OJ, Locke C, Cookson JB. Effect of alterations of dietary sodium on
the severity of asthma in men. Thorax 1993;48:714–18.
14.
Worthington-Roberts BS, Williams SR eds. Nutrition throughout the
lifecycle. 4th edn. New York: McGraw-Hill, 2000.
15.
Campbell K, Crawford D. Family food environments as determinants of
preschool-aged children’s eating behaviours: implications for obesity
prevention policy—a review. Aust J Nutr Diet 2001;58:19–25.
16.
Blais CA, Pangborn RM, Borhani NO, Ferrell MF, Prineas RJ, Laing B. Effect
of dietary sodium restriction on taste responses to sodium chloride: a
longitudinal study. Am J Clin Nutr 1986;44:232–243.
17.
Hofman A, Hazebroek A, Valkenburg HA. A randomized trial of sodium
intake and blood pressure in new born infants JAMA 1983;250:370–3.
18.
Geleijnse JM, Hofman A, Witteman JC, Hazebroek AA, Valkenburg HA,
Grobbee DE. Long-term effects of neonatal sodium restriction on blood
pressure. Hypertension 1997;29:913–17. (Erratum appeared in Hypertension
1997;29:1211.)
19.
Geleijnse JM, Grobbee DE, Hofman A. Sodium and potassium intake and
blood pressure change in childhood. BMJ 1990;300:899–902.
20.
Ambard L, Beaujard E. Causes de l’hypertension artérielle. Archives
générales de médecine 1904;1:520–33.
21.
Graudal NA, Galloe AM, Garred P. Effects of sodium restriction on blood
pressure, rennin, aldosterone, catecholamines, cholesterols and
triglyceride: a meta-analysis. JAMA 1998;279:1383–91.
22.
Law MR, Frost CD, Wald NJ. By how much does dietary salt reduction
lower blood pressure? I. Analysis of observational data among populations.
BMJ 1991;302:811–15.
23.
Denton D, Weisinger R, Mundy NI, Wickings EJ, Dixson A, Moisson P et al.
The effect of increased salt intake on blood pressure of chimpanzees.
Nature Med 1995;1:1009–16.
24.
Dahl LK. Salt and hypertension. Am J Clin Nutr 1972;25:231–44.
25.
Kuller LH. Salt and blood pressure: population and individual perspectives.
Am J Hypertens 1997;10:29S–36S.
Dietary Guidelines for Children and Adolescents in Australia
191
3.7 C HOOSE
FOODS LOW IN SALT
26.
Intersalt Cooperative Research Group. Intersalt: an international study of
electrolyte excretion and blood pressure. Results for 24 hour urinary
sodium and potassium excretion. BMJ 1988;297:319–28.
27.
Frost CD, Law MR, Wald NJ. By how much does dietary salt reduction
lower blood pressure? II. Analysis of observational data within
populations. BMJ 1991;302:815–18.
28.
Cutler JA, Follmann D, Allender PS. Randomized trials of sodium reduction:
an overview. Am J Clin Nutr 1997;65(suppl.):643S–651S.
29.
Cutler JA, Follmann D, Elliott P, Suh IL. An overview of randomized trials
of sodium reduction and blood pressure. Hypertension
1991;17(suppl. 1):27–33.
30.
Midgley JP, Matthew AG, Greenwood CMT, Logan AG. Effect of reduced
dietary sodium on blood pressure: a meta-analysis of randomized
controlled trials. JAMA 1996;275:1590–7.
31.
Sacks FM, Svetley LP, Vollmer WM, Appel LJ, Bray GA, Harsha D et al. Effects
on blood pressure of reduced dietary sodium and the dietary approaches to
stop hypertension (DASH) diet. New Engl J Med 2001;344:3–10.
32.
Whelton PK, Appel LJ, Espeland MA, Applegate WB, Ettinger WH, Kostis
JB et al. for the TONE Collaborative Research Group. Sodium reduction
and weight loss in the treatment of hypertension in older persons: a
randomized controlled trial of nonpharmacologic interventions in the
elderly (TONE). JAMA 1998;279:839–46.
33.
Appel LJ, Moore TJ, Obarzanek E, Vollmer WM, Svetkey LP, Sacks FM et al.
for the DASH Collaborative Research Group. A clinical trial of the effects
of dietary patterns on blood pressure. N Engl J Med 1997;336:1117–24.
34.
Greenland P. Beating high blood pressure with low-sodium DASH.
Editorial. New Engl J Med 2001;344:53–5.
35.
Cook NR, Cohen J, Hebert PR, Taylor JO, Hennekens CH. Implications of
small reductions in diastolic blood pressure for primary prevention. Arch
Intern Med 1995;155:701–9.
36.
Guest C, O’Dea K. Food habits in Aborigines and persons of European
descent of southeastern Australia. Aust J Publ Hlth 1993;17:321–4.
37.
Department of Health and Family Services. The Australian guide to healthy
eating: background information for nutrition educators. Canberra: DHFS,
1998.
38.
James WPT, Ralph A, Sanchez-Castillo CP. The dominance of salt in
manufactured food in the sodium intake of affluent societies. Lancet
1987;1:426–9.
39.
Edwards DG, Kaye AE, Druce E. Sources and intakes of sodium in the
United Kingdom diet. Eur J Clin Nutr 1989;43:855–61.
40.
Stamler J. Dietary salt and blood pressure. Ann NY Acad Sci 1993;676:122–56.
192
Dietary Guidelines for Children and Adolescents in Australia
3.7 C HOOSE
FOODS LOW IN SALT
41.
Mattes RD, Donelly D. Relative contributions of dietary sodium sources. J
Am Coll Nutr 1991;10:383–93.
42.
National Health and Medical Research Council. Recommended dietary
intakes for use in Australia. Canberra: Australian Government Publishing
Service, 1991.
43.
National Health and Medical Research Council. Report of the Working Party
on Sodium in the Australian diet. Canberra: AGPS, 1982.
44.
National Blood Pressure Advisory Committee. Salt and hypertension: a
paper for health professionals. National Heart Foundation of Australia
<www.heartfoundation.com.au>.
45.
National High Blood Pressure Education Program Working Group. Report on
primary prevention of hypertension. Arch Intern Med 1993;153:186–208.
46.
Jacobson MF, Liebman BF. Letter. Sodium in processed foods. Am J Clin
Nutr 1996;63:138–40.
47.
Blais CA, Pangborn RM, Borhani NO, Ferrell MF, Prineas RJ, Laing B. Effect
of dietary sodium restriction on taste responses to sodium chloride: a
longitudinal study. Am J Clin Nutr 1986;44:232–43.
48.
Bertino M, Beauchamp GK, Engelman K. Long-term reduction in dietary
sodium alters the taste of salt. Am J Clin Nutr 1982;36:1134–44.
49.
Grimm RH Jr, Grandits GA, Cutler JA, Stewart AL, McDonald RH, Svendsen
K et al. Relationships of quality-of-life measures to long-term lifestyle and
drug treatment in the Treatment of Mild Hypertension Study. Arch Intern
Med 1997;157:638–48.
50.
Kumanyika S. Behavioral aspects of intervention strategies to reduce
dietary sodium. Hypertension 1991;17(suppl. 1):190–5.
51.
Luft FC, Weinberger MH. Heterogeneous responses to changes in dietary
salt intake: the salt-sensitivity paradigm. Am J Clin Nutr 1997;65:612S–
617S.
52.
Mattes RD, Falkner B. Salt-sensitivity classification in normotensive adults.
Clin Sci 1999;96:449–59.
53.
Weinberger MH, Fineberg NS, Fineberg SE, Weinberger M. Salt sensitivity,
pulse pressure, and death in normal and hypertensive humans.
Hypertension 2001;37(part 2):429–32.
54.
Weinberger M. Sodium and volume sensitivity of blood pressure: age and
pressure change over time. Hypertension 1991;18:67–71.
55.
Weinberger MH. Salt sensitivity of blood pressure in humans. Hypertension
1996;27:481–90.
56.
Bragulat E, Sierra A, Antonio MT, Coca A. Endothelial dysfunction in saltsensitive essential hypertension. Hypertension 2001;37(part 2):444–8.
Dietary Guidelines for Children and Adolescents in Australia
193
3.7 C HOOSE
FOODS LOW IN SALT
57.
McCarron DA. The dietary guideline for sodium: should we shake it up?
Yes! Am J Clin Nutr 2000;71:1013–19.
58.
Liu K, Cooper R, McKeever J, McKeever P, Byington R, Soltero I et al.
Assessment of the association between habitual salt intake and high blood
pressure: methodological problems. Am J Epidemiol 1979;110:219–26.
59.
Beard TC. Salt in medical practice. 2nd edn. Holland Park: Queensland
Hypertension Association, 2000.
60.
Beard TC, Woodward DR, Ball P, Hornsby H, von Witt RJ, Dwyer T. The
Hobart salt study 1995: few meet national sodium intake target. Med J Aust
1997;166:404–7.
61.
Gunton JE, Hams G, Fiegert M, McElduff A. Iodine deficiency in
ambulatory participants at a Sydney teaching hospital: is Australia truly
replete? Med J Aust 1999;171:467–70.
62.
WHO Expert Committee. Hypertension control, WHO Technical Report
Series no. 862. Geneva: World Health Organization, 1986.
194
Dietary Guidelines for Children and Adolescents in Australia
3.8 C ONSUME
3.8
ONLY MODERATE AMOUNTS OF SUGARS AND FOODS CONTAINING ADDED SUGARS
C O N S U M E O N LY M O D E R AT E
AMOUNTS OF SUGARS AND FOODS
C O N TA I N I N G A D D E D S U G A R S
Colin Binns
TERMINOLOGY
Carbohydrates
Carbohydrates are polyhydroxy aldehydes, ketones, alcohols, acids, their simple
derivatives, and their polymers having linkages of the acetal type. They can be
classified according to their degree of polymerisation and can be divided initially
into three principal groups—sugars, oligosaccharides and polysaccharides (see
Table 3.8.1).
Table 3.8.1
The major dietary carbohydrates1
Class (DP)
Subgroup
Components
Sugars (1–2)
Monosaccharides
Glucose, galactose, fructose
Oligosaccharides (3–9)
Polysaccharides (>9)
Disaccharides
Sucrose, lactose, trehalose
Polyols
Sorbitol, mannitol
Malto-oligosaccharides
Maltodextrins
Other oligosaccharides
Raffinose, stachyose, fructooligosaccharides
Starch
Amylose, amylopectin,
modified starches
Non-starch polysaccharides
Cellulose, hemicellulose, pectins,
hydrocolloids
Note: DP = degree of polymerisation.
Sugars
The term sugars is conventionally used to describe monosaccharides and
disaccharides such as sucrose, glucose and fructose. These can be found
naturally in foods or can be added to foods in processing. Sugars is the term
used in the analysis of the 1995 National Nutrition Survey; sugar, by contrast, is
used to describe purified sucrose, as are the terms refined sugar and added
sugar.
Dietary Guidelines for Children and Adolescents in Australia
195
3.8 C ONSUME
ONLY MODERATE AMOUNTS OF SUGARS AND FOODS CONTAINING ADDED SUGARS
Intrinsic and extrinsic sugars
Intrinsic sugars describes sugars occurring within the cell walls of plants—that
is, naturally occurring sugars—while extrinsic sugars is used to describe sugars
that are usually added to foods. However, the naturally occurring sugar in milk,
lactose, is also an extrinsic sugar, so an additional phrase, non-milk extrinsic
sugars is used in the literature. These terms have not gained wide acceptance,
and there are no current plans to measure these sugars separately in the diet or
to incorporate such data in food tables.1 The terms refined, added and extrinsic
sugars are sometimes used to denote sucrose and glucose used in the food
industry and in the home.
Physiologically, there is no difference between the sugars that occur naturally in
food and the refined sugars that are added to the diet. Among foods rich in
added sugars are confectionery, cakes, pastries, biscuits, fruit drinks, cordials and
carbonated soft drinks. Foods with high added-sugar content often have a lower
nutrient content but are energy dense. The term no added sugar means no
sugars have been added during the manufacturing process; it does not mean that
no sugar is present, since most foods contain sugars in some form.
B AC K G RO U N D
Many of the foods found in the Australian diet contain naturally occurring sugars.
In other foods, sugars (particularly sucrose) may be added during processing, to
increase the food’s palatability and acceptability and sometimes to add bulk.
Sugars provide a readily absorbed source of energy and have an important role
as sweeteners and flavour enhancers. The presence of high amounts of sugar
can, however, dilute the nutrient density of the diet, and diets high in added
sugar have been associated with development of obesity and dental caries.
Because sugars are a significant source of energy in the Australian diet, all
previous sets of dietary guidelines—for adults, children and adolescents, and
older Australians—have included a guideline on sugar or sugars. Over the years
the emphasis has changed, from a guideline aimed at reducing the amount eaten
to one that emphasises care and moderation in the amount consumed. This
reflects changing scientific knowledge and the relative stability of sugar
consumption in Australia. The US year 2000 dietary guidelines include in the
section on eating sensibly the guideline ‘Choose beverages and foods that limit
your intake of sugars’.2 A review by Sheiham lists 23 countries that currently
make dietary recommendations on sugars.3 The pros and cons of retaining an
Australian dietary guideline on sugar have recently been debated in the literature
by Stanton4, O’Dea and Mann5, and Williams.6
Sugars in the Australian diet
Australian adults derive about 45 per cent of their energy from carbohydrates
and about half of this comes from sugars. The results of the 1995 National
Nutrition Survey show that the percentage of energy from total sugars intake
196
Dietary Guidelines for Children and Adolescents in Australia
3.8 C ONSUME
ONLY MODERATE AMOUNTS OF SUGARS AND FOODS CONTAINING ADDED SUGARS
declines from age 2–3 years to age 45–64 years; this is followed by a slight
increase in intake in the 65 years and over age group (see Table 3.8.2).7,8 The
percentage of energy from added sugars remains at a similar level from age 2–3
years to age 19–24 years but falls from age 25 years. Natural sugars as a
percentage of energy were highest in very young children and adults over 65
years and lowest in the 19–44 year age group.
Table 3.8.2
Carbohydrates: mean percentage contribution to energy
intake, by age, 19958
Age (years)
2–3
%
4–7
%
8–11
%
12–15
%
16–18
%
19–24
%
25–44
%
45–64
%
65+
%
Carbohydrate
52
52
50
52
49
46
45
44
45
Total sugars
29
28
25
26
25
22
19
19
21
Added sugars
14
15
15
15
15
13
10
9
9
Natural sugars
16
13
10
10
10
9
9
11
12
Figure 3.8.1 shows the amounts (in grams per day) of sugars consumed, as
recorded in the 1995 National Nutrition Survey.
Figure 3.8.2 shows the amount of sugars in the diet as a percentage of energy.
Because of the higher energy consumption of adolescents and young adults,
when consumption of sugars is expressed as a percentage of energy the peaks
are much lower than for Figure 3.8.1. Male adolescents are the highest
consumers of added sugars, both in absolute amounts and as a percentage of
energy.
Figure 3.8.1 Consumption of sugars, by age: 1995 National Nutrition Survey8
Dietary Guidelines for Children and Adolescents in Australia
197
3.8 C ONSUME
ONLY MODERATE AMOUNTS OF SUGARS AND FOODS CONTAINING ADDED SUGARS
Figure 3.8.2 Consumption of total and added sugars as a percentage of energy, by age:
1995 National Nutrition Survey8
Figure 3.8.3 shows the sources of added sugars in the Australian diet, as
recorded in the 1995 National Nutrition Survey, which used a 24-hour recall
method.
Figure 3.8.3 Sources of added sugars, by age: 1995 National Nutrition Survey8
Note: Adults = people aged 19 years and over; children = people aged 2 to 18 years.
198
Dietary Guidelines for Children and Adolescents in Australia
3.8 C ONSUME
ONLY MODERATE AMOUNTS OF SUGARS AND FOODS CONTAINING ADDED SUGARS
The most recent information on sugars (sucrose only) consumption comes from
the Australian Bureau of Statistics Apparent Consumption of Foodstuffs, 1997–98
and 1998–99.9 Apparent consumption has fallen by about 15 per cent from prewar levels, or by 23 per cent from the post–World War 2 peak reached in 1948
(see (kg 3.8.3). The apparent consumption data do not represent actual
consumption by individuals or population groups—some sugar is wasted and
some is used for brewing and other purposes—but they do give an indication of
trends. Baghurst et al.10 discuss the differences between apparent consumption of
sugar and actual dietary consumption.
Apparent consumption data show that consumption of honey, which is a solution
of sugars, has also declined in recent years and is now 0.5 kilograms per
person.9
Table 3.8.3
Apparent annual consumption of sugar (kg per person),
1938–39 to 1998–999
Sugar
1938–39
1948–49
1958–59
1968–69
1978–79
kg
kg
kg
kg
kg
1988–89 1998–99
kg
kg
Cane sugar as
refined sugar
32.0
31.2
27.0
21.0
14.9
8.8
n.a.
Cane sugar in
manufactured foods
16.3
23.1
23.6
27.7
34.6
33.9
n.a.
Total cane sugar
48.3
54.3
50.6
48.7
49.5
42.7
37.6
Total sugars
50.8
56.8
53.0
51.9
54.5
48.3
43.4
n.a. Not available.
In the 1930s, 60 per cent of sugar used in Australia was in the form of added
sugar. Now the proportions are reversed: 73 per cent of sugar is used in food
processing.
In remote Aboriginal communities, apparent consumption of sugar is much
higher than the Australian average, as shown in Table 3.8.4. Lee et al.’s study11
shows that sugar consumption is high, whereas fruit and vegetable consumption
is well below the Australian average. In the communities where apparent
consumption was measured, refined sugars contributed approximately 30 per
cent of total energy intake. Sixty per cent of the apparent high intake of sugars
was derived from white sugar per se, which is in marked contrast to recent
figures for the wider Australian community. No data are available for urban
Indigenous communities.
Dietary Guidelines for Children and Adolescents in Australia
199
3.8 C ONSUME
ONLY MODERATE AMOUNTS OF SUGARS AND FOODS CONTAINING ADDED SUGARS
Table 3.8.4
Apparent mean consumption of selected foods in Aboriginal
communities (kg/head/year) compared with national data11,12
Aboriginal communities
Central Desert
Northern coastal
Food
(n=3)
(n=3)
Australia
Flour (white)
37.6
44.4
n.a.
Bread (all)
34.1
30.5
45.5
Beef and veal
51.6
25.8
41.4
Poultry
22.3
19.7
23.0
Lamb
22.8
3.3
16.8
Fish
–
4.8
4.0
Fruits
33.2
17.6
106.9
Vegetables
24.3
19.6
136.2
Sugar (refined)
54.1
50.3
8.2
Carbonated beverages
67.9
224.6
73.0
Fruit juice
48.3
12.8
n.a.
– Zero.
n.a. Not available.
Note: ‘Bread’ includes flour used in bread-making.
A review of the nutrition of Indigenous Australians has suggested that a
reduction in sugar consumption in this group would be an important strategy to
improve their health and nutritional status.13
Intake of sugars in relation to the total diet
There are two important nutrition questions relating to consumption of sugar in
the diet. The first concerns other nutrients that might be associated with sugars,
and much has been written about a fat–sugar relationship. The second concerns
nutrient density: if sugar (sucrose) provides around 10–15 per cent of energy in
the diet, is the remainder of the diet sufficiently nutrient dense to provide all the
necessary nutrients?
A number of authors have suggested that high consumption of extrinsic sugar is
associated with high intakes of dietary fat.14 Studies from Europe and Australia
suggest, however, that—although it is possible to identify some foods rich in
both fat and sugars—in the context of the whole diet, foods that are the primary
sources of sugars are only minor sources of fat and vice versa.15 Studies of the
relationship between a low-fat diet and refined sugar intake often show an
inverse relationship.15–19 One study, of 3290 people living in Victoria and South
Australia, found that respondents who had the lowest relative intake of fat had
high intakes of simple sugars, both natural and refined.20 In the 1995 National
Nutrition Survey publications, only information on total sugars is available and
this does not show a consistent relationship between sugars and fat intake.7 A
200
Dietary Guidelines for Children and Adolescents in Australia
3.8 C ONSUME
ONLY MODERATE AMOUNTS OF SUGARS AND FOODS CONTAINING ADDED SUGARS
further analysis of the survey data8 showed that those adults in the highest tertile
of percentage of energy from total sugars had a significantly lower percentage of
fat in their diet, but there was no difference in the percentage of fat intake
between the lowest, middle and highest tertiles of percentage of energy from
added sugars.
Some studies, particularly the larger studies from the United States, suggest that
high intakes of sugar are linked to diet quality. Using food intake data from a
representative sample of 15 011 people, Naismith et al.18 divided the sample into
quartiles based on added sugar consumption. Many high consumers of sugar also
overconsumed total energy. The intake of fruit in this group was lower than in
other groups with similar energy intakes. The 41 per cent of sugar
overconsumers who did not consume excessive energy compensated for the
additional energy by reducing their intakes of other foods, including the fruit,
vegetable, milk and grains groups. Similarly, an analysis of the third National
Health and Nutrition Examination Survey (n=15 611, aged 20 years or over)
showed that energy-dense, nutrient-poor foods tended to be consumed at the
expense of foods that are nutrient dense. The former group included foods high
in fat and/or sugar, such as soft drinks, confectionery, biscuits, cakes, desserts,
pastries and processed savoury snacks. A recent review by Williams6,
summarising a number of studies from the United States and the United
Kingdom, noted that in most cases energy and nutrient intakes were positively
related to total sugar intake. At any given level of energy intake, however, as the
proportion of sugars in the diet is increased the nutrient density will fall.21
The report of the UK Committee on Medical Aspects of Food concluded:
• on average people with high total energy intakes eat more of all
nutrients including sugar
• sugar intake is a weaker predictor of absolute micronutrient intake than
total energy consumption.
The association between high refined-sugar intake and low micro-nutrient intake
was investigated by re-examining data from three large-scale Australian
population surveys of dietary intake in adults22 and from the CSIRO sugars
analysis of the 1995 National Nutrition Survey. The results of this review did not
show a consistent relationship between refined sugar consumption and micronutrient intake. A study of older South Africans23 showed that as sugar intake
increased there was a significant decrease in the proportion of energy derived
from fat. But a negative aspect of the increasing sugar intake was evidence of
nutrient dilution: with the exception of folate and Vitamin B12, more than onefifth of the subjects failed to consume 67 per cent of the recommended daily
allowance for several vitamins and minerals. This sub-optimal nutrient intake can
be explained by the contribution of cakes, puddings, tarts, meat pies, snacks,
soups, sauces and cool drinks to overall energy intake. (It should be noted,
however, that this study was in older people: its relevance to younger adults and
children and adolescents is not clear.) Results from several other studies vary
depending on the classification of different sugars used, but in general moderate
sugar consumers appear to have the most adequate diet.24–26
Dietary Guidelines for Children and Adolescents in Australia
201
3.8 C ONSUME
ONLY MODERATE AMOUNTS OF SUGARS AND FOODS CONTAINING ADDED SUGARS
The 1995 National Nutrition Survey shows that an increasing proportion of
energy is obtained from meals and snacks eaten outside the home7, and it is
likely that these have a higher sugar and fat content than the rest of the diet.
Summerbell et al.27 found that 25 per cent of adolescents’ and 20 per cent of
adults’ daily energy intake was in the form of snacks and that the proportion of
energy derived from total sugars in snacks was greater than that in meals. Most
often this sugar was provided by plain biscuits and milk and sugar added to cups
of tea and coffee.
If energy balance is to be maintained—or approximately maintained—foods of
high energy content and lower nutrient density must be replacing other food
groups. When more foods of low nutritional value (lower nutrient density) are
consumed, either less of the foods that supply essential nutrients will be
consumed or the total kilojoule intake will rise.
Foods prepared for infants should contain relatively low levels of sugar. The
Australian Food Standards Code stipulates that if foods prepared for infants
contain more than 4 grams per 100 grams of added sugar they must be labelled
as ‘sweetened’.
In summary, then, it is likely that the results of surveys reported as averages of
group consumption obscure the effects of consumers who are in the upper
percentiles of sugar intake. It is important that care is taken with snack foods
that are high in added sugars, since foods that are high in refined sugars (for
example, soft drinks and confectionery) are energy dense but do not provide
vital nutrients. Foods such as cakes, biscuits and confectionery are high in both
sugar and fat and also energy dense; they provide few nutrients and are often
eaten instead of more nutritious, necessary foods by both children and adults.
SCIENTIFIC
BASIS
Carbohydrates constitute the largest source of energy in the diets of most
people—on average around 45 per cent of the energy in the Australian diet.
Dietary carbohydrates are usually associated in foods with important
micronutrients and phytochemicals. Diets high in carbohydrate are not associated
with the development of obesity independently of energy intake.28 People whose
diets are high in carbohydrates usually have a lower prevalence of obesity, heart
disease, type 2 diabetes, and some forms of cancer.29
Among carbohydrates’ physiological functions are the following:
•
provision of energy
•
effects on satiety and gastric emptying
•
effects on blood glucose and insulin metabolism
•
protein glycosylation
•
bile acid dehydroxylation
•
fermentation—production of hydrogen and methane
202
Dietary Guidelines for Children and Adolescents in Australia
3.8 C ONSUME
•
•
•
•
ONLY MODERATE AMOUNTS OF SUGARS AND FOODS CONTAINING ADDED SUGARS
production of short-chain fatty acids
control of colonic epithelial cell function
bowel habit, laxation and motor activity
effects on large bowel microflora.28
Epidemiological and clinical studies help to give us an understanding of the role
of carbohydrates in the aetiology of disease. Few of these studies suggest a
direct causal link between carbohydrate consumption and disease.
Obesity
The 1995 National Nutrition Survey results demonstrated that obesity is an
increasing problem for all age groups in Australia.7 The World Health
Organization describes this epidemic as part of an ‘escalating epidemic of
overweight and obesity that is affecting many countries in the world’ and notes,
‘The principal causes of the accelerating obesity problem worldwide are
sedentary lifestyles and high-fat, energy-dense diets’ <http://www.who.int/nut/
obs.htm>.
The links between sugar intake and obesity are not clear: many studies show no
links but others suggest there may be cause for concern. In Australia, obesity has
been increasing during the past two decades. Lowered physical activity may, of
course, be involved in the overall picture, but changes in diet may also be
playing a role (see Chapter 2). The national dietary surveys of 1983 to 1985 and
1995 showed a small increase in energy intake in adults (3–4 per cent) and a
larger increase in children aged 10–15 years (11–15 per cent). Carbohydrates
were the macronutrient whose consumption increased most over this period.
It has been suggested that excess consumption of sugar contributes to an energydense diet that may lead to energy imbalance and obesity. In the CARMEN
study30, a randomised controlled trial of diets and weight reduction, subjects
were randomly placed in groups with diets that included reduced fat and high
simple carbohydrate and reduced fat and high complex carbohydrate. The study
found that a reduction in fat intake resulted in a modest, but significant, weight
loss. Whether the carbohydrate was in simple or complex form made no
difference to weight outcomes or to the subjects’ lipid profiles. The lack of a
significant difference between complex and simple carbohydrates may, however,
have been a consequence of insufficient sample size.4
It is nevertheless important to stress that excess energy in any form will promote
the accumulation of excess body fat and that high-carbohydrate diets should be
promoted only in accordance with an individual’s energy needs.28
In a two-year longitudinal study of 548 ethnically diverse school children in the
United States (mean age 11.7 years), Ludwig et al.31 found that an increase in
consumption of sweetened soft drink was linked to increasing body mass index
and risk of obesity. On the other hand, a number of studies have concluded that
intake of carbohydrate or even sucrose has no association with obesity or that
the association may even be negative.32 The Ludwig study used a standardised
Dietary Guidelines for Children and Adolescents in Australia
203
3.8 C ONSUME
ONLY MODERATE AMOUNTS OF SUGARS AND FOODS CONTAINING ADDED SUGARS
food-frequency questionnaire to obtain dietary data. It was undertaken in
adolescents and similar studies have not yet been reported in adults. It does,
however, suggest that there may be cause for concern, and in such an important
and growing area of concern it is essential that additional studies be done to
assess the results’ relevance to the Australian situation.
In some studies, children and adults who ingest large amounts of carbohydrate
or sucrose, or both, have been reported to be leaner than their peers. But the
study participants’ high carbohydrate intake might reflect higher levels of
physical activity. Another reason for the lack of relation between carbohydrate
intake and adiposity, as just noted, might be inaccuracy in assessing intake and
energy expenditure using traditional dietary methods. The ‘doubly labelled water
method’ used for measuring energy expenditure in free-living individuals has
recently cast doubt on the validity of self-reported food intake for adults33,
although dietary data do appear to be more valid for children. Yet another
reason could be that very active children need and ingest more sugar.33
If the study by Ludwig et al.31 is generalisable to the Australian situation, it
suggests that the consumption of sugar-sweetened beverages could be an
independent risk factor for development of obesity in children. This may be
related to the reduced effect on satiety of sugar in a liquid medium. A metaanalysis has shown that compensation for energy in liquid form is less complete
than that for energy in solid form.34 In this context it is of interest to note that
the contribution of fluids (sweetened soft drinks and fruit juices and drinks) to
sugar intake increased in Australian adults between 1983 and 1995 relative to
non-fluid sources, particularly sugar products and fruit products (see
Table 3.8.5). The increase mirrors the situation in the United States and
elsewhere.21,35,36 This is against a background of little change in consumption of
total sugars (see Table 3.8.6) and thus a lessening relative contribution from
other solid food sources.
Table 3.8.5
Percentage intake of sugars from various food groups: children,
1983 and 19958,37
Boys
Food group
1983
Confectionery
Sugar products and dishes
8
Girls
1995
7
b%
1983
9
a%
1995b %
10
11
7
9
7
2
2
2
2
25
20
21
20
Vegetable products
Milk products
a%
Fruit products
11
9
13
10
Cereals and cereal products
17
16
17
15
Non-alcoholic beverages (total)
32
23
34
25
Fruit and vegetable juices and drinks
9
20
20
20
Sweetened soft drinks
8
14
8
13
a. 10–15 year olds assessed by one-day record.
b. 8–15 year olds assessed by one-day recall.
Note: Figures are for 10–15 year olds.
204
Dietary Guidelines for Children and Adolescents in Australia
3.8 C ONSUME
Table 3.8.6
ONLY MODERATE AMOUNTS OF SUGARS AND FOODS CONTAINING ADDED SUGARS
Percentage of energy from total carbohydrates and total
sugars: children, 1983 and 19958,37
Age 8–11 years
Energy
Age 12–15 years
1983
1995
1983
1995
Total carbohydrates
49
50
49
52
Total sugars
24
25
25
26
a. In 1983 this included only 10–11 year olds; in 1995 it included 8–11 year olds.
In the Ludwig et al.31 study, the consumption of diet soft drinks was inversely
associated with becoming obese. In Australia, consumption of beverages, most of
which are sweetened with sugars, is increasing. Carbonated and aerated
beverages have become the most popular beverages, and consumption of these
beverages has continued to increase—from the late 1980s figure of 87.4 litres per
person per year to 113.0 litres in 1998–99. This is an increase of 30 per cent in a
decade and an increase of 3.7 per cent in the year prior to 1998–99.9 Figure 3.8.4
shows the trend in soft drink consumption. By the end of 2000, 19.3 per cent of
soft drinks consumed in Australia were sweetened with non-nutritive sweeteners.
Sugar-sweetened drinks make up the major portion of the soft drink market. The
1995 National Nutrition Survey results showed that consumption of soft drinks in
the 16–18 year and 19–24 year age groups was just over 400 grams a day (see
Figure 3.8.5). About 7 per cent of the reported intake was of non–sugar
containing drinks. The increasing consumption of sweetened drinks (fruit juices
and soft drinks) as a component of increasing energy consumption (see
Chapter 3) suggests that moderation of consumption of these products is
advisable.
Dental caries
Historically, the prevalence of dental caries has increased when the diet has
changed to include more sugars and other refined foods. The relationship
between sugar (sucrose) and dental caries was first documented in the scientific
literature by Miller in 1883, and it has been confirmed in numerous studies since
then.39 Dental caries remains a significant public health problem in Australia: it is
estimated to be the most expensive diet-related health problem.40,41 There have,
however, been dramatic declines in average levels of dental decay, as defined by
the number of decayed, missing and filled teeth. In 12-year-old children, scores
for this criterion fell from approximately 8 in 1965 to 1.01 in 1995.42 These
improvements are obviously the starting point for improvements in oral health in
later life, but even in adults the average number of missing teeth has fallen from
8.3 in 1973 to only 3.6 in 1995. The role of fluoridation in prevention of dental
caries has been documented.43,44
This improvement in the dental health of children does not, however, extend to
Australian Aboriginal children or to Australian children from the lowest socioeconomic groups. Historically, Aboriginal Australians have had substantially less
Dietary Guidelines for Children and Adolescents in Australia
205
3.8 C ONSUME
ONLY MODERATE AMOUNTS OF SUGARS AND FOODS CONTAINING ADDED SUGARS
dental caries than non-Indigenous people, but more recently this trend appears
to have been reversed: the oral health of non-Indigenous children has improved
and that of Aboriginal children has deteriorated.45
Dental caries can be defined as a dietary carbohydrate and saliva–modified
infectious disease. Its key microbiological feature is a dietary carbohydrate
enrichment of the dental plaque microbia with bacteria such as Streptococcus
sobrinus and S. mutans, which increase the acid-producing potential of dental
plaque.46 Development of the disease is a dynamic process involving the
metabolism of a carbohydrate substrate by oral bacteria to produce acid, with
Figure 3.8.4 Per capita consumption of soft drinks, 1990 to 2000 38
Figure 3.8.5 Average daily consumption of fruit juice and soft drink: 1995 National Nutrition Survey7
206
Dietary Guidelines for Children and Adolescents in Australia
3.8 C ONSUME
ONLY MODERATE AMOUNTS OF SUGARS AND FOODS CONTAINING ADDED SUGARS
saliva and host resistance offering protective elements.47 Streptococcus mutans
can ferment sugars to lactic acid. Dietary sugars other than sucrose—for
example, glucose and lactose—can also induce caries formation, although these
sugars are less cariogenic than sucrose because, in addition to being converted
to acid metabolites, sucrose is uniquely used for extracellular polysaccharide
synthesis. Starch is less cariogenic than other dietary sugars because it does not
readily diffuse into plaque and is less readily hydrolysed. Streptococcus mutans,
dietary sugars and a susceptible tooth surface are the important factors in dental
caries. If there is frequent exposure to sugars, the rate of demineralisation of the
tooth will exceed the rate of remineralisation and dental caries will occur.48 The
duration of exposure depends on the extent of retention of sugary foods in the
mouth and the number of eating occasions; it can be difficult to describe and
quantify.47
Comparisons of international data indicate that low sugar consumption does not
necessarily translate into less dental caries or that higher consumption inevitably
leads to more.47 The relationship between the quantity and frequency of sugar
consumption approximates a sigmoid curve. Thus, as the consumption of sucrose
increases, dental caries incidence rises ever more steeply until the curve flattens
out and the increase in dental caries is small with further increases in sucrose
intake.49 A WHO study group49 noted that very little caries occurs in children
when the national per capita sugar (sucrose) consumption is below 10 kilograms
a year (about 30 grams a day) but that a steep increase may occur from
15 kilograms upwards. Studies have also shown that it is the frequency of eating
sugar, rather than the amount of sugar per se, that is related to dental caries.50
The sugars contained in the cellular structure of foods (such as the intrinsic
sugars of fresh fruits and vegetables) have been found to have little cariogenic
potential; it is foods high in extrinsic sugars that are most damaging to the
teeth.51 Petti et al. (cited in reference 47) found that good oral hygiene was three
times more likely to predict low caries prevalence than a ‘low cariogenic’ diet.
The principal diet and health association given for the retention of a sugar
guideline in the US dietary guidelines continues to be dental caries.2 In severe
cases, dental caries can cause loss of teeth and pain that may reduce dietary
intake and compromise nutritional status.
On the basis of the scientific evidence, advice on sugar intake for the prevention
of dental caries should include advice on the frequency of intakes, not just the
amount. The FAO report1 summarises the evidence:
The incidence of dental caries is influenced by a number of factors. Foods
containing sugars or starch may be easily broken down by I-amylase and
bacteria in the mouth and can produce acid which increases the risk of
caries. Starches with a high glycaemic index produce more pronounced
changes in plaque pH than low glycaemic index starch, especially when
combined with sugars. However, the impact of these carbohydrates on
caries is dependent on the type of food, frequency of consumption, degree
of oral hygiene performed, availability of fluoride, salivary function, and
genetic factors. Prevention programs to control and eliminate dental caries
should focus on fluoridation and adequate oral hygiene, and not on
sucrose intake alone.
Dietary Guidelines for Children and Adolescents in Australia
207
3.8 C ONSUME
ONLY MODERATE AMOUNTS OF SUGARS AND FOODS CONTAINING ADDED SUGARS
The British Nutrition Foundation’s report concludes, ‘The evidence establishing
sugars as an aetiological factor in dental caries is overwhelming. The foundation
of this lies in the multiplicity of studies rather than the power of any one’.51
While infants and young children are at risk of dental caries, as people age the
risk increases again.2
Dental caries and infants
Baby-bottle tooth decay, or nursing-bottle caries, is a recognised problem in
infants who are pacified by giving them a bottle to suck on for long periods.
Babies who are allowed to fall asleep while continuing to feed from their bottle
can end up with a severe form of tooth decay. Whether the bottle contains infant
formula, fruit juice or some other carbohydrate-containing food does not seem to
matter.52 (See Chapter 3 for further discussion of fruit juices.)
Carbohydrates and the prevention of dental caries
Both xylitol and sorbitol have been shown to have a preventive effect on dental
caries. Daily consumption of xylitol (5–10 grams a day) added to chewing gum
and confectionery foods has been shown to prevent dental caries in children.53
Highly acidogenic snack foods should be consumed only at meal times to reduce
the risk, and between-meal snacks should be either non-acidogenic (such as
xylitol products) or hypo-acidogenic (such as sorbitol and HSH products).
Cheeses are a natural product that may provide anti-cariogenic effects.24 A
systematic review of published double-blind comparative trials showed that
xylitol-containing chewing gums may provide superior efficacy in reducing caries
rates in high-risk populations.54 One mechanism of the action of xylitolcontaining gums is the stimulation of salivary flow.48
Type 2 diabetes
The rapid cultural change experienced by many populations that previously
consumed a traditional diet and the high incidence of centrally distributed
abdominal obesity in these populations have coincided with high rates of type 2
diabetes. Some populations appear to have a stronger predisposition to the
development of type 2 diabetes than others, suggesting the involvement of
genetic factors. Family history, diet, and lifestyle conditions that are conducive to
obesity will influence the risk of developing diabetes. Development of type 2
diabetes does not appear to be related to ingestion of sugar or other
carbohydrates: it is predominantly influenced by genetics, body weight and
lifestyle factors. Avoiding obesity and increasing intakes of a wide range of foods
that are rich in non-starch polysaccharides and carbohydrates with a low
glycaemic index offer the best means of reducing the rapidly increasing rates of
type 2 diabetes in many countries.28 Dietary fibre may also have a beneficial
effect on insulin metabolism.55
208
Dietary Guidelines for Children and Adolescents in Australia
3.8 C ONSUME
ONLY MODERATE AMOUNTS OF SUGARS AND FOODS CONTAINING ADDED SUGARS
Cardiovascular disease
Body mass index, abdominal obesity, hyperlipidaemia, homocysteineaemia, and
genetic and lifestyle factors are all important in the aetiology of coronary heart
disease. Early studies suggested that a reduction in dietary sucrose could lower
elevated triglyceride levels, but it is likely that the effects seen were the result of
a reduction in energy intake and body weight.25,26 Metabolic studies of lean and
obese volunteers have shown that solid-food diets that are very low in fat and
high in simple sugars markedly stimulate fatty acid synthesis from carbohydrate
and that plasma triglycerides increase in proportion to the amount of fatty acid
synthesis.26
There is some evidence that antioxidants confer protection against the
development of cardiovascular disease. Fruits and vegetables, which are sources
of sugars and carbohydrates, are rich in antioxidants, and increasing the amount
of these foods in the diet can assist in the reduction of saturated fat, which will
provide further protection against cardiovascular disease. There is no evidence of
a causal role for sugar in the development of cardiovascular disease. Ensuring
that the diet contains adequate amounts of fruit, vegetables and carbohydraterich foods—at the expense of fat—and maintaining a healthy body weight are
the basis of dietary advice aimed at reducing the risk of cardiovascular disease.28
When the content of dietary carbohydrate is elevated above the usual level in
our diets (more than 55 per cent of energy), blood concentrations of triglycerides
rise.57 There is, however, a concurrent reduction in LDL cholesterol concentration,
which makes it difficult to predict whether negative health consequences will
result.57
Cancer
In a case-control study of gastric cancer (382 cases and 561 controls), higher
intakes of sugar were found to decrease the likelihood of developing this
cancer.58 Other studies have suggested a link between sugar consumption and
colorectal cancer.59–61 The World Cancer Research Fund reviewed the eight casecontrol studies available to it and concluded that there was a correlation
between sugar intake and colorectal cancer.62 In contrast, when the National
Health and Medical Research Council reviewed the risk factors for colorectal
cancer, sugar was not included as a significant factor.63 The FAO–WHO Expert
Consultation concluded, ‘There is little evidence of any significant correlation
between intake of mono-, di- and oligosaccharides and cancer at any site that
could not be explained by total energy intake’.1 Although it is widely recognised
that diet influences the development of cancer, a consistent role for sugar has
not been identified. Fruit, vegetables and cereal foods are considered to be
protective against some forms of cancer, including colorectal cancer.63
Dietary Guidelines for Children and Adolescents in Australia
209
3.8 C ONSUME
ONLY MODERATE AMOUNTS OF SUGARS AND FOODS CONTAINING ADDED SUGARS
Gastrointestinal diseases other than cancer
Consumption of non-starch polysaccharides and resistant starch contributes to
stool weight: increasing the intake of these foods can effectively prevent
constipation, colon polyps, haemorrhoids and anal fissures. 63,64
Attention deficit/hyperactivity disorder
Attention deficit/hyperactivity disorder is the most common neuro-behavioural
disorder in children and among the most prevalent chronic conditions in schoolaged children. There is no evidence that sugars or sugar-containing foods are
involved in the aetiology of attention deficit/hyperactivity disorder.65
Summary
The evidence for sugar’s role in the aetiology of dental caries is strong. When
energy intake exceeds energy expenditure over a sustained period, overweight
or obesity will result. Excess dietary energy intake—from whatever source,
including sugars—can thus contribute to weight gain, overweight and obesity.
Inappropriately high levels of intake of sugars may also displace other nutrients
from the diet. No other links to the causation of specific disease have been
identified.
On the other hand, moderate use of sugars as sweeteners or to add flavour may
actually improve the palatability of food and increase overall nutrient
consumption. There is no evidence that, for most Australians, consumption of up
to 15–20 per cent of energy as sugars is incompatible with a healthy diet.
Consumption of greater amounts than this could lead to a decrease in nutrient
density. A diet without any sugar would be impractical, hence this guideline:
‘Consume only moderate amounts of sugars and foods containing added sugars’.
PRACTIC AL
ASPECTS OF THIS GUIDELINE
Adding a small amount of refined sugar can increase the palatability of some
highly nutritious foods and increase the overall nutrient intake. For example,
adding a small amount of sugar or honey to porridge and spreading jam on
bread or toast can greatly improve the taste and acceptability of these highcarbohydrate, nutrient-dense foods. But adding stewed fruit to porridge would
offer equal palatability, with less sugar. A growing number of non-nutritive
sweeteners are available and promoted as substitutes for sugars. Although there
are still problems with heat stability, use of non-nutritive sweeteners in
carbonated beverages could reduce the energy load in the highest-consuming
age groups. Some studies on obesity control have shown mixed results, but at
least one study of the use of an artificial sweetener has shown a long-term
benefit for weight control.66
210
Dietary Guidelines for Children and Adolescents in Australia
3.8 C ONSUME
R E L AT I O N S H I P
ONLY MODERATE AMOUNTS OF SUGARS AND FOODS CONTAINING ADDED SUGARS
TO OT H E R G U I D E L I N E S
Enjoy a wide variety of nutritious foods
It is important that a wide variety of foods is included in the diet and that
consumption of foods high in added sugars is kept to moderate levels.
Eat plenty of vegetables, legume and fruits
Sugars are an important constituent of vegetables and fruit, contributing to their
palatability. Adding a small amount of sugar to stewed fruits and some cooked
vegetables can increase their palatability.
Eat plenty of cereals (including breads, rice, pasta and noodles),
preferably wholegrain
Cereals, breads and pasta are an excellent source of energy and nutrients.
Adding small amounts of sugar to cereals and breads can greatly increase their
palatability.
Choose water as a drink
Adding sugar to hot beverages is a common practice; it should be regulated if a
sizeable number of drinks are consumed each day. Artificial sweeteners can be
useful in providing the sweetened flavour but reducing the amount of added
sugar consumed.
CONCLUSION
The amount of sugar added to the diet of Australians should be moderate, to
ensure that valuable nutrients are not diluted by foods high in added sugar and
limited in nutrient density. On the other hand, adding small amounts of sugar to
foods that are energy and nutrient dense can increase the palatability of these
foods and promote their intake.
EVIDENCE
Much of the evidence presented in this guideline relates to dispelling commonly
held beliefs about sugar and disease. As a result, much of it is negative in that it
provides evidence against a hypothesised relationship. There is Level I evidence
of dental caries prevention with xylitol (reference 54) and Level III evidence for
the role of carbohydrates in dental caries (references 39 and 50) and for a link
between consumption of sugar-sweetened drinks and childhood obesity
(reference 31).
Dietary Guidelines for Children and Adolescents in Australia
211
3.8 C ONSUME
ONLY MODERATE AMOUNTS OF SUGARS AND FOODS CONTAINING ADDED SUGARS
In contrast, a number of studies have concluded that intake of carbohydrate, or
even sucrose, has no relationship with obesity or that the relationship may be
negative (see reference 32). Other evidence concerning sugar and dental caries
comes from cross-population studies and observational studies within
populations.
REFERENCES
1.
UN Food and Agriculture Organization. Carbohydrates in human nutrition.
FAO Food and Nutrition Paper no. 66. Rome: FAO, 1997.
2.
Johnson C, Kennedy E. The 2000 Dietary Guidelines for Americans: what are
the changes and why were they made? J Am Diet Assoc 2000;100:769–74.
3.
Sheiham A. Dietary effects on dental diseases. Publ Hlth Nutr
2001;4(2B):569–91.
4.
Stanton R. Sugar: why Australia should retain a dietary guideline. Aust J
Nutr Diet 2001;58:31–6.
5.
O’Dea K, Mann J. Importance of retaining a national dietary guideline for
sugar. Med J Aust 2001;175:165–6.
6.
Williams P. Sugar: is there a need for a dietary guideline in Australia? Aust
J Nutr Diet 2001;58:26–31.
7.
Australian Bureau of Statistics. National Nutrition Survey: selected
highlights, Australia, 1995. Canberra: ABS, 1997.
8.
Cobiac L, Record S, Leppard P, Syrette J, Flight I. Sugars in the Australian
diet: results from the 1995–96 National Nutrition Survey. Adelaide: CSIRO,
2001.
9.
Australian Bureau of Statistics. Apparent consumption of foodstuffs, 1997–
98 and 1998–99, Australia. Canberra: ABS, 2000.
10.
Baghurst K, Record S, Syrette J, Crawford D, Baghurst P. Intakes and
sources of a range of dietary sugars in various Australian populations. Med
J Aust 1989;151:515–18.
11.
Lee A, O’Dea K, Mathews J. Apparent dietary intake in remote Aboriginal
communities. Aust J Publ Hlth 1994;18:190–7.
12.
Australian Bureau of Statistics. Apparent consumption of foodstuffs,
Australia. Canberra: ABS, 1987.
13.
National Health and Medical Research Council. Nutrition in Aboriginal and
Torres Strait Islander peoples: an information paper. Canberra: NHMRC,
2000.
14.
Emmett P, Heaton K. Is extrinsic sugar a vehicle for dietary fat? Lancet
1995;345:1537–40.
15.
Gibney M, Sigman-Grant M, Stanton J, Keast D. Consumption of sugars.
Am J Clin Nutr 1995;62(suppl.):178S–194S.
212
Dietary Guidelines for Children and Adolescents in Australia
3.8 C ONSUME
ONLY MODERATE AMOUNTS OF SUGARS AND FOODS CONTAINING ADDED SUGARS
16.
Bolton-Smith C, Woodward M. Dietary composition and fat to sugar ratios
in relation to obesity. Int J Obes 1994;18:820–8.
17.
Lewis C, Youngmee K, Dexter P, Yetley E. Nutrient intakes and body
weights of persons consuming high and moderate levels of added sugars. J
Am Diet Assoc 1992;92:708–13.
18.
Naismith D, Nelson M, Burley, Gatenby S. Does a high-sugar diet promote
overweight in children and lead to nutrient deficiencies? J Hum Nutr Diet
1995;8:249–54.
19.
Flynn M, Sugrue D, Codd M, Gibney M. Women’s dietary fat and sugar
intakes: implications for food based guidelines. Eur J Clin Nutr
1996;50:713–19.
20.
Baghurst K, Baghurst P, Record S. Demographic and dietary profiles of high
and low fat consumers in Australia. J Epidem Comm Hlth 1994;48:26–32.
21.
Krebs-Smith S. Choose beverages and foods to moderate your intake of
sugars: measurement requires quantification. J Nutr 2001;131(suppl.):527S–
535S.
22.
Baghurst K, Record S, Baghurst P. The relationship between refined sugar
and micronutrient intakes. Proc Nutr Soc Aust 1991;16:33.
23.
Charlton K, Wolmarans P, Lombard C. Evidence of nutrient dilution with high
sugar intakes of older South Africans. J Hum Nutr Diet 1998;11:331–43.
24.
Jensen ME. Diet and dental caries. Dent Clin North Am 1999;43(4):615–33.
25.
Mann J, Truswell A. Effects of isocaloric exchange of dietary sucrose and
starch on fasting serum lipids, postprandial insulin secretion and
alimentary lipidaemia in human subjects. Br J Nutr 1972;27:395–405.
26.
Hudgins L, Hellerstein M, Seidman C, Neese R, Tremaroli J, Hirsch J.
Relationship between carbohydrate-induced hypertriglyceridemia and fatty
acid synthesis in lean and obese subjects. J Lipid Res 2000;41:595–604.
27.
Summerbell C, Moody R, Shanks J, Stock M, Geissler C. Sources of energy
from meals versus snacks in 220 people in four age groups. Eur J Clin Nutr
1995;49:33–41.
28.
UN Food and Agriculture Organization. Carbohydrates in human nutrition:
report of a joint FAO–WHO expert consultation. Rome: FAO, 1997.
29.
Mann J, Truswell A, eds. Essentials of human nutrition. Oxford: Oxford
University Press, 1988.
30.
Saris WH, Astrup A, Prentice AM, Zunft HJ, Formiguera X, Verboeket-van
de Venne WP et al. Randomized controlled trial of changes in dietary
carbohydrate/fat ratio and simple vs complex carbohydrates on body
weight and blood lipids: the CARMEN study. The carbohydrate ratio
management in European national diets. Int J Obes Rel Metab Dis
2000;24(10):1310–18.
Dietary Guidelines for Children and Adolescents in Australia
213
3.8 C ONSUME
ONLY MODERATE AMOUNTS OF SUGARS AND FOODS CONTAINING ADDED SUGARS
31.
Ludwig DS, Peterson KE, Gortmaker SL. Relation between consumption of
sugar-sweetened drinks and childhood obesity: a prospective,
observational analysis. Lancet 2001;357:505–8.
32.
Hill J, Prentice A. Sugar and body weight regulation. Am J Clin Nutr
1995;62(suppl. 1):264S–273S.
33.
Bellisle F, Rolland-Cachera M. How sugar-containing drinks might increase
adiposity in children. Lancet 2001;357:490–1.
34.
Mattes R. Dietary compensation by humans for supplemental energy provided
as ethanol or carbohydrate in fluids. Physiol Behav 1996;59:179–87.
35.
Johnson R, Frary C. Choose beverages and foods to moderate your intake
of sugars: the 2000 Dietary Guidelines for Americans—what’s all the fuss
about? J Nutr 2001;131(suppl.):2766S–2771S.
36.
Kantor LS. A dietary assessment of the US food supply: comparing per capita
food consumption with food guide pyramid service recommendations.
Report no. 772/1998. Washington, DC: Department of Agriculture, 1998.
37.
Department of Community Services and Health. National Dietary Survey of
Adults: 1983. Canberra: AGPS, 1987.
38.
Australian Softdrink Association. Soft drink consumption statistics. Sydney:
ASA, 2001.
39.
Burt B, Eklund S, Morgan K, Larkin F, Guire K, Brown L et al. The effects
of sugars intake and frequency of ingestion on dental caries increment in a
three-year longitudinal study. J Dent Res 1988;67:1422–9.
40.
Crowley S, Antioch K, Carter R, Waters A-M, Conway L, Mathers C. The cost
of diet-related disease in Australia. Canberra: Australian Institute of Health
and Welfare, 1992.
41.
Australian Institute of Health and Welfare. Australia’s health 2000: the
seventh biennial report of the Australian Institute of Health and Welfare,
Canberra: AIHW, 2000.
42.
Australian Institute of Health and Welfare. Australia’s health 1998: the sixth
biennial health report of the Australian Institute of Health and Welfare.
Canberra: AIHW, 1998.
43.
Slade GD, Spencer AJ, Davies MJ, Stewart JF. Caries experience among
children in fluoridated Townsville and unfluoridated Brisbane. Aust NZ J
Publ Hlth 1996;20(6):623–9.
44.
McDonagh M. A systematic review of public water flouridation. Report
no. 18. York: University of York, 2000.
45.
Davies MJ, Spencer AJ, Westwater A, Simmons B. Dental caries among
Australian Aboriginal, non-Aboriginal Australian-born, and overseas-born
children. Bull World Hlth Org 1997;75(3):197–203.
46.
Walsh LJ. Preventive dentistry. Aust Dent J 2000;45:76–82.
214
Dietary Guidelines for Children and Adolescents in Australia
3.8 C ONSUME
ONLY MODERATE AMOUNTS OF SUGARS AND FOODS CONTAINING ADDED SUGARS
47.
Ruxton C, Garceau F, Cotrell R. Guidelines for sugar consumption in Europe:
is a quantitative approach justified? Eur J Clin Nutr 1999;53:503–13.
48.
Balakrishnan M, Simmonds R, Tagg J. Dental caries is a preventable
infectious disease. Aust Dent J 2000;45:235–45.
49.
World Health Organization. Diet, nutrition and the prevention of chronic
diseases. Geneva: WHO, 1990.
50.
Gibson S, Williams S. Dental caries in pre-school children: association with
social class, toothbrushing habit and consumption of sugars and sugar
containing foods. Caries Res 1999;33:101–13.
51.
British Nutrition Foundation. Oral health diet and other factors.
Amsterdam: Elsevier, 1999.
52.
Ollila P, Niemela M, Uhari M, Larmas M. Prolonged pacifier-sucking and
use of a nursing bottle at night: possible risk factors for dental caries in
children. Acta Odontol Scand 1998;56(4):233–7.
53.
Lam M, Riedy C, Coldwell S, Milgrom P, Craig R. Children’s acceptance of
xylitol-based foods. Comm Dent Oral Epidemiol 2000;28(2):97–101.
54.
Gales MA, Nguyen TM. Sorbitol compared with xylitol in prevention of
dental caries. Ann Pharmacother 2000;34(1):98–100.
55.
Bessesen D. The role of carbohydrates in insulin resistance. J Nutr
2001;131(suppl.): 2782S–2786S.
56.
Mann J, Truswell A, Manning E. Effects on serum lipids of reducing dietary
sucrose or starch for 22 weeks in normal men. S Afr Med J 1972;4:827–34.
57.
Parks E. Effect of dietary carbohydrate on triglyceride metabolism in
humans. J Nutr 2001;131(suppl.):2772S–2774S.
58.
Palli D, Russo A, Decarli A. Dietary patterns, nutrient intake and gastric
cancer in a high-risk area of Italy. Cancer Causes Control 2001;12:163–72.
59.
Franceschi S, Favero A, La Vecchia C, Negri E, Conti E, Montella M et al.
Food groups and the risk of colorectal cancer in Italy. Int J Cancer
1997;72(1):56–61.
60.
Boutron-Ruault M, Senesse P, Faivre J, Chatelain N, Belghiti C, Meance S.
Foods as risk factors for colorectal cancer: a case-control study in
Burgundy (France). Eur J Cancer Prev 1999;8:229–35.
61.
Slattery M, Benson J, Berry T, Duncan D, Edwards S, Caan B et al. Dietary
sugar and colon cancer. Cancer Epid Bio Prev 1997;6:677–85.
62.
World Cancer Research Fund. Food, nutrition and the prevention of cancer:
a global perspective. Washington, DC: American Institute for Cancer
Research, 1997.
63.
National Health and Medical Research Council. The prevention, early
detection and management of colorectal cancer. Canberra: NHMRC, 1999.
Dietary Guidelines for Children and Adolescents in Australia
215
3.8 C ONSUME
ONLY MODERATE AMOUNTS OF SUGARS AND FOODS CONTAINING ADDED SUGARS
64.
World Health Organization. Carbohydrates in human nutrition: report of a
joint FAO–WHO expert consultation. Rome: World Health Organization;
1997.
65.
American Academy of Pediatrics. Diagnosis and evaluation of the child
with attention deficit/hyperactivity disorder. Pediatrics 2000;105:1158–70.
66.
Blackburn G, Kanders B, Lavin P, Keller S, Whatley J. The effect of
aspartame as part of a multidisciplinary weight-control program on short
and long term control of body weight. Am J Clin Nutr 1997;65:409–18.
216
Dietary Guidelines for Children and Adolescents in Australia
3.8 C ONSUME
4
ONLY MODERATE AMOUNTS OF SUGARS AND FOODS CONTAINING ADDED SUGARS
C A R E F O R YO U R C H I L D ’ S F O O D :
P R E PA R E A N D S TO R E I T S A F E LY
Rochelle Finlay and Patricia Blenman
B AC K G RO U N D
Despite having one of the world’s safest food-supply systems, Australia has seen
an increase in the number of reported foodborne illnesses in the last 10 years.
Foodborne illness can have very serious health consequences. Correct handling
of food during all stages of its preparation and storage is essential in reducing
the incidence of foodborne illness.
All population groups are susceptible to foodborne illnesses, but children and
infants are particularly vulnerable because of their underdeveloped immune
systems. They are totally dependent on others to provide food that has been
prepared correctly and is suitable for their consumption. Attention to food safety
for this age group is of great importance.
The incidence of foodborne illnesses
Reported data on foodborne illnesses consistently underestimate the true
incidence of these illnesses, and full diagnostic testing is usually done only in
more severe cases or when there are extensive common-source outbreaks.1,2 As a
result of their apparently increasing incidence, in Australia and worldwide,
foodborne diseases pose a significant public health problem.3 A number of
factors are thought responsible for the increase in foodborne illness4,5:
•
changes in human demographics, resulting in a greater proportion of the
population with increased susceptibility to severe foodborne illness
•
changes in food-production methods, including intensive farming practices
and more extensive food-distribution systems. Food grown in one country
can now be transported and consumed halfway across the world
•
new and emerging pathogens. Three of the four most significant foodborne
pathogens in the United States (campylobacter, listeria, and
enterohaemorrhagic Escherichia coli) were unrecognised as causes of
foodborne illness 20 years ago
•
consumer preferences, particularly with the increasing trend towards
takeaway food and dining out.
An increase in notifications of foodborne illness has also occurred, for two main
reasons:
•
better reporting and identification of pathogens.4 Dramatic scientific and
technological improvements in the detection of pathogens have
Dietary Guidelines for Children and Adolescents in Australia
217
4. C ARE
•
FOR YOUR CHILD ’ S FOOD : PREPARE AND STORE IT SAFELY
contributed to the reporting of increasing numbers of cases of foodborne
disease that may have previously gone unreported
increased awareness among consumers and health professionals.
In 1999 it was estimated that the annual cost to Australia of foodborne illness
was $2.6 billion.4 A reduction in the incidence of such illness would benefit the
Australian community through lower health care costs, less absenteeism,
improved business productivity, increased competitiveness in world markets, and
reduced levels of business failure and associated costs, including the cost of
litigation.4
In 1999 and 2000 the three most common notified foodborne diseases in
Australia were infections with campylobacter, salmonella and hepatitis A (see
Table 4.1).
Table 4.1
Notifications of foodborne illness received by Australian health
authorities: selected pathogens, 1991 to 20006
Pathogen
Year
Campylobacter
Hepatitis A
Listeria
Salmonella
Yersinia
1991
8 672
2 195
44
5 440
515
1992
9 136
2 109
38
4 614
567
1993
8 111
2 006
53
4 731
459
1994
10 117
1 901
34
5 327
414
1995
10 933
1 600
58
5 895
306
1996
12 158
2 150
70
5 819
268
1997
11 851
3 076
71
7 005
245
1998
13 449
2 503
58
7 700
207
1999
12 643
1 563
62
7 330
142
2000
13 455
824
66
6 017
71
Note: It is generally recognised that only a small proportion of cases are reported.
The general trend in the last 10 years in Australia is for gradual increases in
notifications of foodborne illnesses associated with campylobacter, salmonella
and listeria.
218
Dietary Guidelines for Children and Adolescents in Australia
4. C ARE
SCIENTIFIC
FOR YOUR CHILD ’ S FOOD : PREPARE AND STORE IT SAFELY
BASIS
Characteristics of foodborne illness
The symptoms of foodborne illness are dependent on the pathogen responsible
and the immune status of the affected person. Symptoms can range from being
so mild as to be hardly noticeable to being so severe that hospitalisation is
needed.7 Common symptoms are abdominal pain, nausea, vomiting, diarrhoea,
bloody stools, fever and dehydration. People may also experience fatigue and
muscle pain.7 In serious cases, and depending on the pathogen, foodborne
illness may result in double vision, trouble with swallowing or breathing,
paralysis, encephalopathy, kidney failure, or death.4 Some foodborne pathogens
can also trigger longer term effects such as reactive arthritis and auto-immune
disorders.8
The time taken between infection by the pathogen and development of
symptoms varies according to the pathogen involved. Symptoms of commonly
acquired foodborne infections can present themselves within two to four hours
or up to 10 days after infection. For some agents, such as Listeria
monocytogenes, the average incubation period is three weeks.
Infection by Escherichia coli O157:H7 is of particular concern with children
because it can cause kidney failure and death. The pathogen has been found
particularly in undercooked ground beef and in unpasteurised apple juices.9 In
children aged less than 5 years the infection can cause a complication called
‘haemolytic uraemic syndrome’, which results in kidney failure: 2–7 per cent of
infections lead to this complication. In the United States, HUS is the principle
cause of acute kidney failure in children, and most cases of the syndrome are
caused by E. coli O157:H7. The death rate from HUS is 3–5 per cent.10 Another
strain, E. coli O111, can also cause HUS. An outbreak of E. coli O111 in Australia
in 1995, which caused the death of one child and the hospitalisation of 24
others, was traced to consumption of mettwurst produced in the Garibaldi
smallgoods factory.11
Children and food safety
Children are especially prone to foodborne illness and other infectious
diseases.12
Infants and young children are at particular risk because their immune systems
are still developing and they cannot fight infection as well as adults can. As a
result, they are more susceptible to all types of infection and are likely to suffer
more severe consequences. In addition, children produce less acid in their
stomachs than do adults13, and low stomach acidity increases the likelihood of
infection if foodborne pathogens are ingested.14
Dietary Guidelines for Children and Adolescents in Australia
219
4. C ARE
FOR YOUR CHILD ’ S FOOD : PREPARE AND STORE IT SAFELY
Causes of foodborne illnesses
Foodborne illnesses can be caused by bacteria, viruses or bacterial toxins.4
Bacterial food poisoning occurs when pathogenic bacteria multiply to harmful
levels as a result of incorrect handling of food, particularly if temperature control
is inadequate. But not all foodborne pathogens need to multiply in food to cause
illness. Viruses such as hepatitis A and Norwalk virus, and some strains of
bacteria—such as Escherichia coli (for example, E. coli O157:H7 and E. coli
O111), Campylobacter jejuni and Shigella spp.—can cause illness, even when
present in low numbers. Food must be protected from contamination if these
pathogens are to be excluded. If a ready-to-eat food is contaminated with these
pathogens, illness may occur and, once the pathogens are present, keeping the
food at a safe temperature will not have any effect.15
A number of micro-organisms produce toxins when allowed to multiply to high
levels in food, and eating food that contains such toxins can cause foodborne
illness. For example, botulism is caused by ingestion of a toxin produced by
Clostridium botulinum present in contaminated food; other micro-organisms
linked with toxin production in food are Staphylococcus aureus (which causes
staphylococcal food poisoning), Bacillus cereus and shigella. Toxin formation
can be prevented if foods are kept at safe temperatures. Even re-heating food to
high temperatures will not destroy toxins.16
The following are the main causes of foodborne illness in Australia:
•
inadequate cooking
•
improper holding temperatures
•
contaminated equipment
•
unsafe food sources
•
poor personal hygiene.1
Temperature
Exposure to high temperatures, such as those used in cooking, should destroy
the vegetative cells of bacteria. Some bacteria do, however, have heat-resistant
spores and toxins that survive the cooking process; an example is Bacillus
cereus. Cooling to low temperatures, such as refrigeration, will slow bacterial
growth. With the exception of Listeria monocytogenes and Yersinia
enterocolitica, pathogenic bacteria do not multiply at temperatures at or below
5ºC. Foods that support the growth of foodborne bacteria should be stored at or
below 5°C or at or above 60°C. Between 5°C and 60°C is considered to be the
‘danger zone’ for food safety: within this temperature range, bacterial replication
can occur.
Time
The longer food is left in the temperature danger zone, the more time bacteria
will have to multiply. Some bacteria can reach an infective dose in four to six
hours at temperatures within the danger zone.17,18
220
Dietary Guidelines for Children and Adolescents in Australia
4. C ARE
FOR YOUR CHILD ’ S FOOD : PREPARE AND STORE IT SAFELY
Food contamination
Microbiological food contamination can occur in a number of ways:
•
The utensils used to prepare raw food—such as a chopping board used to
cut raw meat and poultry—are then used on ready-to-eat food without
having been cleaned, sanitised and dried.
•
Raw foods are allowed to make direct contact with ready-to-eat foods.
•
People preparing or serving food contaminate it by not washing their
hands adequately, particularly after handling raw food and immediately
after using the toilet.
•
Food storage and preparation areas are themselves contaminated through
inadequate cleaning and sanitising or are open to contamination by pests
such as insects and rodents.
Potentially hazardous foods
The ability of micro-organisms to grow in a food depends on external factors
(such as temperature) as well as the characteristics of the food itself (such as
nutrient content, water content and pH). Bacteria need adequate nutrients for
replication; among their most suitable media are high-protein, perishable foods
such as dairy products, egg products, seafood, meat and poultry.17,18 These foods
also have a relatively high moisture content: bacterial growth is limited in the
absence of moisture. The acidity or alkalinity of a food also affects bacterial
growth: bacteria are least active in very acidic foods (those with a pH less than
4.5). Often foods are preserved using vinegar to reduce bacterial growth,
although moulds may still grow in these conditions.18
The following are examples of foods that are normally considered potentially
hazardous15:
•
raw and cooked meat or foods containing raw or cooked meat—for
example, casseroles, curries and meat pies
•
dairy products and foods containing dairy products—for example, milk,
custard and dairy-based desserts
•
seafood and foods containing seafood
•
cooked rice and pasta
•
processed fruits and vegetables such as salads
•
processed foods containing eggs or other protein-rich food
•
foods that contain any of the foods just listed—for example, sandwiches.
The foods most commonly implicated in food-borne illness in Australia are meat
and seafood.1
Some food-borne pathogens, such as viruses and enterohaemorrhagic strains of
Escherichia coli, do not need to grow in foods to produce illness. Contamination
of any ready-to-eat food with such a pathogen can result in food-borne illness.
Dietary Guidelines for Children and Adolescents in Australia
221
4. C ARE
FOR YOUR CHILD ’ S FOOD : PREPARE AND STORE IT SAFELY
Foreign matter in foods
Physical hazards—foreign objects and other extraneous material (that is, any
physical matter not normally found in food)—can cause illness, including
psychological trauma, or injury. The danger is especially great for young
children, who are more likely to choke and, if they are very young, cannot tell
their parent or carer that a foreign object is present.
PRACTIC AL
ASPECTS OF THIS GUIDELINE
To optimise food safety, care should be taken at all stages of the consumer ‘food
chain’—purchasing, transport, storage, preparation, cooking, serving and
cleaning. Children are susceptible to infection, so it is vital that their food is
handled safely.
Purchasing
It is important to make appropriate food purchases for young children. The
following foods should not be fed to young children because of their potential to
cause serious foodborne illness in this age group:
•
uncooked fermented meats, such as salami. Check the label: ‘heat treated’
or ‘cooked’ products are safe. Do not feed young children ‘not heat
treated’ products
•
unpasteurised fruit juices. Shelf-stable juices are pasteurised, but some
packaged refrigerated juices may be unpasteurised. Check the label or
contact the manufacturer. All freshly squeezed juices are unpasteurised
•
unpasteurised milk and products made from unpasteurised milk—such as
raw-milk cheese
•
raw or undercooked meat (particularly minced meat), poultry, fish and
shellfish
•
honey, which should not be fed to children aged less than 1 year because
it may be contaminated with Clostridium botulinum and lead to infantile
botulism19
•
raw sprouts—such as alfalfa, clover and radish.20
Storage
The various food types need to be stored properly to retain their nutrient value,
freshness, aroma and texture, and to keep them safe.17–21,22 Always read the label
for storage instructions. Ensure that storage areas such as cupboards and pantries
are clean and that foods are stored in food-grade containers away from
chemicals. Store raw foods separately from ready-to-eat foods to prevent crosscontamination.15
222
Dietary Guidelines for Children and Adolescents in Australia
4. C ARE
FOR YOUR CHILD ’ S FOOD : PREPARE AND STORE IT SAFELY
Refrigeration
Refrigeration retards the growth of bacteria and the rate of chemical change in
food. The refrigerator temperature should be 5°C or less—this can be checked
using a suitable thermometer— and care should be taken to ensure that the
temperature is maintained. All cooked foods should be covered and stored on a
shelf above uncooked foods. Leftovers and ready-to-eat meals should be used
the next day or stored in the freezer. Raw meats should be wrapped or placed in
a container and stored near the bottom of the refrigerator, so that the juices do
not drip onto other foods. Any spills should be cleaned up immediately, and
fridge and freezer shelves and doors should be cleaned regularly. Ready-to-eat
chilled foods are becoming widely available; they should be stored in the coldest
part of the fridge and used before the ‘use by’ or ‘best before’ date or as soon as
possible after purchase.
Frozen foods
Care should be taken to ensure that frozen food is kept hard frozen. It should be
stored in packages that are free of air and fully sealed, to prevent ‘freezer burn’.
Freezer burn is dehydration or drying that occurs on the surface of a product if it
is improperly wrapped; the product is safe to eat but of poorer quality.
Canned and other hermetically sealed foods
Canned and other hermetically sealed foods—such as foods sealed in glass jars—
should be stored in a cool place. Read the labels carefully for any storage
instructions. Once opened, canned foods should be stored in the refrigerator,
preferably not in the can. Swollen or leaking cans indicate faulty processing:
their contents should not be eaten. In addition, throw out the contents of any
can if there is an unusual odour. When opening vacuum-sealed jars, listen for a
popping sound, which shows that the jar’s seal was intact. This is particularly
important with commercial baby foods: if the jar fails to ‘pop’ when opened, do
not use the food.
Vacuum-packed and modified–atmosphere packed foods
Vacuum packing extends the shelf life of food by removing air from the
packages. Modified-atmosphere packaging extends shelf life by replacing the
oxygen in a packaged food with other gases that slow bacterial growth; the
method is often used with meat and poultry products. An increasing number of
blister packs of foods such as fresh pasta, lunch meat, bacon and olives are now
available. Vacuum-packed and modified–atmosphere packed foods should be
stored according to the instructions on the package.
Dehydrated and dried foods
Dehydration inhibits the growth of micro-organisms by removing water, but it
does not make the food sterile21: a high level of micro-organisms can remain,
only to become active again when the food is rehydrated. Rehydrated foods
should be treated as perishables and be stored in the refrigerator. Dried food
Dietary Guidelines for Children and Adolescents in Australia
223
4. C ARE
FOR YOUR CHILD ’ S FOOD : PREPARE AND STORE IT SAFELY
should be stored in a sealed container and in a cool, dry place away from direct
heat or sunlight. It should be regularly inspected for insect infestation. Opened
packages of dried food can be stored in the refrigerator to maintain quality for
longer.
Date-marked packaged foods
The ‘best before’ date on packaged food signifies the end of the period during
which the intact package of food—if stored in accordance with any stated
storage conditions—will retain all of its quality attributes, such as colour, taste,
texture and flavour.23 Foods that are date-marked in this way can continue to be
sold after that date provided the food is not damaged or has not deteriorated or
perished. Check foods that have passed their ‘best before’ date for signs of
spoilage.
The ‘use by’ date on packaged food signifies the end of the estimated period—if
the food is stored in accordance with any stated storage conditions—after which
the intact package of food should not be consumed for health and safety
reasons.23 Foods marked with a ‘use by’ date are prohibited from being sold after
this date because the food might then pose a health risk.
Food spoilage
Food spoilage occurs when food-spoiling bacteria multiply and cause the food to
deteriorate and develop unpleasant odours, tastes and textures. The bacteria
spoil the food so that it becomes inedible, but they do not themselves cause
foodborne illness. On the other hand, food in which pathogenic micro-organisms
have grown to high levels may appear and taste normal. Food handling measures
used to optimise food safety, such as proper storage and temperature controls,
also help prevent premature spoilage.
Food preparation
Handwashing and hygiene
Before starting to prepare food, people should thoroughly wash and dry their
hands. This is particularly important after:
•
handling raw foods—such as raw meat
•
touching animals
•
using the toilet
•
assisting others with toilet use
•
blowing noses
•
changing children’s nappies.22,24–26
Hands should be lathered and held under running water to ensure that any
micro-organisms are washed away. Particular attention should be paid to
washing between fingers and under fingernails. After washing, hands should be
224
Dietary Guidelines for Children and Adolescents in Australia
4. C ARE
FOR YOUR CHILD ’ S FOOD : PREPARE AND STORE IT SAFELY
dried using either a clean towel or a paper towel. Food should not be prepared
by anyone who might be suffering from a foodborne illness or who has a
foodborne disease.15
Preventing cross-contamination
A number of measures should be taken to help prevent cross-contamination of
food with potentially harmful micro-organisms:
•
Special care should be taken with cleaning after cutting up raw meat and
before dicing vegetables, particularly if the vegetables are to be eaten raw
or with minimal cooking.
•
Use a different chopping board and utensils when preparing foods to be
eaten raw and foods for cooking.
•
Never place cooked food on plates that have held raw meat, poultry or
seafood.
•
Never use a tea towel as a hand towel or for cleaning surfaces.
•
During food preparation, do not taste, or allow children to taste, the food
with the utensil used for stirring.18,25,26
Thawing foods
The method chosen for thawing food should be the one that minimises the time
the food is at a temperature that supports the growth of micro-organisms—for
example, room temperature. Ready-to-eat frozen foods should be thawed in the
refrigerator or under cold water in an airtight plastic wrapper or bag, the water
being changed every 30 minutes.27,28 Foods can also be thawed in a microwave
oven, using the defrost setting.
When thawing raw meat, it is important that fluids produced during the thawing
process do not contaminate other foods or containers and other utensils that
might be used for other foods. Make sure that larger portions of raw meat, such
as chickens and turkeys, are thawed completely before cooking. This might call
for some forward planning, to allow sufficient time for thawing these meats
before they are required; for example, if a turkey is thawed in the fridge it might
take several days, depending on the bird’s size.
Follow the manufacturer’s instructions for re-heating packaged ready-to-eat
frozen foods (such as TV dinners). And be sure to check the information on prepackaged foods to determine whether they need to be cooked or simply reheated before being eaten.
Preparing fruits and vegetables
Fruits and vegetables should be washed thoroughly under running water before
peeling and cutting. Special care should be taken with produce such as parsley
and lettuce: they are harder to clean than smooth-skinned produce.
Dietary Guidelines for Children and Adolescents in Australia
225
4. C ARE
FOR YOUR CHILD ’ S FOOD : PREPARE AND STORE IT SAFELY
Marinating
Marinate raw foods in the refrigerator. The marinade can be used during
cooking, but do not add it to the cooked dish or use it as a dressing if raw meat
has been in it.
Cooking
Not all meat needs to be cooked thoroughly: steaks, whole fillet, chops and
whole pieces of roast meat can be eaten rare. In contrast, rolled and/or stuffed
meats, poultry, pork, sausages and mince should always be cooked all the way
through, until the juices run clear when the meat is pierced.15
When using a microwave to cook, rotate and stir the food so that it cooks
evenly. Cover it with a lid or plastic wrap so that the steam can aid thorough
cooking. Food finishes cooking during standing time, and it is important to wait
until the standing time has elapsed before checking that cooking is complete.29
Never partially cook products then finish cooking them later.29 Meat, fish and
poultry must be cooked thoroughly; they can then be refrigerated and reheated
later.
Cooling
Cooking of itself does not guarantee safety: some bacterial spores can survive
several hours of cooking and later grow in the food if there is poor temperature
control. Foods such as stews and other meat and poultry dishes that will be
eaten later should be cooled as quickly as possible to prevent spores from
germinating and bacteria from multiplying.
Foods that have just been cooked and are still very hot can be cooled at room
temperature until the temperature of the food drops to 60°C. The food should
then be cooled to 5°C as quickly as possible. To cool a large portion of food
more quickly, divide it into smaller quantities or place it in shallow containers
(5 centimetres deep) in the refrigerator.15 All leftovers should be placed in the
refrigerator to cool as soon as possible and should be used within two or three
days.29
Reheating
When reheating food, heat it until it is ‘steaming hot’ throughout: this should
destroy any vegetative cells of foodborne pathogens that may be present, but it
will not destroy toxins. Bring soups, sauces and gravies to a rolling boil. Do not
reheat food more than once.29 When heating pre-prepared frozen or refrigerated
dinners, follow the instructions on the packet.
226
Dietary Guidelines for Children and Adolescents in Australia
4. C ARE
FOR YOUR CHILD ’ S FOOD : PREPARE AND STORE IT SAFELY
Serving
It is essential to serve food safely: foodborne illness can result if food is not
safely handled and served as soon as possible after it is cooked. Hands should
be washed with soap and water and dried thoroughly using a clean towel or a
paper towel, and the food should be served on clean plates. Never put cooked
food on a plate that has held raw food21,27 or re-use utensils used during food
preparation.22 Unless foods are to be served immediately, they should be covered
until ready to be eaten.
Freshly cooked food that is eaten straight away is safest; if foods cannot be
consumed immediately, keep them cold (at 5°C or below) or hot (at 60°C or
above). For buffets, food can be kept hot by using chafing dishes and warming
trays. Cold food should be kept cold by keeping it in the refrigerator or in a
cooler with ice until served; for buffets, it can be kept on ice. When feeding
babies, only feed directly from the baby food jar if the child is to eat all of the
food or the uneaten portion is to be discarded; otherwise, use a clean plate or
bowl.
Cleaning
All work surfaces, crockery, cutlery, cooking utensils and other equipment
should be thoroughly cleaned to remove any food or other residue. This can
usually be done by using warm water with detergent. After cleaning, utensils and
work surfaces can be sanitised using hot water or chemical sanitisers (such as a
mixture of bleach and water) if necessary. Utensils and other equipment should
be thoroughly dry before they are re-used.
Foodborne bacteria readily persist in kitchen towels, sponges and cloths25,26:
wash and dry them often, and replace sponges regularly. Using paper towels can
reduce the risk of cross-contamination because they are disposable and so
cannot harbour and spread bacteria.22
For added protection, keep appliances such as microwave ovens, toasters, can
openers, and blender and mixer blades free of food particles. After thorough
cleaning, use a bleach solution to sanitise chopping blades and hard-to-clean
areas. Keep benches, shelves and work surfaces free of food particles. When
making baby food at home, use a brush to clean around areas of the blender
blades or food processor parts. Old food particles can harbour bacteria that may
contaminate other foods.30
Food handling for infants and children
In addition to the general precautions just discussed, other factors should be
taken into consideration for infants and babies being fed infant formula or milk
and for children taking packed lunches to schools, day-care centres or creches.
Dietary Guidelines for Children and Adolescents in Australia
227
4. C ARE
FOR YOUR CHILD ’ S FOOD : PREPARE AND STORE IT SAFELY
Infant formula
Infant formulas are available in ready-to-use or powder form. Powdered formula
is prepared by adding the powder to cooled boiled water. Fresh formula should
be prepared daily; it can be stored in the refrigerator for a maximum of 24
hours.19
Outbreaks of foodborne illness have been associated with consumption of
contaminated powdered infant formula.31 Among the pathogens found to be the
cause of these outbreaks are salmonella (various strains) and Enterobacter
sakazakii. In infants, particularly premature newborns, colonisation by
E. sakazakii has been linked with the use of contaminated spoons and blenders
and with keeping ready-made milk warm in bottle heaters.
With infant formula, there is a greater risk of infection resulting from substandard sterilisation techniques. The risk of contamination can be reduced if
bottles, teats and spoons are boiled or otherwise sterilised. Further, baby bottles
containing formula or milk should not be left sitting at room temperature.12
Ready-made milk should be stored in the fridge and warmed up immediately
before use by placing the bottle of milk in hot water. Microwave ovens should
not be used to heat the milk: this can cause variations in temperature throughout
the milk. The temperature of the milk should be tested before feeding the baby.
Any partially consumed milk or formula should be discarded.
If travelling, take formula powder in a bottle and add warm water just prior to
feeding.
Breastmilk
Breastfeeding offers the best way of avoiding foodborne illness. There is a low
risk of bacterial contamination, and the risk of infectious diseases such as
gastroenteritis is reduced because maternal antibodies are passed to the
infant.32,33
Breastmilk can be expressed and placed in a sterile container with a lid.19 The
expressed milk can be stored in a refrigerator for up to five days. Frozen
breastmilk can be stored in a deep freeze for up to six months, in a separatedoor fridge/freezer for three to four months, and in the box freezer of a
refrigerator for up to two months. Each time breastmilk is expressed it should be
stored in a different container, rather than being added to already frozen
breastmilk. Addition of warm breastmilk to pre-frozen milk can cause the frozen
milk to partially thaw, increasing the risk of bacterial growth in the milk.19
Frozen breastmilk should be allowed to thaw in the refrigerator or be placed in
its container in warm water until thawed. Breastmilk should be heated gradually
by placing the bottle or other container of milk in hot water. Microwave ovens
should not be used to heat breastmilk: they can destroy some of the
immunological components34 and can cause variations in temperature throughout
the milk. The temperature of the milk should be tested before feeding the baby.
228
Dietary Guidelines for Children and Adolescents in Australia
4. C ARE
FOR YOUR CHILD ’ S FOOD : PREPARE AND STORE IT SAFELY
Sterilising bottles and equipment
Equipment used in preparation and feeding—including bottles or cups used to
feed expressed breastmilk—must be sterilised before use, particularly in the first
three months of the baby’s life. Sterilising equipment and tablets for making
sterilising solution are widely available and effective, provided the
manufacturers’ instructions are followed carefully. Sterilising solutions can be
used for 24 hours before being changed.19 Equipment can also be sterilised by
boiling it in water for five minutes.35
All pieces of breast pumps should be washed with warm water and a mild
detergent. If the pump has clear plastic tubing connected to an electric motor,
check the manufacturer’s guidelines for washing and sterilising the tubing. Most
such tubing needs to be washed and sterilised only if breastmilk has accidentally
been drawn up into it. The outside of the tubing should be wiped with a clean,
moist cloth then dried with a towel or allowed to air dry.
Food safety in day-care centres and creches
Outbreaks of foodborne illness in day-care centres and creches are often
associated with children’s poor hygiene and poor hygiene associated with nappy
changing. Hands should be washed thoroughly after changing nappies. Many
day-care centres and creches provide a midday meal or snack for children;
however, when children are required to bring their own food from home, it must
be prepared in such a way as to ensure that it is safe.36 The day-care centre or
creche should advise parents that if leftovers are to be sent with the child they
should be stored in the refrigerator overnight, then refrigerated immediately
upon arrival at the centre. Foods prepared fresh and sent with the child should
also be refrigerated immediately upon arrival at the centre. Any leftovers sent
home with the child should not be eaten later by the child; nor should they be
sent to the centre the next day. Lunches should be clearly labelled with the
child’s name, the date and the type of food and should be stored at the correct
temperature until eaten. One child’s food should not be fed to another child.
If a child is being fed infant formula or expressed breastmilk, the formula or
milk should be poured into containers labelled with the child’s name, then
capped and refrigerated. Containers should be placed in a fridge immediately
upon arrival at the centre. Any unused expressed breastmilk or formula should
be sent home with the child that day or discarded.
Food safety and packed school lunches
School lunches can safely be made ahead of time (the previous night), provided
they are then kept in the fridge or freezer. To help prevent illness, ensure that
food preparation surfaces, hands and utensils are clean when preparing and
packing the lunch37 and that all fruits and vegetables are washed thoroughly. If
possible, lunches should be carried in an insulated lunch box. Something cold,
Dietary Guidelines for Children and Adolescents in Australia
229
4. C ARE
FOR YOUR CHILD ’ S FOOD : PREPARE AND STORE IT SAFELY
such as a frozen juice box or a freezer gel, should be packed with the lunch.38
Pack perishable foods such as cold meats or egg sandwiches between the cold
items. Children should (if possible) keep their lunches away from heat sources
such as direct sunlight or room radiators.39
When hot foods are taken to school, they should be kept in an insulated bottle
or flask. To ensure that the food is kept hot (and safe), the flask should be preheated by adding hot water, letting it stand for a few minutes, then emptying it
and filling it with hot food. The flask should not be opened until lunchtime.
If lunches are not finished, the leftovers should be thrown out.
Children should be warned against sharing drink bottles because of the risk of
meningococcal disease. A high proportion of cases of meningitis occur in
children aged less than 5 years.40
What to do if it is thought that a child is suffering the effects of food
poisoning
A child with suspected food poisoning should be fed liquids to prevent
dehydration. Seek medical care immediately if symptoms persist or are severe—
for example, bloody diarrhoea, excessive nausea and vomiting or a high
temperature.
If the suspect food was served at a large gathering, by a restaurant or at some
other food-service facility, or if it is a commercially produced product, contact
your local health department.
If possible, preserve the evidence. Wrap the remaining portion of the food
securely, label it ‘DANGER’ and freeze it. Save all the packaging materials and any
identical unopened products. Record details of when the food was consumed
and when the onset of symptoms occurred.41
The last meal eaten is often blamed for causing illness, whereas it is often a food
that has been eaten the previous day. It is useful to recall and write down the
foods eaten in the last 48 hours.
R E L AT I O N S H I P
TO OT H E R G U I D E L I N E S
Eat plenty of vegetables, legumes and fruits
This guideline closely relates to food hygiene and the purchase, transport,
storage, preparation and cooking of vegetables and fruits. When these foods are
stored correctly, their nutritional quality and storage life are maximised. Buy
fresh vegetables and fruits that are ‘firm’, and make sure that canned and frozen
varieties have complete, undamaged packaging.
230
Dietary Guidelines for Children and Adolescents in Australia
4. C ARE
FOR YOUR CHILD ’ S FOOD : PREPARE AND STORE IT SAFELY
Eat plenty of cereals (including breads, rice, pastas, noodles), preferably
wholegrain
Include milks, yoghurts, cheeses and/or alternatives …
Limit saturated fat and moderate total fat intake …
Correct storage will maximise the storage life and prevent spoilage of breads,
cereals and pastas—as well as dairy products and fats (including cooking oils). It
is important to make sure that packaging is complete and undamaged.
Include lean meat, fish, poultry and/or alternatives
Illness caused by foodborne pathogenic bacteria is a serious public health
problem, and all foods are potential vectors of pathogens. In Australia the risk of
foodborne illness from primary food industries is managed across the food chain,
with industry, government and consumers sharing responsibility for the delivery
of microbiologically safe products. Nevertheless, some foods from the meat, fish,
poultry and alternatives food group have been implicated in outbreaks of
foodborne disease, and constant vigilance is required.
Children and adolescents need sufficient nutritious foods to grow and
develop normally
•
Growth should be checked regularly for young children
•
Physical activity is important for all children and adolescents
Research has shown that immune cells are responsive to the effects of acute
exercise, in terms of both number and function. Regular physical activity can be
beneficial for older people’s immune system function and can enhance the
body’s ability to defend itself against foodborne illnesses.
CONCLUSION
It is essential to educate all food handlers, health care providers and the general
public if we are to reduce the incidence of foodborne illness. Although most
foodborne illnesses can be avoided if safe food-handling procedures are
followed, risk reduction is very important at every step of the way, from food
purchase to meal serving.
EVIDENCE
Because of the nature of this guideline, there is no evidence of the kind required
for rating according to the National Health and Medical Research Council’s levels
of evidence. It is not possible to conduct trials or case-control, cohort or
Dietary Guidelines for Children and Adolescents in Australia
231
4. C ARE
FOR YOUR CHILD ’ S FOOD : PREPARE AND STORE IT SAFELY
experimental studies of the microbiological safety of foods. Information about
safe practice comes from a basic understanding of food microbiology and human
physiology and is based on a wide variety of evidence from laboratory studies
and ‘opportunistic’ evidence from outbreaks of food poisoning.
REFERENCES
1.
Crerar SK, Dalton CB, Longbottom HM, Kraa E. Foodborne disease: current
trends and future surveillance needs in Australia. Med J Aust 1996;165:672–5.
2.
Australia New Zealand Communicable Diseases Network. Fortnightly
notifiable diseases tables. Communicable Diseases Intelligence.
<www.health.gov.au/pubhlth/cdi/cdifort.htm>, 11 January 1999.
3.
Desmarchelier PM. Foodborne disease: emerging problems and solutions.
Med J Aust 1996;165:668–71.
4.
Australia New Zealand Food Authority. Food safety standards costs and
benefits: an analysis of the regulatory impact of the proposed national food
safety reforms. Canberra: ANZFA, 1999.
5.
Kaferstin FK. Food safety: a commonly underestimated public health issue.
Wld Hlth Stats Quart 1997;50:3–4.
6.
Australia New Zealand Communicable Diseases Network. National
Notifiable Diseases Surveillance System. Communicable Diseases
Intelligence. <www.health.gov.au:80/pubhlth/cdi/nndss2.htm>, April 2001.
7.
Hench CP, Simpkins SM. Bugs at the banquet table: foodborne illness.
<www.nurseweek.com/ce/ce3240a.html>.
8.
Bender JB, Smith KE, Hedberg C, Osterholm MT. Foodborne disease in the
21st century. What challenges await us? Postgrad Med 1999;106(2):109–12,
115–16, 119. <www.postgradmed.com/issues/1999/08_99/bender.htm>.
9.
Food and Drug Administration. Unpasteurized cider and juice can contain
bacteria that make children and some other people sick. College Park, MD:
Centre for Food Safety and Applied Nutrition, US Food and Drug
Administration. <http://www.cfsan.fda.gov/~1rd/juicefl.html>, 1997.
10.
Centers for Disease Control and Prevention. Preventing foodborne illness:
Escherichia coli O157:H7. Atlanta, GA: CDC. <http://wonder.cdc.gov/
wonder/prevguid/p0000417/p0000417.asp>, 1993.
11.
Kriven S. Business risks from food poisoning in food processing: the
Garibaldi case. Aust Agribus Rev 1995;3(2).
12.
University of Nebraska—Lincoln. Food safety for childcare facilities. G941233-A. <http://www.ianr.unl.edu/pubs/foods/g1233.htm>, 1996.
13.
Van Horn JE, Horning L. Tips for preventing foodborne illness. In: Todd
CM, ed. Child Care Connections. Vol. 4, no. 4. Urbana–Champaign, IL:
University of Illinois Cooperative Extension Service. <http://
www.nncc.org/Health/cc44_tips.foobourne.ill.html>, 1995.
232
Dietary Guidelines for Children and Adolescents in Australia
4. C ARE
FOR YOUR CHILD ’ S FOOD : PREPARE AND STORE IT SAFELY
14.
Cano RJ, Colome JS. Determinants of health and disease. In: Essentials of
Microbiology. St Paul, MN: West Publishing Company, 1988.
15.
Australia New Zealand Food Authority. Safe food Australia: a guide to the
Food Safety Standards. 2nd edn. Canberra: ANZFA, 2001.
16.
Fraser A. Bacterial toxins. National food safety database.
<www.foodsafety.ufl.edu/consumer/nc/nc816a.htm>, 2001.
17.
Sprenger RA. Hygiene for management: a text for food hygiene courses.
South Yorkshire, UK: Highfield Publications, 1989.
18.
Merry G. Food poisoning prevention. 2nd edn. Melbourne: Macmillan
Education Australia, 1997.
19.
Ministry of Health. Food and nutrition guidelines for healthy infants and
toddlers (aged 0–2 years): a background paper. Wellington, NZ: Public
Health Commission, 1995.
20.
US Food and Drug Administration. Consumers advised of risks associated
with raw sprouts. HHS News. Washington, DC: Centre for Food Safety and
Applied Nutrition, 1999. <vm.cfsan.fda.gov/~1rd/hhssprts.html>.
21.
CSIRO. Handling food in the home. North Ryde: Food Science Australia,
1993.
22.
US Federal Consumer Information Center. How to help avoid foodborne
illness in the home. Pueblo, CO: FCIC, 1998. <www.pueblo.gsa.gov/press/
nfcpubs/foodborn.txt>.
23.
Australia New Zealand Food Authority. Date marking: user guide to
Standard 1.2.5, Date Marking of Packaged Food. Canberra: ANZFA, 2001.
24.
Altekruse SF, Street DA, Fein SB, Levy AS. Consumer knowledge of
foodborne microbial hazards and food-handling practices. J Food Protect
1995;59(3):287–94.
25.
Abdussalan M, Kaferstein FK. Food safety in primary health care. World
Health Forum 1994;15:393–9.
26.
Department of Health and Community Services. Food Premises Code. 2nd
edn. Melbourne: DHCS, 1996.
27.
Food Safety Campaign Group. Food safety tips. <www.safefood.net.au/
food_august/tips/index.html>, 15 December 1998.
28.
Brewer MS. Food storage, food spoilage and foodborne illness. Circular
1313. Chicago, IL: Department of Food Science and Human Nutrition,
University of Illinois. <www.aces.uiuc.edu/~fshn/extension/
food_storage.html>, 1991.
29.
US Food Safety and Inspection Service. Safe food to go. Washington, DC:
Department of Agriculture. <www.fsis.usda.gov/OA/pubs/foodtogo.htm>,
1997.
30.
Food and Drug Administration. Seniors and food safety—preventing
foodborne illness. When grandparents take care of grandchildren: what
Dietary Guidelines for Children and Adolescents in Australia
233
4. C ARE
FOR YOUR CHILD ’ S FOOD : PREPARE AND STORE IT SAFELY
you need to know about food safety and young children. Centre for Food
Safety and Applied Nutrition, US FDA. <http://vm.cfsan.fda.gov/~dms/
seniorsg.html>, 1999.
31.
Centers for Disease Control and Prevention. Salmonella serotype
Tennessee in powdered milk products and infant formula—Canada and the
United States. Morbidity and Mortality Weekly Report, 1993;42(26).
32.
Howie PW, Forsyth JS, Ogston SA, Clark A, Florey CD. Protective effect of
breastfeeding against infection. BMJ 1990;300(6716):11–16.
33.
Duncan B, Ey J, Holberg CJ, Wright AL, Martinez FD, Taussig LM. Exclusive
breast feeding for at least 4 months protects against otitis media. Pediatrics
1993;91(5):867–72.
34.
Sigman M, Burke KI, Swarner OW, Shavlik GW. Effects of microwaving
human milk: changes in IgA content and bacterial count. J Am Dietet Assoc
1989;89(5):690–2.
35.
Rubbo SD, Gardner JF. Sterilization and disinfection as applied to medical
industrial and laboratory practice. London: Lloyd-Luke, 1965.
36.
Kendall P. Keeping food safe in day care settings. Fort Collins, CO:
Colorado State University. <http://www.ext.colostate.edu/pubs/columnnn/
nn000704.html>, 2000.
37.
Van D. SafetyAlerts. Safe school lunch tips can help prevent illness. <http://
www.safetyalerts.com/t/fd/schlun.htm>, 1999.
38.
Lamb D. Healthy school lunches follow the new dietary guidelines. In:
Nutrition and your health: dietary guidelines for Americans. Aim for
fitness; build a health base; Choose sensibly for good health. Home and
Garden Bulletin, 5th edn. 2000;232.
39.
Canadian Food Inspection Agency. Food safety facts on bagged and boxed
lunches. <http://www.inspection.gc.ca/english/corpaffr/foodfacts/
bagboxe.shtml>, 2001.
40.
Department of Human Services. Meningococcal disease. Melbourne: DHS
<http://www.betterhealth.vic.gov.au>, 1999.
41.
Food Safety and Inspection Service. Foodborne illness: what consumers
need to know. Fact sheet. Washington, DC: US Department of Agriculture.
<http://www.fsis.usda.gov/oa/pubs/fact_fbi.htm>, 2000.
234
Dietary Guidelines for Children and Adolescents in Australia
4. C ARE
FOR YOUR CHILD ’ S FOOD : PREPARE AND STORE IT SAFELY
Special considerations
Dietary Guidelines for Children and Adolescents in Australia
235
A. T HE
A
FOETAL ORIGINS OF DISEASE HYPOTHESIS , OR
B ARKER
HYPOTHESIS
T H E F O E TA L O R I G I N S O F D I S E A S E
H Y P OT H E S I S , O R B A R K E R H Y P OT H E S I S
Colin Binns
The idea that nutrition early in life can influence growth and health in later life
is not new, but it is only in the past decade that the hypothesis has become
more widely accepted. In a paper published 15 years ago, Barker1 noted a
correlation between high neonatal mortality and deaths from coronary heart
disease 40 to 50 years later. He hypothesised that neonatal mortality could be a
surrogate indicator for early nutrition. Since that time Barker’s group has
published more than 60 papers on the subject and there have been hundreds
more papers by other researchers.
In its original form, the hypothesis related weight at birth to subsequent disease
patterns. In the last decade, however, the hypothesis has been further developed
and refined to include not only birthweight but also body leanness at birth and
growth during childhood.2,3
The original studies on which Barker based his hypothesis involved a cohort of
men and women born in Hertfordshire between 1911 and 1920. The maternal
and child health nurses in the county had kept excellent records, which had
been preserved and were available for research. Follow-up of the cohort about
50 years later showed that those who had a low birthweight were more likely to
die of coronary heart disease (see Table A.1) or to develop metabolic
syndrome.4,5
Table A.1
Death rates from coronary artery disease among 16 000 men
and women born in Hertfordshire between 1911 and 1920, by
birthweight3
Birthweight (pounds)
Standardised
mortality ratio
Deaths
(number)
100
57
5.6–6.5
81
137
6.6–7.5
80
298
7.6–8.5
74
289
8.6–9.5
55
103
>9.5
65
57
All
74
941
<5.5
Barker’s original studies were subject to criticisms—that there may have been
confounding by social class or that the relatively low follow-up rate may have
resulted in biased results. Since that time, however, the results of other studies
Dietary Guidelines for Children and Adolescents in Australia
237
A. T HE
FOETAL ORIGINS OF DISEASE HYPOTHESIS , OR
B ARKER
HYPOTHESIS
that have been published have overcome these objections. Most notable are the
studies from Scandinavia, particularly Helsinki, where a comprehensive database
and excellent follow-up have allowed for more detailed work.6,7,8 The Finnish
studies added to our knowledge of how growth during infancy and childhood
modifies health outcomes. The path of growth during childhood modifies the risk
of disease associated with small body size at birth. The highest death rates from
coronary heart disease were found in men who were thin at birth but who had
accelerated growth rates, so that by the age of 1 year they had above averagebody mass. Other confirmatory studies for the hypothesis have come from
continuing analysis of the results of the famine that occurred in Holland during
World War 2.9
The hypothesis has become more complex because it is apparent that, in
addition to birthweight, other dimensions of body shape at birth and subsequent
growth from childhood into adulthood must be considered.10 As Barker puts it,
the current version of the foetal origins hypothesis applies to people who had
low birthweight or were thin or short at birth or failed to grow in infancy.
As adults, children in these categories develop increased rates of coronary heart
disease, stroke, type 2 diabetes and hypertension.
Death rates from coronary heart disease increase in those with poor prenatal or
infant nutrition followed by improved postnatal nutrition. The patterns differ for
those who later develop stroke, type 2 diabetes or hypertension. And there are
slightly different patterns for each gender. Common to all, however, is a period
of reduced early growth followed by a period of accelerated growth. People who
were small at birth are more prone to developing type 2 diabetes or coronary
heart disease if they become overweight as adults.
Detailed analysis of the Finnish cohort has shown that there are in fact two
pathways whereby growth may lead to subsequent coronary heart disease. In
one, thinness at birth is followed by rapid weight gain in childhood. In the other,
failure of infant growth is followed by persisting thinness during childhood. Both
are associated with short stature in childhood. 8 Figure A.1 illustrates the
combined influences of thinness at birth—a ponderal index of less than 26 (the
ponderal index is weight/height3)—and subsequent growth rates. For example, a
male who is thin at birth but who gains one standard deviation of body mass
index by the age of 6 years has a hazard ratio of 1.2. This compares with a male
born with a normal body shape and who also gains weight but whose
subsequent risk of coronary heart disease remains below average.
An Australian contribution to the hypothesis has been documentation of the
influence of low birthweight on the subsequent development of chronic renal
disease through studies of Aboriginal Australians in the Northern Territory. The
association might be mediated through impaired nephrogenesis caused by intrauterine malnutrition. The current epidemic of renal disease in Aboriginal
Australians may be at least in part a result of the higher incidence of lowbirthweight babies and the improvements in life expectancy in this population.11
238
Dietary Guidelines for Children and Adolescents in Australia
A. T HE
FOETAL ORIGINS OF DISEASE HYPOTHESIS , OR
B ARKER
HYPOTHESIS
Figure A.1 Hazard ratios for coronary heart disease associated with a standard deviation increase in
body mass index, ages 1 to 12 years8
Note: Ponderal index = weight/height 3.
Type 2 diabetes in adulthood is also related to body size in early life. Barker’s
original studies in Hertfordshire showed that diabetes was related to low
birthweight.1 However, in studies in Swedish males by Lithell12 thinness at birth
was found to be a stronger predictor—see Figure A.2.
Hypertension is also included in the outcomes of the foetal origins hypothesis;
an extensive literature review by Law documents numerous supporting studies.13
The relationship between low birthweight and hypertension holds good in both
developed and developing countries. Several studies have also shown that blood
pressure increases with placenta size.13,14 One explanation proposed for this is
that a larger placenta is the result of an undernourished foetus attempting to
extract additional nutrients from the mother.2 The physiological and biochemical
Figure A.2 Prevalence of type 2 diabetes, by ponderal index at birth12
Note: Ponderal index is weight/height3.
Dietary Guidelines for Children and Adolescents in Australia
239
A. T HE
FOETAL ORIGINS OF DISEASE HYPOTHESIS , OR
B ARKER
HYPOTHESIS
mechanisms involved are not yet fully documented. The foetal origins hypothesis
proposes that these chronic diseases develop as a result of adaptations the foetus
makes when it is undernourished. These adaptations can be cardiovascular,
metabolic or endocrine, and they appear to permanently change the structure
and function of the body.15 Among the specific adaptations proposed are
diversion of oxygenated blood away from the trunk to the brain. There may also
be alterations to the hormonal systems that regulate growth and maturation and
alterations to body composition.
One mechanism for the association may be the way in which the hypothalamo–
pituitary–adrenal axis is programmed.16 Programming of this axis is one
hypothesis that can explain the link between the foetal environment and
development and later disease. An excess of glucocorticoids may be associated
with hypertension and glucose intolerance. Some animal data are available to
support this hypothesis, and human studies have found that reduced size at birth
was associated with higher fasting 9am plasma cortisol concentrations in adults.
Raised plasma cortisol concentrations were, in turn, associated with higher blood
pressure and inversely related to measures of glucose tolerance. The resultant
long-term alterations in the set-point of several major hormonal axes would
explain the increased prevalence of type 2 diabetes in low-birthweight infants.17
These adaptations permanently ‘re-program’ the physiology of the body.
Influences on foetal programming include the mother’s body composition before,
during and after pregnancy; diet during pregnancy; and postnatal nutrition and
growth.
Although the evidence supporting the foetal origins hypothesis is strong, there
are numerous gaps and some findings are hard to explain. For example, one
would expect that the intra-uterine nutritional stress on twins would make them
good examples for the hypothesis. Yet a study in New Zealand18 shows that
twins have lower blood pressures than singletons, not the higher blood pressure
that would be expected. Similarly, if the hypothesis holds, it would be expected
that the twins would have a higher death rate from cardiovascular disease, but
this is not the case19, although in this study the shorter of the pairs of twins did
have a higher death rate, confirming that nutrition in early life is important. It
seems likely that some additional protective mechanism operates in the case of
multiple births. Whatever the reason, further research into multiple births may
help us understand the foetal origins hypothesis.
In reviewing the evidence for the foetal origins hypothesis, Terry and Susser20
acknowledge the momentum gathered by the hypothesis and pose three central
challenges:
•
refining the measure of early experience
•
tracing the causal pathway that connects early experience with later health
•
ruling out confounding by social class.
240
Dietary Guidelines for Children and Adolescents in Australia
A. T HE
FOETAL ORIGINS OF DISEASE HYPOTHESIS , OR
B ARKER
HYPOTHESIS
The challenge now must be to discover more about the cellular and molecular
mechanisms giving rise to these associations.21 But, even before the mechanism
is fully understood, it is not too early to begin to apply the findings to public
health interventions. Evaluation of appropriate interventions could actually
expand our knowledge of the mechanisms involved.
One interesting aspect of the foetal origins hypothesis is its ability to explain
differences in the prevalence and timing of chronic disease epidemics in
different countries. For some time epidemiologists have been puzzled by the
‘French paradox’, whereby mortality from ischaemic heart disease in France is
about a quarter of that in Britain but the major risk factors are similar. It is
thought that under-certification of ischaemic heart disease in France could
account for about 20 per cent of the difference and that the high consumption of
alcohol in France—and of red wine in particular—could explain a small amount
of the difference. However, Barker has reviewed the development of maternal
nutrition programs in the two countries and suggests that the earlier concern of
the French with improving nutrition has protected them from this chronic disease
epidemic.22
I M P L I C AT I O N S
F O R P U B L I C H E A LT H
Because of the unproven nature of the foetal origins hypothesis, any intervention
should be conservative and not present a potential risk to the community.
Nevertheless, there are at least two areas where public health nutrition
interventions could be considered:
•
prenatal care—nutrition and health care programs to minimise the number
of low-birthweight babies and thin babies (ponderal index <26)
•
postnatal growth—programs to avoid under-nutrition or the development
of overweight or obesity during childhood. This would be an extension of
present growth monitoring at child health clinics to ensure universal care.
In Australia, low birthweight is observed more often in the babies of younger or
older mothers, first-time mothers, single mothers and Indigenous mothers.23
Cigarette smoking, alcohol consumption and the nutritional status of pregnant
women are also factors.23
The overall proportion of low-birthweight infants in Australia is relatively low by
international standards (see Table A.2), but there are sections of Australian
society in which the proportion is significantly higher.
Dietary Guidelines for Children and Adolescents in Australia
241
A. T HE
FOETAL ORIGINS OF DISEASE HYPOTHESIS , OR
Table A.2
B ARKER
HYPOTHESIS
Low-birthweight infants in Australia24
Year
Low-birthweight
infants
Number
1991
16 272
Per cent of all births
6.3
1992
1993
1994
1995
16 489 16 374 16 387 16 571
6.3
6.3
6.3
6.4
1996
1997
1998
16 525 16 800 16 854
6.4
6.6
6.6
Among Aboriginal Australians, 11.8 per cent of infants were below 2500 grams at
birth—almost double the national average.24 In the Northern Territory the rate for
Aboriginal babies was 13 per cent. It is interesting to note that in the United
States the prevalence of low birthweight in black Americans is about the same as
that for Australian Aboriginal people.25
Programs to reduce the prevalence of low birthweight should be a high priority.
Maternal nutrition is particularly important—not just during pregnancy but also
prior to conception. The nutrition of girls is obviously very important, so that
they enter adulthood in a state of nutrition that prepares them for pregnancy.
P O S T N A TA L
G ROW T H A N D B R E A S T F E E D I N G
Breastfeeding is an extremely important factor in maintaining appropriate growth
in infants. Infants who are breastfed have slightly lower rates of growth at 6
months of age when compared with infants being fed artificial formula. They
also have lower rates of childhood obesity—and probably lower rates of obesity
later in life. Studies have shown that exclusive breastfeeding seems to have a
protective effect against some risk factors for cardiovascular disease in later life,
including lipoprotein and glucose levels.26 This suggests that the most practical
intervention is the promotion of exclusive breastfeeding until the age of
6 months. More studies are needed before the most appropriate interventions for
infants who are born with a low birthweight can be determined.
CONCLUSION
The foetal origins of disease hypothesis explains many facets of the current
epidemic of chronic disease occurring around the world, but many aspects of the
hypothesis need further research and substantiation before its wider acceptance.
Acceptance of the hypothesis would suggest that further programs for maternal,
prenatal and child nutrition should be implemented. Programs designed to
achieve the goals of improved maternal and child nutrition can be justified on
many grounds, have no downside, and should therefore be promoted without
waiting for further evidence.
242
Dietary Guidelines for Children and Adolescents in Australia
A. T HE
FOETAL ORIGINS OF DISEASE HYPOTHESIS , OR
B ARKER
HYPOTHESIS
[The material presented here is based on a paper presented to the Asia Pacific
Academic Consortium for Public Health conference in Seoul, South Korea, in
April 2001. The paper is to be published in the Asia Pacific Journal of Public
Health.]
REFERENCES
1.
Barker D, Osmond C. Infant mortality, childhood nutrition, and ischaemic
heart disease in England and Wales. Lancet 1986;1:1077–81.
2.
Godfrey KM, Barker DJP. Fetal programming and adult health. Pub Hlth
Nutr 2001;4(2B):611–24.
3.
Robinson R. The fetal origins of adult disease. BMJ 2001;322:375–6.
4.
Barker D. Mothers, babies and health in later life. Edinburgh: Churchill
Livingstone, 1998.
5.
Osmond C, Barker DJ, Winter PD, Fall CH, Simmonds SJ. Early growth and
death from cardiovascular disease in women. BMJ 1993;307:1519–24.
6.
Forsén T, Eriksson JG, Tuomilehto J, Osmond C, Barker DJ. Growth in
utero and during childhood among women who develop coronary heart
disease: longitudinal study. BMJ 1999;319:1403–7.
7.
Eriksson JG, Forsén T, Tuomilehto J, Winter PD, Osmond C, Barker DJ.
Catch-up growth in childhood and death from coronary heart disease:
longitudinal study. BMJ 1999;318:427–31.
8.
Eriksson JG, Forsén T, Tuomilehto J, Osmond C, Barker DJ. Early growth
and coronary heart disease in later life: longitudinal study. BMJ
2001;322:949–53.
9.
Roseboom TJ, van der Meulen JH, Osmond C, Barker DJ, Ravelli AC,
Schroeder-Tanka JM et al. Coronary heart disease after prenatal exposure
to the Dutch famine, 1944–45. Heart 2000;84:595–8.
10.
Barker D. The fetal origins hypothesis—where do we stand? Annals Nutr
Metab 2001;45(suppl. 1):123.
11.
Hoy WE, Rees M, Kile E, Mathews JD, Wang Z. A new dimension to the
Barker hypothesis: low birthweight and susceptibility to renal disease.
Kidney International 1999;56:1072–7.
12.
Lithell HO, McKeigue PM, Berglund L, Mohsen R, Lithell UB, Leon DA.
Relation of size at birth to non–insulin dependent diabetes and insulin
concentrations in men aged 50–60 years. BMJ 1996;312:406–10.
13.
Law C, Shiell A. Is blood pressure inversely related to birth weight? The
strength of evidence from a systematic review of the literature. J Hypertens
1996;14:935–41.
14.
Law CM, Barker DJ, Bull AR, Osmond C. Maternal and fetal influences on
blood pressure. Arch Dis Child 1991;66:1291–5.
Dietary Guidelines for Children and Adolescents in Australia
243
A. T HE
FOETAL ORIGINS OF DISEASE HYPOTHESIS , OR
B ARKER
HYPOTHESIS
15.
Barker DJP. Fetal origins of cardiovascular disease. Ann Med
1999;31(suppl. 1):3–6.
16.
Clark PM. Programming of the hypothalamo–pituitary–adrenal axis and the
fetal origins of adult disease hypothesis. Europ J Pediat
1998;157(suppl. V):S7–S10.
17.
Phillips DIW. Birth weight and the future development of diabetes: a
review of the evidence. Diab Care 1998;21(suppl. 2):B150–B155.
18.
Williams S, Poulton R. Twins and maternal smoking: ordeals for the fetal
origins hypothesis? A cohort study. BMJ 1999;318:897.
19.
Vagero D, Leon DA. Is heart disease mortality elevated in a low birth
weight population? A test of the fetal origins hypothesis based on the
Swedish Twins Registry. Lancet 1994;343:260–3.
20.
Terry MB, Susser E. Commentary: the impact of fetal and infant exposures
along the life course. Int J Epid 2001;30:95–6.
21.
Byrne CD, Phillips DI. Fetal origins of adult disease: epidemiology and
mechanisms. J Clin Path 2000;53:822–8.
22.
Barker DJP. Why heart disease mortality is low in France. Commentary:
intrauterine nutrition may be important. BMJ 1999;318:1471–80.
23.
de Looper M, Bhatia K. Australian health trends 2001. Canberra: Australian
Institute of Health and Welfare, 2001.
24.
Nassar N, Sullivan E, Lancaster P, Day P. Australia’s mothers and babies
1998. Sydney: Australian Institute of Health and Welfare, 2000.
25.
Centers for Disease Control and Prevention & National Center for Health
Statistics. Low birth weight statistics from the national vital statistics system.
CDC, 1998.
26.
Ravelli AC, van der Meulen JH, Osmond C, Barker DJ, Bleker OP. Infant
feeding and adult glucose tolerance, lipid profile, blood pressure, and
obesity. Arch Dis Child 2000;82:248–52.
244
Dietary Guidelines for Children and Adolescents in Australia
B. G ROWTH ,
B
GROWTH REFERENCES AND OBESITY CUT - OFF POINTS
G R OW T H , G R OW T H R E F E R E N C E S
A N D O B E S I T Y C U T- O F F P O I N T S
Colin Binns
Weight gain and an increase in body size are integral parts of normal growth and
development during childhood and adolescence. At this life stage the focus is on
maintaining a rate of physical growth that is consistent with the expected norms
for age, sex and stage of physiological maturity. Physical growth is best assessed
by the conventional measures of weight, length or height, and head
circumference. Maintenance of a positive energy and nutrient balance is critical
in achieving and sustaining normal growth and development. During periods of
rapid growth, any intentional restriction of weight gain—through dieting, for
example—is usually inappropriate.
In recent years there has been increasing awareness of the importance of
perinatal nutrition in relation to the development of disease in adulthood; this is
known as the foetal origins of disease hypothesis or Barker hypothesis1—see
part A of this ‘Special considerations’ section. In addition, there is increasing
evidence of the importance of growth and nutrition in relation to cognitive
development.2,3 Growth during infancy also influences future bone mass.4
DEFINITIONS
Growth
Growth refers to the acquisition of tissue and increase in body size.5
Development
Development refers to the increased ability of the body to function physically and
intellectually. Physical and intellectual development proceed at different rates in
different individuals.
G ROW T H
Between birth and 18 years of age, a person’s body weight increases about
twenty-fold. During early childhood, the rate of increase in weight and length is
essentially linear: the rate of increase in weight generally keeps pace with the
rate at which length increases. During infancy and adolescence, however, the
rate of growth changes rapidly over time; for example, it decelerates rapidly
during the first year of life, while during adolescence it first accelerates over a
period of one to three years and then decelerates rapidly until growth in height
Dietary Guidelines for Children and Adolescents in Australia
245
B. G ROWTH ,
GROWTH REFERENCES AND OBESITY CUT - OFF POINTS
ceases at about 16 years of age in girls and 18 years in boys. Secular changes in
growth and maturation have been well documented in many countries and
Australia is no exception. Loesch et al.6 compared the data on height and body
weight obtained in 1992 to 1993 from 1804 Melbourne school students aged 5
to17 years with historical data collected from white Australians during the last
100 years. Australians have been getting taller every decade and, although the
increase in height has significantly slowed down during the last two decades, the
increase in body weight is continuing and is more pronounced in females. This
is resulting in a continuing increase in the proportion of people who are
overweight and obese—in all age groups.
G ROW T H
REFERENCES
The term growth reference refers to the data set used to compile a growth chart.
In Australia, the international growth reference developed by the World Health
Organization, which was originally based on data from the US National Center
for Health Statistics7, was recommended by the National Health and Medical
Research Council in 1984.8 This growth reference has been used throughout
Australia since that time and is used in most countries of the world. This is
despite the fact that it has minor anomalies around the age of 2 years; these
arose when two separate data sets were blended.
Many studies have shown that nutritional and health status is more important
than ethnicity in determining growth rates, allowing the use of this single WHO
reference. Decision points (or ‘cut-off’ points) may, however, be defined
differently for different purposes and perhaps for some ethnic groups. The
growth reference currently in use is derived from a mix of infants who were
breastfed and infants fed on infant formula. Exclusively breastfed babies may
grow at a slightly lower rate than the reference.
In Australia the US National Center for Health Statistics growth charts7 are
recommended for this purpose for all ethnic groups. The charts are included in
the personal health records produced by various organisations for use by parents
and health workers as a continuing record of a child’s health. The NCHS has
since been incorporated in the Centers for Disease Control and Prevention,
which has revised the growth reference to eliminate the minor anomalies around
2 years of age.9 In particular, the data used for infants have been updated and
the calculation of some percentiles has been revised.
Previously, the term growth standard was used, implying that there was a
particular growth pathway every child should follow. A growth reference implies
that the chart will be used to monitor the individual child and not to make a
proscriptive comparison. The difficulty of developing a ‘standard’ would be
compounded by the secular trend just discussed and the current epidemic of
obesity. This means that the selection of any reference is somewhat arbitrary in
the absence of defined outcomes—that is, which growth channel would
maximise longevity and minimise morbidity. Evidence is now accumulating from
246
Dietary Guidelines for Children and Adolescents in Australia
B. G ROWTH ,
GROWTH REFERENCES AND OBESITY CUT - OFF POINTS
the various ‘Barker hypothesis’ studies to suggest that the present reference is
about right.
The suitability of the WHO–NCHS reference values for use as an international
standard has been debated because many of the children on whom the values
were based were not breastfed. In an international study, which included
Australian children, the growth of breastfed infants was slightly below the WHO–
NCHS reference. In 1993 the World Health Organization set up a working group
to develop new internationally applicable standards based on the growth of
infants who were breastfed according to the WHO protocol.10,11 A number of
problems were identified with the growth references developed by the National
Center for Health Statistics and supported by the World Health Organization:
•
the predominance of formula-fed babies
•
lack of representativeness and excessive homogeneity in the data for ages
0–2 years
•
lack of monthly measurements during early infancy—the infants and
children were only measured every three months
•
small sample sizes and lack of repeated measurements on the same
children
•
outdated curve-fitting procedures
•
a length–height disjunction at 24 months. This has been eliminated in the
latest version from the Centers for Disease Control and Prevention.9
These concerns resulted in the WHO recommendation to replace the WHO–
NCHS reference data and the establishment of the WHO working group. Data
collection for a new international growth reference began in 1998, and it is
anticipated that the new reference will be available in 2005.12 The new reference
will be prescriptive—in contrast with the existing descriptive reference—since it
will include infants who are healthy and who have been fed in accordance with
the WHO recommendations. Preliminary studies for the new reference suggest
that, at age 12 months, infants who were exclusively breastfed to 6 months were
600–650 grams lighter than artificially fed infants.13 This is the equivalent of a
Z score* of –0.6 (at 12 months). This difference is the same as that found
between male and female infants at 12 months. Since it is more important to
monitor velocity of growth, it is uncertain whether this change will be noticeable
in growth monitoring.
Dewey has also shown that the height of 12-month-old infants who were
exclusively breastfed to age 6 months is identical to that of artificially fed
infants.13 This is important because cognitive development in infants is related
more to height than to weight, and it reflects the protective effect of
breastfeeding against obesity (see Chapter 1). Thus, at the age of 12 months,
infants who were exclusively breastfed to 6 months will be the same height as
artificially fed infants but will weigh slightly less.
* Z scores are standard deviations above or below the mean.
Dietary Guidelines for Children and Adolescents in Australia
247
B. G ROWTH ,
GROWTH REFERENCES AND OBESITY CUT - OFF POINTS
In Australia, the growth of Aboriginal infants who are exclusively breastfed
follows the WHO–NCHS reference until 6 months of age then begins to fall
away.14,15 By the age of 12 months, the weight increase in Aboriginal infants is
around 0.5 Z scores below the reference.
Assessment of body size and growth rate
The most practical measures of nutritional status in childhood are comparisons
with reference growth charts that show the normal ranges for weight for age,
height for age and weight for height, by sex. When only a single measurement of
weight and height is available, the traditional method has been to establish the
percentile of the growth reference. In some situations it is more appropriate to
use the Z scores, and growth reference charts are available in both formats or a
calculator is available on the internet.16,17 If weight and height are measured on
several occasions, the measurements are most usefully interpreted by plotting
them on reference growth charts. Weight is a better indicator of acute
developments, while height reflects long-term nutrition.
Generally, if a child is growing normally the lines connecting the plotted values
will proceed along or parallel to one of the percentile lines on the charts. If the
plotted values show a markedly irregular pattern, this could signify a problem,
although some of the measurements might have been inaccurate or the data
might have been plotted incorrectly. This possibility should always be checked at
the first opportunity. The extent to which serial data for a child can deviate from
a given percentile range before concern is warranted depends on the age of the
child, the child’s position in the percentile range, the length of time for which
the rate of growth deviates from the norm, and the coexistence of any medical
condition. In general, the more pronounced the change in the growth rate, the
younger the child and the more extreme the percentile, the greater is the
concern.
Skinfold measurement—a measure of the amount of fat in the subcutaneous
compartment—is another index of under- or over-nutrition, although generation
of reliable measurements depends to a large extent on the use of trained
operators and calibrated instruments, and not all are reliable. DEXA (dual energy
X-ray absorptiometry) and ultrasound provide the most accurate measurements,
but cost limits their application to experimental use and to clinical settings where
more accurate diagnosis is required for management. Measurement and recording
of weight and height at regular intervals remain the best way of monitoring
growth.
Use of a growth reference in primary health care
An accurate record of growth is one of the most useful assessment tools for both
well children and children suffering from disease.
The commonly used growth charts are prepared with a number of percentiles
marked, usually ranging from the 3rd percentile to the 97th percentile. Growth
248
Dietary Guidelines for Children and Adolescents in Australia
B. G ROWTH ,
GROWTH REFERENCES AND OBESITY CUT - OFF POINTS
charts using Z scores are also available but are more often used in research
studies and surveys. The 95th and 5th percentiles are approximately plus and
minus 1.65 standard deviations respectively (Z scores of +1.65 and –1.65). The
value of a growth record is dependent not so much on the percentiles on the
chart but more on accurate measurement and plotting, followed by correct
interpretation of the information and, in particular, the trends.
Scales used for weighing children must be accurate and reliable. All scales need
to be continually readjusted to zero and constantly checked for any objects that
are obstructing an accurate measurement. If a towel or nappy is to be placed on
the scales, do this before the scales are set to zero. When reading the scales,
always position yourself at right angles to them, to avoid parallax errors. Ideally,
infants and young children should be weighed without clothing. If clothing has
to be worn, the scales should first be set to zero with an identical set of clothing,
which is then removed from the scale; alternatively, a set of clothing can
subsequently be weighed and subtracted from the clothed weight. Subtraction of
an arbitrary standard weight for clothing leads to inaccuracies.
The accuracy of all scales must be checked at least daily, using a standard
weight. Electronic scales are just as susceptible as mechanical ones to damage
and other causes of inaccuracy and must be cared for to ensure their continued
accuracy. If an obviously inaccurate reading is made—for example, as a result of
movement or excess clothing—it should not be recorded.
Children less than 2 years old are usually measured while they are lying down.
Between 2 and 3 years of age practices vary, and a note should be made to
indicate if the child was measured lying or standing. Two adults are always
required to accurately measure the length of an infant: the infant must lie
straight, and quietly, on the measuring board, with feet at a right angle, head
straight, and eyes looking straight upwards. A child or infant being measured
should wear only minimal clothing, so that the correct position can be easily
seen. Children should be measured in a standing position only when they are
able to ‘stand up straight and stand still’ long enough to be accurately measured.
Anthropometric data are of little use unless they are plotted on a growth chart
for comparison with earlier measurements from the same child or, if sequential
measurements are unavailable, for comparison with the growth reference. Serial
measurements are of far more value than a ‘one-off’ measurement, and an
accurately measured and correctly plotted growth chart can be of considerable
assistance in diagnosis and management. Data must be plotted for the correct
gender. Make a note on the chart of any potential source of error; for example,
the child was a struggler or was weighed in clothing. Check that the chart that is
being used is based on the WHO or CDC growth reference.
A child’s percentile obviously gives an indication of the position of the child
relative to the reference population. Parental size influences a child’s
measurements, and where this is thought to be a significant factor charts or
tables adjusted for the average height of both parents are available. In the case
of premature infants, allowance for their small size at birth can be made by
Dietary Guidelines for Children and Adolescents in Australia
249
B. G ROWTH ,
GROWTH REFERENCES AND OBESITY CUT - OFF POINTS
subtracting the number of weeks of prematurity from the infant’s age before
plotting on the growth chart. After 12 months of age it is no longer necessary to
allow for prematurity.
Growth trends reveal more about a child’s nutrition or health than the position of
one measurement on the chart. A child who is on approximately the same
percentile for height and weight and who is growing at a rate parallel to the next
percentile line is very unlikely to have a serious nutrition or chronic health
problem. If a child’s growth percentile is changing—and particularly when it is
near or crossing the upper or lower extremes, the 10th and 90th percentiles—a
reason should be sought. For example, a child with a body mass index greater
than the 85th percentile should be evaluated for risk factors associated with
excess adiposity and referred for weight management if appropriate. Similarly, a
trend towards weight loss over a month or more should prompt efforts to
establish a nutritional cause or the existence of an underlying problem.
Whenever a major discrepancy from the previous measurement is found, the
accuracy of the measurement and recording should first be checked. In addition,
it is important to note any difference between the weight and height percentiles.
In acute nutritional problems, the weight percentile is likely to be substantially
lower than the percentile for height. Where there are endocrine deficiencies or
other long-term diseases, both weight and height will be substantially depressed.
More than half of the children who are diagnosed in primary care or a
community clinic as ‘failing to thrive’ have a relatively simple nutrition
problem—just not getting enough food to meet their needs. For example, a child
might be thought to have an allergy and be placed on a very restrictive diet, or if
the adults in the family have been placed on a low-fat diet the child might also
be eating the same diet. Many chronic diseases cause growth retardation; among
them are undiagnosed renal, cardiac or metabolic problems. In the absence of
other symptoms or signs, however, it is usually appropriate to embark on a trial
of improved nutrition rather than proceeding immediately to further
investigation. Referral to a specialist clinic for investigation of growth hormone
deficiency is only necessary if a child is consistently below the third percentile
and no other disease is present.
C L A S S I F I C AT I O N
O F OV E RW E I G H T A N D O B E S I T Y I N C H I L D R E N A N D
ADOLESCENTS
Overweight and obesity are serious health problems in Australia and other
western countries: obesity, defined as a condition in which excess fat has
accumulated to the extent that health may be impaired18, accounted for over
4 per cent of the total burden of disease in Australia in 1996.19 Overweight and
obesity are delineated at arbitrary points along a continuum of increasing risk of
adverse health outcomes with increasing levels of fatness.20 A recent report
found that 19–23 per cent of Australian children are either overweight or obese.21
250
Dietary Guidelines for Children and Adolescents in Australia
B. G ROWTH ,
GROWTH REFERENCES AND OBESITY CUT - OFF POINTS
Among adults, body mass index—weight (kilograms / height (metres)2—is widely
accepted as a means of categorising an individual’s weight. A person with a BMI
greater than 25kg/m2 is considered overweight, while a BMI greater than 30kg/
m2 is indicative of obesity. These cut-off points are related to the points at which
the risks of adverse health outcomes rise steeply.19 Table B.1 shows the BMI cutoff points widely accepted for use among adults in Australia.
Table B.1
Category
Normal weight
Overweight
Obese
Body mass index categories for adults in Australia
BMI range (kg/m2)
20–24.9
25–30
>30
Children and adolescents who are overweight or obese can suffer a range of
psychological and physical problems.22 Among them are social isolation and
metabolic and orthopaedic problems in the short term and type 2 diabetes and
cardiovascular disease in the long term. Unlike adults, however, there is
insufficient evidence to determine a level of excess adiposity that equates to
health risk. As a result, choosing cut-off points for classifying a young person as
overweight or obese is somewhat arbitrary.
Defining overweight and obesity for research and monitoring
In 1999 an expert committee, on behalf of the International Obesity Task Force,
recommended that BMI be used to assess adiposity in children and adolescents
and that the adult cut-off points be used as a reference.23,24 Normal BMI among
children and adolescents changes with age, so choosing a single cut-off number
is not possible. Although not as accurate as more direct measures of adiposity
(such as magnetic resonance imaging or dual energy X-ray absorptiometry), BMI
measurement is a low-cost, simple method that has been validated against more
direct measures of adiposity.25
Following on from the recommendations of the International Obesity Task Force,
Cole et al.26 developed tables for categorising overweight and obesity based on
the adult cut-off points of 25kg/m2 and 30kg/m2. The tables were developed by
pooling data on BMI from almost 200 000 children from six large, nationally
representative growth studies in Brazil, Great Britain, Hong Kong, the
Netherlands, Singapore and the United States. Designed for epidemiological use,
the tables will allow international comparison of the prevalence of overweight
and obesity, as well as assessment of trends within populations.
The Table B.2 shows the international BMI cut-off points for overweight and
obesity for males and females aged 2 to 18 years.
Dietary Guidelines for Children and Adolescents in Australia
251
B. G ROWTH ,
Table B.2
GROWTH REFERENCES AND OBESITY CUT - OFF POINTS
International BMI cut-off points for overweight and obesity:
males and females aged 2–18 years26
Body mass index
equivalent to 25kg/m2
in adults
Age (years)
Body mass index
equivalent to 30kg/m2
in adults
Males
Females
Males
Females
2
18.41
18.02
20.09
19.81
2.5
18.13
17.76
19.80
19.55
3
17.89
17.56
19.57
19.36
3.5
17.69
17.40
19.39
19.23
4
17.55
17.28
19.29
19.15
4.5
17.47
17.19
19.26
19.12
5
17.42
17.15
19.30
19.17
5.5
17.45
17.20
19.47
19.34
6
17.55
17.34
19.78
19.65
6.5
17.71
17.53
20.23
20.08
7
17.92
17.75
20.63
20.51
7.5
18.16
18.03
21.09
21.01
8
18.44
18.35
21.60
21.57
8.5
18.76
18.69
22.17
22.18
9
19.10
19.07
22.77
22.81
9.5
19.46
19.45
23.39
23.46
10
19.84
19.86
24.00
24.11
10.5
20.20
20.29
24.57
24.77
11
20.55
20.74
25.10
25.42
11.5
20.89
21.20
25.58
26.05
12
21.22
21.68
26.02
26.67
12.5
21.56
22.14
26.43
27.24
13
21.91
22.58
26.84
27.76
13.5
22.27
22.98
27.25
28.20
14
22.62
23.34
27.63
28.57
14.5
22.96
23.66
27.98
28.87
15
23.29
23.94
28.30
29.11
15.5
23.60
24.17
28.60
29.29
16
23.90
24.37
28.88
29.43
16.5
24.19
24.54
29.14
29.56
17
24.46
24.70
29.41
26.69
17.5
24.73
24.85
29.70
29.84
18
25.00
25.00
30.00
30.00
252
Dietary Guidelines for Children and Adolescents in Australia
B. G ROWTH ,
GROWTH REFERENCES AND OBESITY CUT - OFF POINTS
Defining overweight and obesity in individuals
Cole et al.26 also developed a method of categorising overweight and obesity in
population and clinical research, but it is not suitable for use in clinical practice.
For clinical practice, the use of a BMI-for-age chart is more suitable since an
individual can be described in terms of a percentile—for example, above the
85th percentile—and their progress plotted on a chart that forms part of the
clinical record. An individual with a BMI above the 85th percentile is considered
overweight, while a BMI above the 95th percentile is indicative of obesity.27
Nevertheless, although they are useful in clinical practice, BMI-for-age charts do
have some weaknesses. First, the choice of cut-off points to classify overweight
and obesity is arbitrary, without evidence of an association with adverse health
outcomes. Second, the charts must be derived from a reference population.
Australia does not at present have growth reference charts derived from the local
population, so a reference from another population must be used. The choice of
a suitable reference population is also somewhat arbitrary. Importantly, BMI-forage reference charts should be derived from the same population as that used for
other widely used growth references such as weight-for-age and headcircumference charts. The new Centers for Disease Control and Prevention BMIfor-age charts, developed in the United States, would meet these criteria.
Ideally, child and adolescent overweight and obesity would be defined in terms
of the risks of adverse health outcomes. Those data are not currently available,
and further research to identify the appropriate cut-off points should be a
priority.
Further considerations
Abdominal obesity
Another important factor is the distribution of body fat. Evidence is emerging that
children with excess abdominal fat may be at increased risk of a constellation of
risk factors such as hyperlipidaemia, hypertension and hyperinsulinaemia, known
collectively as metabolic syndrome.28
Abdominal fat is measured most accurately using magnetic resonance imaging or
DEXA, but both of these techniques are expensive and available only in tertiary
referral centres. The most practical measure is waist circumference, which has
been validated against more direct techniques.29 At present there are no accepted
waist-circumference cut-off points with which to characterise an individual’s risk
of health problems associated with excess abdominal fat. It is, however, a useful
measurement, in addition to BMI, as part of serial measurements to monitor
progress in an individual.
Dietary Guidelines for Children and Adolescents in Australia
253
B. G ROWTH ,
GROWTH REFERENCES AND OBESITY CUT - OFF POINTS
Ethnicity
Among adults there are ethnic variations in the level of excess adiposity that
prompts an increase in health risk.20 For example, an Asian person may have a
greater proportion of fat than a Caucasian person with the same BMI. The
International Obesity Task Force has suggested that 27.5kg/m2 might be a
suitable cut-off point for obesity in Asian populations. Further research is needed
to determine whether these differences also apply to young people.
Conclusion
Body mass index is the most practical method of assessing adiposity in children
and adolescents, with waist circumference providing a measure of abdominal fat.
For population and clinical research, the table developed by Cole et al.26 should
be used to categorise young people as normal weight, overweight or obese. In
clinical practice and non–health care settings, BMI-for-age charts such as those
developed by the Centers for Disease Control and Prevention should be used to
describe an individual in terms of a percentile. Although the cut-off points are
arbitrary, a person with a BMI above the 85th percentile would be considered
overweight, while an individual with a BMI above the 95th percentile would be
considered obese. When determining a young person’s weight status, ethnicity
should be taken into consideration and further assessment recommended as
appropriate.
REFERENCES
1.
Forsen T, Eriksson J, Tuomilehto J, Osmond C, Barker D. Growth in utero
and during childhood among women who develop coronary heart disease:
longitudinal study. BMJ 1999;319(27 Nov):1403–7.
2.
Makrides M. Early childhood nutrition and cognitive outcome. Proc Nutr
Soc Aust 1998;22:216–22.
3.
Richards M, Hardy R, Kuh D, Wadsworth MEJ. Birth weight and cognitive
function in the British 1946 birth cohort: longitudinal population based
study. BMJ 2001;322:199–203.
4.
Cooper C, Fall C, Egger P, Hobbs R. Growth in infancy and bone mass in
later life. Ann Rheum Dis 1997;56:17–21.
5.
Network of the Federal/Provincial/Territorial Group on Nutrition &
National Institute of Nutrition. Promoting nutritional health during the
preschool years: Canadian guidelines. 1989.
6.
Loesch DZ, Stokes K, Huggins RM. Secular trend in body height and
weight of Australian children and adolescents. Am J Phys Anthrop
2000;111:545–56.
254
Dietary Guidelines for Children and Adolescents in Australia
B. G ROWTH ,
GROWTH REFERENCES AND OBESITY CUT - OFF POINTS
7.
Hamill PVV, Drizd TA, Johnson CL, Reed RB, Roche AF, Moore WM.
Physical growth: National Center for Health Statistics percentiles. Am J Clin
Nutr 1979;32:607–29.
8.
Binns CW. Assessment of growth and nutritional status. J Food Nutr
1985;42:119–26.
9.
Centers for Disease Control and Prevention. CDC growth charts: United
States. Advance data. No. 314. 2000;314.
10.
Dewey KG, Peerson JM, Brown KH, Krebs NF, Michaelsen KF, Persson LA
et al. Growth of breast-fed infants deviates from current reference data: a
pooled analysis of US, Canadian and European data sets. Pediatrics
1995;96:495–503.
11.
WHO Working Group on the Growth Reference Protocol. WHO Working
Group on the Growth Reference Protocol and WHO Task Force on
Methods for the Natural Regulation of Fertility Growth Patterns of
Breastfed Infants in Seven Countries. Acta Paediatr 2000;89(2):215–22.
12.
de Onis M, Blossner M. The WHO global database on child growth and
malnutrition. In: International Colloqium on Promoting Growth and
Development of Under Fives. Antwerp, 2001.
13.
Dewey K. Nutrition, growth and completmentary feeding of the breastfed
infant. Ped Clin Nutr Amer 2001;48(1):87–104.
14.
Binns CW. Infant feeding and growth. In: Ulijaszek SJ, Johnston FE, Preece
MA, eds. Cambridge encyclopedia of human growth and development.
Cambridge: Cambridge University Press; 1998:320–9.
15.
Smith RM, Smith PA, McKinnon M, Gracey M. Birthweights and growth of
infants in five Aboriginal communities. ANZ J Publ Hlth 2000;24:124–35.
16.
WHO Working Group. Use and interpretation of anthropometric indicators
of nutritional status. Bull WHO 1986;64:929–41.
17.
Dibley MJ, Goldsby JB, Staehling NW, Trowbridge FL. Development of
normalized curves for the international growth reference: historical and
technical considerations. Am J Clin Nutr 1987;46:736–48.
18.
World Health Organization. Obesity: preventing and managing the global
epidemic. Report of a WHO consultation on obesity. Geneva: WHO, 1997.
19.
Australian Institute of Health and Welfare. Australia’s health 2000.
Canberra: AIHW, 2000.
20.
International Obesity Task Force. The Asia–Pacific perspective: redefining
obesity and its treatment. Health Communications Australia, 2000.
21.
Booth ML, Wake M, Armstrong T, Chey T, Hesketh K, Mathur S. The
epidemiology of overweight and obesity among Australian children and
adolescents, 1995–97. ANZ J Pub Hlth 2001;25(2):162–9.
22.
Must A, Strauss RS. Risks and consequences of childhood and adolescent
obesity. Int J Obes 1999;23(suppl. 2):S2–S11.
Dietary Guidelines for Children and Adolescents in Australia
255
B. G ROWTH ,
GROWTH REFERENCES AND OBESITY CUT - OFF POINTS
23.
Himes JH, Dietz WH. Guidelines for overweight in adolescent preventative
services: recommendations from an expert committee. Am J Clin Nutr
1994;59:307–16.
24.
Bellizzi MC, Dietz WH. Workshop on childhood obesity: summary of the
discussion. Am J Clin Nutr 1999;70:173S–175S.
25.
Pietrobelli A, Faith MS, Allison DB, Gallagher D, Chiumello G, Heymsfield
SB. Body mass index as a measure of adiposity among children and
adolescents: a validation study. J Pediatr 1998;132:204–10.
26.
Cole TJ, Bellizi MC, Flegal KM, Dietz WH. Establishing a standard
definition for child overweight and obesity worldwide: international
survey. BMJ 2000;320:1240–3.
27.
Dietz WH, Bellizi MC. Introduction: the use of body mass index to assess
obesity in children. American Journal of Clinical Nutrition
1999;70(suppl.):123S–125S.
28.
Goran MI. Metabolic precursors and effects of obesity in children: a decade
of progress, 1990–1999. Am J Clin Nutr 2001;73:158–71.
29.
Taylor RW, Jones IE, Williams SM, Goulding A. Evaluation of waist
circumference, waist-to-hip ratio, and the conicity index as screening tools
for high trunk fat mass, as measured by dual-energy X-ray absorptiometry.
Am J Clin Nutr 2000;72:490–5.
256
Dietary Guidelines for Children and Adolescents in Australia
C. T HE
C
NUTRITION OF
A BORIGINAL
AND
T ORRES S TRAIT I SLANDER P EOPLES
THE NUTRITION OF ABORIGINAL AND
TORRES STRAIT ISLANDER PEOPLES
Amanda Lee
CURRENT
H E A L T H A N D N U T R I T I O N A L S TAT U S
Aboriginal and Torres Strait Islander peoples continue to suffer a much greater
burden of ill-health—particularly nutrition-related chronic disease—compared
with other Australians.1 –3 In 1998 death rates among Indigenous Australians were
at least three times greater than those for the total Australian population, and
Indigenous people’s life expectancy was around 20 years less.2 Much of this poor
health can be attributed to poor nutrition.1
The prevalence of many nutrition-related conditions—such as type 2 diabetes,
cardiovascular disease, renal disease, poor dental health, iron deficiency
anaemia, and some forms of cancer—is disproportionately high among
Indigenous Australians. Overweight and obesity tend to underpin the
development of many of these conditions4,5 , which are discussed in detail in
Nutrition in Aboriginal and Torres Strait Islander Peoples: an information paper1
(pp. 25–34 and 143–79) and The Health and Welfare of Australia’s Aboriginal
and Torres Strait Islander Peoples.2
The potential intergenerational effects of poor health and nutritional status have
been well described.6–9 Low birthweight, failure to thrive and inappropriate child
growth are serious concerns in Indigenous Australian communities.1,10–12 Diabetes
in pregnancy also has potential intergenerational effects13,14 and is an additional
concern.
Good maternal nutrition and healthy infant and childhood growth are
fundamental to the achievement and maintenance of health throughout the life
cycle.12 Factors associated with maternal and infant health and childhood growth
and nutrition are well documented in Nutrition in Aboriginal and Torres Strait
Islander Peoples1 (pp. 83–140).
High Indigenous infant mortality rates have been reported throughout Australia.1,2
Several studies have indicated that infection—especially of the gastrointestinal
and respiratory tracts—associated with malnutrition and growth retardation was,
and continues to be, the most common cause of death in children, particularly
before the age of two.1
Low Aboriginal birthweights have been documented, ranging from a prevalence
of less than 7 per cent in Victoria to over 20 per cent in parts of northern
Australia.1 Several causal factors are implicated: maternal ill-health and
malnutrition are significant determinants. 15 Although the birthweight distribution
for Aboriginal and Torres Strait Islander infants is similar to that for nonIndigenous infants, the infant mortality rate is 2.5 times higher.16
Dietary Guidelines for Children and Adolescents in Australia
257
C. T HE
NUTRITION OF
A BORIGINAL
AND
T ORRES S TRAIT I SLANDER P EOPLES
Growth retardation among Aboriginal infants after the age of four to six months
has consistently been noted.1 Relatively poor growth has also been shown to
persist in older children, although overweight and obesity are becoming
increasing concerns, particularly among Torres Strait Islanders.1
National breastfeeding data for Indigenous Australians are limited.1,17 The 1995
National Health Survey found that Indigenous mothers breastfed for longer than
non-Indigenous mothers.2 The 1994 National Aboriginal and Torres Strait Islander
Survey confirmed that Indigenous mothers of higher socio-economic status were
more likely to breastfeed and to do so for longer than Indigenous mothers from
lower socio-economic groups, but that Indigenous babies in rural areas were
more likely to be breastfed for longer than six months compared with those in
urban areas.12,18 One small study in Melbourne found that, although 98 per cent
of Indigenous mothers initiated breastfeeding, only 50 per cent and 32 per cent
were still breastfeeding at three and six months respectively.19
The nutritional and immunological effects of prolonged breastfeeding are
particularly important in communities with a high prevalence of infectious
diseases. However, introduction of appropriate solids at around six months is
essential to ensure appropriate growth and development.1
Vitamin and mineral status has been measured infrequently in Indigenous
populations, but there have been some studies in a variety of groups and
environments.1 Samples have generally been small and have often been selected
from vulnerable groups in the community—infants and pregnant and
breastfeeding women. Quantitative comparison of the prevalence of vitamin
deficiencies may be misleading since varying methods and ‘normal’ ranges have
been used in these studies. Multiple deficiencies have frequently been described
in the same subject, suggesting the generally poor nutritional status of such
individuals, rather than a specific micro-nutrient problem. In particular, vitamin
status (in relation to ascorbic acid, folate and beta-carotene) consistent with the
very low contemporary dietary intakes of fruit and vegetables have often been
described.20
SOCIAL
DETERMINANTS OF
INDIGENOUS AUSTRALIANS’
H E A LT H
A range of social determinants underpin the poor nutritional health status of
Indigenous Australians. Among them are poverty; disrupted family and
community cohesion; social marginalisation; stress; lower levels of education;
unemployment; lack of control over circumstances; inadequate and overcrowded
housing; inadequate sanitation, water supplies and hygiene; limited access to
transport; and discrimination.2,21–26 The broader social environment affecting
Indigenous Australians and their health status is well documented in the draft of
the National Aboriginal and Torres Strait Islander Health Strategy.21
Cultural factors can have both positive and negative influences on health and
nutritional status. The relationship between social environment and poor health
operates in both directions: poor health can increase the risks of deprivation
through stigma and reduced earning capacity.27
258
Dietary Guidelines for Children and Adolescents in Australia
C. T HE
NUTRITION OF
A BORIGINAL
AND
T ORRES S TRAIT I SLANDER P EOPLES
Indigenous Australians now make up 2.1 per cent of Australia’s population.2
Compared with the Australian population as a whole, Indigenous Australians are
younger (a median age of 20.1 years compared with 34.0 years), live mainly in
south-eastern Australia, are less likely to have post-school education (11 per cent
compared with 31 per cent), have higher unemployment rates (23 per cent
compared with 9 per cent), have a lower financial income (for men, an average
weekly income of $189 compared with $415; for women, $190 compared with
$224), and are less likely to own homes (31 per cent compared with 71 per
cent).2,28 In addition, Aboriginal and Torres Strait Islander Australians are more
likely to live outside metropolitan areas than other Australians: 32 per cent of
Indigenous Australians live in rural areas containing less than 1000 people,
whereas only 15 per cent of non-Indigenous Australians do.29 All Australians
living in non-metropolitan areas experience higher mortality rates than those in
metropolitan areas—15 per cent higher for men and 9 per cent higher for women
in 1996.30 The higher morbidity and mortality rates observed for rural areas are
probably related more to limited occupational and educational opportunities, and
the effect of this on income, than any special attributes of the physical
environment. Poor access to medical services and limited lifestyle options are
additional factors.22
Many other social, economic, geographical, environmental and infrastructural
issues and factors influence food choices and nutrition in Indigenous groups;
these are discussed in detail in Nutrition in Aboriginal and Torres Strait Islander
Peoples1 (pp. 51–66). Examples are inadequate housing and food storage and
preparation facilities.
In particular, people in rural and remote areas pay up to 50 per cent more for
basic healthy foods than people living in urban and metropolitan areas.31–35 A
recent Queensland study has assessed this disparity in terms of remoteness and
accessibility, as measured by the Accessibility/Remoteness Index of Australia.36
In contrast to expectations, the price of fruit and vegetables was less affected by
remoteness/accessibility than other food groups; the prices of meat and meat
alternatives and dairy foods were the most affected.37 The cost of tobacco and
takeaway food items was less affected by remoteness/accessibility than other
items. Basic food items were less available in the more remote stores, as were
fresh vegetables and fruits and better nutritional choices.37
Among the factors contributing to the higher costs of foods in rural and remote
areas are increased transport costs, high store overheads (including capital costs
of building and maintaining long-term storage facilities and high accountancy
costs) and greater wastage of stock.38 Commitment and partnership across a
range of sectors are necessary if the factors contributing to the high costs and
limited supply of nutritious foods in rural and remote regions are to be
tackled.1,37
Dietary Guidelines for Children and Adolescents in Australia
259
C. T HE
NUTRITION OF
H E A LT H
A BORIGINAL
AND
T ORRES S TRAIT I SLANDER P EOPLES
ASPECTS OF TRADITIONAL DIETS AND LIFESTYLES
All the available evidence suggests that, traditionally, Indigenous Australian were
fit and healthy.20,35,39–42
Traditional dietary intakes and associated lifestyles have been reviewed in detail
recently and are summarised in the following paragraphs. Additional information
about food collection, preparation, storage and distribution is also available in
Nutrition in Aboriginal and Torres Strait Islander Peoples.1
The available information suggests that the traditional diet was generally low in
energy density but high in nutrient density—high in protein, low in sugars, high
in complex carbohydrate of low glycaemic index, and high in micro-nutrients.
Even though the traditional Aboriginal diet contained a high proportion of animal
foods, it would have been low in total fat, extremely low in saturated fat, and
relatively high in polyunsaturated fatty acids (including the long-chain highly
polyunsaturated fatty acids of the omega-3 and omega-6 families) and hence
protective against cardiovascular disease and related conditions.
The composition of most traditional vegetable foods is typical of that of
uncultivated plants worldwide—high in fibre and relatively high in protein, with
a generally low energy density.43 The carbohydrate in most traditional plant
foods is of low glycaemic index, producing lower glucose and insulin levels than
similar western foods, and may be protective against diabetes.44
Although some animal foods—such as witchetty grubs (Cossidae spp.) and green
ants (Oecophylla smaragdina)—have a relatively high fat content, most native
land animals are very lean.43 Traditional meat foods have a much lower carcass
fat content and intramuscular lipid content than meat from domesticated animals
such as cattle and sheep.40 Most carcass fat is stored in discrete ‘depots’ within
the abdomen; these fat depots tend to be small and were traditionally shared by
many people. However, marine animals such as turtle and dugong tend to be
high in fat.43,45 Chewing the bones of land and marine animals1 would have
provided calcium.
Energy expenditure was high. Several accounts highlight the labour-intensive
nature of collecting and preparing traditional foods.46–48 Food procurement and
preparation by Aboriginal hunter–gatherers were energy-intensive processes that
could involve sustained physical activity for many hours—for example, walking
long distances; digging for tubers, reptiles, eggs, honey ants and witchetty grubs;
chopping with a stone axe; winnowing and grinding seeds; digging pits for
cooking large animals; and gathering wood for fires.20,41
260
Dietary Guidelines for Children and Adolescents in Australia
C. T HE
NUTRITION OF
A BORIGINAL
AND
T ORRES S TRAIT I SLANDER P EOPLES
Children were traditionally breastfed until they were about 3 years old, the age
of weaning depending on the arrival of another sibling. Solids were not
introduced until teeth erupted.11,49 Responsibility for feeding tended to rest with
the child, who was expected to express a desire for food and was fed on
demand; older children had priority over the feeding of infants.11
Traditional Aboriginal diet and food preferences
Until European occupation, Aboriginal people successfully pursued a hunter–
gatherer lifestyle across widely different geographical and climatic conditions.
Survival depended on an intimate knowledge of the land, sources of water, and
the seasonal cycle’s effects on plant foods and game.1
The traditional diet was characterised by diversity, and most early observers
describe a varied and ample range of both animal and plant foods, even in dry
regions. On a day-to-day basis, both the quantity and the quality of the food
intake varied greatly; the usual pattern of subsistence was supplemented by
‘feasts’ when large game animals had been successfully hunted.
The most prized components of the Aboriginal hunter–gatherer diet were the
relatively few energy-dense foods, such as depot fat and organ meats. Among
other favoured foods were those with a high fat content—for example, witchetty
grubs and marine mammals. Traditional diets were generally low in sugars,
although sweetness was highly valued and provided by honey ants (Melophorus
inflatus), the honey of the native bee, blossoms (for example, Grevillea spp.),
lerp (a secretion from the insect Psylla, which lives on the leaves of eucalypts)
and gums.20,41,50
Traditional Torres Strait Islander diet and food preferences
Torres Strait Islanders were marine hunters, but they cultivated garden foods and
gathered wild foods to varying degrees, depending on the local habitat.51 Some
garden foods were stored and preserved. Turtle and dugong occupied a
particular place in Torres Strait Islanders’ cultural life; the fat content of these
animals was considered a principal indicator of meat quality, and the fat itself
was particularly prized.52
C O N T E M P O R A RY
DIET
The process of acculturation from a traditional to a contemporary diet and
lifestyle—including the effects of social, political and environmental factors—has
been described in detail.1,20 With the transition from a traditional hunter–gather
lifestyle to a settled westernised existence, Aboriginal and Torres Strait Islander
people’s diet has generally changed from a varied, nutrient-dense diet to an
energy-dense diet that is high in fat and refined sugars (see Table C.1).
Dietary Guidelines for Children and Adolescents in Australia
261
C. T HE
NUTRITION OF
A BORIGINAL
AND
T ORRES S TRAIT I SLANDER P EOPLES
The limited data available support the notion that contemporary Indigenous diets
tend to reflect the dietary intake of wider Australia, both during the depression
years of the 1930s53 and during colonial times54 , when food supply, transport,
storage and costs were matters of general concern. The available dietary studies
were recently reviewed in Chapter 3 of Nutrition in Aboriginal and Torres Strait
Islander Peoples.1
Table C.1
Characteristics of hunter–gatherer and western lifestyles20,41
Criterion
Hunter–gatherer lifestyle
Western lifestyle
Physical activity level
High
Low
Principle characteristics of diet
Energy density
Low
High
Energy intake
Usually adequate
Excessive
Nutrient density
High
Low
High
Low–moderate
Nutrient composition of diet
Protein
Animal
High
Moderate
Vegetable
Low–moderate
Low
Carbohydrate
Moderate (slowly digested)
High (rapidly digested)
Complex carbohydrate
Moderate
Moderate
Simple carbohydrate
Usually low (honey)
High (sucrose)
Dietary fibre
High
Low
Fat
Low
High
Alcohol
Not available
Available
Sodium:potassium ratio
Low
High
Urban Aboriginal communities
Only limited quantitative dietary data are available pertaining to Aboriginal
Australians’ diet in the urban setting.55 Because of methodological difficulties,
individual dietary studies have tended to focus on qualitative and semiquantitative assessment of the diet and to reflect dietary patterns and
preferences, rather than actual, habitual intake.56 A comparison of the food
habits of Aboriginal and non-Indigenous Australians in a city and a country town
showed that in both localities Aboriginal groups consumed takeaway meals and
added salt more often than their non-Indigenous counterparts.56 Twenty-fourhour dietary recall data from a small number of individuals suggested little
difference between the dietary intakes of Aboriginal and non-Indigenous
Australians in a country town, but the data have not been validated57 and
highlight some methodological shortcomings.58
262
Dietary Guidelines for Children and Adolescents in Australia
C. T HE
NUTRITION OF
A BORIGINAL
AND
T ORRES S TRAIT I SLANDER P EOPLES
Remote Aboriginal communities
A study using the ‘store-turnover’ method in remote Aboriginal communities in
the Northern Territory showed that sugar, flour, bread and meat provided more
than half the apparent total energy intake. Fatty meats contributed nearly 40 per
cent of the total fat intake in northern coastal communities and over 60 per cent
in central desert communities. In both regions, white sugar per se contributed
approximately 60 per cent of all sugars consumed.59 Compared with national
data on apparent consumption in Australia, intakes of sugar, white flour and
sweetened carbonated beverages were much higher in Aboriginal communities in
the Northern Territory and intakes of wholemeal bread, fruit and vegetables were
much lower (see Table C.2).59
Table C.2
Apparent mean consumption of selected foods in Aboriginal
communities compared with national data59,60
(kg per person per year)
Aboriginal communities
Food
Central desert
(n = 3)
Northern coastal
(n = 3)
Flour (white)
37.6
44.4
n.a.
Bread (all)
34.1
30.5
45.5
Beef and veal
51.6
25.8
41.4
Poultry
22.3
19.7
23.0
Lamb
22.8
3.3
16.8
Fish
Fruits
Australian data
–
4.8
4.0
33.2
17.6
106.9
136.2
Vegetables
24.3
19.6
Sugar
54.1
50.3
8.2
Carbonated beverages
67.9
224
673
Fruit juice
48.3
12.8
n.a.
9.4
10.1
n.a.
Pie/pasty
9.6
15.1
n.a.
Snack foods
(e.g. potato crisps)
1.8
2.7
n.a.
Tinned meat
– Zero.
n.a. Not available.
Note: ‘Bread’ includes flour used in bread-making.
Nutritional analysis revealed the average diet of Aboriginal Australians in remote
areas was high in energy and sugar (more than three times the Australian
recommended dietary intake), moderately high in fat (particularly saturated fat),
and relatively low in complex carbohydrate, dietary fibre and nutrient density;
these results support qualitative and semi-quantitative dietary assessment.61–63
Dietary Guidelines for Children and Adolescents in Australia
263
C. T HE
NUTRITION OF
A BORIGINAL
AND
T ORRES S TRAIT I SLANDER P EOPLES
Intakes of calcium and zinc and of some vitamins (vitamin B2, vitamin E, betacarotene and folic acid) appear low64 ; these results have been confirmed by
subsequent studies in different communities.65–67
In contrast, very low energy intakes were described in one anthropological study
in remote Aboriginal outstation communities in north-east Arnhem Land.68 The
energy intake of all subjects was approximately 50 per cent of the Australian
recommended dietary intake, and the vitamin C, magnesium and calcium intakes
were low, as was retinol activity. Where traditional bushfoods (predominantly of
animal origin) were consumed, zinc and iron intakes were higher and iron intake
was equal to or above the recommended intake. Low intakes of fruit and
vegetables were also described in this study.68
Dietary intake has been shown to vary in close association with the income cycle
in remote Aboriginal communities.62 Meat and vegetables (mainly as stew) and
fruits were included in the diet after pay day but were usually absent for at least
several days before the next pay day. A staple diet of bread or damper has often
been described.62,69
Even in remote traditionally oriented outstations, foods bought at the store
accounted for most of the energy intake, while traditional bush foods provided
the greatest proportion of protein intake.48,70 ,71 All the available studies show that
flour, sugar, sweets and fats provided much of the energy intake from storebought foods. Animal foods—particularly those high in fat, such as lizard—
provided most of the energy from the bush. In general, dietary patterns in these
small outstation communities are meat-oriented.
Torres Strait communities
In Torres Strait communities—and also in a few other island communities, such
as the Tiwi community—marine foods continue to make substantial contributions
to the diet. Men, women and children are involved in different aspects of
gleaning, fishing and hunting. Torres Strait Islanders living on three outer islands
were estimated to consume between 191 and 450 grams per person per day of
seafood (including turtle and dugong), which is considerably more than the
Japanese seafood intake (102 grams per person per day).45 Concerns have,
however, been raised about the heavy metal content in the organ meat of
dugong, and particularly turtle, and the potentially negative effects of this on
health.72 Production of traditional garden staples continues to be important for
some ceremonial purposes.31
A study using the store-turnover method59 was undertaken in a small island
community in Torres Strait. More than half the energy in the diet was found to
come from white flour, white rice, tinned meat and vegetable oil. The amount of
fruit and vegetables available through the store was low: the fruit available per
person was about one-sixth of the recommended amount and vegetables about
one-third. People who depended on store foods would thus not be able to meet
their needs for vitamins A, C and E and folic acid.31
264
Dietary Guidelines for Children and Adolescents in Australia
C. T HE
C O N T E M P O R A RY
NUTRITION OF
A BORIGINAL
AND
T ORRES S TRAIT I SLANDER P EOPLES
USE OF TRADITIONAL FOODS
It had been suggested that in the short term, after establishment of ‘new’
settlements or outstations, there may be an increase in yields of traditional foods
due to high initial availability and the use of western technology.62,71,73 In some
areas introduced feral animals such as rabbits and buffalo have also been
popular.71,74 But the longer term effect appears to be a reduction in the
availability of traditional foods for several reasons, among them the following:
•
environmental degradation caused by stock and feral animals
•
introduction of exotic plant species
•
the increasing incidence of hot, destructive bush fires as result of poor
land-management practices
•
restricted access to some areas of land
•
depletion of resources and population pressure around permanent
settlements
•
high costs associated with the acquisition and maintenance of equipment,
firearms, vehicles and fuel
•
changing demographic patterns
•
cultural loss from generation to generation.75 ,76
Contrary to some expectations, except for during some seasons in very remote
areas48,68,70,71 the actual dietary intake of traditional foods has been found to be
relatively low where it has been measured on mainland Australia.69,77 Bush foods
contribute only a small proportion of nutrients in many areas.64 A study of a
northern coastal Aboriginal community found that an average of less than 15 per
cent of the population sought traditional foods on at least three days a fortnight
throughout the year. It was estimated that the proportion of total energy intake
derived from bush foods averaged over the population would be less than 8 per
cent during the dry season and less than half this during the peak of the wet
season.77
In the 1994 National Aboriginal and Torres Strait Islander Survey 10 per cent of
respondents aged over 14 years reported spending more than one hour a week
hunting or foraging for traditional foods and, of these, more than half reported
spending more than five hours a week doing so.18 The rate of return for this
effort is, however, unknown. Even though the actual intake of traditional foods is
low, traditional foods are still popular and culturally important for Aboriginal and
Torres Strait Islander peoples.31,78
T H E N AT I O N A L A B O R I G I N A L A N D T O R R E S S T R A I T I S L A N D E R
N U T R I T I O N S T R AT E G Y A N D A C T I O N P L A N
The National Aboriginal and Torres Strait Islander Nutrition Strategy and Action
Plan, NATSINSAP, provides a framework for national action to bring about an
improvement in the nutritional status of Aboriginal and Torres Strait Islander
Dietary Guidelines for Children and Adolescents in Australia
265
C. T HE
NUTRITION OF
A BORIGINAL
AND
T ORRES S TRAIT I SLANDER P EOPLES
peoples.12 It was developed following wide-ranging consultations by a working
group (with broad Indigenous representation) as a key component of Eat Well
Australia.79 The seven primary action areas in the plan are:
•
food supply in remote and rural communities
•
food security and socio-economic status
•
family-focused nutrition promotion, involving resourcing programs,
communicating and disseminating ‘good practice’
•
nutrition in urban areas
•
the environment and household infrastructure
•
the Aboriginal and Torres Strait Islander nutrition workforce
•
national food and nutrition information systems.12
D I E TA RY
GUIDELINES FOR
AUSTRALIA’S INDIGENOUS
PEOPLES
The Dietary Guidelines for Australian Adults; the Dietary Guidelines for Children
and Adolescents in Australia, incorporating the Infant Feeding Guidelines for
Health Workers; and the Dietary Guidelines for Older Australians are pertinent to
Indigenous Australians. Two other recommendations are, however, also
important:
•
Choose store foods that are most like traditional bush foods.
•
Enjoy traditional bush foods whenever possible.
Rationale
Indigenous people can select nutritious food by choosing those store foods that
are most like traditional bush foods—for example, fresh plant foods, wholegrain
cereal foods, seafoods, and lean meat and poultry. With the exception of the
dairy food group, this approach is consistent with the general Australian dietary
guidelines
All the available evidence suggests that, in terms of health and wellbeing,
Indigenous Australians would benefit from closer adherence to the general
Australian dietary guidelines.12,64,66,80–84 In particular, increased consumption of
vegetables and fruits could be expected to improve the health and nutritional
status of this population group. Lactose intolerance after the age of 3 to 5 years
may, however, be problematic in some areas or individuals85 ,86 and may affect
consumption of lactose-containing dairy foods. Alternative calcium sources such
as low-lactose dairy foods (matured cheese, yoghurt), chewing meat and fish
bones, and consumption of small, soft fish bones (for example, in tinned salmon)
are recommended in these cases.
Consumption of traditional bush foods should also be supported wherever
possible, although this may be a nutritional issue where high-fat marine animal
foods are hunted in large numbers using modern procurement and distribution
methods.45 In addition, there may be a problem with high levels of heavy metals
266
Dietary Guidelines for Children and Adolescents in Australia
C. T HE
NUTRITION OF
A BORIGINAL
AND
T ORRES S TRAIT I SLANDER P EOPLES
in the organ meat of turtle and dugong.72 Several other environmental factors
might also need to be considered within the framework of sustainability.
It is particularly important to encourage and support breastfeeding, to ensure
that children and adolescents receive sufficient nutritious food to grow and
develop normally, and to ensure that the growth of young children is checked
regularly.
Where non-Indigenous Australians have sufficient understanding of the
traditional Indigenous food supply, the additional Indigenous guidelines may
also be useful in a wider context.
REFERENCES
1.
National Health and Medical Research Council. Nutrition in Aboriginal and
Torres Strait Islander peoples: an information paper. Canberra: NHMRC,
2000.
2.
Australian Bureau of Statistics & Australian Institute of Health and Welfare.
The health and welfare of Australia’s Aboriginal and Torres Strait Islander
peoples. ABS cat. no. 4704.0. Canberra: ABS, 1999.
3.
McClelland A, Pirkis J, Willcox S. Enough to make you sick: how income and
environment affect health. Melbourne: National Health Strategy Unit, 1992.
4.
Jung RT. Obesity as a disease. Br Med Bull 1997;53:307–21.
5.
O’Dea K. Body fat distribution and health outcome in Australian
Aborigines. Proc Nut Soc Aust 1987;12:56–65.
6.
Barker DJ. Fetal origins of cardiovascular disease. Ann Med
1999;31(suppl. 1):3–6.
7.
Barker D. The fetal origins of type 2 diabetes mellitus. Ann Int Med
1999;130:322–3.
8.
Barker D. Mothers and babies and health in later life. 2nd edn. Edinburgh:
Churchill Livingstone, 1998.
9.
Wadsworth M. Early life. In: Marmot M, Wilkinson R, eds. Social
determinants of health. New York: Oxford University Press, 1999.
10.
Ruben AR, Walker AC. Malnutrition among rural Aboriginal children in the
Top End of the Northern Territory. Med J Aust 1995;162:400–3.
11.
Hamilton A. Nature and nurture. Canberra: Australian Institute of
Aboriginal Studies, 1981.
12.
Strategic Inter-Governmental Nutrition Alliance. National Aboriginal and
Torres Strait Islander Nutrition Strategy and Action Plan 2000–2010.
Canberra: National Public Health Partnership, 2001.
Dietary Guidelines for Children and Adolescents in Australia
267
C. T HE
NUTRITION OF
A BORIGINAL
AND
T ORRES S TRAIT I SLANDER P EOPLES
13.
Pettitt DJ, Aleck KA, Baird HR, Carraher MJ, Bennett PH, Knowler WC.
Congenital susceptibility to NIDDM: role of the intrauterine environment.
Diabetes 1988;37(5):622–8.
14.
Silverman BL, Metzger BE, Cho NH, Loeb CA. Impaired glucose tolerance
in adolescent offspring of diabetic mothers: relationship to fetal
hyperinsulinism. Diab Care 1995;18(5):611–17.
15.
Sayers S, Powers J. Risk factors for Aboriginal low birthweight, intrauterine
growth retardation and preterm birth in the Darwin Health Region. Aust NZ
J Publ Hlth 1997;21:524–30.
16.
Coory M. Is birthweight an appropriate outcome measure for Torres Strait
Islander babies? Aust NZ J Publ Hlth 2000;24:60–3.
17.
Engeler T, McDonald M, Miller M, Groos A, Black M, Leonard D. Review of
current interventions and identification of best practice currently used by
community based Aboriginal and Torres Strait Islander health service
providers in promoting and supporting breast feeding and appropriate
infant nutrition, Canberra: Office for Aboriginal and Torres Strait Islander
Health Services, 1998.
18.
Australian Bureau of Statistics. National Aboriginal and Torres Strait
Islander Survey, 1994: health of Indigenous Australians. Cat. no. 4395.0.
Canberra: ABS, 1996.
19.
Holmes W, Thorpe L, Phillips J. Influences on infant-feeding beliefs and
practices in an urban Aboriginal community. Aust NZ J Publ Hlth
1990;21:504–10.
20.
Lee A. Transition of Australian Aboriginal diet and nutritional health. Wld
Rev Nutr Diet 1996;79:1–52.
21.
National Aboriginal and Torres Strait Islander Health Council. The National
Aboriginal and Torres Strait Islander Health Strategy, Draft for discussion.
Canberra: NATSIHC, 2001.
22.
Queensland Health. Social determinants of health: the role of public health
services. Brisbane: Queensland Health, 2001.
23.
McClelland A, Scotton R. Poverty and health. In: Fincher R,
Niewwenhuysen J, eds. Australian poverty—then and now. Melbourne:
Melbourne University Press, 1998.
24.
National Health and Medical Research Council. Promoting the health of
Indigenous Australians: a review of infrastructure support for Aboriginal
and Torres Strait Islander health advancement. Canberra: NHMRC, 1997.
25.
Altman J, Hunter B. Indigenous poverty. In: Fincher R, Nieuwenhuysen J,
eds. Australian poverty—then and now. Melbourne: Melbourne University
Press, 1998.
26.
Glover J, Woollacott T. A social health atlas of Australia. Vol. 1. South
Australia. 2nd edn. Adelaide: Public Health Information Development
Unit, University of Adelaide, 1999.
268
Dietary Guidelines for Children and Adolescents in Australia
C. T HE
NUTRITION OF
A BORIGINAL
AND
T ORRES S TRAIT I SLANDER P EOPLES
27.
Marmot M. Introduction. In: Marmot M, Wilkinson R, eds. Social
determinants of health. New York: Oxford University Press, 1999.
28.
Australian Bureau of Statistics. Australia now. Aboriginal and Torres Strait
Islander Australians: a statistical profile from the 1996 Census. Cat. no.
1301.0. Canberra: ABS, 2000.
29.
Humphreys J, Mathews-Cowey S, Rolley, F. Health service frameworks for
small rural and remote communities: issues and options. Armidale, NSW:
Department of Geography and Planning, University of New England, 1996.
30.
Australian Institute of Health and Welfare. Australia’s health. Canberra:
AIHW, 1996.
31.
Leonard D, Beilin R, Moran M. Which way kaikai blo umi? Food and
nutrition in the Torres Strait. Aust J Publ Hlth 1995;19:589–95.
32.
Beaumont S. Tasmanian Food Price, Availability and Quality Survey.
Hobart: Community Nutrition Unit, Tasmanian Department of Community
and Health Services, 1998.
33.
Bowcock R. 1998 Kimberley Market Basket Survey. Derby: Kimberley
Public Health, 1999.
34.
Price R, McComb J, Grieve H, Graham E. Surveys of food availability,
quality and price in rural and remote communities of the Alice Springs and
Barkly district: April and May 1998. Darwin: Northern Territory Health
Services, 1998.
35.
Sullivan H, Gracey M, Hevron V. Food costs and nutrition of Aborigines in
remote areas of northern Australia. Med J Aust 1987;147:334–7.
36.
Department of Health and Aged Care & University of Adelaide. Measuring
remoteness: Accessibility/Remoteness Index of Australia. Adelaide:
University of Adelaide, 1999.
37.
Queensland Health. The Healthy Food Access Basket Survey 2000. Brisbane:
Public Health Services, Queensland Health, 2001.
38.
McMillan S. Food and nutrition policy issues in remote Aboriginal
communities: lessons from Arnhem Land. Aust J Publ Hlth 1991;15:281–5.
39.
Coyne T, Darnton-Hill I. Australian Aborigines’ nutrition and changing
disease patterns. New Doctor 1979;12:32–7.
40.
Naughton J, O’Dea K, Sinclair A. Animal foods in traditional Aboriginal
diets: polyunsaturated and low in fat. Lipids 1986;21:684–90.
41.
O’Dea K. Traditional diet and food preferences of Australian Aboriginal
hunter–gatherers. Phil Trans Roy Soc Lond. Series B. Biol Sci 1991;334:233–41.
42.
Needeniya J, Smith A, Carter P. Food supply in rural South Australia: a
survey on food cost, quality and variety. Adelaide: Department of Human
Services, 2000.
Dietary Guidelines for Children and Adolescents in Australia
269
C. T HE
NUTRITION OF
A BORIGINAL
AND
T ORRES S TRAIT I SLANDER P EOPLES
43.
Brand Miller JC, James KW, Maggiore PMA. Tables of composition of
Australian Aboriginal foods. Canberra: Aboriginal Studies Press, 1993.
44.
Brand Miller JC, Holt SHA. Australian Aboriginal plant foods: a
consideration of their nutritional composition and health implications. Nut
Res Rev 1998;11:5–23.
45.
Johannes R, Macfarlane J. Traditional fishing in the Torres Strait Islands.
Hobart: CSIRO Division of Fisheries, 1991.
46.
Spencer B, Gillen F. The native tribes of central Australia. London:
Macmillan, 1899.
47.
Tindale NB. Aboriginal tribes of Australia. Canberra: Australian National
University Press, 1974.
48.
Devitt J. Contemporary Aboriginal women and subsistence in remote, arid
Australia. PhD thesis. Brisbane: Department of Anthropology and
Sociology, University of Queensland, 1988.
49.
McArthur M. Food consumption and dietary levels of the Aborigines at the
settlements. In: Mountford C, ed. Records of the American–Australian
scientific expedition to Arnhem Land. Vol. 2. Anthropology and nutrition.
Melbourne: Melbourne University Press, 1960.
50.
Devitt J. Traditional Aboriginal preferences in a changed context. Central
Australian Rural Practitioners’ Association Newsletter 1991;14:38–41.
51.
Beckett, J. Torres Strait Islanders’ custom and colonialism, Cambridge, UK:
Cambridge University Press, 1987:26–9.
52.
Nietschmann B, Nietschmann J. Good dugong, bad dugong; bad turtle,
good turtle. Natural History 1981;90(5):54.
53.
Australian Bureau of Statistics. Apparent consumption of foodstuffs and
nutrients, Australia, 1998–99. Cat. no. 4306.0. Canberra: ABS, 2000.
54.
Walker RB, Roberts DCK. Colonial food habits. In: Truswell AS, Wahlqvist
ML, eds. Food habits in Australia. Proceedings of first Deakin/Sydney
Universities symposium on Australian nutrition, Melbourne: Deakin
University, 1988:40–59.
55.
Butlin A, Cashel K, Lee A, Taylor V. Food and nutrition programs for
Aboriginal and Torres Strait Islander peoples. Canberra: Office for
Aboriginal and Torres Strait Islander Health Services, 1997.
56.
Guest CS, O’Dea K. Diabetes in Aborigines and other Australian
populations. Aust J Publ Hlth 1992;16:340–9.
57.
Sibthorpe B. All our people are dying: diet and stress in an urban
Aboriginal Community. PhD thesis. Canberra: Australian National
University, 1988.
58.
Lee A, Smith A, Bryce S. Measuring dietary intake in remote Australian
Aboriginal communities. Ecol Food Nutr 1995;34:19–31.
270
Dietary Guidelines for Children and Adolescents in Australia
C. T HE
NUTRITION OF
A BORIGINAL
AND
T ORRES S TRAIT I SLANDER P EOPLES
59.
Lee A, O’Dea K, Mathews J. Apparent dietary intake in remote Aboriginal
communities. Aust J Publ Hlth 1994;18:190–7.
60.
Australian Bureau of Statistics. Apparent consumption of foodstuffs and
nutrients, Australia, 1985–86. Canberra: ABS, 1987.
61.
Hitchcock NE, Gracey M. Dietary patterns in a rural Aboriginal community
in south-west Australia. Med J Aust 1975;2(suppl.):12–16.
62.
Cutter T. Nutrition and food habits of the central Australian Aboriginal. In:
Hetzel BS, Frith HJ, eds. The nutrition of Aborigines in relation to the
ecosystem of central Australia. Melbourne: CSIRO, 1978:63–72.
63.
Coles-Rutishauser IHE. Growing up in Western Australia: if you are
Aboriginal. Proc Nut Soc Aust 1979;4:27–32.
64.
Lee A, Bailey A, Yarmirr D, O’Dea K, Mathews JD. Survival tucker:
improved diet and health indicators in an Aboriginal community. Aust J
Publ Hlth 1994;18(3):277–85.
65.
McDermott R, Rowley K, Lee A, Knight S, O’Dea K. Increase in prevalence
of obesity and diabetes and decrease in plasma cholesterol in a central
Australian Aboriginal community. Med J Aust 2000;175:480–4.
66.
Zakrevsky E, Binns C, Gracey M. Aboriginal Community Foodstores
Project: assessment of nutritional status. Perth: Health Department of
Western Australia, 1996.
67.
Gault A. Health survey, Urapuntja Health Service. Alice Springs: Institute of
Aboriginal Development, 1986.
68.
Maggiore PM. Analysis and interpretation of food record data from remote
Aboriginal communities. Proc Nut Soc Aust 1990;15:220–3.
69.
King R, Smith R, Spargo R. Dietary patterns of Aboriginal children in the
Kimberley. Proc Nut Soc Aust 1985;10:173.
70.
Meehan B. Shell bed to shell midden. Canberra: Australian Institute of
Aboriginal Studies, 1982.
71.
Altman J. Hunter–gatherers today: an Aboriginal economy in north
Australia. Canberra: Australian Institute of Aboriginal Studies, 1987.
72.
Haynes D, Michalek-Wagner K, Kwan D. Trace metal concentrations in
Torres Strait green turtle (Chelonia mydas) tissues, 1997–1998. Report
prepared for the Torres Strait Regional Authority, 2001.
73.
Sinclair AJ, Mann NJ, Kelly J. Kangaroo meat for human consumption. Proc
Nut Soc Aust 1997;21:52–7.
74.
Calaby J. Man, fauna and climate in Aboriginal Australia. In: Mulvaney DJ,
Golson J, eds. Aboriginal man and environment. Canberra: Australian
National University Press, 1971:80–93.
Dietary Guidelines for Children and Adolescents in Australia
271
C. T HE
NUTRITION OF
A BORIGINAL
AND
T ORRES S TRAIT I SLANDER P EOPLES
75.
Peterson N. The traditional pattern of subsistence to 1975. In: Hetzel BS,
Frith HJ, eds. The nutrition of Aborigines in relation to the ecosystem of
central Australia. Melbourne: CSIRO, 1978:25–35.
76.
Cane S, Stanley O. Land use and resources in desert homelands. Canberra:
Northern Australia Research Unit, Australian National University, 1985.
77.
Lee A. Survival tucker: Aboriginal dietary intake and a successful
community-based nutrition intervention project. PhD Thesis, Sydney:
University of Sydney, 1992.
78.
Rae C, Lamprell V, Lion R, Rae AM. The role of bushfoods in contemporary
Aboriginal diets. Proc Nut Soc Aust 1982;7:45–9.
79.
Strategic Inter-Governmental Nutrition Alliance. Eat Well Australia: an
agenda for action for public health nutrition, 2000–2010, Canberra:
National Public Health Partnership, 2001.
80.
Queensland Health. Queensland Aboriginal and Torres Strait Islander Food
and Nutrition Strategy: Indigenous Health Program and Nutrition
Program. Brisbane: Australian Centre for International and Tropical Health
and Nutrition, University of Queensland, 1995.
81.
O’Dea K. Marked improvement in carbohydrate and lipid metabolism in
diabetic Australian Aborigines after temporary reversion to traditional
lifestyle. Diabetes 1984;33:596–603.
82.
Weeramanthri T, Edmond K. Northern Territory Preventable Chronic
Disease Strategy—the evidence base. Darwin: Northern Territory Health
Services, 1999.
83.
White GA, Rowley KG, Daniel M, Skinner K, O’Dea K. Effectiveness of a
community directed healthy lifestyle program in a remote Australian
Aboriginal community. Aust NZ J Publ Hlth 2000;24:136–44.
84.
O’Dea K, White NG, Sinclair AJ. An investigation of nutrition-related risk
factors in an isolated Aboriginal community in northern Australia: advantages
of a traditionally-orientated lifestyle. Med J Aust 1988;148:177–80.
85.
Brand JC, Darnton-Hill I, Gracey MS, Spargo RM. Lactose malabsorption in
Australian Aboriginal children. Am J Clin Nutr 1985;41(3):620–2.
86.
Buttenshaw R, Sheridan J, Tye V, Miller O, Carseldine J. Battistuta D et al.
Lactose malabsorption and its temporal stability in Aboriginal children.
Proc Nut Soc Aust 1990;15:228.
272
Dietary Guidelines for Children and Adolescents in Australia
D. S OCIAL
D
STATUS , NUTRITION AND THE COST OF HEALTHY EATING
S O C I A L S TAT U S , N U T R I T I O N A N D
T H E C O S T O F H E A LT H Y E AT I N G
Katrine Baghurst
SOCIAL
S TAT U S A N D N U T R I T I O N
There is no doubt that a social gradient exists for many diet-related chronic
disease conditions in Australia, but—with the exception of extreme poverty
conditions—it is unclear to what extent dietary differences across social groups
affect chronic disease outcome or nutrition status.
The 1995 National Nutrition Survey1,2 showed few systematic differences in food
and nutrient intake across quintiles of social disadvantage, as defined by SEIFA
(socio-economic indexes for areas), based on the 1991 census. SEIFA assesses
the relative social disadvantage of respondents on the basis of their area of
residence; relative social disadvantage is determined by economic resources,
education and occupation patterns in that area. Table D.1 shows the intake of
various food groups across SEIFA quintiles.
Table D.1
Mean daily intakes from various food groups: people aged 19
years and over, by SEIFA quintile2
(grams per day)
Food group
First quintile
(most
disadvantaged)
Cereal & cereal products
196
Cereal-based products & dishes 113
Fruit products & dishes
126
Vegetable products & dishes
264
Legumes & pulses
9.8
Milk products & dishes
281
Meat, poultry, game
149
Fish & seafood
22
Egg products & dishes
16
Snack foods
3.2
Sugar products & dishes
20
Confectionery
7.8
Seeds & nuts
3.6
Fats & oils
12
Soup
53
Savoury sauces & condiments
30
Non-alcoholic beverages
2001
Alcoholic beverages
239
Second
quintile
222
115
147
258
7.9
284
163
24.5
15
3.0
21
9.2
4.1
13
62
30
2005
254
Third
quintile
203
130
141
260
10.8
285
164
26.3
16
4.2
20
8.3
5.2
13
55
28
1978
273
Fourth
quintile
217
135
143
262
9.5
292
155
25.8
13
3.3
18
9.3
4.0
12
48
30
2007
270
Fifth quintile
(least
disadvantaged)
232
136
156
251
10.7
301
158
28.8
19
3.9
17
9.1
4.8
11
57
29
1938
234
Note: SEIFA = socio-economic indexes for areas.
Dietary Guidelines for Children and Adolescents in Australia
273
D. S OCIAL
STATUS , NUTRITION AND THE COST OF HEALTHY EATING
The findings can be summarised thus for the major food groups:
•
Consumption of cereals and cereal-based foods (for example, rice, pasta
and breads) was somewhat lower in the most disadvantaged group and the
middle group compared with all other groups. Consumption of cerealbased products and dishes (for example, cakes and biscuits) was about
20 per cent lower in the two most disadvantaged groups compared with
the other three.
•
Consumption of fruit and fruit products was lower (10–20 per cent) in the
most disadvantaged group compared with the other four groups, but
vegetable and legume consumption showed no consistent trend across the
groups.
•
Consumption of milk and milk products increased slightly with social
advantage—about a 10 per cent increase across the groups.
•
Consumption of meat, poultry and game was slightly higher in the middle
quintiles; fish and seafood consumption gradually increased with social
advantage.
An assessment of energy and nutrient intakes across the SEIFA quintiles (see
Table D.2) showed that energy intake increased with social advantage, as did
intakes of most nutrients. However, when correcting for energy differences
across groups, few differences were apparent in dietary quality, defined as
nutrient intake per unit energy. It is unclear from the published data whether
other factors, such as the age profile, differed across the quintiles of
disadvantage and how much variation in factors such as age (which are known
to influence total food intake) might account for the differences that were
apparent (for example, in total energy intake). Physical activity may also vary
across quintiles.
274
Dietary Guidelines for Children and Adolescents in Australia
D. S OCIAL
Table D.2
STATUS , NUTRITION AND THE COST OF HEALTHY EATING
Mean daily intakes of energy and nutrient densities: people
aged 19 years and over, by SEIFA quintile1
Food group
First quintile
(most
disadvantaged)
Second
quintile
Third
quintile
Energy (MJ)
8.82
9.18
9.37
9.31
9.45
98.2
98.4
98.5
98.6
99.4
Fourth
quintile
Fifth quintile
(least
disadvantaged)
Nutrient density
(per 10MJ energy)
Protein (g)
Fat (g)
89.8
90.7
91.1
88.9
88.8
Saturated (g)
35.7
35.5
36.0
35.2
35.0
Mono-unsaturated (g)
32.5
32.8
33.4
32.4
32.3
Polyunsaturated (g)
13.5
13.5
13.9
13.4
13.4
332
331
332
319
305
Cholesterol (mg)
Total carbohydrate (g)
Sugars (g)
Starch (g)
276
277
272
276
277
128
125
123
124.
123
147
150
148
151
152
Fibre (g)
24.4
24.4
24.9
25.2
25.6
Alcohol (g)
13.4
13.3
14.3
14.6
13.8
Vitamin A (µg)
1280
1299
1236
1218
1329
Thiamin (mg)
1.81
1.74
1.81
1.83
1.80
Riboflavin (mg)
2.27
2.18
2.24
2.25
2.22
Niacin (mg)
45.8
45.9
45.6
45.5
45.9
Folate (µg)
289
286
299
272
292
Vitamin C (mg)
132
131
130
135
142
Calcium (mg)
907
888
900
926
945
Phosphorus (mg)
1626
1631
1630
1654
1673
Magnesium (mg)
353
356
354
361
366
Iron (mg)
15.1
15.0
15.3
15.4
15.6
Zinc (mg)
12.9
13.07
12.8
13.0
13.3
Potassium (mg)
3541
3495
3507
3528
3551
Neither is it clear whether these relatively small differences in nutrient profiles
could explain a significant proportion of the variation in the health profiles
across the groups. In interpreting the data set, however, it should be borne in
mind that a relatively crude, area-based measure of social disadvantage was
used; it is also possible that many of the most disadvantaged individuals in the
community did not take part in the survey.
Dietary Guidelines for Children and Adolescents in Australia
275
D. S OCIAL
THE
STATUS , NUTRITION AND THE COST OF HEALTHY EATING
C O S T O F H E A LT H Y E AT I N G
In recent years most countries in the western world have developed dietary
guidelines and recommendations similar to those outlined in this Australian
document. The aim is to improve health and nutritional status and help prevent
chronic diseases such as coronary heart disease, certain cancers, hypertension
and diabetes. If, however, the changes encouraged by these guidelines are
financially costly, there will be groups, including some low-income families, in
the community that are unable or unwilling to make these adjustments.
Although there is widespread speculation about the expense of healthy, or
‘healthful’, eating, few cost analyses of healthful diets have been reported. One
study, in the United Kingdom, compared the cost of one-day diets that did and
did not conform to the British dietary guidelines and found that following the
guidelines was in fact potentially more expensive.3 In Australia, Santich looked
at the eating patterns recommended in various federal government nutrition
education publications and concluded that the changes recommended may not
be financially realistic for low-income families.4 However, this conclusion was
based on an analysis of specific recipes given in the pamphlets and on the
substitution models for healthful eating used in the education materials—for
example, using lean minced beef instead of fattier versions and using wholegrain
breads instead of white bread. Using a qualitative sociological analysis, Crowley
has also suggested that the ‘cost’ of a diet that follows the dietary guidelines is
potentially higher compared with the cost of the average Australian diet.5 His
analysis included factors outside the direct financial cost of food as purchased,
such as access and transportation.
In the early 1990s McAllister et al.6 undertook an analysis, based on Australian
data, to determine whether it was necessarily more directly financially costly to
follow a healthful diet in Australia (see Table D.3). Three different approaches
were used: a substitution approach; a relative costing of individual diets that are
in line with the dietary guidelines; and an analysis of the cost of eating
according to a healthy eating plan, the 12345+ Nutrition Plan developed by the
CSIRO.7 This healthy eating plan was highly flexible; it was designed to produce
diets conforming to both the existing Australian dietary guidelines and the
recommended dietary intakes for people with varying energy needs and/or
special nutrient needs (for example, during pregnancy, lactation and
adolescence) and from a variety of cultural backgrounds.
The cost of 229 foods and drinks used in the analysis was determined by
assessing prices in four major supermarkets and other food outlets such as
takeaway stores when necessary. The food outlets used for pricing were located
in a suburban area of Adelaide where there is a large concentration of lowincome families.8 In each supermarket, for each food or drink the cheapest
branded item (that is, bearing the manufacturer’s brand name) was recorded,
together with the price of the equivalent generic item (that is, without the
manufacturer’s brand name but commonly associated with a particular retailer).
276
Dietary Guidelines for Children and Adolescents in Australia
D. S OCIAL
STATUS , NUTRITION AND THE COST OF HEALTHY EATING
An analysis of the potential cost of direct substitution of healthful food choices
for less healthful ones (for example, product-by-product substitution through the
use of fat, fibre or salt-modified alternatives) showed that this approach would
result in a more costly diet while providing limited nutritional improvement at
the population level. Pricing of self-selected diets of people who currently
comply with the dietary guidelines and targets for healthful eating showed that
these people are paying more per megajoule. In contrast, costing of diets that
conformed to a new healthful eating plan—designed to produce eating patterns
that meet both the dietary goals set for components of the food supply (such as
dietary fat, refined sugars and fibre) and the recommended daily intakes for
energy, protein, vitamins and minerals—showed that healthful eating need not
be more expensive and, indeed, for most people would bring cost savings.
In summary, this study showed that healthful eating is not necessarily more
expensive but that restructuring the diet, rather than using a direct-substitution
approach, is the more cost effective strategy. Education programs that stress this
restructuring approach and its cost advantages are therefore more likely to be
successful in promoting an affordable and effective healthful alternative for
people with limited financial means.
Unfortunately, it is generally easier for people to understand and adopt a
substitution approach rather than to basically restructure their diets. They also
receive encouragement to adopt the substitution approach—not only from food
manufacturers, who, understandably, wish to promote specific healthful
products, but also from much of the educational literature produced by health
professionals.
The study just described was designed to look only at the potential financial
costs of healthful eating. It showed that the theoretical cost savings associated
with healthier diets would be similar across all social groups in Australia. But
there are obviously other factors that could make a healthful diet more difficult
to achieve—such as the ready availability of healthful foods, skills, facilities,
time, taste factors and motivation. And these factors might vary across social,
educational and income groups. This has been discussed by Santich4 and
Crowley5, but the data available are limited and further investigation would be
valuable, especially with respect to low-income groups in the community. These
issues do, however, need to be dealt with in implementing the dietary guidelines
in socially disadvantaged groups and will be addressed in the implementation
plan for the dietary guidelines.
Table D.3 summarises the financial costs of healthy eating, as determined in the
1989 Australian Bureau of Statistics Household Expenditure Survey, the 1990
Victorian and South Australian surveys, and the CSIRO’s 12345+ Nutrition Plan.
Dietary Guidelines for Children and Adolescents in Australia
277
D. S OCIAL
STATUS , NUTRITION AND THE COST OF HEALTHY EATING
Table D.3
The financial costs of healthy eating6
Product type
1989 Household Expenditure Survey
Cost ($)
Branded
4.92
Generic
4.58
Branded
4.99
Generic
4.60
Branded
4.96
Generic
4.01
Branded
4.33
Substitution of health choices (adjusted for energy content) Generic
5.22
Branded
5.54
Generic
3.48
Branded
3.76
Generic
3.81
Branded
4.09
1990 Victorian and South Australian surveys
Current cost
Conformers to dietary guidelines
Non-conformers with equivalent energy intakes
Healthy eating plan (CSIRO 12345+ Nutrition Plan)
Average woman
Average man
REFERENCES
1.
Australian Bureau of Statistics & Department Health and Aged Care.
National Nutrition Survey: nutrient intakes and physical measurements,
Australia, 1995. Canberra: ABS, 1998.
2.
Australian Bureau of Statistics & Department Health and Aged Care.
National Nutrition Survey: foods eaten, Australia, 1995. Canberra: ABS,
1999.
3.
Cade J, Booth S. What can people eat to meet the dietary goals—and how
much does it cost? J Hum Nutr Diet 1990;3(1):99–207.
4.
Santich B. The compatibility of nutritional ideals with low incomes. Food
Aust 1992;44:230–4.
5.
Crowley S. Will the poor be able to afford a healthy diet? Nutridate
1992;3:5–7.
6.
McAllister M, Baghurst KI, Record SJ. Financial costs of healthy eating: a
comparison of three different approaches. J Nutr Ed 1994;26:131–9.
7.
Baghurst, KI, Hertzler, AA, Record, SJ, Spurr C. The development of a
simple dietary assessment and education tool for use by individuals and
health professionals. J Nutr Educ 1992;24:165–72.
278
Dietary Guidelines for Children and Adolescents in Australia
E. D IETARY
E
GUIDELINES AND THE SUSTAINABILITY OF FOOD SYSTEMS
D I E TA RY G U I D E L I N E S A N D T H E
S U S TA I N A B I L I T Y O F F O O D S Y S T E M S
Malcolm Riley
Sustainable development is relevant to dietary guidelines because the production
and consumption of food is a fundamental human activity guided by what we
choose to eat. Human activity has affected all the major planetary processes and
cycles, and the earth’s human population continues to grow, as does its appetite
for resources. The immediate problems facing the world concern not limits to
those resources but the increasing disturbances to global and natural systems.
Systemic changes have been recognised—climate change, ozone depletion,
biodiversity loss, freshwater depletion and degraded food-producing systems.1
All of these have important implications for activities such as food production.
Although sustainable development is a global concern, solutions also need to be
sought at national and local levels. If we are to deal comprehensively with the
problems that have been identified, we need integrated policies across many
sectors; these policies must be adequately resourced and have an effective
legislative and administrative base.2
The World Commission on Environment and Development defined sustainable
development as ‘the ability to meet the needs of the current generation without
compromising future generations’ ability to meet their economic needs’. Common
elements in more comprehensive definitions of sustainable agriculture and
animal production are resource efficiency, profitability, productivity,
environmental soundness, biodiversity, social viability, and other ethical
aspects.3 Important prerequisites for sustainable production are appropriate
governmental policies, awareness of our way of thinking, and a more communal
world view.
The consensus on human impact is that every major planetary process—whether
in the biosphere, the lithosphere, the hydrosphere or the atmosphere—is already
dominated by our activity.4 The dominant species on earth (domesticated
animals and plants) are heavily selected for specific traits, and this has reduced
genetic heterogeneity and adaptability. Maintaining the desirable traits in adverse
environments, and in the face of mounting disease and pathogen attacks
(predicted results of global climate change), requires ever-increasing energy
inputs and environmental modification.4
It can be argued that the limits of sustainability have already been reached in the
human population—with 6 billion humans alive today—since at least 20 per cent
of the population suffers from hunger, our natural resources are overexploited,
and biodiversity is threatened.5 Demographers now believe that the world
population will reach a peak of 8 to 10 billion during the 21st century, before
beginning to slowly decline as fertility rates drop below the level necessary for
replacement.6 Problems relating to sustainable development will then be focused
on managing for the peak world population, rather than for a continually rising
Dietary Guidelines for Children and Adolescents in Australia
279
E. D IETARY
GUIDELINES AND THE SUSTAINABILITY OF FOOD SYSTEMS
population. This task will be difficult enough in its own right, and ecological
sustainability will necessarily move from being a side issue to being a central
force in managing development, including the development of our food
production and consumption systems.
Humans are highly successful in an evolutionary sense, as demonstrated by
steady population increase, and this may be proof of our ability to modify
ecosystems to our advantage. It has been argued that humankind can take care
of environmental concerns when it can afford to and that environmental clean-up
follows wealth creation. But it is now clear that this might be misleading: for
example, the rate of increase in agricultural productivity is slowing and major
food-production systems such as fisheries are approaching maximum capacity; it
has been estimated that nearly half the world’s marine fish populations are fully
exploited and another 22 per cent are overexploited.
Agricultural sustainability can be enhanced by a switch from linear solutions to
circular approaches to food production—for example, closing water and nutrient
loops to reduce reliance on external inputs and reducing outputs of waste from
the system. These general strategies would help restore soil fertility and
ultimately improve food security.7
In Australia the most pressing environmental problems are loss of biodiversity,
land degradation, and disturbances to inland waterways.2 Effective solutions to
these problems will require halting large-scale land clearing, measures to deal
with dryland salinity, restoration of adequate environmental flows to our rivers,
and major land use changes, including the retirement of large areas of land from
grazing and similar uses.2
In the last 30 years there have been substantial changes to eating habits in
Australia, with the result that both apparent consumption and the level of waste
(packaging and food wastes) have increased. Between 1970 and 1990 annual
food consumption in Sydney increased from 0.52 tonnes per person to 1.00
tonnes per person—a 92 per cent increase. The increase in consumption is
attributable to changes in food processing, retailing and lifestyle, rather than an
increase in food intake by each individual.8
Australians are the highest per capita users of water in the world, using 2.3 times
the global average. Domestic water use accounts for only 12 per cent of this;
agricultural use accounts for 79 per cent and industrial use for 9 per cent.
Published guidelines to help people consume food in a manner more consistent
with sustainable development focus on matters such as avoiding
overconsumption, eating less processed food, and eating food produced locally
and in season.9 ,10 Suggestions for ways that dietitians can contribute to
protection of the environment have also been the subject of recent discussion.11
It is apparent that a move towards more sustainable food-production methods
will require policy development and change in many different sectors. If
successful, we can expect that this will result in substantial changes to the way
we eat. While these Dietary Guidelines for Children and Adolescents are
280
Dietary Guidelines for Children and Adolescents in Australia
E. D IETARY
GUIDELINES AND THE SUSTAINABILITY OF FOOD SYSTEMS
consistent with sustainable food production and consumption, dietary guidelines
of the future will probably become more and more focused on sustainability as
the problems caused by non-sustainable systems become more starkly obvious.
REFERENCES
1.
McMichael AJ. Global environmental change as ‘risk factor’: can
epidemiology cope? Am J Pub Hlth 2001;91:1172–4.
2.
Yencken D, Wilkinson D. Resetting the compass—Australia’s journey
towards sustainability. Collingwood, Victoria: CSIRO Publishing, 2000.
3.
Olesen I, Groen AF, Gjerde B. Definition of animal breeding goals for
sustainable production systems. J Animal Sci 2000;78:570–82.
4.
Western D. Human-modified ecosystems and future evolution. Proc Nat
Acad Sc 2001;98:5458–65.
5.
Nentwig W. The importance of human ecology at the threshold of the next
millenium: how can population growth be stopped? Naturwissenschaften
1999;86:411–21.
6.
Caldwell JC. The demographic dimension: past and future. Asia Pac J Clin
Nutr 2001;10(suppl.):S93.
7.
Esrey SA. Towards a recycling society: ecological sanitation—closing the
loop to food security. Water and Science Technology 2001;43:177–87.
8.
State of the Environment Advisory Council. Australia: state of the
environment, 1996. Collingwood, Victoria: CSIRO Publishing, 1996:3–34.
9.
Gussow JD, Clancy KL. Dietary guidelines for sustainability. J Nutr Ed
1986;18:1–5.
10.
Gussow JD. Dietary guidelines for sustainability: twelve years later. J Nutr
Ed 1999;31:194–200.
11.
American Dietetic Association. Dietetic professionals can implement
practices to conserve natural resources and protect the environment.
Position statement. J Amer Diet Assoc 2001;101:1221–7.
Dietary Guidelines for Children and Adolescents in Australia
281
Infant Feeding Guidelines for
Health Workers
Colin Binns and Geoff Davidson
S UMMARY
S U M M A RY
Breastmilk is a living tissue that includes many species-specific compounds.
Exclusive breastfeeding is recommended to six months of age, before additional
fluids and solids need to be introduced. Breastfeeding is the normal way to feed
infants. Exclusive breastfeeding confers on them protection against infection and
some chronic diseases, and it leads to improved cognitive development.
In Australia, it is recommended that as many infants as possible be exclusively
breastfed until 6 months of age. It is further recommended that mothers then
continue breastfeeding until 12 months of age—and beyond if both mother and
infant wish. This document provides information that will help health
professionals promote these objectives.
Almost all mothers are capable of breastfeeding their infants. Outcomes are
much improved where the mother has the support and encouragement of the
infant’s father, other family members, the hospital, and the community. Many
mothers—perhaps the majority—encounter some difficulties with breastfeeding
but, with support and encouragement from health professionals and community
organisations, they can nearly always continue to breastfeed. Further, most
mothers can continue breastfeeding if they choose to return to work. It is
important, though, to follow the correct procedures when expressing and storing
breastmilk.
Similarly, in the event that an infant is not breastfed, it is important that correct
methods be used for the preparation and storage of feeds. The WHO
International Code of Marketing of Breast-milk Substitutes and the Marketing in
Australia of Infant Formulas: Manufacturers and Importers Agreement provide the
basis for control of the marketing of infant formula in Australia.
All health workers have an obligation to promote breastfeeding in the
community and to ensure that best practice in breastfeeding is followed.
In comparison with many other countries, Australia’s breastfeeding record is
good, but it is important for the health of the nation’s mothers and infants that
initiation rates and the duration of breastfeeding be increased.
The main management precepts are briefly described in the remainder of this
summary.
Infant Feeding Guidelines for Health Workers
287
S UMMARY
Breastfeeding
Breastfeeding is the normal way to feed all infants. Breastfeeding is very
important in the first six months; breastfeeding and its substantial benefits may
continue for two years and beyond.
RECOMMENDATION
•
Encourage, support and promote exclusive breastfeeding for the first six
months of life. An initiation rate in excess of 90 per cent and 80 per cent
of infants being breastfed at the age of 6 months are objectives for
Australia.
The active promotion and support of breastfeeding by community health,
primary health care services, hospitals, and workplaces will increase initiation
rates and the duration of breastfeeding.
RECOMMENDATIONS
•
Provide antenatal information and counselling about the benefits and
practical aspects of breastfeeding (and the risks of not breastfeeding ) to
all potential mothers and fathers.
•
Promote the principles of the Baby Friendly Hospitals initiative.
•
Pay particular attention to the importance of correct attachment and
positioning when breastfeeding. Effective, rapid management of any
breastfeeding difficulties is important to extend the duration of
breastfeeding.
•
Encourage community-based programs supporting breastfeeding families:
such programs are of increasing importance as the length of hospital stays
decreases.
•
Encourage support in the community and workplace for flexible work
schedules, ‘part-time’ breastfeeding, and the use of expressed breastmilk.
•
Continue to implement the WHO International Code of Marketing of
Breast-milk Substitutes and the Marketing in Australia of Infant Formulas:
Manufacturers and Importers Agreement and ensure that all health
professionals understand their obligations.
There are very few contra-indications for breastfeeding. Smoking and
environmental contaminants are not reasons for stopping breastfeeding.
Moderate, infrequent use of alcohol, most prescription and over-the-counter
288
Infant Feeding Guidelines for Health Workers
S UMMARY
drugs, and most maternal diseases are not indications for stopping breastfeeding.
Use of a pacifier (dummy) can, however, interfere with breastfeeding.
RECOMMENDATIONS
•
Encourage mothers who smoke to stop or reduce smoking and to avoid
exposing their infant to tobacco smoke. Even if a mother persists with
smoking, breastfeeding remains the best choice.
•
Encourage mothers to limit their intake of alcohol and to avoid illicit drugs.
•
Most prescription drugs are compatible with breastfeeding, but each case
should be specifically assessed.
•
At present, breastfeeding is contra-indicated when a mother is known to
be HIV positive. (Research into the possible benefits of antiretroviral drugs
is continuing.)
•
If a pacifier (dummy) is used, it should be introduced after one to two
months and be used infrequently.
When an infant is not receiving breastmilk
If an infant is not breastfed or is partially breastfed, the commercial infant
formulas are the most acceptable alternative to breastmilk until 12 months of
age.
RECOMMENDATIONS
•
Parents should be informed of the benefits of breastfeeding and of the
risks of not breastfeeding when a change from breastfeeding is being
considered.
•
If complementary feeding is considered in hospital, the mother’s informed
consent should be obtained.
•
Use cow’s milk–based formulas until 12 months of age. (All infant formulas
available in Australia are iron-fortified.) Use soy-based or other special
formulas only for infants who cannot take dairy-based products or because
of specific medical, cultural or religious reasons.
•
Specialty formulas are indicated only for infants with detected or
suspected pathology: the advice of a health care professional should be
sought.
•
When an infant formula is used, the instructions for preparation must be
followed exactly.
Infant Feeding Guidelines for Health Workers
289
S UMMARY
It is not appropriate to use nutritionally incomplete alternate milks as the sole
source of nutrition for infants. Pasteurised whole cow’s milk is, however, an
important component of a mixed diet for a child older than about 12 months.
RECOMMENDATIONS
•
Pasteurised whole cow’s milk may be introduced to a child’s diet at around
12 months of age and be continued throughout the second year of life—
and, of course, beyond. It is an excellent source of protein, calcium and
other nutrients.
•
Reduced-fat milks (skim milk and milk with 1 or 2 per cent fat) are not
recommended in the first two years of life.
•
Soy (except soy formula where specifically indicated), rice and other
vegetarian beverages—whether or not they are fortified—are
inappropriate alternatives to breastmilk, formula or pasteurised whole
cow’s milk in the first two years of life.
Other fluids in infant feeding
Tapwater that meets the Australian water standards and commercially bottled
water—but not mineral, carbonated or flavoured water—are generally suitable
for infants and children. Limit the use of fruit juices, to avoid interfering with the
intake of nutrient-containing foods and fluids. Herbal teas and other beverages
are of no known benefit to an infant and could possibly be harmful.
RECOMMENDATIONS
•
Boil all water that is to be fed to an infant.
•
Limit an infant’s fruit juice intake, to avoid interfering with their intake of
breastmilk or infant formula.
•
Do not use herbal teas, soft drinks or other beverages.
The transition to solid foods
At the age of 6 months, infants are physiologically and developmentally ready
for new foods, textures and modes of feeding, and they need more nutrients
than can be provided by breastmilk or formula. By 12 months of age, ingestion
of a variety of foods from the different food groups, as described in the
Australian Guide to Healthy Eating, is recommended.
290
Infant Feeding Guidelines for Health Workers
S UMMARY
RECOMMENDATIONS
•
Introduce solid foods at around 6 months, to meet the infant’s increasing
nutritional and developmental needs.
•
Start with low-allergenic foods such as single-grain baby cereals; follow this
with vegetables and fruits and then meats. Add only one food at a time and
wait several (ideally five to 10) days before introducing a new food. To
prevent iron deficiency, iron-containing foods such as iron-fortified cereals
are recommended as the first foods, followed later by foods containing
meats and other protein-rich foods.
Caring for infants’ food
Foods provided to an infant must be free of pathogens and of suitable size and
texture; they must also provide the necessary nutrients and be fed to the infant
in a safe way.
RECOMMENDATIONS
•
Store foods safely and prepare them hygienically.
•
To prevent botulism, do not feed unpasteurised honey to infants.
•
To prevent salmonella poisoning, cook all eggs well and do not use
products containing raw eggs.
•
Hard, small and round, smooth and sticky solid foods are not
recommended because they can cause choking and aspiration.
•
Ensure that infants and toddlers are always supervised during feeding.
•
Avoid feeding an infant using a ‘propped’ bottle.
Nutrition in the second year of life
Healthy eating is important in the second year of life. It provides the energy and
nutrients needed for growth and development; it develops a sense of taste and
an acceptance and enjoyment of different foods; and it instils attitudes and
practices that can form the basis for lifelong health-promoting eating patterns.
Infant Feeding Guidelines for Health Workers
291
S UMMARY
RECOMMENDATION
•
Small, frequent, nutritious and energy-dense feedings of a variety of foods
from the different food groups are important to meet nutrient and energy
needs during the second year of life. The regular family diet (see the
Australian Guide to Healthy Eating) should be the basis of the child’s meals.
Other aspects of infant nutrition
Food allergies
Whenever possible, food allergies should be minimised.
RECOMMENDATION
•
Encourage exclusive breastfeeding for six months to decrease the risk of
allergy in infants with a positive family history. If there is a strong family
history of allergy, delay introducing some or all of the highly allergenic
foods during the first year; among these foods are cow’s milk and other
dairy products, soy, eggs, nuts, peanuts and fish. It is best to continue
avoiding eggs, nuts and shellfish until the age of 3 years.
Treatment of proven food allergies involves avoidance of foods known to cause
symptoms.
RECOMMENDATION
•
When food choices are restricted, the advice of a dietitian should be
sought to ensure that the dietary intake continues to meet nutrient and
energy needs.
Colic
Changes in diets and restrictions on individual foods have had very limited
success in the treatment of colic.
RECOMMENDATION
•
292
Ensure that any dietary modification or pharmacological intervention is
safe and does not result in nutritional deficiencies.
Infant Feeding Guidelines for Health Workers
S UMMARY
Constipation
In infancy, true constipation is infrequent.
RECOMMENDATION
•
To avoid unnecessary intervention, parents need to be educated about the
wide variation in normal bowel function in infants (particularly those who
are breastfed) and toddlers.
Dietary fat
Dietary fat is an important source of energy and the primary source of essential
fatty acids. It also promotes the absorption of essential fat-soluble vitamins.
RECOMMENDATION
•
Restriction of dietary fat is not recommended during the first two years of
life because it may compromise the intake of energy and essential fatty
acids and adversely affect growth, development, and the myelination of the
central nervous system.
Dental caries
The prevalence of dental caries is lower where infants and children have access
to fluoridated water and when long-term exposure of teeth to nutrient-containing
liquids is avoided. Excessive fluoride intake can, however, cause dental fluorosis.
RECOMMENDATIONS
•
Fluoride supplementation is not recommended for infants aged less than 6
months.
•
For children between the ages of 6 months and 2 years who are living in
areas where the household water supply is not fluoridated, daily
supplementation with 0.25 milligrams of fluoride may be recommended.
•
Avoid leaving a bottle with a sleeping infant or using one as a pacifier. Avoid
night-time and long-term use of baby bottles containing liquids other than
water.
•
Do not dip pacifiers or bottle teats in sugar or honey.
Infant Feeding Guidelines for Health Workers
293
S UMMARY
Diarrhoeal disease
Mild to moderate dehydration associated with gastroenteritis should be managed
with oral rehydration therapy on the advice of a health professional.
RECOMMENDATIONS
•
Manage mild to moderate dehydration with an oral electrolyte solution
and early refeeding.
•
For breastfed infants, continue breastfeeding while supplementing their
fluid intake with an oral electrolyte solution as necessary.
Iron deficiency anaemia
Iron deficiency is common, but it is preventable if suitable feeding choices are
made. Exclusive breastfeeding to the age of 6 months will ensure that breastmilk
is not replaced by foods of lower nutrient density and will minimise the risk of
iron deficiency.
RECOMMENDATIONS
•
Continue exclusive breastfeeding for about six months.
•
Introduce complementary foods containing iron at about 6 months of age.
•
Choose iron-containing formula for infants who are not breastfed and for
infants receiving formula as well as breastmilk.
•
Delay the introduction of whole cow’s milk until 12 months of age.
•
Continue to offer iron-fortified and meat-containing foods beyond 12
months of age.
294
Infant Feeding Guidelines for Health Workers
S UMMARY
Vegetarian diets
Nutritional needs can be met by a well-planned vegetarian diet. The advice of a
dietitian may be needed in particular situations.
RECOMMENDATIONS
•
Vegetarian mothers should be advised to breastfeed their infants for as
long as possible—two years or more. For vegan infants who are not
breastfed or are partially breastfed, use of a commercial soy-based infant
formula during the first two years of life is recommended.
•
After dietary assessment, infants on vegan diets may require nutritional
supplements.
Low-birthweight infants
Breastmilk is the best food for low-birthweight infants, although special
supplements may be required. Low-birthweight infants are often iron deficient
and supplementation is required.
Infant Feeding Guidelines for Health Workers
295
C ONTENTS
CONTENTS
Summary
287
Definitions
301
Introduction: breastfeeding in Australia
305
I
Encouraging and supporting breastfeeding in the Australian
community
Breastfeeding as the physiological norm
References
317
317
323
II
Initiating, establishing and maintaining breastfeeding
Breastfeeding education for parents
Antenatal advice
Physiology of breastmilk and breastfeeding
The first breastfeed
References
329
329
330
331
337
338
III
Breastfeeding: early days
The natural patterns of breastfeeding
The sleepy infant
The unsettled infant
Exclusive breastfeeding
Rooming-in
Monitoring an infant’s progress
Young mothers
References
341
341
341
342
343
345
345
349
349
IV
Breastfeeding: common problems and their management
Hygiene
Nipple pain and trauma
Nipple variations
Nipple shields
Other nipple problems
‘Too much milk’
‘Too little milk’
Engorgement
Inflammatory conditions of the breast
Blood in the breastmilk
Postnatal depression and mood disorders
Breast refusal
The crying infant
353
354
354
355
356
356
357
358
361
362
364
364
366
367
Infant Feeding Guidelines for Health Workers
297
C ONTENTS
Regurgitation and gastro-oesophageal reflux
Physiological jaundice
Breastmilk jaundice
References
369
371
371
371
V
Expressing and storing breastmilk
Expressing breastmilk
Feeding with expressed breastmilk
Storage of expressed breastmilk
References
377
377
379
379
381
VI
Breastfeeding in specific situations
Absolute contra-indications to breastfeeding
Relative contra-indications to breastfeeding
Nicotine, alcohol and other drugs
Women and paid work
Low-birthweight infants
References
383
383
384
385
386
387
387
VII
Informed use of complementary feeds in hospital
389
VIII
Safe use of infant formula
Infant formulas
Preparation of formula
Sterilisation methods
Using infant formula
References
391
391
395
395
397
401
IX
Foods not suitable for infants or that should be used with care
Honey
Tea
Nuts
Fruit juices
Cow’s milk
Reduced-fat milks
References
405
405
405
405
405
406
406
406
X
Interpretation of the WHO Code for health workers in Australia
The Marketing in Australia of Infant Formula Agreement: status
The Advisory Panel on the Marketing in Australia of Infant Formula:
terms of reference
Interpretations of the Advisory Panel on the Marketing in Australia of
Infant Formula
References
407
407
298
Infant Feeding Guidelines for Health Workers
408
408
415
C ONTENTS
Appendix A
Measurement of breastfeeding rates
417
Appendix B
The Innocenti Declaration on the Protection,
Promotion and Support of Breastfeeding
419
Royal Australian College of General Practitioners:
breastfeeding position statement
423
Appendix C
Appendix D
Breastfeeding program of the Department of Health
and Ageing
427
Appendix E
Feeding low-birthweight pre-term infants
(finger feeding)
431
Appendix F
Pharmaceutical and other drugs and breastfeeding
433
Appendix G
The composition of human milk
439
Appendix H
Sample consent form for complementary feeds
443
Appendix I
Australian nutrition and breastfeeding resources
and websites
445
Marketing of breastmilk
447
Appendix J
Infant Feeding Guidelines for Health Workers
299
D EFINITIONS
DEFINITIONS
[Unless otherwise noted, the following definitions are taken from reference 1 at
the end of this list. Where ‘WHO Code’ is inserted in brackets, this refers to the
WHO International Code of Marketing of Breast-milk Substitutes. All the
definitions given here are consistent with the WHO definitions—see reference 2
at the end of the list.]
Breastfeeding duration
The total length of time during which an infant
receives any breastmilk at all—from initiation
until breastfeeding has ceased.
Breastmilk substitute
Any food being marketed or otherwise
represented as a partial or total replacement for
breastmilk, whether or not it is suitable for that
purpose [WHO Code]. In Australia, this term is
considered inappropriate because it implies an
equivalence to breastmilk. The term infant
formula is used throughout this document,
although it is acknowledged that other foods and
fluids are used in place of breastmilk. Infant
formula is the term used in Australia New
Zealand Food Standards Code, volume 2.
Complementary food
Any food—manufactured or locally prepared—
suitable as a complement to breastmilk or infant
formula, when either becomes insufficient to
satisfy the nutritional requirements of the infant.
Such food is also commonly called weaning food
or breastmilk supplement [WHO Code]. In this
document the following working definition is
used: any nutrient-containing foods or liquids
(other than breastmilk) given to infants who are
breastfeeding.
Complementary feeding
The infant or child is receiving both breastmilk
and nutrient-containing foods, which includes any
food or liquid containing non-human milk.
Container
Any form of packaging of products for sale as a
normal retail unit, including wrappers [WHO
Code].
Infant Feeding Guidelines for Health Workers
301
D EFINITIONS
Distributor
A person, corporation or other entity in the public
or private sector engaged, directly or indirectly, in
the business of marketing at the wholesale or
retail level a product within the scope of the
WHO Code. A ‘primary distributor’ is a
manufacturer’s sales agent, representative,
national distributor or broker [WHO Code].
Ever breastfed
Infants who have been put to the breast, if only
once. Also includes infants who have received
expressed breastmilk but have never been put to
the breast.
Exclusive breastfeeding
An infant receives only breastmilk from his or her
mother or a wet nurse, or in the form of
expressed breastmilk, and no other liquids or
solids apart from drops or syrups containing
vitamins, mineral supplements or medicines.
Fully breastfed
This term embraces the WHO indicators of
‘exclusive’ breastfeeding and ‘predominant’
breastfeeding. It refers to infants who are
receiving almost all of their nutrients from
breastmilk but take some other liquids such as
water, water-based drinks, oral rehydration
solutions, ritual fluids, and drops or syrups. It
excludes any food-based fluids.
Health care system
Government, non-government and private
institutions or organisations engaged, directly or
indirectly, in providing health care for mothers,
infants and pregnant women. Also includes
nurseries and child care facilities, plus health
workers in private practice. For the purposes of
the WHO Code, the term does not include
pharmacies or other established sales outlets.
Health worker
A professional or non-professional person
working in a component of a health care system;
includes voluntary unpaid workers [WHO Code].
Infant
A child aged less than 12 months.
Infant formula
An infant formula product represented as a
breastmilk substitute for infants and which
satisfies the nutritional requirements of infants
aged up to 4 to 6 months. (Aust New Zealand
Food Standards (volume 2) See also Breastmilk
substitute.
302
Infant Feeding Guidelines for Health Workers
D EFINITIONS
Infant formula product
Means a product based on milk or other edible
food constituents of animal or plant origin which
is nutritionally adequate to serve as the principal
liquid source of nourishment for infants. (Australia
New Zealand Food Standards (volume 2).
Initiation of breastfeeding
An infant’s first intake of breastmilk.
Label
Any tag, brand, mark, pictorial or other
descriptive matter written, printed, stencilled,
marked, embossed or impressed on, or attached
to, a container of any product within the scope of
the WHO Code.
Manufacturer
A corporation or other entity in the public or
private sector engaged in the business or
function—whether directly, through an agent, or
through an entity controlled by or under contract
with it—of manufacturing a product within the
scope of the WHO Code.
Marketing
Product promotion, distribution, selling and
advertising; product public relations; and product
information services [WHO Code].
Marketing personnel
Any people whose functions involve the
marketing of a product or products coming within
the scope of the WHO Code.
Nursing staff
The terms used for nursing staff associated with
infant care change from time to time and in
different localities. In this document the term
encompasses all involved in infant and maternal
care, regardless of their current or former titles.
Predominant breastfeeding
An infant’s predominant source of nourishment is
breastmilk but he or she may also receive water
and water-based drinks (sweetened and flavoured
water, teas, infusions, and so on); fruit juice; oral
rehydration solution; drop and syrup forms of
vitamins, minerals and medicines; and ritual fluids
(in limited quantities). All other food-based fluids
are excluded—in particular, non-human milk. (In
everyday use, this term is sometimes used to
include infants who are occasionally fed nonhuman milk, but the ‘official’ use of the term
precludes this.)
Infant Feeding Guidelines for Health Workers
303
D EFINITIONS
Samples
Single or small quantities of a product provided
without cost [WHO Code]. For the purposes of
this document, and having regard to the Australian
context, free or subsidised samples or supplies of
infant formula are those given by manufacturers
to health care facilities at no cost or at a cost that
is substantially less than the normal retail or
wholesale cost.
Supplies
Quantities of a product provided for use over an
extended period, free or at a low price, for social
purposes, including those provided to families in
need [WHO Code].
Solid foods
Any nutrient-containing foods (semi-solid or
solid)—for example, dilute infant cereals.
Excludes breastmilk and breastmilk substitutes,
fruit and vegetable juices, sugar water, and so on.
Supplementary feed
Fluids or foods dissolved in fluids given to
completely replace a breastfeed. The distinction
between complementary feeds and supplementary
feeds is important: there seems to be a great deal
of confusion among health professionals.
Toddler
A child aged from 1 to 2 years.
Weaning
The period during which an infant is introduced
to breastmilk substitutes or solid foods, or both,
with the intention of ceasing breastfeeding. (This
term should be used with care: in the literature,
weaning, weaning foods and weaned are used in
different ways.)
Weaned
The infant or child no longer receives any
breastmilk.
Young child
A child aged less than 5 years.
REFERENCES
1.
Webb K, Marks K, Lund-Adams M, Abraham B. Towards a national system
for monitoring breastfeeding in Australia: a discussion paper. Canberra:
Australian Food and Nutrition Monitoring Unit, 2002.
2.
World Health Organization. Complementary feeding of young children in
developing countries; 1998. Report no. WHO/NUT/98.1. Geneva: WHO,
1998.
304
Infant Feeding Guidelines for Health Workers
I NTRODUCTION :
BREASTFEEDING IN
A USTRALIA
INTRODUCTION: BREASTFEEDING IN
AUSTRALIA
[The introduction of solid foods is covered in detail in the Dietary Guidelines for
Children and Adolescents in Australia.]
Breastfeeding is the normal way to feed infants. The purpose of this document is
to encourage health workers to continue promoting breastfeeding as the norm
and to help mothers overcome any difficulties they might encounter. All health
workers have an obligation to promote breastfeeding and to ensure that best
practice in breastfeeding is followed. With modern obstetric care, mothers spend
so little time in hospital that breastfeeding may not be fully established before
they are discharged; the result is that many mothers who are breastfeeding
consult community health professionals.
Provision of breastfeeding education prior to, or in the early stages of, pregnancy
is important. The earlier in the pregnancy a mother makes the decision to
breastfeed, the more likely is she to initiate breastfeeding and continue to
breastfeed.1,2 The support of the baby’s father and the encouragement of society
play important roles in the success of breastfeeding3 —see Chapter 1 of the
Dietary Guidelines for Children and Adolescents and Section II here for a more
detailed discussion.
When, for some reason, substitutes for breastmilk are used, health workers
should provide the relevant information and do their utmost to ensure that best
practice is followed. Once the use of infant formula is established, the
appropriate public health response is to ensure best practice, minimise the risks
associated with formula feeding, and avoid inducing guilt in the mother.
Exclusive breastfeeding to the age of about 6 months gives the best nutritional
start to infants and is recommended by a number of authorities.4–8 The WHO
reviewed the literature on breastfeeding duration and more than 3000 references
were identified. The WHO Expert Consultation recommended exclusive
breastfeeding for six months, with the introduction of complementary foods and
continued breastfeeding thereafter; the 2001 World Health Assembly adopted a
resolution supporting this change in policy.7 The WHO also recommends that
breastfeeding continue for up to two years and beyond. Breastmilk can continue
to provide half or more of an infant’s nutrients during the second half of the first
year of life and up to one-third during the second year of life <www.who.int>.
For Australia, it is recommended that as many infants as possible be exclusively
breastfed until 6 months of age. It is further recommended that mothers then
continue breastfeeding until 12 months of age—and beyond if both mother and
infant wish. Although the greatest benefits from breastfeeding are to be gained in
Infant Feeding Guidelines for Health Workers
305
I NTRODUCTION :
BREASTFEEDING IN
A USTRALIA
the early months, especially from exclusive breastfeeding for at least six months,
there is no doubt that breastfeeding provides benefits that continue beyond this
time. After six months, continued breastfeeding along with complementary foods
for at least 12 months will bring continuing benefits.9–14
Infants’ needs differ, and a small number may benefit from the introduction of
solids before the age of 6 months, but not before 4 months.15 Growth monitoring
on a regular basis, using an accurate scale, a suitable methodology and a growth
reference, offers the most objective way of determining whether there is a need
for supplementation. This should, however, be considered in association with a
number of factors, among them examination, the infant’s history, the parents’
size, and the infant’s current feeding patterns. If an infant’s growth is faltering,
efforts should be made to increase the milk supply: the assistance of a lactation
consultant is often beneficial. Infants who are exclusively breastfed until the age
of 6 months are likely to have better iron status than those who have been given
other foods. This is because of the high bioavailability of the iron (lactoferrin) in
breastmilk. However, delaying the introduction of solid foods much beyond
6 months can compromise iron status. Iron deficiency at this age is known to
cause delayed growth and problems with cognitive development16,17 —see
Chapter 3 of the Dietary Guidelines for Children and Adolescents for further
information).
Australia includes breastfeeding in its national health goals and targets, and all
the states have also accorded high priority to maximising initiation rates and the
duration of breastfeeding. Following a decline in breastfeeding around the
middle of the 20th century, in the 1970s there was increasing recognition of the
harm being done by departing from the norm of breastfeeding. Rates began to
increase again, in Australia and in comparable overseas countries, beginning in
the higher socio-economic groups. By 1983 both the prevalence and the duration
of breastfeeding in Australia were among the highest in the western world, with
85 per cent of mothers breastfeeding at discharge from hospital and 54–55 per
cent three months later.18 Breastfeeding rates have remained around this level
since then. In comparison, breastfeeding initiation rates in the United States were
around 20 per cent in the 1970s and increased to 62 per cent in 198219 ; they
then declined in the 1990s but rose again, to 68.2 per cent, in 2000.8 Promotion
of breastfeeding in the Australian dietary guidelines may have been an important
factor in preventing the decline in breastfeeding seen in the 1990s in other
countries.
In 1992–93 in Western Australia and 1995–96 in Queensland a survey was carried
out by Scott et al.1,20 ; the results suggested a continuing trend to increasing
breastfeeding rates and durations in those states. In the years preceding the
survey the hospitals had a breastfeeding discharge rate of 82 per cent, and by six
months 46 per cent of mothers were still breastfeeding (note that the Scott et al.
and the Palmer18 data are not significantly different). Women who were born in
Australia or New Zealand were almost twice as likely to be breastfeeding at
discharge than women born in other countries.
306
Infant Feeding Guidelines for Health Workers
I NTRODUCTION :
BREASTFEEDING IN
A USTRALIA
Donath and Amir analysed data from the 1995 National Nutrition Survey and
found that breastfeeding rates were 81.8 per cent on discharge from hospital and
57.1 per cent fully breastfed at age 3 months.21 At age 6 months it is estimated
that 18.6 per cent of babies are fully breastfed and 46.2 per cent partially
breastfed; at 1 year of age 21.2 per cent of infants are receiving some breastmilk.
Thus, in Australia at present fewer than 20 per cent of infants are achieving the
goal of being exclusively breastfed to 6 months of age and continuing with
breastfeeding thereafter. It is important to note, however, that, while the
objective is to promote exclusive breastfeeding to the age of 6 months, any
amount of breastfeeding is to be encouraged. Mothers should always be
encouraged to continue breastfeeding, even if their circumstances do not allow
exclusive breastfeeding.
Mothers who are less likely to breastfeed are those from lower socio-economic
groups and certain ethnic groups. Mothers born in Asia are among the earliest of
the ethnic groups to stop breastfeeding; they are followed by mothers from
lower socio-economic groups.1
Although the Australian figures are better than those for most other developed
countries, by the age of 6 months about half of the infants in Australia are no
longer breastfed. This decline in breastfeeding rates after the first few months
means a loss of important health benefits for these infants, and hence for
Australia.
The current situation and the challenge facing Australia can be put in the
following terms. Initiation rates are relatively high, at around 82 per cent or
more, but experience in countries such as Sweden and Norway suggests that an
initiation rate of 98 per cent is achievable. A target of 50 per cent exclusive
breastfeeding for the first six months is realistic in the next few years; this target
would still be sub-optimal, and it should be raised as soon after that as
practicable. Within a decade a target of 80 per cent fully breastfed for around six
months should be set and the necessary parental education and community
support initiated.
The socio-cultural environment has an important influence on parents’ choice to
breastfeed their infant.22 Antenatal exposure to the advertising of infant formula
increases the rate of early termination of breastfeeding and shortens the overall
duration among women with uncertain breastfeeding goals or goals of 12 weeks
of less.23 For these reasons, the promotion of infant formula in Australia is
controlled by voluntary codes based on the World Health Organization’s policies.
The WHO International Code of Marketing of Breast-milk Substitutes
During the 1960s and 1970s infant formulas were inappropriately marketed in
many countries, contributing to a decline in breastfeeding and consequent
increases in infant morbidity and mortality. In response to this situation, UNICEF,
the WHO and a number of other organisations proposed a code to limit the
inappropriate promotion of infant formulas. The World Health Assembly adopted
Infant Feeding Guidelines for Health Workers
307
I NTRODUCTION :
BREASTFEEDING IN
A USTRALIA
the International Code of Marketing of Breast-milk Substitutes on 21 May 1981,
with 118 votes in favour, one against, and three abstentions.
The recommendation to develop a marketing code came out of the 1979
UNICEF–WHO ‘Meeting on Infant and Young Child Feeding’. The meeting was
attended by representatives of governments, UN agencies, non-government
organisations and the infant-food industry, and experts from related disciplines.
The WHO Code aims to protect the nutritional wellbeing of all infants in two
separate but closely related ways: through protecting and promoting
breastfeeding; and the appropriate use and marketing of breastmilk substitutes,
bottles and teats when these are necessary.24
Since 1981 the World Health Assembly has adopted a number of resolutions that
relate to the WHO Code and clarify some of its provisions. Among the most
significant of these is Resolution 39.28 (1986), which deals with the issue of free
supplies, the promotion of early introduction of and use of complementary
foods, and the use of follow-up milks. The Assembly’s Resolution 47.5 (1994)
adds important guidance on the issue of free supplies and proper complementary
feeding at the age of about 6 months. Resolution 49.15, adopted in 1996, urges
member states to ensure that complementary foods are not marketed in ways
that undermine exclusive and sustained breastfeeding. The same resolution
addresses the question of financial support for health professionals and warns
about the danger of conflicts of interest. In response to the WHO Code, in
Australia a self-regulatory model was adopted (see ‘Implementation of the WHO
Code in Australia’, at the end of this introduction). To mark the 20th anniversary
of the Code, Young reviewed some of the violations still being encountered.25
Since the WHO Code was adopted a number of other initiatives designed to
improve the health of infants through promoting and supporting breastfeeding
have been developed. One is the joint WHO–UNICEF Baby Friendly Hospital
initiative, announced in 1991, which seeks to eliminate hospital practices that
may interfere with successful initiation and maintenance of breastfeeding.
Although mothers are now in hospital for only a short period after delivery,
hospitals can still have a positive influence on breastfeeding. If hospitals are not
supportive of breastfeeding the negative effects can be marked. A Cochrane
systematic review has shown that that negative hospital practices, such as the
distribution of commercial sample packs, can have a very negative effect on
breastfeeding. The distribution of these packs (with or without formula) to
mothers while in hospital reduces the number of women who exclusively
breastfeed.26
Hospitals are encouraged to adopt the Baby Friendly Hospital initiative and the
‘Ten steps to successful breastfeeding’ (see the box below). All steps in this
program have been shown to positively influence breastfeeding outcomes.27 The
benefits of this policy have been demonstrated by the Boston Medical Centre,
where breastfeeding initiation rates rose from 58 per cent in 1995 to 86.5 per
cent in 200028 ; the recent PROBIT study in Belarus has also shown increased
initiation rates.12
308
Infant Feeding Guidelines for Health Workers
I NTRODUCTION :
BREASTFEEDING IN
A USTRALIA
Ten steps to successful breastfeeding29
Every facility providing maternity services and care for newborn infants should:
1. Have a written breastfeeding policy that is routinely communicated to all health care
staff.
2. Train all health care staff in skills necessary to implement this policy.
3. Inform all pregnant women about the benefits and management of breastfeeding.
4. Help mothers initiate breastfeeding within half an hour of birth.
5. Show mothers how to breastfeed, and how to maintain lactation even if they are
separated from their infants.
6. Give newborn infants no food or drink other than breastmilk, unless medically indicated.
7. Practise rooming-in (allow mothers and infants to remain together), 24 hours a day.
8. Encourage breastfeeding on demand.
9. Give no artificial teats or pacifiers (also called dummies or soothers) to breastfeeding
infants.
10. Foster the establishment of breastfeeding support groups and refer mothers to them on
discharge from the hospital or clinic.
A further important statement on breastfeeding is the Innocenti Declaration,
which was adopted in April 1990 by participants in the WHO–UNICEF policy
makers’ meeting ‘Breastfeeding in the 1990s: a global initiative’.30
The Baby Friendly Hospitals initiative in Australia
In Australia the Baby Friendly Hospitals initiative is administered by the
Australian College of Midwives Incorporated. As of mid-2001, there were 24
hospitals across Australia that had achieved ‘Baby–Feeding Friendly Hospital
status’ <www.UNICEF.org>.
Promotion of breastfeeding in Australia
The Commonwealth Government is committed to protecting, promoting and
supporting exclusive breastfeeding for the first six months of life and continued
breastfeeding thereafter. Australia is one of the few developed countries in the
world to include a guideline on breastfeeding in its Dietary Guidelines for
Adults; the guideline is included in recognition of the role the whole community
plays in encouraging and supporting breastfeeding. In the Dietary Guidelines for
Children and Adolescents the breastfeeding guideline is placed first, to
emphasise its importance to the health of this age group.
A systematic review of the promotion of breastfeeding has been undertaken by
the Health Technology Assessment Group of the National Health Service.31 A
total of 59 studies were identified as eligible for inclusion, including 14
randomised controlled trials. Three types of intervention have been found to be
effective in developed countries when delivered as stand-alone interventions, or
as part of an integrated package:
Infant Feeding Guidelines for Health Workers
309
I NTRODUCTION :
•
•
•
BREASTFEEDING IN
A USTRALIA
small group health education delivered during the antenatal period
one-to-one health education can be effective in increasing initiation rates
in low income mothers
peer-support programs in the antenatal and postnatal periods have been
shown to be effective in increasing breastfeeding initiation and duration.31
Breastfeeding programs
The National Breastfeeding Strategy was initiated in 1996 and has funded a
number of projects (see www.health.gov.au/pubhlth/strateg/brfeed/index.htm for
details). The National Child Nutrition Program, with funding of $15 million, will
support community-level projects designed to improve the diet and eating habits
of children from the prenatal stage to the primary school years. In addition, the
state and territory governments support the promotion of breastfeeding and have
additional programs and resources available. Appendix I lists some of the
resources relating to breastfeeding and infant feeding that are provided by the
Commonwealth and the states and territories.
The National Breastfeeding Strategy has promoted the following actions:
•
National Health and Medical Research Council guidelines
– development and dissemination of the Infant Feeding Guidelines for
Health Workers (1996), with the aim of helping health workers to
promote and support breastfeeding in a consistent way
–
development and dissemination of the Dietary Guidelines for
Australians (1991), which encourage breastfeeding because of its
importance to all Australians in terms of nutritional, health, social and
economic benefits to the community
–
development and dissemination of the Dietary Guidelines for Children
and Adolescents32 , in which the breastfeeding message is the most
important guideline
•
the International Code of Marketing of Breast-milk Substitutes
– facilitation of a self-regulatory model for implementation of the WHO
Code in the 1990s. The resulting voluntary agreement is the 1992
Marketing in Australia of Infant Formulas: Manufacturers and Importers
Agreement, which deals solely with the marketing of infant formula by
manufacturers
•
the Australian Breastfeeding Association
– funding of $50 000 a year for the three years, beginning in 1998–99,
allocated to the Australian Breastfeeding Association (formerly the
Nursing Mothers Association of Australia) to assist its ongoing work of
supporting breastfeeding in the community
•
Indigenous health services
– an audit of current training in breastfeeding support and infant
nutrition and a review of current interventions and best practice. The
310
Infant Feeding Guidelines for Health Workers
I NTRODUCTION :
BREASTFEEDING IN
A USTRALIA
resultant reports—covering current training in breastfeeding support
and infant nutrition, current interventions and identification of best
practice, and stories and ideas from around Australia—were produced
for use in the development of a national public health nutrition
strategy and disseminated by the Office for Aboriginal and Torres
Strait Islander Health
•
Naturally: the facts about breastfeeding
– a companion to the NHMRC’s Infant Feeding Guidelines for Health
Workers33 , this document contains fact sheets for health workers and
was distributed to health workers and GPs across Australia
•
national accreditation standards for maternal and child health services
– national care standards for services, such as hospitals and community
health services, that support the maintenance of breastfeeding. The
standards are set out in the Maternal and Infant Care Services Module
and the Guidelines for Maternal and Infant Care Services
•
family education
– resources called ‘tip cards’ targeting a variety of ethnic, cultural and
socio-economically disadvantaged groups in Australia; disseminated in
1998. A variety of resources were produced: five series of tip cards,
each with seven hints; a series of tip cards in Vietnamese, Chinese,
Arabic, Turkish and Spanish; You can Breastfeed Your Baby, a booklet
for those with lower literacy; Let’s give our Baby the Best, a comic
booklet aimed at young parents; and two posters captioned ‘Mother’s
milk—perfect anytime, anywhere’
•
employer support
– insert developed for the Department of Workplace Relations and Small
Business newsletter Work and Family on workplace initiatives to
support breastfeeding women (targeted at employers). Disseminated
nationally to employers
•
health professionals’ education
– education kit targeting community health workers and members of
professional colleges. Distributed to practising GPs and paediatricians,
baby health clinics and pharmacies. A variety of resources were
produced: a best-practice guide to the management of common
breastfeeding problems; a lactation resource guide; a breastfeeding
module (a continuing education program for GPs); a continuing
pharmacy education module on breastfeeding; and similar modules for
child health nurses and pharmacy assistants
•
antenatal education breastfeeding package
– an education package, distributed to 3000 antenatal educators and
obstetricians, consisting of an Educators Manual, providing strategies,
tools and lesson plans, including for use with people of non–English
speaking background; a video promoting the importance of the social,
Infant Feeding Guidelines for Health Workers
311
I NTRODUCTION :
BREASTFEEDING IN
A USTRALIA
emotional and relationship aspects of breastfeeding; and a poster to
accompany the video and for display in waiting rooms
•
workplace support
– resources to be developed and strategies implemented that facilitate
women breastfeeding whilst in employment. Fifty thousand kits have
been distributed to medium and large businesses across Australia. The
resources produced are a booklet, aimed at employers and employees,
on ways of continuing breastfeeding; a poster for display in
workplaces as a general awareness-raising tool; a flier featuring key
aspects of combining breastfeeding and paid work; and the same flier
translated into Turkish, Vietnamese, Chinese, Arabic and Spanish.
The National Breastfeeding Monitoring Program will provide consistent and
accurate monitoring of breastfeeding prevalence nationally as part of the
National Nutrition Monitoring and Surveillance Project.
The documents prepared as a part of the National Breastfeeding Program are
available from the Commonwealth Department of Health and Ageing
<www.health.gov.au/pubhlth/strateg/brfeed/index.htm>. Australia is also
fortunate in having a number of voluntary organisations active in the promotion
of breastfeeding. The largest—and the one most accessible to mothers, through
its many branches—is the Australian Breastfeeding Association
<www.breastfeeding.asn.au>.
Implementation of the WHO code in Australia
In Australia the WHO International Code of Marketing of Breast-milk Substitutes
is implemented in a number of ways. A voluntary agreement, the Marketing in
Australia of Infant Formulas: Manufacturers and Importers Agreement (the MAIF
Agreement), was signed in 1992 (see Appendix J). Under this agreement a
monitoring mechanism, in the form of the Advisory Panel on the Marketing in
Australia of Infant Formula, was established, funded jointly by industry and
government. The panel comprises an independent chairperson, a public health
nutritionist and industry and consumer nominees; the Department of Health and
Ageing provides secretariat support. (The panel’s annual reports are available at
<www.health.gov.au>.) The working of the panel and the implementation of the
agreement itself has recently been reviewed.34
Australia’s health workers also need information about their responsibilities
under the WHO Code, to ensure the continuing emphasis on breastfeeding.
Approximately one-third of the WHO Code is directly addressed to health
workers, and Section X of these guidelines is devoted to interpreting the Code.
Health workers must always ensure that they encourage the initiation and
maintenance of breastfeeding and avoid any role in the promotion of breastmilk
substitutes.33
312
Infant Feeding Guidelines for Health Workers
I NTRODUCTION :
BREASTFEEDING IN
A USTRALIA
These guidelines—prepared after extensive consultation—are a revision of those
originally developed by the National Health and Medical Research Council in
1984; they provide for health workers information on ways of encouraging and
supporting breastfeeding. Health workers are committed to promoting optimal
health and development for all infants. When interpreting these guidelines,
however, health workers should be mindful that mothers who do not breastfeed
need information about infant formula and instruction about its use and
preparation; this is covered in Section VIII. All mothers are entitled to support
and advice, so that they can feed their infants well.
Scope of the WHO Code
The WHO Code applies to the marketing (and practices related to the marketing)
of breastmilk substitutes—including infant formula, other milk products, foods
and beverages. It also applies to bottle-fed complementary foods when these are
marketed or otherwise represented as suitable, with or without modification, as a
partial or total replacement for breastmilk. In addition, the Code deals with the
quality and availability of feeding bottles and teats and provides information
about their use.
The following box summarises the provisions of the WHO Code, as interpreted
and implemented in Australia.
Infant Feeding Guidelines for Health Workers
313
I NTRODUCTION :
BREASTFEEDING IN
A USTRALIA
Interpretation and implementation of the WHO Code in Australia
The WHO Code has been implemented in Australia through the MAIF Agreement and the
NHMRC’s Interpretation of the WHO Code for Health Workers in Australia. Following is a
summary of the main points covered by these documents.
•
The restrictions in the Code apply to infant formula and other products marketed or
represented as breastmilk substitutes and to feeding bottles and teats. Responsibilities
are outlined for companies that manufacture, market or distribute these products, as
well as for health workers and the health care system.
•
Educational materials produced by companies for parents should be unbiased and
consistent; they should include all the facts, describe all the hazards, and avoid reference
to a specific product. Distribution of materials should be only through the health care
system, not through retail outlets.
•
Companies are not permitted to promote their products to the general public, either
directly or through retail outlets. Companies may not give samples or gifts to parents.
Health workers may not give samples to parents.
•
Health workers should consider the message about infant feeding that their actions and
their health care facility gives to mothers. There should be no display or distribution of
products or of company materials that refer to a product or encourage artificial feeding.
•
Marketing personnel—even if they are health professionals—should have no contact
with parents and should not perform any educational or health care functions.
•
Companies may provide scientific and factual information about their products directly
to health workers through meetings or materials.
•
Companies may not offer, and health workers may not accept, gifts or other
inducements that might influence a health worker’s product recommendations to
parents or their health care facility. Study grants may be accepted in some
circumstances, but they must be disclosed.
•
All products within the scope of the Code must conform to standards for quality,
composition and labelling.
•
Independently of measures taken to implement the Code, companies and health
workers should take steps to conform to the principles and aim of the Code and to
monitor their own practices.
In Australia, concerns about or breaches of the WHO Code should be reported to the
Advisory Panel on the Marketing in Australia of Infant Formula:
APMAIF Secretariat
Department of Health and Ageing
PO Box 7186
Canberra BC ACT 2610
Sourced: Modified from <www.health.gov.au/pubhlth/strateg/brfeed/index.htm>.
REFERENCES
1.
Scott JA, Aitkin I, Binns CW, Aroni RA. Factors associated with the duration
of breastfeeding amongst women in Perth, Australia. Acta Paediatr Scand
1999;88(4):416–21.
314
Infant Feeding Guidelines for Health Workers
I NTRODUCTION :
BREASTFEEDING IN
A USTRALIA
2.
Scott JA, Binns CW. Factors associated with the initiation and duration of
breast feeding. Aust J Nutr Diet 1998;55(2):51–61.
3.
Scott JA, Binns CW, Aroni RA. The influence of reported paternal attitudes
on the decision to breastfeed. J Paed Child Hlth 1997;33:305–7.
4.
American Academy of Pediatrics. Breastfeeding and the use of human milk.
Pediatrics 1997;100:1035–9.
5.
Royal Australian College of General Practitioners Council. RACGP
breastfeeding position statement. Melbourne: RACGP Council, 2000.
6.
World Health Organization European Region. Infant Nutrition. Geneva:
WHO, 1999.
7.
World Health Organization. The optimal duration of exclusive
breastfeeding. Press release no. 7. Geneva: WHO, 2001.
8.
Dobson B, Murtaugh M. Position of the American Dietetic Association:
breaking the barriers to breastfeeding. JADA 2001;101(10):1213–20.
9.
Scariati P, Grummer-Strawn L, Fein S. A longitudinal analysis of infant
morbidity and the extent of breastfeeding in the United States. Pediatrics
1997;99(6):E5.
10.
Duncan B, Ey J, Holberg CJ, Wright AL, Martinez FD, Taussig LM. Exclusive
breastfeeding for at least four months protects against otitis media.
Pediatrics 1993;91(5):867–72.
11.
Raisler J, Alexander C, O’Campo P. Breastfeeding and infant illness: a
dose–response relationship? Am J Publ Hlth 1999;89(1):25–30.
12.
Kramer M, Chalmers B, Hodnett E, Sevkovskaya E, Dzihovich I, Shapiro S
et al. The Promotion of Breastfeeding Intervention Trial (PROBIT): a
randomized trial in the Republic of Belarus. JAMA 2001;285(4):413–20.
13.
Rogan W, Gladen B. Breastfeeding and cognitive development. Early Hum
Dev 1993;31:181–93.
14.
Anderson J, Johnstone B, Remley D. Breast-feeding and cognitive
development: a meta-analysis. Am J Clin Nutr 1999;70(4):525–35.
15.
Lanigan J, Bishop J, Kimber A, Morgan J. Systematic review concerning the
age of introduction of complementary foods to the healthy full-term infant.
Eur J Clin Nutr 2001;55:309–20.
16.
Lozoff B, Jimenez E, Wolf A. Long-term developmental outcome of infants
with iron deficiency. N Engl J Med 1991;23:687–94.
17.
Walter T, De Andraca I, Chadud P, Perales C. Iron deficiency anemia: adverse
effects on infant psychomotor development. Pediatrics 1989;84:7–11.
18.
Palmer N. Breastfeeding: the Australian situation. J Food Nutr 1985;42:13–18.
19.
Ryan AS, Rush D, Krieger FW, Lewandowski GE. Recent declines in
breastfeeding in the United States, 1984 through 1989. Pediatrics
1991;88(4):719–27.
Infant Feeding Guidelines for Health Workers
315
I NTRODUCTION :
BREASTFEEDING IN
A USTRALIA
20.
Scott J, Landers M, Hughes R, Binns C. Factors associated with the
initiation and duration of breast feeding amongst two populations of
Australian women. J Paediatr Child Hlth 2001;37:254–61.
21.
Donath S, Amir LH. Rates of breast feeding in Australia by state and
socioeconomic status: evidence from the 1995 National Health Survey. J
Paediatr Child Hlth 2000;36(2):164–8.
22.
Dungy C, Christensen-Szalanski J, Losch M, Russell D. Effect of discharge
samples on duration of breastfeeding. Pediatrics 1992;90:233–7.
23.
Howard C, Howard F, Lawrence R, Andresen E, De Blieck E, Weitzman M.
Office prenatal formula advertising and its effect on breast-feeding
patterns. Obstet Gynecol 2000;95:296–303.
24.
Department of Health and Community Services. Review of the
implementation in Australia of the WHO International Code of Marketing
of Breast-milk Substitutes: report of the Steering Committee. Canberra:
DHCS, 1993.
25.
Young D. Violating the Code: breastfeeding, ethics and choices. Editorial.
Birth 2001;28:77–8.
26.
Donnelly A, Snowden HM, Renfrew MJ, Woolridge MW. Vol. 2001. The
Cochrane Library, 2000.
27.
DiGiloroma A, Laurence M, Strawn G, Fein S. Maternity care practices:
implications for breastfeeding. Birth 2001;28:94–101.
28.
Phillipp B, Merewood A, Miller L, Chawla N. Baby Friendly Hospital
initiative improves breastfeeding initiation rates in a US hospital setting.
Pediatrics 2001;108:677–81.
29.
World Health Organization. Protecting, promoting and supporting
breastfeeding: the special role of maternity services. Joint WHO–UNICEF
statement. Geneva: WHO/UNICEF, 1989.
30.
USAID–SIDA. The Innocenti declaration: breastfeeding in the 1990s—a
global initiative. From a meeting held at the Spedale degli Innocenti,
Florence, Italy, 30 July – 1 August 1990. Florence: United States Agency for
International Development & the Swedish International Development
Authority, 1990.
31.
Fairbank L, O’Meara S, Renfrew MJ, Woolridge M, Sowden AJ, Lister-Sharp
D. Health Technol Assess, 2000;4,1–171.
32.
National Health and Medical Research Council. Dietary guidelines for
children and adolescents. Canberra: AGPS, 1995.
33.
National Health and Medical Research Council. Infant feeding guidelines
for health workers. Canberra: NHMRC, 1996.
34.
Knowles R. Independent advice on the composition and modus operandi
of APMAIF and the scope of the MAIF agreement. Canberra: Department of
Health and Aged Care, 2001.
316
Infant Feeding Guidelines for Health Workers
I NTRODUCTION :
I
BREASTFEEDING IN
A USTRALIA
E N C O U R AG I N G A N D S U P P O RT I N G
BREASTFEEDING IN THE
AUSTRALIAN COMMUNITY
[The breastfeeding guideline in the Dietary Guidelines for Children and
Adolescents contains additional material on factors that are important in
promoting breastfeeding initiation and duration.]
A partner who is supportive is important for both the initiation and the duration
of breastfeeding. Education of fathers during the antenatal period is a priority as
a public health intervention.
Partner support
In my view breastfeeding is like holding down a full time job—only more
physically demanding than most! If your partner is working while you are
at home with a baby, sometimes it is difficult for them to understand why
the dinner is not on the table when they get home, the house is a tip and
no shirt is ironed ready for the next day’s work. A supportive partner is
able to roll up their sleeves and lend a hand when they are at home. They
also bring the baby to you in the middle of the night and don’t complain
when you feed the baby lying down in bed because you are too tired to sit
upright. It is the small things that help to make it work.
——A senior nutritionist, writing about her own experience
BREASTFEEDING
AS THE PHYSIOLOGICAL NORM
Numerous studies have demonstrated the importance of breastfeeding for
mothers and infants. The epidemiological evidence confirms the protective
effects of breastfeeding, in both developed and less-developed countries.1–3
Breastfeeding has positive effects on the nutritional, health and psychological
make-up of the infant and brings health and fertility-control benefits for the
mother. It also offers economic benefits to both the family and society.
Benefits to the infant
Nutrition
It is now clear that the composition of breastmilk is uniquely suited to the
neonate, at a time when growth and development are occurring at very high
rates yet when many of the infant’s systems—such as the digestive, hepatic,
Infant Feeding Guidelines for Health Workers
317
I. E NCOURAGING
AND SUPPORTING BREASTFEEDING IN THE
A USTRALIAN
COMMUNITY
neural, renal, vascular and immune systems—are functionally immature. Many of
the nutrients contained in breastmilk are in readily absorbed and bioavailable
forms.4
Breastmilk is not only a high-quality food; it also contains many components—for
example, bile salt–stimulated lipase, glutamate, certain polyunsaturated longchain fatty acids, low sodium, lysozyme, immunoglobulin A, growth factors and
numerous other bioactive factors—that facilitate optimal function of the infant’s
immature systems. The living cells found in breastmilk are also important
functionally.
Furthermore, the young of various mammals are born at very different stages of
maturity, and it is not easy to modify the milk of one species so that it optimises
the metabolism of the young of another species.
Health
Studies have shown that breastfeeding reduces the risk or severity of a number
of disease states, among them the following:
•
physiological reflux5
•
pyloric stenosis6
•
respiratory illness, particularly in households where both parents smoke7
•
asthma8,9
•
obesity10,11
•
gastrointestinal tract disease12,13
•
inflammatory bowel disease14
•
some childhood cancers15,16
•
coeliac disease—reduced incidence17 or delayed onset17–20
•
otitis media21,22 ,3
•
urinary tract infections23,24
•
bacteraemia-meningitis25,26
•
SIDS—sudden infant death syndrome27–29
•
necrotising enterocolitis in premature infants—reduced incidence.30
A detailed review of the scientific and epidemiological evidence in support of the
World Health Organization’s and UNICEF’s Global Strategy for Infant and Young
Child Feeding provides detailed summaries and assessments of the most relevant
studies. (León-Cava, Lutter et al. 2002)
The mechanism whereby middle ear pressure changes during bottle-feeding and
predisposes to ear infection has recently been described.31
In children who were breast-fed for at least three months, a longitudinal study in
Australian children has shown an improvement in bone mass in eight-year-old
children.32
The association between breastfeeding dose and illnesses in the first six months of
life was analysed by reviewing illness episodes in 7092 infants from the National
318
Infant Feeding Guidelines for Health Workers
I. E NCOURAGING
AND SUPPORTING BREASTFEEDING IN THE
A USTRALIAN
COMMUNITY
Maternal and Infant Health Survey.33 Full breastfeeding was associated with the
lowest illness rates, while minimal breastfeeding was not protective. Breastfeeding
conferred health benefits on infants from all socio-economic groups.
Colic and/or excessive crying in their infants is often a complaint of mothers.
Whether colic exists as a separate entity or as symptom of a maternal problem is
often debated. However, in a study of 3345 infants aged 1 to 6 months (96 per
cent response rate), the prevalence of colic was twice as high among infants of
smoking mothers but significantly less among breastfed infants. Maternal
smoking as a potential risk factor for infantile crying needs further study.34 A
meta-analysis identified 27 controlled trials of a number of interventions for
colic; the authors concluded that for non-breastfed infants ‘infantile colic should
preferably be treated by advising carers to reduce stimulation and with a one
week trial of a hypoallergenic formula milk’.35
Studies on colic are fraught with definitional problems, and many of the studies
identified were of short duration. For breastfed infants, simple strategies such as
changing to a more upright position should be tried. Letting the baby ‘finish the
first side first’ can also be helpful.36 In the management of colic, discussion with
the mother followed by environmental changes should be the first response;
changing to an expensive formula should be a last resort, and then only for
babies not being breastfed.
Diabetes
Using data from the Oxford Record Linkage Study, Jones and colleagues were
able to demonstrate a significant 33% increased risk of diabetes among infants
who were not breastfed at discharge.37 The development of insulin-dependent
diabetes mellitus (type 1 diabetes) is linked to the age at which cow’s milk is
introduced to an infant’s food intake.38 Breastmilk contains factors that protect
the infant against developing this disease.39,40
Leukaemia
In a case-control study of children under the age of 14 years with leukaemia,
2200 cases and 2419 controls were studied. Ever having breastfed was found to
be associated with a 21 per cent reduction in risk of childhood acute leukaemias
(odds ratio for all types combined = 0.79; 95%CI: 0.70–0.91).41 A further nine
case-control studies have suggested that children who have never been breastfed
or were breastfed in the short-term only have a higher risk than those breastfed
for six months or more of developing Hodgkin’s disease. 41 Further studies are
needed to confirm the strength of these relationships.
Specific immune factors
Immunoglobulin A (IgA) is the most abundant antibody in breastmilk. It is
manufactured in and excreted by the breast in response to specific bacteria and
viruses to which the mother is exposed. This provides protection against
Infant Feeding Guidelines for Health Workers
319
I. E NCOURAGING
AND SUPPORTING BREASTFEEDING IN THE
A USTRALIAN
COMMUNITY
pathogens the infant is most likely to encounter in his or her local
environment.42 IgG and IgM antibodies offer further protection against specific
pathogens.43 Donnet-Hughes et al. have reviewed all the specific and nonspecific factors present in breastmilk44 and Oddy has reviewed current
knowledge of immune factors in breastmilk.45
Non-specific protective factors46
•
•
•
•
•
•
Lactoferrin has a high binding affinity with iron, making it unavailable to
micro-organisms such as E. coli and Candida albicans, which require iron
for growth. Further, a peptide with bactericidal properties is released from
lactoferrin, and it is possible that this peptide is responsible for much of
the antibacterial action attributed to lactoferrin.47,48 Similarly, vitamin
B12-binding proteins make vitamin B12 unavailable to micro-organisms.
Lysozyme is bactericidal against certain gram-negative rods and grampositive bacteria.
Prolactin enhances the development of B- and T-lymphocytes and affects
differentiation of intestinal lymphoid tissue. Cortisol, thyroxine, insulin and
growth factors promote maturation of the newborn’s intestine and the
development of intestinal host defences.
The functions of cellular components such as macrophages and monocytes,
neutrophils and B- and T-lymphocytes are not yet fully understood but do
include the inhibition and/or destruction of micro-organisms such as
bacteria and viruses.43 The concentration of these cellular components is
especially high in colostrum, but they are present in all breastmilk.
Oligosaccharides form the third most abundant class of compounds in
breastmilk (12–24 grams per litre). Over 130 different oligosaccharides
have been isolated from human milk49 , and most are resistant to digestion
in the small intestine. They provide specific growth factors for the
desirable bifidus bacteria of the large intestine. They also inhibit the
attachment of pathogenic bacteria to the mucosal surfaces of the intestinal
and urinary tracts and may provide important precursors for the
development of the brain in early infancy.
Fatty acids are released from milk fat by the hydrolytic action between
milk and infant lipases. Some of these free fatty acids have antimicrobial
actions.50
The concentration of most of these protective factors is highest in colostrum; it
decreases as lactation is established and increases again during slow weaning.
Although breastfeeding is of particular value while the infant’s immune system is
immature, it continues to offer some protection throughout the entire course of
lactation.45,51
320
Infant Feeding Guidelines for Health Workers
I. E NCOURAGING
AND SUPPORTING BREASTFEEDING IN THE
A USTRALIAN
COMMUNITY
Breastfeeding and allergy
Breastfeeding offers at least some protection against allergy. In the general
population and in atopic families, it can protect against allergic rhinitis,
wheezing, asthma and atopy in children.8,9 A prospective study of 2187 Western
Australian children showed that breastfed infants had lower rates of asthma and
atopic disease. After adjusting for confounding factors, the introduction of milk
other than breastmilk, led to increased rates of asthma at 6 years of age (OR
1.25, 1.02-1.52) and of atopic disease (1.30, 1.04-1.61).8 The results of some
studies are confounded by the failure to control for the introduction of cow’s
milk formula in hospital in the newborn period. The mother’s own feeding
history and intake of dietary allergens may also be significant.52 Among the
reasons breastfed babies have fewer occurrences of atopic disease are:
•
reduced exposure to the food proteins present in formulas and other foods
•
improved maturation of the intestinal barrier, which reduces the absorption
of large molecules
•
reduced frequency of infection, which can act as an adjuvant
•
the presence of anti-inflammatory factors and antibodies in human
breastmilk.53,54
Cytokine, growth factors, hormones and other bioactive components in human
milk may play an important role in modulating the development of asthma.46
Allergy is often a concern for parents and health workers. Current preventive
strategies are limited, and many children still develop allergies despite efforts at
prevention. If through family history an infant is identified as being at high risk
of developing an allergy, the practical tips in Box I.1 may be of assistance.
Infant Feeding Guidelines for Health Workers
321
I. E NCOURAGING
AND SUPPORTING BREASTFEEDING IN THE
A USTRALIAN
COMMUNITY
Box I.1 Minimising the risk of allergy in high-risk infants
•
Do not smoke during pregnancy, and provide a smoke-free environment for your child
after birth.
•
Dietary restrictions in pregnancy are not recommended.
•
Exclusively breastfeed your child for at least six months, and preferably longer.
•
If breastfeeding is discontinued for any reason, seek professional advice. A hydrolysed
protein formula may be recommended.
•
Soy milk and goat’s milk formulas do not reduce allergies, and should not be used as an
alternative to cow’s milk formulas.
•
Solid foods should not be introduced until about 6 months of age.
•
Start with low-allergenic foods such as single-grain baby cereals, followed by vegetables
and fruits, then meats.
•
Add only one food at a time. Wait several days (ideally five to 10 days) before
introducing a new food.
•
If there is a strong history of allergy in the family, delay introducing some or all of the
highly allergenic foods during the first year—including cow’s milk and other dairy
products, soy products, eggs, nuts and fish. It is best to continue to avoid nuts and
shellfish until the age of 3 years.
•
The foods most commonly associated with allergies are eggs, nuts, dairy products, soya
and shellfish. If breastfeeding, the mother should avoid these foods.
•
Simple measures designed to reduce the amount of house dust in the child’s bedroom
and play areas—for example, using barrier encasing for the mattress and pillow and
removing carpets—may help prevent the development of allergy.
•
The role of pets in the development of allergy is controversial. It is currently
recommended that household pets be kept outside and away from the child’s bedroom
and play areas.
Benefits later in life
Breastfeeding confers health advantages that persist into later life. Obviously,
this is a difficult area to study because of time lags and differences in definitions.
In a study of 625 adults aged about 50 years in Holland, information on infant
feeding methods was available. Exclusive breastfeeding seems to have a
protective effect against some risk factors for cardiovascular disease in later life,
including lipoprotein and glucose levels.55 Part A of the ‘Special considerations’
section in the Dietary Guidelines for Children and Adolescents provides further
information about these benefits.
Psychological benefits
Breastfeeding can be an important factor in the bonding between mother and
infant. The interdependence between the breastfeeding mother and infant, the
regular close interaction, and the skin-to-skin contact during breastfeeds
encourage mutual responsiveness and attachment.
Several studies have shown that the method of feeding in early life affects
cognitive development. Children who were breastfed are reported to gain higher
322
Infant Feeding Guidelines for Health Workers
I. E NCOURAGING
AND SUPPORTING BREASTFEEDING IN THE
A USTRALIAN
COMMUNITY
scores on tests of intelligence and language development than those who were
bottle-fed. This beneficial effect becomes more pronounced with increasing
duration of breastfeeding.56,57 Pre-term infants given breastmilk for at least one
month had enhanced cognitive development (approximately 7 IQ units) at 7 to
8 years of age compared with formula-fed pre-term infants.19,20,58–61 This research
has been extended to term infants, with similar results for both cognitive and
visual development. These responses may be related to the higher concentration
of a particular polyunsaturated long-chain fatty acid (docosahexaenoic acid, or
DHA) in breastmilk.62
Benefits to the mother
Health
Breastfeeding shows some protection against premenopausal breast cancer63–67,72
ovarian cancer68,69 and osteoporosis.70,71
The Collaborative Group on Hormonal Factors in Breast Cancer has brought
together worldwide data from epidemiological studies in 30 countries that
included information on breastfeeding patterns and other aspects of
childbearing72 . Their meta-analysis showed a relative risk of breast cancer
reduction of 4·3% (95% CI 2·9–5·8; p<0·0001) for every 12 months of
breastfeeding in addition to a decrease of 7·0% (5·0-9·0; p<0·0001) for each birth.
Breastfeeding hastens uterine involution after birth and helps the mother regain
her pre-pregnancy body weight (providing that breastfeeding continues for more
than seven months).73
Contraceptive effect
Although breastfeeding is not regarded as a reliable method of contraception for
individual women in Australia, it does provide useful benefits on a populationwide basis. If all women in the world stopped breastfeeding, it is estimated that
30 to 50 per cent more children would be born in the following 12 months. The
risk of pregnancy during periods of lactational amenorrhoea is as low as 1.7 per
cent in the first six months74 , and even in developed countries that compares
favourably with barrier methods of contraception, as long as the woman remains
amenorrhoeic.75–77 For example, amenorrhoea is increased by exclusive and more
frequent nursing, especially at night.78
REFERENCES
1.
Cunningham AS, Jelliffe D, Jelliffe EFP. Breastfeeding and health in the
1980s: a global epidemiological review. J Pediatrics 1991;118(5):659–66.
2.
Arifeen SE, Black RE, Caulfield LE, Antelman G, Baqui A. Determinants of
infants growth in the slums of Dhaka: size and maturity at birth,
breastfeeding and morbidity. Eur J Clin Nutr 2001;55(3):167–78.
Infant Feeding Guidelines for Health Workers
323
I. E NCOURAGING
AND SUPPORTING BREASTFEEDING IN THE
A USTRALIAN
COMMUNITY
3.
Heinig MJ. Host defense benefits of breastfeeding for the infant. Effect of
breastfeeding duration and exclusivity. Pediatr Clin North Am
2001;48(1):105–23, ix.
4.
Lawrence RA, Lawrence RM. Breastfeeding: a guide for the medical
profession. 4th edn. St Louis: CV Mosby, 1999.
5.
Heacock H, Jeffery H, Baker J, Page M. Influence of breast versus formula
milk on physiological gastroesophageal reflux in healthy, newborn infants.
J Ped Gastroent Nutr 1992;14(1):41–6.
6.
Habbick BF, Khanna C, To T. Infantile hypertrophic pyloric stenosis: a
study of feeding practices and other possible causes. CMAJ
1989;140(4):401–4.
7.
Woodward A, Douglas RM, Graham N, Miles H. Acute respiratory illness in
Adelaide children: breastfeeding modifies the effects of passive smoking. J
Epidem and Comm Hlth 1990;44:224–30.
8.
Oddy W, Holt P, Sly P, Read A, Landau L, Stanley F et al. Association
between breastfeeding and asthma in 6 year old children: findings of a
prospective birth cohort study. BMJ 1999;319:815–19.
9.
Gdalevich M, Mimouni D, Mimouni M. Breastfeeding and the risk of
bronchial asthma in childhood: a systematic review and meta-analysis of
prospective studies. J Pediatrics 2001;139:261–6.
10.
Fisher J, Birch L, Smiciklas-Wright H, Picciano M. Breast-feeding through
the first year predicts maternal control in feeding and subsequent toddler
energy intakes. JADA 2000;100:641–6.
11.
von Kries RB, Sauerwald T, von Mutius E, Barnert D, Grunert V, von Voss
H. Breast feeding and obesity: cross sectional study. BMJ 1999;319:147–50.
12.
Howie PW, Forsyth JS, Ogston SA, Clark A, Florey CD. Protective effect of
breast feeding against infection. BMJ 1990; 300(6716):11–16.
13.
Sethi D, Cumberland P, Hudson MJ, Rodrigues LC, Wheeler JG, Roberts JA
et al. A study of infectious intestinal disease in England: risk factors
associated with group A rotavirus in children. Epidemiol Infect
2001;126(1):63–70.
14.
Calkins BM, Mendeloff AL. Epidemiology of inflammatory bowel disease.
Epidemiol Rev 1986;8:60–91.
15.
Davis MK, Savitz DA, Graubard BL. Infant feeding and childhood cancer.
Lancet 1988;2(8607):365–8.
16.
Bener A, Denic S, Galadari S. Longer breast-feeding and protection against
childhood leukaemia and lymphomas. Eur J Cancer 2001;37:234–8.
17.
Peters U, Schneeweiss S, Trautwein E, Erbersdoble H. A case-control study
of the effect of infant feeding on celiac disease. Annals Nutr Metab
2001;45:135–9.
324
Infant Feeding Guidelines for Health Workers
I. E NCOURAGING
AND SUPPORTING BREASTFEEDING IN THE
A USTRALIAN
COMMUNITY
18.
Kelly DA, Phillips AD, Elliott EJ, Dias JA, Walker-Smith JA. Rise and fall of
coeliac disease 1960–85. Arch Dis Child 1989;64:1157–60.
19.
Knowles R. Independent advice on the composition and modus operandi
of APMAIF and the scope of the MAIF agreement. Canberra, 2001.
20.
Lang S, Lawrence CJ, Orme RE. Cup feeding: an alternative method to
infant feeding. Arch Dis Child 1994;71:365–9.
21.
Duncan B, Ey J, Holberg CJ, Wright AL, Martinez FD, Taussig LM. Exclusive
breastfeeding for at least four months protects against otitis media.
Pediatrics 1993;91(5):867–72.
22.
Lawrence R. The clinician’s role in teaching proper infant feeding
techniques. J Pediatr 1995;126(6):S112–S117.
23.
Pisacane A, Graziano L, Mazarella G, Scarpellino B, Zona G. Breastfeeding
and urinary tract infection. J Pediatrics 1992;120:87–9.
24.
Coppa GV, Gabrielli O, Giorgi P, Catassi C, Montanari MP, Varaldo PE.
Preliminary study of breastfeeding and bacterial adhesion to ureoepithelial
cells. Lancet 1990;335:569–71.
25.
Cochi SL, Fleming DW, Hightower AW, Limpakamjanarat K, Facklam RR, Smith
JD, et al. Primary invasive Haemophilus influenzae type b disease: a
population-based assessment of risk factors. J Pediatrics 1986;108(6):887–96.
26.
Takala AK, Eskola J, Palmgren J, Ronnberg PR, Kela E, Rekola P, Makela
PH. Risk factors of invasive Haemophilus influenzae type b disease among
children in Finland. J Pediatrics 1989;115:694–701.
27.
Mitchell EA, Scragg R, Stewart AW, Becroft DM, Taylor BJ, Ford RP et al.
Results from the first year of the New Zealand cot death study. NZ Med J
1991;104(906):71–6.
28.
Scragg R, Stewart AW, Mitchell EA, Ford RP, Thompson JM. Public health
policy on bed sharing and smoking in the sudden infant death syndrome.
NZ Med J 1995;108(1001):218–22.
29.
Kiechl-Kohlendorfer U, Peglow UP, Kiechl S, Oberaigner W, Sperl W.
Epidemiology of sudden infant death syndrome SIDS) in the Tyrol before and
after an intervention campaign. Wien Klin Wochenschr 2001;113:27–32.
30.
Lucas A, Cole TJ. Breast milk and neonatal necrotising enterocolitis. Lancet
1990;336:1519–23.
31.
Brown CE, Magnuson B. On the physics of the infant feeding bottle and
middle ear sequela: ear disease in infants can be associated with bottle
feeding. Int J Pediatr Otorhinolaryngol 2000;54(1):13–20.
32.
Jones G, Riley M, Dwyer T. Breastfeeding in early life and bone mass in
prepubertal children: a longitudinal study. Osteoporosis International
2000;11:146–52.
33.
Raisler J, Alexander C, O’Campo P. Breastfeeding and infant illness: a
dose-response relationship? Am J Pub Hlth 1999;89(1):25–30.
Infant Feeding Guidelines for Health Workers
325
I. E NCOURAGING
AND SUPPORTING BREASTFEEDING IN THE
A USTRALIAN
COMMUNITY
34.
Reijneveld SA, Brugman E, Hirasing RA. Infantile colic: maternal smoking
as potential risk factor. Arch Dis Childhood 2000;83(4):302–3.
35.
Lucassen PL, Assendelft WJ, Gubbels JW, van Eijk JT, van Geldrop WJ,
Neven AK. Effectiveness of treatments for infantile colic: systematic
review. BMJ 1998;316:1563–9.
36.
Trenholme A. Colic—more than one solution. BMJ 1998;316(23 May).
37.
Jones, M., A. Swerdlow, et al. Pre-natal and early life risk factors for
childhood onset diabetes mellitus: A record linkage study. Int J
Epidemiol 1998;27: 444–449
38.
Mayer EJ, Hamman RF, Gay EC, Lezotte DC, Savitz DA, Klingensmith GJ.
The Colorado IDDM Registry Reduced risk of IDDM among breast-fed
children. Diabetes 1988;37:1625–32.
39.
Howie PW, Forsyth JS, Ogston SA, Clark A, Florey CD. Protective effect of
breast feeding against infection. BMJ 1990;300(6716):11–16.
40.
Couper J. Environmental triggers of type 1 diabetes. J Paediatr Ch Hlth
2001;37:218–20.
41.
Shu XO, Linet MS, Steinbuch M, Wen WQ, Buckley JD, Neglia JP et al.
Breastfeeding and risk of childhood acute leukemia. JNCI
1999;91(20):1765–72.
42.
Hanson LA. Breastfeeding provides passive and likely long-lasting active
immunity. Ann Allergy Asthma Immunol 1998;81(6):523–33.
43.
Hausman CL, Callahan CA. Breastfeeding: advantages and
contraindications. Del Med J 1989;61(5):219, 223–7.
44.
Donnet-Hughes A, Duc N, Serrant P, Vidal K, Schiffrin E. Bioactive
molecules in milk and their role in health and disease: the role of
transforming growth factor-b. Immunol Cell Biol 2000;78:74–9.
45.
Oddy W. Breastfeeding protects against illness and infection in infants and
children: a review of the evidence. Breastfeed Rev 2001;9:11–18.
46.
Hamosh H. Bioactive factors in human milk. Ped Clin N Am 2001;48(1):69–86.
47.
Tomita M, Takase M, Wakabayashi H, Bellamy W. Anti-microbial peptides
of lactoferrin. Adv Exp Med Biol 1994;357:209–18.
48.
Oppenheimer SJ. Iron and its relation to immunity and infectious disease. J
Nutr 2001;131:616S–633S, 633S–635S.
49.
Renner E. Micronutrients in milk and milk-based food products. London &
New York: Elsevier Applied Science, 1989.
50.
Subcommittee on Nutrition during Lactation. Nutrition during lactation.
Washington DC: National Academy Press, 1991.
51.
Goldman AS, Goldblum R, Garza C. Immunologic components in human
milk in the second year of lactation. Acta Paediatr Scand 1983;72:461–2.
326
Infant Feeding Guidelines for Health Workers
I. E NCOURAGING
AND SUPPORTING BREASTFEEDING IN THE
A USTRALIAN
COMMUNITY
52.
Bahna SL. Factors determining the development of allergy in infants.
Allergy Proc 1992;13:21–5.
53.
Chandra RK. Food allergy and nutrition in early life: implications for later
health. Proc Nutr Soc 2000;59:273–7.
54.
Dandrifosse G, Peulen O, El Khefif N, Deloyer P, Dandrifosse A, Grandfils
C. Are milk polyamines preventive agents against food allergy? Proc Nutr
Soc 2000;59:81–6.
55.
Ravelli ACJ, van der Meulen JHP, Osmond C, Barker DJP, Bleker OP. Infant
feeding and adult glucose tolerance, lipid profile, blood pressure, and
obesity. Arch Dis Child 2000;82:248–52.
56.
Lancet. Breastfeeding and Cognitive development. Lancet 1996;347:1057.
57.
Angelsen NK, Vik T, Jacobsen G, Bakketeig LS. Breast feeding and
cognitive development at age 1 and 5 years. Arch Dis Child
2001;85(3):183–5.
58.
Bauer G, Ewald LS, Hoffman J, Dubanoski R. Breastfeeding and cognitive
development of three year-old children. Psych Reports 1991;68(3)(Pt
2):1218.
59.
Carlson SE, Peeples JM, Werkman SH, Cooke RJ, Wilson WM. Arachidonic
acid (AA) in plasma and red blood cell (RBC) phospholipids (PL) during
follow up of preterm infants: occurrence, dietary determinants and
functional relationships. Second International Conference on the Health
Effects of Omega-3 Fatty Acids in Seafoods. Washington DC, 1990.
60.
Lucas A, Morley R, Cole TJ, Lister G, Leeson-Pope C. Breast milk and
subsequent intelligence quotient in children born preterm. Lancet
1992;339:261–4.
61.
Horwood LJ, Darlow BA, Mogridge N. Breast milk feeding and cognitive
ability at 7–8 years. Arch Dis Child Fetal Neonatal Ed 2001;84(1):F23–F27.
62.
Makrides M, Neumann MA, Byard RW, Simmer K, Gibson RA. Fatty acid
composition of brain, retina and erythrocytes in breast and formula fed
infants. Am J Clin Nutr 1994;60:189–94.
63.
McTiernan A, Thomas DA. Evidence for the protective effect of lactation
on risk of breast cancer in young women. Am J Epidemiol 1986;124:353–8.
64.
Yuan J, Yu MC, Ross RK, Gao Y, Henderson BE. Risk factors for breast
cancer in Chinese women in Shanghai. Cancer Res 1988;48:1949–53.
65.
Siskind V, Schofield F, Rice D, Bain C. Breast cancer and breastfeeding: results
from an Australian case control study. Am J Epidemol 1989;130:229–36.
66.
Brinton LA, Potischman NA, Swanson CA, Schoenberg JB, Coates RJ,
Gammon MD et al. Breastfeeding and breast cancer risk. Cancer Causes
Control 1995;6(3):199–208.
67.
Lipworth L, Bailey LR, Trichopoulos D. History of breastfeeding in relation
to breast cancer risk: a review of the epidemiologic literature. J Nat Cancer
Inst 2000;92:302–12.
Infant Feeding Guidelines for Health Workers
327
I. E NCOURAGING
AND SUPPORTING BREASTFEEDING IN THE
A USTRALIAN
COMMUNITY
68.
Gwinn ML, Lee NC, Rhodes PH, Layde PM, Rubin GL. Pregnancy,
breastfeeding, and oral contraceptives and the risk of epithelial ovarian
cancer. J Clin Epidemiol 1990;43(6):559–68.
69.
Whittemore AS. Characteristics relating to ovarian cancer risk: implications
for prevention and detection. Gynecol Oncol 1994;55(3)(Pt 2):S15–S19.
70.
Cummings SR, Kelsey JL, Nevitt MC, O’Dowd KJ. Epidemiology of
osteoporosis and osteoporotic fractures. Epidemiol Rev 1985;7:178–203.
71.
Labbok MH. Effects of breastfeeding on the mother. Pediatr Clin North Am
2001;48:143–58.
72
CCGHFBC and CGoHFiB. Cancer (2002). “Breast cancer and breastfeeding:
collaborative reanalysis of individual data from 47 epidemiological studies
in 30 countries, including 50 302 women with breast cancer and 96 973
women without the disease.” Lancet 360: 187-195.
73.
Dewey KG, Heinig MJ, Nommsen LA, Peerson JM, Lonnerdal B. Breast-fed
infants are leaner than formula-fed infants at 1 y of age: the DARLING
study. Am J Clin Nutr 1993;57(2):140–5.
74.
Short RV, Lewis PR, Renfree M, Shaw G. Contraceptive effect of extended
lactational amenorrhoea: beyond the Bellagio Concensus. Lancet
1991;337:715–17.
75.
Kennedy KL, Visness CM. Contraceptive efficacy of lactational
amenorrhoea. Lancet 1992;339:227–30.
76.
Gray RH, Campbell OM, Apelo R, Eslami SS, Zacur H, Ramos RM et al. Risk
of ovulation during lactation. Lancet 1990;335:25–9.
77.
Labbok M, Cooney K, Coly S. Guidelines for breastfeeding, family
planning, and the lactational amenorrhea method—LAM. Washington DC:
Institute of Reproductive Health, Georgetown University, 1995.
78.
Heinig MJ, Nommsen-Rivers LA, Peerson JM, Dewey KG. Factors related to
duration of postpartum amenorrhoea among USA women with prolonged
lactation. J Biosoc Sci 1994;26(4):517–27.
328
Infant Feeding Guidelines for Health Workers
I. E NCOURAGING
II
AND SUPPORTING BREASTFEEDING IN THE
A USTRALIAN
COMMUNITY
I N I T I AT I N G , E S TA B L I S H I N G A N D
M A I N TA I N I N G B R E A S T F E E D I N G
Health professionals and voluntary health workers can provide invaluable help
for mothers initiating breastfeeding. Offering factual information and sympathetic
support, demonstrating practical skills, and discussing strategies for problem
solving all work to create a positive environment for breastfeeding. Nevertheless,
it is important to view this role as one of encouragement and support between
mother and worker, always having regard for the mother’s suggestions, concerns
and cultural background.
BREASTFEEDING
E D U C AT I O N F O R PA R E N T S
All women should be informed of the benefits of breastfeeding and the risks of
not breastfeeding. Health professionals should also discuss the management of
breastfeeding with them, and they should be encouraged to use the services
available for antenatal education. The antenatal education should cover the
importance of exclusive breastfeeding for the first six months (including the
nutritional and protective benefits), basic breastfeeding management, and coping
with minor problems. Mothers should also be encouraged to become familiar and
comfortable with handling their breasts. Virtually every mother can breastfeed,
but for some it is not so easy and learning and patience are necessary.1
In many cultures the support of grandmothers and other female relatives is very
important and changes in family structures in Australian society now mean that
the father’s role has assumed greater importance. Education programs should
involve fathers and help them understand the advantages of breastfeeding and
the role they can play in supporting the breastfeeding mother.2,3
Since breastfeeding should be regarded as ‘best practice’, mothers wishing to
initiate formula feeding in a health care institution should sign a form indicating
their informed consent. A policy using standard informed-consent procedures
should be considered; this is required by the Baby Friendly Hospital initiative.
The Baby Friendly Hospital initiative should be implemented in all maternity
facilities in Australia, and a 10-year plan for achieving this should be prepared.
A range of useful, easy-to-read, publications dealing with pregnancy and
breastfeeding is available through antenatal programs, outpatient services, early
childhood centres, community health centres, and medical practitioners.
Hospitals and other agencies should offer information about the Australian
Breastfeeding Association and contact details for local support groups. A
resource list is provided in Appendix I. The ABA’s (Australian Breastfeeding
Infant Feeding Guidelines for Health Workers
329
II. I NITIATING ,
ESTABLISHING AND MAINTAINING BREASTFEEDING
Association) Lactation Resource Centre has breastfeeding information available in
a variety of media. Many of these resources are also available from local ABA
groups.
In hospital during the postnatal period, midwives give support, help and advice
as mothers begin breastfeeding. A lactation consultant is generally available if
someone experiences difficulties and needs specialist advice. Women whose
babies are in special care should be encouraged—using both practical
demonstration and written information—to initiate and maintain an adequate
milk supply. When expression of breastmilk is required, mothers sometimes have
particular difficultly in the immediate post-partum period and may require extra
support.
Following discharge from hospital, support, particularly from home-support
midwives and lactation consultants, should still be available. Mothers are also
encouraged to seek assistance from other people, such as maternal and child
health nurses and ABA counsellors. General practitioners need to be familiar
with breastfeeding or at least with points of referral for assistance.
A N T E N ATA L
A DV I C E
The initial antenatal interview between a woman and her doctor or midwife
should include a careful assessment of a woman’s (and her partner’s) attitudes,
beliefs, expectations, knowledge and experience in relation to infant feeding.
Nursing and medical practitioners often leave discussion of breastfeeding until
later in the pregnancy, but research shows that the earlier in the pregnancy a
decision to breastfeed is made the more likely the breastfeeding will be
successful.4
During antenatal examination the following breast characteristics should be
noted:
•
scars indicating previous surgery
•
extra-large breasts, which may sometimes cause initial difficulties with
attachment
•
nipple or areola eczema or dermatitis
•
minimal or absent development of the mammary tissue—very rare
•
any other breast pathology.
Physical problems that interfere with breastfeeding are extremely rare, and in
most societies breastfeeding has been universal.5,6 Antenatal treatment of inverted
or non-protractile nipples is not recommended: it has been found to be
ineffective and associated with a negative impact on breastfeeding.7 Various
practices for antenatal nipple preparation—including some form of nipple
friction, applications of cream, and antenatal expression of colostrum—have
330
Infant Feeding Guidelines for Health Workers
II. I NITIATING ,
ESTABLISHING AND MAINTAINING BREASTFEEDING
been evaluated by a number of researchers, but no evidence has been found to
support these practices.8 Nor is there evidence to support the commonly held
belief that fair-skinned women are more likely to experience nipple problems.9,10
PHYSIOLOGY
OF BREASTMILK AND BREASTFEEDING
Breastmilk production
The alveoli of the breast mature during pregnancy under the control of the
hormones of pregnancy. Progesterone, prolactin and human placental lactogen
are essential for the final stages of mammary growth and differentiation.
Lactogenesis Stage One is complete by mid-pregnancy; the breast is then able to
secrete and lactose is found in blood and urine. During the first three to four
days post-partum, copious milk secretion occurs; this is Lactogenesis Stage
Two11 , and it involves preparation of the mammary epithelium, progesterone
withdrawal, maintained prolactin levels, and removal of milk from the breast.12
Control of the initiation of lactation after birth
Late in pregnancy, copious milk production is inhibited by the high
concentrations of blood progesterone. In the presence of permissive hormones
(prolactin, cortisol and insulin), the withdrawal of progesterone following the
delivery of the placenta triggers a rapid increase in milk production
approximately 30 to 40 hours after birth.13
The withdrawal of progesterone and the changes in milk composition following
delivery by Caesarean section are similar to those following normal delivery.14
Where possible, management of breastfeeding after a Caesarean birth should be
similar to that after a normal birth. Initiation of lactation is delayed a further 24
hours in women who have type 1 diabetes15 and may be inhibited if there is a
retained placental fragment.16
Milk ‘comes in’ about 48 to 72 hours after birth14 and is perceived by the mother
as the start of lactation. However, milk ‘coming in’ does not mean a sudden
increase in the infant’s milk intake, and the aetiology of associated engorgement
is poorly understood.
Four secretory processes are involved in the production of milk by the mammary
gland:
•
exocytosis
•
fat synthesis and secretion
•
secretion of ions and water
•
transcystosis of immunoglobulins and other substances, from the interstitial
space17 and the paracellular pathway.
Infant Feeding Guidelines for Health Workers
331
II. I NITIATING ,
ESTABLISHING AND MAINTAINING BREASTFEEDING
Regulation of milk production
It has long been known that one of the most important factors in successful
lactation is removing milk from the breasts. Recent research shows that the
lactating mammary gland exercises a local feedback inhibitory control over milk
synthesis, referred to as autocrine control.18,19 It is important to emphasise the
following simple equation:
SUPPLY = DEMAND
The rate of milk production is regulated to match the amount of milk removed
from each breast at each breastfeed. If milk withdrawal has not started within
three days post-partum, the changes in milk composition with lactogenesis are
reversed and the likelihood of the establishment of successful breastfeeding
declines.20,12
Prolactin is secreted by the anterior pituitary gland in response to sucking and
the consequent stimulation of the nerve endings in the nipple and areola. The
secretion is greatest in early lactation and declines to only a small response six
months after birth. There does not appear to be any relationship between the
release of prolactin and milk yield: it is thought that hormonal influences
regulate the maximum potential for milk production in women and that autocrine
control ‘downregulates’ milk synthesis to match the mother’s supply of milk to
the infant’s appetite. In contrast with fat, the concentration of prolactin is high in
the ‘fore milk’ but low in the ‘hind milk’. However, the physiological significance
of these changes is unknown.
A meta-analysis of the milk volumes of exclusively breastfeeding women shows
that milk production is fairly constant across studies from a number of different
countries, at about 800 millilitres a day (820ml; SD 110ml).17
Milk ejection
Within seconds of a baby stimulating the sensory nerve endings around the
nipple by sucking, a pulse of oxytocin is released from the posterior pituitary
gland. Oxytocin stimulates the contraction of myoepithelial cells surrounding the
alveoli, and milk is forced into the ducts and milk sinuses towards the nipple.
This process is known as milk ejection or milk let-down. Multiple releases of
oxytocin can occur during a breastfeed (or during breast expression). Milk
ejection can be blocked by stress, but it rarely seems to be a problem in
breastfeeding mothers; on the other hand, eliciting milk ejection can at times be
a problem for mothers expressing breastmilk.
Breastmilk composition
Human breastmilk is a very complex secretion, consisting of thousands of
compounds and cellular components.21 Furthermore, the composition of milk
varies greatly between different species, and mature human milk tends to fall at
332
Infant Feeding Guidelines for Health Workers
II. I NITIATING ,
ESTABLISHING AND MAINTAINING BREASTFEEDING
one extreme (see Tables II.1 and II.2), having very low concentrations of protein
and sodium chloride and high concentrations of lactose and oligosaccharides.22
Appendix G provides a detailed table of composition. Human milk has a
characteristic very pale whitish-blue appearance. One important component is, of
course, water: this meets all the infant’s requirements, and for at least six months
no additional fluids are required when breastfeeding.
Breastmilk’s whiteness is a result of its fat content, so hind milk, which usually
has a higher fat content than fore milk, has a whiter appearance. It is misleading
to describe breastmilk as ‘thin’ or ‘watery’: it contains the same energy and total
solids content as cow’s milk. Precipitation of the casein curd from milk produces
whey that contains soluble proteins, lactose and many water-soluble minor
components.
Table II.1
Composition of mature human milk and cow’s milk and
composition of infant formula
Component
Energy (kJ)
Energy (kcal)
Protein (g)
Fat (g)
Lactose (g)
Mean value for
mature human milk
280
Cow’s milk
Infant formula a
276
273–285
67
66
65–68
1.3b
3.2
1.5–1.7
4.2
3.9
3.6–3.9
7
4.6
7.0–7.6
Sodium (mg)
15
55
14–17
Chloride (mg)
43
97
Calcium (mg)
35
120
42–55
Phosphorus (mg)
15
92
21–32
Iron (µg)
76
c
60
700–800
Vitamin A (µg)
60
35
Vitamin C (mg)
3.8
1.8
Vitamin D (µg)
0.01
0.08
–
–
Linoleic acid (mg)
5.4–7.1
Minimum 190mg
Potassium (mg)
60-70
–
56–59
Magnesium (mg)
3.0-3.5
–
4.5–5.3
–
–
Average 290
Renal solute load
– Zero.
a.
Ranges for infant formula products (from birth, cow’s milk–based, whey:casein ratio of
60:40).
b.
True protein = 0.85g per 100ml, excluding non-protein nitrogen, although a proportion of
the non-protein nitrogen is used for the maintenance and growth of infants.
c.
Iron in breastmilk is highly bioavailable, with absorption of 50–70 per cent.
d.
Iron in infant formula is poorly bioavailable, with only about 10 per cent absorption.
Sources: Reference 23 ; data for the average composition of infant formula supplied by the Infant
Formula Manufacturers Association of Australia Inc. (2001).
Infant Feeding Guidelines for Health Workers
333
II. I NITIATING ,
Table II.2
ESTABLISHING AND MAINTAINING BREASTFEEDING
Composition of milk from selected species: a comparison3
(grams per litre)
Species
Lactose
Protein
Fat
Human
70
8
41
Horse
62
19
13
Pig
55
56
83
Cow
48
32
37
Goat
41
29
38
Rabbit
22
103
151
1
87
422
Harp seal
The increase in the fat content as milk is withdrawn from the breast is a feature
of mammalian lactation. Much emphasis has been given to the significance of
this change for an infant’s energy intake, but the physiology of milk synthesis,
secretion and removal is not fully understood. There are only two ways a
breastfed baby can obtain a higher energy intake over a 24-hour period: if the
mother produces more milk; or if the mother produces the same volume of milk
with a higher fat content. Since animal studies demonstrate that it is indeed very
difficult to alter the average daily composition of milk, it is not surprising that
research has shown that variations in the intervals between breastfeeds and in
the amount of milk withdrawn during a breastfeed explain only a small
proportion (20 per cent) of the variation in the fat content of breastmilk. (Daly,
S. E. J., A. Di Rosso, et al. (1993). Degree of breast emptying explains changes in
the fat content, but not fatty acid composition, of human milk. Experimental
Physiology 78: 741–55.)
One factor that does determine the fat content of breastmilk is the fullness of the
breast. The first milk withdrawn from a full breast has a low fat content, and the
fat content begins to rise more rapidly after the removal of about 40 per cent of
the breast’s storage capacity. Depending on both the fullness and the storage
capacity of the mother’s breasts, the fat content at the end of one breastfeed (the
hind milk) may be either lower or higher than that at the beginning (the fore
milk) of a subsequent breastfeed.24
Colostrum, which is produced in the breast during late pregnancy and for the
first 30 to 40 hours after birth, is yellowish and thicker than mature milk, and it
contains a high concentration of immunoglobulins.
Individual variation
Mothers and babies vary considerably in a range of aspects of breastfeeding.25
The anatomy of the breast varies greatly between women. Some women can
store up to six times more milk than other women.26 As a result, women with
large storage capacity have great flexibility in their frequency of breastfeeding,
while women with a smaller storage capacity need to feed more frequently to
334
Infant Feeding Guidelines for Health Workers
II. I NITIATING ,
ESTABLISHING AND MAINTAINING BREASTFEEDING
maintain similar levels of milk production. This latter group should spread
breastfeeds fairly evenly over the 24-hour day. This highlights the importance of
infant-led feeding—allowing the infant to regulate intake according to need. It
also shows the value of letting the infant ‘finish’ the feed in their own time, not
according to the clock.
Apart from storage capacity, there is considerable variability in the rate of milk
flow, the nature of mouth–breast positioning, and the changes in milk
composition during a feed. Advice should be tailored to each mother and her
infant’s circumstances, rather than arbitrary rules on timing and positioning being
imposed.27
Maternal nutrition and lactation
Good nutrition is very important for the health and wellbeing of all women and
particularly for lactating women, who have additional nutritional requirements.28
The additional nutrient requirements are documented in the recommended
dietary intakes.29 While milk intakes of infants are quite variable, average intakes
of exclusively breastfed infants (defined as those who receive no other foods or
fluids) range from 710grams per day at 0–2 months of age to 900g/day at 9–11
months of age. For partially breastfed infants (defined as those who receive
breast milk plus other foods or fluids), average intake decreases from 640–687g/
day at 0–5 months of age to 436–448g/day after 9 months of age.30 The amount
of additional energy that is required to produce these amounts of milk is shown
in Table II.3.
Table II.3
Summary of additional energy needs during lactation30
Milk volume
(ml/day)
Energy cost
of milk
(kcal/day) a
Energy cost of
milk synthesis
(kcal/day) b
Full costs
(kcal/day)
Allowing
for fat loss
(kcal/day) c
0–2
710
476
119
595
440
3–8
800
536
134
670
515
0–5
660
442
111
553
398
6–8
590
395
99
494
339
9+
440
295
74
369
369
Breastfeeding
(months)
Exclusively
Partially
a. Using 0.67 kcal/g.
b. Assuming 80% efficiency.
c. Assuming about 500 g/month (16.7 g/day) up to 8 months (none thereafter) at 9.3 kcal/g.
Diet can influence the chemical constituents of breastmilk, as studies on vitamin
A and lipids have shown.31–33 The principles of the Australian Guide to Healthy
Eating remain the basis of an appropriate diet. Mothers who are on very
restrictive diets—vegans, for example—will need specific assessment to ensure
that they are not deficient in nutrients such as vitamin B12.
Infant Feeding Guidelines for Health Workers
335
II. I NITIATING ,
ESTABLISHING AND MAINTAINING BREASTFEEDING
Attaching and positioning at the breast: the key to successful breastfeeding
An infant’s ‘milking’ of the breast is dependent on two things: ‘latching onto’
sufficient breast tissue containing the lactiferous sinuses or milk glands; and the
correct sucking or milking action with the tongue. Correct positioning at the
breast and correct latching-on and milking action are vital for the efficient
removal of milk from the breast without nipple pain or trauma.
•
The mother should be seated comfortably in an upright position, so that
her breasts fall naturally. She should have good support for her back, arms
and feet. The infant should be unwrapped to allow easy handling and
avoid overheating.
•
If the nipple is erect, support the outer area of the breast with a ‘C’ hold,
being careful not to alter the breast position. If the nipple is flat or
inverted, move the ‘C’ hold under the breast and shape the breast between
the thumb and index finger, well back from the areola.
•
The infant should be supported behind the shoulders and facing the
mother, with his or her body flexed around the mother’s body. The
position must be a comfortable drinking position for the infant.
•
The infant’s top lip should be level with the mother’s nipple, and a wide
gape should be encouraged by teasing the infant’s mouth with the nipple.
•
When the infant gapes widely, bring him or her quickly onto the breast. So
that the infant will take a good mouthful of breast, it is always advisable to
bring the infant to the breast, not the breast to the infant.
•
The chin should be tucked well into the breast, and the infant’s mouth
should be wide open, with the bottom lip curled back. More areola will be
evident above the infant’s top lip than below the bottom lip. When
positioning is correct it is not necessary to hold the breast away from the
infant’s nose.
•
After an initial short burst of sucking, the rhythm will be slow and even,
with deep jaw movements that should not cause the mother any
discomfort. Pauses are a normal part of the feed and they become more
frequent as the feed continues.
•
If the cheeks are being sucked in or there is audible ‘clicking’, the infant is
not latched on correctly.
•
The infant should stop feeding of his or her own accord by coming off the
breast spontaneously. The nipple will appear slightly elongated but there
should be no evidence of trauma.
Women normally experience heightened nipple sensitivity and tenderness in the
first few days after birth but this subsides as breastfeeding becomes established.
If nipples are already sore or cracked—and even if positioning and attaching
errors are corrected—they may continue to be tender at the start and end of
feeds for some time. The mother should be reassured that the discomfort will
diminish as the nipples heal and feeding continues.
If the baby is correctly positioned and attached and is sucking correctly there
should be no nipple pain.
336
Infant Feeding Guidelines for Health Workers
II. I NITIATING ,
ESTABLISHING AND MAINTAINING BREASTFEEDING
Signs of a functioning let-down reflex
Although some mothers report no noticeable signs of the let-down reflex, many
mothers do notice one or more of the following signs:
•
tingling or prickling—‘pins and needles’, which may take several weeks to
develop
•
a sudden feeling of fullness
•
an increase in skin temperature
•
a feeling of wellbeing or relaxation
•
for some mothers, pain or nausea
•
dripping, leaking or spurting from the unsucked breast
•
for some mothers, an intense thirst
•
uterine contractions accompanied by a gush of lochia in the immediate
postpartum period—more common in multiparas.
There may also be noticeable changes in the infant’s sucking and swallowing
pattern. This sign is more consistent than any of the others, but it may take the
mother several days of observation after her the milk ‘comes in’ to recognise the
changes. There are two types of sucking: non-nutritive and nutritive.
Non-nutritive sucking occurs in short, sharp bursts at a rate of up to two per
second. Nutritive sucking occurs at a slower rate—about one per second. Once
the milk has started to flow the sucking continues at a regular rate. As the feed
progresses sucking becomes fragmented into bursts, usually separated by pauses
of longer duration than are seen in the non-nutritive phase. At the start of each
burst there may be two to three fast sucks typical of non-nutritive sucking—
termed restart sucking.
At all times the aim of the health professional should be to help the mother
achieve independence in breastfeeding and caring for her infant. If mothers are
managing well—particularly mothers who have previously breastfed
successfully—advice from midwives and others may be inappropriate if it is not
asked for.
THE
FIRST BREASTFEED
Baby Friendly training will inform all staff of what is required to promote and
support breastfeeding. There is evidence that starting to breastfeed within the
first hour or so of birth is good for both mother and infant and for continued
breastfeeding.34,35 A successful first breastfeed has a number of positive effects:
•
It builds the mother’s confidence in her ability to breastfeed.
•
The infant starts to receive the immunological benefits of colostrum.
•
The infant’s digestion and bowel function are stimulated.
•
Correct sucking at the breast at this stage may avert later sucking
difficulties.
•
The bonding and attachment between mother and infant are enhanced.
Infant Feeding Guidelines for Health Workers
337
II. I NITIATING ,
ESTABLISHING AND MAINTAINING BREASTFEEDING
Ideally, uninterrupted skin-to-skin contact should be maintained following birth.
Common practices such as early weighing, bathing the infant, or passing him or
her around should be delayed until later. Good antenatal education will help
with parents’ expectations in this regard.
When the infant indicates an interest in sucking, the midwife can guide the
mother into a comfortable position that will enable the infant to latch on
correctly.
Unless there is a medical reason (such as prematurity) mother and infant should
remain together, so that breastfeeding begins and proceeds according to the
infant’s needs—without restriction on the number or length of feeds. It should
also be emphasised, however, that, although early contact between mother and
infant is the ideal, when this is not possible it does not preclude successful
breastfeeding. In many cultures, the mother may not have contact with her infant
for many hours, yet successful breastfeeding is almost universal.
REFERENCES
1.
James J. Ready for birth—but what about breastfeeding? Breastfeed Rev
1999;7(3):29–32.
2.
Scott JA, Binns CW. Factors associated with the initiation and duration of
breast feeding. Aust J Nutr Diet 1998;55(2):51–61.
3.
Scott JA, Aitkin I, Binns CW, Aroni RA. Factors associated with the duration
of breastfeeding amongst women in Perth, Australia. Acta Paediatr Scand
1999;88(4):416–21.
4.
Scott JA, Binns CW, Aroni RA. The influence of reported paternal attitudes
on the decision to breastfeed. J Paed Child Hlth 1997;33:305–7.
5.
Dettwyler K. A time to wean. In: Stuart-Macadam P, Dettwyler K, eds.
Breastfeeding: biocultural perspectives. New York: Aldine de Gruytyer,
1995.
6.
Binns CW. Food, sickness and death in children of the highlands of Papua
New Guinea. J Trop Pediatr Environ Child Hlth 1976;22(1):9–11.
7.
Alexander JM, Grant AM, Campbell MJ. Randomised controlled trial of
breast shells and Hoffman’s exercises for inverted and non-protractile
nipples. BMJ 1992;304:1030–2.
8.
Scott-Brown MS, Hurlock JT. Preparation of the breast for breastfeeding.
Nursing Res 1975;24:448–51.
9.
Gans B. Breast and nipple pain in the early stages of lactation. BMJ
1958;(Oct. 4):830–4.
10.
Brockway L. Hair colour & problems in breast feeding. Midwives Chron
1986;99(1178):66–7.
338
Infant Feeding Guidelines for Health Workers
II. I NITIATING ,
ESTABLISHING AND MAINTAINING BREASTFEEDING
11.
Hartmann P. Changes in the composition and yield of the mammary
secretion of cows during the initiation of lactation. J Endocrinol
1973;59:231–47.
12.
Neville MC, Morton J, Umemura S. Lactogenesis: the transition from
pregnancy to lactation. Pediat Clin Nth Am 2001;48(1):36–51.
13.
Kulski JK, Smith M, Hartmann PE. Perinatal concentrations of progesterone,
lactose and á-lactalbumin in the mammary secretion of women. J Endocrin
1977;74:509–10.
14.
Kulski JK, Smith M, Hartmann PE. Normal and caesarian section delivery
and the initiation of lactation in women. Aust J Exp Biol Med Sci
1981;59:405–12.
15.
Arthur PG, Smith M, Hartmann PE. Milk lactose, citrate and glucose as
markers of lactogenesis in normal and diabetic women. J Paediatr
Gastroentero Nutr 1989;9(4):488–96.
16.
Neifert MR, McDonough SL, Neville MC. Failure of lactogenesis associated
with placental retention. Am J Obstet Gynaec 1982;140:477–9.
17.
Neville MC. Anatomy and physiology of lactation. Pediatr Clin Nth Am
2001;48(1):13–34.
18.
Hartmann P, Sherriff J, Kent J. Maternal nutrition and the regulation of milk
synthesis. Proc Nutr Soc 1995;54(2):379–89.
19.
Wilde CJ, Addey VP, Boddy LM, Peaker M. Autocrine regulation of milk
secretion by a protein in milk. Biochem J 1995;305:51–8.
20.
Kulski JK, Hartmann P, Martin J. Effects of bromocritine mesylate on the
composition of the mammary secretion in non-breastfeeding women.
Obstet Gynecol 1978;52:38–42.
21.
Renner E. Micronutrients in milk and milk-based food products. London &
New York: Elsevier Applied Science, 1989.
22.
Oftedal OT. Milk composition, milk yield and energy output at peak
lactation: a comparative review. In: Peaker M, Vernon RG, Knight CH, eds.
Physiological strategies in lactation: symposia of the Zoological Society of
London. London: Academic Press, 1984.
23.
Department of Health. Weaning and the weaning diet. Report of the
Working Group on the Weaning Diet of the Committee on Medical Aspects
of Food Policy. Report no. 45. London, 1994.
24.
Daly SEJ, Di Rosso A, Owens RA, Hartmann PE. Degree of breast emptying
explains changes in the fat content, but not fatty acid composition, of
human milk. Experim Physiol 1993;78:741–55.
25.
Daly SEJ, Owens RA, Hartmann PE. The short-term synthesis and infant
regulated removal of milk in lactating women. Experim Physiol
1993;78:209–20.
Infant Feeding Guidelines for Health Workers
339
II. I NITIATING ,
ESTABLISHING AND MAINTAINING BREASTFEEDING
26.
Daly SEJ, Hartmann PE. Infant demand and milk supply. Part 2: the short term
control of milk synthesis in lactating women. J Hum Lact 1995;11:21–6.
27.
Dewey KG, Lonnerdal B. Infant self-regulation of breast milk intake. Acta
Paediatr Scand 1986;75:893–8.
28.
National Health and Medical Research Council. Dietary Guidelines for
Children and Adolescents, Canberra: AGPS, 1995.
29.
National Health and Medical Research Council. Recommended Dietary
Intakes for Use in Australia, Canberra: AGPS, 1991.
30.
Dewey K. Ann Rev Nutr 1997;17:19–36.
31.
Canfield L, Kaminsky RG, Taren DL, Shaw E and Sander JK. European
Journal of Nutrition, 2001;40:30–8.
32.
Neville MC and Picciano M. Ann Review Nutrition 1997;17:159–84.
33.
Gonzalez-Coss 1T, Habicht J, Rasmussen K and Delgado H. J Nutrition
1998;128:1692–702.
34.
De Chateau P, Holmberg H, Jakobsson K, Winberg J. A study of factors
promoting and inhibiting lactation. Develop Med Child Neurol
1977;19(5):575–84.
35.
Salariya EM, Easton PM, Carter JI. Duration of breast-feeding after early
initiation and frequent feeding. Lancet 1978;ii:1141–3.
340
Infant Feeding Guidelines for Health Workers
II. I NITIATING ,
III
ESTABLISHING AND MAINTAINING BREASTFEEDING
B R E A S T F E E D I N G : E A R LY D AY S
Breastfeeding
No-one ever warned me just how hard it is to get breastfeeding
established. In my mind I knew that this was the best food for my new
baby and certainly the only option as far as convenience was concerned,
however I found it quite frustrating (and painful) to learn this new skill at
first. It was an eye-opener when I realised that the 2–3 hours between
feeds included the time that you took feeding, which meant that sometimes
there was a break of less than one hour between feeds to get anything else
done. I relied a lot on the support and encouragement that I received from
community nurses.
——A senior nutritionist, writing about her own experience
[See also ‘Ten steps to successful breastfeeding’, in the Introduction.]
THE
N A T U R A L P AT T E R N S O F B R E A S T F E E D I N G
Unrestricted feeding, both day and night, is an important factor in successfully
establishing breastfeeding and results in optimum milk production. An infant will
vary the feeds according to his or her needs and the rate of milk transfer. The
mother should be encouraged to allow the infant to finish the first breast before
offering the second one. Both breasts should be offered at each feed. The infant
may or may not feed from the second breast, depending on his or her appetite.
With correct positioning and unrestricted feeding, breast engorgement is unlikely
to occur or will occur only briefly.
THE
S L E E P Y I N FA N T
After the initial alert period following birth, some infants become very sleepy for
the next 24 hours or so. This may be a consequence of the birth experience or of
maternal analgesia during labour, or both.
If an infant has fed well at least once in the first day since birth there is no cause
for concern. During the daytime if the infant does not ‘ask’ for a feed after about
five hours, he or she can be roused and put to the breast. If the infant has not
been to the breast at least once, every effort should be made to encourage him
or her to breastfeed.
Infant Feeding Guidelines for Health Workers
341
III.
BREASTFEEDING : EARLY DAYS
Strategies for sleepy infants
A number of strategies can be used to rouse sleepy infants and encourage them
to breastfeed:
•
Changing the nappy often wakes an infant.
•
Expressing a little colostrum and giving it by teaspoon, syringe or cup can
give the infant the ‘taste’ and he or she will then start seeking the breast.
•
Unwrapping the infant, talking to him or her, and gently stroking the legs
and abdomen may stimulate him/her to wake and start seeking the breast.
•
Sometimes getting the infant to suck on a finger will stimulate the sucking
reflex; stroking the lip and cheek will stimulate the rooting reflex.
•
The mother can cuddle her infant as often as she likes, and holding the
infant against her breast may stimulate seeking.
•
If the infant does not take the breast in spite of all efforts and is otherwise
well, it is essential to express the colostrum and feed it by teaspoon,
syringe or cup.
Most infants soon recover from the initial sleepy period and begin to seek feeds
frequently. This can be very tiring for the mother, but the midwife can prepare
her for this and reassure her about the benefits of early frequent feeding. This
gives the infant colostrum, stimulates full milk production, and reduces the
chance of breast engorgement (see Section IV).
Persistent sleepiness
Occasionally sleepiness persists beyond the first day. The infant may be one of
the few who do not wake for feeds and so fail to thrive as well as expected. It is
important that any medical causes are excluded before the infant is regarded as a
‘sleepy’ baby. This will be apparent after several days. If all other causes are
excluded—particularly incorrect attaching to and sucking at the breast—the
mother must make sure she feeds the infant at least six times every 24 hours.
(Six feeds would be a minimum: mothers should expect that they may be
feeding their newborn babies eight to 10 times in a 24-hour period, sometimes
more often.)
These infants usually start feeding more frequently as they grow bigger and
older. Before going home, the mother should be alerted to the possible need to
offer more frequent feeds for some time to come.
THE
U N S E T T L E D I N FA N T
Most infants have unsettled periods, which can be distressing for parents even
though the causes (when they can be found) are usually minor. The midwife and
mother may need to evaluate the feeding progress and develop strategies for
settling the infant. Health professionals and parents should be aware that the use
342
Infant Feeding Guidelines for Health Workers
III.
BREASTFEEDING : EARLY DAYS
of bottles and dummies is usually inappropriate at this early stage of
breastfeeding.
Unsettled periods may occur before the mother’s milk ‘comes in’. It is common
for infants to want to feed frequently before the milk comes in, particularly in
the second 24 hours. The mother may need to be reassured that this is normal
and that frequent feeds help stimulate the milk supply and reduce the likelihood
of engorgement. Frequent feeds can, however, present a problem for tired
mothers during the night. In many cultures it is common for mothers to sleep
with their infants. The safest way of co-sleeping is for the infant to have a
bassinet next to the mother’s bed. If a mother does choose to sleep with an
infant, ‘safe sleeping’ should be emphasised; this includes avoiding
hyperthermia, not using soft pillows or bed coverings, avoiding smoking, and
avoiding drugs that cause drowsiness (such as alcohol). Sometimes it is
appropriate for the midwife to offer the mother time away from the infant, the
midwife caring for the infant between feeds while the mother sleeps or rests.
After the milk comes in the following factors should be assessed:
•
Is the infant attached properly and getting the milk?
•
Is the mother leaving the infant on the breast until he or she comes off
naturally?
•
Is the infant sucking properly?
Some infants take several days to establish a good sucking technique. Until that
happens, the breastmilk may need to be expressed and given to the infant after
the breastfeed, by spoon, cup or syringe.
Unrealistic expectations
Because of entrenched social attitudes about sleeping and eating schedules,
many people think infants sleep three to four hours in regular patterns around
the clock. Infants’ individuality and variations in their appetites should be
carefully explained to new mothers.
Is the infant needing attention other than for breastfeeding?
Infants need contact for comfort in addition to food. The mother and the health
professional should together consider strategies and options for helping restless
or crying infants (see ‘The crying infant’ in Section IV).
EXCLUSIVE
BREASTFEEDING
Exclusive breastfeeding—that is, no use of breastmilk substitutes—ensures that
an infant receives the full nutritional and protective benefits of colostrum and
breastmilk.
Infant Feeding Guidelines for Health Workers
343
III.
BREASTFEEDING : EARLY DAYS
Detrimental effects of bottle and dummy use
Early use of bottles and dummies (pacifiers), especially before the first
breastfeed, can interfere with the natural processes of breastfeeding, reducing
the infant’s sucking capacity and the stimulation of the mother’s breasts. The
likely result is delayed or poor establishment of lactation.1 The most important
risks associated with use of a pacifier and the non-nutritive sucking habit it
promotes are failure of breastfeeding, dental deformities, recurrent acute otitis
media, and the risk of accidents. Latex allergy, tooth decay, oral ulcers and sleep
disorders are other possible problems; the WHO has published a review of
evidence supporting this statement.2 A longitudinal study in New Zealand found
the use of dummies to be very widespread, at around 80 per cent.3 The authors
followed 351 mothers and their infants for 12 months to assess the impact of the
use of pacifiers on the duration of breastfeeding; they showed that breastfeeding
duration was decreased by pacifier use.
The detrimental effects of giving breastmilk substitutes
Offering complementary feeds—water, glucose or milk formula—when there is
no medical reason has been shown to adversely affect the establishment and
maintenance of successful breastfeeding.4–7
Complementary feeds
If an infant is unable to take all the feeds directly at the breast, expressed
breastmilk should be the preferred method of feeding the infant (see Section V).
Midwifery staff should seek the informed consent of the mother before
complementing or supplementing infant feeding with fluids other than
breastmilk. Sample consent forms for complementary feeds are shown in
Appendix H.
If lactation is not fully established, the mother should be helped to understand
the processes of lactation and breastfeeding techniques. She should also be
encouraged to call on support people or groups when in need; these can include
home care, home midwifery services, lactation consultants, and early childhood
nurses. The Australian Breastfeeding Association offers counselling and motherto-mother support seven days a week.
Breastfeeding of premature infants is occasionally complemented by formula
feeding (usually a special product for low-birthweight infants) while in hospital.
If these feeds are to be continued after discharge, the mother’s competence in
formula preparation and bottle feeding should be ensured and follow-up care
organised. In particular, the mother will benefit from information about how she
can establish full breastfeeding by:
•
gradually increasing her milk supply by expressing after feeds
•
increasing the number of breastfeeds per day
344
Infant Feeding Guidelines for Health Workers
III.
or
•
BREASTFEEDING : EARLY DAYS
gradually reducing the amount of bottle complements—by putting slightly
less in the bottle each time or by cutting down the complement one feed
at a time, daily or on alternate days, or more slowly if appropriate.
Even if the mother does need to continue giving complementary feeds
indefinitely, it should not be suggested that the infant be totally formula fed. The
mother should be encouraged to continue breastfeeding before offering the
complementary feed.
ROOMING-IN
Rooming-in 24 hours a day is the usual practice in most hospitals. This means
the infant is with the mother from birth. The practice:
•
facilitates unrestricted breastfeeding
•
promotes mother–infant bonding
•
helps prevent cross-infection
•
allows both mother and infant contact with the father and other family
members
•
helps the mother learn about her infant’s patterns of behaviour and
feeding, so she learns sooner to manage and care for the infant.
After delivery the infant should remain with the mother, so that they are
transferred to the postnatal ward together. The infant’s cot remains beside the
mother’s bed. Contrary to popular opinion, mothers who have their infants with
them at night lose no more sleep than mothers whose infants are in a nursery.8
Occasional use of the nursery or staff care during the day or night is an option
for the mother. If she does choose to place her infant with staff at night, the
infant should be taken to her for breastfeeds or the mother should be
encouraged and helped to express breastmilk.
After delivery by Caesarean section an infant is sometimes placed in the nursery.
When the mother returns to the postnatal ward, though, the infant should be in
her room. Initially, rooming-in after Caesarean section calls for extra support
from the midwife.
M O N I TO R I N G
A N I N FA N T ’ S P RO G R E S S
To ensure that an infant is well and to allay any concerns the mother might
have, it is important that both mother and health professional have a means of
assessing the infant’s progress. Observing the infant and his or her behaviour
and documenting his/her feeding and output contribute to this assessment.
A healthy infant is alert and responsive when awake and has bright eyes and
firm skin with good elasticity. The adequacy of breastfeeding (with no breastmilk
Infant Feeding Guidelines for Health Workers
345
III.
BREASTFEEDING : EARLY DAYS
substitutes) can be assessed by observing the infant’s behaviour, feeding
patterns, urine output and bowel actions, and by checking the infant’s weight
and using growth reference charts.
Infants’ behaviour
Infants are generally content after feeds, although most have one period each
day when they want to feed frequently and will not settle (see ‘The crying infant’
in Section IV). This often happens in the evening, and it should not be
interpreted as ‘running out of milk at the end of the day’: milk production is
continuous over a 24-hour period, although the rate of production varies
according to the fullness of the breast.9
Feeding patterns
Infants usually breastfeed eight to 10 times, or even 12 times, during a 24-hour
period. Some mothers expect their infant to feed on a regular four-hourly
pattern, but they should be reassured that this is not a common pattern of
feeding. The length of each feed is very variable, and during the early neonatal
period feeds can take about an hour. If an infant is spending long periods on the
first breast, however, there is a good chance there is a feeding problem: perhaps
he or she is not attached properly and cannot milk the lactiferous sinuses
effectively. The positioning and attachment of an infant should be carefully
monitored in the early days.
Urine output
Until the mother’s milk comes in an infant will not pass urine often; provided he
or she voids once or more every 24 hours there is no cause for concern. As the
milk volume increases, the infant’s urine output will increase, and a cloth nappy
will be soaked with pale or colourless urine six or more times every 24 hours.
Disposable nappies tend to mask wetness and may need close inspection to
determine whether the infant has urinated. If an infant’s urine becomes scanty
and strongly yellow in colour—suggesting the development of dehydration—
feeding frequency and milk transfer should be evaluated.
Bowel actions
An infant’s first bowel actions consist of meconium, which is greenish-black.
After 24 to 48 hours the meconium changes—first to brownish ‘transitional’ stools
and then, by the third or fourth day, to typical breastfed infants’ stools, which
are loose and mustard-yellow (sometimes with milk curds), although occasionally
they are green or orange. None of these changes is significant in a healthy
breastfed infant. Frequent, runny stools do not mean a breastfed infant has
diarrhoea or lactose intolerance: they should simply be viewed as evidence of
sufficient milk. Diarrhoea entails very frequent watery stools.
346
Infant Feeding Guidelines for Health Workers
III.
BREASTFEEDING : EARLY DAYS
The number of bowel motions of breastfed infants tends to decrease between
6 weeks and 3 months of age. Intervals of several days or more between stools
are common. If the infant is receiving breastmilk only and no other food or fluid,
there is no cause for concern. Infants who are having formula for most of their
feeds tend to pass fewer motions than breastfed infants—once a day or every
second day, often khaki-coloured and with a Plasticine-like consistency. Mothers
need to be aware of the potential change in their infant’s motions when they are
weaning.
Constipation refers to the hard, dry consistency of the stools, not the frequency
of bowel motions. It has been observed that hard, dry bowel motions are more
likely to occur after formula or solids have been introduced. Exclusively
breastfed infants are rarely constipated. Many breastfed infants show signs of
discomfort or distress before passing a motion: this is a normal response to body
sensations they are not used to; it does not indicate pain or constipation.
Infants’ weight
A newborn infant adapts to the small amounts of colostrum available. With the
passage of meconium and loss of water by evaporation, an initial weight loss of
5–10 per cent of the birthweight is normal. Between 4 and 6 days of age the
infant starts to regain weight and by 2 weeks of age should have returned to
their birthweight. If the infant appears contented and healthy there should be no
immediate cause for concern about minor fluctuations in weight—which can
result from factors as simple as passing a stool, urinating, or a recent feed. Static
weight or suspected weight loss over several days should, however, be carefully
examined. Further investigation to exclude disease should include evaluating
feeding frequency and milk transfer.
It is recommended that an appropriate growth chart be used. In general, weight
gain should be assessed on a four-week average. The rate of growth is the most
important factor, although if growth is above the 95th percentile or below the
5th, or crosses these percentiles, further investigation is required. A growth
reference chart should always be used, but the following is a rough guide:
•
birth to age 3 months—a gain of 150–200 grams a week
•
age 3 to 6 months—a gain of 100–150 grams a week
•
age 6 to 12 months—a gain of 70–90 grams a week.
Percentile growth reference charts
Percentile charts are used to assess growth. While the international growth
reference used in Australia was originally derived from US data, it is applicable
to Australia. The charts should be used as a reference for monitoring, not as an
absolute standard. The body size of infants and their growth rates are determined
mainly by nutritional status, and the weights of individual infants often cross
percentiles in the first few months after birth. Birthweight is influenced more by
nutritional conditions in utero and maternal health—for example, mothers who
Infant Feeding Guidelines for Health Workers
347
III.
BREASTFEEDING : EARLY DAYS
smoke or have pregnancy-induced hypertension have smaller babies—than by
genetic considerations. 10
The weight percentiles for breastfed infants differ only slightly from those for
bottle-fed infants. In general, breastfed infants tend to grow rapidly in the first
two to three months of life but then at a slightly slower rate than the current
percentile charts. At 8–11 months of age, infants who have been exclusively
breastfed for six months will have a weight-for-age Z score of around –0.5 to –
0.6.11 Height for age is generally less affected. Studies have confirmed minimal
differences between ethnic groups.12,13 Part B of the ‘Special considerations’
section in the Dietary Guidelines for Children and Adolescents discuses growth
and growth references in detail.
In Australia, the growth rate of Aboriginal infants who are exclusively breastfed
follows the WHO–NCHS reference until about 6 months of age, when it begins to
fall away.14,15 This suggests that the differences between breastfed infants and the
CDC–WHO reference are not very significant for Australia, particularly if the
reference charts are used for monitoring growth and not as a standard.
Whitehead and Paul16 reviewed the use of doubly labelled water techniques to
study energy dynamics in breastfed infants. This approach indicated that
460 kilojoules (110 kilocalories) per kilogram per day at age 1 month and 397kJ
and 355kJ (95kcal and 85kcal) per kilogram per day at 3 and 6 months
respectively would provide sufficient nutrients, given the high bioavailability of
the nutrients in breastmilk. This means that a breastmilk intake of 850 millilitres
a day would cover the dietary energy needs of the average infant growing along
the 50th percentile until at least age 4 months, but after that there may be some
decline in the growth percentile of currently used references.
The extent to which serial data for an infant can deviate from a given percentile
range before concern is warranted depends on the infant’s age, their position in
the percentile range, and the length of time for which the rate of growth deviates
from the norm. Because of the slightly slower growth velocity of breastfed
infants, they may appear to be faltering after two to three months when they are
plotted on current growth charts, even when they are healthy and thriving.17
Health professionals may mistakenly believe that the mother’s milk production is
inadequate and suggest starting complementary formula.
In general, the more pronounced the change in growth rate, the younger the
infant and the more extreme the percentile, the greater the cause for concern. As
noted, some slowing in the infant’s rate of growth is expected after 3 months of
age. In addition, many normal infants cross percentiles to reach their genetic and
nutritional potential, so percentile charts should be used as a guide only. As a
general rule, however, any infant whose weight is static for two weeks, who
loses weight over a five to seven–day period, or who crosses the 10th or 90th
percentiles should be clinically examined.
348
Infant Feeding Guidelines for Health Workers
III.
BREASTFEEDING : EARLY DAYS
Not enough breastmilk?
Most mothers at some stage are concerned that they are not producing enough breastmilk.
Here are some tips:
•
Is your baby losing weight or gaining weight and growing in length? Most babies lose
weight in the days following birth. Within a week or two, they start to gain weight, at the
rate of around 600 grams a month, or 150 grams a week. Plotting weights on a growth
chart and explaining these patterns can be very reassuring. A baby who is gaining weight
is getting enough breastmilk and does not have any significant chronic disease problem.
•
Does your baby have six to eight wet nappies a day? This is the typical amount for a
breastfed baby. Bowel movements are often infrequent in breastfed babies: this isn’t
constipation; it’s just that breastmilk is so good there’s nothing to waste!
•
Are you eating a nutritious diet, drinking plenty of water, and getting as much rest as
possible? Taking care of yourself will enable you to take care of your baby. Make sure you
eat good food and drink plenty of fluid; drink a glass of water every time you breastfeed.
Weight-loss diets are not recommended for breastfeeding mothers.
•
Is your baby’s urge to suck being met in other ways? Breasts respond to frequent
stimulation by producing more milk. If your baby is sucking on a dummy (pacifier) or a
bottle, he or she won’t nurse as much and your milk supply will decrease.
Complementary bottles should be completely avoided.
•
Your baby can’t tell the time yet. In the first months of life babies don’t always become
hungry at the same time each day. Don’t feed on a schedule: feed ‘according to need’,
whenever your baby shows signs of hunger or fussiness. Your baby will be happier and
your milk supply greater.
•
Breast size has no relationship to milk production.
YOUNG
M OT H E R S
The results of many observational studies, and two intervention studies, show
that adolescent mothers breastfeed less often than older mothers.18 Teenage
mothers’ breastmilk is comparable in composition to that of adults.18–20
A study of breastfeeding by Aboriginal mothers in Kalgoorlie found that among
older women breastfeeding was almost universal, but the rates among young
mothers were often much lower.21 Young mothers, Indigenous mothers and
mothers from lower socio-economic groups generally require more support if
they are to maintain satisfactory breastfeeding levels.
REFERENCES
1.
Newman J. Breastfeeding problems associated with the early introduction
of bottles and pacifiers. J Hum Lact 1990;6(2):59–63.
2.
Vallenas C, Savage F. Evidence for the ten steps to successful
breastfeeding. Geneva: World Health Organization, 1998.
Infant Feeding Guidelines for Health Workers
349
III.
BREASTFEEDING : EARLY DAYS
3.
Vogel A, Hutchison B, Mitchell E. The impact of pacifier use on
breastfeeding: a prospective cohort study. J Paediatr Child Hlth
2001;37:58–63.
4.
Lennon I, Lewis BR. Effect of early complementary feeds on lactation
failure. Breastfeeding Rev 1987;11:24–6.
5.
Nylander G, Lindemann R, Helsing E, Bendvold E. Unsupplemented
breastfeeding in maternity ward. Acta Obstet Gynecol Scand 1991;70:205–9.
6.
Gray-Donald K, Kramer MS, Munday S, Leduc DG. Effect of formula
supplementation in the hospital on the duration of breastfeeding: a
controlled clinical trial. Pediatrics 1985;75:514–18.
7.
Blomquist H, Jonsbo F, Serenius F, Persson L. Supplementary feeding in
the maternity ward shortens the duration of breast feeding. Acta Paediatr
Scand 1994;83:1122–6.
8.
Keefe MR. The impact of infant rooming-in on maternal sleep at night. J
Obstet Gynecol Neonatal Nurs 1988;Mar/Apr:122–6.
9.
Daly SEJ, Kent JC, Huynh DQ, Owens RA, Alexander BF, Hartmann PE.
The determination of short-term breast volume changes and the rate of
synthesis of human milk using computerised breast measurement. Experim
Physiol 1992;77(1):79–87.
10.
Binns, C. W. (1998). Infant feeding and growth. The Cambridge
Encyclopedia of Human Growth and Development. S. J. Ulijaszek, F. E.
Johnston and M. A. Preece. Cambridge, University of Cambridge Press:
320-329.
11.
Hediger ML, Overpeck MD, Ruan WJ, Troendle JF. Early infant feeding and
growth status of US-born infants and children aged 4–71 mo: analyses from
the third National Health and Nutrition Examination Survey, 1988–1994.
Am J Clin Nutr 2000;72(1):159–67.
12.
Dewey KG, Peerson JM, Brown KH, Krebs NF, Michaelsen KF, Persson LA et
al. Growth of breastfed infants deviates from current reference data: a pooled
analysis of US, Canadian and European data sets. World Health Organization
Working Group on Infant Growth. Pediatrics 1995;96:495–503.
13.
Cohen RJ, Brown KH, Canahuati J, Rivera LL, Dewey KG. Effects of age of
introduction of complementary foods on infants’ breastmilk intake, total
energy intake, and growth: a randomized intervention study in Honduras.
Lancet 1994;344:288–93.
14.
Binns CW. Infant feeding and growth. In: Ulijaszek SJ, Johnston FE, Preece
MA, eds. The Cambridge encyclopedia of human growth and development.
Cambridge: University of Cambridge Press; 1998:320–9.
15.
Gracey M. Infant feeding and weaning practices in an urbanizing
traditional hunter–gatherer society. Pediatrics 2000;106:1276–7.
350
Infant Feeding Guidelines for Health Workers
III.
BREASTFEEDING : EARLY DAYS
16.
Whitehead RG, Paul AA. Long-term adequacy of exclusive breastfeeding:
how scientific research has led to revised opinions. Proc Nutr Soc
2000;59(1):17–23.
17.
Dewey K, Heinig MJ, Nommsen LA, Lonnerdal B. Adequacy of energy
intake among breastfed infants in the DARLING Study: relationships to
growth velocity, morbidity and activity level. J Pediatr 1993;119:538–47.
18.
Scott JA, Binns CW. Breastfeeding in Perth—recent trends. Aust NZ J Pub
Hlth 1996;20(2):210–11.
19.
Misra R, James DC. Breastfeeding practices among adolescent and adult
mothers in the Missouri WIC population. JADA 2000;100(9):1071–3.
20.
Wambach KA, Cole C. Breastfeeding and adolescents. J Obstet Gynecol
Neonatal Nurs 2000;29(3):282–94.
21.
Community Health Services Report. Kalgoorlie: 2000.
Infant Feeding Guidelines for Health Workers
351
III.
IV
BREASTFEEDING : EARLY DAYS
BREASTFEEDING: COMMON
P RO B L E M S A N D T H E I R M A N AG E M E N T
[The Commonwealth Department of Health and Ageing publication Best Practice
Guide to Common Breastfeeding Problems provides detailed advice on
breastfeeding problems and their management <www.health.gov.au/pubhlth/
strateg/brfeed/index.htm>. The Australian Breastfeeding Association’s Lactation
Resource Centre (telephone 03 9885 0855) also has many excellent resources.]
Much of the advice in this section of the first edition of the Infant Feeding
Guidelines was based on Promoting Breastfeeding, the breastfeeding guidelines
produced by the Victorian Department of Health and Community Services. It has
been modified here to give guidance to health workers who have contact with
infants and families after discharge from hospital.
At an institutional level, many lactation problems are iatrogenic and will respond
to changes in the routine care of mothers and newborns, such as those outlined
in the Baby Friendly Hospital initiative.1 The early days of breastfeeding are
critical times for education and assistance to ensure correct positioning and
attachment, which will prevent many subsequent difficulties.2 Early follow-up
visits and support at home or in community or outpatient clinics are important to
answer mothers’ breastfeeding concerns.3 In Australia, additional community
resources are available from the Australian Breastfeeding Association and
lactation consultants.
Most women experience some difficulties when breastfeeding, particularly in the
early days. But they are usually only minor and can be readily overcome with
advice, assistance and support.4 Adequate support in the community and in
general practice—particularly through the use of lactation consultants and other
trained health professionals—is of considerable value in minimising the impact
of problems on breastfeeding outcomes.5 Table IV.1 provides an indication of
the prevalence of the difficulties encountered during breastfeeding.
Infant Feeding Guidelines for Health Workers
353
IV.
BREASTFEEDING : COMMON PROBLEMS AND THEIR MANAGEMENT
Prevalence of difficulties during breastfeeding6
Table IV.1
(per cent)
Age (weeks)
0
(in hospital)
Difficulty
2
6
10
14
18
24
Sore nipples
46.8
15.8
5.0
2.3
2.2
0.8
0.9
Engorged breasts
22.3
2.3
1.2
0.3
0.0
0.0
0.9
‘Milk too fast’
19.2
1.3
1.5
0.3
0.7
0.0
0.0
7.0
3.6
0.3
0.0
0.0
0.0
0.5
Sucking difficulty
Mastitis
Not gaining weight
–
2.1
5.0
3.2
1.1
1.2
1.2
2.7
0.5
0.3
0.3
1.1
0.0
0.5
– Zero.
Note: n=556 in hospital, declining to 218 at 24 weeks.
HYGIENE
Good basic hygiene is important when caring for infants. Mothers should be
advised to carefully wash their hands with soap and water after changing a
nappy and before handling their breasts and preparing expressed breastmilk or
infant formula.
NIPPLE
PA I N A N D T R A U M A
Although nipple sensitivity and some initial discomfort in the early days after
birth are to be expected, nipple pain is not normal and could be a sign that
something is wrong.7 Nipple pain is the second most common reason given for
abandoning breastfeeding.8,9 (Perceived milk insufficiency is the most common
reason.) The nipple is constantly subject to trauma and to exposure to the
bacterial flora in the infant’s mouth.10 There are a number of causes of nipple
pain:
•
incorrect positioning and attachment
•
engorgement
•
infant causes
–
•
•
•
incorrect sucking action
– mouth or palatal abnormalities
nipple variations such as flatness or inversion
thrush
eczema or dermatitis.
Correct positioning and attachment are important. Incorrect positioning and
attachment are the most common causes of nipple pain and trauma. They can
lead to the vicious cycle of engorgement and more difficulty in attachment,
causing further nipple trauma and possibly premature weaning.
354
Infant Feeding Guidelines for Health Workers
IV.
BREASTFEEDING : COMMON PROBLEMS AND THEIR MANAGEMENT
Nipple care
•
•
•
•
•
•
Avoid using shampoos and soaps on the nipples.
Air dry the nipples after breastfeeding.
Applying hind milk or colostrum to the nipples after a feed may be
helpful.
If nursing pads are used, replace damp pads frequently.
Generally avoid applying ointments, sprays, tinctures and powders—apart
from purified lanolin, which may be useful.11–13
For severe cases, a controlled trial has shown that treatment with purified
lanolin and breast shells is more effective than using moist dressings.10
Management
•
•
•
•
Correct positioning and attachment are essential.
Treat any underlying cause.
Continue breastfeeding unless the pain is intolerable or, in spite of every
effort, the trauma worsens.
Except in rare circumstances, an infant who has been removed from the
breast should be fed on expressed breastmilk and returned to the breast as
soon as possible. Skilled support is usually required.
Although I found early breastfeeding painful with my son, the discomfort
really wasn’t necessary. I’d recommend future mothers to do what I did
this time round—make it easy on yourself with correct positioning from
the start. Contact your local breastfeeding group before the birth to learn
and practise the technique. I’m delighted to say that since my daughter
was born eight weeks ago breastfeeding has not caused so much as a
twinge.
——‘Readers Notes’, The Times, 17 November 2001, p. 3.
NIPPLE
V A R I AT I O N S
Most women’s nipples are perfectly adequate for breastfeeding, in spite of
variations in shape and size, and there is no scientific evidence of the benefit of
nipple preparation during the antenatal period. For a small number of women,
however, nipple variations such as non-protractile or inverted nipples can
present difficulties when initiating breastfeeding. Previous breast or nipple
surgery, or nipple piercing, can also cause difficulties, but each case should be
individually assessed.
If some degree of flatness or retraction is present the following will assist:
•
The ideal is to begin breastfeeding early, preferably within an hour of
birth, when the infant is alert and eager to suckle. Teaching correct
attachment and encouraging correct suckling action at this time may reduce
the likelihood of subsequent problems.
Infant Feeding Guidelines for Health Workers
355
IV.
BREASTFEEDING : COMMON PROBLEMS AND THEIR MANAGEMENT
•
•
Express milk until successful attachment is achieved. If the infant cannot
latch onto the breast, the colostrum needs to be expressed and given to
him or her. Expression should be frequent and thorough to keep the
breasts well drained and to stimulate the milk supply.
Avoid ‘nipple confusion’: the sucking action used by an infant on the
breast appears to be different from that used on teats and dummies.14 The
theory of nipple confusion refers to an infant who has difficulties
breastfeeding because he or she has first learnt to ‘bottle suck’ on teats or
dummies in the early postnatal period.15–17 It has been suggested that
bottle teats and dummies should be avoided in the early postnatal period,
and if an alternative to breastfeeding is required consideration should be
given to feeding the infant expressed breastmilk with a cup, spoon18 or
syringe or to gavage.
NIPPLE
SHIELDS
Using nipple shields may be associated with a decreasing milk supply.19–21,14 Their
use should be limited to situations where all other avenues of treatment have
failed. If a nipple shield is needed, the woman should be referred to a qualified
person, such as a lactation consultant, midwife, maternal and child health nurse,
or Australian Breastfeeding Association counsellor.
OTHER
N I P P L E P RO B L E M S
Candida
A lactating mother suffering from candida (thrush) infection of the nipples or
breast, or both, may experience breast pain, nipple pain or nipple rash.22,23
Breast pain is often described as ‘shooting, burning’ pain, like ‘red-hot needles’,
that radiates from the nipple into the breast. The pain can occur both during and
between breastfeeds. Similarly, the nipples may be painful during and between
breastfeeds. In the case of nipple rash, the nipples may look normal, be a
brighter pink than usual, or be covered with an erythematous rash and possibly
itchy. In association with these maternal symptoms, the infant may have oral and
perianal thrush.
Treatment
Miconazole or nystatin is a suitable antifungal agent for topical application to the
nipples while simultaneously treating the infant with an oral preparation.
Treatment should continue until mother and infant have been symptom-free for
several days. If pacifiers (dummies) are used during an episode of monilial
infection they could be a source of re-infection: they should be boiled several
times each day and be replaced after a week.
356
Infant Feeding Guidelines for Health Workers
IV.
BREASTFEEDING : COMMON PROBLEMS AND THEIR MANAGEMENT
Eczema and dermatitis
Eczema and dermatitis are generalised skin conditions that can affect the nipples
and breasts of breastfeeding women. There are three main types:
•
atopic eczema, where the nipples are affected by more widespread skin
disease
•
irritant contact dermatitis, occurring in response to an agent being applied
to the nipples
•
allergic contact dermatitis, which is a delayed hypersensitivity reaction to
an allergen in contact with the nipple—for example, in nipple cream or
even food in the baby’s mouth.24
Management
•
•
•
•
Avoid using soap and nipple creams—except for the treatment of candida.
If a nipple cream being used for the management of thrush is suspected,
change to another antifungal agent.
Breastfeed before offering solids to the infant and/or rinse the infant’s
mouth with water to avoid food allergens in the mouth.
To reduce the infant’s exposure, topical corticosteroids should be used
only as a last resort. When one is necessary, use the minimum effective
preparation strength for the shortest period and apply it sparingly to the
nipples after a feed.
‘TOO
MUCH MILK’
When an infant is not removing the milk effectively, there might be a perceived
‘oversupply’ of milk (see also ‘Engorgement’, later in this section).
Some women find they initially have so much milk that it causes temporary
difficulties. This is more common in the early days of breastfeeding because the
breasts have the potential to feed more than one infant. But as an infant
continues to feed, local autocrine control of milk production helps to balance the
amount of milk produced with the amount he or she is taking.
Management
•
•
•
•
Provide reassurance that it is usually a temporary problem and will resolve
with time.
Try temporarily feeding on one breast only at each feeding time. The
infant is put back on the first breast instead of being offered the second
breast.
Provide symptomatic relief—ice packs, analgesia (paracetamol) and breast
support.
Expression of milk at the beginning or end of feeds will also help to ease
discomfort. It may prolong the excess production somewhat but it can be a
Infant Feeding Guidelines for Health Workers
357
IV.
BREASTFEEDING : COMMON PROBLEMS AND THEIR MANAGEMENT
more comfortable approach while the milk supply is settling down. The
expressed milk can be saved and stored for future use (see Section V).
There is no evidence that posture feeding assists, so it is not recommended.
‘TOO
LITTLE MILK’
It is important to distinguish between actual low milk supply and perceived low
milk supply. Although most problems of undersupply can be resolved by
improving the management of breastfeeding, a very small proportion of women
do not have the metabolic capacity to produce enough breastmilk for their
infants. Perceived low milk supply is a cause of much anguish to mothers and
the most common reason for stopping breastfeeding early.25 Underlying
endocrine and/or metabolic defects, while uncommon, do occur; among them are
another pregnancy, oral contraceptives or diuretics, and thyroid disease.
The mother’s milk supply is sufficient if:
•
The infant is fully breastfed—that is, receiving no other fluids or solids—
and producing six to eight very wet nappies of pale, inoffensive-smelling
urine in a 24-hour period.
•
When young, the infant has some greenish-gold bowel motions daily,
changing to less frequent soft, pasty or curdy yellow bowel as he or she
becomes older.
•
The infant is alert, with bright eyes, moist lips and good skin tone.
·
The infant is reasonably content for some time between some feeds.
•
The infant has appropriate weight gain when averaged out over a fourweek period, remembering that infants often lose 5 to 10 per cent of their
birthweight during the first week.
•
The infant is fed according to need rather than schedule, although some
sleepy infants may have to be reminded.
There are a number of reasons mothers (and those around them) believe they
have insufficient milk:
•
The infant keeps turning his or her head and opening the mouth, as if
wanting to suck. This is the ‘rooting reflex’, present from birth to 3 or
4 months of age; infants do it when they are awake and alert and
something touches their cheek, whether or not they are hungry.
•
The mother experiences no sensation of let-down or the sensation fades or
disappears as the infant grows older.
•
The infant is unsettled. The reasons infants cry a lot and have trouble
sleeping are complex and varied: when an infant is taking the breast well,
gaining weight and developing normally, it is unlikely that the unsettled
behaviour has anything to do with breastfeeding.
358
Infant Feeding Guidelines for Health Workers
IV.
•
•
•
•
•
•
•
BREASTFEEDING : COMMON PROBLEMS AND THEIR MANAGEMENT
The translucent appearance of breastmilk makes the mother (or others)
think breastmilk is weaker than formula or cow’s milk and therefore not as
nourishing.
The mother may be unable to express much milk. It must be remembered
that the ability to express is not a reflection of how much milk the infant
takes.
The infant starts to suck her fists all the time: between 8 and 12 weeks of
age her hands are almost never out of her mouth. This is a normal part of
sensory and motor development and not a sign of hunger.
Between six and 12 weeks after the birth the mother’s breasts stop leaking
and become softer and smaller. This is normal and not a sign of
insufficient milk.
The infant’s bowel motions become less frequent at about 6 to 12 weeks of
age.
The feeds become shorter.
The mother receives well-meaning advice from an assortment of sources,
suggesting that her milk supply is not ‘satisfying the baby’. This plants
doubts in the mother’s mind about the quantity and quality of her milk
supply. Similar suggestions—‘the baby would be more content and sleep
for longer if the milk was satisfying’, ‘you’ll have greater peace of mind if
you can see how much the baby is getting’, and so on—contribute to the
mother’s misperceptions about her milk supply.
Actual insufficiency of breastmilk has a number of possible causes:
•
Positioning or attachment is incorrect.
•
The infant is not feeding frequently enough or not being given enough
time to feed, or the milk is not being removed from the breast. After
several days the milk supply will start to diminish.
•
The use of dummies, which reduce sucking time at the breast, can
eventually lead to reduced milk supply.26
•
Reduction mammaplasty (breast reduction surgery) and other breast
surgery, while not precluding breastfeeding, can hinder full lactation.
Some areas of the glandular tissue that are no longer connected to the
nipple ducts will become hard when the milk comes in, but this is
temporary because these sections of the breast will gradually cease to
make milk in response to local autocrine control.
•
Very rarely, insufficient glandular tissue can be a problem, particularly if a
mother has undergone augmentation surgery for a congenital lack of
mammary tissue. It must be borne in mind, though, that breastmilk
production is not related to breast size.
•
Retained placenta can cause reduced milk supply.
Infant Feeding Guidelines for Health Workers
359
IV.
BREASTFEEDING : COMMON PROBLEMS AND THEIR MANAGEMENT
Management
A low supply of breastmilk is usually a temporary difficulty; only occasionally
does it become a continuing problem that requires supplementation of the
breastmilk supply. It is important that health care professionals recognise the
signs and symptoms of insufficient milk—among them can be infant lethargy
and/or irritability, jaundice, infrequent stools, and scant urine production or
infrequent urinating. Any failure to gain weight or excessive weight loss (7–
10 per cent of birth weight) over a period should be assessed. Intervention is
vital if an infant’s health might be jeopardised; it should include a full
assessment of lactation and a plan that preserves breastfeeding. 27 A number of
strategies may be helpful:
•
Check positioning and attachment.
•
Feed more frequently.
•
•
•
•
•
•
–
Offer the breast between the usual feeds.
–
Offer the breast as a comforter instead of a dummy.
– Wake the infant and offer an extra feed before going to bed.
Allow the infant to finish the first breast before offering the second breast.
Always feed from each breast more than once each feed.
Express milk between feeds.
Encourage good maternal nutrition and rest.
– Recommend a healthy, well-balanced diet.
–
Discourage excessive exercise and weight-loss diets.
–
Ensure adequate fluid intake by encouraging the mother to drink
when thirsty.
– Encourage rest and relaxation.
Metoclopramide, a dopamine antagonist, induces the release of prolactin
and has been shown to increase milk supply.28–32 It has been used in
mothers with lactation failure caused by stress.33
If the infant requires supplementation, this can best be achieved by using
a supply line or supplementary nursing system available from the
Australian Breastfeeding Association. A supply line consists of a plastic
container of expressed breastmilk or formula hung around the mother’s
neck; a fine tube leading from it is taped to the mother’s nipple, and as
the infant sucks on the breast he or she gets both milk from the breast and
expressed milk or formula from the supply line. The ‘nursing
supplementer’ is a similar product available from pharmacies.
The supply line obviates the possibility of ‘nipple confusion’, which can result if
a bottle and teat are used, and encourages milk production by continued
stimulation of the breast.34 Mothers using a supply line when discharged from
hospital need specific follow-up and referral to a health professional. Careful
sterilisation of supply lines is essential.
360
Infant Feeding Guidelines for Health Workers
IV.
BREASTFEEDING : COMMON PROBLEMS AND THEIR MANAGEMENT
The most important factor to remember is:
SUPPLY = DEMAND
A good milk supply is dependent on continued stimulation of the breast.
ENGORGEMENT
Engorgement is a problem that occurs primarily in the early days of lactation. It
is usually preventable and always manageable.
If breastmilk is not removed effectively, engorgement will result. Feeding other
fluids can decrease an infant’s demand for breastmilk. Over-distension of the
alveoli with milk can also restrict blood flow, leading to further distension and
discomfort. Early engorgement can be reduced by correct positioning and
attachment and unrestricted access to the breast.35 Engorgement can also result
from prolonged separation of mother and infant and from weaning too rapidly.
Management
•
•
•
•
•
•
Unrestricted sucking is the best response to engorgement. Dummies and
complementary feeds should not be used.
Correct positioning and attachment are vital; expressing a small amount of
milk first may provide relief and help with attachment.
Relief of the discomfort associated with engorgement can be found in
simple analgesia (for example, paracetamol), cold packs between feeds,
and support of the breast, although the bra should not be too tight. Some
women find it more comfortable not to wear a bra; others prefer light
support—perhaps a T-shirt tied under the breasts or a crop top.
Feeding twice on the first breast can be tried as a temporary strategy.
It can be helpful to remove the bra during feeding and allow the milk
from the second breast to flow freely into a towel or cloth.
If engorgement persists for more than a day or two—especially in the early
days of lactation—the cycle can be broken by completely draining both
breasts with an electric pump after a feed, but this is a ‘one-off’ strategy
that brings relief and makes it easier for the baby to attach to the breast at
the next feed.
Young infants often feed eight to 12 times in 24 hours, including several times
during the night. If a mother is separated from her infant, complete expression
(usually as often as the infant would breastfeed) is necessary.
Untreated engorgement can progress to complications such as suppression of
lactation, blocked ducts, mastitis, and even breast abscess.
Infant Feeding Guidelines for Health Workers
361
IV.
BREASTFEEDING : COMMON PROBLEMS AND THEIR MANAGEMENT
I N F L A M M AT O RY
CONDITIONS OF THE BREAST
Non-infective mastitis
Non-infective mastitis can result from a blocked milk duct. Usually one segment
of a breast becomes tender, reddish and hardened. The inflammation occurs
because milk in the blocked duct cannot be removed and banks up, causing
localised distension. If the blockage is not cleared rapidly, milk is forced into the
surrounding breast tissue, causing inflammation. A blocked milk duct will not
initially be accompanied by systemic symptoms such as fever and aches and
pains, but as the breast becomes more inflamed flu-like symptoms may develop.
Blockage of ducts frequently recurs, and mothers need to be advised of this
possibility and informed about preventive measures.
A variety of factors can lead to a blocked duct:
•
poor drainage of the breast as a result of poor positioning and attachment
or incorrect sucking
•
sudden engorgement caused by a missed feed, perhaps because the infant
has changed his or her feeding pattern—for example, by sleeping through
the night. It can also happen if the mother is absent for a feed and cannot
express milk while away.
•
a tight or ill-fitting bra or other clothing putting pressure on one particular
segment of the breast, inhibiting drainage
•
consistently lying on one side or in one position during sleep, placing
pressure on the breast
•
pressure on one spot if the mother holds the breast too tightly, particularly
close to the nipple, during feeding.
Treatment
•
•
•
•
•
•
•
Check positioning and attachment.
Vary the feeding positions of the infant.
Feed the infant frequently, starting with the affected side and pointing the
infant’s chin towards the blocked duct.
A warm cloth can be applied before and during a feed to assist the letdown.
The affected area can be gently massaged, towards the nipple, while
feeding or expressing.
Cold packs can be applied for comfort after feeding.
Paracetamol can be taken as needed—simple analgesia, four-hourly.
When treated promptly, a blocked duct should clear in 24 to 48 hours. If the
pooling of the milk continues, the inflammation will intensify and provide an
ideal environment for bacterial growth, leading to infective mastitis.
362
Infant Feeding Guidelines for Health Workers
IV.
BREASTFEEDING : COMMON PROBLEMS AND THEIR MANAGEMENT
Infective mastitis
Infective mastitis generally results from either an immense overgrowth of
pathogenic bacteria or conditions that give bacteria access to breast tissue while
at the same time preventing the body from destroying them. It can develop very
rapidly.
There are several predisposing factors:
•
nipple trauma
•
poor physical health
•
a blocked milk duct
•
a sudden change in feeding pattern, such as abrupt weaning
•
use of nipple creams.
The most common form of infective mastitis is cellulitis caused by infection with
Staphylococcus aureus36 or, less commonly, a streptococcus.
The appearance of a breast harbouring infective mastitis differs from that of a
breast with a blocked duct only in degree. The breast will usually be red,
swollen, hot and painful. The skin may appear tight and shiny and be streaked
with red. The mother will be feeling very unwell, with general myalgia (muscle
pain) and a fever. A health professional should consider infective mastitis in any
breastfeeding mother who complains of flu-like symptoms.
Prevention
•
•
•
•
•
•
•
•
•
Ensure correct positioning of the infant on the breast to avoid nipple
trauma and poor breast drainage.
Avoid sudden long periods between feeds.
Handle breasts gently to avoid bruising.
Treat blocked milk ducts promptly.
Wear loose, comfortable clothing.
Avoid localised obstruction of the breast—such as a tight bra.
Avoid nipple creams and ointments.
Avoid prolonged use of nipple pads, especially plastic-backed ones.
Maintain good health.
Treatment
•
•
•
•
Early detection of infective mastitis is very important, and health workers
need to be aware of the signs. A medical practitioner should be consulted
without delay.
Most importantly, breastfeeding should continue. This is not the time to
wean because such an abrupt change can increase the risk of developing a
breast abscess.36 The breast should be kept as well drained as possible.
Breastfeed frequently.
Express after feeds.
Infant Feeding Guidelines for Health Workers
363
IV.
BREASTFEEDING : COMMON PROBLEMS AND THEIR MANAGEMENT
•
•
Feed from the affected breast first—but not all the time because as the
other breast may become engorged.
Varying the feeding position may help to drain the affected area. For
example, if the outer area is affected the underarm position may assist
drainage of that area.
If after trying these measures the symptoms persist, antibiotics should be started
early and continued for 10 days. As noted, Staphylococcus aureus is the most
common cause, and suitable antibiotics are Cephalexin, Erythromycin and
Flucloxacillin.37 On completion of a course of antibiotics, the mother may need
to be reassessed by her GP to ensure that the mastitis has resolved completely.37
Hospitalisation and intravenous antibiotics may be required if severe cellulitis
has developed. Adequate analgesia should be provided, and bed rest and an
adequate fluid intake encouraged.
Breast abscess
A breast abscess is a serious and painful condition. It is usually the result of
untreated or inadequately treated mastitis, and it requires urgent medical
attention. The abscess may be managed with needle aspiration38 or with surgical
incision but, unless the position of the incision makes it impossible,
breastfeeding should continue.
BLOOD
IN THE BREASTMILK
Blood in the breastmilk occasionally occurs in late pregnancy or in the first few
days after delivery. Its cause is unclear, although it is thought to be duct
hyperplasia. When excess duct cells are dislodged during feeding or expressing,
bleeding may result. Since only a small amount of blood is involved, it will not
upset the baby and breastfeeding can continue as normal. If bleeding persists
beyond a few days, however, medical referral is required to exclude the
presence of a duct papilloma or other breast pathology.
If a baby vomits milk containing blood the most common cause is bleeding from
traumatised nipples.
P O S T N A TA L
DEPRESSION AND MOOD DISORDERS
Knowledge about the use of drugs during pregnancy and lactation is advancing
rapidly, so where specific medications are mentioned here the most recent
advice should be sought. Medication that permits continued breastfeeding is
nearly always available.
‘The blues’ is a mild, transient disorder occurring in the first week after delivery
and peaking on the third to fifth day. It affects up to 70 per cent of mothers.39
364
Infant Feeding Guidelines for Health Workers
IV.
BREASTFEEDING : COMMON PROBLEMS AND THEIR MANAGEMENT
The symptoms are swings from tearfulness to elation and irritability or increased
sensitivity. Empathy, support and encouragement are all that is necessary for
treatment.
Post-partum psychosis is a severe psychiatric illness that begins acutely within
the first three weeks of delivery. It affects two women per 1000 births or
deliveries and is characterised by confusion and indecisiveness. The mother may
have hallucinations or delusions, with a mixture of affective (manic, depressive
or manic-depressive) or schizophrenic symptoms. Hospitalisation—ideally in a
specialised mother–baby unit—and appropriate medication are necessary.40,41
Antipsychotics are often needed in the first few days of treatment; in this case,
breastfeeding must be stopped temporarily. Health professionals can encourage
mothers to maintain their milk supply by helping them express by hand or with
a breast pump, discarding the milk.
Postnatal depression is an episode of major depression that arises within the first
three to six months after delivery.42 It is important to distinguish between
postnatal depression and the common mood changes experienced by many
postnatal women who are sleep-deprived and struggling to come to terms with
their new role. These common mood changes are probably better termed an
‘adjustment disorder with depressed (or anxious) mood’; women experiencing
this need counselling, encouragement and support from their families and health
professionals.
Depression as an illness is distinguished from an adjustment disorder by the
persistence of the depressed mood and the presence of other symptoms,
especially disturbed sleep, loss of appetite, loss of self-esteem, lethargy, and
poor concentration. Anxiety and irritability are also common. Australian studies
have shown prevalence rates for birth-induced depression ranging from 9 per
cent at six weeks after birth43 to 14 per cent at four months44 and 15.4 per cent
at eight months.45
It is generally accepted that the aetiology of postnatal depression is multifactorial, involving psychological factors, hormonal changes and social variables.
Australian studies46,47 have shown that the condition was associated with lack of
support (being single, divorced or separated), not breastfeeding, having a
Caesarean or forceps delivery, feeling dissatisfied with various aspects of
maternity care, and being a non–English speaking immigrant. In some states and
territories the Edinburgh Postnatal Depression Scale has been used to screen
women as part of their postnatal care. The questionnaire has been validated for
use in Australia.48
If symptoms are marked—especially loss of appetite, insomnia, constantly
lowered mood and feelings of worthlessness—medication and sometimes
hospitalisation may be required. Antidepressant medication is not always
necessary, but where it is appropriate women find that it quickly reduces their
anxiety and helps with sleeping problems. It is often not until two to three
weeks after the full dosage is reached that the full antidepressant effect occurs.
Breastfeeding can continue while a mother is on tricyclic antidepressants and
Infant Feeding Guidelines for Health Workers
365
IV.
BREASTFEEDING : COMMON PROBLEMS AND THEIR MANAGEMENT
most other drugs; for other classes of antidepressants specific advice on
breastfeeding must be sought. Enabling a mother experiencing postnatal
depression to continue breastfeeding may help her feel more positive about her
mothering ability. Counselling or psychotherapy from a skilled health
professional is essential for both the mother and her partner. Referral to a
support group can also be valuable.
Among the mood-stabilising medications that have been the subject of at least
limited studies in breastfeeding women are tricyclic antidepressants, selective
serotonin reuptake inhibitors, benzodiazepines, and the mood stabilisers lithium,
carbamazepine and divalproex.49–51 Tricyclic antidepressants such as dothiepin
and amitriptyline are considered safe for the breastfeeding infant. The risk of
recurrence of post-partum psychosis with subsequent deliveries is high, and
lithium prophylaxis has proved beneficial52 , although it should be used only
under close supervision.53 A Cochrane Review concluded that mothers with
postnatal depression can be effectively treated with fluoxetine and that this was
effective as a course of cognitive-behavioural counselling in the short term. 54
The reviewers also commented that postnatal depression is a neglected area,
despite its large public health impact.
BREAST
REFUSAL
The causes of breast refusal are numerous; often no cause can be found.
Among the infant-related causes can be the following:
•
infectious illness—for example, respiratory illness causing a blocked nose
and/or sore ears. Clearing a blocked nose with saline drops may solve a
feeding problem
•
frequent regurgitation with acid reflux—oesophagitis rarely occurs under
the age of 4 months
•
allergy resulting in blockage of the Eustachian tube
•
thrush
•
distractions (10 weeks onwards)—some babies are easily distracted and
need a quiet environment to feed. This is in fact a normal development in
infants.
Among the mother-related causes can be the following:
•
a change in perfume or talcum powder
•
mastitis, which leads to salty-tasting milk
•
unwell mother
•
illness decreasing the milk supply or inhibiting let-down
•
medication altering the taste of milk
•
hormonal changes, which may affect both the taste and the supply of milk
•
ovulation—three or four days before ovulation there appears to be a
change in milk composition
366
Infant Feeding Guidelines for Health Workers
IV.
•
•
BREASTFEEDING : COMMON PROBLEMS AND THEIR MANAGEMENT
menstruation
pregnancy.
Other causes can be low milk supply, a slow let-down response, and milk flow
that is too fast.
Management
A number of management strategies might be helpful:
•
reassurance—encouraging mothers to relax and not to perceive breast
refusal as a personal rejection. They need to know this is usually a
temporary situation. Support from their health professional or Australian
Breastfeeding Association counsellor is extremely important
•
stopping the feed when the infant cries and refuses the breast
•
feeding the infant when he or she is drowsy, either when just awakening
or just going to sleep
•
encouraging the infant to suck on a finger and then slipping the nipple in
•
calming the infant by singing, rocking or massaging him or her before
feeding
•
trying alternative feeding positions
•
expressing milk into the infant’s mouth
•
expressing milk and feeding the infant with a cup or bottle
•
dealing with any underlying causes of an unwell baby.
THE
C RY I N G I N F A N T
Our society encourages the perception that infants who are loved, well cared for
and well fed do not cry. So parents are bewildered when, in spite of all their
efforts, their infant continues to cry. For this reason, they often seek a health
professional’s advice during the first three months. Crying is an essential part of
human development, but it is a complex subject and there are many different
schools of thought about the management of a crying infant.
It is easy to respond to crying caused by hunger, heat, cold, noise, or a clearly
defined medical problem. Less easy, but usually manageable, are causes such as
over-tiredness or over-stimulation. Crying that persists after all these needs are
met can cause deep distress and frustration—for the infant and especially the
parents.
The age and times of day at which infants cry tend to fall into identifiable
patterns. From birth to 3 weeks of age many infants sleep a lot. Their crying
periods do not last long and are easy to resolve. From 3 weeks to 3 months the
scene changes dramatically, with infants being more wakeful and active. Their
crying, unsettled behaviour can be loosely classified into three types:
Infant Feeding Guidelines for Health Workers
367
IV.
BREASTFEEDING : COMMON PROBLEMS AND THEIR MANAGEMENT
•
•
•
Explained crying is ‘expected crying’. It has an obvious cause, and the
infant can usually be calmed and settled by simple measures such as
feeding, rocking or patting, and sometimes a bath or a walk. Occasionally
the crying is caused by a clearly defined medical problem such as a urinary
tract infection, which can be treated.
Unexplained crying for short periods is ‘unexpected crying’ for a reason
that is hard to determine. Unexplained crying for short periods every 24
hours is normal for about 80 per cent of healthy babies.55 Parents find
their baby cries for one to four hours every 24 hours, in spite of prompt
attention to his or her needs. It usually happens in the evening and rarely
in the morning before lunch, but it may occur at any time during the 24hour period.
Third, there is unexplained crying for long periods. Researchers estimate
that about 10 to 35 per cent of healthy babies cry for long periods of the
day and night.56 This sort of crying in healthy, well–cared for babies is
difficult to resolve—no one really knows what the cause is, the baby can’t
tell us, and there is no single solution that suits every baby.
Management
•
•
•
•
Rule out hunger with care. Breastfed babies commonly have times when
they feed frequently, and it does not necessarily indicate a low milk
supply. Unexplained crying in healthy babies is usually not caused by
breastfeeding problems. Weighing the baby—and thus assessing their
continuing growth—remains the most reliable way of checking the
likelihood of hunger. Once hunger has been ruled out, the baby’s crying
and sleeping patterns should be seen as unrelated to breastfeeding.
Exclude medical causes.
Parent counselling that emphasises safe options rather than solutions can
be valuable. Advice needs to be tailored to individual mothers and babies.
Mothers may find that a return to their antenatal relaxation techniques is a
help.
The following strategies work sometimes:
•
rocking and patting
•
wrapping the baby firmly in a flexed position
•
carrying the baby in a sling
•
taking the baby for a walk or trying some other gentle, rhythmic activity
•
playing music or other rhythmic sounds
•
giving the mother permission to let her baby cry for short periods when
there is nothing else she can do—well-fed tired babies sometimes sleep
after crying for 20 to 30 minutes.
Parents should be encouraged to be flexible and try whatever strategy they think
is reasonable at the time. They should be reassured that they will not ‘spoil’ their
368
Infant Feeding Guidelines for Health Workers
IV.
BREASTFEEDING : COMMON PROBLEMS AND THEIR MANAGEMENT
baby by picking her up all the time, nor will they ‘damage’ her by allowing her
to cry for short periods.
In general, there are no easy answers and research suggests that parent
counselling, support and practical help are more effective remedies than medical
diagnoses and medications.57,58
R E G U R G I TAT I O N
A N D G A S T RO - O E S O P H AG E A L R E F L U X
Regurgitation is common and may occur in about 40 per cent of infants aged less
than 3 months. It is probably a normal physiological response to food in the
stomach. Gastro-oesophageal reflux is a condition of frequent regurgitation or
vomiting, often beginning between 2 and 6 weeks of age. If severe, it can lead
to complications such as failure to thrive, recurrent aspiration (which may be
associated with apnoea) and pneumonia.59 Most infants with regurgitation or
reflux remain healthy and thrive, and the symptoms settle down between 6 and
10 months of age, when the infant begins to spend more of the day in an upright
posture.
The symptoms in young infants differ from those seen in older children and
include excessive crying, irritability, back arching, breast refusal and feeding
difficulties. Oesophagitis (inflammation of the oesophagus) is extremely rare in
infants under 4 months of age.
Diagnosis
The diagnosis of gastro-oesophageal reflux is made on clinical grounds. It is
important to exclude other causes of vomiting in infants—such as pyloric
stenosis, infections, chronic renal or cardiac disease, allergy, anatomical
abnormalities of the gastrointestinal tract, or metabolic disorders. Heacock et al.
showed that physiological gastro-oesophageal reflux was significantly less
common in breastfed infants than in those fed formula.60 This finding was
unrelated to feed volume.
Investigation is required only when complications are present or if the infant
does not respond to simple management measures.
Management
Reassurance
The majority of infants will have physiological regurgitation and will settle
spontaneously. Provided the infant is thriving, no investigation or intervention is
required. It is important not to label these children as having a condition such as
gastro-oesophageal reflux.
Infant Feeding Guidelines for Health Workers
369
IV.
BREASTFEEDING : COMMON PROBLEMS AND THEIR MANAGEMENT
Posture
Placing the infant in a more upright feeding position can be helpful for
regurgitation. Keeping the infant upright for 15 to 30 minutes after feeding also
helps; a baby sling is useful in this setting. The best position for reducing reflux
is prone but, because this position has been associated with an increased
incidence of sudden infant death syndrome, it is not generally recommended.61
No other lying position has been shown to be effective.
Food thickening
Thickening feeds with rice cereal or carob has been shown to be effective in
clinical trials in regurgitating infants but not in complicated gastro-oesophageal
reflux. Thickening is difficult with breastfeeding, and in that case liquid Gaviscon
is sometimes effective, although it can cause constipation. Recently infant
formulas containing a thickening agent (AR formulas) have become widely
available. Data on their clinical efficacy are limited but they offer no benefit over
rice cereal. They should be considered only for reducing regurgitation; they are
not an anti-reflux formula.62
Drug therapy
Drug therapy should be given only under medical supervision. There are two
possible therapies: acid reduction and use of prokinetic agents.
At present there is no drug available that is truly anti-reflux. The ideal drug
would reduce the frequency of transient lower oesophageal sphincter
relaxations, the major contributor to gastro-oesophageal reflux. Medications
containing antacids for treatment of reflux act only for a short time. The response
of an irritable infant to antacid suggests that the symptoms are related to acid
reflux. H2 receptor antagonists provide more potent acid reduction. Proton pump
inhibitors are the most potent reducers of gastric acid and also have an antireflux effect.
Cisapride, the most widely used prokinetic agent for gastro-oesophageal reflux,
has been withdrawn from use in reflux for safety reasons.63 Drugs in this class
worked on the premise that delayed gastric emptying was an important cause of
reflux, but this now seems unlikely. Several studies have also shown that
Cisapride in fact offered no symptomatic benefit in children with reflux.64 No
other agents have proven benefit.65
A study of the natural history of reflux66 showed that active medical management
produces control of symptoms such that approximately 50 per cent of cases need
no further therapy beyond 8 to 10 months of age and 30 per cent beyond 18
months of age. However, 17 per cent of patients have ongoing symptoms or
complications requiring anti-reflux surgery.
370
Infant Feeding Guidelines for Health Workers
IV.
BREASTFEEDING : COMMON PROBLEMS AND THEIR MANAGEMENT
Surgical intervention
Surgical intervention is restricted to infants for whom medical management has
failed and/or who have potentially life-threatening complications such as apnoea
or aspiration.66
PHYSIOLOGICAL
JAUNDICE
Some degree of physiological jaundice—or early-onset jaundice—occurs in
almost half of all infants; it shows up after 24 hours of age, peaks on the third or
fourth day of life, and declines steadily through the first week. An early first
breastfeed (within an hour or so of birth) and frequent breastfeeds with no
restrictions help to prevent or reduce jaundice. Frequent stimulation of the
infant’s gut speeds up the elimination of meconium, which contains jaundicecausing bilirubin.67
If an infant requires phototherapy breastfeeding should continue. The infant
should be removed from under the lights to be breastfed: intermittent
phototherapy is as effective as continuous therapy.68 If the infant becomes
sleepy or requires extra fluids while under phototherapy, the mother can express
milk to be given in addition to breastfeeds.
BREASTMILK
JAUNDICE
A small percentage of infants have prolonged jaundice, which cannot be
distinguished from early-onset jaundice in the first week. Any infant jaundiced
beyond 2 weeks of age should have a serum-conjugated (direct) bilirubin
determination, together with serum amino transferase levels, in order to exclude
a pathologic cause of hyperbilirubinaemia (for example, biliary atresia).
Breastmilk jaundice—or late-onset jaundice—manifests itself in the second week
of life with a rising serum bilirubin concentration. The exact cause is unknown,
but it appears to be a syndrome associated with the milk of a particular mother.
Varying degrees of the syndrome are likely to occur with subsequent
pregnancies.69 Usually the infant is thriving, healthy and gaining weight and has
normal bowel motions. Once other causes of prolonged or excessive jaundice
(such as haemolytic disease, hypothyroidism, G6PD deficiency and intestinal
obstruction) are ruled out, late-onset jaundice requires no intervention. No cases
of kernicterus caused by breastmilk jaundice have been reported.69
REFERENCES
1.
World Health Organization. Protecting, promoting and supporting
breastfeeding: the special role of maternity services. Joint WHO–UNICEF
statement. Geneva: WHO–UNICEF, 1989.
Infant Feeding Guidelines for Health Workers
371
IV.
BREASTFEEDING : COMMON PROBLEMS AND THEIR MANAGEMENT
2.
Kuan L, Britto M, Decolongon J, Schoettker P, Atherton H, Kotagal U.
Health system factors contributing to breastfeeding success. Pediatrics.
1999;104(3):E28.
3.
Lieu T, Braveman P, Escobar G, Fischer A, Jensvold N, Capra A. A
randomized comparison of home and clinic follow-up visits after early
postpartum hospital discharge. Pediatrics 2000;105(5):1058–65.
4.
Melnikow J, Bedinghaus JM. Management of common breast-feeding
problems. J Fam Pract 1994;39(1):56–64.
5.
Lawlor-Smith C, McIntyre E, Bruce J. Effective breastfeeding support in a
general practice. Aust Fam Physician 1997;26(5):573–5, 578–80.
6.
Scott JA, Binns CW, Aroni R. Infant feeding practices in Perth and
Melbourne. Report for the National Better Health Promotion Program.
Perth: Curtin University, 1995.
7.
Woolridge MW. Aetiology of sore nipples. Midwifery 1986;2(4):172–6.
8.
Martin J, Monk J. Infant feeding practice in 1980: OPCS Survey. London:
HMSO, 1983.
9.
Sloper KS, Eldsen E, Baum JD. Increasing breastfeeding in a community.
Arch Dis Childhood 1977;52:700–2.
10.
Brent N, Rudy SJ, Redd B, Rudy TE, Roth LA. Sore nipples in breastfeeding women: a clinical trial of wound dressings vs conventional care.
Arch Pediatr Adolesc Med 1998;152(11):1077–82.
11.
Hagen RL. Lanolin for sore nipples. Arch Pediatr Adolesc Med
1999;153(6):658.
12.
Huml S. Sore nipples: a new look at an old problem through the eyes of a
dermatologist. Pract Midwife 1999;2(2):28–31.
13.
Hewat RJ, Ellis DJ. A comparison of the effectiveness of two methods of
nipple care. Birth 1987;14(1):41–5.
14.
Woolridge M, Baim J, Drewett R. Effect of traditional and of a new nipple
shield on sucking patterns and milk flow. Early Hum Dev 1980;4:357–64.
15.
Bu’Lock F, Woolridge MW, Baum JD. Development of co-ordination of
sucking, swallowing and breathing: ultrasound study of term and preterm
infants. Developmental Medicine and Child Neurology 1990;32(8):669–78.
16.
Newman J. Breastfeeding problems associated with the early introduction
of bottles and pacifiers. J Hum Lact 1990;6(2):59–63.
17.
Neifert M, Lawrence R, Seacat J. Nipple confusion: toward a formal
definition. J Pediatrics 1995;126:S125–S130.
18.
Lang S, Lawrence CJ, Orme RE. Cup feeding: an alternative method to
infant feeding. Arch Dis Child 1994;71:365–9.
19.
Amatayakul K, Vutyavanich T, Tanthayaphinant O, Tovanabutra S,
Yutabootr Y, Drewett RF. Serum prolactin and cortisol levels after suckling
372
Infant Feeding Guidelines for Health Workers
IV.
BREASTFEEDING : COMMON PROBLEMS AND THEIR MANAGEMENT
for varying periods of time and the effect of a nipple shield. Acta Obstet
Gynecol Scand 1987;66:47–51.
20.
Auerbach KG. The effect of nipple shields on maternal milk volume. J
Obstet Gynecol Neonatal Nurs 1990;19:419–27.
21.
Jackson DA, Woolridge MW, Imong SM, McLeod CN, Yutabootr Y,
Wongsawat L et al. The automatic sampling shield: a device for sampling
suckled breast milk. Early Hum Dev 1987;15:295–306.
22.
Amir LH, Pakula P. Nipple pain, mastalgia and candidiasis in the lactating
breast. Aust NZ J Obstet Gynaecol 1991;31(4):378–80.
23.
Johnstone HA, Marcinak JF. Candidiasis in the breastfeeding mother and
infant. J Obstet Gynecol Neonatal Nurs 1990;19:171–3.
24.
Amir L. Eczema of the nipple and breast: a case report. J Hum Lact
1993;9(3):173–5.
25.
Barros F, Victoria CG, Semer TC, Tonioli-Filho S, Tomasi E, Weiderpass E.
Use of pacifiers is associated with decreased breastfeeding duration.
Paediatrics 1995;95(4):497–9.
26.
Woolridge M, Baum J, Drewett R. Individual patterns of milk intake during
breastfeeding. Early Hum Devel 1982;7:265–72.
27.
Dobson B, Murtaugh M. Position of the American Dietetic Association:
breaking the barriers to breastfeeding. JADA 2001;101(10):1213–20.
28.
Ehrenkranz TA, Ackerman BA. Metoclopramide effect on faltering milk
production by mothers of premature infants. Pediatrics 1986;78(4):614–20.
29.
Guzman V, Toscano G, Canales ES, Zarate A. Improvement of defective
lactation by using oral metoclopramide. Acta Obstet Gynec Scand
1979;58:53–5.
30.
Kauppila A, Kivinen S, Ylikorkala O. A dose response relation between
improved lactation and metoclopramide. Lancet 1983;1(8231):1175–7.
31.
Seema, Patwari AK, Satyanarayana L. Relactation: an effective intervention
to promote exclusive breastfeeding. J Trop Pediatr 1997;43(4):213–16.
32.
Kauppila A, Kivinen S, Ylikorkala O. Meoclopramide increases prolactin
release and milk secretion in puerperium. J Clin Endocrinol Metab
1981;52:436–9.
33.
Lau C. Effects of stress on lactation. Pediatr Clin Nth Am 2001;48(1):221–34.
34.
Sutherland F. Breastfeeding with the use of a supply line. Nursing Mothers
Association of Australia Newsletter 1987;May:24–5.
35.
Moon Jl, Humenick SS. Breast engorgement: contributing variables and
variables amenable to nursing intervention. J Obstet Gynecol Neonatal Nurs
1989;18:309–15.
36.
Marshall BR, Hepper JK, Zirbel CC. Sporadic puerperal mastitis. JAMA
1975;233(13):1377–9.
Infant Feeding Guidelines for Health Workers
373
IV.
BREASTFEEDING : COMMON PROBLEMS AND THEIR MANAGEMENT
37.
Mashford ME. Antibiotic guidelines 1994–1995. 8th edn. Melbourne:
Therapeutics Committee, Victorian Medical Postgraduate Foundation Inc.,
1995.
38.
Dixon JM. Repeated aspiration of breast abscess in lactating women. BMJ
1988;297(6662):1517–18.
39.
Kennerley H, Gath D. Maternity blues detection and measurement by
questionnaire. Br J Psychiat 1989;155:356–62.
40.
Brockington IF, Cernik KF, Scholfield EM, Downing AR, Francis AF, Keelan
C. Puerperal psychosis: phenomena and diagnosis. Arch Gen Psychiat
1981;38:829–33.
41.
Nurnberg HG, Prudic J. Guidelines for treatment of psychosis during
pregnancy. Hosp Comm Psychiat 1984;35(1):67–71.
42.
Boyce PM, Stubbs JM. The importance of postnatal depression. MJA
1994;161(8):471–2.
43.
Stamp GE, Crowther CA. Postnatal depression: a South Australian
prospective survey. Aust NZ J Obstet Gynaecol 1993;34:164–7.
44.
Astbury J, Brown S, Lumley J, Small R. Birth events, birth experiences and
social differences in postnatal depression. Aust J Pub Hlth 1994;18:176–84.
45.
Small R, Astbury J, Brown S, Lumley J. Depression after childbirth: does
social context matter? Med J Aust 1994;161:473–7.
46.
Williams H, Carmichael A. Depression in mothers in a multi-ethnic urban
industrial municipality in Melbourne. J Ch Psychol Psychiat 1985;26:277–88.
47.
Small R, Brown S, Lumley J, Astbury J. Missing voices: what women say and
do about depression after birth. J Reprod Infant Psychol 1994;12:89–103.
48.
Boyce P, Stubbs J, Todd A. The Edinburgh Postnatal Depression Scale
validation for an Australian sample. Aust NZ J Psychiat 1993;27:472–6.
49.
Suri, Altshuler et al. 1998
50.
Iqbal MM, Gundlapalli SP, Ryan WG, Ryals T, Passman TE. Effects of
antimanic mood-stabilizing drugs on fetuses, neonates, and nursing infants.
South Med J 2001;94(3):304–22.
51.
Misri S, Kostaras D, Kostaras X. The use of selective serotonin reuptake
inhibitors during preganancy and current knowledge. Can J Psychiat
2000;45:285–7.
52.
Austin MP. Puerperal affective psychosis: is there a case for lithium
prophylaxis? Br J Psychiat 1992;161(Nov):692–4.
53.
Iqbal MM, Sohhan T, Mahmud SZ. The effects of lithium, valproic acid, and
carbamazepine during pregnancy and lactation. J Toxicol Clin Toxicol
2001;39(4):381–92.
374
Infant Feeding Guidelines for Health Workers
IV.
BREASTFEEDING : COMMON PROBLEMS AND THEIR MANAGEMENT
54.
Hoffbrand S, Howard L, Crawley H. Antidepressant drug treatment for
postnatal depression (Cochrane Review). Cochrane Database Syst Rev
2001;2.
55.
Brazelton TB. Crying in infancy. Pediatrics 1962;29:579–88.
56.
National Health and Medical Research Council. Infant colic: current
concepts in aetiology and management. Canberra: Australian Government
Publishing Service, 1991.
57.
Taubman B. Parental counselling compared with elimination of cow’s milk
or soy milk protein for the treatment of colic syndrome: a randomised trial.
Pediatrics 1988;81:756–61.
58.
Carey WB. Infantile colic: a pediatric practitioner-researcher’s point of
view. Inf Ment Hlth J 1990;2:334–9.
59.
Davidson G, Omari T. Reflux in children. Bailliere’s Clinical Gastroenterol
2002;14:839–55.
60.
Heacock H, Jeffery H, Baker J, Page M. Influence of breast versus formula
milk on physiological gastroesophageal reflux in healthy, newborn infants.
J Ped Gastroent Nutr 1992;14(1):41–46.
61.
Bremberg S. Health promotion at Swedish child health centres. Acta
Paediatr Suppl 2000;89(434):53–6.
62.
Vandenplas Y, Belli D, Cadranel S, Cucchiara S, Dupont C, Heymans H et
al. Dietary treatment of regurgitation—recommendations from a working
party. Acta Paediatr 1998;87:462–8.
63.
Miller J. Cisapride to be taken off market, placed in controlled-access plan.
Am J Health Syst Pharm 2000;57:834.
64.
Cohen R, O’Loughlin E, Davidson G, Moore D, Lawrence D. Cisapride in
the control of symptoms in infants with gastro oesophageal reflux. J
Pediatr 1999;134:287–92.
65.
Vandenplas Y, Belli D, Benhamou P, Cadranel S, Cezard JP, Cucchiara S et
al. A critical appraisal of current management practices for infant
regurgitation—recommendations of a working party. Eur J Paediatr
1997;156:343–57.
66.
Shepherd RW, Wren J, Evans S, Lander M, Ong TH. Gastro-oesophageal
reflux in children: clinical profile, course and outcome with active therapy
in 126 cases. Clin Pediatr (Phila) 1987;26(2):55–60.
67.
De Carvalho M, Robertson S, Klaus M. Fecal bilirubin excretion and serum
bilirubin concentrations in breast-fed and bottle-fed infants. J Pediatrics
1985;107(5):786–90.
68.
Jahrig K, Jahrig D, Meisel P. Dependence on the efficiency of phototherapy
on plasma bilirubin concentration. Acta Paediatr Scand 1982;71:293–299.
69.
Auerbach KG, Gartner LM. Breastfeeding and human milk: their association
with jaundice in the neonate. Clin Perinatal 1987;14:89–107.
Infant Feeding Guidelines for Health Workers
375
IV.
V
BREASTFEEDING : COMMON PROBLEMS AND THEIR MANAGEMENT
E X P R E S S I N G A N D S TO R I N G
BREASTMILK
It is important that instructions for collecting and storing breastmilk do not seem
daunting; nor should they promote anxiety by implying that there is a risk of
harming the infant.1,2
EXPRESSING
BREASTMILK
Mothers may need to express their breastmilk for a variety of reasons:
•
The infant is sick or premature.
•
Mother and baby are temporarily separated.
•
The mother is returning to paid work.
•
The milk supply needs to be increased.
•
The mother’s breasts are uncomfortably full.
The requirements for collecting breastmilk for sick or premature babies in
hospital are more stringent than those applying to collecting milk for healthy
babies at home. Midwives, lactation consultants, early childhood nurses and
Australian Breastfeeding Association counsellors are available to provide advice
about expressing, both in hospital and at home.
There are three methods of expressing: hand expressing, hand pump expressing,
and electric pump expressing. The mother’s choice will depend on her reason
for expressing and her personal preference. The following general hints apply,
regardless of the method chosen:
•
Express in a comfortable, private place.
•
Disable the telephone.
•
Have a glass of water nearby.
•
Have all expressing equipment ready.
•
Relax! Music may help.
Hand expressing
Every mother should be shown how to hand express her milk. This method has
many advantages: no equipment is required; it is convenient; and the skin-toskin contact stimulates milk production. In spite of initial reservations, many
women find hand expressing becomes easier with practice. Here are the steps:
•
Wash hands with soap and warm water.
Infant Feeding Guidelines for Health Workers
377
V. E XPRESSING
•
•
•
•
•
•
•
•
AND STORING BREASTMILK
Gently massage the breast. Start from the top of the breast and stroke
towards the nipple; massage the underside too. Do this several times to
ensure that the whole breast is massaged.
Hold a clean plastic dish under the breast to collect the milk. This may be
difficult for some mothers to manage when they are learning: instead, a
wide bowl can be held between the legs or placed on a low table, leaving
both hands free; a towel may be needed to catch any spills.
Place thumb and finger diagonally opposite each other on the edge of the
areola.
Gently press inward towards the centre of the breast, squeezing the finger
and thumb together.
Repeat with a rhythmic rolling movement, feeling for the milk sinuses. The
fingers should not slide over or pinch the skin.
Once the milk flow has stopped, move the fingers around the nipple and
press again. This helps express more milk and empty all sectors of the
breast.
Repeat the process on the other breast.
If more milk is required, the mother can change from breast to breast until
she has the amount of milk needed or she can wait and try again later.
Hand pumps
Hand pumps are portable and relatively inexpensive. They are recommended if a
mother is breastfeeding and needs to express regularly once or twice a day when
away from her baby. Many types are available; they should be used according to
the manufacturers’ instructions. The following steps relate to piston hand pumps:
•
Wash hands with soap and warm water.
•
Have a clean, sterilised pump ready.
•
Gently massage the breast. Start from the top of the breast and stroke
towards the nipple; massage the underside too. Do this several times to
ensure that the whole breast is massaged.
•
Place the flat rim of the breast cup on the breast, centring the nipple.
•
Gently work the pump with a smooth action, pulling the piston and
releasing the suction rhythmically. By releasing the suction, the blood
circulation to the areola and the nipple will be maintained.
•
Continue working the pump until the breast is soft and about half the
required amount of milk has been expressed.
•
Change to the other breast and repeat the process, starting with the gentle
massage.
•
If more milk is required the mother can change from breast to breast until
she has the amount needed or she can wait and try again later.
•
Pour the collected milk into a storage container and put it in the
refrigerator (see ‘Storage of expressed breastmilk’, below).
378
Infant Feeding Guidelines for Health Workers
V. E XPRESSING
AND STORING BREASTMILK
Electric pumps
Electric breast pumps are recommended when the baby is sick or premature,
mothers are separated from their babies for long periods, mothers are not getting
enough milk using other expression methods, and babies cannot attach well at
the breast. Here are the steps to follow when using an electric pump:
•
Wash hands with soap and warm water.
•
Have the sterilised pump equipment ready.
•
Gently massage the breast. Start from the top of the breast and stroke
towards the nipple; massage the underside too. Do this several times to
ensure that the whole breast is massaged.
•
Place the breast cup on the areola, centring on the nipple.
•
Turn the suction strength to low, start the pump, and relax.
•
Gradually increase the suction strength—as long as there is no discomfort.
The strength should not be increased above the recommended level for
the type of pump being used.
•
Continue until the breast is soft and about half the required amount of
milk is collected.
•
Change the cup to the other breast, turning the suction to low, and repeat
the process, beginning with the gentle breast massage.
•
If more milk is required, the mother can change from breast to breast until
she has the required amount or she can wait and try again later.
•
Pour the collected milk into a storage container and put it in the
refrigerator (see ‘Storage of expressed breastmilk’).
Electric breast pumps can be hired from many pharmacies or from the Australian
Breastfeeding Association.
FEEDING
WITH EXPRESSED BREASTMILK
Expressed breastmilk can be fed to an infant by bottle, cup or spoon. Using a
cup will minimise problems with nipple confusion. Whether a bottle, a cup or a
spoon is used, the same procedures for sterilisation and storage apply.
S TO R AG E
OF EXPRESSED BREASTMILK
The requirements for storing breastmilk are more stringent for sick or premature
babies in hospital than for healthy babies at home.
Storing breastmilk in hospital
Mothers and health workers should wash their hands thoroughly with soap and
water before handling breastmilk.
Infant Feeding Guidelines for Health Workers
379
V. E XPRESSING
•
•
•
•
•
•
•
•
•
AND STORING BREASTMILK
Breastmilk is best used when fresh. A mother should try to provide fresh
breastmilk daily for her baby; if this is not possible, the milk can be stored
in a refrigerator or freezer in sterilised plastic containers.
Breastmilk refrigerated at 4°C for 48 hours suffers little loss of nutrients or
immunological properties and the bacterial count is actually reduced.3
Freshly expressed milk should be chilled in the refrigerator before being
added to frozen milk.
Warmed milk should be given straight away and any amount left over
should be discarded.
Never refreeze or reheat breastmilk.
Label the container with surname, date, and time of expression.
Do not thaw or warm breastmilk in the microwave.
Thaw breastmilk by placing it in either cool or warm water. Shake the milk
gently before using it if it has separated.
Thawed milk should be used within 24 hours.
Mothers should be given advice about cleaning, storing and sterilising
equipment—see Section VIII.
Storing breastmilk at home
Very little special handling of a mother’s milk is necessary. Since it is already
sterile when it comes from the breast, expressed breastmilk is safer to use than
prepared infant formula. It can be stored in glass or plastic containers, including
sealable plastic bags. Freshly expressed milk can be chilled in the refrigerator
and added to frozen milk in the freezer.
The following is a simple guide for mothers storing expressed breastmilk at
home4 :
•
Wash hands thoroughly with soap and water.
•
Refrigerate or freeze milk after expressing.
•
Use fresh milk whenever possible.
•
Freeze milk that will not be used within two days.
•
Use the oldest milk first; date the container at the time of collection.
Table V.1 shows how long breastmilk can be stored.
380
Infant Feeding Guidelines for Health Workers
V. E XPRESSING
Table V.1
AND STORING BREASTMILK
Storing breastmilk for home use1,2,4–6
Breastmilk status
Room temperature
(26°C or lower)
Refrigerator
(4°C or lower)
Freezer
Freshly expressed
into container
6–8 hours
3–5 days
If refrigeration is
Store at back,
available store milk there where it is coldest
2 weeks in freezer
compartment inside
refrigerator
3 months in freezer
section of refrigerator
with separate door
6–12 months in
deep freeze (–18°C
or lower)
Previously frozen—
thawed in refrigerator
but not warmed
4 hours or less—that is,
the next feeding
Do not refreeze
Thawed outside
refrigerator in
warm water
For completion of feeding 4 hours or until
next feeding
Infant has begun feeding Only for completion
of feeding
24 hours
Discard
Do not refreeze
Discard
Transporting breastmilk
•
•
•
Transport breastmilk in an insulated container—an Esky with a freezer
brick.
If some milk has thawed it should be used within 24 hours. Do not
refreeze it.
Place the milk in the refrigerator (or in the freezer if it is still frozen)
immediately upon arrival.
REFERENCES
1.
Lawrence RA, Lawrence RM. Breastfeeding: a guide for the medical
profession. 4th edn. St Louis: CV Mosby, 1999.
2.
Lang S, Lawrence CJ, Orme RE. Cup feeding: an alternative method to
infant feeding. Arch Dis Child 1994;71:365–9.
3.
Sosa R, Barness L. Bacterial growth in refrigerated human milk. Am J Dis
Child 1987;141:111–12.
4.
Barger J, Bull P. A comparison of the bacterial composition of breast milk
stored at room temperature and stored in the refrigerator. Int J Childbirth
Educ 1987;2:29–30.
5.
Nwankwo MU, Offor E, Okolo AA, Omene JA. Bacterial growth in
expressed breast milk. Ann Trop Pediatr 1988;8:92–5.
6.
Pittard WB 3rd, Anderson DM, Cerutti ER, Boxerbaum B. Bacteriostatic
qualities of breast milk. J Pediatr 1985;107(2):240–3.
Infant Feeding Guidelines for Health Workers
381
V. E XPRESSING
VI
AND STORING BREASTMILK
BREASTFEEDING IN SPECIFIC
S I T U AT I O N S
There are very few situations for which breastfeeding is contra-indicated. Even
mothers who have serious conditions are able to breastfeed successfully; among
these conditions are1 :
•
type 1 diabetes
•
type 2 diabetes
•
gestational diabetes
•
multiple sclerosis
•
systemic lupus erythematosis
•
hypothyroidism
•
hypertension
•
Crohn’s disease and ulcerative colitis
•
phenylketonuria
•
cystic fibrosis
•
fibrocystic disease.
ABSOLUTE
C O N T R A - I N D I C AT I O N S T O B R E A S T F E E D I N G
In a limited number of situations breastfeeding is absolutely contra-indicated:
•
active tuberculosis that has not yet been treated. Any contact with the
infant, including breastfeeding, is not permitted until the mother has
finished two weeks of treatment. The infant is usually prescribed
prophylactic treatment. Lactation is initiated and maintained by expressing
breastmilk until contact is approved
•
brucellosis (undulant fever), which, like tuberculosis, can pass from the
mother’s blood to the breastmilk
•
recently acquired maternal syphilis with an unaffected infant. Mother–
infant contact and breastfeeding can begin after 24 hours of therapy,
provided there are no lesions around the breasts or nipples. If there are
lesions around the breasts or nipples, feeding may begin or resume once
treatment is complete and the lesions are healed
•
breast cancer detected during pregnancy1
•
HIV infection. In Australia, women who are HIV positive are advised not to
breastfeed. Transmission of the human immunodeficiency virus through
breastfeeding is well documented. The US Centers for Disease Control and
Infant Feeding Guidelines for Health Workers
383
VI. B REASTFEEDING
•
•
IN SPECIFIC SITUATIONS
Prevention advise women with HIV infection not to breastfeed.2,3 The
NHMRC4 and the American Academy of Pediatrics5 have issued statements
in support of this position. Other countries may have different policies. For
developing countries, the WHO and other UN agencies currently
recommend exclusive breastfeeding by HIV-positive mothers until 6
months of age and then transfer to other methods of feeding. Use of
retroviral drugs assists in reducing mother-to-infant transmission. It is
estimated that the rate of mother-to-infant transmission during
breastfeeding is 10–20 per cent, but all the studies are fraught with
problems of definition of exclusive breastfeeding6
rare metabolic disorders of infants such as galactosaemia and maple syrup
urine disease, which severely limit or render impossible the infant’s use of
certain milk components. In cases of phenylketonuria, partial
breastfeeding may be possible, provided there is careful monitoring by a
paediatrician and a dietitian with expertise in metabolic disease
hepatitis B infection, although breastfeeding may begin or resume once the
infant has been immunised.
R E L AT I V E
C O N T R A - I N D I C AT I O N S T O B R E A S T F E E D I N G
Some conditions may need to be considered on their merits before use of infant
formula is advised:
•
maternal medications. Most drugs are excreted into the breastmilk but
usually in concentrations less than 1–2 per cent of the maternal dose,
which rarely poses a danger to the infant.7–9 Some drugs may be contraindicated during breastfeeding, but this is a complex subject and advice
given may depend on factors such as the drug dose, the duration of
treatment, and the nature of the illness. The advice of the general
practitioner who prescribed the medication or the pharmacist at the
nearest women’s or children’s hospital should be sought if there is any
doubt.
•
hepatitis C. There is as yet no evidence that hepatitis C is transmitted
through breastmilk
•
specific illnesses in the infant. Breastfeeding can continue in almost all
circumstances
•
maternal illness and malignancy, depending on the mother’s health and the
medications used
•
maternal psychiatric illness if there is definite danger to the infant. A
psychiatrist’s advice should be sought.
384
Infant Feeding Guidelines for Health Workers
VI. B REASTFEEDING
N I C OT I N E ,
IN SPECIFIC SITUATIONS
A L C O H O L A N D OT H E R D RU G S
Nicotine
Cigarette smoking can affect the mother’s milk supply and may cause
gastrointestinal upsets in the infant, so mothers are advised to give up smoking.
If this is not possible, they should reduce their smoking as much as possible, and
they should completely avoid smoking in the hour before feeding, and during
feeding, to reduce the harmful effects. No one should smoke in the same room
as an infant because of the dangers of passive smoking. Smokers are less likely
to breastfeed, but they should be encouraged to do so because of the modifying
effect breastfeeding has on the ill-effects of smoking.
Alcohol
The level of hepatic alcohol dehydrogenase activity in infants is less than 50 per
cent of that in adults.10 Ingestion of alcohol by breastfeeding mothers can lead to
impaired neurologic development in their infants. One study found that
Psychomotor Development Index scores were lower among infants who were
exposed to alcohol through breastmilk than among those who were not
exposed.11 When a breastfeeding mother takes even one standard alcoholic
drink, a small quantity of ethanol passes into her milk and is subsequently taken
by the suckling infant, so lactating women are advised not to drink alcohol. The
average woman takes about two hours to metabolise one standard drink. Thus, a
mother who does take alcohol should limit the amount to one drink, consumed
just after a breastfeeding; this will allow the alcohol to be substantially
metabolised before the next feed.8 The level of alcohol in the breastmilk is the
same as the level in the mother’s blood. Larger amounts of alcohol inhibit the
let-down reflex.
Other drugs
Marijuana should not be smoked by breastfeeding mothers. Use of other moodaltering substances is also contra-indicated: these substances may be excreted in
the breastmilk. In addition, a mother who is not fully alert can be a hazard to
herself and her infant while breastfeeding or preparing infant formula.
Use of methadone for the treatment of narcotic addiction is justified during
lactation.8
Appendix F provides information about breastfeeding and pharmaceutical and
other drugs.
Infant Feeding Guidelines for Health Workers
385
VI. B REASTFEEDING
WOMEN
IN SPECIFIC SITUATIONS
A N D PA I D W O R K
Returning to paid work has a significant impact on the experience of
breastfeeding and is commonly cited as a reason for ceasing to breastfeed.12–14
Among the factors that have limited mothers’ ability to continue breastfeeding
are the relative brevity of maternity leave, inflexible hours of work, and the lack
of paid breastfeeding (or pumping) breaks while at work.15 Until recently, the
rights of a woman in paid employment to breastfeed her baby have been
neglected; increasingly, though, the social environment in Australia is allowing
mothers the choice of working and breastfeeding and this is being recognised in
employment contracts.
The booklet Balancing Breastfeeding and Work outlines the benefits of
promoting breastfeeding—for employers, mothers and infants.16 The facilities
that should be provided are listed and a number of other useful
recommendations are made. A number of websites also provide useful
information (see Appendix I).
The International Labour Organisation’s Convention 103 on Maternity Protection
(1952) calls on member nations to provide, by national legislation, an
entitlement of at least 12 weeks’ maternity leave. During this period the mother
is to be entitled to cash benefits provided by a compulsory social insurance
scheme or from public funds. The convention also calls for nursing breaks for
women in the workplace.
In Australia, most employed women are entitled to maternity (or parental) leave,
although there is variation in the benefits available. In some areas of the public
sector a period of maternity leave is paid; in the private sector maternity leave is
generally unpaid.
Regardless of their eligibility for paid maternity leave, many women, for
economic or personal reasons, return to paid work before they want to stop
breastfeeding. They commonly find that their workplace lacks the flexibility and
facilities—such as work-based child care or the time and a suitable place to
express and store milk—that would allow them to combine breastfeeding and
their job. Because of this, some women who intend to return to work may be
discouraged from initiating breastfeeding and others may feel that breastfeeding
has to stop once paid work starts.
This is usually not the case. Health workers need to be well informed and
positive when advising parents about combining breastfeeding and paid work.
When it is not possible for the mother to go to her baby during working hours,
several options are available:
•
replacing breastfeeds during work hours with expressed breastmilk fed
from a cup or a bottle
•
for babies aged 6 months and over, replacing breastfeeds during work
hours with food from a spoon and a cup
•
replacing breastfeeds during work hours with infant formula fed from a
cup or a bottle.
386
Infant Feeding Guidelines for Health Workers
VI. B REASTFEEDING
IN SPECIFIC SITUATIONS
Health workers need to be aware that breastfeeding and formula feeding can be
combined: using formula does not mean the mother has to cease breastfeeding.
When formula is used during working hours, breastfeeding can still continue
before and after work and during weekends. A combination of both expressed
breastmilk and formula can be given to a baby when there is not enough
expressed milk.
It is important that in the first six weeks to three months of a baby’s life health
workers give the mother as much assistance as possible to establish
breastfeeding successfully; that way, the mother has a greater range of options.
Accurate advice on expressing, storing and using frozen breastmilk, as well as on
bottle-feeding and using formula, is also necessary.
Health workers should become advocates for workplace adoption of policies that
enable women to breastfeed. Such policies entail flexible working hours, workbased child care, and provision of rooms for expressing breastmilk or
breastfeeding and of refrigerators for storing expressed milk.
L O W - B I RT H W E I G H T
I N FA N T S
Management of low-birthweight infants is beyond the scope of this document.
Infants weighing less than 2000 grams at birth have relatively higher
requirements for nutrients—such as protein, calcium, phosphorus and zinc—and
often need breastmilk that has been fortified. Feeding infants of low or very low
birthweight with breastmilk reduces the incidence of infection, including
septicaemia, meningitis and necrotising enterocolitis.17–19
REFERENCES
1.
Dobson B, Murtaugh M. Position of the American Dietetic Association:
breaking the barriers to breastfeeding. JADA 2001;101(10):1213–20.
2.
Centers for Disease Control and Prevention. Public Health Service
recommendations for human immunodeficiency virus counseling and
voluntary testing for pregnant women. MMWR 1995;44(RR–7):1.
3.
Department of Health and Human Services. Blueprint for action on
breastfeeding 2000. Washington DC: DHHS, 2000.
4.
National Health and Medical Research Council. Consensus statement from
the WHO–UNICEF consultation on HIV transmission and breastfeeding. In;
1993.
5.
American Academy of Pediatrics. Human milk, breastfeeding, and
transmission of human immunodeficiency virus in the United States.
Pediatrics 1995;96:977–9.
6.
Coutsoudis A. Promotion of exclusive breastfeeding in the face of the HIV
pandemic. Lancet 2000;356:1620–1.
Infant Feeding Guidelines for Health Workers
387
VI. B REASTFEEDING
IN SPECIFIC SITUATIONS
7.
Colvin J. Drugs and breastfeeding guide. The Royal Women’s Hospital,
1994/95.
8.
Ito S. Drug therapy for breast-feeding women. N Eng J Med 2000;343:118–28.
9.
APA Drugs Co. The transfer of drugs and other chemicals in human milk.
Pediatrics 1994;93:137–50.
10.
Pikkarainen P, Raiha N. Development of alcohol dehydrogenase activity in
the human liver. Pediatr Res 1967;1:165–8.
11.
Little R, Anderson K, Ervin C, Worthington-Roberts B, Clarren S. Maternal
alcohol use during breast-feeding and infant mental and motor
development at one year. N Engl J Med 1989;321:425–30.
12.
Visness C, Kennedy K. Maternal employment and breast-feeding: findings
from the 1988 National Maternal and Infant Health Survey. Am J Pub Hlth
1997;87(6):945–50.
13.
James J. Working & breastfeeding: a contemporary workplace dilemma.
Australian College of Midwives 1999;12(4):8–11.
14.
Noble S, Team TAS. Maternal employment and the initiation of
breastfeeding. Acta Paediatr 2001;90:423–8.
15.
Fein S, Roe B. The effect of work status on initiation and duration of
breast-feeding. Am J Pub Hlth 1998;88(7):1042–6.
16.
Department of Health and Aged Care. Balancing breastfeeding and work.
Canberra: DHAC, 2000.
17.
Lucas A, Fewtrell M, Morley R, Lucas P, Baker B, Lister G et al.
Randomized outcome trial of human milk fortification and developmental
outcome in preterm infants. Am J Clin Nutr 1996;64:142–51.
18.
Hylander M, Strobino D, Dhanireddy R. Human milk feedings and infection
among very low birth weight infants. Pediatrics 1998;102(3):E38.
19.
Schanler R, Shulman R, Lau C, Smith E, O’Brian M, Heitkemper M. Feeding
strategies for premature infants: randomized trial of gastrointestinal
priming and tube-feeding method. Pediatrics 1999;103:434–9.
388
Infant Feeding Guidelines for Health Workers
VI. B REASTFEEDING
VII
IN SPECIFIC SITUATIONS
I N F O R M E D U S E O F C O M P L E M E N TA RY
F E E D S I N H O S P I TA L
Complementary feeding is not helpful for the early establishment of successful
breastfeeding. When complementary feeds are to be used in hospital, the mother
should give her informed consent. If an infant has become dehydrated,
rehydration may enable him or her to begin breastfeeding successfully: a
paediatric assessment should be made before seeking the mother’s consent for
this. It should be emphasised, however, that such a situation is uncommon, even
in Australia’s climate. A consent form that tells the mother about the advantages
of breastfeeding and the risks associated with not breastfeeding should be
signed. The implications of complementary feeding for establishing and
maintaining successful breastfeeding should be the subject of discussion between
health worker and mother; an example of a consent form is shown in
Appendix H.
It is also important that women be informed about their options for feeding
before they are admitted to hospital, preferably during the antenatal education
period. The decision to breastfeed, or not to do so, should be an informed one.
To assist in this decision making, all pregnant women and their partners should
have the opportunity to discuss feeding methods with their midwife or doctor.
They should be encouraged to read the wide selection of material available on
infant feeding, and they should be told about community groups that offer
information and support for women who intend to breastfeed—for example, the
Australian Breastfeeding Association and La Leche League.
Infant Feeding Guidelines for Health Workers
389
VIII. S AFE
VIII
USE OF INFANT FORMULA
S A F E U S E O F I N FA N T F O R M U L A
The primary objective of the WHO International Code of Marketing of Breastmilk Substitutes is to ensure safe and adequate nutrition for infants by protecting
and promoting breastfeeding and by ensuring the safe use of infant formula,
when it is necessary, on the basis of adequate information and through
appropriate marketing and distribution. The Code states that feeding with infant
formula should be demonstrated only by health workers or other community
workers and only to those mothers or family members who need to use formula.
In giving this information, health and other community workers should inform
parents and others of the hazards of improper use of infant formula (WHO Code,
Article 6.5).
It is important that health workers know how to demonstrate the reconstitution
of infant formula and how to feed an infant with a bottle. (Bottles may, of
course, also be used to feed infants expressed breastmilk.) While breastfeeding is
the objective for all infants, if formula is to be used it is essential that health
professionals demonstrate the correct methods and that the methods be regularly
monitored.
IN FA N T
FORMULAS
Compared with cow’s milk, all modern infant formulas contain reduced protein
and electrolytes and added iron and vitamins A, B group, C, D, E and K. The
protein in the formula is either casein or whey dominated and, since its amino
acid content is not the same as that in human milk, a slightly higher protein
content is required in formula. The fat in formula is either butterfat or mixtures
of vegetable oils. The mixtures of vegetable oils are closer to the pattern of
saturated fatty acids in human milk, but the fatty acids’ actual composition is
very different.1
Although human milk constituents are used as a reference point for the
development of infant formula, it is not possible to duplicate human milk. Infant
formula lacks many factors present in human milk, including numerous types of
living cells, cholesterol, polyamines, free amino acids, glycosamine, and enzymes
and other bioactive substances. Furthermore, the sterilisation (pasteurisation)
processes used in manufacturing formula slightly modify the structure of the
cow’s milk proteins, with a consequent loss of any cross-species protection
against infection. The processing does, however, reduce the allergenicity of the
cow’s milk protein. Although research into the development of formulas is
continuing, it is unlikely that these products will provide the variety of nutrient
and active factors present in human milk in the foreseeable future. 1 In spite of
Infant Feeding Guidelines for Health Workers
391
VIII. S AFE
USE OF INFANT FORMULA
this, when a baby is not breastfed use of an infant formula offers a better way of
meeting their primary nutritional needs than using modified raw cow’s milk.
Standards for the quality, composition and labelling of infant formulas sold in
Australia are regulated through Standard 2.9.1—Infant Formula in the joint
Australia New Zealand Food Standards Code (volume 2).2 For the purposes of
the standard, an infant is defined as being a person aged up to 12 months.
Cows’ milk–based formula is suitable for most normal-term infants and is
recommended over formulas made from soy beans or goat’s milk, modified
lactose formula, or specialised formula designed for babies with nutritional
problems, which should be used only in the case of medically diagnosed
conditions. Changing the type of formula because of minor rashes or irritability
and infant or parent distress is usually of no benefit.
Although soy formulas offer no advantages over cow’s milk formulas, soy
protein–based formulas have been demonstrated to permit normal growth and
development in infants.3,4 Vegans may prefer a soy-based formula. Soy formula
can also be used as an alternative to cow’s milk formula in infants with an
allergy to or intolerance of cow’s milk protein.
A number of concerns have, however, been raised about soy-based infant
formulas, on the basis of possible physiological effects of the isoflavone
compounds on the infant’s developing neuro-endocrine system. There is no clear
clinical or scientific evidence to support the position that these compounds are
harmful, although there have been no long-term studies that conclusively
document the product’s safety in infants.
The Australian College of Paediatrics policy for the use of soy formula in infants
(1998) is as follows:
1.
The indiscriminate use of soy formula for vague symptoms and signs not
proven to be due to cow’s milk protein intolerance (CMPI) is to be
avoided. Casual treatment in this manner is undesirable because it leads to
over-diagnosis of food intolerance, with potential long-term effects on
child health and behaviour.
2.
Soy formula should not be used routinely as prophylaxis in infants thought
to be at risk of the development of allergy. Soy protein is an allergen in its
own right.5 The diagnosis of gastrointestinal CMPI should not be made
without careful evaluation by an expert in the field. When proven, it
should be treated with formulas containing protein hydrolysates
3.
Conditions in infancy for which soy formula may be appropriately
prescribed are galactosaemia and lactose intolerance.
4.
The use of soy formula may not be without side-effects. There is some
evidence that soy formula may impair immunity and the long term effects
of contaminants of soy (eg aluminium and phytoestrogens) are unknown.
During its review of infant formula (Proposal P93), Food Standards Australia New
Zealand (formerly the Australia New Zealand Food Authority) completed an
assessment of the risks to infants from soy-based infant formula. FSANZ
392
Infant Feeding Guidelines for Health Workers
VIII. S AFE
USE OF INFANT FORMULA
concluded, ‘The currently available information suggests that, while
phytoestrogens have the potential to cause adverse effects, there is no evidence
that exposure of healthy infants to soy-based infant formula has been associated
with any demonstrated harm’. It recommended that the use of soy-based infant
formula be limited, that support be given for education strategies that promote
breastfeeding, and that, when breastfeeding is not an option, modified cow’s
milk formula be chosen in preference to soy-based formula.6 A more recent
review reached similar conclusions.7
In the past there was concern about aluminium levels found in soy formulas, but
these have now been lowered to within the acceptable range.
Many infants who are allergic to cow’s milk are also allergic to goat’s milk and
soy milk.8 Although there is a range of cow’s milk–based formulas on the
market, there is little evidence that one is better than another for normal-term
infants.1
The prices of different infant formulas and the types of retail outlets that sell the
formulas are not related to quality or nutritional value. All infant formulas sold in
Australia meet the relevant nutritional and quality-control standards. Use of a
particular formula by a hospital does not mean that formula is the ‘best’ one.
Interchange between formulas within the same generic group is optional and can
be decided on the basis of cost.
Standard formulas labelled ‘suitable from birth’ are for infants from birth to 12
months. ‘Follow-on’ formulas labelled ‘suitable only for babies over 6 months’
are for infants aged from 6 to 12 months, but their use is not considered
necessary for most and there have been no studies showing advantages over the
infant formula they are already having. The American Academy of Pediatrics
recommends that infants be fed breast milk for the first 6 to 12 months and states
that the only acceptable alternative to breast milk is iron-fortified infant
formula.9,10 By 12 months of age infants should be eating a wide variety of family
foods, and cow’s milk should be introduced at this time.
Long-chain polyunsaturated fatty acids and infant formulas
Long-chain polyunsaturated fatty acids, or LCPUFAs, are important structural
components of lipid-rich cell membranes in the infant’s developing central
nervous system, particularly the brain and retina.11 They are also precursors to
eicosanoids, which are oxygenated, highly active lipid mediators such as
leukotrienes, prostaglandins and thromboxanes.12 Eicosanoids have key roles as
modulators of renal function, mediators and messengers of allergic and
inflammatory reactions, and messengers in cellular signalling cascades.12,13
In infants, LCPUFAs are preferentially accumulated by the brain during the last
trimester of pregnancy and the first months of life.14 Breastmilk contains
LCPUFAs, among them docosahexaenoic acid (DHA, C22:6n-3) and arachidonic
acid (AA, C20:4n-6), and their precursors alpha linolenic acid and linoleic acid.15
Evidence suggests that formula-fed premature and newborn infants have limited
Infant Feeding Guidelines for Health Workers
393
VIII. S AFE
USE OF INFANT FORMULA
capacity to synthesise sufficient DHA and AA from the precursor fatty acids
normally included in infant formula16 : they have lower levels of DHA and AA in
their plasma and red blood cell lipids compared with breastfed infants.17,18 A
developing body of evidence suggests that formula-fed infants require dietary
preformed DHA and AA to match the tissue accretion rates of infants receiving
DHA and AA from breastmilk.11,19,20
Clinical studies have evaluated the dietary benefit of supplementation of DHA
and AA and reached different conclusions. A systematic Cochrane Review of
supplementation in pre-term infants found evidence that n-3 LCPUFA
supplementation of formula increases the early rate of visual maturation in these
infants.21 A similar review in term infants did not identify a benefit for visual or
cognitive development.22 These reviews established that DHA and AA
supplementation of formulas does not influence the growth of term and pre-term
infants, which is a consistent conclusion.23,24,19 More recently, two large trials have
shown that visual acuity and cognitive development in formula-fed infants
supplemented with LCPUFAs were increased compared with infants fed
unsupplemented formula.25,26 The failure of earlier studies to find a significant
benefit could be a result of protocol differences, evaluation methodology,
limiting levels of supplementation, differing LCPUFA sources, trial sample sizes
and other confounding variables.22 Any benefits LCPUFAs in infant formulas offer
for cognitive development are smaller than the advantage of breastmilk over
formula for infants.27
Fluoride in infant feeding
Fluoride is an essential nutrient, being part of the structural componentry of
bone and teeth. The US National Research Council recommends a fluoride intake
of 0.1–1.0 milligrams a day for infants aged less than 12 months. An extra
0.25 milligrams a day is recommended for breastfed infants and those fed readyto-use formula that has been made with non-fluoridated water.28
The water supply in most metropolitan and many regional areas in Australia is
fortified with approximately 1 milligrams per litre of fluoride. The National
Health and Medical Research Council29 recommends that infant formula
manufacturers assume that formula powder will be reconstituted using
fluoridated water, so the level of fluoride in the infant formula powder should be
kept as low as possible. An intake above 2 milligrams a day can be regarded as
undesirable and may result in mottled teeth in the infant.
In order to limit the amount of fluoride in formula, infant formula manufacturers
use non-fluoridated or de-fluoridated water in processing. This results in infant
formula powders that contribute minimal amounts of fluoride to the reconstituted
liquid and levels of less than 1.5 milligrams a litre in the reconstituted formula.
In areas where the water supply is not fluoridated, an inadequate intake of
fluoride by infants and the general community poses a public health problem
that may need to be redressed by health professionals.
394
Infant Feeding Guidelines for Health Workers
VIII. S AFE
P R E PA R AT I O N
USE OF INFANT FORMULA
OF FORMULA
Safe bottle-feeding depends on a safe water supply, sufficient family income to
meet the costs, effective refrigeration, clean surroundings, and satisfactory
arrangements for sterilising and storing equipment. Health workers should be
aware that parents without literacy skills or from a non–English speaking
background might need extra help to make sure bottle-feeding is done safely.
Equipment
The following equipment is needed for preparing formula:
•
two to six large bottles. A large variety of bottles made of glass or
polycarbonate (rigid plastic) are available. Bottles made of plastic are
preferred over glass because of the potential for glass to break. Many
bottle manufacturers offer differently shaped bottles and bottles with ‘anticolic’ devices. Decorations and odd shapes make bottles hard to clean and
there is no evidence that a particular shape of bottle prevents wind or
colic
•
several teats. Teats are made from rubber, also called latex (browncoloured), or silicone (clear-coloured). Shape variations (as in ‘orthodontic’
teats) offer no particular advantage unless the infant prefers that shape
•
a knife for levelling the formula powder
•
a bottle brush to clean the bottles
•
sterilising equipment.
After use, all equipment should be rinsed in cold water, washed in detergent and
hot water, using a bottle brush to thoroughly clean bottles and teats; then rinsed
again before sterilising. Careful cleaning and safe storage of equipment should
continue for as long as bottles and teats are used.
It is recommended that equipment be sterilised until the infant is 12 months of age.
Sterilisation of equipment and water by microwaving is not recommended
because microwaves do not heat evenly and this may lead to some equipment or
parts of equipment not being properly sterilised.
S T E R I L I S AT I O N
METHODS
It is recommended that all equipment used in the preparation of infant formula
be boiled in fresh water for five minutes. Water used in the preparation of
formula should also be brought to the boil and boiled for five minutes. In most
cases it is safe to use cold tapwater and then boil it. The water used should meet
the standards specified in the Australian Drinking Water Guidelines <http://
www.health.gov.au:80/hfs/nhmrc/publications/synopses/eh19syn.htm>: ‘drinking
water should be clear, colourless, well aerated, no unpalatable taste or odour
and contain no suspended matter, harmful chemical substances or pathogenic
Infant Feeding Guidelines for Health Workers
395
VIII. S AFE
USE OF INFANT FORMULA
micro-organisms’. If your tapwater does not meet these standards, plain bottled
water can be used, but it should still be boiled for 5 minutes. Bottled natural or
sparkling mineral water should not be used in the preparation of infant formula:
its high mineral content raises the renal solute load of the formula and places
stress on the infant’s kidneys.
Boiling water for extended periods (10 minutes or more) is not recommended
because of the possibility of concentrating heavy metals such as lead in the
water.
Sterilisation of water is recommended until the age of 12 months.
Microwaving is not recommended because microwaves do not heat evenly.
Similarly, using microwaves to reheat formula prior to use is not recommended
because hot spots can form in the formula and may burn the infant.30 –33
Boiling
Boiling is the preferred option for sterilisation. It will give consistent and reliable
results if the following steps are taken:
•
Place utensils—including bottles, teats and caps—in a large saucepan on
the back burner of the stove.
•
Cover utensils with water, making sure to eliminate all air bubbles from
the bottle.
•
Bring water to the boil and boil for five minutes. Turn off—don’t allow it
to boil dry.
•
Care needs to be taken to avoid scalds, so allow the equipment to cool in
the saucepan until it is hand hot, then remove it. Be extra careful if
children are present.
•
Store equipment that is not being used straight away in a clean container
in the fridge.
•
Boil all equipment every 24 hours, even if it has not been used during that
time.
Note. It is common practice to use an electric jug or kettle with an automatic cutoff to boil water. After the cut-off has activated, reset the cut-off switch and boil
again. This will be about the same as boiling for five minutes.
Sterilising using chemicals
A chemical sterilant is an antibacterial solution that comes in liquid or tablet
form. Follow the manufacturer’s instructions carefully when making up the
solution to ensure the correct dilution. After 24 hours discard the used solution,
thoroughly scrub the container and equipment in warm water with detergent,
and make up a new solution. Make sure all equipment is made of plastic or
glass: metal corrodes when left in chemical sterilant.
396
Infant Feeding Guidelines for Health Workers
VIII. S AFE
USE OF INFANT FORMULA
Completely submerge everything, making sure there are no air bubbles, and
leave it in the solution for at least the recommended time. Equipment can be left
in the solution until it is needed. Allow the equipment to drain; do not rinse the
sterilising liquid off it or there will be a risk of re-contamination.
Store the sterilising concentrate and solution well out of the reach of children.
Chemical sterilisation is not as effective as boiling: unless bottles and other
utensils are meticulously cleaned, the process will not be effective.
Steam sterilisers
Steam sterilisers are automatic units that raise the temperature quickly to the
range that kills harmful bacteria.
Place thoroughly cleaned equipment inside the unit, add water according to the
manufacturer’s instructions, and switch on. The unit switches itself off when the
sterilisation process is complete.
Microwave steam sterilisers
Sterilising units designed for use in a microwave oven are available. The caveats
that apply to chemical sterilisation also apply to microwave sterilisation.
USING
I N FA N T F O R M U L A
Manufacturers’ information about formula composition is based on accurately
made-up mixtures, but accuracy is not always achieved in practice. A survey of
274 Sydney mothers who were bottle-feeding showed that 30 per cent made
mistakes in reconstituting feeds; in 52 cases there were potentially serious
errors.34 A study by Bennett and Gibson suggests there is an inherent limitation
in accuracy when measuring powdered formula with scoops.35 A review of the
US Food and Drug Administration’s Infant Feeding Practices Study, a national
longitudinal survey, found a high level of non-compliance with best practice; this
included 33 per cent of mothers who mixed formula with warm tapwater and up
to 48 per cent who heated bottles in a microwave oven.36
Health professionals need to instruct parents how to reconstitute formula
correctly.
Important points for preparing formula
•
•
Formula is designed to remain at a constant strength. As an infant grows it
is the amount of formula that should increase, not the strength. Never, for
any reason, add any more scoops than instructed.
Always use the scoop provided with the brand of formula being used:
scoops are not interchangeable between brands. All scoops used in
Infant Feeding Guidelines for Health Workers
397
VIII. S AFE
•
•
•
USE OF INFANT FORMULA
Australia should be filled to the level: never use half scoops of powder.
When a container of formula is finished, throw away the scoop with the
container, to ensure that the correct scoop is used next time.
If using concentrated liquid formula, use equal proportions of formula and
water unless otherwise instructed.
If the brand of powdered formula is changed, it is important that the
parent is reminded to check the number of millilitres of boiled water per
scoop. Brands differ.
It is important to use cooled boiled water: hot water can destroy vitamins
and other nutrients.
Making the feeds
Prolonged boiling of water is unnecessary when making the feeds. To prepare
water for mixing with powder or liquid formula, empty the kettle or electric jug,
refill it with water, and bring the water to the boil. Kettles and jugs with no
automatic cut-off should be switched off within 30 seconds of boiling.37 Always
allow the water to cool before adding the powder or liquid. Bottled water is safe
to use but still should be boiled. Mineral waters and soda water are unsuitable.
The preferred—and safest—way of making formula at home is ‘in the bottle’, one
at a time. This reduces the potential for contamination, the amount of equipment
needed, and the possibility of mistakes when counting out the scoops of
formula.
The procedure
•
•
•
•
•
Measure the required amount of cooled, boiled water and pour it into each
bottle.
Using the scoop from the formula container, measure the required number
of scoops and place them in each bottle. Use a knife to level off each
scoop, and do not pack down the formula in the scoop.
Seal the bottle with a cap and disc and shake it gently to mix the formula.
Note that the total volume will be greater than the measured water
because of displacement.
Store all made-up formula in the centre at the back of the fridge, where it
is coldest—not in the door, where it is warmer.
Throw out any unused formula after 24 hours.
Safety points
•
•
•
Always wash your hands and work surfaces before preparing formula.
Put formula straight into the refrigerator as soon as it is made.
Discard the contents of partially used bottles after an hour. Re-using halfempty bottles is risky once they have been heated and sucked on.
398
Infant Feeding Guidelines for Health Workers
VIII. S AFE
•
•
•
USE OF INFANT FORMULA
Check the expiry date on formula containers and discard them if they are
out of date. Discard any opened container of formula after a month. In
very hot climates formula can deteriorate before its expiry date.
The safest way to transport formula is to take the cooled, boiled water and
the powdered formula in separate containers and mix them when needed.
When it is necessary to transport prepared formula (or expressed
breastmilk), it must be icy cold when leaving home and be carried in an
insulated pack to keep it cold. It can be given cold to the infant if there is
no way of warming it.
The time taken to warm a bottle of formula should not exceed 10 minutes:
bacteria multiply rapidly in warm formula, and extended warming time has
the potential to create this environment and then cause diarrhoea.
Feeding formula
It is not harmful to feed babies cold formula, but formula warmed to room
temperature flows faster and generally babies seem to prefer it warm. Standing
the bottle in warm to hot water is the traditional, and safest, way of heating
formula.
Bottle warmers are convenient and safe, provided they have a thermostat
control, but bottles should not be left to warm in them for longer than
10 minutes. Microwaves are not recommended for warming for safety reasons:
they do not heat the milk evenly, so the temperature of the milk can be
misjudged; and, because of ‘hot spots’ in the milk, an infant can receive burns to
the mouth.
Teats and flow rates
It can be difficult to get the milk to flow at just the right rate: several types of
teat may have to be tried until a suitable one is found. ‘Orthodontic teats’ offer
no particular advantage, and there is some evidence they could be harmful
because of the reduced tongue movement in the suck–swallow cycle, leading to
an increased risk of speech problems, particularly in boys. Their shape is also
implicated in an increased risk of later orthodontic problems as a result of
pressure on the gums and developing jaw.
To test the flow of a teat, hold the bottle upside down when it is filled with
room-temperature milk mixture: the milk should drip steadily. If the bottle has to
be shaken vigorously, the teat is too ‘slow’ and the infant may go to sleep before
drinking as much as he or she needs. The milk should drip easily at a steady
rate, without pouring out in a great stream. A little leakage at the corners of the
mouth while an infant feeds is nothing to worry about; it stops as he or she gets
older. When the ideal teat cannot be found, a faster teat is usually preferable to
a slower one.
Infant Feeding Guidelines for Health Workers
399
VIII. S AFE
USE OF INFANT FORMULA
Teats need to be checked and replaced regularly. Silicone and rubber teats are
prone to perishing and can become dangerous if they crack: they can harbour
bacteria, and there is a risk of pieces coming off and being inhaled or ingested.
Reducing the risks of bottle feeding
Before giving the bottle to the infant, always check the temperature of the feed
by shaking a little milk from the teat onto the inside of the wrist. It should feel
warm, not hot.
It is important to hold an infant while feeding him or her with a bottle. Not only
is parent–infant contact extremely important, but leaving infants to feed on their
own can place them at risk. Feeding should be a pleasurable experience for both
mother and infant, regardless of the feeding method. It is dangerous for parents
to ‘prop up’ a bottle and leave the infant to manage alone. The milk may flow
too quickly and cause the baby to splutter, or even choke. In addition, infants
who feed a lot on their own are at greater risk of ear infection38 and tooth
decay. Infants need to be held, cuddled and talked to when they are fed.
Infants should never be put to sleep while drinking from a bottle. Apart from the
risk of choking, they can end up with a severe form of tooth decay called bottle
decay.39
How much milk?
As with breastfeeding, bottle-feeding according to need is appropriate. Bottle-fed
young infants need about 150 millilitres per kilogram of body weight each day to
meet their nutrient needs before solids are introduced. Some will require more
(up to 200ml/kg); others less. It is important for parents to be aware that there
are many individual variations in the amount of formula and the number of
bottles consumed each 24 hours. Information on formula packages
recommending certain amounts for various ages is a guide only and does not
necessarily suit every infant. Plenty of wet nappies, consistent (but not
excessive) weight gain, and a thriving, active infant indicate that all is well.
Following are the average formula requirements for infants and toddlers:
•
day 1—30 millilitres per kilogram of body weight each day
•
day 2—60ml/kg/day
•
day 3—90ml/kg/day
•
day 4—120ml/kg/day
•
day 5 to 3 months—150ml/kg/day. Some, especially premature, babies will
require up to 180–200ml/kg/day
•
3 to 6 months—120ml/kg/day
•
6 to 12 months—100ml/kg/day. Some may reduce to 90ml/kg/day
•
1 to 2 years—90ml/kg/day.
400
Infant Feeding Guidelines for Health Workers
VIII. S AFE
USE OF INFANT FORMULA
Using a cup
A feeding cup can be used instead of a bottle for feeding infant formula or
expressed breastmilk. The technique used by an infant to suck on the teat of a
bottle differs from that used on the breast40 , and use of a feeding cup instead of
a bottle reduces the risk of confusion. Cups can be used from birth.41 When the
decision to wean is made, infants of all ages can be weaned onto a cup. This
practice is widespread in developing countries, where difficulties with cleaning
make a cup a potentially safer option than a bottle. The techniques used for
sterilising equipment and preparing formula apply equally to feeding cups.
REFERENCES
1.
Daly SEJ, Hartmann PE. Infant demand and milk supply. Part 2: the short term
control of milk synthesis in lactating women. J Hum Lact 1995;11:21–6.
2.
National Food Authority. Australian Food Standards Code, Standard R7—
Infant Formula. Canberra: Australian Government Publishing Service, 1994.
3.
Lasekan JB, Ostrom KM, Jacobs JR, Blatter MM, Ndife LI, Gooch WM 3rd et
al. Growth of newborn, term infants fed soy formulas for 1 year. Clin
Pediatr (Phila) 1999;38(10):563–71.
4.
Businco L, Bruno G, Giampietro PG. Soy protein for the prevention and
treatment of children with cow-milk allergy. J Clin Nutr
1998;68(6)(suppl.):1447S–1452S.
5.
Hill D, Hosking C. Preventing childhood allergy: leading articles. M J Aust
1993;158:367–8.
6.
Australia New Zealand Food Authority. Phytoestrogens: an assessment of
the potential risks to infants associated with exposure to soy-based infant
formula. Canberra: ANZFA, 1999.
7.
Strom BL, Schinnar R, Ziegler EE, Barnhart KT, Sammel MD, Macones GA
et al. Exposure to soy-based formula in infancy and endocrinological and
reproductive outcomes in young adulthood. JAMA 2001;286:807–14.
8.
Hill DJ, Ford RPK, Shelton M, Hosking CS. Study of 100 infants and young
children with cow’s milk allergy. Clin Rev Allergy 1984;2:125–42.
9
American Academy of Pediatrics (1992). The use of whole cow’s milk in
infancy (RE9251). Pediatrics 89(6): 1105–1109,)
10
American Academy of Pediatrics Committee on Nutrition (1989). Follow-up
or weaning formulas. Pediatrics 83(6): 1067–1071
11.
Clandinin MT, Van Aerde JE, Parrott A, Field CJ, Euler AR, Lien E.
Assessment of feeding different amounts of arachidonic and
docosahexaenoic acids in preterm infant formulas on the fatty acid content
of lipoprotein lipids. Acta Paediatr 1999;88:890–6.
Infant Feeding Guidelines for Health Workers
401
VIII. S AFE
USE OF INFANT FORMULA
12.
Sellmayer A, Koletzko B. Long-chain polyunsaturated fatty acids and
eicosanoids in infants—physiological and pathophysiological aspects and
open questions. Lipids 1999;34:1999–2005.
13.
Kurlak and Stephenson, 1999
14.
Clandinin MT, Chappell JE, Heim T. Do low weight infants require
nutrition with chain elongation–desaturation products of essential fatty
acids? Prog Lipid Res 1981;20:901–4.
15.
Rodriguez-Palmero M, Koletzko B, Kunz C, Jensen R. Nutritional and
biochemical properties of human milk—II: lipids, micronutrients and
bioactive factors. Clinics in Perinatol 1999;26:335–59.
16.
Sauerwald T, Hachey D, Jensen C, Heird W. New insights into the
metabolism of long chain polyunsaturated fatty acids during infancy. Eur J
Med Res 1997;2:88–92.
17.
Makrides M, Neumann MA, Byard RW, Gibson RA. Fatty acid composition
of brain, retina and erthyrocytes in breast- and formula-fed infants. Am J
Clin Nutr 1994;60:194–8.
18.
Jorgenson MH, Hemell, Lund P, Holmer G, Michaelson K. Visual acuity and
erythrocyte docosahexaenoic acid status in breast-fed and formula-fed term
infants during the first four months of life. Lipids 1996;31:99–105.
19.
Vanderhoof J, Gross S, Hegyi T. A multicenter long-term safety and efficacy
trial of preterm formula supplemented with long-chain polyunsaturated
fatty acids. J Pediatr Gastr Nutr 2000;31:121–7.
20.
Birch et al 1998
21.
Simmer K. Longchain polyunsaturated fatty acid supplementation in
preterm infants. Cochrane Database Syst Rev 2000;(2):(CD000375).
22.
Simmer K. Longchain polyunsaturated fatty acid supplementation in infants
born at term. Cochrane Database Syst Rev 2000;(2):(CD000376).
23.
Morris G, Moorcraft J, Mountjoy A, Wells J. A novel infant formula milk
with added long-chain polyunsaturated fatty acids from single-cell sources:
a study of growth, satisfaction and health. Eur J Clin Nutr 2000;54:883–6.
24.
Diersen-Schade D, Hansen J, CL. H, Merkel K, Wisont K, Boettcher J.
Docosahexaenoic acid plus arachidonic acid enhance preterm infant
growth. In: Essential fatty acids and eicosanoids. Champaign IL: AOCS
Press, 1999:123–7.
25.
Birch EE, Garfield S, Hoffman DR, Uauy R, Birch DG. A randomized
controlled trial of early dietary supply of long-chain polyunsaturated fatty
acids and mental development in term infants. Devel Med Child Neurol
2000;42:174–81.
26.
Birch EE, Hoffman DR, Uauy R, Birch DG, Prestidge C. Visual acuity and
the essentiality of docosahexaenoic acid and arachidonic acid in the diet of
term infants. Pediatr Res 1998;44:201–9.
402
Infant Feeding Guidelines for Health Workers
VIII. S AFE
USE OF INFANT FORMULA
27.
Gibson RA. Long-chain polyunsaturated fatty acids and infant development.
Lancet 1999;354:1919–20.
28.
National Research Council. Recommended dietary allowances. 10th edn.
Washington DC: National Research Council, 1989.
29.
National Health and Medical Research Council. The effectiveness of water
fluoridation. Canberra: NHMRC, 1991.
30.
Nemethy M, Clore E. Microwave heating of infant formula and breastmilk. J
Pediatr Health Care 1990;4:131–5.
31.
American Academy of Pediatrics & American College of Obstetricians and
Gynecologists. Guidelines for perinatal care. In: Frigoletto F, Little G, IL E,
eds. 2nd edn. 1988:201–3.
32.
Dixon J, Burd D, Roberts D. Severe burns resulting from an exploding teat
on a bottle of infant formula heated in a microwave oven. Burns
1997;23(3):268–9.
33.
Department of Community Services and Health (Victoria). Communicable
Diseases Update 1993;2(3):103–4.
34.
Lilburne A, Oates R, Thompson S, Tong L. Infant feeding in Sydney: a
survey of mothers who bottle feed. Aust Paediatr J 1988;24:49–54.
35.
Bennett J, Gibson RA. Inaccuracies in reconstituting infant formulas. Aust J
Nutr Diet 1988;47(1):27–30.
36.
Beck-Fein S, Faici CD. Infant formula preparation, handling, and related
practices in the United States. JADA 1999;99(10):1234–40.
37.
Taylor K. Boiling of water for the preparation of infant formulae.
Communicable Diseases Update 1993;3:27–8.
38.
Beauregard WG. Positional otitis media. J Pediatr 1971;79:294.
39.
Wight NE. Management of common breastfeeding issues. Pediatr Clin
North Am 2001;48(2):321–44.
40.
Righard L, Alade MO. Sucking technique and its effect on success of
breastfeeding. Birth 1992;19(4):185–9.
41.
Lang S, Lawrence CJ, Orme RE. Cup feeding: an alternative method to
infant feeding. Arch Dis Child 1994;71:365–9.
Infant Feeding Guidelines for Health Workers
403
VIII. S AFE
IX
USE OF INFANT FORMULA
F O O D S N OT S U I TA B L E F O R I N FA N T S
O R T H AT S H O U L D B E U S E D W I T H
CARE
HONEY
Honey can contain the spores of Clostridium botulinum, and it is recommended
that it not be given to children aged less than 2 years. Previously, honey was
prohibited in foods for infants in Australia, but it is now permitted providing it
has been treated to inactivate C. botulinum. This is indicated on the label by the
term sterilised honey.1 After the age of 12 months, children are less susceptible
to this bacterium.1
TEA
Tea contains tannins and other compounds that bind iron and other minerals,
thereby reducing their bioavailability. Furthermore, sugar is often added to tea,
increasing the risk of dental caries.
NUTS
Nuts are a problem with small children because of the risk of inhalation. For this
reason, they should not be given to children aged less than 5 years. In addition,
peanuts pose a risk of allergy: it is estimated that 0.6 per cent of the US
population—that is, 1.6 million people—suffer from peanut allergy.2
FRUIT
JUICES
Juices made from compressed fruit contain all the nutrients present in fruits but
not the dietary fibre. They have historically been given to children to prevent
vitamin C deficiency and scurvy.
An Adelaide study found that, in addition to milk, fruit juice and water were the
main fluids given to infants aged less than 8 months.3 This was especially the
case with non-breastfed infants. The study results suggest that inclusion of juice
in infants’ diets is common: 85 per cent of the children on juice in the study had
begun drinking juice by the age of 6 months.
Fruit juice offers no nutritional benefits to infants under 6 months of age; for
infants over 6 months of age, drinking water or milk and consuming whole fruit
are preferable.4,5 Excess consumption of fruit juice by young children has been
Infant Feeding Guidelines for Health Workers
405
IX. F OODS
NOT SUITABLE FOR INFANTS OR THAT SHOULD BE USED WITH CARE
associated with gastrointestinal symptoms, failure to thrive, decreased appetite,
loose stools, and failure to gain weight.6 –8 In the case of older children and
adolescents, see Section 3.8 in the Dietary Guidelines for Children and
Adolescents for a discussion of sugar-containing drinks and the risk of obesity.
Milk drinks (for children aged more than 12 months) or water are good
substitutes; milk is particularly beneficial because of its calcium content.
COW’S
MILK
It is recommended that children under the age of 12 months not be given cow’s
milk. The evidence for this recommendation is discussed in Section 3.4 of the
Dietary Guidelines for Children and Adolescents.
R E D U C E D - F AT
MILKS
In Australia reduced-fat milks are recommended for older children and for all
adults as part of a healthy diet. They are not recommended for children aged
less than 2 years.
REFERENCES
1.
Australia New Zealand Food Authority. Food Standards Code of Australia
and New Zealand. Vol. 2. Canberra: ANZFA.
2.
Sicherer S. New insight on the natural history of peanut allergy. Annals of
Allergy, Asthma, and Immunology 2000;85:435–6.
3.
Retallack SJ, Simmer K, Gibson RA. Infant weaning practices in Adelaide:
the results of a shopping complex survey. J Paediatr Child Hlth (Australia)
1994;30(1):28–32.
4.
American Academy of Pediatrics. AAo Committee on Nutrition. The use
and misuse of fruit juice in pediatrics. Pediatrics 2001;107(5):1210–13.
5.
American Academy of Pediatrics. Breastfeeding and the use of human milk.
Pediatrics 1997;100:1035–39.
6.
Hourihane J, Rolles C. Morbidity from excessive intake of high energy
fluids: the squash drinking syndrome. Arch Dis Child 1995;72:141–3.
7.
Lifshitz F, Ament ME, Kleinman RE, Klish W, Lebenthal E, Perman J et al.
Role of juice carbohydrate malabsorption in chronic nonspecific diarrhea
in children. J Pediatr 1992;120(5):825–9.
8.
Smith MM, Lifshitz F. Excess fruit juice consumption as a contributing
factor in nonorganic failure to thrive. Pediatrics 1994;93:438–43.
406
Infant Feeding Guidelines for Health Workers
IX. F OODS
X
NOT SUITABLE FOR INFANTS OR THAT SHOULD BE USED WITH CARE
I N T E R P R E TAT I O N O F T H E W H O
C O D E F O R H E A LT H W O R K E R S I N
AUSTRALIA
All health workers in Australia have a responsibility to promote and support
breastfeeding. This section outlines aspects of the WHO Code—the WHO
International Code of Marketing of Breast-milk Substitutes—and subsequent
World Health Assembly resolutions that are relevant to health workers. Some
aspects of the Code are actually the responsibility of others, such as government
or industry, but it is important that health workers be aware of their
responsibilities. The marketing in Australia of infant formula is regulated on a
voluntary basis by the Advisory Panel on the Marketing in Australia of Infant
Formula, through the MAIF Agreement. All health professionals have an
obligation to do their best to promote breastfeeding. The extracts that follow are
taken from the Advisory Panel’s 1999–2000 annual report.1 More details about
the MAIF Agreement are available from the Department of Health and Ageing.
The aim of the WHO Code is to contribute to the provision of safe and adequate
nutrition for infants by protecting and promoting breastfeeding and by ensuring
the proper use of breastmilk substitutes, when these are necessary, on the basis
of adequate information and through appropriate marketing and distribution.
(The box at the end of the Introduction to these Infant Feeding Guidelines
summarises the Code.)
The whole purpose of these Infant Feeding Guidelines, and of the WHO Code, is
to protect the nutritional wellbeing of infants. Breastfeeding is to be encouraged
and should be protected from practices that undermine it. Health workers are
seen by the public as the source of advice on infant feeding. This advice is to be
available to all mothers, regardless of the feeding option they have chosen for
their infant. When mothers do not breastfeed, or do so only partially, they
should use a suitable infant formula until their child is 12 months of age. They
should be fully informed about the health implications of using formula, the
potential cost, and the hazards of improper use.
THE MARKETING
IN
AUSTRALIA
OF
I N FA N T F O R M U L A A G R E E M E N T :
S TAT U S
The MAIF Agreement is a voluntary agreement between the manufacturers,
importers and distributors of infant formula and is not law. The Agreement
has been authorised by the Australian Competition and Consumer
Commission under the TPA [Trade Practices Act]. An Agreement must be
submitted for authorisation where it contains marketing restrictions and
Infant Feeding Guidelines for Health Workers
407
X. I NTERPRETATION
OF THE
WHO C ODE
FOR HEALTH WORKERS IN
A USTRALIA
authorisation is only granted where the public benefit is shown to
outweigh any anti-competitive effect. The signatories can legally follow the
provisions of the authorised Agreement, but could be in breach of the TPA
if they agree to any further marketing restriction, which is not covered in
the Agreement, even if it is recommended in the WHO Code. Similarly, for
aspects of the WHO Code for which there is no authorised Agreement,
agreements by companies to restrict marketing practices may result in
penalties for breaching the TPA.
T H E A D V I S O RY P A N E L O N T H E M A R K E T I N G
I N FA N T F O R M U L A : T E R M S O F R E F E R E N C E
IN
AUSTRALIA
OF
The aim of APMAIF is to:
• receive and investigate complaints regarding the marketing in Australia
of infant formulas;
• act as a liaison point for issues relating to the marketing in Australia of
infant formulas;
• develop guidelines on the interpretation and application of the MAIF
Agreement; and
• provide advice to the Commonwealth Minister for Health and Aged
Care, on the operation of the Agreement.
I N T E R P R E TAT I O N S O F T H E A D V I S O RY P A N E L
A U S T R A L I A O F I N FA N T F O R M U L A
ON THE
MARKETING
Clause 4: Information and education
Clause 4(a): Manufacturers and importers of infant formulas in Australia
agree that informational and educational materials, whether written, audio
or visual, dealing with the feeding of infants and intended to reach
pregnant women and parents of infants and young children, should always
include clear information on all the following points:
(i)
the benefits and superiority of breastfeeding;
(ii) maternal nutrition, and the preparation for and maintenance of
breastfeeding;
(iii) the negative effect on breastfeeding of introducing partial bottlefeeding;
(iv) the difficulty of reversing the decision not to breastfeed; and
(v) where needed, the proper use of infant formula, whether
manufactured industrially or home prepared. (WHO Code, Article 4.2)
Clause 4(b): When such materials contain information about the use of
infant formulas, they should include the social and financial implications of
its use, the health hazards of inappropriate foods or feeding methods and,
in particular, the health hazards of unnecessary or improper use of infant
408
Infant Feeding Guidelines for Health Workers
IN
X. I NTERPRETATION
OF THE
WHO C ODE
FOR HEALTH WORKERS IN
A USTRALIA
formulas. Such materials should not use any pictures or text which may
idealise the use of infant formulas. (WHO Code, Article 4.2)
Inclusion of information
The information required by clauses 4(a) and 4(b) must be included in any
video or written material which refers to infant formula that is produced or
sponsored by an infant formula manufacturer. (December 1993)
• The information required by clauses 4(a) and 4(b) must be included in
the main body of the video in the same type of presentation as the rest
of the material, and at a level suitable for the target audience. A mother
should be able to understand what it means. (December 1993)
• The print size of the information required by clauses 4(a) and 4(b)
should be the same size as the majority of the main text or at least 8
point. (September 1993)
• The Panel sees the social and financial implications as interrelated.
They may include the following points:
–
cost will be (about $20 per week) (at least 1 can per week) (each
company should insert the most appropriate quantity);
–
infant formula will need to be purchased until the baby is 12
months of age; and
–
the costs affect the family budget. (March 1994)
Pictures on informational or educational material for health professionals
• Certain pictures may be acceptable on materials for health
professionals. (1994)
• The Panel considered that cartoons and pictures of animals and toys do
not necessarily idealise the use of infant formulas and therefore may be
acceptable. They should not depict an animal or toy being fed, whether
by breast or by bottle, nor should they depict animal or toy ‘mothers’,
because the Panel considers that these would idealise the use of infant
formula. (1994)
• The Panel considers that real babies depicted in a normal context do
not necessarily idealise the use of infant formulas and may legitimately
draw a health professional’s attention to information about an infant
formula.
• However:
–
babies (with or without bottles) in fantasy situations (e.g. stars,
heavens, clouds, sitting up in school) are unacceptable because they
suggest formula-fed babies are in some way ‘ahead’ of breastfed
babies (March 1994);
–
babies with slogans over or adjacent to the pictures (such as ‘Every
baby deserves the best’ or ‘A little extra something’) are
unacceptable. The Panel believes this implies that the product is
better than breastmilk and idealises the use of infant formula (March
1994); and
–
the Panel feels that it is inappropriate to use a picture of an
apparently newly born baby to draw attention to information about
Infant Feeding Guidelines for Health Workers
409
X. I NTERPRETATION
OF THE
WHO C ODE
FOR HEALTH WORKERS IN
A USTRALIA
infant formula. Breastmilk is the best milk for babies up to 12
months old, but it is particularly valuable in the first few weeks of
life when the baby is most vulnerable. Baby models for such
pictures should be no younger than three months (February 1995).
• The Panel considers that a picture of a woman breastfeeding is never
acceptable because it:
–
creates an impression that their product is equivalent to
breastfeeding;
–
appropriates the image of breastfeeding for the purpose of
promoting a product; and
–
is a misleading way of gaining attention (March 1994).
Clause 4(c): Manufacturers and importers of infant formulas should not
donate informational or educational equipment or materials unless it is at
the request of, and with the written approval of, the appropriate
government authority or within guidelines given by the Commonwealth,
State or Territory Governments for this purpose. Such equipment or
materials may bear the donating company’s name or logo, but should not
refer to a proprietary infant formula, and should be distributed only
through the health care system. (WHO Code, Article 4.3)
• Instructions how to prepare a specific infant formula may include the
brand logo and should include the product name. Such materials
should be limited to preparation instructions only and should not
include other educational or promotional information. (March 1994)
• The Panel has determined that the distribution at conferences of pens
and monogrammed paper which bear a brand name and not just a logo
is unacceptable. (March 1994)
• The Panel considers that a slogan is different to a logo. For example,
‘Every baby deserves the best’ and ‘A little extra something’ are slogans.
When used in conjunction with the brand name of a product, it is
implied that feeding a baby the product would be better than
breastfeeding. (March1994)
• Inexpensive materials likely to be used only in the process of
professional duty (provided they are not readily given to mothers, for
example small ‘tear off’ note pads) may be acceptable. However,
materials of a personal nature such as coffee mugs are not considered
acceptable. Any such materials should bear only the company name
and logo, and not a product brand name. The use of slogans on these
materials is unacceptable. (March 1994)
• The provision of ordinary food (morning/afternoon tea or lunch) is
acceptable provided it is in association with a presentation that
coincides with a mealtime and that is not of a lavish nature. (March
1994)
• The Panel agreed that manufacturers should keep in mind clause 7 that
prohibits any donations, or activities, which can be construed as a
material inducement. (September 1993)
410
Infant Feeding Guidelines for Health Workers
X. I NTERPRETATION
OF THE
WHO C ODE
FOR HEALTH WORKERS IN
A USTRALIA
Clause 5: The general public and mothers
Clause 5(a): Manufacturers and importers of infant formulas should not
advertise or in any other way promote infant formulas to the general
public. (WHO Code, Article 5.1)
Advertisements to the general public
• The Panel is aware of its obligation under both the Australian
Agreement and the TPA. We wish to minimise harm to breastfeeding
while allowing consumers to obtain formula at a competitive price.
(March 1994)
• The Panel feels that parents have a right to information about
availability of infant formula. However:
–
announcements regarding changes to availability of infant formulas
(for example, in supermarkets) are acceptable, but only on a oneoff basis. Advertisements may appear only once in any one
publication over a maximum of a three-month period (to allow for
inclusion in quarterly publications);
–
references to outlets of availability should be restricted to generic
locations such as ‘toy stores’ or ‘supermarkets’, but not to specific
locations such as ‘Coles’ or ‘Woolworths’;
–
such advertisements should have no promotional content. There
should be no slogans and the logo should not include a slogan;
–
advertisements should not promote or encourage use of formula;
–
changes in formulation should be referred to only on the container,
not promoted in advertisements (March 1994); and
–
pack shot size is to be restricted to 4 cm x 3 cm. (February 1996)
• New infant formula products may not be advertised or ‘announced’ to
the general public. (1994)
• When infant formula manufacturers widened the distribution of their
product from pharmacies to supermarkets, it was accepted by the Panel
that it was in the interest of consumers to be aware of this change of
availability. However, infant formula products have now been available
in a range of retail outlets for over two years. The Panel therefore does
not consider it necessary for further changes in availability to be
announced to consumers and such announcements are no longer
acceptable. (June 1996)
• When an infant formula manufacturer advertises to the general public a
product with the same name as an infant formula, the product name
should be followed either by the range name (e.g. toiletries) or the
specific product (e.g. baby powder). Generalised terms such as ‘Brand
X Baby Care Products’ or ‘Brand X, Best for Baby’, should not be used
where Brand is the name of an infant formula. (June 1996)
Price promotions of infant formula by manufacturers through retailers
• Price tickets on the ‘shelf-talkers’ that simply advertise the price of the
product or the fact that it has a ‘special’ price are acceptable. The ticket
may also state the saving to be made; e.g. ‘Special. Save $1’. Shelf
Infant Feeding Guidelines for Health Workers
411
X. I NTERPRETATION
OF THE
WHO C ODE
FOR HEALTH WORKERS IN
A USTRALIA
tickets should have no content other than the price, the name of the
product and, if wanted, the amount to be saved.
• The Panel believes that descriptors such as ‘soy formula’ or ‘lactose
free’ should not be allowed on these price promotion announcements
or ‘shelf-talkers’. This is because manufacturers may claim that a list
such as ‘cholesterol-free, cow’s milk protein–free, lactose-free’ should
be allowed, as these are all ‘descriptors’. Also, the Panel believes that
infant formula other than standard formulas based on cow’s milk
should only be used if there is a medical indication. If these descriptors
are used in promotion, some parents may mistakenly believe that
‘lactose-free’ or ‘cow’s milk protein–free’ formulas are superior to cow’s
milk formula.
• For the purpose of in-store price promotions, ‘pack shots’ (i.e.
depictions or photographs of the product) are allowable in store
specific catalogues but the depiction of the product should be relative
to the size, colour etc, the other products similarly depicted.
• This is in recognition that ‘pack shots’ may be necessary for those retail
customers with a non–English speaking background or low literacy.
Such ‘pack shots’ should not include slogans or descriptors.
• Large stacks of cans (gondola ends or shelf stacks) are not necessary to
make consumers aware of the price of the product, but the Panel
recognises that they are apparently necessary to provide ‘stock weight’
(sufficient stock) for the increased demand created by ‘special offers’.
Stock in gondola end stacks and shelf stacks should be kept in their
boxes and efforts should be made to ensure that the stack is not overly
promotional.
• Window displays, window stacks and pavement displays are not
acceptable.
• Care should be taken not to display infant formula products or the
name of the product under generic slogans for a range of products,
such as ‘Everything that is best for baby’.
• There should be no price or product promotion on radio, television or
any other electronic media. (May 1995)
• Information materials for health professionals should not contain
pictures, music or other devices that are likely to be attractive to young
children, and therefore might lead to health professionals putting them
on display or giving them to children and parents to look at or play
with. Examples might include use of music, posters or mobiles.
(December 1995)
Clause 5(b): Manufacturers and importers of infant formulas should not
provide samples of infant formulas to the general public, pregnant women,
parents or members of their families. (WHO Code, Article 5.2)
• The Panel considered that the provision of free samples by
manufacturers through pharmacies breaches the Agreement. However,
small packs could be made available in retail outlets for purchase at
commercial competitive rates. (February 1993)
412
Infant Feeding Guidelines for Health Workers
X. I NTERPRETATION
OF THE
WHO C ODE
FOR HEALTH WORKERS IN
A USTRALIA
Clause 7: Health care professionals
Clause 7(a): Manufacturers and importers of infant formulas providing
information about the formulas to health care professionals should restrict
the information to scientific and factual matters. Such information should
not imply or create a belief that bottle-feeding is equivalent or superior to
breastfeeding. It should also include the information specified in clause
4(a) above. (WHO Code, Article 7.2)
Interpretation of the term ‘scientific’
• By ‘scientific’, it is meant that the total current scientific knowledge is
reflected in total, not simply selective parts that can be used in a
misleading way. (February 1993)
Use of the terms ‘resembles’, ‘is close to’ and ‘is similar to’
• The Panel does not consider that it is scientific or factual to claim that a
product resembles, or is similar to, or is close to breastmilk unless the
component that the company claims is similar to that in breastmilk is
specified, and evidence is provided which satisfies the Panel that this
specific claim is valid.
• Where these terms are used without a specific claim, the Panel
considers that the manufacturer is implying equivalence with breastmilk
and is therefore in breach of the Agreement.
• In informational material for health professionals, a manufacturer
sometimes wishes to point out that mothers who cannot breastfeed
should be advised that they should use an infant formula that resembles
breastmilk more closely than cow’s milk. The Panel considers that the
use of the term ‘resembles breastmilk’ is acceptable only in this context
of the comparison with cow’s milk. (December 1993)
• Requirement for tables used in promotional pieces to compare
breastmilk with infant formula or components of infant formula. The
following information should be included:
(i)
the units of measurement;
(ii)
the specific type of breastmilk sample which is being compared;
(iii) the average or mean values and the standard deviation; and
(iv) the references for the source of date. (January 1999)
Access to health professionals
• It is up to health care professionals to decide whether they wish to see
representatives of formula manufacturers. The Panel agrees that there is
nothing in the MAIF Agreement, nor in the WHO Code, which prevents
the access of representatives to health care professionals, and indeed
believes that such access plays an important part in providing
information about infant formula to health care professionals. (June
1994 – February 1995)
• Information materials for health professionals should not contain
pictures, music or other devices that are likely to be attractive to young
children, and therefore might lead to health professionals putting them
Infant Feeding Guidelines for Health Workers
413
X. I NTERPRETATION
OF THE
WHO C ODE
FOR HEALTH WORKERS IN
A USTRALIA
on display or giving them to children and parents to look at or play
with. Examples might include use of music, posters or mobiles.
(December 1995)
• In the new marketing environment of infant formula in Australia it is
reasonable for manufacturers to provide information for retailers of
their products in trade journals only. The information should comply
with the restrictions of clause 7(a) and clause 4(a) of the MAIF
Agreement. They should not be promotional in any way, and the
information should be restricted to the scientific and factual. In
addition, such information should be able to be understood by retailers
who are not health professionals. (June 1996)
Competitions
Clause 7(c): Manufacturers and importers of infant formulas should not
offer any financial or material inducement to health care professionals or
members of their families to promote infant formulas, nor should such
inducements be accepted by health care professionals or members of their
families. (WHO Code, Article 7.3)
• The Panel considers it is acceptable to hand out gifts such as pens and
papers (with the company name or logo only) designed for personal
use at a conference. However, if the gifts were designed to be taken
home, this would be classed as an inducement. It was considered
unacceptable for these materials to be left in a hospital ward
(September 1993). The Panel considers that anything intended or likely
to be taken home is an inducement.
• The Panel considers that competitions, included in information material
for health professionals, which are clearly for the purpose of
emphasizing information that is restricted to the scientific and factual,
may be acceptable. Such competitions, however, should not be an
inducement to promote infant formulas. Therefore the prize should not
exceed a value of $100. Manufacturers should also be mindful of clause
4(c). (February 1996)
Clause 7(d): Manufacturers and importers should not provide samples of
infant formulas, or of equipment or utensils for their preparation or use, to
health care professionals except when necessary for the purpose of
professional evaluation or research at the institutional level. (WHO Code,
Article 7.4)
• Infant formula given to child care or day care centres for distribution in
single or small quantities to parents or when a mother has forgotten to
bring her own formula or when the baby’s formula has unexpectedly
been exhausted, will be considered, according to the definition in the
MAIF Agreement, as a ‘sample’. Child care centres are not a setting in
which professional evaluation of infant formula occurs. There is
therefore no valid reason for manufacturers to give samples of infant
formula to child care centres. Such provision will be considered by the
Panel as a breach of the Agreement. (May 1995)
• Samples should not be distributed unless for valid professional
evaluation or research at the institutional level implying sound scientific
scrutiny and methodology. (January 1999)
414
Infant Feeding Guidelines for Health Workers
X. I NTERPRETATION
OF THE
WHO C ODE
FOR HEALTH WORKERS IN
A USTRALIA
The position of APMAIF on conferences, seminars or publications, under the auspices of
another organisation, by manufacturers of infant formula
• Sponsorship of conferences, seminars or publications by manufacturers
of infant formula does not necessarily breach the Agreement.
• The Panel believes that any sponsorship of meetings, seminars or
conferences should be declared. There should be no conditions which
relate to the marketing of the sponsor’s product or to restrictions on
promotion of breastfeeding.
• The sponsor should not exert any influence on the choice of speakers
of the content of presentations.
• In line with clause 4(c) of the Agreement, any conference materials
may bear the donating company’s logo, but should not refer to a
proprietary infant formula, and should be distributed only through the
health care system.
REFERENCES
1.
Advisory Panel on the Marketing in Australia of Infant Formula. Annual
report of the Advisory Panel on the Marketing in Australia of Infant
Formula 1999–2000. Canberra; 2000.
Infant Feeding Guidelines for Health Workers
415
X. I NTERPRETATION
OF THE
WHO C ODE
FOR HEALTH WORKERS IN
A USTRALIA
APPENDIX A
MEASUREMENT
O F B R E A S T F E E D I N G R AT E S
The review of breastfeeding indicators recommends a large number of indicators.
For comparison of studies in Australia, the following indicators are a useful
minimum:
•
percentage ever breastfed—that is, the rate of initiation of breastfeeding
•
median duration of breastfeeding among children who have ever been
breastfed
•
mediation of the introduction of solid foods. This should specify the exact
question asked because it may mean a first taste or more established
feeding
•
prevalence (percentage) at ages 4 months and 6 months of
–
exclusively breastfed
–
predominantly breastfed
–
fully breastfed—that is, exclusively plus predominantly
–
infants receiving solid foods.
It is usual to also collect information on ‘any or some’ breastfeeding.
For precise definitions, see references 1 to 3 .
It is important to state the method used to record the data. Evidence suggests
that mothers can recall relatively accurately—even over a long period—the
incidence and duration of breastfeeding, but their recall is not as accurate for the
timing of the introduction of other fluids and solid foods.1
Data on ‘ever breastfeeding’ and ‘some breastfeeding’ can usually be collected by
cross-sectional, retrospective studies, but for more detailed data longitudinal
studies have advantages, among them interviewing the mother close to the event
to reduce recall bias and the ability to obtain data related to different stages of
breastfeeding. The problem of recall is demonstrated by comparing the results of
the Donath and Amir analysis of the National Health Survey4 , which is crosssectional, and the Perth breastfeeding study, which is longitudinal.5 Donath and
Amir reported the exclusive breastfeeding rate at 57 per cent at age 3 months
and Scott and Binns reported 47 per cent; overall rates of breastfeeding were
similar. It is likely that the difference is a result of the recall bias inherent in the
National Health Survey methodology, which is based on recall over a long
period.
The way the questions are asked and the timing of the questions is important
when studying breastfeeding and the introduction of solids.
Infant Feeding Guidelines for Health Workers
417
A PPENDIX A
Data from India are illustrative of the way the questions influence the results for
rates of introduction of solids in infant feeding6 : the proportions of exclusive
breastfeeding at 3 months from three national surveys were 52 per cent, as
determined retrospectively using one question; 38 per cent when determined
retrospectively with multiple questions and a checklist of foods; but only 15 per
cent in a prospective cohort study using multiple questions.
For these reasons—to be accurate—data on the time of introduction of solids and
on the proportion exclusively breastfeeding should be collected prospectively or
at least as close to the event as possible.
REFERENCES
1.
Webb K, Marks K, Lund-Adams M, Abraham B. Towards a national system
for monitoring breastfeeding in Australia: a discussion paper. Canberra:
AusInfo, 2002.
2.
World Health Organization. Complementary feeding of young children in
developing countries. Report no. WHO/NUT/98.1. Geneva: WHO, 1998.
3.
Labbok M, Krasovec K. Toward consistency in breastfeeding definitions.
Stud Fam Plann 1990;4:226–30.
4.
Donath S, Amir LH. Rates of breast feeding in Australia by state and
socioeconomic status: evidence from the 1995 National Health Survey.
J Paediatr Child Health 2000;36(2):164–8.
5.
Scott JA, Binns CW. Factors associated with the initiation and duration of
breast feeding. Aust J Nut Dietet 1998;55(2):51–61.
6.
Engle PL. What is child development? In: International colloquium on
promoting growth and development of under fives. Antwerp; 2001. p. 67.
418
Infant Feeding Guidelines for Health Workers
A PPENDIX A
APPENDIX B
T H E I N N O C E N T I D E C L A R AT I O N O N T H E
P R OT E C T I O N , P R O M OT I O N A N D S U P P O RT
BREASTFEEDING
OF
The Innocenti Declaration was developed and adopted by participants in the
WHO–UNICEF policymakers’ meeting ‘Breastfeeding in the 1990s: a global
initiative’, which was jointly sponsored by the United States Agency for
International Development and the Swedish International Development Authority
and held at the Spedale degli Innocenti in Florence, Italy, from 30 July to 1
August 1990. The declaration reflects the content of the original background
document for the meeting and the views expressed in group and plenary
sessions.
RECOGNISING that
Breastfeeding is a unique process that:
• provides ideal nutrition for infants and contributes to their healthy
growth and development
• reduces incidence and severity of infectious diseases, thereby lowering
infant morbidity and mortality
• contributes to women’s health by reducing the risk of breast and
ovarian cancer, and by increasing the spacing between pregnancies
• provides social and economic benefits to the family and the nation
• provides most women with a sense of satisfaction when successfully
carried out
and that Recent Research has found that:
• these benefits increase with increased exclusiveness* of breastfeeding
during the first six months of life, and thereafter with increased
duration of breastfeeding with complementary foods, and
• programme intervention can result in positive changes in breastfeeding
behaviour
WE THEREFORE DECLARE that
As a global goal for optimal maternal and child health and nutrition, all
women should be enabled to practise exclusive breastfeeding and all
infants should be fed exclusively on breastmilk from birth to 4–6 months of
*
Exclusive breastfeeding means that no other drink or food is given to the infant; the
infant should feed frequently and for unrestricted periods.
Infant Feeding Guidelines for Health Workers
419
A PPENDIX B
age. Thereafter, children should continue to be breastfed, while receiving
appropriate and adequate complementary foods, for up to two years of age
or beyond. This child-feeding ideal is to be achieved by creating an
appropriate environment of awareness and support so that women can
breastfeed in this manner.
Attainment of this goal requires, in many countries, the reinforcement of a
‘breastfeeding culture’ and its vigorous defence against incursions of a
‘bottle-feeding culture’. This requires commitment and advocacy for social
mobilization, utilizing to the full the prestige and authority of
acknowledged leaders of society in all walks of life.
Efforts should be made to increase women’s confidence in their ability to
breastfeed. Such empowerment involves the removal of constraints and
influences that manipulate perceptions and behaviour towards
breastfeeding, often by subtle and indirect means. This requires sensitivity,
continued vigilance, and a responsive and comprehensive communications
strategy involving all media and addressed to all levels of society.
Furthermore, obstacles to breastfeeding within the health system, the
workplace and the community must be eliminated.
Measures should be taken to ensure that women are adequately nourished
for their optimal health and that of their families. Furthermore, ensuring
that all women also have access to family planning information and
services allows them to sustain breastfeeding and avoid shortened birth
intervals that may compromise their health and nutritional status, and that
of their children.
All governments should develop national breastfeeding policies and set
appropriate national targets for the 1990s. They should establish a national
system for monitoring the attainment of their targets, and they should
develop indicators such as the prevalence of exclusively breastfed infants
at discharge from maternity services, and the prevalence of exclusively
breastfed infants at four months of age.
National authorities are further urged to integrate their breastfeeding
policies into their overall health and development policies. In so doing
they should reinforce all actions that protect, promote and support
breastfeeding within complementary programmes such as prenatal and
perinatal care, nutrition, family planning services, and prevention and
treatment of common maternal and childhood diseases. All healthcare staff
should be trained in the skills necessary to implement these breastfeeding
policies.
420
Infant Feeding Guidelines for Health Workers
A PPENDIX B
Operational targets
All governments by the year 1995 should have:
• appointed a national breastfeeding coordinator of appropriate authority,
and established a multisectoral national breastfeeding committee
composed of representatives from relevant government departments,
non-governmental organizations, and health professional associations
• ensured that every facility providing maternity services fully practises
all ten of the Ten Steps to Successful Breastfeeding set out in the joint
WHO–UNICEF statement ‘Protecting, promoting and supporting
breastfeeding: the special role of maternity services’**
• taken action to give effect to the principles and aim of all Articles of
the International Code of Marketing of Breast-Milk Substitutes and
subsequent relevant World Health Assembly resolutions in their
entirety, and
• enacted imaginative legislation protecting the breastfeeding rights of
working women and established means for its enforcement.
We also call upon international organizations to:
• draw up action strategies for protecting, promoting and supporting
breastfeeding, including global monitoring and evaluation of their
strategies
• support national situation analyses and surveys and the development of
national goals and targets for action; and
• encourage and support national authorities in planning, implementing,
monitoring and evaluating their breastfeeding policies.
** World Health Organization, Geneva, 1989.
Infant Feeding Guidelines for Health Workers
421
A PPENDIX B
APPENDIX C
R OYA L A U S T R A L I A N C O L L E G E O F G E N E R A L
PRACTITIONERS: BREASTFEEDING POSITION
S TAT E M E N T
The RACGP position statement on breastfeeding was endorsed on 9–10 December
2000 and formally published on 7 February 2001. It reads as follows.
Aim
• To protect, promote and support breastfeeding in Australia in ways that
optimise maternal and child health.
• To assist GPs to provide information and support for breastfeeding
women, their babies and their families.
• To raise awareness among GPs of the important role they can play in
supporting breastfeeding women.
Principles
In 1999, UNICEF recommended that babies be exclusively breastfed for
about the first 6 months of life.1 They recommended that breastfeeding
should be sustained until the baby was at least 2 years old, but beginning
at about 6 months breastmilk should be complemented with appropriate
solid food
They stated that mothers have the right to breastfeed wherever and
whenever their baby requires and that breastfeeding mothers in the paid
work force should be supported to continue breastfeeding.
Background
Breastfeeding provides infants with optimal nutrition; human milk is
specific for human babies. Research studies have demonstrated that when
infants are not fed on human milk they may be more likely to experience
gastrointestinal 2 and respiratory infections3 , asthma4 , otitis media5 , urinary
tract infections 6 , necrotising enterocolitis7 , insulin-dependent diabetes8 ,
inflammatory bowel disease9 , lymphoma10 and atopy.11 Continued research
is required to determine the full health benefits of human milk for infants.
Breastfeeding is also beneficial for women’s health. Breastfeeding women
have less postpartum bleeding12 , delayed resumption of ovulation13 ,
improved bone remineralization postpartum14 and less ovarian15 and
premenopausal breast cancer.16
Infant Feeding Guidelines for Health Workers
423
A PPENDIX C
Breastfeeding may facilitate mother-infant bonding, saves the family money
and protects the environment.
Position of the College
The RACGP supports the NHMRC Infant Feeding Guidelines (1996).17
General practitioners should have the knowledge and skills to help
mothers and babies with common breastfeeding difficulties.
The WHO International Code of Marketing of Breast-milk Substitutes [see
Appendix J] seeks to ensure that infant formula is not marketed or
distributed in ways that interfere with breastfeeding. The RACGP supports
the WHO Code and will not accept practices that undermine the Code.
Only information that is scientific and factual should be accepted by GPs
from the infant formula industry. GPs should also be careful not to
inadvertently undermine, by the display of artificial feeding materials,
industry’s public commitment not to advertise its products to the general
public.
The RACGP supports the Baby Friendly Hospital Initiative (BFHI) in
Australia. This is a global UNICEF–WHO initiative based on the ‘Ten Steps
to Successful Breastfeeding’. The BFHI improves breastfeeding practices in
maternity hospitals, as the basis of protection, promotion and support of
breastfeeding in the community.18 Mothers of newborn babies should
receive adequate assistance to establish and maintain breastfeeding,
whether in hospital or at home.
The RACGP supports breastfeeding as a normal part of life, and will
continue to facilitate education in normal lactation and common
breastfeeding difficulties for GP registrars and practicing GPs. The RACGP
supports breastfeeding women GPs and registrars in medical settings.
Recommended role for GPs
The RACGP recommends that:
• GPs support and encourage breastfeeding in the community
• GPs promote breastfeeding as the optimal infant feeding method to
pregnant women and their partners
• GPs maximise maternal physical and emotional well being to assist new
mothers in the early postpartum weeks during establishment of
breastfeeding
• GPs make mothers aware of mother-to-mother support groups, such as
the Australian Breastfeeding Association (ABA)
• GPs become skilled in the diagnosis and management of common
breastfeeding problems. When specialised help is needed, doctors
should refer to experienced health workers, such as International Board
424
Infant Feeding Guidelines for Health Workers
A PPENDIX C
Certified Lactation Consultants (IBCLCs), NMAA breastfeeding
counsellors or other qualified workers. The NH&MRC Infant Feeding
Guidelines (1996) provide information on the management of
breastfeeding problems17
• GPs prescribe medication that is compatible with breastfeeding. If in
doubt, consult a reference centre knowledgeable about drugs in
lactation
• GPs encourage exclusive breastfeeding for the first 6 months and then
gradual introduction of suitable foods. Breastfeeding may continue as
long as the mother and child wish to continue, and weaning should be
gradual
• GPs support and advise women who, for a variety of reasons, are
unable to breastfeed their babies
• GPs acknowledge that even partial breastfeeding is of great value.
REFERENCES
1.
UNICEF. Breastfeeding: foundation for a healthy future.
2.
Howie PW et al. Protective effect of breastfeeding against infection. Br
Med J 1990;300:11–16.
3.
Raisler J, Alexander C, O’Campo P. Breastfeeding and infant illness: a
dose–response relationship? Am J Publ Hlth 1999;89(1):25–30.
4.
Oddy W, Holt P, Sly P, Read A, Landau L, Stanley F et al. Association
between breastfeeding and asthma in 6 year old children: findings of a
prospective birth cohort study. BMJ 1999;319:815–19.
5.
Scariati P, Grummer-Strawn L, Fein S. A longitudinal analysis of infant
morbidity and the extent of breastfeeding in the United States. Pediatrics
1997;99(6):E5.
6.
Pisacane A, Graziano L, Mazarella G, Scarpellino B, Zona G. Breastfeeding
and urinary tract infection. J Pediatrics 1992;120:87–9.
7.
Lucas A, Cole TJ. Breast milk and neonatal necrotising enterocolitis. Lancet
1990;336:1519–23.
8.
Gerstein HC. Cow’s milk exposure and type I diabetes mellitus. A critical
overview of the clinical literature. Diabetes Care 1994;17:13–19.
9.
Rigas A, Rigas B, Glassman M, Yen YY, Lan SJ, Petridou E et al. Breastfeeding and maternal smoking in the etiology of Crohn’s disease and
ulcerative colitis in childhood. Ann Epidemiol 1993;3:387–92.
10.
Shu XO, Clemens J, Zheng W, Ying DM, Ji BT, Jin F. Infant breastfeeding
and the risk of childhood lymphomas and leukaemia. Int J Epidemiol
1995;24:27–32.
11.
Saarinen UM, Kajosaari M. Breastfeeding as prophylaxis against atopic
disease: prospective follow-up study until 17 years old. Lancet
1995;346:1065–9.
Infant Feeding Guidelines for Health Workers
425
A PPENDIX C
12.
Chua S, Arulkumaran S, Lim I, Selamat N, Ratnam SS. Influence of
breastfeeding and nipple stimulation on postpartum uterine activity. Br J
Obstet Gynaecol 1994;101:804–5.
13.
Kennedy KI, Visness CM. Contraceptive efficacy of lactational
amenorrhoea. Lancet 1992;339:227–30.
14.
Cumming RG, Klineberg RJ. Breastfeeding and other reproductive factors
and the risk of hip fractures in elderly women. Int J Epidemiol
1993;22:684–91.
15.
Rosenblatt KA, Thomas DB. WHO collaborative study of neoplasia and
steroid contraceptives. Int J Epidemiol 1993;22:192–7.
16.
Newcomb PA, Storer BE, Longnecker MP, Mittendorf R, Greenberg ER,
Clapp RW. Lactation and a reduced risk of premenopausal breast cancer. N
Engl J Med 1994;330:81–7.
17.
NHMRC Infant Feeding Guidelines <http://www.health.gov.au/nhmrc/
publicat/n-home.htm>, 1996; NHMRC Children’s Dietary Guidelines,
chapter on breastfeeding <http://www.health.gov.au/nhmrc/publicat/nhome.htm>, 1996.
18.
World Health Organization. Evidence for the ten steps to successful
breastfeeding. Geneva: Division of Child Health and Development, WHO,
1998.
426
Infant Feeding Guidelines for Health Workers
A PPENDIX C
APPENDIX D
BREASTFEEDING PROGRAM
O F H E A LT H A N D A G E I N G
OF THE
D E PA R T M E N T
Relatively simple, cost-effective measures such as breastfeeding can have a
significant impact on the health of women and children.
In recognition of this, the Commonwealth Government made a commitment
through the policy document Health throughout Life to encourage breastfeeding
awareness, with the aim of increasing Australia’s rate of breastfeeding,
particularly for babies up to 6 months of age. Australia’s target for breastfeeding
for the year 2000 was to have 80 per cent of babies at least partially breastfed up
to 6 months of age.
The National Breastfeeding Strategy takes a multi-faceted approach:
•
family education
•
national accreditation standards for maternal and infant care services
•
employer support
•
education of health professionals
•
Indigenous health
•
data collection
•
antenatal educators.
Family education
Education materials target the family, particularly fathers, ethnic and cultural
groups, and disadvantaged socio-economic groups. Hard copies of these
materials are available through the Australian Breastfeeding Association. Online
versions can be downloaded, as follows:
•
7 Helpful Hints for Learning to Breastfeed (1998)
•
7 Helpful Hints for Solving Breastfeeding Problems (1998)
•
7 Reasons Why Mother’s Milk is Better for Your Baby and You (1998)
•
7 Important Facts for Fathers about Breastfeeding (1998)
•
7 Suggestions for Breastfeeding Your Baby—anywhere, anytime (1998)
•
non–English language materials (1998)
•
Let’s Give Our Baby the Best (1998)
•
Mother’s Milk—perfect anytime anywhere (1998)
•
You Can Breastfeed Your Baby (1998)
A practical, evidence-based antenatal education breastfeeding package is being
developed. The package will be provided to antenatal educators nationally for
Infant Feeding Guidelines for Health Workers
427
A PPENDIX D
inclusion in antenatal education programs. A video produced as part of this
package will be provided to obstetricians nationally.
National accreditation standards for maternal and infant care services
The national accreditation standards for integrated maternal and infant care
services have a strong emphasis on support for the initiation and maintenance of
breastfeeding and on the transfer of support and encouragement from hospital to
community health services.
Employer support
The Department of Health and Ageing has produced an insert, on the topic of
supportive workplace initiatives for women who are breastfeeding, for the
Department of Workplace Reform and Small Business newsletter Work and
Family; it has also been distributed nationally to employers. The insert is based
on the DWRSB’s booklet Guide to Combining Breastfeeding and Work. Materials
aimed at employers, employees and workplaces and providing information about
combining breastfeeding and employment are also being developed:
•
Balancing Breastfeeding and Work—booklet
•
Balancing Breastfeeding and Work—poster
•
Balancing Breastfeeding and Work—pamphlet
•
non–English language materials in Arabic, Chinese, Spanish, Turkish and
Vietnamese.
Education of health professionals
A companion document to the Infant Feeding Guidelines for Health Workers has
been developed. Titled Naturally: the facts about breastfeeding, it contains fact
sheets for health workers to use during consultations with mothers and is
available for purchase through government bookshops. Breastfeeding education
kits have been produced for community-based health professionals by the
Australian Breastfeeding Association (formerly the Nursing Mothers Association
of Australia) in partnership with the Royal Australian College of General
Practitioners, the Division of Paediatrics, the Royal Australasian College of
Physicians (formerly the Australian College of Paediatrics), the Royal College of
Nursing, Australia, and the Pharmaceutical Society of Australia. The kits contain a
best-practice guide to the management of breastfeeding problems, a lactation
resource guide, and examples of consumer materials drawn from the family
education project. They have been distributed to all practising GPs and
paediatricians, all child health clinics, and all pharmacies nationally. A
continuing education module on breastfeeding has also been produced for each
group of health professionals, as well as pharmacy assistants. Online versions
can be downloaded:
428
Infant Feeding Guidelines for Health Workers
A PPENDIX D
•
•
•
•
•
•
Best Practice Guide to the Management of Common Breastfeeding Problems
(1999)
Lactation Resource Directory (1999)
Breastfeeding CHECK Module (1999)
Continuing Pharmacy Education Module on Breastfeeding (1999)
Continuing Education Module for Child Health Nurses (1999)
Breastfeeding Education Module for Pharmacy Assistants (1999).
Indigenous health
An audit has been undertaken of current training in breastfeeding support and
infant nutrition for Aboriginal and Torres Strait Islander health workers and other
professionals providing health care to Aboriginal and Torres Strait Islander
women. A review has also been undertaken of current interventions and
identification of best practice currently used by community-based Indigenous
health service providers in promoting and supporting breastfeeding and
appropriate infant nutrition. The outcomes of these reviews will be taken up in
the broader context of the development of a national approach to the nutrition of
Indigenous Australians.
A book of breastfeeding stories has been prepared for Indigenous communities.
It presents case histories of programs and projects run by Indigenous services
and organisations to promote and support breastfeeding and infant nutrition.
Data collection
A framework for monitoring national breastfeeding rates will be established as
part of a National Nutrition Monitoring Program. This project will involve the
development of consistent breastfeeding definitions and standardised questions
to monitor breastfeeding rates, thereby establishing a framework through which,
for the first time, breastfeeding rates across Australia can be consistently and
accurately monitored.
Antenatal educators
The following resources are available for antenatal educators:
•
Breastfeeding and You: a handbook for antenatal educators
•
Breastfeeding and You: preparing the way.
For further information, see the Breastfeeding Fact Sheet.
[Last updated on 15 August 2000 by the Population Health Division,
Commonwealth Department of Health and Ageing (www.health.gov.au/pubhlth/
strateg/ brfeed/index.htm). For further information, contact the Population Health
Division (telephone 02 6289 1555).]
Infant Feeding Guidelines for Health Workers
429
A PPENDIX D
APPENDIX E
F E E D I N G L OW - B I RT H W E I G H T
(FINGER FEEDING)
P R E - T E R M I N FA N T S
We n d y O d d y
When supplementation is thought necessary, alternatives to bottles and teats—
including lactation aids and feeding with a cup, spoon or eyedropper—or finger
feeding, may be sought. Although finger feeding is a technique that allows a
baby to be fed without giving him or her an artificial nipple, it is also a method
that helps train the baby to take the breast and is particularly useful for pre-term
infants.
Finger feeding can be used in a number of situations:
•
The baby refuses the breast or is too tired to nurse.
•
The baby does not latch on well and therefore does not get milk well.
•
The baby is separated from its mother.
•
Breastfeeding is stopped temporarily.
•
The mother’s nipples are so sore that she cannot put the baby to her
breast, although proper positioning and good latching-on help sore nipples
more often than finger feeding.
Finger feeding is more like breastfeeding than bottle-feeding and is best used to
prepare a baby to take the breast. The baby must keep his or her tongue down
and forward over the gums, with the mouth wide open and jaw forward. The
motion of the tongue and jaw is similar to that when feeding at the breast.
Infant Feeding Guidelines for Health Workers
431
A PPENDIX E
Box E.1 Instructions for finger feeding
1. Wash your hands.
2. Position yourself and the baby comfortably, the baby’s head being supported with one
hand behind the shoulders. Any comfortable position is appropriate.
3. Use a feeding tube—#5F, 36 inches (90 centimetres) long—and a feeding bottle with
expressed breastmilk or, if necessary, formula, depending on the situation. The feeding
tube is passed through an enlarged feeding hole in the bottle into the fluid.
4. Line up the tube so it sits on the soft part of the index finger, with the end of the tube
protruding no further than the end of your finger. Grip the tube about where it makes a
gentle curve between the thumb and middle finger and position your index finger above
the tube. There should be no need to tape the tube to your finger.
5. Using the finger with the tube, tickle the baby’s mouth gently until they open their
mouth wide enough to let the finger enter. Usually the baby will begin to suckle; and
receiving food will usually awaken a sleeping baby.
6. Insert your finger with the tube so that the soft part of the finger remains upwards and
flat. The baby will probably begin sucking on the finger and will not gag unless full from
another feed.
7. Pull the baby’s chin down if the lower lip is sucked inwards.
8. The technique is working if the baby is drinking. If the flow is slow, raise the bottle above
the baby’s head. Keep the finger as straight as possible, flattening the baby’s tongue and
working the lower jaw forward.
Note: This technique is in use at Baby Friendly hospitals in Australia, although no published
references to any clinical trials using this technique have been found.
Source: Newman J. Breastfeeding problems associated with the early introduction of bottles
and pacifiers. J Hum Lact 1990;6(2):59–63.
432
Infant Feeding Guidelines for Health Workers
A PPENDIX D
APPENDIX F
PHARMACEUTICAL
A N D OT H E R D RU G S A N D
BREASTFEEDING
Table F.1
Drugs and other substances requiring careful assessment of
risk before prescription to breastfeeding women
Category
Drug or compound
Management plan and rationale
Analgesic drugs
Pethidine (C),
oxycodone (C)
Use alternatives. Breastfed infants whose
mothers are receiving meperidine had a
higher risk of neurobehavioural depression
than breastfed infants whose mothers were
receiving morphine. In breastfed infants, the
level of exposure to oxycodone may reach
10 per cent of the therapeutic dose. For
potent analgesia, morphine may be given
cautiously. Paracetamol (C) and nonsteroidal anti-inflammatory drugs (C) are safe.
Anti-arthritis drugs
Gold salts,
methotrexate (D),
high-dose aspirin
Consider alternatives to gold therapy.
Although the bioavailability of elemental gold
is unknown, a small amount is excreted in
breastmilk for a prolonged period. Therefore,
the total amount of elemental gold an infant
could ingest may be substantial. No toxicity
has been reported. Consider alternatives to
methotrexate therapy, although low-dose
methotrexate therapy for breastfeeding
women with rheumatic diseases has lower
risks of adverse effects in their infants than
does anticancer chemotherapy. High-dose
aspirin should be used with caution, since
there is a case report of metabolic acidosis in
a breastfed infant whose mother was
receiving high-dose therapy. Although the risk
seems small, the infant’s condition should be
monitored clinically if the mother is receiving
long-term therapy with high-dose aspirin.
Anticoagulant drugs Phenindione (D)
Use alternatives. Currently available vitamin K
antagonists such as warfarin (D) and
acenocoumarol are considered safe, as is
heparin.
continued next page
Infant Feeding Guidelines for Health Workers
433
A PPENDIX F
Table F.1 continued
Category
Drug or compound
Management plan and rationale
Antidepressant
drugs and lithium
Fluoxetine (C),
doxepin (C), lithium (D)
Use with caution. Although the concentrations
of these drugs in breastmilk are low, colic
(with fluoxetine) and sedation (with doxepin)
have been reported in exposed infants. Near
therapeutic plasma concentrations of
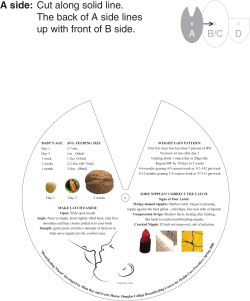


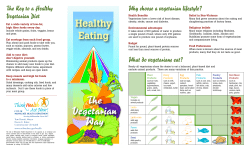
© Copyright 2026