
Myth Busting – The Network Layer Homework Contents
Myth Busting – The Network Layer
Homework
Contents
Overview ......................................................................................................................................... 2
Gather Gear ..................................................................................................................................... 2
Bring Your Own Gear ................................................................................................................. 2
Mini-Switch ................................................................................................................................ 2
Install Software ............................................................................................................................... 3
Linux ........................................................................................................................................... 3
OS X............................................................................................................................................ 4
Windows ..................................................................................................................................... 5
Validate Connectivity ..................................................................................................................... 8
Linux & OS X ............................................................................................................................. 8
Windows ..................................................................................................................................... 9
Practice Using the Toolkit ............................................................................................................ 11
Linux + OS X ............................................................................................................................ 11
Edit text files ......................................................................................................................... 11
Run cycle-iperf.bat ................................................................................................................ 12
Save Data .............................................................................................................................. 14
Windows ................................................................................................................................... 15
Load iPerf Server .................................................................................................................. 15
Edit text files ......................................................................................................................... 15
Run cycle-iperf...................................................................................................................... 16
Save Data .............................................................................................................................. 20
cycle-wget ..................................................................................................................................... 20
Summary ....................................................................................................................................... 23
Appendix ....................................................................................................................................... 26
Terminology.............................................................................................................................. 26
Bandwidth and Throughput .................................................................................................. 26
Megabytes versus Mebibytes ................................................................................................ 26
Windows Details ....................................................................................................................... 27
Myth-Busting—The Network Layer / Homework
Chris Shaiman & Stuart Kendrick
1
Created: 2014-07-05
Updated: 2014-10-04
Overview
This document specifies the homework for the Myth-Busting – The Network Layer classes
facilitated by Stuart Kendrick1 and Chris Shaiman: mostly, it covers the installation of the
Myth-Busting Toolkit, the use of which is central to the curriculum.
We recommend starting this homework several weeks prior to attending class -- you have a lot of
parts & gear to assemble, along with a handful of hours of software installation to perform on
your laptop.
Skim through the deck to get a feel for how we will spend the day:
http://www.skendric.com/seminar/myth/Myth-Busting-The-Network-Layer-Deck.pdf
Arrive 30-60 minutes early to class, to set-up your laboratory gear and build the class network.
Gather Gear
Bring Your Own Gear
For this class, you must bring your own gear; we do not provide this.
One (1) laptop running the Myth-Busting Toolkit: cycle-iperf, cycle-wget, gnuplot, Wireshark
Four (4) Cat 5 or Cat 6 Ethernet cables: 3’, 6’, 10’, 15’2
One (1) power strip
One (1) mini-switch (see approved list on following page)
Feel free to share a power-strip and mini-switch with another student – if you’re attending with a
buddy and want to shave luggage space and costs, go for it.
Every team needs at least two computers, which is why we claim that every student must bring a
laptop.
Mini-Switch
You can bring any mini-switch you want, so long as its ports support 10/100/1000 Ethernet.
However, realize that a few of the adventures – ones which involve LACP, Jumbo Frames,
VLANs, etc. – require a feature-rich mini-switch, like one of the following3:
Low-End: Minimal feature set
1
If you run into bumps executing this homework, feel free to drop me questions: stuart dot kendrick dot sea at g
mail dot com, where you replace the word 'dot' with the '.' symbol and the word 'at' with the '@' symbol.
2
You will want four Ethernet cables, of roughly varying lengths from 3’ to 15’. The lengths we specify here are
guidelines, not a requirement.
3
I have worked with all of these except for the NetGear GS 180Tv2. --sk
Myth-Busting—The Network Layer / Homework
Chris Shaiman & Stuart Kendrick
2
Created: 2014-07-05
Updated: 2014-10-04
NetGear GS 105Ev2 – Require Windows-only management app
NetGear GS 108Ev2 – Require Windows-only management app
Mid-Range: Basic feature Set
HP 1810-8Gv2
High-End: Enterprise feature set
Cisco SG-200-084
MicroTik RB750GL
NetGear GS 108Tv2
The switches in green/italics are the only ones which support Jumbo Frames – if you’re
interested in bench-marking Jumbo Frames, then bring one of these. But any of these will work.
Typical cost: $60 - $100. Do not bring a switch cooled by a fan – too noisy.
Install Software
In this seminar, we rely heavily on a set of open-source tools, plus a couple in-house scripts
(cycle-iperf and cycle-wget): collectively, we call this the Myth-Busting Toolkit. In this
section you will install that tool kit. Install this tool kit on two machines: the laptop (aka ‘Your
Laptop’, aka YL) which you will bring with you to class plus some other machine (aka ‘Your
Imaginary Partner’s Machine’, aka YIPM).
Linux
1. Download http://www.skendric.com/seminar/myth/homework/Myth-BustingToolkit.tar.gz and uncompress/untar in your home directory.
cd
tar xvfz Myth-Busting-Tools.tar.gz
2. This creates the directory structure ~/Myth-Busting – explore it.
3. Verify that you have version 1.1.0+
grep version ~/Myth-Busting/version.txt
Myth-Busting-Toolkit version 1.1.0
4. Install iperf and gnuplot using your favorite package manager
sudo apt-get install iperf gnuplot
5. Install a recent release of Wireshark (1.12.0 or better)
sudo add-apt-repository ppa:whoopie79/ppa
sudo apt-get update
sudo apt-get install wireshark libcap2-bin
setcap 'CAP_NET_RAW+eip CAP_NET_ADMIN+eip' /usr/bin/dumpcap
groupadd wireshark
usermod -a -G wireshark {your username}
chgrp wireshark /usr/bin/dumpcap
ln -s /usr/bin/dumpcap /usr/local/tools/dumpcap
setcap cap_net_raw,cap_net_admin=eip /usr/bin/dumpcap
A Note on Versions
4
The GUI management interface suggests that this switch supports Jumbo Frames; but it doesn't -- and if you read
the fine-print in the manual, you'll see that Cisco documents this lack.
Myth-Busting—The Network Layer / Homework
Chris Shaiman & Stuart Kendrick
3
Created: 2014-07-05
Updated: 2014-10-04
We rely heavily on features in iperf-2.0.5 and gnuplot-4.6.0+ -- patch level doesn't matter but
version number does.
iperf --version
iperf version 2.0.5 (08 Jul 2010) pthreads
gnuplot --version
gnuplot 4.6 patchlevel 1
On my system, apt-get install gnuplot gave me gnuplot v4.4, which is too old. Here’s
what I did to install gnuplot 4.65:
sudo add-apt-repository ppa:gladky-anton/gnuplot
sudo apt-get dist-upgrade
OS X
1. Download http://www.skendric.com/seminar/myth/homework/Myth-BustingToolkit.tar.gz and uncompress/untar in your home directory.
cd
tar xvfz Myth-Busting-Toolkit.tar.gz
2. This creates the directory structure ~/Myth-Busting – explore it.
3. Verify that you have version 1.1.0+
grep version ~/Myth-Busting/version.txt
Myth-Busting-Toolkit version 1.1.0
4. Install Xcode
{ via the App Store }
{ then acknowledge the license using the following: }
sudo xcodebuild -license
5. Install MacPorts
http://www.macports.org/install.php
6. Install gnuplot
sudo port install gnuplot
7. Install iperf
http://rudix.org/packages/iperf.html
8. Install XQuartz
http://xquartz.macosforge.org/landing/
9. Install a recent release of Wireshark (1.12.0 or better)
http://www.wireshark.org/download.html
A Note on Versions
We rely heavily on features in iperf-2.0.5 and gnuplot-4.6.0+ -- patch level doesn't matter but
version number does.
iperf --version
iperf version 2.0.5 (08 Jul 2010) pthreads
gnuplot --version
5
I realize that this is not the safest approach to installing packages – use at your own risk.
Myth-Busting—The Network Layer / Homework
Chris Shaiman & Stuart Kendrick
4
Created: 2014-07-05
Updated: 2014-10-04
gnuplot 4.6 patchlevel 5
Windows
1. Download http://www.skendric.com/seminar/myth/homework/Myth-Busting-Toolkit.zip
and unzip.
2. Find the resulting C:\Myth-Busting folder and move it to some convenient location -- in
this document, I assume that you've moved it to the top level of C:\, e.g. C:\Myth-Busting
3. Explore the C:\Myth-Busting folder
4. Verify that you have version 1.1.0+
type C:\Myth-Busting\version.txt
Myth-Busting-Toolkit version 1.1.0
[...]
5. Install gnuplot by running C:\Myth-Busting\Tools\gp466-win32-setup.exe
6. Update your path variable to include gnuplot’s directory
7. Install a recent release of Wireshark (1.12.0 or better)
http://www.wireshark.org/download.html
A Note on Versions
We rely heavily on features in iperf-2.0.5 and gnuplot-4.6.0+ -- patch level doesn't matter but
version number does.
Here is a procedure for executing Step #5:
Fire up the System Control Panel and click on Advanced system settings
Myth-Busting—The Network Layer / Homework
Chris Shaiman & Stuart Kendrick
5
Created: 2014-07-05
Updated: 2014-10-04
In the resulting System Properties dialogue box, click Environment Variables…
Myth-Busting—The Network Layer / Homework
Chris Shaiman & Stuart Kendrick
6
Created: 2014-07-05
Updated: 2014-10-04
In the resulting Environment Variables dialogue box, scroll down until you see the Path variable:
Then click Edit…
At the end of the Variable value field, add the string C:\Program Files (x86)\gnuplot\bin, as
show here. Notice the semi-colon which separates each field – you want that semi-colon.
You will be running gnuplot many times during this seminar – adding gnuplot’s executable
directory to your Path variable will allow you to simply type gnuplot, rather than typing the
entire directory path – that’s why we recommend this step.
Myth-Busting—The Network Layer / Homework
Chris Shaiman & Stuart Kendrick
7
Created: 2014-07-05
Updated: 2014-10-04
Validate Connectivity
Verify that the two machines, YL (Your Laptop) and YIPM (Your Imaginary Partner’s Machine)
are both on-line and can reach other.
1. Figure out the IP address of each machine.
2. Open holes in firewalls between the two: you’ll want ICMP Echo and TCP Port 5001
3. Verify that you can ping and iperf between the two machines.
Here is one way to perform this verification.
Linux & OS X
Ping
On YL, ping YIPM
gnat> ping -c 3 192.168.75.103
PING 192.168.75.103 (192.168.75.103) 56(84) bytes of data.
64 bytes from 192.168.75.103: icmp_req=1 ttl=128 time=2.20 ms
64 bytes from 192.168.75.103: icmp_req=2 ttl=128 time=1.05 ms
64 bytes from 192.168.75.103: icmp_req=3 ttl=128 time=1.02 ms
--- 192.168.75.103 ping statistics --3 packets transmitted, 3 received, 0% packet loss, time 2004ms
rtt min/avg/max/mdev = 1.022/1.426/2.206/0.552 ms
gnat>
Now, do the same from YIPM to YL (example not shown).
iperf
On YIPM, load iperf in server mode:
aphid> iperf -s
-----------------------------------------------------------Server listening on TCP port 5001
TCP window size: 85.3 KByte (default)
On YL, run iperf against YIPM; here is what success looks like:
gnat> iperf -c 192.168.75.103
-----------------------------------------------------------Client connecting to 192.168.75.103, TCP port 5001
TCP window size: 22.5 KByte (default)
-----------------------------------------------------------[ 3] local 192.168.75.128 port 58833 connected with 192.168.75.103 port 5001
[ ID] Interval
Transfer
Bandwidth
[ 3] 0.0-10.1 sec 11.5 MBytes 9.57 Mbits/sec
gnat>
In this example, YL ran a 10 second iPerf test against YIPM, transferred and 11.5 MB during
this test for an average throughput6 of 9.57 Mb/s.
And here is what failure looks like:
gnat> iperf -c 192.168.75.103
6
See the Appendix for terminology.
Myth-Busting—The Network Layer / Homework
Chris Shaiman & Stuart Kendrick
8
Created: 2014-07-05
Updated: 2014-10-04
connect failed: Connection timed out
gnat>
Perhaps iperf isn’t running in server mode on YIPM or perhaps a firewall is blocking
communication.
Now, do the same from YIPM to YL (example not shown).
Windows
Ping
On YL, ping YIPM
Now, do the same from YIPM to YL (example not shown).
iPerf
On YIPM, open a command prompt and run iperf in server mode.
Myth-Busting—The Network Layer / Homework
Chris Shaiman & Stuart Kendrick
9
Created: 2014-07-05
Updated: 2014-10-04
On YL, run iperf.exe against YIPM; here is what success looks like:
In this example, YL ran a 10 second iPerf test against YIPM, transferred and 679 MB during this
test for an average throughput7 of 570 Mb/s.
Here is what failure looks like:
7
See the Appendix for terminology.
Myth-Busting—The Network Layer / Homework
Chris Shaiman & Stuart Kendrick
10
Created: 2014-07-05
Updated: 2014-10-04
Perhaps iperf isn’t running in server mode on YIPM or perhaps a firewall is blocking
communication.
Now do the same from YIPM to YL (example not shown).
Practice Using the Toolkit
Linux + OS X
On YIPM, open a command prompt and run iperf in server mode.
gnat> iperf -s
iperf -s
-----------------------------------------------------------Server listening on TCP port 5001
TCP window size: 85.3 KByte (default)
------------------------------------------------------------
gnat> iperf -s
iperf -s
-----------------------------------------------------------Server listening on TCP port 5001
TCP window size: 85.3 KByte (default)
-----------------------------------------------------------Edit text files
On YL, use your favorite text editor to create C:\Myth-Busting\Data\readme.txt and make it
look something like this:
~/Myth-Busting/Data/type readme.txt
Test: Throughput across an HP 1810-8Gv2 switch
iPerf client: Shuttle SZ77, Win7, Intel Core i5-3550 @ 3.3GHz (4 CPU)
iPerf server: Latitude E6400, Win7, Intel Core Duo T9900 @ 3.06 GHz
Notes: Does switch model affect throughput?
Myth-Busting—The Network Layer / Homework
Chris Shaiman & Stuart Kendrick
11
Created: 2014-07-05
Updated: 2014-10-04
Edit C:\Myth-Busting\Data\iperf-throughput.gp and change the first line to describe this
test:
long_title
= "iPerf Throughput over HP 1810-8Gv2 "
Run cycle-iperf.bat
On YL, switch back to ~/Myth-Busting/Tools to run cycle-iperf for the first time:
gnat> ./cycle-iperf
Must specify -i {ipaddr or hostname}
Usage: cycle-iperf -a {ipaddr or hostname} [-h] [-i {iterations}] [-s
{seconds}] [-w {TCP window}] [-b {buffer}] [-f {output file}]
gnat>
Protip
cycle-iperf.bat won’t do anything useful unless you specify the IP address or
hostname of an iPerf server.
OK, let’s do some actual work using cycle-iperf:
gnat> ./cycle-iperf -a 192.168.75.103
Deleting files from previous run
+++++++++++++++++++++++++++++++++++++++++++++++++++++++++++++++++++++++++
I will run the following command 10 times, sleeping 2 seconds between
each iteration:
iperf -c 192.168.75.103 -w 64K -l 8K -y C
and will store the output in:
/home/skendric/Myth-Busting/Data/cycle-iperf-output.csv
/home/skendric/Myth-Busting/Data/cycle-iperf-output.txt
/home/skendric/Myth-Busting/Data/cycle-iperf-output.png
Stalling for 5 seconds, hit Ctrl-C if you want to pause or cancel
Beginning iPerf cycle: 10 iterations
Starting iPerf iteration 1 at 14:40:02
Starting iPerf iteration 2 at 14:40:14
Starting iPerf iteration 3 at 14:40:26
Starting iPerf iteration 4 at 14:40:38
Starting iPerf iteration 5 at 14:40:50
Starting iPerf iteration 6 at 14:41:02
Starting iPerf iteration 7 at 14:41:14
Starting iPerf iteration 8 at 14:41:26
Starting iPerf iteration 9 at 14:41:38
Starting iPerf iteration 10 at 14:41:50
Producing throughput file using this command:
cut -d, -f9 /home/skendric/Myth-Busting/Data/cycle-iperf-output.csv >
/home/skendric/Myth-Busting/Data/cycle-iperf-output.txt
Producing statistics and chart using this command:
cat /home/skendric/Myth-Busting/Data/iperf-throughput.gp | gnuplot
* FILE:
Myth-Busting—The Network Layer / Homework
Chris Shaiman & Stuart Kendrick
12
Created: 2014-07-05
Updated: 2014-10-04
Records:
10
Out of range: 0
Invalid:
0
Blank:
0
Data Blocks:
1
* COLUMN:
Mean:
Std Dev:
Sum:
Sum Sq.:
Minimum:
Maximum:
Quartile:
Median:
Quartile:
69.1714
3.5083
691.7136
47969.8523
62.8991 [ 0]
74.0607 [ 1]
66.4593
68.8879
72.5881
See
/home/skendric/Myth-Busting/Data/cycle-iperf-output.csv for the raw output,
/home/skendric/Myth-Busting/Data/cycle-iperf-output.txt for throughput only,
/home/skendric/Myth-Busting/Data/cycle-iperf-output.png for the chart
This run of cycle-iperf started at
Sun Jul 13 14:39:57 PDT 2014 and ended at Sun Jul 13 14:42:02 PDT 2014
========================================================================
gnat>
By default, cycle-iperf invokes iperf, points it at the specified IP address or hostname, and
executes ten cycles, sleeping for a couple seconds between each cycle. The resulting iPerf
output data is stored in a file named cycle-iperf-output.csv, a subset of that output is stored in
cycle-iperf-output.txt. cycle-iperf then invokes gnuplot, which relies on iperf-throughput.gp to
tell it to read cycle-iperf-output.txt and to produce cycle-iperf-output.png. In general, we will
only be interested in cycle-iperf-output.png.
cycle-iperf
1. Uses iperf.exe to produce cycle-iperf-output.csv
2. Uses cut to copy the last column of cycle-iperf-output.csv into cycle-iperf-output.txt
3. Uses gnuplot to process cycle-iperf-output.txt into cycle-iperf-output.png, relying on
iperf-throughput.gp for instructions
Most of the time, we only examine cycle-iperf-output.png.
Let’s go over to the Data directory and examine the output:
gnat> pwd
/home/skendric/Myth-Busting/Data
gnat> ls -l
total 24
-rw-rw-r-- 1 skendric skendric 870
-rw-rw-r-- 1 skendric skendric 8710
-rw-rw-r-- 1 skendric skendric 100
-rw-rw-r-- 1 skendric skendric 1848
gnat>
Myth-Busting—The Network Layer / Homework
Chris Shaiman & Stuart Kendrick
Jul
Jul
Jul
Jul
13
13
13
13
13
14:42
14:42
14:42
14:10
cycle-iperf-output.csv
cycle-iperf-output.png
cycle-iperf-output.txt
iperf-throughput.gp
Created: 2014-07-05
Updated: 2014-10-04
Examine cycle-iperf-output.csv and cycle-iperf-output.txt using a text editor … and then take a
look at cycle-iperf-output.png, perhaps by double-clicking on it.
Image Viewer or Preview (or some similar graphics application) should display something like
the following:
From this, we can see that from our ten trials, the median (aka average) throughput was
~68MB/s, while the worst was ~60 MB/s and the best was ~70MB/s.
According to the title, this test measured throughput across the ‘HP 1810-8Gv2' switch – when
you’re working in class, you’ll want to edit iperf-throughput.gp repeatedly, to change ‘HP 18108Gv2' to something meaningful to each test you perform.
Save Data
Create a subdirectory of Data using a structured naming methodology. We prefer the following;
you can use whatever suits you.
~/Myth-Busting/Data> mkdir 2014-07-06
~/Myth-Busting/Data> cd 2014-07-06
~/Myth-Busting/Data/2014-07-06> mkdir Practice
~/Myth-Busting/Data/2014-07-06> cd Practice
~/Myth-Busting/Data/2014-07-06/Practice> mkdir 1630
Myth-Busting—The Network Layer / Homework
Chris Shaiman & Stuart Kendrick
14
Created: 2014-07-05
Updated: 2014-10-04
~/Myth-Busting/Data/2014-07-06/Practice> cd 1630
~/Myth-Busting/Data/2014-07-06/Practice/1630> copy ../../../* .
The directory ends up looking like this:
gnat> ls -l
total 24
-rw-rw-r-- 1
-rw-rw-r-- 1
-rw-rw-r-- 1
-rw-rw-r-- 1
gnat>
Protip
skendric
skendric
skendric
skendric
skendric 870 Jul 13
skendric 8710 Jul 13
skendric 100 Jul 13
skendric 1848 Jul 13
16:30
16:30
16:30
16:30
cycle-iperf-output.csv
cycle-iperf-output.png
cycle-iperf-output.txt
iperf-throughput.gp
You want some organizational scheme into which to slot your data files, because
you will be creating a lot of them during the seminar.
Windows
Load iPerf Server
On YIPM, open a command prompt and run iperf.exe in server mode.
Edit text files
On YL, use your favorite text editor to create C:\Myth-Busting\Data\readme.txt and make it
look something like this:
C:\Myth-Busting\Data\type readme.txt
Test: Throughput across an HP 1810-8Gv2 switch
iPerf client: Shuttle SZ77, Win7, Intel Core i5-3550 @ 3.3GHz (4 CPU)
iPerf server: Latitude E6400, Win7, Intel Core Duo T9900 @ 3.06 GHz
Notes: Does switch model affect throughput?
Myth-Busting—The Network Layer / Homework
Chris Shaiman & Stuart Kendrick
15
Created: 2014-07-05
Updated: 2014-10-04
Edit C:\Myth-Busting\Data\iperf-throughput.gp and change the first line to describe this
test:
long_title
= "iPerf Throughput over HP 1810-8Gv2 "
Run cycle-iperf
On YL, switch back to C:\Myth-Busting\Tools to run cycle-iperf.bat for the first time:
Protip
cycle-iperf.bat won’t do anything useful unless you specify the IP address or
hostname of an iPerf server.
OK, let’s do some actual work using cycle-iperf.bat
C:\Myth-Busting\Tools>cycle-iperf.bat -c 192.168.1.103
=========================================================================
TCP-based throughput test: verify that the server is running as 'iperf -s'
I will run the following command 10 times, sleeping 2 seconds between
each iteration:
iperf.exe -c 192.168.1.103 -w 64K -l 8K -p 5001 -t 10 -y C
and will store the output in:
C:\Myth-Busting\Data\cycle-iperf-output.csv
C:\Myth-Busting\Data\cycle-iperf-output.txt
C:\Myth-Busting\Data\cycle-iperf-output.png
Myth-Busting—The Network Layer / Homework
Chris Shaiman & Stuart Kendrick
16
Created: 2014-07-05
Updated: 2014-10-04
Stalling for 5 seconds, hit Ctrl-C if you want to pause or cancel
Beginning iPerf cycle: 10 iterations
Starting iPerf iteration 1 at 7:10:02.24
Starting iPerf iteration 2 at 7:10:14.38
Starting iPerf iteration 3 at 7:10:26.51
Starting iPerf iteration 4 at 7:10:38.66
Starting iPerf iteration 5 at 7:10:50.81
Starting iPerf iteration 6 at 7:11:02.99
Starting iPerf iteration 7 at 7:11:15.18
Starting iPerf iteration 8 at 7:11:27.38
Starting iPerf iteration 9 at 7:11:39.57
Starting iPerf iteration 10 at 7:11:51.70
Producing throughput file
Producing statistics and chart
cat.exe C:\Myth-Busting\Data\iperf-throughput.gp | gnuplot.exe
* FILE:
Records:
10
Out of range: 0
Invalid:
0
Blank:
0
Data Blocks:
1
* COLUMN:
Mean:
Std Dev:
Sum:
Sum Sq.:
Minimum:
Maximum:
Quartile:
Median:
Quartile:
1.1953
0.0013
11.9530
14.2875
1.1925 [ 1]
1.1968 [ 0]
1.1949
1.1958
1.1960
See
C:\Myth-Busting\Data\cycle-iperf-output.csv for the raw output,
C:\Myth-Busting\Data\cycle-iperf-output.txt for throughput only, and
C:\Myth-Busting\Data\cycle-iperf-output.png for the chart
This run of cycle-iperf.bat started at Sat 10/04/2014 7:09:57.04
and ended at Sat 10/04/2014 7:12:04.43
=========================================================================
C:\Myth-Busting\Tools>
By default, cycle-iperf.bat invokes iperf.exe, points it at the specified IP address or hostname,
and executes ten cycles, sleeping for a couple seconds between each cycle. The resulting iPerf
output data is stored in a file named cycle-iperf-output.csv, a subset of that output is stored in
cycle-iperf-output.txt. cycle-iperf.bat then invokes gnuplot.exe, which relies on iperfMyth-Busting—The Network Layer / Homework
Chris Shaiman & Stuart Kendrick
17
Created: 2014-07-05
Updated: 2014-10-04
throughput.gp to tell it to read cycle-iperf-output.txt and to produce cycle-iperf-output.png. In
general, we will only be interested in cycle-iperf-output.png.
cycle-iperf.bat
4. Uses iperf.exe to produce cycle-iperf-output.csv
5. Uses cut.exe to copy the last column of cycle-iperf-output.csv into cycle-iperf-output.txt
6. Uses gnuplot.exe to process cycle-iperf-output.txt into cycle-iperf-output.png, relying on
iperf-throughput.gp for instructions
Most of the time, we only examine cycle-iperf-output.png.
Let’s go over to the Data directory and examine the output:
Examine cycle-iperf-output.csv and cycle-iperf-output.txt using a text editor … and then take a
look at cycle-iperf-output.png.
Myth-Busting—The Network Layer / Homework
Chris Shaiman & Stuart Kendrick
18
Created: 2014-07-05
Updated: 2014-10-04
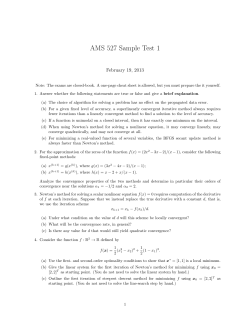
Windows Photo Viewer (or some similar graphics application) should display something like the
following:
Myth-Busting—The Network Layer / Homework
Chris Shaiman & Stuart Kendrick
19
Created: 2014-07-05
Updated: 2014-10-04
From this, we can see that from our ten trials, the median (aka average) throughput was
~68MB/s, while the worst was ~60 MB/s and the best was ~70MB/s.
According to the title, this test measured throughput across the ‘HP 1810-8Gv2' switch – when
you’re working in class, you’ll want to edit iperf-throughput.gp repeatedly, to change ‘HP 18108Gv2' to something meaningful to each test you perform.
Save Data
Create a subdirectory of Data using a structured naming methodology. We prefer the following;
you can use whatever suits you.
C:\Myth-Busting\Data> mkdir 2014-07-06
C:\Myth-Busting\Data> cd 2014-07-06
C:\Myth-Busting\Data\2014-07-06> mkdir Practice
C:\Myth-Busting\Data\2014-07-06> cd Practice
C:\Myth-Busting\Data\2014-07-06\Practice> mkdir 0836
C:\Myth-Busting\Data\2014-07-06\Practice> cd 0836
C:\Myth-Busting\Data\2014-07-06\Practice\0836> copy ..\..\..\*.* .
The directory ends up looking like this:
C:\Myth-Busting\Data\2014-07-06\Practice\0836>dir
Volume in drive C has no label.
Volume Serial Number is E0D8-8557
Directory of C:\Myth-Busting\Data\2014-07-06\Practice\0836
07/06/2014
07/06/2014
07/06/2014
07/06/2014
07/06/2014
07/06/2014
07/06/2014
08:29 AM
<DIR>
.
08:29 AM
<DIR>
..
08:27 AM
810 cycle-iperf-output.csv
08:27 AM
8,681 cycle-iperf-output.png
08:27 AM
110 cycle-iperf-output.txt
08:27 AM
1,919 iperf-throughput.gp
08:32 AM
19 readme.txt
5 File(s)
11,539 bytes
2 Dir(s) 470,143,197,184 bytes free
C:\Myth-Busting\Data\2014-07-06\Practice\0836>
Protip
You want some organizational scheme into which to slot your data files, because
you will be creating a lot of them during the seminar.
cycle-wget
For a few of the Adventures, we provide cycle-wget, which works pretty much the same way
cycle-iperf does, acting as a wrapper around the wget utility. Typically, you will point cyclewget at savage (see the Myth-Busting Class LAN diagram), a PC Engines ALIX board hosting a
copy of http:/www.skendric.com, and cycle-wget will mirror that Web site to a temporary
directory on your laptop, measuring the throughput during each cycle.
Before a cycle-wget run, modify the first line in wget-throughput.gp:
# Define variables
long_title = "wget Throughput across Home Network to Savage"
Myth-Busting—The Network Layer / Homework
Chris Shaiman & Stuart Kendrick
20
Created: 2014-07-05
Updated: 2014-10-04
Update readme.txt:
Test:
Client:
Server:
iPerf:
Notes:
wget Throughput across Home Network to ALIX/nginx Web Server
Shuttle SZ77, Win7, Intel Core i5-3550 @ 3.3GHz (4 CPU)
Latitude E6400, Win7, Intel Core Duo T9900 @ 3.06 GHz
Window 64K, Buffer 8K, Sleep 2s
nginx is hosting a mirror of www.skendric.com
Run cycle-wget:
C:\Myth-Busting\Tools>cycle-wget -u http://192.168.1.108
=======================================================================
I will run the following command 10 times, sleeping 2 seconds between
each iteration:
wget.exe -r -P http://192.168.1.108
and will store the output in:
C:\Myth-Busting\Data\cycle-wget-output.csv
C:\Myth-Busting\Data\cycle-wget-output.txt
C:\Myth-Busting\Data\cycle-wget-output.png
Stalling for 5 seconds, hit Ctrl-C if you want to pause or cancel
To watch wget's progress, run 'tail -f C:\Myth-Busting\Mirror\wgetoutput.log'
Beginning wget cycle: 10 iterations with recursion = 1
Starting wget iteration 1 at 6:50:24.91
Starting wget iteration 2 at 6:50:55.73
Starting wget iteration 3 at 6:51:20.85
Starting wget iteration 4 at 6:51:46.05
Starting wget iteration 5 at 6:52:11.94
Starting wget iteration 6 at 6:52:38.27
Myth-Busting—The Network Layer / Homework
Chris Shaiman & Stuart Kendrick
21
Created: 2014-07-05
Updated: 2014-10-04
Starting
Starting
Starting
Starting
wget
wget
wget
wget
iteration
iteration
iteration
iteration
7 at 6:53:04.02
8 at 6:53:31.15
9 at 6:53:56.94
10 at 6:54:27.07
Producing throughput file
Producing statistics and chart
* FILE:
Records:
10
Out of range: 0
Invalid:
0
Blank:
0
Data Blocks:
1
* COLUMN:
Mean:
Std Dev:
Sum:
Sum Sq.:
Minimum:
Maximum:
Quartile:
Median:
Quartile:
13.6300
0.4220
136.3000
1859.5500
12.7000 [ 8]
14.1000 [ 1]
13.3000
13.7000
14.0000
See
C:\Myth-Busting\Data\cycle-wget-output.csv for the raw output,
C:\Myth-Busting\Data\cycle-wget-output.txt for throughput only, and
C:\Myth-Busting\Data\cycle-wget-output.png for the chart
This run of cycle-wget started at Sat 10/04/2014
and ended at Sat 10/04/2014
6:50:19.75
6:54:53.72
C:\Myth-Busting\Tools>
Move to the Data directory:
C:\Myth-Busting\Data>dir
Volume in drive C has no label.
Volume Serial Number is E0D8-8557
Directory of C:\Myth-Busting\Data
09/24/2014
09/24/2014
09/21/2014
09/21/2014
09/21/2014
09/24/2014
09/24/2014
09/24/2014
09/21/2014
04:39
04:39
09:43
09:44
09:43
04:38
04:47
04:38
09:44
AM
AM
AM
AM
AM
AM
AM
AM
AM
<DIR>
<DIR>
Myth-Busting—The Network Layer / Homework
Chris Shaiman & Stuart Kendrick
820
8,982
110
297
8,193
88
2,125
.
..
cycle-iperf-output.csv
cycle-iperf-output.png
cycle-iperf-output.txt
cycle-wget-output.csv
cycle-wget-output.png
cycle-wget-output.txt
iperf-throughput.gp
22
Created: 2014-07-05
Updated: 2014-10-04
09/24/2014
09/24/2014
04:33 AM
298 readme.txt
04:45 AM
2,161 wget-throughput.gp
9 File(s)
23,074 bytes
2 Dir(s) 438,481,174,528 bytes free
C:\Myth-Busting\Data>
And examine the resulting chart:
C:\Myth-Busting\Data>cycle-wget-output.png
C:\Myth-Busting\Data>
Summary
For our testing methodology, we use cycle-iperf and cycle-wget as front-ends to iperf, wget, and
gnuplot to produce charts which illustrate the results of a test.
By automating data collection and presentation, we intend to focus your time and energies on
analyzing your data and thinking about the implications.
And by executing this homework several weeks prior to the seminar date, we predict that you'll
arrive in class prepared to think, rather than spending your time hurriedly installing and
configuring this toolkit.
Myth-Busting—The Network Layer / Homework
Chris Shaiman & Stuart Kendrick
23
Created: 2014-07-05
Updated: 2014-10-04
Next steps:
Review the deck for the class: http://www.skendric.com/seminar/
Review the Class LAN diagram below
Arrive 30-60 minutes early to class, for set-up. You'll be configuring your switch, your
laptop, and building the class network.
We look forward to seeing you soon.
Chris Shaiman & Stuart Kendrick
Myth-Busting—The Network Layer / Homework
Chris Shaiman & Stuart Kendrick
24
Created: 2014-07-05
Updated: 2014-10-04
Conference
WiFi
savage
10.10.0.10
VMWare server
Screen
Myth-Busting Class LAN
fluffy-rtr
10.10.0.1
chris-esx
10.10.0.5
stuart-esx
10.10.0.6
10.10.0.0/24
Class Network
10.10.0.0/16
Subnet mask
Broadcast
Default router
DNS server
Projector
255.255.0.0
10.10.255.255
10.10.0.1
10.10.0.11
team1-esx
10.10.1.5
team2-esx
10.10.2.5
team3-esx
10.10.3.5
team4-esx
10.10.4.5
10.10.1.0/24
10.10.2.0/24
10.10.3.0/24
10.10.4.0/24
team5-esx
10.10.5.5
team6-esx
10.10.6.5
team7-esx
10.10.7.5
team8-esx
10.10.8.5
10.10.5.0/24
10.10.6.0/24
10.10.7.0/24
10.10.8.0/24
team9-esx
10.10.9.5
team10-esx
10.10.10.5
team11-esx
10.10.11.5
team12-esx
10.10.12.5
10.10.9.0/24
team13-esx
10.10.13.5
10.10.13.0/24
10.10.10.0/24
10.10.11.0/24
team14-esx
10.10.14.5
team15-esx
10.10.15.5
10.10.14.0/24
10.10.15.0/24
10.10.12.0/24
team16-esx
10.10.16.5
10.10.16.0/24
- Assign a static address to your Ethernet switch, as shown
- Each team has a /24 from which they can assign static addresses to laptops, as desired
- Alternatively, you can rely on fluffy-rtr to hand-out DHCP addresses: 10.10.150.0/24
- Protip: grabbing addresses from another team’s allocation is considered poor form
- Notice that while each team gets its own /24 allocation, we all live within one subnet: 10.10.0.0/16
Back of Room
Myth-Busting—The Network Layer / Homework
Chris Shaiman & Stuart Kendrick
25
skendric 2014-07-15
Created: 2014-07-05
Updated: 2014-10-04
Appendix
Terminology
Bandwidth and Throughput
The terms Bandwidth and Throughput are defined differently by different communities within
the IT world. For the purposes of our class, we define Bandwidth as meaning the number of bits
per second passing an arbitrary point in the cable between point A and point B. We define
Throughput as how many payload bits (i.e. interesting data – the data the user wanted to send,
ignoring most of the protocol overhead) we transmitted from point A to point B. So, for example,
if YL and YIMP’s machine are connected by a cross-over Ethernet cable, the Bandwidth
between the two machines is likely 1,000,000,000 bits per second (Gigabit Ethernet), while the
Throughput in the example on p.8 was 570,000,000 bits per second. In our class, we don’t talk
much about Bandwidth, preferring to talk about Throughput. And when we talk about
Throughput, we tend to abbreviate the numbers to MB/s – in this example, 570,000,000 bits per
second collapses down to ~71MB/s.
570,000,000 bits/second ÷ 8 bits/byte ÷ 1,000,000 bytes/MB = 71.25 MB/s
Megabytes versus Mebibytes
The term Megabyte (and Kilobyte and Gigabyte and Terabyte) are defined differently by
different communities within the IT world.
In the networking (Data in Flight) world:
1 Megabyte = 106 = 1,000,000 bytes
In the memory (Data at Rest) world:
1 Megabyte = 220 = 1,048,576 bytes
Standards committees have tried to straighten things out using the following nomenclature:
Data in Flight
Data at Rest
Kilobyte
Kibabyte
Megabyte
Mebibyte
Gigabyte
Gibibyte
Terabyte
Tebibyte
Petabyte
Pebibyte
…
But, speaking for ourselves, we haven’t heard the Data at Rest nomenclature in common use – in
practice, folks seem to use the Networking terminology and rely on context for the listener to
determine whether the speaker means 106 or 220.
What to do? For the purposes of this class, we will attempt to use the Standards approach …
wish us luck.
Myth-Busting—The Network Layer / Homework
Chris Shaiman & Stuart Kendrick
26
Created: 2014-07-05
Updated: 2014-10-04
Windows Details
Q
A
Why does Myth-Busting-Toolkit.zip contain iperf-2.0.5-2-win32.zip? Are we supposed
to do anything with this?
No particularly good reason, and no, you don’t do anything with it – ignore it. The key
iperf files are precisely these: iperf.exe and cygwin1.dll, included separately within the
zip file.
Myth-Busting—The Network Layer / Homework
Chris Shaiman & Stuart Kendrick
27
Created: 2014-07-05
Updated: 2014-10-04


© Copyright 2026