
HERE - CPH Tourist
BIOLOGICAL BASELINE STUDY
IN THE RAMSAR SITE ”HEDEN” AND THE
ENTIRE JAMESON LAND, EAST GREENLAND
NERI Technical Report no. 769
AU
2010
NATIONAL ENVIRONMENTAL RESEARCH INSTITUTE
AARHUS UNIVERSITY
[Blank page]
BIOLOGICAL BASELINE STUDY
IN THE RAMSAR SITE ”HEDEN” AND THE
ENTIRE JAMESON LAND, EAST GREENLAND
NERI Technical Report no. 769
2010
Christian M. Glahder
David Boertmann
Jesper Madsen
Mikkel Tamstorf
Kasper Johansen
Jannik Hansen
Alyn Walsh
Cornelia Jaspers
Morten Bjerrum
AU
NATIONAL ENVIRONMENTAL RESEARCH INSTITUTE
AARHUS UNIVERSITY
Data sheet
Series title and no.:
Title:
Authors:
Department:
Publisher:
URL:
Year of publication:
Editing completed:
Referee:
Greenlandic translation:
Financial support:
Please cite as:
NERI Technical Report No. 769
Biological baseline study in the Ramsar site "Heden" and the entire Jameson Land, East
Greenland
Christian M. Glahder, David Boertmann, Jesper Madsen, Mikkel Tamstorf, Kasper Johansen,
Jannik Hansen, Alyn Walsh, Cornelia Jaspers & Morten Bjerrum
Department of Arctic Environment
National Environmental Research Institute ©
Aarhus University - Denmark
http://www.neri.dk
January 2010
November 2009
Anders Mosbech
Bjørn Rosing
Bureau of Mineral and Petroleum, Greenland Self-Government
Glahder, C.M., Boertmann, D., Madsen, J., Tamstorf, M., Johansen, K., Hansen, J., Walsh, A.,
Jaspers, C. & Bjerrum, M. 2010: Biological baseline study in the Ramsar site “Heden” and the
entire Jameson Land, East Greenland. National Environmental Research Institute, Aarhus University. 86 p. – NERI Technical Report no. 769. http://www.dmu.dk/Pub/FR769.pdf.
Reproduction permitted provided the source is explicitly acknowledged
Abstract:
Keywords:
Layout:
In 2008, Quadra Mining Ltd. was granted an exploitation license that covered a large molybdenum ore body in East Greenland. Mining this ore will involve constructions inside the Ramsar site “Heden” of a port, a road and an air strip. In July 2008 NERI performed baseline studies on
geese and other birds in the area. The possible impacted north-western part of the Ramsar site,
Gurreholm, is lush wetland tundra. About 25% of the Pink-footed geese moulting in Jameson
Land use this small part of the Ramsar site. The diversity and density of breeding birds in the
area are relatively high. About 3% of the moulting Barnacle geese in Jameson Land use this
area. The impact of the mining activities on the Gurreholm area is evaluated in proportion to disturbance zones of 1.5, 5 and 10 km; the most substantial impact will be that up to 4,900 moulting Pink-footed geese will avoid the area. The proposed replacement area, the extended Ørsted
Dal area, holds 60-80% of the Pink-footed geese expected to avoid the Gurreholm area. The
number of breeding Pink-footed geese in the affected area constitutes about one third of the
Jameson Land breeding population. The replacement area will compensate for more moulting
Barnacle geese than those impacted, thereby giving protection under the Ramsar Convention to
an extra 7% of the flyway population. It is suggested to monitor the impact when mining starts. If
the proposed replacement area can not compensate fully, yet another replacement area should
be delimited.
Ramsar site, Pink-footed goose, Barnacle goose, mining, disturbances, replacement area,
Jameson Land, East Greenland.
NERI Graphics Group, Silkeborg
Photo front cover:
Photos:
Pink-footed geese moulting in the Ramsar site “Heden”, July 2008. Photo: Alyn Walsh.
C. M. Glahder if no photographer mentioned.
ISBN:
ISSN (electronic):
978-87-7073-158-4
1600-0048
Number of pages:
86
Internet version:
The report is available in electronic format (pdf) at NERI's website
http://www.dmu.dk/Pub/FR769.pdf
Contents
Summary 5
Sammenfatning 8
Eqikkaaneq 11
1
Introduction 15
2
The study areas 18
3
Methods 21
3.1
3.2
3.3
3.4
3.5
4
Aerial survey 21
Ground survey, Gurreholm & Tyskit Nunaat 22
Ground survey, Ørsted Dal & Draba Sibirica 23
Vegetation mapping 25
Generalized linear model set-up 28
Results, birds 33
4.1
4.2
4.3
4.4
4.5
Pink-footed goose 33
Barnacle goose 41
Goose grazed marshes 46
Modelling the number of moulting geese in the extended Ørsted Dal area 50
Other bird species 52
5
Results, mammals 62
6
Results, vegetation 66
7
Discussion 68
7.1
7.2
7.3
7.4
7.5
7.6
Mining activities 68
Methods employed 69
Geese in Gurreholm and Jameson Land 70
Birds in the Gurreholm area 73
Possible effects of mining activities 74
The proposed replacement area in Ørsted Dal 76
8
Conclusions 79
9
References 80
Appendix 1. The Gurreholm area in detail 83
Appendix 2. The possible replacement area in Ørsted Dal 86
National Environmental Research Institute
NERI technical reports
[Blank page]
Summary
In 2004, Quadra Mining Ltd. was granted an exploration license that covered the Malmbjerget area in East Greenland and late 2008 the mining
company was granted an exploitation licence. Early 2008 an Environmental Impact Assessment and an Interim Feasibility Study was presented by the mining company. The mining company plans to exploit a
large molybdenum ore body estimated to be mined for 20-25 years. In
the north western part of Jameson Land, around Gurreholm (Fig. 1), the
mining company plans to construct a port with a large container terminal, a gravel road from the port and c. 75 km north to the production
camp along the east side of the Schuchert River and a c. 2,000 m long air
strip situated 3-4 km northeast of the port and connected to the road by a
perpendicular gravel road (Figs. 45, 46). These constructions cover about
1 km2. In the production phase the period July-October will be the most
intensive period, with an estimated arrival of one ship every second
week and a maximum of 7 trucks (c. 50 tons) per hour that will arrive or
leave the port site. Every second week a Hercules plane will land and
about 2 medium sized jet planes will land per week.
The port, airstrip and about 20 km road in the Gurreholm area are planned to be located inside the Ramsar site “Heden”. A Ramsar site is a wetland of international importance for e.g. staging and breeding birds that
holds a minimum of 1% of the total flyway population of at least one water bird species. The Ramsar site “Heden” was designated in 1988 primarily to protect internationally important populations of moulting
Pink-footed geese and Barnacle geese. The area held at that time 3% of
the total flyway population of Pink-footed geese and 9% of the total Barnacle geese. Of importance for the designation was also other breeding
birds like Red-throated diver, Long-tailed and Arctic skua, Dunlin and
Turnstone, and uncommon breeding birds like Sabine´s gull, Whimbrel,
Red and Red-necked phalarope. If “urgent national interests” are
claimed by the national state resulting in a reduction of a Ramsar site,
the Ramsar Secretariat must be informed about alternatives and a proposal for the designation of a replacement area. In a dialogue with the
Ramsar secretariat the Greenland Self-Government has informed that the
mining project is of “urgent national interests”, meaning that the project
can proceed provided that the impact of the activities are monitored and
that an appropriate replacement area is found in advance.
The relatively large construction works planned inside the Ramsar site
”Heden” will affect the area in two ways: Some areas will be lost due to
the constructions, perhaps temporarily dependant of remediation measures, and some areas will be disturbed so that animals, especially moulting geese, will be displaced permanently or temporarily from the areas.
The purpose of the present reported baseline studies performed in July
2008 in Jameson Land was to census the number and distribution of
moulting and breeding geese and of other birds prior to the mine start.
The studies were performed in four study areas: the possible affected
Gurreholm area, the reference areas Tyskit Nunaat and Draba Sibirica
River, and the planned replacement area in Ørsted Dal (Fig. 1). Also, the
purpose was to map the vegetation of the entire Jameson Land.
5
The 2008 field studies show that the Gurreholm study area is very rich in
bird species and individuals compared to the other study areas. The reason is that Gurreholm is a lush tundra wetland area rich in smaller and
larger lakes and rivers, fens and coastal salt marshes. The number of
breeding and moulting Pink-footed geese (more than 800 individuals in
families and c. 4,000 moulting birds that constitutes more than 20% of the
Jameson Land total) as well as other breeding birds (11 species with 64
successfully pairs) is high. Sabine´s gull and Whimbrel, classified as
“near threatened” in the Greenland Red-list are breeding in the area. Only about 3% of the total moulting population of Barnacle geese in Jameson Land use the Gurreholm area.
The possible effects of the mining activities on geese and other bird species in the northwestern part of the Ramsar site ”Heden” is evaluated in
relation to three disturbance scenarios, expressed by the distance at
which birds are predicted to be displaced. The size of these three zones
of 1.5, 5 and 10 km (Fig. 45) are based on knowledge from reactions of
moulting geese to helicopter disturbances and breeding geese to airstrips
and walking persons. When a large helicopter approached moulting
Pink-footed geese they stayed alert at a distance of about 10 km from the
plane and fled to a lake or river at distances of 7-8 km. A smaller helicopter caused the two latter reactions at distances of 4-6 km. When geese,
still able to fly, are searching for suitable moulting sites they probably
will avoid moulting habitats that are inside the 10 km disturbance zone.
This is based on observations of Pink-footed geese that avoided a valley
in Jameson Land in late June after passage of large helicopters at distances of about 5 km. No geese moulted in the valley that year. Breeding
geese are more tolerant to disturbances and observations indicate little or
no effects at distances of 1-2 km from the source. According to these observations we have chosen a disturbance zone of 1.5 km to breeding geese and other breeding birds. A worst case scenario is represented by the
10 km disturbance zone inside which we expect that no geese will start
moulting (Fig. 45). The more moderate scenario anticipates the geese to
initiate their moult in areas situated more than 5 km from the disturbances, but inside the 5 km zone no geese will moult. Breeding geese and
other breeding birds are expected to avoid the area inside the 1.5 km disturbance zone.
Inside the disturbance zone of 10 km about 4,900 moulting Pink-footed
geese and 530 moulting Barnacle geese were observed in 2008, while the
disturbance zone of 5 km held c. 3,900 moulting Pink-footed geese and
400 moulting Barnacle geese. Inside the 1.5 km disturbance zone a minimum of 150 Pink-footed geese in family flocks (equal to c. 30 successful
pairs) and a minimum of 8 breeding pairs of other breeding birds were
located. It is likely that all lakes used by foraging non-breeding Sabine´s
gulls will be affected by the constructions. Supplementary studies on
breeding birds, performed in June 2009, will be reported separately.
The size and quality of a replacement area depends on both the chosen
disturbance zones and suitable areas in East Greenland. Ørsted Dal is the
only relevant potential replacement area in Jameson Land. To delimit the
replacement area the starting point could be to evaluate if the Ørsted Dal
study area would be a sufficient replacement area. In this area we observed 400 moulting Pink-footed geese and 700 Barnacle geese, family
birds of 50 Pink-footed geese and 120 Barnacle geese and 30 breeding
6
pairs of 5 other bird species. It is obvious that this area is not sufficient to
replace especially moulting and breeding Pink-footed geese. It is doubtful if the area is sufficient to replace the diversity of other breeding species. On the other hand, Barnacle geese are fully replaced.
Therefore, it is necessary to extend the Ørsted Dal area to that depicted
on Fig. 45. The replacement area shown on the figure is smaller than the
proposed optimal replacement area (Fig. 51) due to two existing mineral
licence areas. This area holds c. 3,000 moulting Pink-footed geese or
about 60-80% of the 3,900 – 4,900 geese potentially lost inside the two
disturbance zones in the Gurreholm area. In return, the extended Ørsted
Dal area supports c. 4,700 moulting Barnacle geese giving protection under the Ramsar Convention to an extra 7% of the Barnacle goose flyway
population. This is of importance because the population is still relatively small despite its current rapid growth. It is difficult to judge if the
replacement area can fully compensate the loss of breeding Pink-footed
geese and other breeding birds. The southeastern part of the area is suitable only to moulting geese and not to most breeding birds because of
snow and ice coverage until late June. A preliminary spatial model indicates that the replacement area has no substantial spare habitats for the
moulting geese displaced from Gurreholm.
Because of the uncertainties to assess the impact of the mining activities
on the moulting and breeding birds in the northwestern part of the Ramsar site it is suggested to introduce a monitoring program when mining
starts. If the proposed replacement area can not compensate for the loss
of moulting and breeding birds in the Gurreholm area, yet another
replacement area should be delimited elsewhere along the East Greenland coast. Studies performed in 2009 and planned in 2010 should prepare for such a situation.
Photo 1. The Gurreholm area
with Scoresby Sund and Staunings Alps in background (Alyn
Walsh).
7
Sammenfatning
Quadra Mining Ltd. fik i 2004 en efterforskningstilladelse for Malmbjerget i Østgrønland og i 2008 en udnyttelsestilladelse. I den forbindelse
blev der bl.a. fremlagt en vurdering af virkningen på miljøet og et midlertidigt lønsomhedsstudie. Mineselskabet planlægger indenfor de
kommende år at starte en 20-25 årig udvinding af molybdæn fra forekomsten i Malmbjerget. Planerne omfatter bl.a. anlæg af en havn med
tilhørende stort containerlager ved Gurreholm i det nordvestlige Jameson Land, en ca. 75 km lang vej langs den østlige bred af Schuchert Elv
fra havnen mod nord til en mineby ca. 10 km syd for malmforekomsten
og en stikvej til en ca. 2 km lang landingsbane til bl.a. mellemstore jetfly
og Hercules transportfly beliggende ca. 1,5 km fra kysten nord for havnen (Figurerne 45 og 46). Anlæggene vil omfatte et landområde på ca. 1
km2. Det skønnes, at der juli-oktober i mineperioden vil ankomme ét
fragtskib hver anden uge, 2-3 fly vil lande og lette om ugen og omkring 7
lastbiler (ca. 50 tons) vil hver time ankomme eller forlade havnen.
De relativt store anlægsarbejder der planlægges ved Gurreholm ligger
inde i Ramsarområdet ”Heden”. Et Ramsarområde er et vådområde af
international betydning for bl.a. rastende og ynglende fugle og det skal
rumme mindst 1% af mindst én vandfuglearts totale bestand. ”Heden”
blev udpeget som Ramsarområde i 1988 bl.a. på grund af de internationalt vigtige bestande af fældende kortnæbbede gæs og bramgæs, der på
det tidspunkt rummede henholdsvis 3 og 9% af de totale bestande. Udpegningsgrundlaget var desuden andre ynglefugle som lommer, kjover
og vadefugle, samt relativt sjældne ynglefugle som sabinemåge, odinshane, thorshane og lille regnspove. Hvis et Ramsarområde vil blive påvirket eller ændret som følge af ”vitale nationale interesser” skal Ramsar
sekretariatet oplyses om mulige alternativer og erstatningsområder.
Grønlands Selvstyre har i dialog med Ramsar sekretariatet meddelt at
mineprojektet er af “vital national interesse” således at projektet fortsætter forudsat at påvirkningerne af mineaktiviteterne moniteres og at der
udpeges et passende erstatningsområde inden minestart.
De planlagte anlægsarbejder betyder dels, at der er områder som, måske
midlertidigt, vil gå tabt og dels områder hvor dyrelivet, herunder især de
fældende gåsebestande, vil blive forstyrret. Formålet med undersøgelserne udført i juli 2008 i Jameson Land, var dels at optælle antallet af
fældende gæs i hele området inden og efter en igangsættelse af anlægsarbejderne og dels nøjere at kortlægge ynglende gæs samt andre fuglearter indenfor fire delområder: det efter planerne påvirkede Gurreholm
område, to nærliggende referenceområder ved Tyskit Nunaat og Draba
Sibirica elv, samt det eventuelle Ramsar erstatningsområde i Ørsted Dal
(Figur 1). Desuden var formålet at udføre en vegetationskortlægning af
hele Jameson Land.
Resultaterne fra undersøgelserne viser, at området ved Gurreholm er et
særdeles rigt fugleområde der, i forhold til de øvrige undersøgte delområder, indeholder et meget stort antal fældende kortnæbbede gæs (ca.
4.000 eller godt 20% af hele Jameson Lands bestand), ynglende kortnæbbede gæs (over 800 familiefugle), samt et stort antal andre ynglefugle (64
8
par fordelt på 11 arter). Området omfatter desuden de relativt sjældne
ynglefugle sabinemåge og lille regnspove, der i henhold til den grønlandske rødliste er kategoriserede som ”næsten truede”. Antallet af fældende bramgæs (ca. 300) er derimod lavt og udgør kun ca. 3% af den
samlede bestand i Jameson Land. Baggrunden for, at Gurreholm området er så fuglerigt i forhold til de øvrige områder er, at der er et meget
stort antal større og mindre søer, elve og mange kær og at denne våde
lavlandshabitat er dominerende i forhold til de mere tørre dværgbuskheder.
Med den nuværende viden om hvilke aktiviteter mineselskabet planlægger indenfor det nordvestlige område af Ramsarområdet ”Heden” er
påvirkningen vurderet i forhold til tre forstyrrelsesscenarier. De tre scenarier er baseret på den afstand som aktiviteterne forventes at påvirke
fuglelivet. Zonernes størrelser på henholdsvis 1,5, 5 og 10 km fra aktiviteterne (Figur 45) knytter sig til en viden om fældende gæs’ reaktioner på
helikopterforstyrrelser og ynglende gæs’ reaktioner på landingsbaner og
gående personer. En større helikopter der nærmer sig en flok fældende
kortnæbbede gæs vil forstyrre disse på 7-10 km´s afstand. På 10 km´s afstand blev gæssene opmærksomme på forstyrrelsen, mens de på 7-8
km´s afstand flygtede ud på søer og elve. Når en mindre helikopter
nærmede sig var reaktionerne tilsvarende, men på 4-6 km´s afstand. Når
gæssene, der stadig kan flyve, skal vælge fældeområde, vil de være meget opmærksomme på forstyrrelser og formodentlig undgå områder indenfor en 10 km forstyrrelseszone. Dette bygger på observationer fra Jameson Land hvor kortnæbbede gæs forlod områder forstyrret af helikoptere på 5 km´s afstand og gæssene vendte ikke tilbage for at fælde det år.
Ynglende gæs er mere tolerante overfor forstyrrelser og observationer
tyder på påvirkninger indenfor 1-2 km fra en forstyrrelse. I forbindelse
med ynglende fugle har vi valgt en forstyrrelseszone på 1,5 km. Området
indenfor forstyrrelseszonen på 10 km repræsenterer det værst tænkelige
tilfælde, hvor ingen gæs vil påbegynde fældningen. Ved mere moderate
forstyrrelser forventes det, at gæssene inden fældningen påbegyndes
godt vil etablere sig i en afstand over 5 km fra forstyrrelsen, men at de
bliver skræmt væk nærmere end 5 km fra forstyrrelsen. Vedrørende ynglefugle vurderes det, at alle ynglepar i den vestligste fjerdedel af Gurreholm feltområdet (området indenfor ca. 1,5 km fra anlæggene) forsvinder som følge af fysiske anlæg og forstyrrelser.
Ved optællingerne fra fly i juli 2008 registreredes ca. 4.900 fældende
kortnæbbede gæs og 530 bramgæs indenfor 10 km forstyrrelseszonen og
ca. 3.900 fældende kortnæbbede gæs og ca. 400 bramgæs indenfor 5 km
forstyrrelseszonen. Desuden var der i 1,5 km forstyrrelseszonen mindst
150 kortnæbbede gæs i familieflokke (svarende til mindst 30 succesrige
ynglepar) og mindst 8 succesfulde ynglepar af 5 andre fuglearter. Det er
også sandsynligt at de søer hvor ikke ynglende sabinemåger blev set søge føde vil blive påvirket af anlæggene. Supplerende relevante ynglefugle studier blev udført i juni 2009 og vil blive rapporteret separat.
Størrelsen og kvaliteten af et erstatningsområde afhænger både af valget
af forstyrrelseszoner og af hvilke passende områder der findes i Østgrønland. I Jameson Land området er Ørsted Dal området det eneste relevante område. For at afgrænse det nødvendige areal i Ørsted Dalen er
det i første omgang vurderet om Ørsted Dal feltområdet er tilstrækkeligt
som erstatningsområde. I dette område blev der observeret 400 fældende
9
kortnæbbede gæs og 700 fældende bramgæs, 50 familiefugle af kortnæbbet gås og 120 af bramgås, samt 30 ynglefugle fordelt på 5 øvrige arter.
Det er åbenlyst, at Ørsted Dal feltområdet ikke er tilstrækkeligt til at
kompensere for især fældende og ynglende kortnæbbede gæs. Derimod
er der mere end fuld kompensation for bramgæssene.
Det er derfor nødvendigt at inddrage et større område som erstatningsområde (Figur 45). Dette område er mindre end det foreslåede optimale
område (Figur 51) hvilket skyldes to områder med gældende mineraltilladelser. Hvis det udvidede Ørsted Dal område udpeges som erstatningsområde vil der her være ca. 3.000 fældende kortnæbbede gæs. Dette antal udgør stadig kun omtrent 60-80% af de 3.900 - 4.900 fældende
kortnæbbede gæs der vurderes at forlade Gurreholm området indenfor
forstyrrelseszonerne. Erstatningsområdet indeholder til gengæld ca.
4.700 fældende bramgæs. Derved kommer der yderligere 7% af bestanden under Ramsar Konventionens beskyttelse, hvilket er betydningsfuldt, da denne bramgåsbestand stadig er relativ lille trods den store bestandsfremgang i de sidste årtier. Det er på nuværende tidspunkt vanskeligt at vurdere om erstatningsområdet fuldt ud vil kompensere for
tabet af ynglende kortnæbbede gæs og andre ynglefugle. Den sydøstlige
del af erstatningsområdet er kun velegnet til fældende gæs, da sen sne
og isafsmeltning ikke muliggør yngel (jf. photo 1). En foreløbig rumlig
model over sammenhængen mellem fældehabitater og antallet af gæs
kunne ikke påvise, at erstatningsområdet kunne rumme et forøget antal
af fældende gæs.
På grund af usikkerhederne med at vurdere omfanget af påvirkningen
fra mineaktiviteterne skal det foreslås, at fuglelivet i Gurreholm området
årligt moniteres. Hvis erstatningsområdet ikke kompenserer tilstrækkeligt for tabet af fældende og ynglende gæs, samt andre ynglende fugle i
området, bør der udpeges endnu et erstatningsområde på Grønlands
østkyst. Der er taget højde for denne situation ved i 2009 at udføre optællinger fra fly i relevante områder og ved at planlægge ynglefugleundersøgelser i 2010.
Photo 2. Non-breeding Pinkfooted geese migrating north in
late June to moult.
10
Eqikkaaneq
2004-mi Quadra Mining Ltd. Tunumi Malmbjerget-mi ujarlernissamut
akuersissummik pivoq 2008-milu iluaquteqarnissamut akuersissummik
pilluni. Tassunga atatillugu ilaatigut avatangiisinut sunniuteqarnissamik
naliliineq aammalu utaqqiisaagallartumik imminut akilersinnaassutsimik misissuisimaneq saqqummiunneqarput. Aatsitassarsiorfik ukiuni
aggersuni 20-25-ini Malmbjerget-mi molybdænimik tamaaniittumik piiaanissamut pilersaarusiorppoq. Pilersaarutinut ilaatigut ilaavoq Gurreholm-imi Jameson Landip avannamut kitaaniittumi containeriisivittalimmik umiarsualiviliornissaq, 75 km miss. takissusilimmik Scuchert
Elv-ip sinaa kangilleq sinerlugu aqqusinniornissaq aatsitassarsiorfiup illoqarfianut aatsitassarsiorfiup kujataani 10 km miss. Ungasissusilimmiittumut aammalu aqqusinermik sanimoortumik timmisartut jetflyt akunnattumik angissusillit, timmisartut assartuutit Hercules-it mittarfissaannut umiarsualivimmiit 1,5 km miss. Avannarpasinnersusumiittumut
atanilerlugu (titartakkat 45 amma 46 takukkit). Sanaartorfissaq nuna 1
km2 missiliorlugu angissuseqassaaq. Naatsorsuutigineqarpoq aatsitassarsiornerup nalaani juli-oktoberimi sapaatip akunnera allortarlugu
umiarsuarmik assartuummik tikittoqartarumaartoq, timmisartullu 2-3
sapaatip akunnerata ingerlanera nunnillutillu aallartarumaartut aammalu lastbiilit 7 miss. (50 tons miss.) nalunaaquttap akunnerata ataatsip
ingerlanerani umiarsualivimmut tikiullutillu tassannga aallartarumaartut.
Gurreholm-imi sanaartugassat annikitsuunngitsut pilersaarutigineqartut
Ramsar-eqarfiup ”Heden”-ip iluaniipput. Ramsareqarfik tassaavoq masarsoqarfik nunanut assigiinngitsunut pingaarutilik, ilaatigut timmissanit uninngaarfiusarlunilu piaqqiorfiunermigut, aammalu taamaattoq
minnerpaamik timmissap immamiittartup ataatsip nunarsuarmi 1%ianik najorneqartuussoq.”Heden” nerlerit siggukitsut nerlernallu isasarfiattut pingaarutilittut Ramsareqarfittut toqqarnerarpoq 1988-imi, taamanikkut nunarsuarmi timmissat taakkua tamarmiusut 3 aamma 9%-iinik
najorneqartoq. Toqqaanermut pissutaavortaaq timmissat allat, soorlu
qilanngat, isunngat naloraarusillillu, kiisalu timmissat qaqutigoornerusut sabinemåge, odinshane, thorshane aamma lille regnspovenit piaqqiorfiummat. Ramsareqarfik ”nunap soqutigisai pingaarutillit”
pissutigalugit sunnerneqarpat allanngortinneqarpalluunniit taava Ramsarip allaffeqarfia periarfissanik taartaasinnaasunillu ilisimatinneqartussaavoq. Kalaallit Nunaanni Naalakkersuisut Ramsarip allaffeqarfia oqaloqatigalugu nalunaarutigaat aatsitassarsiorneq ”nunap soqutigisarigaa
pingaarutilik” taamaattumillu pilersaarut ingerlaqqissasoq piumasaraluguli aatsitassarsiornikkut ingerlatat sunniutaasa nalunaarsorneqarnissaat aammalu piukkunnartumik taatissamik toqqaasoqassasoq
aatsitassarsiorneq aallartitsinnagu.
Sanaartugassatut pilersaarutaasut kingunerisussaassavaat ilaatigut
nunap ilaata uumasut tungaannit isigalugu annaaneqarnera imaluunniit
qimanneqarnera, immaqa sivisunngitsumik, pingaartumik nerlerit isasut
eqqarsaatigalugit, taakkua akornuserneqarumaarmata. Misissuinerit
Jameson Land-imi julimi 2008-mi ingerlanneqartut siunertaraat nerlernik
isasumik tamanna tamakkerlugu kisitsinissaq aammalu sanaartornerup
11
aallartinnginnerani, aallartereerneranilu aammalu nerlerit siggukitsut
timmissallu allat erniortut sumiiffinni sisamani erseqqinnerusumik
nalunaarsornissaat: Gurreholm-imi pilersaarutit malillugit sunnerneqartussat, eqqaaniittumi naleqqiussuussivissat marluk, Tyskit Nunaanni
aamma Draba Sibirica-p kuuani, aammalu Ramareqarfimmut annaasamut taartaasinnaasoq Ørsted Dal (Titartagaq 1). Siunertaavortaaq
Jameson Land tamakkelugu naasoqarfinnik misissuinissaq.
Misissuinerit inernerisa takutippaat Gurreholm eqqaalu, immikkoortortanut misisuiffigineqartunut sanilliullugu, timmiarpassuaqartoq, nerlerit
siggukitsut isasut amerlasoorujussuit (4.000 miss. imalunniiit Jameson
Land-imiittut tamakkerlutik 20%-ii sinnerlugit), nerlerit siggukitsut erniortut (ilaqutariit 800 sinnerlugit) aammalu timmissat allarpassuit erniortut (aappariit 64-it timmissanut assigiinngitsunut 11-nut agguataarsimasut). Tamannalu aamma timmissat qaqutigoornerusut, sabinemåget aamma lille regnspove-t ilaapput, taakkua kalaallit uumasunut navianartorsiortitaasunut nalunaarsuiffianni ”nungutitaanissamik navianartorsiorluinnangajattutut” nalunaarsorsimapput. Nerlernat isasut (300
miss.) amerlanngillat tassa Jameson Land-imiittut 3%-iat missiliuinnarlugu. Gurreholm-ip taama timmiaqartigineranut pissutaavoq angeqatigiinngisitaartunik taserpassuaqarlunilu taserarpassuaqarnera, kuuit masarsuillu amerlaqisut tamannalu uumsoqarfik masarsuulluni narsaamanerusoq annertunerpaavoq panernerusortaanut orpigaqarfiusunut
naleqqkiullugu.
Aatsitassarsiorfiup Ramsareqarfiup ”Heden”-ip avannaa kitaani pilersaarutaanut maannamut ilisimaneqartunut tunngatillugu sunniutaajumaartutut akornusersuutit pingasunut avinneqarsimapput. Taakkunani
pingasuni ingerlatat timmissanut qanoq ungasissuseqarnerat tunngavigineqarpoq. Zonit ingerlataniit 1,5, 5 aamma 10 km ungasissuseqarput
(Titartagaq 45) ilisimaneqarmat nerlerit isasut helikopteriniit akornusersorneqarlutik periaasiat aammalu nerlerit ivasut mittarfeqarfinnit inunnillu pisuinnartunit akornusersorneqartarnerat. Helikopteri angisooq
nerlernut siggukitsunut isasunut qanilliartortoq akornusersuilersarpoq
taakkunannga 7-10 km ungasissuseqaleraangami. 10 km ungasissuseqartoq nerlerit akornusersuisoqarnera malugisarpaat, 7-8 km ungasissuseqaleraangallu tatsinut kuunnullu qimaasarlutik. Helikopteri
mikinerusoq taamatut aamma qisuariarfigisarpaat, kisianni 4-6 km ungasissuseqaleraangat aatsaat. Nerlerit suli timmisinnaatillutik isaffissarsiulersut akornusersuutinut misikkarissorujussuusarput qularnanngitsumillu akornusersuiffimmiit 10 km qaninnerusumiinniarnaviarnatik.
Tamanna Jameson Land-imi helikiopterit nerlerniit 5 km ungasitsigisumi
akornusersuilermata tamatuminnga qimatsisimanerannik ukiorlu taanna
isajartorlutik utersimannginnerannik takusimasanik tunngaveqarpoq.
Nerlerit piaqqiortut akornusersuineq naammagittarfiginerusarpaat takusimasallu malillugit akornusersuutiniit 1-2 km ungasitsigisisumiissinnaallutik. Timmissanut piaqqiortunut atatillugu qinersimavarput akornusersuisumiit ungasissuseq 1,5 km. 10 km iluani nerlerit isanialissanngippata akornusersuineq ajornerpaasaaq. Akornusersuutit ajunnginnerumaartillugit ilimagineqarpoq nerlerit isalesinnatik akornusersuisumiit 5 km ungasinnerusumiinniarsinnaassasut kisiannili 5 km qaninnerugunikku pisorpalummit tatamititaassallutik. Timmissanut piaqqiortunut tunngatillugu naliliineqarpoq Gurreholm-ip sisamararterutaani
kippasinnersusuaniittumit (sanaartukkaniit 1,5 km ungasitsigisumi) qimagukkumaartut sanaartukkat akornusersuutillu pissutigalugit.
12
Timmisartumiit 2008-mi julimi kisitsinermi nerlerit siggukitsut 4.900
miss. nerlernallu 530, 10 km akornusersuiffimmiit ungasissusillip iluani
aamma nerlerit siggukitsut isasut 3.900 miss. nerlernallu 400 miss. 5 km
akornusersuiffimmiit ungasissusillip iluani nalunaarsorneqarput. Kiisalu
1,5 km akornusersuiffimmiit ungasissusillip iluani minnerpaamik nerlerit siggukitsut 150 ilaqutariikkuutaartut (tassa minnerpaamik aappariit
30 iluatitsillutik piaqqisimasut) aammalu minnerpaamik aappariit
piaqqisartut 8 timmiaasut assigiinngitsut 5 nalunaarsorneqarput. Ilimanarportaaq sabinemåge-t piaqqiunngitsut tatsini nerisassarsiortut takuneqartut sanaartukkanit akornuserneqarumaartut. Timmiisanik
naleqquttunik piaqqiortunik ilassutaasumik misissuinerit 2009-mi junimi
ingerlanneqarput kingusinnerusukkut immikkoortillugit nalunaarusiuunneqarumaarput.
Taarsiutassap angissusianut pitsaassusianullu apeqqutaavoq akornusersuiffiit sumiinnerat aammalu Tunumi allami sumi naleqquttumik nassaartoqarsinnaanersoq. Jameson Land-imi Ørsted Dal eqqaalu tamaani
naleqquttutuaavoq. Ørsted Dal-imi nunaminertaq pisariaqartitaq killilersinnaajumallugu siullermik nallersuineqarpoq Ørsted Dal taarsiutissallugu naammassanersoq. Tamaani takuneqarput nerlerit siggukitsut
isasut 400 nerlernallu isasut 700, nerlerit siggukitsut ilaqutariikkuutaat
50 aamma nerlernat 120 kiisalu timmissat assigiinngitsut tallimat kalillutik 30-iullutik piaqqisimasut. Erseqqippoq Ørsted Dal naammassanngitsoq, pingaartumik nerlerit siggukitsut isasut piaqiortullu eqqarsaatigalugit. Akerlianilli nerlernat eqqarsaatigalugit naammattumik taartaasinnaalluni.
Taamaattumik taartaasinnaasumik annertunerusumik ilanngussinissaq
pisariaqarpoq (Titartagaq 45). Tamannami pitsaasutut siunnersuummit
minneruvoq (Titartagaq 51) tamannalu pissuteqarpoq marlunnik aatsitassanut tunngatillugu akuersissuteqarfiusunik nunaminertaqarmat.
Ørsted Dal annertusisaq taartissatut toqqarneqassagaluarpat tamanna
3.000 miss. siggukitsunik isasunik nerleqassaaq. Taakkuali taamaallaat
nerlerit siggukitsut isassut 3.900 – 4.900-iusut Gurreholm-imi akornusersukkanik qimatsisussat 60-80%-eriinnassavaat. Taartaasussarli taarsiullugu nerlernanik isasunik 4.700 miss. peqassaaq. Taamaalillunilu 7%-mik
amerlanerusut Ramsarimi isumaqatigiissutikkut llersorneqartumiilissapput, tamannalu suusupagisassaanngilaq, timmiaqatigiimmi taakkua
suli amerlasoorsuunngimmata naak ukiuni qulikkuutaani kingullerni
annertuumik
amerlisimagaluarlutik.
Massakkut
tamakkiisumik
oqaatigiuminaakkallarpoq
taartaasussaq
nerlernik
siggukitsunik
piaqqiortunik timmissanillu allanik piaqqiortunik annaasanik tamakkiisumik taarsiisinnaassanersoq. Taartissap kujammut kangisinnerusortaa taamaallaat nerlernut isasunut naleqquppoq, aputimmi sermillu kingusissukkut aattulersarnerat piaqqiorsinnaatitsinngimmat (tak. assilisaq
1). Utaqqiisaagallartumik isasarfiit nerlerillu amerlassusiata imminnut
ataqatigiinnerannut missangersuusiap taartaasussaq nerlernit isasunit
amerlanerusunit najorneqarsinnaassanersoq takutissinnaanngilaa.
Aatsitassarsiornikkut ingerlatat sunniutissaanik nalilersuiniarnermi
nalorninartut pissutigalugit Gurreholm-imi timmissat ukiut tamaasa
nalunaarsorneqartarnissaat siunnersuutigineqassaaq. Taartaasussaq
naammattumik nerlerit isasut piaqqiortullu, timmissallu allat tamaani
piaqqsartut eqqarsaatigalugit naammattumik taartaasinnaassanngippat
aamma allamik Tunumi taartaasussamik toqqaasariaqarumaarpoq. Ta-
13
manna naatsorsuutigineqareerpoq 2009-mi naleqquttuni timmisartumiit
kisitsinermi aammalu 2010-mi timmissat piaqqiorneranik misissuinissamik pilersaarusiornermi.
14
1
Introduction
In 2004, Quadra Mining Ltd. was granted an exploration license that covered the Malmbjerget area in East Greenland and late 2008 the mining
company was granted an exploitation licence. The mining company
plans to exploit a large molybdenum ore body estimated to be mined for
20-25 years. In the north western part of Jameson Land, around Gurreholm (Fig. 1), the mining company plans to construct a port with a large
container terminal, a gravel road from the port and c. 75 km north to the
production camp along the east side of the Schuchert River and a c. 2,000
m long air strip situated 3-4 km northeast of the port and connected to
the road by a perpendicular gravel road (Figs. 45-51). The air strip will
include northern and southern approaching corridors of unknown
length, width and height. All these parts of the mining infrastructure
will, according to the Environmental Impact Assessment (Cessford 2007)
and the Interim Feasibility Study (Quadra 2008) presented early 2008, be
placed inside the Ramsar site “Heden”. The localisation of road and airstrip inside the Ramsar site was later changed so that the road was suggested to run close to the Schuchert River and the airstrip moved 1.5 km
to the northeast (Quadra Mining Ltd, in litt. 7 October 2008).
The port will consist of wharf (100 m quay), container storage area for
minimum 2,100 containers, three fuel tanks each containing 25,000 m3, a
building for 10 persons and power supply. The foot-print is approximately 0.2 km2. The shipping season is July-October where 3-4 cargo
ships (c. 9,600 tons of cargo capacity (DWT)) and 3-4 fuel tankers are estimated to call the port each year during the mining operation. In the
construction phase a total of about 24 ships will call the site per year.
The road is planned to be a single-lane gravel road about 5 m wide. Passing places will be constructed at distances of 500-1000 m. About 20 km
road including a 1.5 km connecting road to the airstrip will be situated
inside the Ramsar site, with a foot-print of c. 0.1 km2. The dominant traffic will be trucks with trailers with a maximum weight of 48 tons. In the
shipping season during July-October a maximum of 40-80 vehicles per
day in both directions are expected. A year round average is expected to
be 20-40 vehicles per day. The speed will in good weather conditions be
40-50 km/h.
The airstrip is based on a 1800 m runway for operating cargo aircrafts
(e.g. Hercules C-130) and passenger/freight aircrafts (BAe 146-100 jet
plane; 74 passengers). Included is tower, garage, staff rooms and a terminal for 160 passengers. The runway with safety areas is 2100 x 300 m.
The foot-print is about 0.7 km2. When the mine is operating there will be
an estimated 100 flights per year (mainly DHC-8 with a minimum of 20
Hercules). During construction about 150 flights of Twin Otter and
DHC-7 are expected.
The mining company’s plan early 2009 is not to start construction work
earlier than 2010.
15
Impacts on the environment
The Ramsar site “Heden” was designated primarily to protect internationally important populations of moulting Pink-footed geese and Barnacle geese (Greenland Home Rule 1990). The relatively large construction works planned inside the Ramsar site ”Heden” will affect the area in
two ways: Some areas will be lost, perhaps temporarily dependant of
remediation measures, and some areas will be disturbed so that animals,
especially moulting geese, will be displaced from the areas. Therefore, a
part of the Ramsar site “Heden” does not comply with the obligations
for a Ramsar site: A wetland which as an ecosystem supports a characteristic flora and fauna, especially water birds. An important purpose for
the Ramsar Convention is to avoid ongoing changes and losses of wetlands today and in the future. If “urgent national interests” are claimed
by the national state resulting in a reduction of a Ramsar site, the Ramsar
Secretariat must be informed about possible alternatives and a proposal
for the designation of a replacement area must be developed.
The Ramsar site “Heden” was designated due to the large number of
moulting and breeding Pink-footed geese and Barnacle geese, other
breeding birds like red-throated diver, long-tailed and Arctic skua, dunlin and turnstone, and uncommon breeding birds like Sabines gull, Red
and Red-necked phalarope and Whimbrel. In the late 1980s, the numbers
of moulting Pink-footed geese and Barnacle geese in the Ramsar site were 4,000 and 2-3,000, respectively (Greenland Home Rule 1990). The
Greenland/Iceland Pink-footed goose flyway population held in 1990
about 190,000 birds (Mitchell 2008) and the Greenland Barnacle goose
flyway population numbered c. 35,000 birds (Mitchell & Walsh 2008).
The moulting Pink-footed geese in “Heden” constituted at that time 23% of the total flyway population and the moulting Barnacle geese 6-9%.
An area qualifies to a Ramsar site if a minimum of 1% of the total flyway
population of at least one water bird species is using the area.
In a dialogue with the Ramsar secretariat the Greenland SelfGovernment has informed that the mining project is of “urgent national
interests”, meaning that the project can proceed provided that the impact
of the activities are monitored and that an appropriate replacement area
is found in advance. The Greenland Bureau of Minerals and Petroleum
(BMP) has informed the Ramsar secretariat of the mining project and the
preliminary results of the biological field work performed in the area during summer 2008, where the Ørsted Dal area in Jameson Land was suggested as a replacement area (Glahder et al. 2008).
Field studies in Jameson land
The initial purposes of the biological studies to be performed in 2008 and
2009 in the Ramsar site “Heden” and in the rest of Jameson Land were to
census the number and distribution of moulting geese prior to the start
of any construction work and then repeat these censuses after construction work was initiated. The effect of the different constructions on the
moulting geese could then be assessed both inside the Ramsar site and in
Jameson Land as such, e.g. in the Ørsted Dal replacement area. Because
the mining company late 2008 announced that no constructions would
be initiated during 2009, BMP decided to have a first report with only the
field work performed in 2008. The census of moulting geese in Jameson
16
Land was performed with the same methodology as used in the late
1980s in order to compare with censuses performed about 20 years ago.
Another purpose of the field work in 2008 was to census the number and
distribution of moulting and breeding geese, and of other breeding bird
species inside the possible affected area around Gurreholm, in the reference areas Tyskit Nunaat and Draba Sibirica River, and in the potential
replacement area around Ørsted Dal. The Gurreholm area was delimited
so that harbour area, airstrip and connecting roads were situated inside
the study area and a land area of about 10 km from these activities was
covered by the study. The reference area Tyskit Nunaat was delimited so
that it was situated at least 10 km away from the mining activities in an
area as similar as possible to the Gurreholm area and of approximately
the same size. The reference area Draba Sibirica River was also chosen to
compare grazing pressure by moulting geese in 2008 with that studied in
the area in 1982-1984 (Madsen et al. 1984, Madsen & Mortensen 1987).
The study area in the Ørsted Dal was chosen because the valley and its
surroundings is the only possible area in Jameson Land outside the Ramsar site “Heden” that can serve as a replacement area for the affected
Gurreholm area. The size of the study area is comparable to the Gurreholm area.
The studies in the above mentioned four study areas were performed in
July 2008. Because these studies were performed prior to construction activities it will be possible to assess the effect of these activities on number, distribution and possibly the breeding success of geese and other
bird species.
The present report describes the results of the field studies and the aerial
census performed in the Jameson Land area during July and August
2008. Also, the impact of the mining activities on birds in the north western corner of the Ramsar site “Heden” is assessed. The assessment is
based on the alternative localisation of the airstrip and roads as described in a letter and an attached figure from Quadra Mining Ltd. on 7
October 2008. Compared to the localisation of these constructions in the
mining company’s feasibility study from spring 2008, the airstrip has
been moved c. 1.5 km to the northwest and the road has been moved to
the coast with a perpendicular branch 1.5 km to the airstrip. According
to the letter, the proposed location of the alternative airstrip was visited
by the aviation authority SLV (Statens luftfartsvæsen) during summer
2008 and they indicated verbally that it was suitable.
17
2
The study areas
The four study areas
The Gurreholm area is a lowland area delimited to the west by Hall Bredning in the large fjord Scoresby Sund. In the north-western part of the
area a huge silty delta area is formed at the mouth of the c. 10 km wide
Schuchert River system. To the north and east the area gradually rises to
drier areas. The entire area can be classified as a wetland with a high
number of smaller and larger lakes, many marshes and smaller and larger rivers that drains the area. Mosses, cotton grasses Eriophorum sp,
sedges Carex sp and different flowering plant species dominate the wet
areas along lakes and rivers and in the marsh areas. On higher ground
in-between the wetland areas the vegetation is dominated by dwarf
scrub heath with species like Arctic blueberry Vaccinium uliginosum, Arctic bell-heather Cassiope tetragona and Arctic willow Salix arctica.
Photo 3. The Gurreholm study
area with Staunings Alps in the
back-ground.
The Tyskit Nunaat area is a lowland area delimited to the west by Scoresby Sund. To the north and the south the area is delimited by two west
flowing large rivers, Fegins River and Depot River, respectively. To the
east the area gradually raises to drier areas. The area is characterised by
drier dwarf scrub heath with species like Arctic blueberry, Arctic bellheather and Arctic willow. Rather few rivers drain the area, there is only
one large lake, Munin lake and relatively few smaller lakes and marshes.
The wet areas along these lakes, rivers and marsh areas are dominated
by mosses, cotton grasses, sedges and different flowering plant species.
The Ørsted Dal area is a 4-7 km wide, u-shaped valley that runs east-west
for about 50 km. To the east it borders Fleming Fjord and to the southwest it joins the Colorado Valley. Many smaller and larger rivers run into the main river and the valley floor contains scattered ponds and lakes
with the largest ones found in the mouth of the Lamprenen Valley.
Common mare’s-tail Hippuris vulgaris is widespread in ponds and lakes.
18
The valley slopes are mostly covered by barren ground, while the low lying dry areas are dominated by Arctic bell-heather and Arctic willow.
Wet areas are dominated by mosses, cotton grasses, sedges and different
flowering plant species. Mossy fens are extensive along rivers and lakes
where water is dammed or slow flowing. The river bed is covered by
gravel and sand with only little vegetation.
The Draba Sibirica area is a lowland tundra heath land (0-200 m a.s.l.) with
a continuous dwarf scrub with 75-100% cover with Arctic bell-heather,
Arctic blueberry, Crowberry Empetrum hermaphroditum and Dwarf birch
Betula nana predominating. The area is intersected with rivers and some
lakes are found. Graminoid marshes are found along rivers, streams and
lakes. Along the west coast, salt marshes are found (Madsen & Mortensen 1987).
Figure 1. The four study areas in
the northern part of Jameson
Land where intensive studies
were conducted during 16 July-2
August 2008.
Climate
The climate of the Jameson Land area is arctic with the mean monthly
temperature of the warmest month being below 10˚C. Only three
months, June, July and August, have mean temperatures above freezing.
The annual mean temperature at Mestersvig lying in the northern most
part of Jameson Land is –10.5˚C while Ittoqqortoormiit at the southeastern tip of Liverpool Land east of Jameson Land has an annual mean
19
temperature of -7.5˚C. Precipitation lies in the range from 290 to 410 mm
per year (Ohmura and Reeh, 1991) and decreases along the regional climatic gradients from coastal areas to inland areas and from south to
north.
Climate models predict changes in the summer mean temperature of
around 1˚C within the period 2021-2050 compared to the period 19611990 and 2˚C at 2051-2080 (Stendel et al. 2007). Winter temperatures will
change even more with a rise of 2˚C before 2050 and 8˚C before 2080.
With the diminishing sea ice there will also be a rise in precipitation of
up to 150 mm before 2050 and 200 mm before 2080 compared to the
1961-1990 period. Hence, the area in general will experience a warmer
and wetter climate similar to what is found at lower latitudes.
Weather in the area in 2008
During winter and early spring the entire Jameson Land was covered by
an unusual heavy snow fall with coverage of up to 2 m on the western
lowland part of Jameson Land. High temperatures in May – August in
combination with very little precipitation at that time made the snow
melt very rapid in May and first half of June followed by a very dry situation during July and August. In that period many smaller lakes and
marshes dried out completely. Similar conditions were seen throughout
north-eastern Greenland. Hence Zackenberg had a record amount of
snow and one of the fastest snowmelts in the period of registration (19952008) and Ittoqqortoormiit also experienced record amounts of snow.
20
3
Methods
During the period 16 July-2 August 2008 field work was performed by
three different study groups from NERI. The one group conducted an
aerial survey of moulting geese in the entire Jameson Land (70º-72ºN) on
17 and 18 July and the two other groups counted birds and examined
vegetation plots from the ground in four selected areas in Jameson Land
(Figs. 1 & 2).
3.1
Aerial survey
The aerial goose survey was carried out on 17 and 18 July 2008, approximately one week before the first non-breeding geese attain their flying abilities. Weather conditions were optimal, with unlimited visibility,
no winds and sky clear. The surveys were a replica of the surveys carried
out in 1987, 1988 and 1989 (Mortensen et al. 1988, Mosbech et al. 1989,
Mosbech & Glahder 1990). Aircraft and pilot were the same as in the
1980ies; a Partenavia P-68 Observer equipped with plexiglass front and
bubble windows at the seats behind the pilot seats and navigated by air
captain Leif Petersen. The observers were David Boertmann (participated also in 1988 and 1989) and Kent Olsen.
The flown routes were carried out as “total counts” (Laursen et al. 2008)
and duplicated as far as possible from the routes in 1987-1989 (Figure 2).
Navigation was visual and aided by GPS. Survey speed and altitude was
the same as in 1987-1989 i.e. 90 knots (160 km/hour) and 250 feet (85 m)
above ground. The two observers were placed in the co-pilot seat
(watching to the right) and the seat behind the pilot (watching to the
left). Observations were recorded on tape-recorders with indication of
time of the day (hour, minute, second) and subsequently written into a
spreadsheet. The observation file was then by the time signal merged
with the position file from the GPS (observer watches and GPS time synchronised) resulting in positions of each single observation.
The airport Constable Pynt (CNP) close to Ittoqqortormiit/Scoresbysund was the base of the flights.
21
Figure 2. Aerial survey routes in
Jameson Land 2008. Blue: 17
July, 915 km; and red: 18 July,
1004 km.
3.2
Ground survey, Gurreholm & Tyskit Nunaat
The ground survey in the Gurreholm area was performed during 17 – 25
July 2008 and in the reference area Tyskit Nunaat during 25 – 31 July.
The team of two persons, Alyn Walsh and Christian M. Glahder, was
flown out from Constable Pynt (CNP) by a Bell 222 helicopter to the Gurreholm camp site (71º11.958’N; 24º21.022’W), moved by helicopter to the
Tyskit Nunaat camp site (71º06.237’N; 24º15.002’W) and finally flown
back to CNP. Each day, trips of 10-20 km were walked and during the
study period a total c. 100 km (Gurreholm) and 78 km (Tyskit Nunaat)
was traversed. Routes formed radii from the camp sites to the areas’ delimitations with a special focus of lakes. Thereby land areas of 68.9 km2
(Gurreholm) and 48.6 km2 (Tyskit Nunaat) were covered. Binoculars
(Leica & Zeiss 10x magnification) and spotting scopes (Carl Zeiss Diascope 85 TFL 20-60x) were used for observations and GPS (Garmin
Etrex) for positions. All birds and mammals were registered with species, number, age, behaviour and position. Positions were either GPS positions or calculated from observations plotted in the field on false colour
infrared ASTER and Landsat satellite images from 15-17 July 2004
(1:25.000). Geese were separated in non-breeding moulting geese and
breeding geese in family flocks which include pulli. For other bird spe-
22
cies it was noted if birds were breeding or non-breeding; a breeding bird
was defined as a bird connected to a nest with eggs or chicks, juvenile
birds or that performed territorial behaviour (e.g. lure or chase intruders,
or sing). In mammals, fox dens and cubs were registered. On selected
vegetation plots of 4 m2 dominating species/genera, coverage and moisture were noted. Positions and data from these plots were initially used
to map fen covered areas in the entire Jameson Land (Fig. 44). In the
Gurreholm area, droppings were counted in double plots each of 4 m2
along transects perpendicular to shores of lakes where moulting geese
were observed. The plots were placed 2, 10, 20, 40 and 60 m from the
lake. These transects can in following years be used to assess the goose
use of the area. All animal observations, camps, routes, observed lakes
and observations points were plotted on false coloured satellite images
(1:25,000) and if necessary verified by false coloured aerial photos (c.
1:22,000, 1980ies).
3.3
Ground survey, Ørsted Dal & Draba Sibirica
The ground survey in the Ørsted Dal area was performed during 17 – 25
July 2008 and in the reference area Draba Sibirica River area during 25 –
31 July. The team of two persons, Jesper Madsen and Cornelia Jaspers,
was flown out from Constable Pynt (CNP) by a Bell 222 helicopter to the
Ørsted Dal camp site (71º39.14’N; 23º43.52’W), moved by helicopter to
the Draba Sibirica camp site (71º01.15’N; 24º00.21’W) and finally flown
back to CNP. Each day, trips of 5-10 km were walked and scans with telescopes were performed form vantage points. The Ørsted Dal area covered 53.2 km2 and the Draba Sibirica area 65.6 km2. Binoculars (Leica &
Zeiss 10x magnification) and spotting scopes (Carl Zeiss Diascope 85 TFL
20-60x) were used for observations and a GPS receiver (Trimble Recon©)
for positions of vegetation plots and observed animals. All birds and
mammals were registered with species, number, age, behaviour and position. The positions were given as estimated distance and angle from the
observer to the animal; from these data the positions of the animals were
calculated. Geese were separated in non-breeding moulting geese and
breeding geese in family flocks which include pulli. For other bird species it was noted if birds were breeding or non-breeding; a breeding bird
was defined as a bird connected to a nest with eggs or chicks, juvenile
birds or that performed territorial behaviour (e.g. lure or chase intruders,
or sing). For mammals, muskoxen calves, fox dens and cubs were registered. On selected vegetation plots of 4 m2 dominating species/genera,
coverage and moisture were noted. Positions and data from these plots
were initially used to map fen covered areas in the entire Jameson Land
(Chapter 6, Fig. 44).
Vegetation composition and productivity in goose grazed marshes in
the Draba Sibirica area
Frequency distribution
On 30 July 1984, plant species frequency was examined by use of a pinpoint method in a Hoppner’s sedge Carex subspathacea – moss dominated
sward grazed by moulting Pink-footed geese. A 165 m-long transect was
laid out in the marsh perpendicular to the lake where geese were seeking
refuge. At 15-m intervals a secondary transect was laid out at right angles to the main transect. Depending on the width of the marsh, the pres-
23
ence or absence of species was recorded in up to 180 contact points. In
2008, we repeated the analysis following the same methodology. Since
we did not have exact positions of the 1984 primary and secondary transect lines, we visually judged the position of the former main transect
line (see Photo 1). Due to the configuration of the marsh, we believe to
have hit the 1984-primary transect line within few metres. We took GPS
positions of the centre of the secondary transect lines. Due to the presence of moulting geese, breeding divers and Sabine’s gulls on the nearby
lake, we shortened our presence in the marsh to minimize disturbance.
Therefore, instead of doing the pin-point sampling in the field, we took
close up nadir digital pictures of the secondary transect lines and did the
estimation of species coverage later on the basis of the pictures. For each
secondary transect we took up to three pictures at two m-intervals on
each side of the main transect, placing a ruler in the picture. Subsequently, the plant species presence was sampled in 32 contact points
within the picture frame (which was 50 cm x 30 cm), overlaying the picture with a grid. Furthermore, for monocots grazed by the geese, we recorded whether the leaf had been grazed by geese or not. For each centre
point of the secondary transects, we also took an oblique picture of the
vegetation community, with a 2-m ruler as the frame. The picture thus
represents an area of approximately 4 m2. From each picture, we have
counted the number of flowering Arctic cotton-grass Eriophorum
scheuchzeri.
Figure 3. Transect line in goose
grazed marsh in the Draba Sibirica area (Jesper Madsen).
For statistical comparison of the 1984 and 2008 transect data, we used the
non-parametric version of the paired t-test, viz. a paired Wilcoxon signed
rank test. For analysis of trends along the transect, we used a MannKendall test for mononic trend. Non-parametric tests were used because
the frequency data was not normally distributed, even after transformation.
On 31 July 2008, we made an additional transect in a Carex subspathacea
dominated marsh along the Draba Sibirica River, using the same method
and sampling protocol as described above. This marsh was primarily
grazed by moulting Barnacle geese, but also some Pink-footed geese occurred according to the primary feathers found shed on the river banks.
24
Here, we made both the pin-point analysis in the field and the digital
photo method to compare the direct field sampling with the photo-based
sampling. The two methods did not yield different results.
Plant biomass and productivity of vegetation
To estimate potential food supplies available to moulting geese, the net
above-ground primary production (NAPP) of marsh vegetation was studied in 1983 and 1984. In 1983, an exclosure experiment was set up in a
Carex subspathacea dominated marsh. Biomass was estimated within and
outside exclosures on 5 July and 4 August, respectively, i.e. covering the
moulting period. In 1984, an exclosure experiments were set up in a Water sedge Carex stans - Kentucky bluegrass Poa pratensis dominated marsh
and in a Carex subspathacea dominated marsh (same marsh as in 1983).
We simulated goose grazing by clipping during 21 June and 30 July (see
Madsen and Mortensen 1987). On 27 July 2008, we revisited the Carex
stans-Poa pratensis marsh where we sampled in 1984. We were not able to
set up exclosures, but we took five biomass samples at random in the
previous exclosure plot. The area showed no signs of having been grazed
by geese; hence, the area is regarded as comparable to the previous exclosures. In five plots of 16 cm x 16 cm (0.0256 m2) each, we clipped the
above-ground vegetation to the ground and sorted the vegetation into
species; only leaves which were alive were collected. If leaf tips were
dead, but the lower part was still alive, the whole leaf was sampled.
Samples were stored in paper bags and wind dried in the field. In the laboratory, samples were dried at 50oC for 48 hours, stored in an exicator
for 24 hour and weighed.
3.4
Vegetation mapping
In the 1980s, comprehensive vegetation studies were performed in the
Jameson Land area. These were based on ground truthing and either false colour infrared aerial photos or satellite imagery (Bay & Holt 1986;
Mosbech & Hansen 1994). Unfortunately, we have not been able to perform quantitative analyses of the vegetation change between the 1980s
and 2008, because none of the earlier studies exist on a digital form.
In the present study we used a combination of field surveys and satellite
imagery processing to produce a map of the wet vegetated habitats (in
the following called fens) used by geese. These areas are often located
close to lakes, major river systems and coastal areas; lakes and rivers have therefore been a focus for the mapping and the following analyses.
Field surveys
Mapping of the overall coverage and composition of plant communities
and registration of the moisture content in the soil surface was carried
out in five areas in Jameson Land during July 2009: Ørsted Dal (n=144),
Draba Sibirica River (n=86), Constable Point (n=45), Gurreholm (n=20)
and Tyskit Nunaat (n=16) (Fig. 4). In plant communities which were visually judged as homogeneous within a radius of at least 15 m, a random
plot was selected. Within a circle with a diameter of 2 m (area c. 3.1 m2),
we estimated the following (i) the overall coverage, ranging from 0100%, (ii) the coverage of the four most dominant plant species, including mosses (not identified to species level); hence, the sum of the coverage could exceed 100%, (iii) soil surface moisture content, categorised as
25
dry, moist and wet (with standing water). All plots were geo-referenced
by use of a GPS. For the plots in Ørsted Dal, Draba Sibirica River and
Constable Point, oblique digital photos were taken, with the picture
frame covering a 2 m long ruler placed in the plot. We focussed on the
habitats used by geese, but attempted to cover all major habitat types encompassed as well as gradients in coverage and soil surface moisture
content. To assist in selecting habitat types subsequently identifiable
from an ASTER satellite image, a handheld computer with a GPS receiver (Trimble Recon©) was used with downloaded ASTER satellite imagery of Jameson Land (Ørsted Dal, Draba Sibirica River and Constable
Point). This enabled us to navigate and search for gradients in reflection
on the image.
Photo 4. Vegetation ground
truthing in the Ørsted Dal study
area. Diameter of the 2 m plot is
shown by the folding rule (Cornelia Jaspers).
Satellite imagery processing
A series of satellite images were used to create a mosaic that covers the
entire Jameson Land area. Seven ASTER images and one Landsat ETM+
SLC-off were used. They were all acquired within the three-day period
15 – 17 July 2004 where weather and general conditions were stable. We
therefore assume that vegetation development, moisture, snow cover etc.
are the same during this short period. All images were georectified and
resampled to 15 m using the ENVI software (http://www.ittvis.com)
and atmospherically corrected using the ATCOR3 software (Richter
1997). Due to the slightly different spectral band width and lower spatial
resolution of the Landsat ETM+ sensor the edges between the coverage
with the different sensor types are somewhat visible. This does not have
a significant impact in the analysis of the imagery. Another problem with
the Landsat ETM+ SLC-off is the missing data lines. These holes and a
few clouded areas have been filled using a Delaunay triangulation based
on the bordering areas. Hence, the interpolated areas will not give information on the exact pixel but a more general view of the surrounding
pixels. The accuracy of the classification is therefore in these regions
slightly lowered. However, as the missing lines in the regions where the
Landsat ETM+ imagery has been used only covers 5 lines out of 32 the
problem is small and less than 0.3 percent of the mapped area is affected.
26
Figure 4. Position of plant community studies at the five main
field survey locations. All locations are placed in the lowland
areas or valleys where vegetation
is abundant.
After pre-processing, the images were used to map the areas of major
importance for the geese. This includes lakes and larger rivers that function as refuge in relation to predators and wet fens that are the primary
feeding ground for geese. Salt marshes are another type of major importance for geese but cannot be distinguished from fell field on the satellite
imagery due to its sparse vegetation cover. Instead, salt marshes are included through the addition of a coastal region in the modelling (Refer to
3.5 Spatial analyses).
Lakes
The lakes were mapped using a standard supervised maximum likelihood classification based on visual interpretation of the final mosaic.
Some problems occurred in distinguishing lakes from shadows that often
are showing the same low spectral reflectance. To avoid misclassification
a digital elevation model was used to filter out sloping areas and thereby
shadows.
27
Fens
Fens where mapped using two different indices calculated from the mosaic: Normalised Difference Vegetation Index (NDVI) and Normalised
Difference Infrared Index (NDII).
NDVI is widely used for monitoring vegetation characteristics and differences whereas NDII is used for vegetation and surface moisture.
NDVI is calculated as the difference in reflection between the nearinfrared (NIR) and the red spectral bands using the following equation
(Rouse et al. 1973):
σ NIR − σ RED
σ NIR + σ RED
where σNIR is the reflection at the near-infrared wavelength (ASTER band
3) and σRED is the reflection at the red wavelength (ASTER band 2). The
images were analysed for greenness (NDVI) and surface moisture using
a moisture index, NDII (similar to NDVI but uses band 4 and 3 from the
ASTER sensor to enhance areas with higher surface moisture (Yilmaz et
al. 2008)). Based on the analysis with information from the field observations it was possible to distinguish wet fens with luxurious vegetation.
Ranges of NDVI and NDII were based on a comparison between the
field observations and the satellite data. Hence, all pixels with NDVI
above 0.45 (corresponding to vegetation cover above 80%) and NDII
above 0.0 (corresponding to the wet field observations) were mapped as
fen. Some of the shallow lakes in the region have a relative high NDVI
due to mosses and plants in the water. These areas were masked out using the lake classification.
3.5
Generalized linear model set-up
On the basis of the fen and freshwater areas extracted from the Aster satellite images and results of the ground surveys at Gurreholm and Tyskit
Nunaat, we defined the potential foraging area for moulting geese in Jameson Land. Firstly, we evaluated to what extent the potential habitats
of moulting geese in Jameson Land were covered by the aerial survey
and thereby the credibility of this total count. Secondly, the potential foraging area served as a parametre in a model that described the relationship between the size of the foraging area and the number of geese. This
model was then used to predict the number of moulting geese in the
proposed replacement area around Ørsted Dal (see section 4.4).
The freshwater areas which resulted from the digital image processing
were not always continuous. What in reality was one discrete lake was
often represented as a non-continuous cluster of freshwater cells within a
limited area. This representation was considered problematic as it resulted in far too many discrete freshwater bodies.
The problem was solved by clustering freshwater bodies situated within
100 meters of each other, measured as the distance between their perimeters. The 100 meters is considered a relevant threshold value, as moulting geese are likely to move this distance and thus probably would consider different water bodies within this distance as one big refuge area
(Glahder & Walsh 2006). This single-link clustering algorithm had the
28
fortunate consequence of chaining together the freshwater cells making
up larger rivers, which in the original raster representation were severely
fragmented.
The size of the freshwater bodies resulting from the clustering process
were compared to the observations of moulting geese made during the
field studies at Gurreholm and Tyskit Nunaat (Fig. 5). From this comparison it was evident that the freshwater bodies needed a certain minimum size to serve as a refuge area to the moulting geese. On the basis of
the moving average in Fig. 5 only freshwater bodies larger than 0.25 ha
were considered to be potential refuge areas.
400
350
Total no of geese
Figure 5. Number of moulting
geese in freshwater bodies of
different size in the Gurreholm
and Tyskit Nunaat study areas.
300
250
200
150
100
50
0
0
0.5
1.0
1.5
2.0
2.5
3.0
3.5
Size of freshwater body (ha)
Studies of densities of goose droppings around lakes and rivers in Jameson Land have shown that the moulting geese primarily forage in the
sedge-dominated fens up to 200 m away from the water bodies (Madsen
& Mortensen 1987). Thus in terms of defining the potential foraging area
for moulting geese in Jameson Land the fen area within 200 m of the clustered freshwater bodies of more than 0.25 ha of size was extracted from the
raster grid of fen vegetation. However, as the moulting geese also use the
coast as a refuge area, fen areas within 200 m of the coastline were also included.
As an example, Fig. 6 shows the distribution of potential foraging areas
in the Gurreholm study area along with the field observations of flocks
of moulting Pink-footed geese and all freshwater areas extracted from
the satellite images.
Jameson Land was then overlaid by a grid of 5x5 km cells and within
each cell the size of the potential foraging area for moulting geese was
calculated (Fig. 7). Aerial survey routes from July 2008 and observed
flocks of moulting geese were also included on Fig. 7. Thus, the model is
based on the 5x5 km grid overlaid the entire Jameson Land, but only
cells intersected by the aerial survey routes and by land areas are included in the dataset. All other cells are excluded as we have no objective knowledge of the number of geese in these cells. Since the survey
routes primarily cover areas with large potential foraging areas for
moulting geese, we are only modelling the variation within areas where
we expect to find geese. Thus, the basis of the model is not a random
sample of the Jameson Land area.
29
Figure 6. The extracted potential
foraging areas, freshwater bodies
larger than 0.25 ha and observed
flocks of moulting Pink-footed
geese in the Gurreholm study
area.
Flock of moulling pink-footed geese
Potential fouraging area
Freshwater
0
1
2 Km
The response variable of the model is the total number of moulting geese
(Barnacle and Pink-footed geese) observed in the cells during the aerial
survey in 2008. Two explanatory variables were tested, the size of the potential foraging area for moulting geese within the cells and a factor called “coastal” which indicates whether or not the cells intersect the coast.
The coastal areas were separated because we found that coastal salt
marshes, which to a large degree constitute the foraging habitat of geese
occurring there, did not consistently show up as fen habitat in the satellite imagery analysis. Hence, we expect that the number of geese in relation to salt marshes will be higher than expected from the fen habitat.
30
Figure 7. Jameson Land overlaid
by a 5x5 km grid with calculations
of the size of the potential foraging areas (red: highest coverage;
dark green: lowest coverage).
Aerial survey routes and observed flocks of moulting geese
are shown.
Foraging area
ha per 5×5 km cell
0.00 - 1.00
1.01 - 3.50
3.51 - 7.00
7.01 - 12.00
12.01 - 20.00
20.01 - 30.00
30.01 - 50.00
50.01 - 121.00
Goose flocks
Survey route
0
7.5
15 km
A Generalized Linear Model with log-link and quasipoisson errors was
applied. In this model, the interaction between potential foraging area
and the factor “coastal” turned out not to be significant (p=0.30). Both
main effects were significant and are retained in the minimal adequate
model which thus contains one slope and two intercepts:
31
glm(formula = Geese ~ ForagingArea + Coastal, family = quasipoisson)
Deviance Residuals:
Min
1Q Median
-28.487 -12.530 -11.964
3Q
-1.382
Max
68.285
Coefficients:
(Intercept)
ForagingArea
CoastalYes
Estimate Std. Error
4.270651 0.170891
0.026626 0.003712
0.578217 0.230274
t value
Pr(>|t|)
24.990
< 2e-16 ***
7.173 6.81e-12 ***
2.511
0.0126 *
--Signif. codes: 0 ‘***’ 0.001 ‘**’ 0.01 ‘*’ 0.05 ‘.’ 0.1 ‘ ’ 1
(Dispersion parameter for quasipoisson family taken to be 439.0666)
Null deviance: 95825 on 277 degrees of freedom
Residual deviance: 78598 on 275 degrees of freedom
The model explains approximately 18% of the total deviance, of which
the potential foraging area and the factor “coastal” account for 85% and
15% respectively. However, too much faith should not be put in the model as the residuals show some degree of non-normality of errors. Further, there is evidence of spatial autocorrelation of residuals up to a distance of approximately 20 km and the uncertainty of the model is thus
likely to be underestimated. At this stage, these issues have not been
dealt with, and the model should thus be considered preliminary.
32
4
Results, birds
4.1
Pink-footed goose
Aerial survey
The total number of Pink-footed geese recorded in Jameson Land during
the aerial survey is listed in Table 1. Almost all geese were moulting nonbreeding birds. However, here and there downy young were seen in the
flocks and small flocks or single pairs with goslings were also recorded.
In total, 24 Pink-footed goslings were seen.
Table 1. Total number of geese recorded during the aerial survey in Jameson Land 17
and 18 July 2008.
Goose species
Number of birds
Number of flocks
Pink-footed goose
19068
384
Barnacle goose
16603
431
2
1
Canada goose
Photo 5. Flock of moulting Pinkfooted geese on a lake in the
Gurreholm study area (Alyn
Walsh).
Only very few Pink-footed geese were recorded flying (n = 21) and the
geese had usually taken refuge on water – rivers, lakes, ponds and the
sea. However, a few flocks remained on river and lake shores when over
flown.
The distribution of the Pink-footed geese is shown in Figure 8.
33
Figure 8. Distribution of flocks of
Pink-footed geese in Jameson
Land recorded during aerial
surveys on 17 and 18 July 2008.
Flock sizes are indicated by the
size of the signature. In total 384
flocks with a total of 19,068 birds
were recorded (corrected for
birds recorded more than once).
Ground studies
From the ground it was possible to distinguish between moulting geese
and family flocks. The moulting flocks were often rather large and mostly encountered on or close to larger lakes or rivers, whereas the family
flocks formed smaller groups that were often feeding near ponds and
streams, on marshes or on the tundra. In many instances it was possible
to separate single families so that the brood size could be registered.
Adult failed breeding birds could be part of the family flocks. Because of
different methodology used in the aerial survey and the ground survey,
it is not possible directly to compare the results, but the two studies give
a fairly good idea of the total number of moulting geese in the ground
study areas. Below, the results from the aerial study and the ground studies are given for each of the four ground study areas.
34
The Gurreholm area
A total of 2752 moulting Pink-footed geese and 834 geese in family flocks
were counted from the ground (Figs. 9 and 10, Table 2). The table also
show the distribution of adults and young. Young per breeding pair
could be calculated from 76 families, giving an average of 2.80. From the
air a total of 3971 moulting Pink-footed geese were counted, while no
family groups were observed (Figure 11, Table 2).
Table 2. Pink-footed geese in the Gurreholm area counted from the air on 17 July 2008
and from the ground during 17-25 July 2008.
Aerial survey
Moulting
Ground count
Breeding
3971
Moulting
Adult
Young
Total
0
0
0
2752
Breeding
Adult
Young
Total
442
392
834
Figure 9. Moulting Pink-footed
geese in the Gurreholm and
Tyskit Nunaat areas counted
from the ground. Total numbers
were 2752 and 1090 birds, respectively.
1 - 10
11 - 25
26 - 65
66 - 140
141 - 270
0
1
2 Km
35
Figure 10. Family groups of Pinkfooted geese in the Gurreholm
and Tyskit Nunaat areas counted
from the ground. Total numbers
was 834 and 83 birds, respectively.
1 - 10
11 - 20
21 - 32
33 - 45
46 - 65
0
1
2 Km
Figure 11. Pink-footed geese in
the Gurreholm area counted from
the air. Total number was 3971
birds.
Goose droppings counts in the Gurreholm area
In the Gurreholm area the relative activity of moulting geese was registered by counting goose droppings along transect lines at selected lakes
shores. At 13 lakes droppings were counted at a total of 16 transects (figure 12, Table 3).
36
Figure 12. Transect with goose
droppings counts in Gurreholm
(green dots).
Included also are observations of
exploration activities: blue dots
show Quadra Mining Ltd. activities (port site to the west and
airstrip length indicated by the
two dots further north); in 1960´s
the mining company Nordisk
Mineselskab explored the area
(brown dot indicates a smaller
harbour) and in 1980´s the oil
company ARCO explored intensively the area (lilac dots indicate
seismic vehicle tracks).
Nordisk Mineselskab
Quadra
ARCO
Goosedrops
0
1
2 Km
Table 3. The relative number (in % of highest number) of Pink-footed goose droppings from 15 transects in moulting habitats in
the Gurreholm area. *): The transect JT12 was in a family group habitat. Droppings were counted in distances of 2, 10, 20, 40
and 60 m from the lake shore (Dist. (m)).
Dist.
(m)
JT01
JT02
JT03
JT04
JT05
JT06 JT07
2
100.0 100.0 100.0 100.0 100.0 100.0 100.0
JT08
JT09
JT10
JT11 JT12*)
45.0 100.0 100.0 100.0
10
30.2
76.5
58.8
52.9
44.8
56.1
31.9
60.0
20.0
52.4
20
13.8
17.6
32.4
70.6
6.9
63.4
16.7
60.0
0.0
4.8
40
9.4
11.8
5.9
17.6
3.4
24.4
0.0
95.0
0.0
23.8
60
0.0
0.0
23.5
5.9
6.9
43.9
0.0 100.0
6.7
0.0
JT13
JT14
JT15
JT16
50.0 100.0 100.0 100.0 100.0
52.0 100.0
71.4
93.6
46.2
21.8
16.0
0.0
14.3
36.2
57.7
12.7
4.0 100.0
19.0
12.8
23.1
1.8
4.8
8.5
7.7
5.5
0.0
75.0
The Tyskit Nunaat area
From the ground, a total of 969 moulting Pink-footed geese and 83 geese
in family flocks were counted (Figs. 9 and 10, Table 4). The table also
show the distribution of adults and young. Young per breeding pair
could be calculated from only 4 families, giving an average of 3.50. The
aerial survey observed a total of 969 moulting Pink-footed geese, nearly
the same amount counted from the ground. No family groups were observed from the air (Figure 13, Table 4).
37
Table 4. Pink-footed geese in the Tyskit Nunaat area counted from the air on 17 July 2008
and from the ground during 25 July and 1 August 2008.
Aerial survey
Moulting
969
Ground count
Breeding
Moulting
Adult
Young
Total
0
0
0
1090
Breeding
Adult
Young
Total
57
26
83
Figure 13. Pink-footed geese in
the Tyskit Nunaat area counted
from the air. A total of 969 birds
were observed.
The Ørsted Dal area
A total of 166 moulting Pink-footed geese and 54 geese in family flocks
were counted from the ground (Figure 14, Table 5). The table also shows
the distribution of adults and young. Young per breeding pair could be
calculated from 10 families, giving an average of 2.70. From the air a total
of 408 moulting Pink-footed geese were counted, while no family groups
were observed (Figure 15, Table 5).
Table 5. Pink-footed geese in the Ørsted Dal area counted from the air on 18 July 2008
and from the ground during 17-25 July 2008.
Aerial survey
Moulting
408
38
Ground count
Breeding
Moulting
Adult
Young
Total
0
0
0
166
Breeding
Adult
Young
Total
27
27
54
Figure 14. Moulting Pink-footed
geese and family flocks in the
Ørsted Dal area counted from the
ground. Total numbers were 166
and 54 birds, respectively.
Moulting adults
10 - 15
16 - 20
21 - 50
51 - 65
Family groups
29
42
0
1
2 Km
Figure 15. Pink-footed geese in
the Ørsted Dal area counted from
the air. A total of 408 moulting
birds were observed.
The Draba Sibirica area
A total of 2756 moulting Pink-footed geese and 770 geese in family flocks
were counted from the ground (Figure 16, Table 6). The table also shows
the distribution of adults and young. Brood sizes could not be counted
accurately. From the air a total of 2483 moulting Pink-footed geese were
counted, while no family groups were observed (Figure 17, Table 6).
39
Table 6. Pink-footed geese in the Draba Sibirica area counted from the air on 17 July
2008 and from the ground during 17-25 July 2008.
Aerial survey
Moulting
Breeding
Young
Total
0
0
0
Figure 16. Moulting Pink-footed
geese and family flocks in the
Draba Sibirica area counted from
the ground. Total number was
2756 and 770 birds, respectively.
Family groups
46 - 60
61 - 100
550
Moulting adults
0 - 50
51 - 100
101 - 250
1892
Figure 17. Pink-footed geese in
the Draba Sibirica area counted
from the air. A total of 2483 birds
were observed.
40
1
Moulting
Adult
2483
0
Ground count
2 Km
2756
Breeding
Adult
Young
Total
338
432
770
4.2
Barnacle goose
Aerial survey
The total number of Barnacle geese recorded in Jameson Land during the
aerial survey is listed in Table 1. Almost all were moulting non-breeding
birds. However, here and there downy young were seen in the flocks
and small flocks or single pairs with goslings were also recorded. In total, 45 Barnacle goslings were seen.
Only very few Barnacle geese were recorded flying (n = 8) and the geese
had usually taken refuge on water – rivers, lakes, ponds and the sea.
The distribution of the Barnacle geese is shown in Figure 18.
Figure 18. Distribution of flocks
of Barnacle geese in Jameson
Land recorded during aerial
surveys on 17 and 18 July 2008.
Flock sizes are indicated by the
size of the signature. In total 431
flocks with a total of 16,630 birds
were recorded (corrected for
birds recorded more than once).
Ground studies
From the ground it was possible to distinguish between mounting geese
and family flocks. The moulting flocks were often rather large and mostly encountered on or close to larger lakes or rivers, whereas the family
flocks formed smaller groups that often were feeding near ponds and
streams. In many instances it was possible to separate single families so
that the brood size could be calculated. Because of different methodology used in the aerial survey and the ground survey, it is not possible directly to compare the results, but the two studies give a fairly good idea
41
of the total number of moulting geese in the ground study areas. Below,
the results from the aerial study and the ground studies are given for
each of the four ground study areas.
Photo 6. Barnacle geese still
able to fly.
The Gurreholm area
A total of 167 moulting Barnacle geese and one family flock of 8 individuals were counted from the ground (Figs. 19, Table 7). From the air a
total of 284 moulting Barnacle geese were counted, while no family
groups were observed (Figure 20, Table 7).
Figure 19. Moulting (blue) Barnacle geese and family flocks
(red) in the Gurreholm and Tyskit
Nunaat areas counted from the
ground. Total numbers in Gurreholm were 167 moulting geese
and 8 family birds and in Tyskit
Nunaat 201 moulting geese.
Family groups
8
Moulting adults
1-2
3 - 10
11 - 30
31 - 55
0
42
1
2 Km
Table 7. Barnacle geese in the Gurreholm area counted from the air on 17 July 2008 and
from the ground during 17-25 July 2008.
Aerial survey
Moulting
284
Ground count
Breeding
Moulting
Adult
Young
Total
0
0
0
167
Breeding
Adult
Young
Total
6
2
8
Figure 20. A total of 284 moulting
Barnacle geese were counted
from the air in the Gurreholm
area.
The Tyskit Nunaat area
From the ground, a total of 201 moulting Barnacle geese and no family
flocks were counted (Figs. 19, Table 8). The aerial survey observed a total
of 269 moulting Barnacle geese, not very different from the number
counted from the ground. No family groups were observed from the air
(Figure 21, Table 8).
Figure 21. A total of 269 moulting
Barnacle geese were counted
from the air in the Tyskit Nunaat
area.
43
Table 8. Barnacle geese in the Tyskit Nunaat area counted from the air on 17 July 2008
and from the ground during 25 July and 1 August 2008.
Aerial survey
Moulting
269
Ground count
Breeding
Moulting
Adult
Young
Total
0
0
0
201
Breeding
Adult
Young
Total
0
0
0
The Ørsted Dal area
A total of 696 moulting Barnacle geese and 123 geese in family flocks were counted from the ground (Figure 22, Table 9). The table also shows the
distribution of adults and young. Young per breeding pair could be calculated from 17 families, giving an average of 1.71. From the air a total of
542 moulting Barnacle geese were counted and probably only one family
group with 2 young were observed (Figure 23, Table 9).
Figure 22. Moulting Barnacle
geese and family flocks in the
Ørsted Dal area counted from the
ground. Total numbers were 696
and 123 birds, respectively.
Family groups
3-5
6 - 25
26 - 75
76 - 83
Moulting adults
6 - 25
26 - 50
51 - 100
101 - 240
0
1
2 Km
Table 9. Barnacle geese in the Ørsted Dal area counted from the air on 18 July 2008 and
from the ground during 17-25 July 2008.
Aerial survey
Moulting
542
44
Ground count
Breeding
Moulting
Adult
Young
Total
0
2
2
696
Breeding
Adult
Young
Total
82
41
123
Figure 23. Barnacle geese in the
Ørsted Dal area counted from the
air. A total of 544 birds were
observed.
The Draba Sibirica area
A total of 240 moulting Barnacle geese and 37 geese in family flocks were
counted from the ground (Figure 24, Table 10). The table also show the
distribution of adults and young. Young per breeding pair could be calculated from 6 families, giving an average of 3.83. From the air a total of
1122 moulting Barnacle geese were counted, while no family groups were observed (Figure 25, Table 10).
Figure 24. Moulting Barnacle
geese and family flocks in the
Draba Sibirica area counted from
the ground. Total numbers were
240 and 37 birds, respectively.
Family groups
5
32
Moulting adults
5 - 10
11 - 20
21 - 30
31 - 40
0
1
2 Km
45
Table 10. Barnacle geese in the Draba Sibirica area counted from the air on 17 July 2008
and from the ground during 25-31 July 2008.
Aerial survey
Moulting
1122
Ground count
Breeding
Moulting
Adult
Young
Total
0
0
0
240
Breeding
Adult
Young
Total
14
23
37
Figure 25. Barnacle geese in the
Draba Sibirica area counted from
the air. A total of 1122 birds were
observed.
4.3
Goose grazed marshes
In 1983 and 1984, studies of the plant frequency distribution and productivity of vegetation used by moulting geese were carried out in the Draba
Sibirica area (Madsen et al. 1984, Madsen & Mortensen 1987). To see if
major changes had taken place from 1983-84 to 2008, i.e., as a long-term
effect of possible intensified goose grazing due to increasing goose populations over the 25 year period or as an effect of climate change, we returned to the same areas to repeat the studies. This information is important for the assessment of the habitat carrying capacity of Jameson Land
for moulting geese.
Marsh vegetation composition
The overall composition of the vegetation of the goose grazed marsh in
the Draba Sibirica area in 1984 and 2008 is comparable (Fig. 26). Less frequent species (less than 1% in overall frequency) are not shown, such as
Herb-like willow Salix herbacea, Saxifraga foliosa, Viviparous knotweed
Bistorta viviparum, Juncus spp., Carex stans and Horsetail spp. Equisetum
spp. At a distance of up to approximately 120 m from the lake shore, Carex subspathacea, protruding the moss carpet, was dominating. Further
away from the lake, Loose-flowered Alpine sedge Carex rariflora became
dominant. However, between years, there were significant differences.
46
1984
No. vegetation
80
2008
60
40
20
0
80
Moss
60
40
20
Carex subspathacea
Frequency
0
80
60
40
20
0
80
Poa spp.
60
40
20
Eriophorum scheuzerii
0
80
60
40
20
carex rariflora
0
80
60
40
20
0
0
15 30 45 60 75 90 105 120 135 150 165
0
15 30 45 60 75 90 105 120 135 150 165
Distance from lake shore (m)
Figure 26. Frequency distribution in 1984 and 2008 of plants and unvegetated points in a goose grazed sedge and moss dominated marsh in the Draba Sibirica area in relation to the distance to the lake shore.
47
First, the frequency of points with no vegetation increased from 1984 to
2008 (Table 11); in 1984, the frequency decreased with distance from the
lake shore, whereas there was no trend in 2008. Second, in 1984, the frequency of moss increased with distance from lake shore, whereas the
opposite was the case in 2008. Third, the frequency of Carex subspathacea
was higher in 1984 compared to 2008. Fourth, Poa spp. was more frequent in 1984 compared to 2008. Eriophorum scheuchzeri increased in frequency with distance to lake in 2008, but showed no trend in 1984.
Table 11. Statistical comparison of coverage of vegetation along transect in goose grazed
marsh in the Draba Sibirica area, 1984 vs. 2008, and trends in coverage from the lake
shore and 165 m inland. Difference in coverage between 1984 and 2008 is expressed by
a Paired Wilcoxon signed rank test (V-value) (non-parametric equivalent of a paired ttest), trends by a Mann-Kendall test for mononic trend (Tau-value).
No vegetation
Difference
1984-2008
V
Trend
1984
Tau
Trend
2008
Tau
11 *
-0.576 *
0.06 n.s.
Moss
42
n.s.
0.758 **
-0.606 **
Carex subspathacea
72 **
-0.485 *
-0.382 n.s.
Poa spp.
78 **
0.091 n.s.
0.095 n.s.
n.s.
n.s.
0.688 **
Eriophorum scheuzerii
16
Carex rariflora
4 n.s.
-0.224
0.759 **
0.776 **
*significant at 5% level (2-sided); ** significant at 1% level (2-sided);
n.s.
not significant.
The geese grazed the vegetation intensively. Hence, within 100 m from
the lake shore, approximately 80% of all leaves of Carex, Poa and Eriophorum were grazed. Beyond that distance, grazing pressure decreased, and
at distance of 165 m from the lake, none of the leaves were grazed (Fig.
27). Furthermore, until 130 m from the lake shore, no Eriophorum
scheuchzeri was recorded flowering in the central photo plots; beyond
that distance, flowering plants occurred frequently (with 4-9 flowers per
4 m2).
100
80
% of leaves grazed
Figure 27. The proportion of
leaves of monocot vegetation
grazed by moulting geese in
relation to the distance to the lake
shore. Data are from the same
marsh shown in Fig. 26 in the
Draba Sibirica area in 2008.
60
40
20
0
0
15
30
45
60
75
90
105
120
Distance from lake shore (m)
48
135
150
165
80
No vegetation
60
40
20
0
80
Moss
60
40
20
0
60
40
20
Frequency
Carex subspathacea
80
0
80
Poa spp.
60
40
20
Eriophorum scheuzerii
0
80
60
40
20
0
80
Carex rariflora
Figure 28. Frequency distribution
in 2008 of plants and unvegetated points in a goose grazed
sedge and moss dominated
marsh at the Draba Sibirica river
in relation to the distance to the
lake shore.
60
40
20
0
0
15
30
45
60
75
90
105
120
135
Distance from river shore (m)
49
In the marsh adjacent to the Draba Sibirica River, the overall vegetation
composition and spatial trends were similar to the lake marsh (Fig. 28).
However, frequency of moss was higher and Carex subspathacea decreased at a shorter distance from the river bank and was replaced by
Carex rariflora at a distance of 75 m from the river. Poa spp. and Eriophorum scheuchzeri were infrequent; Eriophorum started to flower at a distance of 90 m from the river (with 1-13 flowers per 4 m2 picture frame).
The grazing pressure, expressed by the proportion of leaves grazed, was
high close to the river, but decreased at a distance of 60 m from the river
(Fig. 29).
100
80
% of leaves grazed
Figure 29. The proportion of
leaves of monocot vegetation
grazed by moulting geese in
relation to the distance to the
river bank. Data are from the
same marsh as shown in Fig. 28
in the Draba Sibirica area in
2008.
60
40
20
0
0
15
30
45
60
75
90
105
120
135
Distance from river shore (m)
Biomass and productivity
The biomass clipping in five marsh plots in late July 2008 showed a standing crop of on average 98 g d.w. m-2 (s.d. = 36.0), comprised of 88.8%
Carex stans and 11.2% Poa spp. This compares to a cumulative aboveground biomass of on average 42 g d.w. m-2, measured in the same plot
late July 1984 (Fig. 9B in Madsen and Mortensen 1987). Because we only
based our 2008 biomass estimate on live plant material, the biomass
samples taken late July represent a conservative estimate of the cumulative above-ground biomass as estimated in 1984.
4.4
Modelling the number of moulting geese in the
extended Ørsted Dal area
The number of moulting geese in the whole Ørsted Dal replacement area
was estimated using a Generalized Linear Model. The model is based on
data from the entire Jameson Land, i.e. the number of moulting geese observed from the air and the potential foraging areas (chapter 3.5). The
original data on which the model is based and a prediction made from
the model with confidence bands of ± 1 standard error is shown on Fig.
30. As expected, the number of moulting geese observed in the 5x5 km
cells during the aerial survey is positively correlated with the size of the
potential foraging area within the cells, although much variation is left
unexplained by the model. The coastal cells have a higher intercept than
the inland cells which is certainly due to the presence of the coastal salt
marshes.
50
2500
Number of geese per grid cell
Figure 30. The number of moulting geese observed from the air
in each 5x5 km cell as a function
of the potential foraging area
inside the cell. Cells including
coastline were separated from
inland cells.
2000
1500
1000
500
Coastal cells
Inland cells
0
0
20
40
60
80
100
120
Potential foraging area (ha) per grid cell
The predicted number of geese in the extended Ørsted Dal area is shown
in Fig. 31. These 76 cells cover an area of 1900 km2, and the predicted total number of geese is 7043 with a 95% confidence interval of 6752 – 7347.
Given the problems of spatial autocorrelation and the tendency towards
non-normality of errors in the model residuals, this confidence interval
may be a bit too optimistic. Consequently, a very conservative confidence interval was calculated as the sum of the upper and lower limits of
the 95% confidence interval of the individual grid cell estimates. This results in a lower limit of 5060 and an upper limit of 9807.
Figure 31. The predicted number
of moulting geese in each 5x5 km
cell of the extended Ørsted Dal
area.
Predicted no of geese
n per 5x5 km cell
70 - 75.0
75.1 - 80.0
80.1 - 85.0
85.1 - 100.0
100.1 - 200.0
200.1 - 300.0
0
5
10 Km
51
Photo 7. Large flock of moulting
Pink-footed geese on a lake in
Gurreholm. One family of Pinkfooted goose is seen in front of
the flock to the right (Alyn Walsh).
4.5
Other bird species
During the field work the three groups observed other bird species than
the two most common goose species, the Pink-footed goose (chapter 4.1)
and the Barnacle goose (chapter 4.2). In this chapter we give a brief description of most of the other species observed (excluding passerines):
divers, swans, geese, ducks, waders, skuas, gulls and terns. Species like
waders, King eider and rock ptarmigan were observed too scant from
the air, so these bird species are described only from the four study areas
where ground surveys were performed. For each species we start with
observations from the air with reference to Figs. 32 and 33. This description is followed by observations from the ground in the four study areas
(Figs. 34-38).
Red-throated diver (Gavia stellata) is a common breeding bird in the area.
They nest in small ponds and lakes and feed often in nearby coastal waters. During the aerial survey 17 were observed, mainly in coastal waters
(Fig. 32). Three were seen at the coast of the Gurreholm area indicating
breeding pairs at ponds inland.
In the Gurreholm area 6 breeding pairs and 8 individuals were observed
(Fig. 34). The individual birds were often seen flying over or at the coast
and could be registered or unregistered breeding birds. In the Tyskit
Nunaat 2 breeding pairs were observed together with 11 individuals
(Fig. 34). In Ørsted Dal no divers were observed; in the Draba Sibirica
area, one nesting pair and a single individual were found (Fig. 37).
Whooper swan (Cygnus cygnus) is a relatively rare visitor to the area.
Breeding has not been recorded, but may be expected as swans seem to
have occurred more frequently in recent years. Seven birds were observed from the air (Fig. 32).
52
Figure 32. Divers, ducks, swans
observed on the aerial surveys in
Jameson Land 17 and 18 July
2008.
In Ørsted Dal a group of seven plus two birds were observed during 1725 July. The swans, which were all able to fly, were feeding in wet
marshes, often without connection to open water, and they were roosting
on the central lake (Fig. 36).
Lesser snow goose (Anser caerulescens caerulescens). A blue-phased individual was observed in a flock of Barnacle geese at the Draba Sibirica River on 25 July.
53
Figure 33. Skuas, gulls and terns
observed on the aerial surveys in
Jameson Land 17 and 18 July
2008.
Canada goose (Branta canadensis) is another relatively rare visitor not
breeding in the area. The aerial survey on 17 July observed two birds
among moulting Pink-footed geese (Fig. 32).
Northern pintail (Anas acuta). An adult female was observed in the Gurreholm area (Fig. 34).
Greater scaup (Aythya marila) was seen off Gurreholm on 20 July 2008. It
was an adult male in eclipse plumage. The bird was alone when observed, but joined later with a group of 6 long-tailed ducks. The species
is a rare vagrant to East Greenland (Boertmann 1994).
Common eider (Somateria mollissima) was seen in groups of 19 and 2
along the Gurreholm coast, and one group of 2 off Tyskit Nunaat. In Tyskit Nunaat one female with 6 ducklings were observed on 31 July (Fig.
34).
54
Figure 34. Breeding divers,
ducks and skuas and nonbreeding Sabine’s gulls in the
Gurreholm and Tyskit Nunaat
areas. A small dot represents a
breeding pair, a larger dot 2 or 3
breeding pairs. A blue square
represents a flock of 6-25 Sabine´s gulls.
Sabine’s gull
Northern pintail
Long-tailed duck
Red-throated diver
Common eider
King eider
Long-tailed skua
Arctic skua
0
1
2 Km
Figure 35. Breeding waders
observed in the Gurreholm and
Tyskit Nunaat areas. A small dot
represents one breeding pair, a
larger dot 2 or 3 breeding pairs.
Ruddy turnstone
Sanderling
Dunlin
Red knot
Common ringed plover
Whimbrel
Red phalarope
0
1
2 Km
55
King eider (Somateria spectabilis). In the Gurreholm area 11 breeding females were observed, including 2 females together with 3 ducklings. In
the Tyskit Nunaat area 2 breeding birds were seen and 4 individuals
along the coast (Fig. 34).
Long-tailed duck (Clangula hyemalis) was rather numerous during the
aerial surveys, both inland and along the coasts (Fig. 32). The flock seen
in coastal habitats probably represent post-breeding males, while the
birds seen in ponds and lakes inland most likely were breeding birds.
The density of inland birds was relatively high in the Gurreholm area,
which also was surveyed more thorough than other inland areas.
In the Gurreholm area a minimum of 6 possibly breeding females were
seen in inland lakes and a minimum of 3 breeding females in the Tyskit
Nunaat area (Fig. 34). Along the coast of both areas a total of 823 birds
were seen in flocks up to 250 birds. In the Ørsted Dal area, a flock of up
to 30 was observed on the central lake. In the Draba Sibirica area, one
pair was observed.
Rock ptarmigan (Lagopus muta). In the Tyskit Nunaat area 2-3 males were seen. In the Ørsted Dal area a female with 5 chicks were observed.
Common ringed plover (Charadrius hiaticula) were observed with 2 breeding pairs in the Gurreholm area and 1 pair in the Tyskit Nunaat area
(Fig. 35). In the Ørsted Dal, ringed plovers are common, and territorial
birds were observed (Fig. 36).
Eurasian golden plover (Pluvialis apricaria). A single adult bird was observed feeding in a marsh along a lake in the Draba Sibirica area on 26
July (Fig. 38).
Red knot (Calidris canutus). Two breeding birds were seen in the Gurreholm area including one adult bird with 3 pulli. One breeding bird was
observed in the Tyskit Nunaat area and 15 non-breeders, including a
flock of 10 birds on 28 July (Fig. 35). Three birds were observed in display flight in the Draba Sibirica area on 27 July (Fig. 38).
Sanderling (Calidris alba). Five breeding birds, including one with a flying juvenile, were observed in the Gurreholm area, while 2 breeding
birds were seen in the Tyskit Nunaat area (Fig. 35). A total of 66 nonbreeding birds were seen in the two areas, including one flock of 17 on
17 July and one flock of 25 on 31 July. An adult with a nearly fledged
young was observed in the Draba Sibirica area on 29 July (Fig. 38).
Dunlin (Calidris alpina). In the Gurreholm area 11 breeding birds were
seen, including one nest with 3 eggs and one pulli. One breeding bird
was observed in the Tyskit Nunaat area (Fig. 35). A total of 39 nonbreeders were seen in the two areas, mainly in small groups; one flock of
10 birds was seen on 25 July. Dunlin is a common breeding bird in Ørsted Dal, and territorial birds were observed in marshes and along
streams (Fig. 36). In the Draba Sibirica area few pairs were observed (Fig.
38).
56
Figure 36. Breeding Rock ptarmigan, waders and Long-tailed
skua and non-breeding Whooper
swans observed in the Ørsted
Dal area. A dot represents one
breeding pair. Blue squares
represent a flock of 2 and 7
Whooper swans, respectively.
Ruddy turnstone
Common ringed plover
Whooper swan
Rock ptarmigan
Long-tailed skua
Dunlin
0
1
2 Km
Figure 37. Breeding Redthroated diver, Sabine’s gull and
Long-tailed skua observed in the
Draba Sibirica area. A dot represents one breeding pair.
Red-throated diver
Long-tailed skua
Sabine’s gull
0
1
2 Km
57
Ruddy turnstone (Arenaria interpres). A total of 8 breeding pairs were
observed in the Gurreholm area, including 2 pairs each with 2 pulli. In
the Tyskit Nunaat area one breeding pair was seen (Fig. 35). In the Tyskit
Nunnat area 22 non-breeding birds were observed, including 10 juvenile
birds. Two territorial birds were observed in Ørsted Dal (Fig. 36), and
one young bird was observed in the Draba Sibirica area (Fig. 38).
Whimbrel (Numenius phaeopus) is breeding only in Jameson Land in
Greenland with 50-100 pairs. According to the Greenland Red-list it is
classified as “near threatened” (Boertmann 2007). Eight breeding pairs
were observed in the Gurreholm area and 3 pairs in the Tyskit nunaat
area (Fig. 35). A total of 16 overflying birds in groups of 4-6 birds were
seen in the two areas during 21-29 July. In late July 2007 13 observations
were made of Whimbrel in the Gurreholm area, but there was no information on number of individuals and possible pairs (Skov & Hansen
2007). Three territorial pairs were recorded in the Draba Sibirica area
(Fig. 38).
Red phalarope (Phalaropus fulicaria). One male held a territory in the
Gurreholm area, where he was seen during the entire study period 17-25
July (Fig. 35). In late July 2007 two single birds were observed in the
Gurreholm area (Skov & Hansen 2007).
Photo 8. Female Red phalarope.
Red-necked phalarope (Phalaropus lobatus). One male was observed in a
small pond not suitable for breeding in the Gurreholm area. A total of 6
individuals were observed on ponds in the Ørsted area; a single bird was
observed in the Draba Sibirica area.
Long-tailed skua (Stercorarius longicaudus) was observed frequently on
the aerial survey (Fig. 33). A single large flock (50 birds) indicates that
breeding birds had begun to assemble in flocks, due to scarcity of food
(lemmings). Many of the observation of single birds or pairs in inland areas probably represent birds still in their breeding territories.
58
Photo 9. Long-tailed skua defending the chick.
Nine breeding pairs, including 2 pairs each with 2 pulli and one pair
with one juvenile, were observed in the Gurreholm area. In the Tyskit
Nunaat area 6 pairs were seen (Fig. 34). In Gurreholm the largest flock of
non-breeding birds held 23 birds and in the Tyskit Nunaat area the largest flock had 9 birds. In Ørsted Dal, at least 4 territorial pairs were observed, including one young, and up to 20 birds were observed flocking
(Fig. 36). In Draba Sibirica, at least 3 territorial pairs were active (Fig. 37).
Arctic skuas (Stercorarius parasiticus) were seen in small numbers on Heden during the aerial survey (Fig. 33).
In both Gurreholm and Tyskit Nunaat areas 2 pairs were seen (Fig. 34).
Few single arctic skuas were seen in the two areas. In the Draba Sibirica
area, a total of 7 individuals were observed, with no signs of breeding activity.
Sabine’s gull (Larus sabini) is breeding in small colonies in the area. It is
classified as “near threatened” in the Greenland Red-list (Boertmann
2007). Several were seen on Heden during the aerial survey (Fig. 33).
In the Gurreholm area a flock of non-breeding birds were seen, and in
the well known breeding site at the mouth of Draba Sibirica Elv many
birds were also seen. A few birds were also seen at a lake in inland parts
of the Draba Sibirica Elv water shed. These were also breeding birds,
confirmed by the field team working here. Flocks of 20 and 25 birds were
seen in the Gurreholm area on 20 and 21 July, respectively (Fig. 34). These flocks included probably the same birds. In Gurreholm flocks of 5 and
10 were observed in July 2007, but no breeding birds were found (Skov &
Hansen 2007). In the Tyskit Nunaat area flocks of up to 8 birds were seen
(Fig. 34). There was no sign of breeding. Ground survey in the Draba Sibirica area revealed 3 breeding pairs, including a young, on a lake in the
interior (Fig. 37).
59
Photo 10. Sabine´s gull.
Arctic tern (Sterna paradisaea) is a common bird along the coasts. During
the aerial survey the breeding colonies at Fame Øer in Hurry Fjord and
on the island off Sydkap were confirmed (the large numbers shown in
Fig. 33). Small numbers were seen here and there representing feeding
birds, small colonies or single breeding pairs.
Figure 38. Breeding waders
observed in the Draba Sibirica
area. A dot represents one
breeding pair.
Ruddy turnstone
Sanderling
Dunlin
Red knot
Common ringed plover
Whimbrel
Eurasian golden plover
0
60
1
2 Km
Photo 11. Red knot.
A total of 71 Arctic terns were seen in the Gurreholm area with 17 birds
in the largest flock. In Tyskit Nunaat a total of 35 Arctic terns were seen
with the largest flock holding 10 birds. There were no signs of breeding
performance in the two areas. In the Draba Sibirica area a single bird was
observed.
61
5
Results, mammals
During the field work the three groups observed Muskox, Arctic fox and
Arctic hare. Muskox observations cover both the entire Jameson Land
(aerial surveys, Fig. 39) and the four study areas, while observations of
fox and hare are given only for the study areas (Figs. 40-42).
Figure 39. The distribution of
Muskoxen in Jameson Land
recorded on the aerial survey 17
and 18 July 2008.
Muskox (Ovibos moscatus). During the aerial survey 607 Muskoxen were
recorded. Their distribution is shown in Figure 39.
In the Gurreholm area only two bulls were seen and in the Tyskit Nunaat area a distant flock of six animals was observed (Fig. 40). Such few
animals agree with the observations during the aerial survey. In Ørsted
Dal, several groups of Muskoxen passed through the valley. Up to 78 individuals could be observed from one vantage point on the hill side in
the central valley (Fig. 41). In the Draba Sibirica area, Muskoxen were infrequent (3 groups observed of 2-5 individuals, Fig. 42).
62
Figure 40. The distribution of
Muskox, Arctic fox and their dens
in the Gurreholm and Tyskit
Nunaat areas. Two Muskoxen
were observed in the Gurreholm
area and six in Tyskit Nunaat.
One Arctic fox dot represents one
animal except for the den in
southwest Gurreholm where one
adult and 3 juvenile were seen.
Fox den
Arctic fox
Muskox
0
1
2 Km
Figure 41. The distribution of
Muskox, Arctic fox and Arctic
hare in the Ørsted Dal area.
Arctic fox
1-2
3-5
6 - 10
Arctic hare
1-2
3-5
6 - 10
Muskox
1-2
3-5
6 - 10
0
1
2 Km
63
Figure 42. The distribution of
Muskoxen and Arctic fox in the
Draba Sibirica area.
Arctic fox
1
Muskox
2
4
5
0
Photo 12. Muskox bull (Cornelia
Jaspers).
64
1
2 Km
Arctic fox (Alopex lagopus). In the Gurreholm area a total of 7 foxes were
seen, including a family of 1 adult and 3 juvenile in a fox den. Another
fox den was seen in the centre of the study area. In the Tyskit Nunaat
area 3 foxes were observed and no dens (Fig. 40). In Ørsted Dal, one pair
of foxes was active in the central part of the valley, but no den was found
(Fig. 41). In the Draba Sibirica River, a single individual was observed
(Fig. 42).
Photo 13. Arctic fox at the den
(Alyn Walsh).
Arctic hare (Lepus arcticus). Arctic hare was recorded only in the Ørsted
Dal area (Fig. 41) where one individual was observed.
Photo 14. Arctic hare.
65
6
Results, vegetation
Figure 43 shows an overview of Jameson Land with the ASTER and
Landsat-7 ETM+ satellite mosaic (combined from 15 and 17 July 2004)
draped on the map.
Figure 43. Coverage of satellite
images over Jameson Land.
Mosaic is composed of ASTER
and Landsat ETM+ images from
15 to 17 June 2004. The shown
image has band 7, 4 and 3 in R,
G, B, respectively.
The image is a false colour composite of the shortwave infrared, the infrared and the green band (7, 4 and 3) in the red, green and blue colour
channel, respectively. This enhances the contrast between vegetated and
bare surfaces shown in green and red colours, respectively. Jameson
Land is dominated by the high mountain ranges north and east of the
66
large west-sloping drainage area along the Hall Bredning. The main part
of the vegetation is located in the lower parts below 300 m.a.s.l.
The fen cover distribution in Jameson Land is shown in figure 44. The
vegetation type is clearly located in the lowland or in valleys and valley
slopes where melting snow can supply adequate water throughout the
growing season.
Especially the areas around the outlet of the Schuchert River and the Ørsted Dal have a high abundance of this type of vegetation.
Figure 44. Fen covered areas on
Jameson Land. Fens are shown
in green with a NDVI greyscale
image as background.
67
7
Discussion
7.1
Mining activities
The mining activities can be separated in a construction phase of 2-3
years, a production phase of 20-25 years and a closure period of 1-2
years.
The construction phase is planned not to start before mid 2010 at the earliest. During this phase the port, access road and a temporary runway
will be constructed inside the Ramsar site. It is expected that air traffic,
calling ships and truck driving are more intensive during this phase than
during production, but aircrafts are smaller due to shorter runway. Therefore, the disturbance of the environment can be expected to be somewhat higher during construction than during the production phase.
In the production phase the period July-October will be the most intensive period because ships can only enter the Scoresby Sund during this
open water window. It is estimated that one ship will arrive at the port
site every second week and that a maximum of 7 trucks per hour will arrive or leave the port site. Every second week a Hercules plane will land
and about 2 medium sized jet planes will land per week. The foot-print
of the roads, airstrip and port site including the container storage area is
about 1 km2.
The closure period is not dealt with in this report, but it will probably be
a very active and intense period with more disturbances during JulyOctober than that during the production phase.
Photo 15. A bulk carrier is ready
to be loaded with ore. The photo
is from the Nalunaq gold mine in
South Greenland.
68
7.2
Methods employed
Aerial goose census
Because the methodology used in July 2008 was as identical as possible
to that performed in the 1980s we believe that the results from the present survey and the past surveys are comparable. The aircraft, pilot, airspeed and altitude above ground, the one observer and the route were
the same during the two periods. The route in the 1980s was not fixed by
GPS coordinates but drawn on a map; therefore an exact repetition of the
route has not been possible, but the divergence is small due to the pilot
and the one observer being the same. In 1988 and 1989 photografic verification was added to the aerial surveys (Mosbech et al. 1989; Mosbech &
Glahder 1990). The numbers of observed Pink-footed geese and Barnacle
geese were adjusted according to photographed flocks to give true numbers. In general, flocks below 75 geese were overestimated by 13.6%
while flocks above 75 geese were underestimated by 3.2%. In 2008, no
photographs were taken, but if we use the above results on our flocks,
the total count of Pink-footed geese and Barnacle geese should be reduced by 2 and 3%, respectively. Due to this small difference we have
kept the observed numbers in this report.
Ground surveys
Ground surveys in the four study areas were performed in the same way
with special focus on moulting and breeding geese. The aim was to obtain full coverage of moulting geese and family flocks inside the study
areas. This was done by daily walking trips and observations from vantage points covering all major water bodies and wetland areas. Moulting
geese counted from the air and the ground in the four study areas differed, but not systematically. In Pink-footed geese the ground counted
geese differed from the aerial count in most cases between 70 and 113%
and with only 41% found in Ørsted Dal. In Barnacle geese the differences
varied in most cases between 60 and 128% with only 21% found in the
Draba Sibirica area. The big difference in Ørsted Dal could be due both
to the different census periods and to the possibility of the geese to move
along the main river and thereby out of the study area. In Draba Sibirica
many of the moulting Barnacle geese counted from the air were observed
along the coastline and these flocks could have moved out of the study
area when the ground team arrived about one week later.
The most marked difference between the two methods were that the
ground counts observed a total of 1741 Pink-footed family geese and 168
Barnacle goose family birds, while only 2 Barnacle goose family birds
were observed from the air. Family birds are not observed from the air
either because they blend into the moulting geese or they are invisible
while feeding on the tundra or in marsh areas.
The ground observations of other birds than geese from the four study
areas were focusing on breeding birds. In July, birds are either incubating or attending young birds, so what we observe at this time of the
breeding season is the successful breeding birds. Failed breeders constitute a major part of the breeding population and these birds have at this
time of the year gathered in flocks. The numbers of breeding birds in this
69
report represent therefore a minimum. A more comprehensive method
of counting breeding birds is given by Meltofte (2001).
7.3
Geese in Gurreholm and Jameson Land
The present study has especially focused on the populations of Pinkfooted and Barnacle goose that breed and moult in Jameson Land, because the Ramsar site “Heden” was designated mainly due to these populations. In the four study areas moulting geese and geese in family
flocks were counted on the ground, while moulting geese in the whole of
Jameson Land was censused from the air. In one of the study areas the
productivity in goose grazed marshes was assessed.
Goose populations in Jameson Land
During 1983-1989 the moulting geese from the two populations were
censused from the air in 1983, 1984, 1987-89 (Mosbech & Glahder 1990).
On average 6,071 (SD=634, n=5) Barnacle geese and 6,243 (SD=1012, n=5)
Pink-footed geese were counted. The global flyway populations of the
two species were in 1990 estimated to 35,000 Barnacle geese and 190,000
Pink-footed geese and in 2007 and 2008 to 70,500 Barnacle geese and
290,000 Pink-footed geese (Table 12, Mitchell 2008, Mitchell & Walsh
2008).
Table 12. Changes in the global flyway populations of Barnacle geese and Pink-footed
geese and in the number moulting geese in Jameson Land during 1983-2008 (Mitchell
2008, Mitchell & Walsh 2008, Mosbech & Glahder 1990, the present study in 2008).
Species
Barnacle goose
Pink-footed goose
Global flyway population
Jameson Land number
1990
2007/2008
1983-89
2008
35,000
70,500
6,071
16,603
190,000
290,000
6,243
19,068
It appears from Table 12 that that the global populations during the 20
years period have increased 1.5-2 times while the moulting geese from
the two populations in Jameson Land have tripled their numbers. The
proportion of Barnacle geese in Jameson Land of the total population has
increased over the period from 17 to 24% and for Pink-footed geese from
3 to 7%.
The increase of the two species in Jameson Land over the 20 years period
is not evenly distributed. In the extended Ørsted Dal (the replacement
area proposal, Fig. 45) both species have more or less doubled their
number (Barnacle goose from 2377 (average 1983-89) to 4106, and Pinkfooted goose from 960 to 1952). In the Gurreholm area, on the other
hand, the number of Barnacle geese has decreased to nearly the half
(from 430 to 284), while Pink-footed geese have increased their number
six fold (from an average of 634 to 3,971). In the Draba Sibirica area
numbers of the two species have not changed much in the 20 year period
(Barnacle goose 1980s-average of 1114 compared to 1122 in 2008, and
Pink-footed goose numbers have increased slightly from 2030 to 2483).
Especially in the Gurreholm area the expanding Pink-footed goose population has been able to find unexploited habitats. Consequently, about
70
25% of the entire Jameson Land population of moulting Pink-footed
geese are today using the Gurreholm area as a moulting ground.
Productivity in goose grazed marshes
Based on field studies during 1982-1984, it was concluded that habitat
carrying capacity of Jameson Land for moulting geese was close to being
reached (Madsen & Mortensen 1987). Over the subsequent 25 years the
moulting populations of the two goose species have tripled in Jameson
Land (Table 12). What are the possible explanations for this increase in
goose exploitation of Jameson Land?
The conclusion drawn in Madsen & Mortensen (1987) was based on: (1)
All suitable sites (a combination of a certain minimum width and surrounding marsh habitat) along coastlines, rivers and lakes were occupied. A linear correlation between the size of available habitat and the
number of geese, suggested that the geese had filled up the area (habitat
matching). (2) In the Carex subspathacea dominated marsh, the most
common moulting foraging habitat, the geese removed a significant part
of the net above-ground primary production. (3) By the end of the moulting period, the vegetation was grazed below 0.5 cm height, and the geese
abandoned the sites immediately after they regained flight
Two possible explanations are discussed here. The one is the effects of
climate change on the production of vegetation biomass, the other is the
ability of the geese to exploit habitats to a higher degree than anticipated.
The climate in East Greenland has been warming during recent decades.
In Zackenberg further north, the average July air temperature has increased by 0.28 oC per year during 1996-2005 (Forchhammer et al. 2008).
This may have had a positive influence on the productivity of the marsh
vegetation, possibly explaining the estimated more than doubling in biomass of the Carex stans - Poa spp. plots from 1984 to 2008. If this is generally the case, the habitat carrying capacity of Jameson Land for moulting
geese will have increased, resulting in higher densities of geese. On the
other hand, our ground truthing of the vegetation cover carried out in
the Draba Sibirica and in the Ørsted Dal areas reveal that in marshes
grazed by moulting geese, Carex subspathacea dominates, whereas in
marshes without grazing, Carex rariflora or Carex stans dominate, including flowering Eriophorum scheuchzeri. Therefore, we need biomass estimations from goose grazed marshes to be more confident before we put
forward general conclusions about an increase in primary productivity.
Even though it is likely that biomass production has increased in Jameson Land, intensive goose grazing might reduce biomass production.
Our results from the repeated vegetation transect in the Draba Sibirica
area showed a significant increase in dead vegetation, and decrease in
moss cover and cover of Carex subspathacea and Poa spp. This may suggest that moulting geese have a long-term effect on the vegetation composition and cover in the marshes subject to intensive grazing.
The increase in the two global flyway goose populations over the last decades has inevitably lead to an increased pressure on existing and new
moulting areas in East Greenland. On existing areas like in Jameson
Land the geese might exploit other plant species than the preferred Carex
71
subspathacea in order to overcome the moulting period. On the wintering
grounds, both species have, during a few decades, changed their feeding
habitats from natural wetlands like salt marshes to farmlands (Mitchell
at al. 1999; Ogilvie et al. 1999). It is likely that a change to other feeding
habitats can also happen on the summering grounds in the Arctic, even
though relevant data is lacking. We know that Pink-footed geese have
exploited new areas in East and North Greenland (Boertmann & Glahder
1999, own observations 2008, 2009) where large moulting flocks have
been observed on apparently very poor feeding habitats.
Breeding geese in Jameson Land
In the four ground study areas we have counted 1741 family group individuals of Pink-footed geese and 160 family individuals of Barnacle goose. This gives an approximate number of 430 successfully breeding pairs
of Pink-footed geese and 50 pairs of Barnacle geese in the four study areas. We do not have total numbers of breeding pairs of the two goose
species for the entire Jameson Land despite the aerial survey performed
in 2008. The reason is that from the air (1) gosling can be difficult to differentiate from older geese in dense flocks and (2) family flocks in general segregate spatially from non-breeding moulting geese on habitats
(small rivers and ponds, marshes without connection to open water,
tundra) where they are difficult to detect. During the 1980es the total Jameson Land breeding population of the Pink-footed goose was estimated to 300-500 pairs in 1982-84 (Madsen et al. 1985) and 600 in 1988
(Mosbech et al. 1989).
Photo 16. Breeding Pink-footed
goose on a mound in the Gurreholm area June 2009.
The breeding population of the Barnacle goose was in 1982-84 estimated
to 300-400 pairs. In the Ørsted Dal the breeding population was, on the
basis of juveniles, estimated at about 60 pairs in 1963 and 1974 (Hall &
Waddingham 1966; Ferns & Mudge 1976) and 201 nest in 9 colonies in
June 1984 (Cabot et al. 1984). In a breeding bird study in June 2009 in
Gurreholm and Ørsted Dal a total of c. 400 nests of Pink-footed goose
and c. 50 nests of Barnacle goose were counted (Glahder & Meltofte, in
prep.).
72
The possible moulting goose capacity in the extended Ørsted Dal area
The extended Ørsted Dal area has been suggested as a replacement area
to the possible loss of area in the Ramsar site “Heden”. Besides the number of moulting geese in this replacement area we were interested in
knowing if the area had extra potential capacity to absorb some or all of
the geese from the disturbed Gurreholm area. On the basis of modelling
we predicted 7043 (limits: 5060-9807) moulting geese in the extended Ørsted Dal area, which is not very different from the actually counted
number of 7814. This may indicate that there is little spare habitat for the
expelled geese here, although it is important to stress that too much confidence should not be placed on the model prediction. The model is based on the observed distribution and density of geese in Ørsted Dal.
However, if in the future the geese occupy new habitats in Ørsted Dal (of
lower quality as has been observed in other areas) or occur in higher
density on the existing moulting areas in Ørsted Dal, this potential for
increase in number is not included in the model.
7.4
Birds in the Gurreholm area
The Gurreholm study area is an area very rich in bird species and individuals compared to the other study areas. The number of breeding and
moulting Pink-footed geese (more than 800 individuals in families and c.
4,000 moulting birds) as well as other breeding birds (11 species with 64
successfully pairs) is high (Table 13). The area is not very important for
Barnacle geese where the highest number of breeding birds (123 individuals) was observed in Ørsted Dal and the highest number of moulting birds (c. 1100) was counted in the Draba Sibirica area.
The reason for this relative high biodiversity is the high number of different habitats such as many larger and smaller lakes and rivers, fens
and salt marshes. This mosaic of wet areas are dominating over the dryer
dwarf scrub heath. The Tyskit Nunaat area is dominated by dwarf scrub
heath with only few lakes, rivers and fens. The Ørsted Dal and Draba Sibirica areas are intermediate between the two areas described above.
Table 13. Breeding birds and moulting geese in the four study areas in Jameson Land.
Breeding birds are successfully pairs only. Figures in bold show the highest count in the
four areas.
Study area
Gurreholm
Tyskit
Nunaat
Ørsted Dal
Draba
Sibirica
Area (km2)
68.9
48.6
53.2
65.6
Pink-footed goose (moult)
3971
1090
408
2756
Pink-footed goose (family)
834
83
54
770
Barnacle goose (moult)
284
269
696
1122
Barnacle goose (family)
8
0
123
37
Other breeding birds (pair)
64
22
30
20
Other breeding birds (species)
11
10
5
9
Observations of specific interest in the Gurreholm area were 8 pairs of
Whimbrel, 1 pair of Red phalarope, 11 pairs of King eiders and 9 pairs of
Long-tailed skua; a total of 34 foraging Sabine´s gulls were also observed. In the Tyskit Nunaat area we observed 3 pairs of Whimbrel, 1
pair of King eider and 6 pairs of Long-tailed skua, plus a total of 15 non-
73
breeding Sabine´s gulls. In Ørsted Dal we registered 3 pairs of Longtailed skuas and 9 non-breeding Whooper swans. In the Draba Sibirica
area 3 pairs of Whimbrel, 3 pairs of Sabine´s gulls and 1 Eurasian golden
plover were observed.
Whimbrel and Sabine´s gull are in the Greenland Red-list classified as
“near threatened” (Boertmann 2007). Whimbrel breeds in Greenland only in the dwarf scrub heath north of Ittoqqortoormiit with the majority of
the 50-100 pairs breeding in the Ramsar site “Heden”. The Sabine´s gull
has in Greenland a population below 1000 adult birds breeding only on
about 20 sites. Probably the Greenland population is increasing.
It should be noted that July is not the optimal period to register breeding
birds. Therefore, only successfully breeding pairs are registered, while
breeding attempts are not included. The given figures of breeding pairs
therefore represent a minimum. In June 2009 breeding birds were registered in two areas in the Gurreholm area and two in the Ørsted Dal area
(Glahder & Meltofte, in prep.). In the Gurreholm area, numbers of breeding geese were not much higher in June 2009 than observed in July 2008,
whereas numbers of other breeding birds like waders, ducks and skuas
were about 5-7 times higher in June 2009. These results will be reported
in a separate report.
7.5
Possible effects of mining activities
The possible effects of the mining activities on geese and other bird species in the northwesterne part of the Ramsar site ”Heden” is evaluated in
proportion to two disturbance zones. It must be emphasized that our
knowledge of the mining activities is based on the EIA and feasibility
study from early 2008 with some additional material on airstrip and
roads from the mining company from late 2008. The most constant disturbance is thought to come from noise emitted by trucks and from activities in the harbour area. Due to the open and relatively flat terrain
and to the often strong fjord wind blowing eastward from around mid
day, it is expected that noise from these activities easily can propagate 35 km. Noise from fixed wing aircrafts using the south-north directed
runway about twice a week will propagate even further due to their elevation above ground. No helicopter traffic has been described; this type
of aircraft will have the strongest disturbance effect on the geese in the
area.
We have chosen two disturbance zones of 5 and 10 km from the mining
activities to discuss the effects of the activities on geese and other birds
in the area. These two zones are based on knowledge from reactions of
moulting geese to helicopter disturbances (Mosbech et al. 1989; Mosbech
& Glahder 1991). Two helicopter types were studied, a larger (Bell 212)
and a smaller (Bell 206) model. When a large helicopter approached
moulting Pink-footed geese they stayed alert at a distance of about 10
km, fled to water bodies at 7.5-9 km and formed a dense group on the
water at 7-8 km. A smaller helicopter caused the two latter reactions at
distances of 4-6 km.
During late June and early July the geese, still able to fly, are searching
for suitable moulting sites. If the geese are disturbed during this period
74
they will probably avoid moulting habitats that are inside the 10 km disturbance zone. Flocks of Pink-footed geese avoided a valley in Jameson
Land in late June after passage of large helicopters at distances of about 5
km. No geese moulted in the valley that year; the previous year 75 Pinkfooted geese had moulted here (Mosbech et al. 1989; Mosbech & Glahder
1991).
Regarding disturbance distances to breeding Pink-footed geese we have
few observations from a river valley and delta near the airstrip and camp
area Constable Pynt, Jameson Land (Mosbech et al. 1989; Mosbech &
Glahder 1990; de Korte 1988). The nearest nests were 1-2 km from Constable Pynt and this was also the case in 1975, 10 years before the airstrip
and camp were established. There was a slight but not significant increase in clutch size over a c. 15 km distance from Constable Pynt (de
Korte 1988). A similar disturbance effect was found in breeding Pinkfooted geese in Iceland (Sigurdsson 1974). Shortly after hatching the
families gather in family flocks and these can be disturbed at minimum
distances of 600 m and perhaps up to several km (Mosbech & Glahder
1990). In Svalbard, Pink-footed goose families showed an escape response at a distance of almost 2 km from approaching humans (Madsen
et al. 2009). According to these observations we have chosen a disturbance zone of 1.5 km to breeding geese and other breeding birds.
Photo 17. Moulting Pink-footed
geese fleeing from one walking
person in the Gurreholm area
(Alyn Walsh).
Worst case scenario is represented by the 10 km disturbance zone inside
which we expect that no geese will start moulting (Fig. 45). The more
moderate scenario anticipate the geese to initiate their moult in areas
situated more than 5 km from the disturbances, but inside the 5 km zone
no geese will moult. Breeding geese and other breeding birds are less
sensitive to disturbances, so we expect breeding birds only to avoid areas
closer than about 1.5 km from harbour, roads and runway. Appendix 1
shows in detail the affected birds in the Gurreholm area.
Disturbance zone of 10 km
Based on the aerial survey, c. 4,900 moulting Pink-footed geese and 530
moulting Barnacle geese will avoid the area. Moreover, about 150 Pink75
footed geese in family flocks and a minimum of 8 breeding pairs of 5
bird species will abandon the Gurreholm study area. New figures for
breeding birds will be available from the June 2009 field study in a larger
Gurreholm area (Glahder & Meltofte in prep.). It is likely that all lakes
used by foraging non-breeding Sabine´s gulls will be affected by the constructions.
Disturbance zone of 5 km
About 3,900 moulting Pink-footed geese and c. 400 moulting Barnacle
geese will abandon the area. The breeding birds will be affected as described above: Moreover, about 150 Pink-footed geese in family flocks
and a minimum of 8 breeding pairs of 5 bird species will abandon the
Gurreholm study area. New figures for breeding birds will be available
from the June 2009 field study in a larger Gurreholm area (Glahder in
prep.). It is likely that all lakes used by foraging non-breeding Sabine´s
gulls will be affected by the constructions.
7.6
The proposed replacement area in Ørsted Dal
The size and quality of a replacement area depends of both the chosen
disturbance zones and suitable areas in East Greenland. If the disturbance zone of 10 km is chosen then the replacement area should include
about 4,900 moulting Pink-footed geese, 530 moulting barnacle geese,
min. 150 Pink-footed geese in family flocks (equal to ca. 30 successfully
pairs; in Gurreholm we found 2.8 gosling/pair, n=76) and a minimum of
8 breeding pairs of other breeding birds. If the disturbance zone of 5 km
is chosen the replacement area should hold c. 3,900 moulting Pink-footed
geese, 400 moulting Barnacle geese and the same number of breeding
pairs as described for the 10 km disturbance zone.
Photo 18. The western part of
the proposed replacement area
Ørsted Dal late June 2009.
In the Jameson Land area the only suitable habitat outside the Ramsar site “Heden” would be the Ørsted Dal, Karstryggen (west of Schuchert
Dal) and a few valleys in the southeastern Jameson Land. Karst-ryggen is
close to the mining activities, partly included in the 10 km disturbance
76
zone and supports too few moulting Pink-footed geese. The southeastern
valleys are too small to support that many moulting geese and different
breeding bird species. That leaves Ørsted Dal as a possible Ramsar replacement area in this part of East Greenland.
To delimit the replacement area the starting point could be to evaluate if
the Ørsted Dal study area would be a sufficient replacement area. In the
Ørsted Dal study area (Table 13) we observed 400 moulting Pink-footed
geese and 700 Barnacle geese, family birds of 50 Pink-footed geese and
120 Barnacle geese and 30 breeding pairs of 5 other bird species. It is obvious that this area is not sufficient to replace especially moulting and
breeding Pink-footed geese. It is doubtful if the area is sufficient to replace the diversity of other breeding species. On the other hand, Barnacle
geese are fully replaced. It should be noted that more relevant data on
breeding bird species and densities in the Gurreholm and Ørsted Dal areas was provided June 2009 and the findings will be published in a separate rapport.
Figure 45. The Ramsar site
Heden inside which the field area
Gurreholm is shown as well as
the air strip (A) and the port area
(H). The three disturbance zones
of 1.5, 5 and 10 km from the
mining activities are shown in
black lines. The replacement
area, the extended Ørsted Dal
area, shown here is smaller than
the proposed optimal replacement area (refer to Appendix 2,
Fig. 51) due to two existing mineral licence areas.
dD
al
Schuch
ert
Da l
te
Ørs
Gurreholm
Scoresby Sund
Ramsar
area
Heden
Replacement area
Ramsar area
Gurreholm field area
Airstrip
Harbour
Disturbance zones
0
10
20 Km
Therefore, it is necessary to extend the Ørsted Dal area to that depicted
on Fig. 45. The replacement area shown on the figure is smaller than the
proposed optimal replacement area (refer to Appendix 2, Fig. 51) due to
two existing mineral licence areas. This area holds c. 3,000 moulting
Pink-footed geese which still is less than the about 4,000 Pink-footed geese expected to avoid the area inside the 5 km disturbance zone. In return,
the extended Ørsted Dal area supports c. 4,700 moulting Barnacle geese
giving protection under the Ramsar Convention to an extra 7% of the
Barnacle goose flyway population. This is of importance because the po-
77
pulation is still relatively small despite its rapid expansion. It is difficult
to judge if the replacement area can fully compensate the loss of breeding Pink-footed geese and other breeding birds. The southeastern part of
the area, Pingel Dal and Enhjørningens Dal, is suitable only to moulting
geese and not to most breeding birds because of snow and ice coverage
until late June (Photo 19). We tried to evaluate if the replacement area
had extra potential capacity to absorb some or all of the moulting geese
from the disturbed Gurreholm area. By model prediction we reached a
figure (between 5,060 and 9,807) close to what was observed during the
aerial survey (c. 7,700) and this may suggest that there is little spare habitat for the expelled geese.
At present, it is difficult to judge the impact of the mining activities on
the moulting and breeding birds in the northwestern part of the Ramsar
site “Heden”. Geese might not initiate moulting inside the 10 km disturbance zone, moulting and breeding birds might seep out of the area over
some years or the birds will habituate to the activities, especially if these
are predictable to the birds, so that the outskirts of the area will be reoccupied. It is possible, to a certain degree, to plan for and regulate activities in a way that will facilitate habituation e.g. by planning a fixed aircraft corridor and prevent traffic outside main facilities.
Photo 19. Southeastern part of
the extended Ørsted Dal replacement area on 26 June 2009.
The mouth of Pingel Dal is in the
center and that of Enhjørningen
Dal to the right.
Because of the uncertainties of impacts from mining activities, a monitoring program should be introduced when the mining activities are initiated. If the proposed replacement area can not compensate for the loss of
moulting and breeding birds in the Gurreholm area, yet another replacement area should be delimited. This must be elsewhere along the
East Greenland coast; our knowledge of such areas has been prepared by
extending the Jameson Land aerial survey in July 2009 to cover Hold
With Hope and Wollaston Forland situated 200-300 km north of Jameson
Land. Also, we plan to study breeding birds in the Hold With Hope area
in June 2010 similar to the breeding studies performed in Jameson Land
in June 2009.
78
8
Conclusions
In 2008, Quadra Mining Ltd. was granted an exploitation license that covered a large molybdenum ore body in East Greenland. Mining this ore
for a period of 20-25 years will involve constructions inside the Ramsar
site “Heden” of a port with a large container terminal, a gravel road
north along the coast and the Schuchert River and a c. 2,000 m long air
strip.
The possible impacted northwestern part of the Ramsar site, Gurreholm,
is a lush wetland area of the tundra rich in smaller and larger lakes and
rivers, fens and coastal salt marshes. About 25% of the Pink-footed geese
moulting in Jameson Land use this area that constitutes 5% of the Ramsar site (2524 km2). The diversity and density of breeding birds in the
area are relatively high; breeding Whimbrel and Sabine´s gull are classified as “near threatened” in the Greenland Red-list. Only about 3% of the
total moulting population of Barnacle geese in Jameson Land uses the
Gurreholm area.
The impact of the mining activities on the Gurreholm area is evaluated in
proportion to three disturbance zones of 1.5, 5 and 10 km; the most substantial impact will be that 3,900 to 4,900 moulting Pink-footed geese will
avoid the area. The proposed replacement area, the extended Ørsted Dal
area (Fig. 45), holds about 3,000 moulting Pink-footed geese corresponding to about 60-80% of geese expected to avoid the Gurreholm area.
Modelling indicates that the replacement area has no substantial spare
habitats for the expelled geese. The number of breeding Pink-footed
geese in the affected Gurreholm area is high and constitutes, to our present knowledge, about one third of the Jameson Land breeding population, perhaps even half of that. Also, the number of other breeding bird
species is relatively high in the area. We estimate that less than one fifth
of the breeding birds will avoid the area.
The replacement area will not fully compensate for the impacted number
of moulting Pink-footed geese, but more so for the moulting Barnacle
geese; we expect about 500 moulting Barnacle geese to avoid the Gurreholm area compared to the 4,700 moulting Barnacle geese counted in the
replacement area. Thereby, an extra 7% of the Barnacle goose flyway
population is giving protection under the Ramsar Convention. This is of
importance because the population is relatively small despite its rapid
expansion.
Because of the uncertainties to assess the impact of the mining activities
on the moulting and breeding birds in the northwestern part of the Ramsar site it is suggested to introduce a monitoring program when mining
starts. If the proposed replacement area can not compensate for the loss
of moulting and breeding birds in the Gurreholm area, yet another replacement area should be delimited elsewhere along the East Greenland
coast. The studies performed in 2009 and planned for in 2010 should
prepare for such a situation.
79
9
References
Bay, C. & Holt, S. 1986: Vegetationskortlægning af Jameson Land 19821986. Grønlands Fiskeri og Miljøundersøgelser, Grønlands Botaniske
Undersøgelser, 40 pp.
Boertmann, D. & Glahder, C. 1999: Grønlandske gåsebestande – en oversigt. Danmarks Miljøundersøgelser, Faglig rapport nr. 276, pp. 59.
Boertmann, D. 1994: An annotated checklist to the birds of Greenland.
Meddelelser om Grønland, Bioscience 38, 63 pp.
Boertmann, D. 2007: Grønlands Rødliste 2007. Grønlands Hjemmestyre,
Danmarks Miljøundersøgelser, Aarhus Universitet. Pp. 152.
Cabot, D., Nairn, R., Newton, S. & Viney, M. 1984: Biological Expedition
to Jameson Land, Greenland 1984. Expedition Report. Barnacle Books,
Dublin.
Cessford, F. 2007: Environmental and social assessment of the Malmbjerg
project. Vol. 1 – Main report. SRK Consulting, British Columbia, Canada.
Pp. 192.
de Korte, J. 1988: Observations of birds and mammals from the Hurry Inlet Area, Scoresby Sund, 1988. Circumpolar Journal 3 (4): 1-5.
Ferns, P. N. & Mudge, G. P. 1976: Abundance and breeding success of
birds in Ørsted Dal, East Greenland, 1974. Dansk Orn. Foren. Tidskr. 70:
21-33.
Forchhammer, M.C., Christensen, T.R., Hansen, B.U., Tamstorf, M.P.,
Schmidt, N.M., Høye, T.K., Nabe-Nielsen, J., Rasch, M., Meltofte, H., Elberling, B. & Post, E. 2008: Zackenberg in a Circumpolar context. – Advances in Ecological Research 40: 499-544.
Glahder, C. M., Boertmann, D., Madsen, J. & Bjerrum, M. 2008: Preliminary assessment of the impact of Quadra Mining on birdlife in the Heden Ramsar site and proposal for a replacement area. National Environmental Research Institute, Aarhus University. Pp. 34.
Glahder, C. M. & Walsh, A.J. 2006: Experimental disturbance of moulting
Greenland White-fronted Geese Anser albifrons flavirostris. P. 640 in Boere, G.C., Galbraith, C. A. & Stroud, D.A. (Eds.) Waterbirds around the
World. The Stationary Office, Edinburgh, UK.
Greenland Home Rule 1990: International wetlands in Greenland. Ramsar-sites. Greenland Home Rule, Department of Physical Planning and
Nature Management, Nuuk, Greenland.
Hall, A. B. & Waddingham, R. N. 1966: The breeding birds of Ørsted Dal,
East Greenland, 1963. Dansk Orn. Foren. Tidskr. 60: 186-197.
80
Laursen, K, Frikke, J & Kahlerth, J. 2008: Accuracy of ’total counts’ of waterbirds from aircraft in coastal waters. Wildlife Biology. 14: 165-175.
Madsen, J., Boertmann, D.M. & Mortensen, C.E. 1984: The significance of
Jameson Land, East Greenland, as a moulting and breeding area for geese: results of censuses 1982-1984. Dansk Orn. Foren. Tidsskr. 78: 121-131.
Madsen, J., Mortensen, C.E. & Boertmann, D.M. 1985: Gæssene i Jameson
Land, resultater af undersøgelser 1982-1984. Grønlands Fiskeri- og Miljøundersøgelser, Zoologisk Museum, København.
Madsen, J. & Mortensen, C. E. 1987: Habitat exploitation and interspecific competition of moulting geese in East Greenland. Ibis 129: 25-44.
Madsen, J., Tombre, I. & Eide, N. E. 2009: Effects of disturbance on geese
in Svalbard: implications for regulating increasing tourism. Polar Research 28 (3): 376-389.
Meltofte, H. 2001: Wader Population Censuses in the Arctic: Getting the
Timing Right. Arctic 54: 367-376.
Mitchell, C. Fox, A. D., Boyd, H., Sigfusson, A. & Boertmann, D. 1999:
Pink-footed goose Anser brachyrhynchus: Iceland/Greenland. Pp. 68-81.
In: Madsen, J., Cracknell, G. & Fox, A. D. (eds.). Goose populations of the
Western Palaearctic. A review of status and distribution. Wetlands International, The Netherlands. National Environmental Research Institute,
Denmark.
Mitchell C. 2008: The Icelandic-breeding Goose Census 2007. Goose
News, Wildfowl & Wetlands Trust, Slimbridge, UK, no. 7: 13-14.
Mitchell C. & Walsh, A. 2008: The rise and rise of Greenland Barnacle
Geese. Goose News, Wildfowl & Wetlands Trust, Slimbridge, UK, no. 7:
5.
Mortensen, C.E., Glahder, C. & Mosbech, A. 1988. Gåseundersøgelser i
Jameson Land 1987. Grønlands Miljøundersøgelser.
Mosbech, A. & Glahder, C. 1990: Gåseundersøgelser i Jameson Land 1989
og resultater af moniteringen af gæs i Jameson Land fra 1983 til 1989.
Grønlands Miljøundersøgelser, 50 pp.
Mosbech, A. & Glahder, C. 1991: Assessment of the impact of helicopter
disturbance on moulting Pink-footed geese Anser brachyrhynchus and
Barnacle geese Branta leucopsis in Jameson Land, Greenland. Ardea 79:
233-238.
Mosbech, A. & Hansen, B. U. 1994: Comparison of satellite imagery and
infrared aerial photography as vegetation mapping methods in an arctic
study area; Jameson Land, East Greenland. Polar Research 13, 139-152.
Mosbech, A., Clausen, P., Glahder, C. & Witting, L. 1989: Gæssene i Jameson Land 1988. Grønlands Miljøundersøgelser, 98 pp.
81
Ogilvie, M. A., Boertmann, D., Cabot, D., Merne, O, Percival, S. M. & Sigfusson, A. 1999: Barnacle Goose Branta leucopsis: Greenland. Pp. 246-256.
In: Madsen, J., Cracknell, G. & Fox, A. D. (eds.). Goose populations of the
Western Palaearctic. A review of status and distribution. Wetlands International, The Netherlands. National Environmental Research Institute,
Denmark.
Ohmura, A. & Reeh, N. 1991: New precipitation and accumulation maps
for Greenland. Journal of Glaciology, vol. 37, pp. 140-148.
Quadra Mining Ltd. 2008: Malmbjerg Project, Feasibility Study, Vol. 5,
Airstrip, Port and Access Road. Pp. 39.
Richter, R. 1997: Atmospheric and Topographic Correction: MODEL
ATCOR3 (Version 1.1, May1997), DLR-German Aerospace Center, Institute of Optoelectronics, Wessling, Germany.
Rouse, J. W., Haas, R. H., Schell, J. A. & Deering, D. W. 1973: Monitoring
vegetation systems in the Great Plains with ERTS. Third ERTS Symposium, NASA SP-351, vol. 1, pp. 309-317.
Sigurdsson, J. B. 1974: Studies on breeding biology of Pink-footed geese
(Anser brachyrhynchus). Skyrsla um rannsóknir I Thjórsarverum 1972.
Reykjavik, Island.
Skov, H. & Hansen, J. 2007: Monitoring of birds. Baseline studies –
Malmbjerg 2007. DHI, Denmark. Pp. 24.
Stendel, M., Christensen, J.H., Aoalgeirsdóttir, G., Kliem, N. & Drews, M.
2007: Regional Climate change for Greenland and surrounding seas. Part
1: Atmosphere and land surface. Danish Climate Centre Report 07-02.
Danish Meteorological Institute, Ministry of Transport and Energy, Copenhagen. Pp. 26.
Yilmaz, M.T. Hunt Jr., E.R. & Jackson, T.J. 2008: Remote sensing of vegetation water content from equivalent water thickness using satellite imagery. Remote Sensing of Environment vol. 112, pp. 2514–2522.
82
Appendix 1. The Gurreholm area in detail
Figure 46. The Ramsar site
Heden and the Gurreholm field
area, together with the airstrip
(A), the port site (H) and the two
disturbance zones of 5 and 10
km.
Ramsar area
Airstrip
Gurreholm field area
Harbour
Disturbance zones
0
5
10 Km
83
Figure 47. The distribution of
moulting Pink-footed geese inside the two field areas Gurreholm and Tyskit Nunaat (delineated by red line). The two disturbance zones of 5 and 10 km are
shown as well as the port site
(brown), the road along the coast
and the airstrip (yellow).
1 - 10
11 - 25
26 - 65
66 - 140
141 - 270
Harbour
Airstrip/roads
Disturbance zones
0
1
2 Km
Figure 48. The distribution of
family flocks of the Pink-footed
goose inside the two field areas
Gurreholm and Tyskit Nunaat
(delineated by red line). The
disturbance zone of 1.5 km is
shown as well as the port site
(brown), the road along the coast
and the airstrip (yellow).
1 - 10
11 - 20
21 - 32
33 - 45
46 - 65
Harbour
Airstrip/roads
Disturbance zones
0
84
1
2 Km
Figure 49. The distribution of
breeding waders inside the two
field areas Gurreholm and Tyskit
Nunaat (delineated by red line).
One dot represents a breeding
pair. The disturbance zone of 1.5
km is shown as well as the port
site (brown), the road along the
coast and the airstrip (yellow).
Harbour
Airstrip/roads
Disturbance zone
Ruddy turnstone
Sanderling
Dunlin
Red knot
Ringed plover
Whimbrel
Red phalarope
0
1
2 Km
Figure 50. The distribution of
breeding species of divers, ducks
and skuas inside the two field
areas Gurreholm and Tyskit
Nunaat (delineated by red line).
One dot represents a breeding
pair. Sabine’s gulls were nonbreeding birds in flocks of 6-25
birds. The disturbance zone of
1.5 km is shown as well as the
port site (brown), the road along
the coast and the airstrip (yellow).
Harbour
Airstrip
Disturbance zone
Sabine’s gull
Pin-tailed duck
Long-tailed duck
Red-throated diver
Common eider
King eider
Long-tailed skua
Arctic skua
0
1
2 Km
85
Appendix 2. The possible replacement area
in Ørsted Dal
Figure 51. The Ramsar site
Heden inside which the field area
Gurreholm is shown as well as
the air strip (A) and the port area
(H). The three disturbance zones
of 1.5, 5 and 10 km from the
mining activities are also shown
(black lines) and the replacement
area, the extended Ørsted Dal
area.
Schuch
ert
Da l
te
Ørs
Gurreholm
Scoresby Sund
Replacement area
Ramsar area
Gurreholm field area
Airstrip
Harbour
Disturbance zones
0
86
10
20 Km
Ramsar
area
Heden
dD
al
NERI
DMU
National Environmental Research Institute,
NERI, is a part of
Aarhus University.
NERI undertakes research,
monitoring and consultancy
within environment
and nature.
Further information:
National Environmental Research Institute
Danmarks Miljøundersøgelser
At NERI’s website www.neri.dk
you’ll find information regarding ongoing
research and development projects.
Furthermore the website contains a database
of publications including scientific articles, reports,
conference contributions etc. produced by
NERI staff members.
www.neri.dk
National Environmental Research Institute
Frederiksborgvej 399
PO Box 358
DK-4000 Roskilde
Denmark
Tel: +45 4630 1200
Fax: +45 4630 1114
Management
Department of Arctic Environment
Department of Atmospheric Environment (main address)
Department of Environmental Chemistry and Microbiology
Department of Marine Ecology (main address)
Department of Policy Analysis
National Environmental Research Institute
Vejlsøvej 25
PO Box 314
DK-8600 Silkeborg
Denmark
Tel: +45 8920 1400
Fax: +45 8920 1414
Department of Freshwater Ecology
Department of Marine Ecology
Department of Terrestrial Ecology
National Environmental Research Institute
Grenåvej 14, Kalø
DK-8410 Rønde
Denmark
Tel: +45 8920 1700
Fax: +45 8920 1514
Department of Policy Analysis
Department of Wildlife Ecology and Biodiversity
NERI Technical Reports
NERI’s website www.neri.dk contains a list of all published technical reports along with other
NERI publications. All recent reports can be downloaded in electronic format (pdf) without
charge. Some of the Danish reports include an English summary.
Nr./No.
2009
744
Danish Emission Inventories for Stationary Combustion Plants. Inventories until year 2007.
By Nielsen, M., Nielsen, O.-K., Plejdrup, M. & Hjelgaard, K. 216 pp.
742
Vildtbestande og jagttider i Danmark: Det biologiske grundlag for jagttidsrevisionen 2010.
Af Noer, H., Asferg, T., Clausen, P., Olesen, C.R., Bregnballe, T., Laursen, K., Kahlert, J.,
Teilmann, J., Christensen, T.K. & Haugaard, L. 288 s.
741
Biodiversity at the Ecosystem Level – Patterns and Processes.
Proceedings of the 2nd DanBIF conference, 26-27 April 2009.
By Balslev, H. & Skov, F. (eds.). 44 pp.
739
Emission Inventory for Fugitive Emissions in Denmark.
By Plejdrup, M.S., Nielsen, O.-K. & Nielsen, M. 47 pp.
738
Økologisk risikovurdering af genmodificerede planter i 2008.
Rapport over behandlede forsøgsudsætninger og markedsføringssager.
Af Kjellsson, G., Damgaard, C., Strandberg, M., Simonsen, V. & Krogh, P.H. 48 s.
737
Environmental monitoring at the former lead-zinc mine in Maarmorilik,
Northwest Greenland, in 2008.
By Schiedek, D., Asmund, G., Johansen, P., Rigét, F., Johansen, K., Strand J., & Mølvig, S. 70. pp.
736
Naturtilstand på terrestriske naturarealer – besigtigelser af § 3-arealer.
Af Fredshavn, J.R., Nygaard, B. & Ejrnæs, R. 46 s.
735
Naturtilstand i habitatområderne. Habitatdirektivets lysåbne naturtyper.
Af Fredshavn, J.R. & Ejrnæs, R. 76 s.
734
Undervandsplanter som indikatorer for vandkvalitet i søer.
Af Søndergaard, M., Johansson, L.S., Jørgensen, T.B. & Lauridsen, T.L. 48 s.
732
Lokal kvælstofdeposition og kvælstofindhold i lav.
Af Andersen, H.V., Nielsen, K.E., Degn, H.J., Geels, C., Løfstrøm, P., Damgaard, C. &
Christensen, J.H. 46 s.
731
Anvendelse af en feltbaseret metode til bedømmelse af biologisk vandløbskvalitet i danske
vandløb.
Af Skriver, J., Hansen, F.G., Jensen, P.B., Larsen, L.K. & Larsen, S.E. 42 s.
730
Metodeafprøvning af passive diffusionsopsamlere til koncentrationsbestemmelse af ammoniak.
Af Andersen, H.V., Løfstrøm, P., Moseholm, L., Ellerman, T. & Nielsen, K.E. 31 s.
729
Biologiske beskyttelsesområder i Nationalparkområdet, Nord- og Østgrønland.
Af Aastrup, P. & Boertmann, D. 90 s.
728
Danske plantesamfund i moser og enge – vegetation, økologi, sårbarhed og beskyttelse.
Af Nygaard, B., Ejrnæs, R., Baattrup-Pedersen, A. & Fredshavn, J.R. 144 s.
727
Overdrev, enge og moser.
Håndbog i naturtypernes karakteristik og udvikling samt forvaltningen af deres biodiversitet.
Af Ejrnæs, R., Nygaard, B. & Fredshavn, J.R. 76 s.
726
Klimatilpasning og den sociale faktor. 2009.
Af Petersen, L.K, Jensen, A. & Nielsen, S.S. 52 s.
724
Denmark ’s National Inventory Report 2009. Emission Inventories 1990-2007
– Submitted under the United Nations Framework Convention on Climate Change.
By Nielsen, O.-K., Lyck, E., Mikkelsen, M.H., Hoffmann, L., Gyldenkærne, S., Winther, M.,
Nielsen, M., Fauser, P., Thomsen, M., Plejdrup, M.S., Albrektsen, R., Hjelgaard, K., Vesterdal, L.,
Møller, I.S. & Baunbæk, L. 826 pp.
723
Guidelines to environmental impact assessment of seismic activities in Greenland waters.
By Boertmann, D., Tougaard, J., Johansen, K. & Mosbech, A. 38 pp.
722
Grønne kommuner. Indikatorer til belysning af kommunernes indsats på natur- og miljøområdet.
Af Levin, G., Münier, B., Fuglsang, M. & Frederiksen, P. 177 s.
721
Seabirds and marine mammals in Northeast Greenland.
Aerial surveys in spring and summer 2008.
By Boertmann, D., Olsen, K. & Nielsen, R.D. 50 pp.
720
The eastern Baffin Bay. A preliminary strategic environmental impact assessment of hydrocarbon
activities in the KANUMAS West area.
By Boertmann, D., Mosbech, A., Schiedek, D. & Johansen, K. (eds). 238 pp.
[Blank page]
BIOLOGICAL BASELINE STUDY
IN THE RAMSAR SITE ”HEDEN” AND THE
ENTIRE JAMESON LAND, EAST GREENLAND
In 2008, Quadra Mining Ltd. was granted an exploitation
license that covered a large molybdenum ore body in East
Greenland. Mining this ore will involve constructions inside
the Ramsar site “Heden” of a port, a road and an air strip. In
July 2008 NERI performed baseline studies on geese and
other birds in the area. The possible impacted north-western
part of the Ramsar site, Gurreholm, is lush wetland tundra.
About 25% of the Pink-footed geese moulting in Jameson
Land use this small part of the Ramsar site. The diversity
and density of breeding birds in the area are relatively high.
About 3% of the moulting Barnacle geese in Jameson Land
use this area. The impact of the mining activities on the
Gurreholm area is evaluated in proportion to disturbance
zones of 1.5, 5 and 10 km; the most substantial impact will
be that up to 4,900 moulting Pink-footed geese will avoid
the area. The proposed replacement area, the extended
Ørsted Dal area, holds 60-80% of the Pink-footed geese
expected to avoid the Gurreholm area. The number of
breeding Pink-footed geese in the affected area constitutes
about one third of the Jameson Land breeding population.
The replacement area will compensate for more moulting Barnacle geese than those impacted, thereby giving
protection under the Ramsar Convention to an extra 7% of
the flyway population. It is suggested to monitor the impact
when mining starts. If the proposed replacement area can
not compensate fully, yet another replacement area should
be delimited.
ISBN: 978-87-7073-158-4
ISSN: 1600-0048


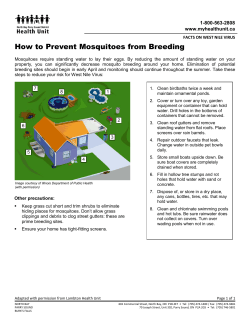


© Copyright 2026