
Specialty Distribution Industry Update October 2014 www.harriswilliams.com
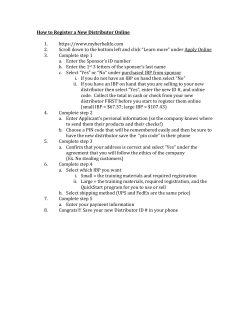
Specialty Distribution
Industry Update
October 2014
Member FINRA/SIPC
www.harriswilliams.com
Specialty Distribution Industry Update
October 2014
Recent Harris Williams & Co. Distribution Transactions
CONTENTS
WHAT WE’RE READING
HW&Co. Advises BHC on its Sale to Behrman Capital
Harris Williams & Co. recently advised on the sale of BECO Holding Company,
Inc. (“BHC”), a wholesale distributor of fire equipment and related parts and
portfolio company of Freeman Spogli & Co., to Behrman Capital. The transaction
closed on August 29, 2014.
Founded in 1941, BHC is the country’s leading business to business wholesale
distributor of fire equipment and related parts. With 18 locations across the United
States, BHC’s customers have access to an inventory of more than 6,200 items often
on a next day basis.
PUBLIC COMPARABLES
DISTRIBUTION TRENDS
M&A AND PUBLIC MARKET
TRENDS
a portfolio company of
ECONOMIC UPDATE
has been acquired by
HW&Co. Perspective:
“This is the second time we have had the pleasure of working with the BHC management team and we are
excited they are returning to partner with Behrman Capital. The team was able to accomplish a
tremendous amount during its partnership with Freeman Spogli and is well positioned as they move
forward with Behrman Capital,” said Bob Baltimore, managing director in Harris Williams & Co.’s
Specialty Distribution Group.
“The company has exhibited an impressive track record of growth, and we wish CEO Eric Smith and the
team continued success,” added David Kennedy, a director in the firm’s Specialty Distribution Group.
HW&Co. Advises Controlled Products Systems Group on its Sale to The Duchossois Group, Inc.
Harris Williams & Co. recently advised on the sale of Controlled Products Systems
Group, Inc. (“CPSG”), a national distributor of perimeter access control and gate
automation security systems, to The Duchossois Group, Inc. (TDG). CPSG is a
portfolio company of Najeti Ventures LLC and Pilgrim Capital Partners, LLC. The
transaction closed on September 2, 2014.
CPSG is the largest wholesale distributor of perimeter access control equipment in
the U.S., supplying equipment to authorized dealers from coast to coast. CPSG offers
the highest quality, most widely recognized brands of access control products
available on the market. With more than 10,000 SKUs and 31 locations to serve its
customers, CPSG is a one-stop shop for customers’ gate automation and perimeter
access control needs.
NOTABLE M&A ACTIVITY
a portfolio company of
GROUP OVERVIEW
Harris Williams & Co. is a leading
advisor to the specialty distribution
market. Our significant experience
covers a broad range of end
markets, industries, and business
models. This particular report
focuses on trends and metrics in the
following areas:
• Specialty Catalog and Direct
Marketing
• Branch-Based Distributors
• Route-Based Distributors
• Automotive and Heavy Duty
Aftermarket
• Building and Construction
Products
• Consumer & Food Service
• Industrial, MRO, and Safety
• Healthcare
• Technology
• Electrical and Communications
• Alcohol, Tobacco, and Fire Arms
CONTACTS
has been acquired by
HW&Co. Perspective:
“CPSG President Brian Huitt and his senior leadership team have done a remarkable job building the
platform and creating an industry leader in the security and access control space,” said Bob Baltimore,
managing director in Harris Williams & Co.’s Specialty Distribution Group. “The company has exhibited
an impressive track record of growth, and we wish Brian and the team continued success.”
“The company has done an exceptional job executing its strategic plan and is poised to capitalize on its
new partnership with TDG, which has a strong track record in the sector,” added David Kennedy, a
director in Harris Williams & Co.’s Specialty Distribution Group.
Bob Baltimore | Managing Director
[email protected]
+1 (804) 915-0129
Derek Lewis | Managing Director
[email protected]
+1 (804) 915-1118
Dave Kennedy | Director
[email protected]
+1 (804) 915-0105
Marshall Croft | Vice President
[email protected]
+1 (804) 915-0161
www.harriswilliams.com
1
Specialty Distribution Industry Update
October 2014
What We’re Reading
Distribution Industry is Growing, Adding Jobs
Driven by online sales and an improving economy, the U.S. distribution industry grew at a steady pace over the last
year. The 2014 NAW Institute/McGladrey Distribution Monitor reported that 74% of middle market distributors
reported an increase in sales over the past 12 months, with an average increase of 7.5%. Growth is forecasted to
continue to improve in the coming year, as 91% of distributors expect to increase sales at an average rate of 8.9%.
Dan Blaylock, 2014 Chairman of the Board of the National Association of Wholesaler-Distributors notes that, “at 5.5
million employees, wholesale distribution accounts for approximately one in every 20 jobs in the United States.
Because the industry is so important to the vitality of the U.S. economy, identifying and understanding the various
strategic management challengers that the distribution community faces is one of the great priorities of our time.
Business intelligence helps provide a roadmap to navigate to solutions.”
When asked about potential impediments to growth, distributors most often cited competition from other companies
(65%) as the biggest threat over the next 12 months. However, nearly as many distributors (63%) cited government
regulation as a limiting factor on growth, and 59% said they expected taxation to limit their growth over the next 12
months.
Please read the article here.
Distributors expect strong 2015 for IT channel
As 2014 comes to a close, next year is shaping up to be a strong year for the IT distribution channel, CEOs of major
distributors said in a series of recent interviews. While it is hard to predict the future in a rapidly changing industry,
CEO’s said that they are all expecting growth over the next year. Much of their predictions were based on strong 2014
numbers, with many of the distributors posting double-digit, year-over-year growth in their most recent secondquarter earnings reports.
Mike Baur, CEO of ScanSource, said that 2014 was a good year for the company, with the numbers showing earnings
jumping 135 percent over the year before to $81.8 million. Additionally Baur notes that, “we think the business is
healthy right now. I think there is momentum through 2015. I think now is the time to be doing some new things
because we have some growth.”
Please read the article here.
Benefits of Investing in a Green Supply Chain
Green supply chains bring major benefits, including better brand image and, more than ever, competitive advantage.
Many companies are still just reacting to sustainability, due partly to upfront costs and efforts. But, as many other
organizations have proven, there is a lot of pay-it-forward and hidden value to be realized.
Companies are increasingly realizing four key benefits as a result of investing in a green supply chain including: (i)
lower costs; (ii) better brand image; (iii) better business practices; and (iv) competitive advantage.
Please read the article here.
Why Technology is no Substitute for Talented Salespeople
Entrepreneurs who are doing the selling or the buying – whatever their role is in that moment – must understand the
human elements of selling. Technology will never fully replace a buyer’s need for assurance and trust as they make
important purchases.
Please read the article here.
2
Specialty Distribution
Public Comparables & Trading Valuations
Key Trading
Stats
Specialty Distribution Public Comparables
As of September 27, 2014
($ in millions, except
per share amounts)
TEV
Current
Price
$21,377
16,905
14,324
10,119
1,470
977
$503.59
151.89
88.68
26.86
41.46
26.18
Stock Performance
1-Month
1-Year
Change
Change
% of
LTM High
LTM Margins
EBITDA
Gross
TEV/EBITDA
2013 LTM 2014E
Revenue
Growth
3-Yr. CAGR
Automotive & Heavy Duty Aftermarket
AutoZone, Inc.
O'Reilly Automotive Inc.
Genuine Parts Company
LKQ Corp.
Dorman Products, Inc.
Uni-Select Inc.
Median
Mean
(6.3%)
(2.3%)
0.9%
(1.6%)
(5.6%)
(0.3%)
19.9%
20.8%
9.1%
(15.9%)
(17.9%)
10.0%
89.7%
95.8%
98.3%
78.3%
68.0%
91.5%
21.7%
19.8%
7.9%
12.1%
20.9%
4.9%
52.1%
50.9%
30.3%
40.1%
38.5%
29.8%
10.4x
12.4x
12.3x
14.0x
9.7x
11.3x
10.3x
11.8x
10.6x
12.3x
9.5x
9.0x
5.5%
7.3%
7.3%
28.1%
14.2%
5.6%
(1.9%)
(2.5%)
9.5%
4.3%
90.6%
86.9%
15.9%
14.6%
39.3%
40.3%
11.8x
11.7x
10.5x
10.6x
7.3%
11.3%
3.1%
2.5%
(7.5%)
(10.0%)
2.1%
(13.0%)
(3.0%)
(2.3%)
(6.7%)
(29.2%)
15.8%
(2.3%)
83.9%
94.5%
82.0%
63.0%
97.1%
62.6%
6.5%
6.1%
7.9%
5.9%
4.6%
4.2%
28.1%
27.9%
24.1%
22.9%
13.4%
22.3%
15.1x
12.0x
11.4x
11.8x
8.8x
14.3x
9.9x
10.2x
12.1x
11.5x
7.2x
13.4x
1.2%
(0.3%)
10.0%
9.8%
0.0%
30.4%
(2.7%)
(3.8%)
(2.6%)
(4.6%)
83.0%
80.5%
6.0%
5.9%
23.5%
23.1%
11.9x
12.2x
10.9x
10.7x
5.5%
8.5%
(0.0%)
(0.3%)
(6.9%)
9.1%
15.4%
(4.9%)
(8.2%)
65.9%
86.6%
80.1%
79.1%
98.1%
4.9%
3.9%
2.8%
1.3%
17.6%
16.6%
15.5%
6.9%
10.9x
13.8x
7.8x
12.8x
13.6x
12.3x
6.3x
9.7x
5.8%
14.5%
0.0%
11.5%
83.4%
86.0%
3.3%
3.2%
16.0%
14.2%
11.9x
11.3x
11.0x
10.5x
8.6%
7.9%
Building & Construction Products
CRH plc
Wolseley plc
Watsco Inc.
Beacon Roofing Supply, Inc.
Boise Cascade Company
Builders FirstSource, Inc.
$22,301
15,961
3,476
1,582
1,389
923
$23.55
54.63
86.42
26.09
30.93
5.88
Median
Mean
Consumer & Food Service
Sysco Corporation
United Natural Foods, Inc.
SpartanNash Company
Core-Mark Holding Company, Inc.
$24,760
3,646
1,356
1,286
$37.58
63.82
20.37
53.81
Median
Mean
(0.1%)
0.5%
5.3%
17.1%
Industrial, MRO & Safety
W.W. Grainger, Inc.
Fastenal Company
Airgas, Inc.
MSC Industrial Direct Co. Inc.
United Stationers Inc.
Applied Industrial Technologies, Inc.
DXP Enterprises, Inc.
$17,655
13,685
10,878
5,817
2,069
2,083
1,627
$251.28
45.56
112.56
88.45
39.09
47.45
77.84
Median
Mean
1.7%
(0.1%)
2.4%
(1.7%)
(5.3%)
(3.0%)
2.4%
(7.0%)
(9.2%)
6.8%
10.5%
(6.7%)
(8.0%)
1.9%
91.6%
87.3%
99.2%
91.5%
83.4%
88.8%
66.6%
15.6%
22.8%
18.4%
17.0%
5.0%
7.8%
9.4%
43.6%
51.0%
55.8%
46.2%
15.3%
27.9%
29.4%
11.7x
17.1x
11.5x
12.5x
8.0x
10.8x
12.6x
10.7x
15.7x
11.0x
11.8x
8.2x
9.9x
11.0x
8.3%
11.6%
5.4%
11.9%
1.2%
3.6%
23.9%
(0.1%)
(0.5%)
(6.7%)
(1.7%)
88.8%
86.9%
15.6%
13.7%
43.6%
38.5%
11.7x
12.0x
11.0x
11.2x
8.3%
9.4%
1.0%
4.1%
(1.5%)
(0.4%)
(2.6%)
(2.7%)
47.7%
42.1%
11.8%
(0.8%)
(3.6%)
(8.1%)
96.9%
99.5%
97.1%
91.1%
87.0%
75.4%
2.2%
2.6%
8.3%
9.4%
2.6%
4.5%
6.2%
5.7%
27.9%
28.6%
12.3%
12.6%
16.0x
11.3x
13.3x
11.4x
9.6x
14.8x
11.2x
10.0x
13.2x
11.1x
9.0x
14.3x
9.2%
(3.9%)
7.5%
7.5%
2.9%
22.9%
94.0%
91.2%
3.6%
5.0%
12.5%
15.5%
12.3x
12.7x
11.2x
11.5x
7.5%
7.7%
Healthcare
McKesson Corporation
Cardinal Health, Inc.
Henry Schein, Inc.
Patterson Companies, Inc.
Owens & Minor Inc.
MWI Veterinary Supply, Inc.
$53,699
26,719
11,097
4,551
2,285
1,878
Median
Mean
$193.85
75.94
117.44
40.45
33.52
142.10
(1.0%)
(0.3%)
5.5%
14.8%
3
Specialty Distribution
Public Comparables & Trading Valuations
Key Trading
Stats
Specialty Distribution Public Comparables
As of September 27, 2014
($ in millions, except
per share amounts)
TEV
Current
Price
Stock Performance
1-Month
1-Year
Change
Change
% of
LTM High
LTM Margins
EBITDA
Gross
TEV/EBITDA
2013 LTM 2014E
Revenue
Growth
3-Yr. CAGR
Technology
Arrow Electronics, Inc.
Avnet, Inc.
Ingram Micro Inc.
SYNNEX Corp.
Tech Data Corp.
ScanSource, Inc.
$7,765
7,186
4,926
3,182
2,337
854
$59.34
43.04
26.95
60.84
64.83
35.88
Median
Mean
(3.8%)
(3.1%)
(4.8%)
(11.4%)
(1.5%)
(6.9%)
23.2%
4.1%
19.4%
(3.4%)
30.1%
6.5%
93.0%
89.3%
87.0%
76.6%
90.9%
82.2%
4.5%
3.7%
1.6%
2.8%
1.1%
4.0%
13.3%
11.7%
5.9%
6.8%
5.1%
10.3%
7.8x
7.1x
7.1x
9.3x
7.8x
7.4x
7.6x
6.7x
6.3x
7.7x
5.9x
7.8x
2.1%
1.2%
6.5%
8.4%
2.3%
3.0%
3.2%
2.9%
8.5%
8.8%
7.6x
7.7x
7.2x
7.0x
2.7%
3.9%
1.2%
10.8%
2.8%
0.5%
(4.3%)
(5.3%)
12.9%
13.3%
88.2%
86.5%
2.9%
(2.1%)
1.0%
(3.9%)
(21.0%)
6.0%
(1.2%)
(5.0%)
77.2%
86.4%
75.1%
87.0%
5.5%
6.5%
6.3%
7.0%
24.6%
20.4%
23.1%
21.8%
10.1x
10.3x
9.1x
10.2x
7.7x
9.6x
8.7x
10.0x
(0.5%)
(0.5%)
(3.1%)
(5.3%)
81.8%
81.4%
6.4%
6.3%
22.4%
22.5%
10.1x
9.9x
9.1x
9.0x
Electrical & Communications
Rexel SA
WESCO International Inc.
Anixter International Inc.
Houston Wire & Cable Company
$9,045
5,147
3,586
281
Median
Mean
$20.36
81.89
87.00
12.60
2.0%
3.8%
Trailing Twelve Months Stock Price Performance
Stock Prices
As of September 27, 2014
60%
50%
Healthcare
S&P 500
40%
Automotive & Heavy Duty Aftermarket
30%
20%
Technology
Consumer & Food Service
Industrial, MRO, & Safety
10%
Building and Construction
0%
Electrical & Communications
(10%)
(20%)
Source: S&P Capital IQ.
4
Private Equity and Public Market Trends
Recent Private Equity Trends
• According to a recent Pitchbook report, a historically large number of PE
funds have closed over the past five quarters, as closing times have grown
swifter and more and more targets are being reached
PE Fundraising:
Where is the Money
Going?
• Globally, growth funds are lagging significantly behind their 2013 fundraising
pace, while buyout, energy and co-investment vehicles are set to surpass 2013
fundraising levels
• According to a recent article by Pitchbook, 87% of all PE funds reached their
targets in 1H 2014
LPs Targeting More
Small and MiddleMarket U.S. Funds
Distribution
Trends
• However, the proportion of smaller private equity funds continues to rise
• Through the first half of 2014, 37% of all fund closings have been for under
$100 million, compared to just 25% in 2008
TEV / EBITDA Multiples for Public Comparables1
20x
LTM EBITDA as of
September 27, 2014
TEV / EBITDA
15x
12x
14x
11x
14x
12x 13x
12x
10x
10x
12x 13x
11x
11x 12x
10x
11x
11x
11x
12x
13x
10x
10x
8x
8x
12x 12x
12x
8x
8x
5x
0x
May-14
Jun-14
Jul-14
Automotive & Heavy Duty Aftermarket
Consumer & Food Service
Healthcare
Electrical & Communications
Building & Construction Products
Industrial, MRO & Safety
Technology
Net Debt / EBITDA1
EBITDA Margins1
20%
2.9x
3x
1.6x
1.7x
1.6x
1.5x
1.3x
1x
0x
(1) Mean figures for each industry category.
Source: S&P Capital IQ.
0.7x
EBITDA Margin
Net Debt / EBITDA
4x
2x
Aug-14
15%
14.6%
13.7%
10%
6.3%
5.9%
5%
5.0%
3.0%
2.9%
0%
5
Specialty Distribution
Notable M&A Activity
Announced
M&A
Transactions
Date
Announced
Target
Description
Acquirer
Private Equity
Involvement
09/25/14
Belt Power, LLC
Distributor of conveyor belt parts
Shorehill Capital
P
(Buyer)
9/23/2014
Palm Beach Spring Company
Distributor of truck parts
TruckPro, LLC
P
(Buyer)
9/19/2014
ALLFAST Fastening Systems, Inc.
Distributor of bolts and tools
TriMas UK Aerospace Holdings Limited
9/18/2014
Industrial Distribution Group, Inc.
Distributor of MRO products
Sonepar North America, Inc.
P
(Seller)
9/16/2014
Cook and Boardman, Inc.
Distributor of construction supplies
Triangle Capital Corporation; Ridgemont
Equity Partners; Ridgemont Equity
P
(Both)
9/15/2014
Area Wholesale Tire Co Inc., Texas Assets
Distributor of ties
K&M Tire, Inc.
9/11/2014
SILVER CROSS
Distributor of healthcare supplies
Savaria Home Access Inc.
9/11/2014
Winona Feed and Grain, Inc.
Distributor of farm equipment
The Scoular Company
9/10/2014
MEDCO and G2S Equipment de Fabrication et d'Entretien
ULC
Distributor of office products
United Stationers Supply Company
9/9/2014
Western Extralite Company
Distributor of communication products
Border States Industries, Inc.
9/8/2014
Abrasive Products & Equipment, LLC
Distributor of air blast equipment
Ridgemont Equity Partners; Ridgemont
Equity Partners I, L.P.
P
(Both)
9/8/2014
Clarion Medical Technologies Inc.
Distributor of hospital supplies
ALPHAEON Corporation
9/2/2014
Controlled Products Systems Group, Inc.
Distributor of perimeter access equipment
The Chamberlain Group, Inc.
P
(Both)
9/1/2014
Interamerican Motor Corporation
Distributor of auto parts
AutoZone, Inc.
8/31/2014
VJ Stanley, Inc.
Distributor of HVAC equipment
Stritt & Priebe Incorporated
8/29/2014
Brooks Equipment Company, Inc.
Distributor of safety equipment
Behrman Capital
P
(Both)
8/25/2014
Berlin Packaging, LLC
Distributor of packaging materials
Oak Hill Capital Partners
P
(Both)
8/21/2014
Great Lakes Industrial Shoe Co
Distributor of safety equipment
Michigan Industrial Shoe Company
8/18/2014
Quietside Corporation
Distributor of HVAC equipment
Samsung Electronics America, Inc.
8/18/2014
Best Uniforms, Inc.
Distributor of uniforms
Galls, LLC
P
(Buyer)
8/15/2014
Duncan Systems, Inc.
Distributor of RV parts
Lippert Components, Inc.
P
(Seller)
8/14/2014
All-Fast, Inc.
Distributor of office tools
GRABBER Construction Products, Inc.
8/13/2014
Henrob Ltd.
Distributor of riveting equipment
Atlas Copco North America LLC; Atlas
Copco UK Holdings Ltd.
P
(Buyer)
8/13/2014
Air Tool Service Company
Distributor of motors and tools
Hy-Tech Machine, Inc.
8/13/2014
Barnsco, Inc.
Distributor of construction products
Kodiak Building Partners
8/12/2014
Piccirillo LTD, McAllen Texas Used Auto Parts Businesses
Distributor of auto parts
Pull-A-Part, LLC
8/12/2014
Phoenix Fulfillment Group, LLC
Distributor of art products
Auri, Inc.
Source: Capital IQ, Modern Distribution Management, Industrial Distribution, NAW, and TEDMagazine.
Economic Update
A Snapshot
of Key
Economic
Indicators
PMI Index1
ISM New Orders Index2
59.0
66.7
75
62
70
65
56
60
55
50
50
45
44
40
38
35
30
32
25
(1) A PMI Index figure greater than 50 indicates expansion.
(2) An ISM Index figure greater than 50 indicates expansion.
Industry Production Index3
75
U.S. Manufacturing Capacity Utilization4
64.5
100%
70
65
77.2%
90%
60
80%
55
50
70%
45
40
60%
35
30
50%
25
(3) A Production Index figure greater than 50 indicates expansion.
(4) Manufacturing Capacity Utilization for August 2014. September release on
October 16.
Durable Goods New Orders7
Manufacturing Inventories & Backlog5,6
($ in billions)
70
52.5
60
$350
$300
50
$250
40
$200
52.0
$245.4
30
$150
20
Aug-09
Aug-10
Aug-11
Inventories
Aug-12
Aug-13
Aug-14
$100
Backlog of Orders
(5) A Manufacturing Inventory Index figure greater than 50 indicates expansion.
(6) A Backlog Index figure greater than 50 indicates expansion.
(7) Durable Goods New Orders for August 2014. September release on October 28.
7
Specialty Distribution
Two International Place
24th Floor
Boston, MA 02110
USA
Phone: +1 (617) 482-7501
Fax: +1 (617) 482-7503
Sources:
• Industrial Distribution
a portfolio company of
63 Brook St
London, W1K 4HS
United Kingdom
Phone: +44 (0) 20 7518 8900
Fax: +44 (0) 20 7526 2187
222 South Ninth Street
Suite 3350
Minneapolis, MN 55402
USA
Phone: +1 (612) 359-2700
Fax: +1 (612) 359-2701
1600 Market Street
21st Floor
Philadelphia, PA 19103
USA
Phone: +1 (267) 675-5900
Fax: +1 (267) 675-5901
1001 Haxall Point
9th Floor
Richmond, VA 23219
USA
Phone: +1 (804) 648-0072
Fax: +1 (804) 648-0073
575 Market Street
31st Floor
San Francisco, CA 94105
USA
Phone: +1 (415) 288-4260
Fax: +1 (415) 288-4269
a portfolio company of
has been acquired by
has been acquired by
has been acquired by
• PitchBook
• PNC Economic Outlook
• S&P Capital IQ
• Thomson Financial – SDC Database
Bockenheimer Landstrasse
33-35
60325 Frankfurt am Main
Germany
Phone: +49 069 3650638 00
Fax: +49 069 3650638 01
a portfolio company of
• The Electrical Distributor Magazine
• The Wall Street Journal
1900 East 9th Street
20th Floor
Cleveland, OH 44114
USA
Phone: +1 (216) 689-2400
Fax: +1 (216) 689-2401
Select HW&Co. Distribution Transactions
• Federal Reserve
a portfolio company of
a portfolio company of
has been acquired by
has been acquired by
has been recapitalized by
• United States Census Bureau
• NAW Smartbrief
Harris Williams & Co. (www.harriswilliams.com) is a preeminent middle market investment bank focused on the advisory needs
of clients worldwide. The firm has deep industry knowledge, global transaction expertise, and an unwavering commitment to
excellence. Harris Williams & Co. provides sell-side and acquisition advisory, restructuring advisory, board advisory, private
placements, and capital markets advisory services.
Investment banking services are provided by Harris Williams LLC, a registered broker-dealer and member of FINRA and SIPC,
and Harris Williams & Co. Ltd, which is authorised and regulated by the Financial Conduct Authority. Harris Williams & Co. is a
trade name under which Harris Williams LLC and Harris Williams & Co. Ltd conduct business.
THIS REPORT MAY CONTAIN REFERENCES TO REGISTERED TRADEMARKS, SERVICE MARKS AND
COPYRIGHTS OWNED BY THIRD-PARTY INFORMATION PROVIDERS. NONE OF THE THIRD-PARTY
INFORMATION PROVIDERS IS ENDORSING THE OFFERING OF, AND SHALL NOT IN ANY WAY BE DEEMED AN
ISSUER OR UNDERWRITER OF, THE SECURITIES, FINANCIAL INSTRUMENTS OR OTHER INVESTMENTS
DISCUSSED IN THIS REPORT, AND SHALL NOT HAVE ANY LIABILITY OR RESPONSIBILITY FOR ANY
STATEMENTS MADE IN THE REPORT OR FOR ANY FINANCIAL STATEMENTS, FINANCIAL PROJECTIONS OR
OTHER FINANCIAL INFORMATION CONTAINED OR ATTACHED AS AN EXHIBIT TO THE REPORT. FOR MORE
INFORMATION ABOUT THE MATERIALS PROVIDED BY SUCH THIRD PARTIES, PLEASE CONTACT US AT +1
(804) 648-0072.
The information and views contained in this report were prepared by Harris Williams & Co. (“Harris Williams”). It is not a
research report, as such term is defined by applicable law and regulations, and is provided for informational purposes only. It is
not to be construed as an offer to buy or sell or a solicitation of an offer to buy or sell any financial instruments or to participate in
any particular trading strategy. The information contained herein is believed by Harris Williams to be reliable, but Harris
Williams makes no representation as to the accuracy or completeness of such information. Harris Williams and/or its affiliates
may be market makers or specialists in, act as advisers or lenders to, have positions in and effect transactions in securities of
companies mentioned herein and also may provide, may have provided, or may seek to provide investment banking services for
those companies. In addition, Harris Williams and/or its affiliates or their respective officers, directors and employees may hold
long or short positions in the securities, options thereon or other related financial products of companies discussed herein.
Opinions, estimates and projections in this report constitute Harris Williams’ judgment and are subject to change without notice.
The financial instruments discussed in this report may not be suitable for all investors, and investors must make their own
investment decisions using their own independent advisors as they believe necessary and based upon their specific financial
situations and investment objectives. Also, past performance is not necessarily indicative of future results. No part of this material
may be copied or duplicated in any form or by any means, or redistributed, without Harris Williams’ prior written consent.
Copyright© 2014 Harris Williams & Co., all rights reserved.
www.harriswilliams.com
8


© Copyright 2026