
For personal use only 2014 Annual Report
2014 Annual Report
For personal use only
For personal use only
Contents
Corporate Directory
Chairman’s Review
Operating and Financial Review
Directors’ Report
1
2-3
4-16
17-28
Auditors Independence Declaration
29
Consolidated Income Statement
30
Consolidated Statement of Profit or Loss
and Other Comprehensive Income
31
Consolidated Statement of Financial Position
32
Consolidated Statement of Changes in Equity
33
Statement of Cash Flows 34
Notes to the Financial Statements Directors’ Declaration
35-75
76
Independent Audit Report
77-78
Corporate Governance Statement
79-81
Additional Shareholder Information
82-84
For personal use only
Corporate Directory
Directors
Share Registry
PJ Leonhardt (Chairman)
Link Market Services Limited
Level 4
152 St Georges Terrace
Perth, WA 6000 Australia
Investor Enquiries: 1300 554 474 (within Australia)
Investor Enquiries: +61 2 8280 7111
(outside Australia) Facsimile:
+61 2 9287 0303
AC Cook (Managing Director)
EP Jacobson (Non-Executive Director)
WA Foster (Non-Executive Director)
NC Fearis (Non-Executive Director)
(Retired 31 December 2013)
Company Secretary
T Naude
Auditors
Crowe Horwath Perth
Bankers Stock Exchange Listing
Carnarvon Petroleum Limited’s shares are quoted
on the Australian Securities Exchange.
ASX Code:
CVN - ordinary shares
CVNO - options
Australia and New Zealand Banking Group Limited
National Australia Bank Limited
HSBC
Registered Office 2nd Floor
76 Kings Park Road
West Perth WA 6005
Telephone:
+61 8 9321 2665
Facsimile:
+61 8 9321 8867
Email:[email protected]
Website:www.carnarvon.com.au
Carnarvon Petroleum Limited
1
Chairman’s Review
For personal use only
As your Chairman it gives me pleasure
to introduce the 2014 Annual Report for
Carnarvon Petroleum.
During the financial year we have focused on
opportunities in Australia, particularly those
offering shareholders a strong growth oriented
investment. This is a transition from the previous
focus on production and diversified exploration in
Australia and South East Asia. The rationale for
the transition was to concentrate the Company’s
resources on regions in which we have excellent
data, experience and are able to offer compelling
opportunities for major organisations to partner
with Carnarvon and invest their capital and
operational expertise. In determining the areas
in which we would apply our expertise the Board
felt the North West Shelf of Western Australia
offered a strong balance of proven hydrocarbons
in material volumes, supported by quality data
and fiscal terms that have the potential to result
in significant value being generated if discovered
from our exploration efforts.
On reflecting on our progress in 2014, I’m delighted
to report the commencement of the Phoenix
South-1 well in Western Australia during the year
and the subsequent discovery of oil announced on
18 August 2014. Our investment in the surrounding
area now allows us to progress relatively quickly
with a second well having been farmed out and
new 3D seismic having been already acquired
and processed.
It is also pleasing that we have secured new
additions to the exploration portfolio during the
year in the heart of the Carnarvon Basin in Western
Australia. Extensive regional work exploring new
play concepts has already been undertaken and
the new blocks are now being worked on by
Carnarvon’s technical team in preparation for
exploration activities with the introduction of
new partners. It is our intention to replicate the
Phoenix model which enabled us to attract a world
class operator with the financial and operational
resources to drill exciting exploration wells.
Other notable achievements during the year
included the material increase in oil production
flow rates in Thailand and the sale of half of the
Company’s 40% interest in those assets for a
material premium to the share price at the time.
The monetisation of a portion of the assets placed
the Company in a secure cash position leading
into the drilling of the Phoenix South-1 well with
appropriate resources for drilling contingencies,
the next phase of progressing the Phoenix area and
our new exploration initiatives.
The last two or three years have been challenging
with pressures from internal operations and
external market conditions requiring a concerted
focus and effort from the Board and management.
However, I’m very pleased with the outcomes and
the sound business positioning and strategic focus
we have today.
I’m delighted to report the commencement of the
Phoenix South-1 well in Western Australia during
the year and the subsequent discovery of oil
2
2014 Annual Report
For personal use only
Chairman’s Review
We have also been building the Company’s
technical capabilities by attracting people with the
skills and experience which are relevant to our
focus on the North West Shelf in Western Australia.
We have also been building the Company’s
technical capabilities by attracting people with
the skills and experience which are relevant to our
focus on the North West Shelf in Western Australia.
At the same time we have been encouraging staff
to increase their shareholding in the Company by
offering to match shares bought on market with
a loan to acquire a share under the Company’s
Employee Share Plan (“ESP”). The Company’s ESP
has been in existence since 1997 and is approved
every three years by shareholders. In the opinion
of the Board it is, on balance, a strong plan that
aligns staff and shareholder interests, in addition
to attracting and retaining staff. The Board
continually monitors alternative schemes such as
option schemes and performance right schemes
but is of the view that a share price growth ESP
such as Carnarvon’s most effectively aligns the
holder’s interests with those
of shareholders.
While on the matter of staff remuneration, and
appreciating the sensitivity of this matter in
recent times, I note that the Board agreed this
year to provide bonuses to staff. The basis for
such included personal performance coupled
with the delivery of key milestones such as the
spudding of the Phoenix South-1 well, the securing
of new exploration acreage, materially increasing
oil production in Thailand and the sale of half of
Carnarvon’s interest in its Thailand production
assets for a premium to the Company’s
market value.
Carnarvon Petroleum Limited
After 14 years on the Board, Mr Neil Fearis
retired in December 2013 and I thank him for his
unwavering support and contribution during his
tenure and since his retirement. I’d like to take
this opportunity to thank my fellow members
of the Board for their valuable counsel and the
management team and staff for their resolve in
challenging circumstances and their contribution
to turning the Company into a strong operation
with an exciting future.
Of course my thanks to our shareholders for their
support without which we would not be able to
develop and grow the business. In conclusion,
I can assure shareholders that there is a very
committed team at Carnarvon who are all looking
forward with great enthusiasm to the next year
and the unveiling of the forward plan for the
greater Phoenix area.
Peter Leonhardt
Chairman
3
For personal use only
Operating and Financial Review
4
Overview of Operations
During what has been a transformational financial year for
Carnarvon, several key milestones were achieved, including:
> Spudding of the Phoenix South-1 well in
WA-435-P in Western Australia;
> Increasing carried well cost caps from US$50 million to US$70
million per well (gross) for the Phoenix South-1 well and the
contingent Roc well in the adjoining permit;
> Securing new exploration acreage on the North West Shelf
(“Cerberus Project”);
> Materially increasing oil production in Thailand to approximately
4,000 bopd (gross) by applying new technical knowledge;
> Divesting half of the Company’s Thai oil production asset for
US$33 million in cash plus a receivable of up to US$32 million;
> Strengthening the financial position of the Company in preparation
for drilling success in the North West Shelf (Phoenix South-1 well)
through the above divestment and a $3.1 million entitlement offer
with a free listed option presented only to existing shareholders;
and
> Continuing drilling operations in Thailand wherein Carnarvon holds
a 20% interest in this active cash generative asset.
2014 Annual Report
For personal use only
At the time of writing, the Company is in a
strong position with:
> The Phoenix South-1 well in Western Australia discovering light oil
and proving the concept envisaged by the Carnarvon team when the
acreage was secured in 2008 (“Phoenix Project”);
> A follow up well to Phoenix South-1, in the Roc structure, is funded by
Apache and JX Nippon with the partners electing to drill the well on
18 August 2014 (“Phoenix Project”);
> New Carnarvon Basin acreage in Western Australia was secured
during the year and has the potential to replicate the Phoenix farmout model (“Cerberus Project”);
> Thailand oil production remains steady at around 4,000 bopd (gross)
with Carnarvon holding a 20% interest with a look through value
based on the 2014 sale of up to US$65 million; and
> Financial resources are strong with cash of around $50 million, no
debt, minimal commitments and receivables of US$32 million due
from future oil sales revenue of the acquirer of half of Carnarvon’s
interest in 2014.
Carnarvon Petroleum Limited
5
Operating and Financial Review
Australian Operations
Phoenix Project
For personal use only
In 2008 Carnarvon secured exploration acreage
offshore Western Australia comprising four
exploration permits (WA-435-P, WA-436-P, WA437-P and WA-438-P) covering approximately
20,000km2. These permits are situated in the
north-western region of the Bedout Sub-basin
within the greater Roebuck Basin, offshore
Western Australia. The permits lie between the
prolific Carnarvon Basin hydrocarbon province
to the southwest and the Browse Basin to
the northeast. The town of Port Hedland lies
approximately 150 kilometres to the south of
the permits and Broome lies 250 kilometres to
the northeast.
The Joint Venture embarked on an extensive
geological study, acquiring 1,100 km2 of multiclient 3D seismic and another 407 kilometres of
2D seismic data through to mid 2012. The newly
acquired 3D covered two previous wells in WA435-P, Phoenix-1 and Phoenix-2, discovering gas
and other evidence of hydrocarbons while drilling.
A study of the newly acquired 3D data confirmed
two significant prospects, Phoenix South within
WA-435-P; and Roc in WA-437-P.
Carnarvon and its partner, Finder Exploration, were
then successful in attracting new partners to fund
their share of well costs in drilling exploratory
wells searching for the extension of the discovered
hydrocarbons.
The Phoenix South-1 well commenced drilling in
the WA-435-P permit on 25 May 2014.
The Phoenix South-1 well was planned to drill to a
depth of approximately 4,500 metres to explore for
gas and condensate on trend with that discovered
in the Phoenix-1 well some 13 kilometres away.
On 18 August 2014 Carnarvon announced the
discovery of light oil with some associated gas
in the Phoenix South-1 well. These preliminary
results are very encouraging and while they bode
well for the future, this project is at a preliminary
stage of exploration.
Figure 1: Carnarvon Interests as at 30 June 2014 in Australia
6
2014 Annual Report
For personal use only
Cerberus Project
During the year Carnarvon secured exploration
acreage offshore Western Australia comprising
three permits (EP-490, TP/27 and EP-491) covering
approximately 3,200km2 in the heart of the
Carnarvon Basin in Western Australia.
Numerous oil and gas fields have also been
discovered throughout the area to the west of
the permits, including the significant hydrocarbon
accumulations in the Harriet area, reservoired
within the highly productive Flag Sandstone.
Two major hydrocarbon accumulations occur
immediately to the north of the permits. The
Wandoo Oilfield is located around 46 kilometres to
the north of the permits with its primary reservoir
at a depth of approximately 600 metres in the
Early Cretaceous M.australis Sandstone of the
Muderong Shale. Recoverable oil is estimated to
be approximately 100 million barrels. The Stag
Oilfield is located only 24 kilometres to the north
of these permits with its primary reservoir at a
depth of approximately 700 metres. Recoverable oil
is estimated to be around 50 million barrels. Both
fields lie in approximately 50 metres of water.
Water depth over the permits does not exceed 70
metres, which when combined with shallow target
depths, allows for cost effective drilling using
offshore jack-up rigs.
These new Cerberus permits are substantially
covered by modern 3D seismic data that will aid
in identifying analogous traps to the Stag and
Wandoo oilfields.
Carnarvon Petroleum Limited
Work commitments for the primary two year
period are limited to reprocessing the existing 3D
seismic and geological studies and will not add any
significant cost exposure to Carnarvon’s already
low future commitments.
Relinquished Permits
During the year Carnarvon relinquished its
interests in WA-399-P and WA-443-P in good
standing. The decision to relinquish these permits
was due to a lack of material prospects being
identified from technical work which did not
warrant further exploration activity or expenditure.
7
Operating and Financial Review
Thailand Operations
Wichian Buri Project
For personal use only
Carnarvon’s oil producing asset is contained within
the L33/43, L44/43 and SW1A Concessions. These
Concessions are situated onshore Thailand, within
the Phetchabun Basin.
The Concessions cover the central, oil prone
section of the basin, with around 100 km2 under
long term production licenses and an additional
1,000 km2 area reserved for exploration.
Carnarvon has been a co-Concessionaire in these
Concessions since 2000; however oil has been
flowing from the area since 1995.
Oil has been discovered in multiple oil bearing
reservoirs in two distinct reservoir types: clastic
(sandstone) and fractured igneous (volcanic).
Asset Divestment
The Company completed a sale of half of its 40%
interest in the L33/43, L44/43 and SW1 Concessions
in Thailand to Loyz Energy Ltd on 31 March 2014.
The total consideration for the disposal of a 20%
interest in the Thai assets is up to US$65 million.
An upfront payment of US$33 million was paid
on completion. In addition, a future receivable
of up to US$32 million is to be paid annually at
the rate of 12% of the buyer’s annual revenue in
the Concessions, to a limit of US$10 million per
annum. The above amounts include working capital
adjustments.
Following the completion of the sale, Carnarvon’s
net interest in the L33/43, L44/43 and SW1
Concessions in Thailand is 20%.
2014 Production
Production for the first half of the 2014 financial
year was relatively stable due to a suspension in
the drilling program.
Only one well was drilled in the period between 3
January 2013 and 2 December 2013. Although this
well, WBEXT-2C, was successful and contributed
positively to overall oil production, it was not
enough to offset the natural decline from other
wells and accordingly overall production declined
slightly through the first two quarters of the 2014
financial year.
8
Figure 2: Carnarvon Interests as at
30 June 2014 in Thailand
After significant new technical work was
undertaken during the period from March 2013
to December of 2013, drilling recommenced on 2
December 2013.
The majority of the 11 wells drilled in the current
financial year were commercially successful, and
average field rates increased from around 1,300
bopd (gross) over the first half of the 2014 financial
year to 1,650 bopd (gross) for the March 2014
quarter and 4,000 bopd (gross) for the June 2014
quarter.
At year end field production was around 4,000 bopd
(gross) from 30 producing wells, with ten wells
shut-in due to ongoing land access issues.
2014 Annual Report
For personal use only
Operating and Financial Review
Field capacity is significantly higher than the
current production rate of circa 4,000 bopd due
to the Joint Venture deliberately choking back
wells in order to reduce the likelihood of early
water incursion. During 2010 and 2011 a number
of wells in the Wichian Buri Extension area were
brought on-line at flow rates of between 3,500
and 5,000 bopd and these wells were allowed to
flow unconstrained. In a relatively short period of
time these wells experienced sudden high water
cuts that reduced the flow rates significantly.
As a result, the overall production per well was
limited to around 200,000 bbls of oil. For the wells
drilled in the Wichian Buri Extension area in 2014,
while the wells are capable of similar flow rates
of 3,000 to 4,000 bopd, the individual rates have
been constrained to one half to one third their
capacity. Analysis suggests that at these rates the
wells are flowing below the critical water coning
rate. Delaying the onset of water incursion should
increase the ultimate recovery per well.
L33/43
Oil
production
area
Oil
kitchen
area
L44/43
Exploration
The main oil generating kitchen is interpreted to be
at the centre of the Phetchabun Basin, contained
within the L44/43 exploration concession.
Major oil accumulations have been discovered to
the north, east and south of the oil kitchen area.
Development activity has concentrated on the areas
immediately to the north and east of the kitchen.
Acquisition of 100 km2 3D seismic was completed
Q1 2013 over the south-western portion of the
L33/43 concession. Processing and interpretation
of this seismic was completed Q4 2013.
Exploration, appraisal and development in this area
is expected to increase in late 2014.
Exploration activities will be expanded to the areas
to the west and south of the oil kitchen beginning
in early 2015. These exploration activities will
include exploration drilling and acquisition of new
3D seismic data.
Development Projects
A water flood project commenced September 2013
in the Wichian Buri Extension area, incorporating
a number of wells drilled in late 2012. Water
injection commenced at a rate of several hundred
barrels of water per day, several times higher
than production voidage. Increased reservoir
pressure was observed and the process arrested
the previous natural field decline, and marginally
Carnarvon Petroleum Limited
improved production results, after the first few
months of operation. The water injection process
does not incur additional costs so the project
will continue despite recent improvements in
production being minimal.
A chemical water shut-off project was undertaken
in the June 2014 quarter in order to trial a
chemical injection method to arrest early water
incursion. After several weeks of chemical soak
the well was placed back into production and early
results are promising.
Agricultural Land Reform Office –
Shut in wells
Ten wells in the Bo Rang North area, under control
of the Agricultural Land Reform Office (ALRO), were
shut in in May 2012 while clarification was sought
from ALRO, regarding development approvals for
these wells.
Four of these wells were brought back online
during December 2012 but were shut in once more
during June 2014 pending ALRO discussions.
At year end the ten wells, producing around 300
bopd in aggregate (gross) at the time of the shutin, remain off-line whilst discussions continue with
ALRO on the matter.
9
Operating and Financial Review
2014 Drilling
One additional well was drilled to the east, outside
the Wichian Buri Extension production area
targeting sandstone reservoirs. The results of that
well allowed the Joint Venture to apply for an
extension to the production area.
Seven wells were drilled into the igneous
reservoirs of the Wichian Buri Extension production
area and an additional three wells were drilled into
the igneous reservoirs of the L33/43 Concession.
Overall the 2014 financial year drilling program
was successful with nine of the wells testing oil
at commercial rates and field production rates
increasing materially.
For personal use only
As summarized in the following table, the Joint
Venture performed 11 drilling operations in the
2014 financial year, primarily targeting the igneous
reservoirs in the north of the L44/43 Concession
and in the south of the L33/43 Concession.
Well
Q1
WBEXT-2C
Cumulative
Production
to 30 June
2014
Spud
Date
(‘000 bbls)
Appraisal well targeting the WBV2 igneous within the Wichian Buri Extension
production area. Successfully tested at up to 330 bopd with high water cut of around
700 bwpd.
17.8
16-Jul-13
5.6
2-Dec-13
Q2
WBEXT-2BST2 Appraisal well completed up-dip of the WBEXT-2C well. Successfully completed
as production well over the WBV2 igneous with initial testing of 175 bopd with 40
barrels per day of produced water and 500,000 scf/day of gas.
WBEXT-4C
Appraisal well into the WBV2 igneous within the Wichian Buri Extension production
area. The well intersected good quality reservoir with excellent pressure and flowed
several barrels of oil during clean-up operations before the bottom section of the
well collapsed and production ceased. Several workovers have failed to restart
production from this well and it remains shut-in at year end.
0.1 20-Dec-13
Q3
WBEXT-4BST1 Appraisal well intersected the WBV2 igneous reservoir with good oil shows but
initial testing resulted in high water cut oil at sub-commercial rates. Following recompletion into the overlying sandstone reservoirs the well initially tested 50-60
bopd with negligible water.
WBEXT-2AST2 Appraisal well intersected the igneous reservoir within the Wichian Buri Extension
production area however failed to flow commercial oil rates.
L33-2D
Exploration well intersected good quality reservoir with flow rates of between 20 and
50 bopd and associated water of around 400 bwpd. This well was abandoned and redrilled as L33-2D Deepen later in the year in an attempt to investigate stratigraphic
component to the igneous reservoirs.
WBEXT-3C
Deviated development/appraisal well within the Wichian Buri Extension production
area. Initial testing was successful with the well testing at rates up to 3,200 bopd.
To reduce the chance of early water incursion due to water coning, the flow rate has
been deliberately reduced.
WBEXT-5A
The WBEXT-5A well is an exploration well drilled to intersect the sandstones to the
east of the current WBEXT production area. The well successfully intersected several
sandstones and was put on 90 day test with rates around 80-100 bopd with no water.
Following the end of the test period the well has been shut-in pending an extension
to the production area.
WBEXT-3D
Deviated development/appraisal well within the same fault block as the WBEXT-3C
well. Initial testing was successful with the well testing at rates up to 3,500 bopd. To
reduce the chance of early water incursion due to water coning, the flow rate has
been deliberately reduced.
5.2
8-Jan-14
0.0 23-Jan-14
0.9
4-Feb-14
187.6
23-Feb-14
4.8
6-Mar-14
159.3 23-Mar-14
Q4
L33-2D Deep
L33-5A
The L33-2D well was deepened in an attempt to complete into an alternative
reservoir section, however the well failed to flow after deepening and remains shutin at year end.
Exploration well targeting igneous reservoir to the west of the L33/43 production
area. No oil shows and no losses were encountered while drilling this well. The well
has been suspended pending a decision to test later in the year in connection with
other L33/43 drilling.
0.9
11-Apr-14
0.0 15-Jun-14
Note: All flow rates and volumes are gross to the Joint Venture in which Carnarvon had a 40%
interest until 31 March 2014 and thereafter a 20% interest
10
2014 Annual Report
Operating and Financial Review
For personal use only
L52/50 and L53/50 Surat-Khiensa Basin
(Carnarvon Petroleum 100%)
In the March 2014 quarter, Carnarvon advised
the Thailand authorities of its intention to
withdraw from the L52/50 and L53/50 Exploration
Concessions in Southern Thailand.
Carnarvon was unable to secure a suitable farm-in
partner to join the Company in drilling two wells in
these Exploration Concessions. As previously outlined
to shareholders, Carnarvon’s intention was not to
commit to these wells without a farm in partner.
Accordingly, these Concessions are being returned to
the Government of Thailand in good standing.
L20/50 Concession
Carnarvon and Joint Venture partner, Sun
Resources Limited, previously assigned 100% of
the L20/50 Concession to Siam Moeco Limited.
Siam Moeco notified Carnarvon in the December
2013 quarter that they intend to relinquish this
Concession prior to exploration drilling. As a result
the block will revert back to the government and
Carnarvon’s commercial agreement with Siam
Moeco over this block will lapse.
Reserve Assessment
Petroleum Resource Classification, Categorisation
and Definitions
Carnarvon calculates reserves and resources
according to the SPE/WPC/AAPG/SPEE 1 Petroleum
Resource Management System (“SPE-PRMS”)
definition of petroleum resources. This definition
was first published in 1997 by the SPE, and in an
effort to standardise reserves reporting, has been
further clarified by the SPE-PRMS in 2007. Carnarvon
reports reserves in line with ASX Listing Rules.
Production
Reserves
Proved
1
Proved
& Probable
Proved, Probable
& Possible
Commercial
Contingent Resources
Discovered, but not
currently commercial
Prospective Resources
Exploration prospectivity
Society of Petroleum Engineers (“SPE”); World Petroleum Council (“WPC”); American Association of Petroleum
Geologist (“AAPG”) & Society of Petroleum Evaluation Engineers (“SPEE”)
Carnarvon Petroleum Limited
11
Operating and Financial Review
Carnarvon Reserves
For personal use only
All Carnarvon’s reserves are within the L33/43,
L44/43 and SW1 Concessions in which Carnarvon
has a 20% equity interest. Eco Orient Energy
(“Eco”) as Operator of these Concessions has
commissioned Chapman Petroleum Engineering
Ltd (“Chapman”) to undertake a third party
independent appraisal of these Concessions.
Proved
Undeveloped
Proved
Developed
Producing
Total
Proved
(million
(million
(million
barrels)
barrels)
barrels)
Reserves as at 31 December 2012
Chapman completed a Reserve and Economic
Evaluation of these Concessions in line with end
of calendar year requirements for the Department
of Mineral Fuels (“DMF”) in Thailand. Carnarvon’s 1P
reserves are 1.48 million barrels and 2P reserves
are 5.81 million barrels at 30 June 2014.
Probable
Developed Producing
Probable
Undeveloped
(million
barrels)
(million
barrels)
Total
Probable
Total
Proved
plus Probable
Total
Possible
Total
Proved
plus
Probable
plus
Possible
(million
barrels)
(million
barrels)
(million
barrels)
(million
barrels)
SW1
0.19
0.30
0.49
0.09
0.76
0.84
1.33
1.34
2.68
L33
0.06
0.12
0.18
0.06
0.24
0.30
0.49
2.94
3.43
2.75
3.42
0.36
0.51
7.29
8.29
10.40
12.22
16.98
21.27
27.39
33.50
L44
0.74
2.01
Total
0.99
2.43
Production 1 Jan 2013 to 31 December 2013
SW1
(0.04)
L33
(0.01)
L44
(0.22)
Technical Revision
7.65
8.80
SW1
0.09
(0.04)
0.05
0.05
0.06
0.11
0.16
0.11
0.27
L33
(0.04)
(0.03)
(0.07)
(0.05)
(0.04)
(0.10)
(0.16)
(0.22)
(0.38)
L44
(0.35)
0.12
Reserves as at 31 December 2013
(0.23)
(0.19)
0.03
(0.16)
(0.39)
(0.00)
(0.39)
SW1
0.29
0.26
0.54
0.14
0.82
0.95
1.50
1.45
2.95
L33
0.02
0.09
0.12
0.01
0.20
0.21
0.32
2.72
3.05
0.18
0.32
7.32
8.34
7.50
8.66
10.02
11.84
16.98
21.16
27.00
33.00
(0.41)
(0.48)
(0.75)
(0.73)
(1.47)
L44
0.40
2.12
2.52
Total
0.71
2.47
3.18
Corporate Adjustment - Sale of 50% of Thailand Assets
SW1
(0.14)
(0.13)
(0.27)
(0.07)
L33
(0.01)
(0.05)
(0.06)
(0.00)
(0.10)
(0.10)
(0.16)
(1.36)
(1.52)
L44
(0.20)
(1.06)
(1.26)
(0.09)
(3.66)
(3.75)
(5.01)
(8.49)
(13.50)
0.48
0.74
0.73
Production 1 Jan 2014 to 30 June 2014
SW1
(0.01)
L33
(0.00)
L44
(0.10)
Reserves as at 30 June 2014
SW1
0.14
0.13
0.27
L33
0.01
0.05
0.06
0.00
0.10
0.10
0.16
1.36
1.52
L44
Total
0.10
0.25
1.06
1.24
1.16
1.48
0.09
0.16
3.66
4.17
3.75
4.33
4.91
5.81
8.49
10.58
13.40
16.39
12
0.07
0.41
1.47
2014 Annual Report
For personal use only
Directors’ Report
Reserves as at 30 June 2014 have been adjusted
for production and the asset sale, but have not
been reassessed by Chapman. Accordingly the
figures for 30 June 2014 should be considered as
an interim position. Independent reserves reviews
for the Thailand assets are undertaken annually at
calendar year end.
Technical Discussion
Production from the Concessions is from a
number of producing fields, all of which are
faulted structural traps defined by 3D seismic and
geological controls. These fields range in extent
from 200 to 2,000 acres. Reservoirs are found at a
depth ranging between 500 to 1,100 metres. The net
pay thickness ranges from less than 3 to greater
than 200 metres.
Total developed producing reserves are based on
production decline analysis for each currently
producing well in the Concessions. By analysing
the optimum drainage area for existing wells
and corresponding petroleum initially in place, a
recovery factor can be determined. This forms the
basis for the assignment of undeveloped reserves
and potential well locations.
Total proved undeveloped reserves has been
estimated for identified infill locations. Total
probable undeveloped reserves have been
estimated for step out locations. Possible
underdeveloped reserves have been estimated
for over 200 locations in these fields in lesser
developed portions of the fields.
Carnarvon Petroleum Limited
Reserves Assessment
Information on the Reserves in this report are
based on an independent appraisal of the oil
reserves conducted by Chapman covering the
Concessions as at 31st December 2013 and
fairly represents the information and supporting
documentation reviewed. The appraisal was carried
out in accordance with the SPE Reserves Auditing
Standards and the SPE-PRMS guidelines under
the Supervision of Mr C Chapman, President of
Chapman, a leading petroleum advisory firm. Mr
Chapman has a Bachelor of Science degree, is a
member of the Australasian Institute of Mining and
Metallurgy and has more than 25 years relevant
experience. Mr Chapman meets the requirements
of a qualified petroleum reserve and resource
evaluator as defined in Chapter 19 of the ASX
Listing Rules and consents to the inclusion of this
information in this report.
The Reserve estimates outlined in this report have
been compiled by the Company’s Chief Operating
Officer, Mr Philip Huizenga, who is a full-time
employee of the Company. Mr Huizenga is qualified
in accordance with ASX Listing Rule 5.11 and has
consented to the form and context in which this
statement appears.
There are numerous uncertainties inherent
in estimating reserves and resources, and in
projecting future production, development
expenditures, operating expenses and cash flows.
Oil and gas reserve engineering and resource
assessment must be recognised as a subjective
process of estimating subsurface accumulations
of oil and gas that cannot be measured in an exact
way, and this is particularly so for the volcanic
reservoirs encountered in this area.
13
Operating and Financial Review
The Group reports an after-tax profit of $16,787,000
for the financial year ending 30 June 2014.
2013
Change
237,311
200,147
19%
Sales ($’000)
23,193
18,304
27%
Cost of sales
13,142
13,007
1%
For personal use only
2014
Production (bbls)
Increases in production and realised oil prices
saw an increase in sales revenue compared to the
previous financial year. A large portion of the cost
of sales is fixed and as a result, cost of sales was
relatively consistent with the previous year.
The sale of half of the Company’s 40% interest
in its producing Concessions in Thailand meant
there was a decrease in deferred tax liabilities of
$21,343,000 recognised in the financial statements.
These liabilities are due to temporary differences
between income tax deductions and amortization
with respect to the Company’s oil and gas assets
in Thailand. The deferred tax component of the
income tax expense does not incur any cash
obligation to the Thai tax authorities in the current
period.
During the year Carnarvon raised $3,100,000 by way
of an entitlement offer to existing shareholders in
preparation for drilling success in the North West
Shelf (Phoenix South-1 well).
The Group does not currently use derivative
financial instruments to hedge financial risk
exposures and therefore it is exposed to daily
movements in the international oil prices,
exchange rates, and interest rates. The Company
manages its cash positions in Thai Baht, US Dollars
and Australian Dollars to naturally hedge its foreign
exchange rate exposures.
In April 2014, Carnarvon completed the sale of half
of its 40% interest in its producing Concessions
in Thailand. This resulted in the receipt of US$33m
cash and US$32m in deferred consideration.
The deferred consideration has resulted in the
Company carrying a deferred consideration asset
classified as available-for-sale of $21,480,000
which represents the estimated present value of
this receivable.
Revenues under the Group’s contractual
arrangements with its customer are denominated
in US$, linked to the US$ prices of a basket of oil
products, and paid in Thai Baht at the average
monthly exchange rate. The Group does not
currently use derivative financial instruments
to hedge commodity price risk and therefore is
exposed to daily movements in the prices of these
oil products.
The exploration expenditure written off during
the 2014 financial year consists of $4,408,000 in
relation to exploration expenses incurred in the
L52/50 and L53/50 Concessions, $105,000 in relation
to the WA-399-P Permit and $365,000 in relation to
the WA-443-P Permit. These amounts have been
written off as the Concessions and Permits have
been relinquished.
The Company spent $9,639,000 on exploration and
development drilling and associated activities in
the L33/43 and L44/43 Concessions in Thailand
during the 30 June 2014 financial year.
14
2014 Annual Report
Operating and Financial Review
For personal use only
Permit Interests
Equity
Joint
Venture
Partner(s)
Partner
Interest
Indicative
Forward
Program
Permit
Basin
Thailand
SW1A
Phetchabun
20%
Eco Orient Energy (i)
Loyz Energy Limited
60%
20%
Production,
Appraisal
L33/43
Phetchabun
20%
Eco Orient Energy (i)
Loyz Energy Limited
60%
20%
Production, Appraisal,
Exploration
L44/43
Phetchabun
20%
Eco Orient Energy (i)
Loyz Energy Limited
60%
20%
Production,
Appraisal, Exploration
L20/50
Phitsanulok
0%
Siam Moeco
100%
Relinquishment
L52/50
Surat-Khiensa
100%
-
Relinquishment
(i) (ii)
-
L53/50
Surat-Khiensa
100%
-
-
Relinquishment
Australia
EP-490
Carnarvon
100%
-
-
G & G Studies
EP-491
Carnarvon
100%
-
-
G & G Studies
TP/27
Carnarvon
100%
-
-
G & G Studies
WA-435-P
Roebuck
20%
Apache (i)
Finder Exploration
JX Nippon
40%
20%
20%
Exploration well
WA-436-P
Roebuck
Finder Exploration (i)
50%iii
G & G Studies,
Farmout
WA-437-P
Roebuck
Apache (i)
Finder Exploration
JX Nippon
40%
20%
20%
G & G Studies,
Contingent exploration
well
WA-438-P
Roebuck
Finder Exploration (i)
50%iii
G & G Studies,
Farmout
WA-443-P
Roebuck
EP321
50%
(iii)
20%
50%
(iii)
100%
-
-
Relinquishment
Perth
2.50% of
38.25% (ii)
-
-
Appraisal
EP407
Perth
2.50% of
42.5% (ii)
-
-
Appraisal
WA399P
Carnarvon
13%
Apache (i)
Rialto Energy
Jacka Resources
60%
12%
15%
Relinquishment
Note: (i) Denotes operator where Carnarvon is non-operator partner
(ii) Carnarvon has an overriding royalty interest in these assets
(iii) Apache Northwest Pty Ltd have exercised an option to acquire 40% (20% from Carnarvon and 20% from Finder as per
ASX announcement 18 August 2014.
Carnarvon Petroleum Limited
15
For personal use only
For personal use only
Directors’ Report
The directors present their report together with the financial report of the Group, being
the Company, its controlled entities, and the Group’s interest in jointly controlled assets,
for the financial year ended 30 June 2014, and the auditor’s report thereon.
Carnarvon Petroleum Limited is a listed public company incorporated and domiciled in Australia.
Directors
The names and details of the Company’s directors in office at any time during or since the end of the
financial year are as follows. Directors were in office for this entire period unless otherwise stated.
Peter J Leonhardt
Chairman
FCA, FAICD (Life)
Appointed as a director on 17 March 2005 and appointed Chairman in April 2005.
Mr Leonhardt is an independent company director and adviser with extensive business, financial and
corporate experience. He is a Chartered Accountant and a former Senior Partner of PricewaterhouseCoopers
and Managing Partner of Coopers & Lybrand in Western Australia.
During the past three years Mr Leonhardt has served as a director of CTI Logistics Limited (from August
1999). He is also a director of The Honey Perkins Institute for Medical Research and the Cancer
Research Trust.
Mr Leonhardt is a member of the Audit Committee and the Remuneration Committee.
Adrian C Cook
Chief Executive Officer and Managing Director
B Bus, CA, MAppFin
Appointed as a director on 1 July 2011
Mr Cook has over 25 years experience in commercial and financial management, primarily in the petroleum
industry. Immediately prior to joining Carnarvon, he was the Managing Director of Buru Energy Limited, an
ASX listed oil and gas exploration and production company with interests in the Canning Basin in Western
Australia. Mr Cook has also held senior executive positions within Clough Limited’s oil and gas construction
business and was on the executive committee at ARC Energy Limited, an ASX listed mid cap oil and gas
exploration and production company.
During the past three years Mr Cook has not served as a Director of any other listed company. Mr Cook joined
Carnarvon on 2 November 2009 and was appointed to the Board on 1 July 2011.
Carnarvon Petroleum Limited
17
Directors’ Report
Edward (Ted) P Jacobson
For personal use only
Non-Executive Director
B.Sc (Hons Geology)
Appointed as a director on 5 December 2005.
Mr Jacobson is a petroleum geophysicist with over 40 years’ experience in petroleum exploration principally
in the European North Sea, South East Asia, South America and Australia. Within Australia he has been
responsible for initiating a number of petroleum discoveries within the Cooper Basin, Barrow Sub Basin
and Timor Sea. In 1986, Mr Jacobson established the consulting company Exploration Study Projects Pty Ltd
which advised companies on new venture opportunities in Australia and South East Asia and assisted in
capital raisings and corporate activity. In 1991 Mr Jacobson was co-founder of Discovery Petroleum NL and
from 1996 co-founder and technical director of Tap Oil Ltd which grew to a market capitalisation of over $400
million under his technical leadership. Mr Jacobson retired from Tap in September 2005.
During the past three years Mr Jacobson has not served as director of any other listed company.
Mr Jacobson retired as Chief Executive Officer of Carnarvon on 30 June 2011.
Neil C Fearis
Non-Executive Director
LL.B (Hons), FAICD, F Fin
Appointed as a director on 30 November 1999. Retired as director on 31 December 2013.
Mr Fearis has over 35 years’ experience as a commercial lawyer in the UK and Australia.
During the past three years Mr Fearis served as a director of the following listed companies: Perseus Mining
Limited (from 2004); Magma Metals Limited (from October 2009 to June 2013); and Tiger Resources Limited
(from May 2011). Mr Fearis is also a member of several professional bodies associated with commerce and law.
Mr Fearis was Chairman of the Audit Committee and a member of the Remuneration Committee until his
retirement on 31 December 2013.
William (Bill) A Foster
Non-Executive Director
BE (Chemical)
Appointed as a director on 17 August 2010.
Mr Foster is an engineer with extensive technical, commercial and managerial experience in the energy
industry over a 40 year period. He has been an advisor to a major Japanese trading company for the last
20 years in the development of their global E&P and LNG activities and has spent time prior to this working
internationally in the development of a number of energy companies.
During the past three years Mr Foster served as a director of Hawkley Oil & Gas Limited and was a former
director of the E&P companies that were formed through his advisory services to the Japanese trading
company.
Mr Foster is Chairman of the Remuneration Committee and the Audit Committee.
18
2014 Annual Report
Directors’ Report
For personal use only
Company Secretary
Mr Thomson Naude was appointed Company Secretary in November 2012. Mr Naude is a qualified Chartered
Accountant, a member of Chartered Secretaries Australia and the Commercial Manager at Carnarvon
Petroleum.
Directors’ meetings
The number of directors’ meetings held and attended by each of the directors during the reporting period
was as follows:
(a)
(b)
Peter Leonhardt
10
10
Ted Jacobson
10
9
Neil Fearis
5
5
Bill Foster
10
10
Adrian Cook
10
10
(a) Number of meetings held during period of office
(b) Number of meetings attended
Audit Committee
Names and qualifications of Audit Committee members
The Committee is to include at least 2 members from 1 July 2009. Current members of the committee
are Bill Foster (Chairman of the Audit Committee) and Peter Leonhardt. Qualifications of Audit Committee
members are provided in the Directors section of this directors’ report.
Audit Committee meetings
The number of Audit Committee meetings held and attended by the members during the reporting period
was as follows:
(a)
(b)
Peter Leonhardt
2
2
Neil Fearis
1
1
Bill Foster
2
2
(a) Number of meetings held during period of office
(b) Number of meetings attended
Carnarvon Petroleum Limited
19
Directors’ Report
Remuneration Report (Audited)
Remuneration Committee
For personal use only
The Committee is to include at least 2 members. Current members of the committee are Bill Foster
(Chairman of the Remuneration Committee) and Peter Leonhardt. Qualifications of Remuneration Committee
members are provided in the Directors section of this directors’ report.
Remuneration Committee meetings
The number of Remuneration Committee meetings and the number attended by each of the members during
the reporting period were as follows:
Neil Fearis
Peter Leonhardt
Bill Foster
(a)
(b)
1
2
2
1
2
2
(a) Number of meetings held during period of office
(b) Number of meetings attended
The Remuneration Committee is responsible for the compensation arrangements for directors and
executives of the Company. The Remuneration Committee considers compensation packages and policies
applicable to the executive directors, senior executives and non-executive directors’ fees. In certain
circumstances these include incentive arrangements including employee share plans, incentive performance
packages, and retirement and termination entitlements.
Principles of compensation
Total non-executive directors’ fees are approved by shareholders and the Remuneration Committee is
responsible for the allocation of those fees amongst the individual members of the Board.
The Remuneration Committee assesses the appropriateness of the nature and amount of compensation on
an annual basis by reference to industry and market conditions, and with regard to individual performance
and the Company’s financial and operational results. Such assessments are also made after referring to the
recommendations of specialist consultancy firms, industry groups, government and shareholder bodies. The
Board obtains, when required, independent advice on the appropriateness of remuneration packages, given
trends in comparative companies both locally and internationally.
The Remuneration Committee ultimately determines its compensation practices in terms of their
effectiveness to attract, retain and incentivise appropriately qualified and experienced directors and senior
executives.
Remuneration arrangements are made having regard to the number and composition of staff in the business
and the stage of development of the Company. Remuneration arrangements include a mix of fixed and
performance based remuneration. Performance based remuneration comprises short term and long term
incentive schemes. Short term incentive arrangements are designed to incentivise superior individual
achievement over a period of twelve months and typically comprise cash payments or share issues, as the
Remuneration Committee considers appropriate. Long term incentive arrangements are share-based and
designed to be simple, clear and strongly aligned between shareholder and executive interests over the
medium to longer term.
Remuneration structures take into account the overall level of compensation for each director and executive,
the capability and experience of the directors and senior executives, the executives’ ability to control the
financial performance of the relative business segment, the Group’s performance (including earnings and
share price), and the amount of any incentives within each executives’ remuneration.
20
2014 Annual Report
Directors’ Report
Remuneration Report (Audited) (continued)
For personal use only
Principles of compensation (continued)
On 1 August 2008 the Board adopted a policy that prohibits those that are issued share-based payments as
part of their remuneration from entering into other arrangements that limit their exposure to losses that
would result from share price decreases. The Company requires all executives and directors to sign annual
statements of compliance with this policy throughout the preceding year.
In considering the Group’s performance and impact on shareholder wealth, the Board has had regard to the
following in respect of the current financial year and the previous four years. No dividends have been paid or
declared during this period.
Share price as at
30 June each year
Year on year change in
the share price
Consolidated net profit / (loss)
from continuing operations
($000)
30 June
2010
30 June
2011
30 June
2012
30 June
2013
30 June
2014
$0.345
$0.175
$0.105
$0.041
$0.075
(58%)
(49%)
(40%)
(61%)
83%
$14,423
$2,159
($2,498)
($8,385)
16,787
Non-executive directors
Total remuneration for all non-executive directors, last voted upon by shareholders at a General Meeting in
November 2008, is not to exceed $300,000 per annum.
A non-executive director’s base fee is $75,000 per annum, the Chairman of the board receives $115,000
per annum, the Chairman of the Audit Committee receives an additional $2,500 and the Chairman of the
Remuneration Committee receives an additional $2,500. These fees were last increased with effect from 1
January 2014. Non-executive directors do not receive any performance-related remuneration. The Company
does not have any terms or schemes relating to incentives or retirement benefits for non-executive
directors.
Additional consulting fees of $106,356 (2013:$ 149,987) were paid to a related entity of Ted Jacobson in
relation to exploration advisory services during the year.
Fixed compensation
Fixed compensation consists of base compensation as well as employer contributions to superannuation
funds.
Carnarvon Petroleum Limited
21
Directors’ Report
Remuneration Report (Audited) (continued)
Short term incentive scheme
For personal use only
Short term incentives are assessed by the Remuneration Committee based on two components:
1. the performance of the business as a whole; and
2. the individual performances of each employee.
The value of any short term incentive paid in cash is restricted to a maximum 50% of an individual’s Fixed
Compensation.
The Remuneration Committee is not obliged to make incentive payments where there are material adverse
changes in the circumstances of the Company.
Non-executive directors are not entitled to participate in the short term incentive scheme.
All short term incentives awarded during the period are included in remuneration, as set out on page 25, and
fully vested to each named Company executives, and key management personnel during the period. The basis
of these short term incentives included personal performance coupled with the delivery of key milestones
such as the spudding of the Phoenix South well, the securing of new acreage, materially increasing oil
production in Thailand and the divesting of half of Carnarvon’s interest in its Thailand production asset for a
value premium to the Company’s market value.
Long term incentive scheme - Employee Share Plan
The Carnarvon Employee Share Plan (“ESP”) was implemented following shareholder approval at the 1997
Annual General Meeting (“AGM”) and was last updated and ratified by shareholders at the AGM on 16
November 2013.
The purpose of the ESP is to attract, retain and motivate those who have been invited by the Board to
participate in the ESP and align their interests with all other shareholders by encouraging performance that
increases shareholder wealth through long term growth.
The Plan is considered to be the most appropriate long term incentive scheme for the size and nature of
the Company. The plan only rewards long term share price growth, rather than relative performance. Unlike
performance rights, the Plan shares are only of value to the holder of the shares when the share price
increases to at least 120% of the share price when the offer is made to the employee. Furthermore, the
Plan does not give rise to a tax liability on issue (unlike some options) thus encouraging long term holdings.
The Company Employee Share Plan is considered to be the most effective way to align the objectives of
management with the interests of shareholders.
The principal provisions of the Plan include:
• the Plan is available to all executive Directors, employees or consultants of the Company or any of its
subsidiaries (“Eligible Person”);
• Non-Executive Directors are not eligible to participate in the Plan;
• the Company may at any time, in its absolute discretion, make an offer to an Eligible Person;
• the number of Plan Shares issued to any Eligible Person and the issue price is to be determined by the
directors of the Company;
• the issue price is to be determined by the Board, provided that the issue price is at least 120% of the
market price of the Company’s Shares, being the weighted average sale price of Shares sold through the
ASX on the 5 trading days prior to the proposed date of an offer under the Plan.;
• the offer may be accepted by an Eligible Person or an associate of that Eligible Person, within the given
acceptance period;
• the person accepting the offer (“Participant”) will be taken to have agreed to borrow from the Company
on the terms of the loan agreement referred to below an amount to fund the purchase of the Plan
Shares;
22
2014 Annual Report
Directors’ Report
Remuneration Report (Audited) (continued)
For personal use only
•
•
•
•
•
•
•
•
•
•
•
the Plan Shares will rank pari passu with all issued fully paid ordinary shares in respect of voting rights,
dividends and entitlement to participate in any bonus or rights issues;
a Participant may not dispose of any Plan Shares within one year of the Issue Date but, subject to
repayment of any associated loan, may dispose of up to 33.3% of Plan Shares after one year, 66.6% after
two years, and 100% after three years;
until the loan to the Participant is fully repaid, the Company has control over the disposal of the Plan
Shares. Once the loan is repaid in full, the Participant may deal with the Plan Shares as he wishes;
the aggregate number of Plan Shares and other shares and options issued in the previous 5 years under
any other employee incentive scheme of the Company must not exceed 5% of the issued capital of the
Company; and
applications will be made as soon as practicable after the allotment of the Plan Shares for listing for
quotation on ASX.
the principal provisions of the loan agreement include:
the amount lent will be an advance equal to the issue price of the Plan Shares multiplied by the number
of Plan Shares issued;
the loan can be repaid at any time but the Participant must pay any amount outstanding to the Company
within 30 days of termination of the Eligible Person’s employment. All dividends declared and paid on
the Plan Shares will be applied towards the repayment of the advance and there is no interest on the
advance;
the maximum liability in respect of the loan will be the value of the Plan Shares from time to time; and
a holding lock will be placed on the Plan Shares until the loan is fully repaid.
loans made under the ESP involve no cash outlay by the Company.
A complete copy of the rules of the ESP (which incorporates the terms of the loan agreement) is available
for inspection by shareholders (free of charge) at the Company’s Registered Office or, upon request, from the
Company Secretary.
Plan Shares are approved by the Remuneration Committee based upon the assessed performance of each
person against their job specifications and the recommendations of the Chief Executive Officer, and in the
case of executive Directors, with the approval of shareholders.
The Remuneration Committee, having regard to recent changes in the taxation of certain long term incentive
schemes and current trends in structuring long term incentive plans, is of the view that the Company’s ESP
is effectively structured to meet its objectives in attracting, retaining and motivating appropriately qualified
and experienced directors and senior executives.
During the current financial year the following Plan Shares were issued to Executive Officers of the
Company:
Executive
Officers
Number of
shares issued
Issue date
Exercise price
per share
Notional
Loan
400,000
250,000*
1,000,000
21/11/2013
13/12/2013*
23/05/2014
$0.71
$0.059*
$0.115
$46,000
$14,750*
PP Huizenga
AC Cook*
PP Huizenga
$115,000
The exercise price for each issue above was calculated based on a 20% premium on the 5-day weighted
average closing price prior to the date of offer. The purchases were funded by interest-free loans with a
limited recourse security over the Plan Shares and subject to the detailed rules of the ESP. The shares remain
subject to the disposal restrictions contained in the Plan Rules summarized above.
*
Approved by shareholders at the AGM on 15 November 2013.
Carnarvon Petroleum Limited
23
Directors’ Report
Remuneration Report (Audited) (continued)
Directors’ and executive officers’ remuneration (Company and consolidated)
For personal use only
Details of the nature and amount of each major element of the remuneration of each director of the
Company and each of the named Company and Group executives receiving the highest remuneration are set
out on the following page.
In order to determine the cost of Plan Shares issued in a period, the Company uses the Black-Scholes
Option Pricing Model, calculated at the date of issue of the Plan Shares, assuming a 3 year life and nil
cash consideration. For this purpose, Plan Shares are treated as having vested immediately and the cost
calculated under the Black-Scholes Option Pricing Model is recognised as an expense entirely in the current
period, notwithstanding restrictions on their disposal and the period over which the benefits arise. The
following factors and assumptions were used in determining the fair value of Plan Shares at grant date in the
current reporting period:
Grant date
Assumed
expiry date
Fair value
per option
21/11/2013
13/12/2013
23/05/2014
20/11/2016
12/12/2016
22/05/2017
$0.042
$0.025
$0.030
ASX quoted
price of
shares at
Exercise
price grant date
$0.071
$0.059
$0.115
Expected
Risk free
volatility interest rate
$0.066
$0.055
$0.098
70%
70%
70%
Dividend
yield
2.5%
2.5%
2.5%
0%
0%
0%
Service contracts
The contract duration, period of notice and termination conditions for key management personnel are as follows:
Philip Huizenga, Chief Operating Officer, is engaged as an employee. Termination by the Company is with 3
months’ notice or payment in lieu thereof and an additional payment of 3 months’ remuneration. Termination
by Mr Huizenga is with 3 months’ notice.
Adrian Cook, Chief Executive Officer, is engaged as an employee. Termination by the Company is with 12
months’ notice or payment in lieu thereof. Termination by Mr Cook is with 6 months’ notice.
Equity instruments
(i)Shares
There were no shares in the Company issued as compensation to key management personnel during the
reporting period, other than the Plan Shares issued as described on page 22.
650,000 Plan Shares were issued to key management personnel to match shares acquired on market by
these individuals. An additional 3,259,399 Plan Shares were issued to employees of the Company to match
shares acquired on market by these individuals. The match scheme is designed to align the interests of
employees and shareholders by encouraging employees to use personal funds to acquire shares in the
Company.
(ii)Options
There were no options over shares in the Company issued as compensation to key management personnel
during the reporting period. No options have been issued since the end of the financial year. ESP shares
issued as compensation to key management personnel during the year are disclosed on page 25.
There were no shares issued in either 2014 or 2013 on the exercise of options.
There are no amounts unpaid on shares issued as a result of the exercise of options. During the reporting
period there was no forfeiture, lapsing or vesting of options issued in previous periods.
At the end of the reporting period, other than Plan Shares (treated in principle as options), there were no
unvested options on issue.
24
2014 Annual Report
Remuneration report (Audited) (continued)
Directors’ and executive officers’ remuneration, Company and consolidated (continued)
110,000
Salary
and fees
($)
-
-
-
Short term
cash
bonus
($)
-
-
-
-
Superannuation
contributions
($)
-
-
-
-
Shares
($)
62,500
68,750
62,500
71,250
62,500
31,250
105,000
110,000
Total
($)
14.7
-
-
-
-
-
-
-
-
Proportion of
remuneration
performance
related%
-
1.0
-
-
-
-
-
-
-
-
Value of
shares as
a % of
remuneration
Share-based
payments
105,000
-
648,177
-
8.2
Post
Employment
2014
31,250
-
545,000
20.7
-
Short Term
2013
62,500
-
-
669,520
-
-
3.8
Name
Directors
2014
-
-
-
517,750
-
15.1
2014
2013
2014
2013
2014
492,750
493,933
520,000
521,250
62,500
68,750
62,500
-
191,597
-
96,003
-
95,594
-
-
50,000
50,000
25,000
25,000
25,000
25,000
-
2014
Mr PP Huizenga (Chief Operating Officer)
Executives
Mr AC Cook (Chief Executive Officer)
Executive
Mr EP Jacobson
2013
1,305,250
1,296,433
Mr W Foster
Mr NC Fearis
Mr PJ Leonhardt (Chairman)
Non-Executive
2013
71,250
-
-
-
1,598,947
2013
Total compensation: key management
personnel (Company and consolidated)
2014
-
54,584 ¹
-
-
60,917 ¹
25
Carnarvon Petroleum Limited
6,333 ¹
1,355,250
2013
Accounting cost as determined using the Black-Scholes Option Pricing Model
Directors’ fees are paid or payable to the director or a director-related entity.
1
For personal use only
Directors’ Report
Directors’ Report
Non-audit services
For personal use only
The auditors have not performed any non-audit services over and above their statutory duties during the
current reporting period.
Details of the amounts paid or payable to the auditor of the Group for audit services provided during the year
are set out below:
Audit Services
Consolidated 2014 ($)
Auditors of the Company:
Audit and review of financial reports
142,544
Directors’ interests
At the date of this report, the relevant interests of the directors in securities of the Company are as follows:
Name
PJ Leonhardt
AC Cook
EP Jacobson
WA Foster
Ordinary
Shares
Options over
ordinary Shares
17,750,000
6,890,000
34,188,267
528,205
640,000
2,890,632
156,250
Shares issued under the Company’s ESP are included under the heading Ordinary Shares. Options over
ordinary shares were acquired by Directors through their participation in the Company’s entitlement offer to
all shareholders.
Share options
Options issued to directors and executives of the Company
There were no options over shares issued as compensation to directors or named executives during or since
the end of the financial year.
Diversity
For the year ending 30 June 2014, women made up 30% of the Company’s general work force. Currently,
there are no women on the board or in senior executive positions.
Likely developments
The likely developments for the 2014 financial year are contained in the operating and financial review as set
out on pages 4 to 15. The directors are of the opinion that further information as to the likely developments
in the operations of the Group would prejudice the interests of the Company and the Group and it has
accordingly not been included.
Environmental regulation and performance
The Group’s oil and gas exploration and development activities are concentrated in Thailand, and Western
Australia. Environmental obligations are regulated under both State and Federal Law in Western Australia and
under the Department of Mineral Fuels regulations in Thailand. No significant environmental breaches have
been notified by any government agency during the year ended 30 June 2014.
Dividends
No dividends were paid during the year and the directors do not recommend payment of a dividend in
respect of the current financial year (2013: Nil).
26
2014 Annual Report
Directors’ Report
For personal use only
Auditor’s independence declaration
The auditor’s Independence Declaration under Section 307C of the Corporations Act is set out on page 29 and
forms part of the directors’ report for the financial year ended 30 June 2014.
Principal activities
During the course of the 2014 financial year the Group’s principal activities continued to be directed towards
oil and gas exploration, development and production.
Identification of independent directors
The independent directors are identified in the Corporate Governance Statement section of this Annual
Report as set out on pages 79 to 81.
Significant changes in state of affairs
In the opinion of the directors no significant changes in the state of affairs of the Group occurred during the
current financial year other than as outlined in the operating and financial review as set out on pages 4 to 15.
Indemnification and insurance of directors and officers
During the period the Company paid a premium to insure the directors and officers of the Company and its
controlled entities. The policy prohibits the disclosure of the nature of the liabilities covered and the amount
of the premium paid.
Proceedings on behalf of the Company
No person has applied for leave of Court to bring proceedings on behalf of the Company or intervene in
any proceedings to which the Company is a party for the purpose of taking responsibility on behalf of the
Company for all or any part of the proceedings. The Company was not a party to any such proceedings during
the year.
Operating and financial review
An operating and financial review of the Group for the financial year ended 30 June 2014 is set out on pages
4 to 15 and forms part of this report.
Indemnity of directors, company secretary and auditors
Deeds of Access and Indemnity have been executed by the Company with each of the directors and
Company Secretary. The deeds require the Company to indemnify each director and Company Secretary
against any legal proceedings, to the extent permitted by law, made against, suffered, paid or incurred by the
directors or Company Secretary pursuant to, or arising from or in any way connected with the director or
Company Secretary being an officer of the Company.
The company has not otherwise, during or since the end of the financial year, except to the extent permitted
by law, indemnified or agreed to indemnify the auditor of the company against a liability incurred by the
auditor.
Carnarvon Petroleum Limited
27
Directors’ Report
Events subsequent to reporting date
For personal use only
As of the 18 August 2014 the Company announced a significant oil discovery in the Phoenix South-1 well
in the North West Shelf in Western Australian Permit WA-435-P. At this preliminary stage it is too early to
quantify the recoverable volumes of oil. In addition, further technical evaluation is required in order to be
in a position to announce this information. The cost estimate for the well to completion for the Company,
including additional drilling, is estimated to be around $6,000,000. This figure is subject to change pending the
finalisation of the costs associated with the well.
No matters or circumstance has arisen since 30 June 2014 that in the opinion of the directors has
significantly affected, or may significantly affect in future financial years:
(i) The Group’s operations; or
(ii) The results of those operations; or
(iii) The Group’s state of affairs.
Rounding off
The Company is an entity to which ASIC Class Order 98/100 dated 10 July 1998 applies. In accordance with
that Class Order amounts in the financial report and directors’ report have been rounded off to the nearest
thousand dollars, unless otherwise stated.
Signed in accordance with a resolution of the directors.
PJ Leonhardt
DirectorPerth, 29 August 2014
28
2014 Annual Report
For personal use only
Independence Declaration
Carnarvon Petroleum Limited
29
Consolidated Income Statement
For the year ended 30 June 2014
For personal use only
Consolidated
Notes
Oil sales
2014
$000
2013
$000
23,193
18,304
787
Other income
4
1,574
(Loss) on sale of joint operations
5
(2,387)
Cost of sales
6
(13,142)
(13,007)
(1,365)
(1,192)
(281)
(293)
(1,552)
(885)
(204)
(271)
Administrative expenses
Directors’ fees
Employee benefits expense
Travel related costs
-
Unrealised foreign exchange (loss)/gain
(1,501)
1,498
New venture and advisory costs
(2,203)
(2,334)
(4,878)
(1,105)
(143)
(14)
Exploration expenditure written off
16
Share-based payments
(Loss) profit before income tax
(2,889)
Taxes
Current income tax expense / (benefit)
1,667
Deferred income tax (benefit) / expense
1,488
(261)
(21,343)
10,134
(19,676)
9,873
(19,676)
9,873
Profit (loss) for the year
16,787
(8,385)
Profit (loss) attributable to members of the Company
16,787
(8,385)
10 (a)
Total taxes
Basic profit (loss) per share (cents per share)
9
1.7
(1.0)
Diluted profit (loss) per share (cents per share)
9
1.7
(1.0)
The above consolidated income statement should be read in conjunction with the accompanying notes to
the financial statements.
30
2014 Annual Report
Consolidated Statement of Profit or Loss
and other Comprehensive Income
For personal use only
For the year ended 30 June 2014
Consolidated
2014
$000
2013
$000
16,787
(8,385)
(11,501)
18,102
Total comprehensive income for the year
5,286
9,717
Total comprehensive income attributable to members
of the company
5,286
9,717
Profit (loss) for the year
Other comprehensive income
Items that may be reclassified to profit or loss
Exchange differences arising in translation of foreign operations,
net of income tax
The above consolidated statement of comprehensive income should be read in conjunction with the
accompanying notes to the financial statements.
Carnarvon Petroleum Limited
31
Consolidated Statement of Financial Position
As at 30 June 2014
2014
$000
2013
$000
Cash and cash equivalents
23(b)
49,580
19,525
Trade and other receivables
11
3,937
5,082
Inventories
14
2,728
6,963
Other assets
15
428
251
56,673
31,821
For personal use only
Notes
Current assets
Total current assets
Non-current assets
Deferred consideration asset
12
21,480
-
Property, plant and equipment
13
504
765
Exploration and evaluation expenditure
16
2,300
3,404
Oil and gas assets
17
52,008
108,374
76,292
112,543
132,965
144,364
Total non-current assets
Total assets
Current liabilities
Trade and other payables
19
4,516
3,166
Employee benefits
26
244
279
Exploration provision
16
1,203
-
235
846
6,198
4,291
Current tax liability
10 (b)
Total current liabilities
Non-current liabilities
Employee benefits
26
105
-
Deferred tax liabilities
21
21,902
43,245
Total non-current liabilities
22,007
43,245
Total liabilities
28,205
47,536
104,760
96,828
87,573
Net assets
Equity
Issued capital
22
90,213
Reserves
22
(6,268)
Retained earnings
Total equity
857
20,815
8,398
104,760
96,828
The above consolidated statement of financial position should be read in conjunction with the
accompanying notes to the financial statements.
32
2014 Annual Report
Consolidated Statement of Changes in Equity
For personal use only
For the year ended 30 June 2014
Balance at 1 July 2012
Issued
capital
$000
Retained
earnings
$000
Translation
reserve
$000
Share
based
payments
reserve
$000
68,536
16,783
(19,197)
2,194
Total
$000
68,316
Comprehensive income
(Loss) for the year
-
Other comprehensive income
Total comprehensive income
for the year
-
(8,385)
(8,385)
-
-
(8,385)
18,102
-
18,102
18,102
-
9,717
Transactions with owners and
other transfers
Share based payments
256
-
-
(242)
Proceeds from capital raise
18,781
-
-
Total transactions with owners
and other transfers
19,037
-
-
Balance at 30 June 2013
87,573
8,398
(1,095)
1,952
96,828
Balance at 1 July 2013
87,573
8,398
(1,095)
1,952
96,828
Profit for the year
-
16,787
-
16,787
Other comprehensive income
Total comprehensive income
for the year
-
-
(11,501)
-
(11,501)
-
16,787
(11,501)
-
5,286
-
(4,370)
4,370
-
-
(242)
14
18,781
18,795
Comprehensive income
Transactions with owners and
other transfers
Reclassification on partial
disposal
Share based payments
-
137
-
-
6
143
Proceeds from entitlement issue
2,503
-
-
-
2,503
Total transactions with owners
and other transfers
2,640
-
-
6
2,646
90,213
20,815
1,958
104,760
Balance at 30 June 2014
(8,226)
The above consolidated statement of changes in equity should be read in conjunction with the
accompanying notes to the financial statements.
Carnarvon Petroleum Limited
33
Consolidated Statement of Cash Flows
For the year ended 30 June 2014
Consolidated
2013
$000
Receipts from customers and GST recovered
23,413
18,352
Payments to suppliers and employees
(13,425)
(15,766)
(1,249)
(1,479)
For personal use only
2014
$000
Notes
Cash flows from operating activities
Income tax and special remuneratory benefit paid
Interest received
151
180
Research and development refundable tax offset
714
-
9,604
1,287
Net cash provided by operating activities
23(a)
Cash flows from investing activities
Exploration and development expenditure
Cash held as security
Acquisition of property, plant and equipment
Proceeds from farm-out activities
(13,232)
(12,448)
(164)
(745)
(43)
(453)
-
Net cash used in investing activities
(13,439)
4,480
(9,166)
Cash flows from financing activities
Proceeds from sale of Thai assets
31,062
-
-
19
2,503
-
-
18,781
Net cash provided by financing activities
33,565
18,800
Net increase in cash and cash equivalents held
Cash and cash equivalents at the
beginning of the financial year
Effect of exchange rate fluctuations on
cash and cash equivalents
29,730
10,921
19,525
7,106
325
1,498
49,580
19,525
Sale from property, plant and equipment
Proceeds from entitlement issue
Proceeds from issue of shares
Cash and cash equivalents at the end of the
financial year
23(b)
The above consolidated statement of cash flows should be read in conjunction with the accompanying
notes to the financial statements.
34
2014 Annual Report
Notes to the Financial Statements
For the year ended 30 June 2014
For personal use only
1. Reporting entity
The consolidated financial report of Carnarvon Petroleum Limited (‘Company’) for the financial year
ended 30 June 2014 comprises the Company and its controlled entities (the “Group”) and the Group’s
interest in jointly controlled assets.
The separate financial statements of the parent entity, Carnarvon Petroleum Limited, have not been
presented within this financial report as permitted by the Corporations Act 2001.
The group is a for profit entity for financial reporting purposes under Australian Accounting Standards.
The financial report was authorised for issue by the directors on 30 August 2014.
2. Basis of preparation of the financial report
Statement of compliance
The financial report is a general purpose financial report prepared in accordance with Australian
Accounting Standards (“AASBs”), including Australian Accounting Interpretations, other authoritative
pronouncements of the Australian Accounting Standards Board (“AASB”), and the Corporations
Act 2001.
Australian Accounting Standards set out accounting policies that the AASB has concluded would
result in a financial report containing relevant and reliable information about transactions, events and
conditions to which they apply. Compliance with Australian Accounting Standards ensures that the
financial statements and notes also comply with International Financial Reporting Standards (“IFRSs”).
Material accounting policies adopted in the preparation of this financial report are presented below.
They have been consistently applied unless otherwise stated.
Adoption of new and revised Accounting Standards
None of the new standards and amendments to standards that are mandatory for the first time
for the financial year beginning 1 July 2013 affected any of the amounts recognised in the current
period or any prior period and are not likely to affect future periods. However, amendments made to
AASB 101 Presentation of Financial Statements effective 1 July 2013 now require the statement of
comprehensive income to show the items of comprehensive income grouped into those that are not
permitted to be classified to profit or loss in a future period and those that may have to be reclassified
if certain conditions are met.
Basis of measurement
The financial report is prepared on a historical cost basis, except for available-for-sale financial assets
which are measured at fair value.
Use of estimates and judgements
The preparation of the financial report requires management to make judgements, estimates and
assumptions that affect the application of accounting policies and the reported amounts of assets
and liabilities, income and expenses. Actual results may differ from these estimates.
Estimates and underlying assumptions are reviewed on an ongoing basis. Revisions to accounting
estimates are recognised in the period in which the estimate is revised and in any future periods
affected.
Carnarvon Petroleum Limited
35
Notes to the Financial Statements
For the year ended 30 June 2014
For personal use only
2. Basis of preparation of the financial report (continued)
Key estimate – impairment
The Group assesses impairment at each reporting date by evaluating conditions specific to the group
that may lead to the impairment of assets. Where an impairment trigger exists, the recoverable
amount of the asset is determined. Value-in-use calculations performed in assessing recoverable
amounts incorporate a number of key estimates as detailed in Note 17.
Key estimate – income and capital gains taxes
Estimates are made in determining any provision for income and capital gains taxes. The Group
recognizes liabilities of anticipated tax based on estimates of taxes due. Where the final tax outcome
of these matters is different from the amounts that were initially recognised, such differences will
impact the income tax and deferred tax expenses, assets or provisions in the year in which such
determination is made.
Exploration and evaluation expenditures
The application of the Company’s accounting policy for exploration and evaluation expenditure
requires judgement to determine whether it is likely that future economic benefits are likely, from
future either exploitation or sale, or whether activities have not reached a stage which permits a
reasonable assessment of the existence of reserves. The determination of reserves and resources
is itself an estimation process that requires varying degrees of uncertainty depending on how the
resources are classified. These estimates directly impact when the Company defers exploration and
evaluation expenditure. The deferral policy requires management to make certain estimates and
assumptions as to future events and circumstances, in particular, whether an economically viable
extraction operation can be established. Any such estimates and assumptions may change as new
information becomes available. If, after expenditure is capitalised, information becomes available
suggesting that the recovery of the expenditure is unlikely, the relevant capitalised amount is written
off in profit or loss in the period when the new information becomes available.
Key estimate – special remuneratory benefit and income tax
The Group’s Phetchabun Basin Joint Venture is subject to Thai income tax at 50% and a special
remuneratory benefit (“SRB”) tax on profits, at sliding scale rates (0% - 75% per concession).
The SRB, which is tax deductible in the calculation of Thai income taxes, involves a highly detailed
calculation done on a concession by concession basis. The basis of the calculation is petroleum
profits, adjusted for capital spent, being subjected to a sliding scale SRB rate such that profits are
not taxed until all capital has been recovered. The sliding scale rate is principally driven by production
and pricing but is subject to other adjustments such as changes in Thailand’s consumer price index,
wholesale price index, cumulative metres drilled on the concession, and, for certain concessions,
changes in the exchange rate between the Thai Baht and the USD.
The SRB calculation is performed and paid annually for each concession at the calculated annual rate
at the end of each calendar year. Judgement is required in determining provisions which are based on
estimates of amounts due. Where the final outcome of those matters is different from the amounts
that were originally recognised, such difference may impact those provisions in the period in which
such a determination is made.
Key estimate – reserve quantities
Reserves are estimates of the amount of product that can be economically and legally extracted
from the consolidated entity’s properties. In order to estimate economically recoverable reserves,
assumptions are required about a range of geological, technical, legal and economic factors, including
quantities, production techniques, reversion rights, recovery rates, production costs, transport costs,
commodity demand, commodity prices and exchange rates.
36
2014 Annual Report
Notes to the Financial Statements
For the year ended 30 June 2014
For personal use only
2. Basis of preparation of the financial report (continued)
Estimating the quantity of reserves requires the size, shape and depth of fields to be determined
by analysing geological drilling and production data. This process may require complex and difficult
judgements to interpret the data. Because the economic assumptions used to estimate economically
recoverable reserves change from period to period, and because additional data is generated during
the course of operations, estimates of reserves may change from period to period. Changes in
reported reserves may affect the consolidated entity’s financial results and financial position in a
number of ways, including the following:
• asset carrying values (note 17) may be affected due to changes in estimated future cash flows;
• depreciation charged in the income statement (note 6) may change as such charges are determined
by the units of production basis; and
• the carrying value of deferred tax assets (note 21) may change due to changes in the estimates of
the likely recovery of the tax benefits.
Key judgement – functional currency
The determination of the functional currency of the Company’s controlled entities requires
consideration of a number of factors. These factors include the currencies that primarily influence
their sales and costs and the economic environment in which the entities operate.
Key judgements – other
Other areas of judgement are in the determination of oil reserves, rehabilitation provisions,
capitalisation of exploration and evaluation costs, determination of areas of interest, and the units of
production method of depreciation.
3. Significant accounting policies
The accounting policies set out below have been applied consistently to all periods presented in the
consolidated financial report. The accounting policies have been applied consistently by all entities
in the Group. Certain comparative amounts have been reclassified to conform to the current year’s
presentation.
(a) Basis of consolidation
Controlled entities
The consolidated financial report comprises the financial statements of the Company and its controlled
entities. A controlled entity is any entity controlled by the Company whereby the Company has the power
to control the financial and operating policies of an entity so as to obtain benefits from its activities. All
inter-company balances and transactions between entities in the group, including any unrealised profits
or losses, have been eliminated on consolidation. Accounting policies of controlled entities have been
changed where necessary to ensure consistency with those applied by the Company.
Where controlled entities enter or leave the group during the year, their operating results are included
or excluded from the date control was obtained or until the date control ceased. Investments in
controlled entities are carried at cost in the Company’s financial statements.
Joint Operations
The Group’s shares of the assets, liabilities, revenue and expenses of joint operations have been
included in the appropriate line items of the consolidated financial statements. Details of the Group’s
interests are provided in Note 18.
Carnarvon Petroleum Limited
37
Notes to the Financial Statements
For the year ended 30 June 2014
For personal use only
3. Significant accounting policies (continued)
38
(b) Income tax and special remuneratory benefit
Income tax (current tax & deferred tax)
The charge for current income tax expense is based on the result for the year adjusted for any
non-assessable or disallowed items. It is calculated using tax rates that have been enacted or are
substantively enacted by balance sheet date.
Deferred tax is accounted for using the liability method in respect of temporary differences arising
between the tax bases of assets and liabilities and their carrying amounts in the financial statements.
No deferred income tax will be recognised from the initial recognition of an asset or liability, excluding
a business combination, where there is no effect on accounting or taxable profit or loss.
Deferred tax is calculated at the tax rates that are expected to apply to the period when the asset is
realised or liability is settled. Deferred tax is recognised in the income statement except where it relates
to items recognised directly in equity, in which case it is recognised in equity. Deferred income tax assets
are recognised for deductible temporary differences and unused tax losses only if it is probable that
future taxable amounts will be available to utilise those temporary differences and tax losses. Deferred tax
assets and liabilities are offset when they relate to income taxes levied by the same taxation authority and
the company / group intends to settle its current tax assets and liabilities on a net basis.
The amount of benefits brought to account or which may be realised in the future is based on the
assumption that no adverse change will occur in income taxation legislation and the anticipation
that the economic entity will derive sufficient future assessable income to enable the benefit to be
realised and comply with the conditions of deductibility imposed by the law. The carrying amount of
deferred tax assets is reviewed at each balance date and only recognised to the extent that sufficient
future assessable income is expected to be obtained against which the benefits of the deferred tax
assets can be utilized.
Special remuneratory benefit
The Group’s Phetchabun Basin Joint Venture is subject to a special remuneratory benefit (“SRB”) tax
on profits, at sliding scale rates (0% - 75% per concession).
The SRB, which is tax deductible in the calculation of Thai income taxes, involves a detailed calculation
done on a concession by concession basis. The basis of the calculation is petroleum profits, adjusted
for capital spent, being subjected to a sliding scale SRB rate such that profits are not taxed until all
capital has been recovered. The sliding scale rate is principally driven by production and pricing but
is subject to other adjustments such as changes in Thailand’s consumer price index, wholesale price
index, cumulative metres drilled on the concession, and, for certain concessions, changes in the
exchange rate between the Thai Baht and the USD. The SRB calculation is performed quarterly for each
concession at the calculated annual rate at the end of each quarter.
The SRB is considered, for accounting purposes, to be a tax on income.
Tax consolidation
Carnarvon Petroleum Limited and its wholly-owned Australian-resident controlled entities formed a
tax-consolidated group with effect from 1 July 2003 and are therefore taxed as a single entity from
that date. Carnarvon Petroleum Limited is the head entity of the tax-consolidated group. In future
periods the members of the group will, if required, enter into a tax sharing agreement whereby each
company in the group contributes to the income tax payable in proportion to their contribution to the
net profit before tax of the tax consolidated group.
2014 Annual Report
Notes to the Financial Statements
For the year ended 30 June 2014
For personal use only
3. Significant accounting policies (continued)
(c) Property, plant and equipment
Recognition and measurement
All property, plant and equipment is stated at cost less accumulated depreciation and impairment
losses. The cost of an item also includes the initial estimate of the costs of dismantling and removing
an item and restoring the site on which it is located. Such amounts are determined based on
current costs.
Subsequent costs are included in the asset’s carrying amount or recognised as a separate asset, as
appropriate, only when it is probable that future economic benefits associated with the item will flow
to the group and the cost of the item can be measured reliably. All other repairs and maintenance are
charged to the income statement during the financial period in which they are incurred.
Impairment
The carrying amount of property, plant and equipment is reviewed at each balance date to determine
whether there are any objective indicators of impairment that may indicate the carrying values may
not be recoverable in whole or in part. Impairment testing is carried out in accordance with Note 3(f).
Where an asset does not generate cash flows that are largely independent it is assigned to a cash
generating unit and the recoverable amount test applied to the cash generating unit as a whole.
If the carrying value of the asset is determined to be in excess of its recoverable amount, the asset or
cash generating unit is written down to its recoverable amount.
Depreciation
Depreciation on property, plant and equipment is calculated on a straight-line basis over expected
useful life to the economic entity commencing from the time the asset is held ready for use. The
major depreciation rates used for all classes of depreciable assets are:
Property, plant and equipment:
10% to 33%
The assets’ residual values and useful lives are reviewed, and adjusted if appropriate, at least annually.
An asset’s carrying amount is written down immediately to its recoverable amount if the asset’s
carrying amount is greater than its estimated recoverable amount.
Gains and losses on disposals are determined by comparing proceeds with the carrying amount.
These gains and losses are included in the income statement.
(d) Oil and gas assets
Oil and gas assets include costs transferred from exploration and evaluation once technical feasibility
and commercial viability of an area of interest are demonstrable, together with subsequent costs to
develop the asset to the production phase.
Where the directors decide that specific costs will not be recovered from future development, those
costs are charged to the income statement during the financial period in which the decision is made.
Amortisation of oil and gas assets is calculated on a unit of production basis so as to write off costs,
including an element of future costs, in proportion to the depletion of the estimated recoverable
reserves which are expected to be recovered by the expiry of the production licenses.
Carnarvon Petroleum Limited
39
Notes to the Financial Statements
For the year ended 30 June 2014
For personal use only
3. Significant accounting policies (continued)
(e) Exploration and evaluation
Exploration and evaluation expenditure incurred is accumulated in respect of each identifiable area
of interest. These costs are only carried forward to the extent that the Group’s rights of tenure to the
area are current and that the costs are expected to be recouped through the successful development
of the area, or where activities in the area have not yet reached a stage that permits reasonable
assessment of the existence of economically recoverable reserves.
Each area of interest is assessed for impairment to determine the appropriateness of continuing to
carry forward costs in relation to that area of interest. Impairment testing is carried out in accordance
with Note 3(f).
Accumulated costs in relation to an abandoned area are written off in full against profit in the year in
which the decision to abandon the area is made.
Once the technical feasibility and commercial viability of the extraction of mineral resources in an area
of interest are demonstrable, exploration and evaluation costs attributable to that area of interest are
first tested for impairment and then reclassified from exploration and evaluation to oil and gas assets.
The Company does not record any expenditure made by the farmee on its account. It also does not
recognise any gain or loss on its exploration and evaluation farm-out arrangements but redesignates any
costs previously capitalised in relation to the whole interest as relating to the partial interest retained. Any
cash consideration received directly from the farmee is credited against costs previously capitalised in
relation to the whole interest with any excess accounted for by the farmor as a gain on disposal.
(f) Recoverable amount of assets and impairment testing
Assets that have an indefinite useful life are not subject to depreciation and are tested annually for
impairment by estimating their recoverable amount.
Assets that are subject to depreciation are reviewed annually to determine whether there is any indication
of impairment. Where such an indicator exists, a formal assessment of recoverable amount is then made.
Where this is less than carrying amount, the asset is written down to its recoverable amount.
Recoverable amount is the greater of fair value less costs to sell and value in use. Value in use is
the present value of the future cash flows expected to be derived from the asset or cash generating
unit. In estimating value in use, a pre-tax discount rate is used which reflects the current market
assessments of the time value of money and the risks specific to the asset. Any resulting impairment
loss is recognised immediately in the income statement.
For the purposes of impairment testing assets are grouped together into the smallest group of assets
that generates cash inflows from continuing use that are largely independent of the cash inflows of
other assets or groups of assets.
(g) Provisions
Provisions are recognised when the Group has a legal or constructive obligation, as a result of past
events, for which it is probable that an outflow of economic benefits will result and that outflow can
be reliably measured. Provisions are determined by discounting the expected future cash flows at a
pre-tax discount rate that reflects current market assessments of the time value of money and, where
appropriate, the risks specific to the liability.
Restoration costs
There are no restoration provisions required in respect of the Group’s activities under current
Thai Legislation.
40
2014 Annual Report
Notes to the Financial Statements
For the year ended 30 June 2014
For personal use only
3. Significant accounting policies (continued)
(h) Financial instruments
Recognition and initial measurement
Financial assets and financial liabilities are recognised when the entity becomes a party to the contractual
provisions to the instrument. For financial assets, this is equivalent to the date that the company commits
itself to either the purchase or sale of the asset (i.e. trade date accounting is adopted).
Financial instruments are initially measured at fair value plus transaction costs, except where the
instrument is classified “at fair value through profit or loss”, in which case transaction costs are
expensed to profit or loss immediately.
Classification and subsequent measurement
Finance instruments are subsequently measured at fair value, amortised cost using the effective
interest rate method, or cost. Amortised cost is the amount at which the financial asset or financial
liability is measured at initial recognition less principal repayments and any reduction for impairment,
and adjusted for any cumulative amortisation of the difference between that initial amount and the
maturity amount calculated using the effective interest method.
The effective interest method is used to allocate interest income or interest expense over the relevant
period and is equivalent to the rate that discounts estimated future cash payments or receipts
(including fees, transaction costs and other premiums or discounts) through the expected life (or when
this cannot be reliably predicted, the contractual term) of the financial instrument to the net carrying
amount of the financial asset or financial liability. Revisions to expected future net cash flows will
necessitate an adjustment to the carrying value with a consequential recognition of an income or
expense item in profit or loss.
Fair value is determined based on current bid prices for all quoted investments. Valuation techniques
are applied to determine the fair value for all unlisted securities, including recent arm’s length
transactions, reference to similar instruments and option pricing models.
The Group does not designate any interests in subsidiaries, associates or joint venture entities as being
subject to the requirements of Accounting Standards specifically applicable to financial instruments.
(i)
(ii)
(iii)
Loans and receivables
Loans and receivables are non-derivative financial assets with fixed or determinable payments
that are not quoted in an active market and are subsequently measured at amortised cost.
Loans and receivables are included in current assets, where they are expected to mature within
12 months after the end of the reporting period.
Available-for-sale financial assets
Available-for-sale financial assets are non-derivative financial assets that are either not
suitable to be classified into other categories of financial assets due to their nature, or they are
designated as such by management. They comprise investments in the equity of other entities
where there is neither a fixed maturity nor fixed or determinable payments.
They are subsequently measured using the effective interest method which is recognised in
profit or loss. A fair value gain or loss of the underlying financial asset shall be recognised in other
comprehensive income (except for impairment losses and foreign exchange gains or losses). When
the financial asset is derecognised, the cumulative gain or loss pertaining to that asset previously
recognised in other comprehensive income is reclassified into profit or loss. Available-for-sale financial
assets are included in non-current assets where they are expected to be sold within 12 months after
the end of the reporting period. All other financial assets are classified as current assets.
Financial liabilities
Non-derivative financial liabilities (excluding financial guarantees) are subsequently measured at
amortised cost.
Carnarvon Petroleum Limited
41
Notes to the Financial Statements
For the year ended 30 June 2014
For personal use only
3. Significant accounting policies (continued)
(i) Segment reporting
The Group reports one segment, oil and gas exploration, development and production, to the chief
operating decision maker, being the board of Carnarvon Petroleum Limited, in assessing performance
and determining the allocation of resources. The financial information presented in the statement of
cash flows is the same basis as that presented to chief operating decision maker.
Unless otherwise stated, all amounts reported to the chief operating decision maker are determined
in accordance with accounting policies that are consistent to those adopted in the annual financial
statements of the Group.
(j) Foreign currency
Functional and presentation currency
The functional currency of each of the group’s entities is measured using the currency of the primary
economic environment in which that entity operates (the “functional” currency). The consolidated
financial statements are presented in Australian dollars which is the Company’s functional and
presentation currency.
Transactions and balances
Foreign currency transactions are translated into functional currency using the exchange rates
prevailing at the date of the transaction. Foreign currency monetary assets and liabilities are
translated at the exchange rate at balance date. Non-monetary items measured at historical cost
continue to be carried at the exchange rate at the date of the transaction.
Exchange differences arising on the translation of monetary items are recognised in the income
statement, except where deferred in equity as a qualifying cash flow or net investment hedge.
Foreign operations
The financial performance and position of foreign operations whose functional currency is different
from the Group’s presentation currency are translated as follows:
• assets and liabilities are translated at exchange rates prevailing at balance date
• income and expenses are translated at average exchange rates for the period
Exchange differences arising on translation of foreign operations are transferred directly to the
group’s foreign currency translation reserve as a separate component of equity. These differences are
recognised in the income statement upon disposal of the foreign operation.
(k) Leases
Leases are classified at their inception as either operating or finance leases based on the economic
substance of the agreement so as to reflect the risks and benefits incidental to ownership.
Operating leases
A lease where a significant portion of the risks and rewards of ownership are retained by the lessor
are classified as operating leases. Payments in relation to operating leases are charged to the income
statement on a straight-line basis over the period of the lease.
(l) Share capital
Incremental costs directly attributable to an equity transaction are shown as a deduction from equity,
net of any recognised income tax benefit.
42
2014 Annual Report
Notes to the Financial Statements
For the year ended 30 June 2014
For personal use only
3. Significant accounting policies (continued)
(m) Inventories
Inventories are stated at the lower of cost and net realisable value. Net realisable value is the
estimated selling price in the ordinary course of business less any estimated selling costs.
Cost includes those costs incurred in bringing each component of inventory to its present location and
condition.
(n) Employee benefits
Wages and salaries, annual leave
Provision is made for the Group’s liability for employee benefits arising from services rendered by
employees to balance date. Employee benefits that are expected to be settled within one year have
been measured at the amounts expected to be paid when the liability is settled, plus related on-costs.
Share based payments – Employee Share Plan
Share based compensation has been provided to eligible persons via the Carnarvon Employee Share
Plan (“ESP”), financed by means of interest-free limited recourse loans. Under AASB 2 “Share-based
Payments”, the ESP shares are deemed to be equity settled, share-based remuneration.
For limited recourse loans issued to eligible persons on or after 1 January 2005, the Group is required to
recognise within the income statement a remuneration expense measured at the fair value of the shares
inherent in the issue to the eligible person, with a corresponding increase to a share-based payments
reserve in equity. The fair value is measured at grant date and recognised when the eligible person become
unconditionally entitled to the shares, effectively on grant. A loan receivable is not recognised.
The fair value at grant date is determined using a pricing model that factors in the share price at grant
date, the expected price volatility of the underlying share, the expected dividend yield, and the risk free
rate for the assumed term of the plan. Upon repayment of the ESP loans, the balance of the sharebased payments reserve relating to the loan repaid is transferred to issued capital.
(o) Earnings per share
The Group presents basic and diluted earnings per share (“EPS”) for its ordinary shares.
Basic EPS is calculated by dividing the profit attributable to equity holders of the Company by the
weighted number of shares outstanding during the period.
Diluted EPS is determined by adjusting the profit or loss attributable to ordinary shareholders and
the weighted average number of ordinary shares outstanding for the effects of all potential ordinary
shares, which comprise share options issued.
(p) Cash and cash equivalents
Cash and cash equivalents comprise cash on hand, deposits held at call with banks, and other shortterm highly liquid investments.
Carnarvon Petroleum Limited
43
Notes to the Financial Statements
For the year ended 30 June 2014
For personal use only
3. Significant accounting policies (continued)
44
(q) Revenue
Revenue from the sale of goods is measured at the fair value of the consideration received or
receivable.
Revenue is recognised when the significant risks and rewards of ownership have been transferred
to the buyer, recovery of the consideration is probable, and the amount of revenue can be
measured reliably. For the sale of oil the transfer of risks and rewards occurs on delivery of oil to
the refinery.
(r) Goods and services tax
Revenues, expenses and assets are recognised net of the amount of goods and services tax
(“GST”), except where the amount of GST incurred is not recoverable from the Australian Tax Office.
In these circumstances the GST is recognised as part of the cost of acquisition of the asset or as
part of the expense. Receivables and payables in the statement of financial position are shown
inclusive of GST.
Cash flows are presented in the statement of cash flows on a gross basis, except for the GST
component of investing and financing activities, which are disclosed as operating cash flows.
(s) Finance income and expenses
Interest revenue on funds invested is recognised as it accrues, using the effective interest rate
method.
Finance expenses comprise interest expense on borrowings and the unwinding of the discount on
provisions.
(t) Royalties
Royalties are treated as taxation arrangements when they have the characteristics of a tax. This
is considered to be the case when they are imposed under government authority and the amount
payable is calculated by reference to revenue derived (net of any allowable deductions) after
adjustment for items comprising temporary differences. For such arrangements, current and
deferred tax is provided on the same basis as described above for other forms of taxation.
Obligations arising from royalty arrangements that do not satisfy these criteria are recognised as
current provisions and included in expenses.
u) Comparative figures
When required by Accounting Standards, comparative figures have been adjusted to conform to
changes in presentation for the current financial year.
2014 Annual Report
Notes to the Financial Statements
For the year ended 30 June 2014
For personal use only
3. Significant accounting policies (continued)
(v) New Accounting Standards for Application in Future Periods
Australian Accounting Standards and Interpretations that have recently been issued or amended but
are not yet mandatory, have not been early adopted by the consolidated entity for the annual reporting
period ended 30 June 2014. The consolidated entity’s assessment of the impact of these new or amended
Accounting Standards and Interpretations, most relevant to the consolidated entity, are set out below.
AASB 9 Financial Instruments and its consequential amendments
This standard and its consequential amendments are applicable to annual reporting periods beginning
on or after 1 January 2017 and completes phases I and III of the IASB’s project to replace IAS 39
(AASB 139) ‘Financial Instruments: Recognition and Measurement’. This standard introduces new
classification and measurement models for financial assets, using a single approach to determine
whether a financial asset is measured at amortised cost or fair value. The accounting for financial
liabilities continues to be classified and measured in accordance with AASB 139, with one exception,
being that the portion of a change of fair value relating to the entity’s own credit risk is to be
presented in other comprehensive income unless it would create an accounting mismatch. Chapter
6 ‘Hedge Accounting’ supersedes the general hedge accounting requirements in AASB 139 and
provides a new simpler approach to hedge accounting that is intended to more closely align with risk
management activities undertaken by entities when hedging financial and non-financial risks. The
consolidated entity will adopt this standard and the amendments from 1 July 2017 but the impact of
its adoption is yet to be assessed by the consolidated entity.
AASB 2012-3 Amendments to Australian Accounting Standards - Offsetting Financial Assets and
Financial Liabilities
The amendments are applicable to annual reporting periods beginning on or after 1 January 2014. The
amendments add application guidance to address inconsistencies in the application of the offsetting
criteria in AASB 132 ‘Financial Instruments: Presentation’, by clarifying the meaning of ‘currently has
a legally enforceable right of set-off’; and clarifies that some gross settlement systems may be
considered to be equivalent to net settlement. The adoption of the amendments from 1 July 2014 will
not have a material impact on the consolidated entity.
AASB 2013-3 Amendments to AASB 136 - Recoverable Amount Disclosures for Non-Financial Assets
These amendments are applicable to annual reporting periods beginning on or after 1 January 2014.
The disclosure requirements of AASB 136 ‘Impairment of Assets’ have been enhanced to require
additional information about the fair value measurement when the recoverable amount of impaired
assets is based on fair value less costs of disposals. Additionally, if measured using a present value
technique, the discount rate is required to be disclosed. The adoption of these amendments from 1
July 2014 may increase the disclosures by the consolidated entity.
AASB 2013-4 Amendments to Australian Accounting Standards - Novation of Derivatives and
Continuation of Hedge Accounting
These amendments are applicable to annual reporting periods beginning on or after 1 January 2014
and amends AASB 139 ‘Financial Instruments: Recognition and Measurement’ to permit continuation of
hedge accounting in circumstances where a derivative (designated as hedging instrument) is novated
from one counter party to a central counterparty as a consequence of laws or regulations. The adoption
of these amendments from 1 July 2014 will not have a material impact on the consolidated entity.
AASB 2013-5 Amendments to Australian Accounting Standards - Investment Entities
These amendments are applicable to annual reporting periods beginning on or after 1 January 2014
and allow entities that meet the definition of an ‘investment entity’ to account for their investments
at fair value through profit or loss. An investment entity is not required to consolidate investments in
entities it controls, or apply AASB 3 ‘Business Combinations’ when it obtains control of another entity,
nor is it required to equity account or proportionately consolidate associates and joint ventures if it
meets the criteria for exemption in the standard. The adoption of these amendments from 1 July 2014
will have no impact on the consolidated entity.
Carnarvon Petroleum Limited
45
Notes to the Financial Statements
For the year ended 30 June 2014
For personal use only
3. Significant accounting policies (continued)
46
(v) New Accounting Standards for Application in Future Periods (continued)
Annual Improvements to IFRSs 2010-2012 Cycle
These amendments are applicable to annual reporting periods beginning on or after 1 July 2014
and affects several Accounting Standards as follows: Amends the definition of ‘vesting conditions’
and ‘market condition’ and adds definitions for ‘performance condition’ and ‘service condition’ in
AASB 2 ‘Share-based Payment’; Amends AASB 3 ‘Business Combinations’ to clarify that contingent
consideration that is classified as an asset or liability shall be measured at fair value at each reporting
date; Amends AASB 8 ‘Operating Segments’ to require entities to disclose the judgements made by
management in applying the aggregation criteria; Clarifies that AASB 8 only requires a reconciliation
of the total reportable segments assets to the entity’s assets, if the segment assets are reported
regularly; Clarifies that the issuance of AASB 13 ‘Fair Value Measurement’ and the amending of AASB
139 ‘Financial Instruments: Recognition and Measurement’ and AASB 9 ‘Financial Instruments’ did not
remove the ability to measure short-term receivables and payables with no stated interest rate at
their invoice amount, if the effect of discounting is immaterial; Clarifies that in AASB 116 ‘Property,
Plant and Equipment’ and AASB 138 ‘Intangible Assets’, when an asset is revalued the gross carrying
amount is adjusted in a manner that is consistent with the revaluation of the carrying amount
(i.e. proportional restatement of accumulated amortisation); and Amends AASB 124 ‘Related Party
Disclosures’ to clarify that an entity providing key management personnel services to the reporting
entity or to the parent of the reporting entity is a ‘related party’ of the reporting entity. The adoption of
these amendments from 1 July 2014 will not have a material impact on the consolidated entity.
Annual Improvements to IFRSs 2011-2013 Cycle
These amendments are applicable to annual reporting periods beginning on or after 1 July 2014 and
affects four Accounting Standards as follows: Clarifies the ‘meaning of effective IFRSs’ in AASB 1
‘First-time Adoption of Australian Accounting Standards’; Clarifies that AASB 3 ‘Business Combination’
excludes from its scope the accounting for the formation of a joint arrangement in the financial
statements of the joint arrangement itself; Clarifies that the scope of the portfolio exemption in
AASB 13 ‘Fair Value Measurement’ includes all contracts accounted for within the scope of AASB 139
‘Financial Instruments: Recognition and Measurement’ or AASB 9 ‘Financial Instruments’, regardless
of whether they meet the definitions of financial assets or financial liabilities as defined in AASB 132
‘Financial Instruments: Presentation’; and Clarifies that determining whether a specific transaction
meets the definition of both a business combination as defined in AASB 3 ‘Business Combinations’ and
investment property as defined in AASB 140 ‘Investment Property’ requires the separate application of
both standards independently of each other. The adoption of these amendments from 1 July 2014 will
not have a material impact on the consolidated entity.
2014 Annual Report
Notes to the Financial Statements
For the year ended 30 June 2014
For personal use only
Consolidated
2014
$000
2013
$000
236
-
188
599
4. Other income
Finance income on bank deposits
Net gain on asset transactions
Research and development refundable offset
714
-
Interest on financial assets
624
-
1,574
787
35,681
20,856
-
5. (Loss) on sale of joint operations
Cash consideration
Deferred consideration
Less transaction costs
(1,654)
54,883
-
Less asset and liability adjustments:
Cash and cash equivalents
(2,954)
-
Trade and other receivables
(2,419)
-
Inventories
(2,776)
-
(211)
-
(230)
-
(50,440)
-
Other assets
Property, plant and equipment
Oil and gas assets
Trade and other payables
Current tax liability
1,852
-
(92)
-
(2,387)
-
6. Cost of sales
Production expenses
Royalty and excise
(3,787)
(1,297)
(4,426)
(1,050)
(627)
(486)
(5,613)
(5,140)
(1,818)
(1,905)
(13,142)
(13,007)
Depreciation – property, plant and equipment
Rental premises – operating leases
(300)
(175)
(310)
(163)
Defined contribution – superannuation expense
(156)
(143)
(143)
(138)
Transportation
Depreciation - development costs and producing
assets
Selling, general and administration
7. Other expenses
8. Auditors’ remuneration
Audit and review services:
Auditors of the Company
Carnarvon Petroleum Limited
47
Notes to the Financial Statements
For the year ended 30 June 2014
For personal use only
9. Earnings per share
48
The calculation of basic and diluted earnings per share was based on a weighted average number of
shares calculated as follows:
2014
2013
Number of shares
Issued ordinary shares at 1 July
935,383,501
693,370,634
Effect of shares issued
 30,233,337
168,989,083
Weighted average number of ordinary shares 30 June (basic)
965,616,838
862,359,717
Effect of share options on issue
 28,180,943
-
Weighted average number of ordinary shares 30 June (diluted)
993,797,781
862,359,717
2014
$
2013
$
Profit / (loss) used in calculating basic and diluted earnings per
share from continuing operations
 16,787,000
(8,385,000)
2014 Annual Report
Notes to the Financial Statements
For the year ended 30 June 2014
For personal use only
Consolidated
2014
$000
2013
$000
10.Taxes
(a) Income tax expense
Numerical reconciliation between pre-tax profit
and income tax expense:
Prima facie income tax expense on pre-tax profit
at 30% (2013: 30%)
(222)
446
Tax effect of:
Special remuneratory benefit
Effect of higher overseas tax rate
Effect of foreign exchange
Non-deductible expenditure
Prior year temporary differences recognised
Effect of deferred tax on disposal
Current year tax benefit not brought to account
Income tax expense on pre tax profit
Current income tax
Deferred tax
(b) Current tax liability
-
-
1,965
1,039
(3,733)
6,200
1,967
(275)
(21,509)
635
(356)
-
2,131
1,909
(19,676)
9,873
1,667
(261)
(21,343)
10,134
(19,676)
9,873
235
846
Tax Consolidation
Effective 1 July 2003, for the purposes of Australian income taxation, Carnarvon and its
100%-owned Australian controlled entities formed a tax consolidated group. The head entity of the
tax consolidated group is Carnarvon.
The impact of consolidating for tax purposes is that Carnarvon’s Australian controlled entities are
treated as divisions of Carnarvon rather than as separate entities for tax purposes. The members
of the group will, if required, enter into a tax sharing arrangement in order to allocate group tax
related liabilities to contributing members on a reasonable basis. The agreement will provide for
the allocation of income tax liabilities between entities should the head entity default on its tax
payment obligations.
Income tax expense has not been accrued on the profits generated by the Thailand joint operation
as under Australian tax law, such profits attributable to the branch are taxed in Thailand and are
non-assessable in Australia.
Carnarvon Petroleum Limited
49
Notes to the Financial Statements
For the year ended 30 June 2014
For personal use only
Consolidated
11. Trade and other receivables
Current
Trade and other receivables
Cash held as security
2013
$000
3,719
5,028
218
54
3,937
5,082
The Group’s exposure to credit and currency risks is disclosed in Note 34.
Consolidated
12. Deferred consideration asset
50
2014
$000
Deferred consideration
2014
$000
2013
$000
21,480
-
-
-
Additions
20,856
-
Disposals
-
-
Effective interest
624
-
Closing fair value
21,480
-
Reconciliation
Reconciliation of the fair values at the beginning and
end of the current financial year are set out below:
Opening fair value
Carnarvon completed the sale of half of its 40% interest in its producing Concessions in Thailand
during the year. This resulted in the receipt of US$33,000,000 cash and US$32,000,000 in deferred
consideration based on 12% of the acquirer’s share of revenue in the Concessions.The $20,856,000
AUD deferred consideration asset addition relates to the present value of $32,000,000 USD of
deferred consideration receivable to Carnarvon. This is recognised in accordance with AASB 139 as an
available-for-sale financial asset.
Refer to note 35 for further information on fair value measurement.
2014 Annual Report
Notes to the Financial Statements
For the year ended 30 June 2014
For personal use only
Consolidated
2014
$000
2013
$000
892
552
Additions
38
206
Disposals
-
13. Property, plant and equipment
Plant and equipment
Cost:
Balance at beginning of financial year
Effect of sale
(8)
(463)
-
Effects of movements in foreign exchange
(44)
142
Balance at end of financial year
423
892
415
279
Depreciation and impairment losses:
Balance at beginning of financial year
Effect of sale
(235)
-
Depreciation charge for year
133
136
Balance at end of financial year
313
415
Carrying amount opening
477
273
Carrying amount closing
110
477
1,122
823
Additions
369
222
Effect of sale
(413)
-
(27)
77
Fixtures and fittings
Cost:
Balance at beginning of financial year
Effects of movements in foreign exchange
Balance at end of financial year
1,051
1,122
Balance at beginning of financial year
899
695
Effect of sale
(431)
Depreciation charge for year
203
204
Balance at end of financial year
671
899
Carrying amount opening
223
181
Carrying amount closing
380
223
Depreciation and impairment losses:
Carnarvon Petroleum Limited
-
51
Notes to the Financial Statements
For the year ended 30 June 2014
For personal use only
Consolidated
13.Property, plant and equipment
(continued)
52
2014
$000
2013
$000
159
139
19
-
(88)
-
(6)
20
Land and buildings
Cost:
Balance at beginning of financial year
Additions
Effect of sale
Effects of movements in foreign exchange
Balance at end of financial year
84
159
Balance at beginning of financial year
94
71
Effect of sale
(59)
-
Depreciation:
Depreciation charge for year
28
23
Balance at end of financial year
63
94
Carrying amount opening
65
68
Carrying amount closing
21
65
2,226
1,567
Additions
425
428
Disposals
-
Total
Cost:
Balance at beginning of financial year
Effect of sale
Effects of movements in foreign exchange
Balance at end of financial year
(8)
(964)
-
(79)
239
1,608
2,226
1,461
1,098
Depreciation and impairment losses:
Balance at beginning of financial year
Effect of sale
(722)
Depreciation charge for year
365
Balance at end of financial year
(1,104)
363
1,461
Carrying amount opening
765
469
Carrying amount closing
504
765
2014 Annual Report
Notes to the Financial Statements
For the year ended 30 June 2014
For personal use only
Consolidated
2014
$000
2013
$000
2,728
6,963
428
251
Balance at beginning of financial year
3,404
7,776
Additions
3,774
1,213
14.Inventories
Current
Consumables
15. Other assets
Current
Deposits and prepayments
16.Exploration and evaluation
expenditure
Cost:
Exploration back costs recovered
-
(4,480)
Exploration expenditure written off
(4,878)
(1,105)
Balance at end of financial year
2,300
3,404
The exploration expenditure written off during the financial year ended 30 June 2014 of $4,878,000 was in
relation to $470,000 of exploration expenses incurred in the WA-443-P and WA-399-P Permits in Western
Australia in addition to $3,205,000 of exploration expenses incurred, a $991,000 provisional work program
obligation and a $212,000 community commitments provision in the L52/50 and L53/50 Concessions in
Thailand as the Company has relinquished these Concessions to the relevant authorities. The obligation and
provision commitments have generated a $1,203,000 exploration provision owing by the Company at year end.
17. Oil and gas assets
Cost:
Balance at beginning of financial year
Additions
144,064
113,730
9,639
13,196
Effect of Sale
(70,364)
-
Effects of movements in foreign exchange
(10,174)
17,138
Balance at end of financial year
73,165
144,064
35,690
30,825
5,391
4,865
Depreciation and impairment losses:
Balance at beginning of financial year
Depreciation charge for year
Effect of Sale
Balance at end of financial year
(19,924)
-
21,157
35,690
Carrying amount opening
108,374
82,905
Carrying amount closing
52,008
108,374
Carnarvon Petroleum Limited
53
Notes to the Financial Statements
For the year ended 30 June 2014
For personal use only
18. Joint operations
54
The Group has the following interests in joint operation assets:
Joint operation
Principal activities
Thailand
Ownership interest
%
2014
2013
Phetchabun Basin Concession,
Exploration Blocks L44/43 and L33/43
3/2546/60 and 5/2546/62 Concessions
Exploration, development and
production of hydrocarbons
 20%
 40%
Exploration Blocks L52/50 and L53/50
3/2553/105 concession
Exploration for hydrocarbons
100%
100%
WA-435-P, WA-437-P, Roebuck Basin
Exploration for hydrocarbons
 20%
 20%
WA-436-P, WA 438-P, Roebuck Basin
Exploration for hydrocarbons
 50%
 50%
WA-399-P, Carnarvon Basin
Exploration for hydrocarbons
 13%
 13%
WA-443-P, Roebuck Basin
Exploration for hydrocarbons
100%
100%
EP-490, EP-491, TP/27 Barrow sub Basin
Exploration for hydrocarbons
100%
  0%
Western Australia
The Company has accounted for its interest in the above Concessions as Joint Operations even
though some of the Company’s interests do not require the unanimous consent of all of the parties
sharing control to make decisions about the relevant activities. These interests are still treated as
Joint Operations because the Company’s investment in these Concessions gives it rights to its share
of the assets, and obligations for its share of the liabilities. Therefore the Company has recognised its
interests in the assets, liabilities, revenues and expenses for the above arrangements.
2014 Annual Report
Notes to the Financial Statements
For the year ended 30 June 2014
For personal use only
18. Joint operations (continued)
Summary financial information for joint venture assets, as included in the consolidated statement of
financial position and income statement, is shown below:
2014
2013
$000
$000
Current assets
Cash and cash equivalents
5,880
5,087
Trade and other receivables
3,535
4,972
Inventories
2,728
6,963
174
174
12,317
17,196
Property, plant and equipment
218
707
Exploration and evaluation
691
3,132
Oil and gas assets
52,008
108,374
Total non-current assets
52,917
112,213
Total assets
65,234
129,409
2,884
2,568
235
846
1,203
-
4,323
3,414
21,902
43,245
Total non-current liabilities
21,902
43,245
Total liabilities
26,225
46,659
Net assets
39,009
82,750
Other assets
Total current assets
Non-current assets
Current liabilities
Trade and other payables
Current tax
Provisions
Total current liabilities
Non-current liabilities
Deferred tax
Income
23,318
18,351
Expenses
(15,159)
(23,026)
Deferred tax reversal
21,343
Net profit after tax
29,502
(4,675)
Capital commitments and contingent liabilities for the joint ventures are disclosed in Notes 24 and 25
respectively.
Carnarvon Petroleum Limited
55
Notes to the Financial Statements
For the year ended 30 June 2014
For personal use only
Consolidated
2014
$000
2013
$000
Trade payables
1,574
533
Non-trade payables and accrued expenses
2,942
2,633
4,516
3,166
19. Trade and other payables
Current
The Group’s exposure to currency and liquidity risk related to trade and other payables is disclosed in
Note 34
20.Provisions
Provision for restoration costs
There are no restoration provisions required in respect of the Group’s activities under current Thai
Legislation.
Provision for drilling commitments
The Company recognised a provision of $1,203,000 in relation to drilling commitments to the
Government of Thailand for the L52/50 and L53/50 exploration Concessions in which the Company did
not complete prior to relinquishing these Concessions.
21. Deferred tax liabilities
Recognised deferred tax assets and liabilities
The net deferred tax liability is attributable to the
following:
Oil and gas assets
Tax value of losses carry forward - Thailand
Net deferred tax liability
22,292
(390)
21,902
44,359
(1,223)
43,245
The movement in the deferred tax liability during the reporting period has all been recognised in the
income statement.
Unrecognised deferred tax assets and liabilities
Deferred tax assets have not been recognised in respect of the following items:
Australian tax losses
7,103
6,362
The tax losses do not expire under current tax legislation. Deferred tax assets have not been
recognised in respect of these items because it is not probable that future taxable profit will be
available against which the Group can utilise the benefits. As explained in note 10(a), income tax is not
payable in Australia on the profits generated by the Thailand joint operation as under Australian tax
law, such profits attributable to the branch are taxed in Thailand and are non-assessable in Australia.
56
2014 Annual Report
Notes to the Financial Statements
For the year ended 30 June 2014
22. Capital and reserves
For personal use only
Company
2014
2013
Number of shares
Issued capital
Balance at beginning of financial year
Issued for cash
Employee Share Plan issues
Employee Share Plan cancellations
Balance at end of financial year
935,383,501
693,370,634
48,519,077
243,887,066
4,159,399
600,000
(885,000)
987,176,977
(2,474,199)
935,383,501
Company
2014
$000
2013
$000
87,573
68,536
137
256
2,503
18,781
90,213
87,573
Issued capital
Balance at beginning of financial year
Transfer from share based payment reserve*
Net proceeds from capital raising activities
Balance at end of financial year
* This represents the fair value of Employee Share Plan shares transferred from the share based
payment reserve to issued capital upon cancellation.
Ordinary shares have the right to one vote per share at meetings of the Company, to receive dividends
as declared and, in the event of a winding-up of the Company, to participate in the proceeds from the
sale of all surplus assets in proportion to the number of, and amounts paid up on, shares held.
Translation reserve
Movements in the translation reserve are set out in the Statement of Changes in Equity on page 33.
The translation reserve comprises all foreign exchange differences arising from the translation of
the financial statements of foreign operations where their functional currency is different to the
presentation currency of the reporting entity.
Share based payments reserve
Movements in the share based payments reserve are set out in the Statements of Changes in Equity
on page 33.
This reserve represents the fair value of shares issued under the Company’s ESP. This reserve is
reversed against issued capital when shares are issued on exercise of options issued under the
previous employee option plan and the loan is repaid or cancelled under the current ESP.
Carnarvon Petroleum Limited
57
Notes to the Financial Statements
For the year ended 30 June 2014
For personal use only
Consolidated
2014
$000
2013
$000
16,787
(8,385)
23.Reconciliation of cash flows
from operating activities
(a) Cash flows from operating activities
Profit (loss) for the year
Adjustments for:
Equity settled share based payment expense
Deferred tax expense
Depreciation
Foreign exchange gains
143
14
(21,343)
10,134
5,068
5,139
325
(1,498)
Exploration expenditure written off
4,878
1,105
Operating profit before changes in working capital
and provisions:
5,858
6,509
Changes in assets and liabilities:
(Increase) / decrease in trade and other receivables
(828)
(2,544)
(Increase) / decrease in inventories
957
(2,631)
(Increase) / decrease in other assets
(401)
Increase / (decrease) in trade and other payables
Increase / (decrease) in provisions and employee benefits
Net cash flows generated from operating activities
176
3,416
1,221
602
(1,444)
9,604
1,287
17,798
31,782
19,525
-
49,580
19,525
(b) Reconciliation of cash and cash equivalents
Cash at bank and at call
Cash on deposit
The Group’s exposure to interest rate risk and a sensitivity analysis for financial assets and liabilities is
disclosed in Note 34.
Restricted cash of $862,227 consolidated is included under trade and other receivables
(2013:$ 1,443,100 consolidated), see Notes 11 and 25.
Consolidated
2014
$000
2013
$000
232
542
309
1,987
24. Capital and other commitments
(a) Joint operation commitments
Share of capital commitments of joint operation assets:
Within one year
Capital commitments of the Group to joint operation assets:
Within one year
58
2014 Annual Report
Notes to the Financial Statements
For the year ended 30 June 2014
For personal use only
24. Capital and other commitments (continued)
(b) Exploration expenditure commitments
Due to the nature of the Group’s operations in exploring and evaluating areas of interest it is
necessary to incur expenditure in order to retain the Group’s present permit interests. Expenditure
commitments on exploration permits can be reduced by selective relinquishment of exploration
tenure, by the renegotiation of expenditure commitments, or by farming out portions of the Group’s
equity. Failure to meet Joint Operation cash requirements may result in a reduction in equity in that
particular Joint Operation.
Exploration expenditure commitments forecast but not provided for in the financial statements are as
follows:
Consolidated
2014
$000
2013
$000
Less than one year
1,205
3,120
Between one and five years
1,200
3,650
2,405
6,770
257
229
(c) Capital expenditure commitments
Data licence commitments
25.Contingencies
The directors are of the opinion that provisions are not required in respect of these matters as it is not
probable that a future sacrifice of economic benefits will be required or the amount is not capable of
reliable measurement.
Contingent liabilities considered remote
a) The Company has provided a cash bond of THB 19,654,800 (AUD$644,227) to the Department of
Mineral Fuels in Thailand in respect of its obligations for its 20% interest in the L44/43 and L33/43
Concessions in Thailand. The bond is secured by a cash deposit of THB 19,654,800 (AUD$644,227) held
with the joint operations partner’s Thai bank. The other partners of the joint operations have also
provided their remaining 80% shares of similar guarantees to the Department of Mineral Fuels.
The restricted cash held by the banks as security for these bonds and other guarantees total $862,227
(2013: $1,443,100) is classified under “trade and other receivables”.
b) In accordance with normal petroleum industry practice, the Group has entered into joint operations
and farmin agreements with other parties for the purpose of exploring and developing its petroleum
permit interests. If a party to a joint operation defaults and does not contribute its share of joint
operation obligations, then the other joint operators are liable to meet those obligations. In this event,
the interest in the permit held by the defaulting party may be redistributed to the remaining joint
operators.
Carnarvon Petroleum Limited
59
Notes to the Financial Statements
For the year ended 30 June 2014
For personal use only
Consolidated
2014
$000
2013
$000
244
279
Provision for long service leave
105
-
Total Employee benefits
349
279
26. Employee benefits
60
Current:
Liability for annual leave
Non-Current:
Share based payments - Employee Share Plan
Under the terms of the Carnarvon Employee Share Plan (“ESP”), as approved by shareholders, the
Company may, in its absolute discretion, make an offer of ordinary fully paid shares in the Company to
any Eligible Person, to be funded by a limited recourse interest free loan granted by the Company.
The issue price is determined by the directors and is not to be less than the weighted average market
price of the Company’s shares on the five trading days prior to the date of offer. Eligible Persons use
the above-mentioned loan to acquire plan shares.
The movements in the ESP during the financial year, including those held by Key Management
Personnel, were as follows:
Number of shares
Loan
Average loan per
share
Number of shares
Loan
Average loan per
share
1 July 2013
Issued
Cancelled
30 June 2014
21,365,000
4,159,399
885,000
24,639,399
4,173,894
359,396
325,334
4,207,956
$0.19
$0.09
$0.37
$0.17
1 July 2012
Issued
Cancelled
30 June 2013
23,239,199
600,000
2,474,199
21,365,000
4,718,316
54,000
598,422
4,173,894
$0.20
$0.09
$0.24
$0.19
2014 Annual Report
Notes to the Financial Statements
For the year ended 30 June 2014
For personal use only
26. Employee benefits (continued)
Shares issued under the ESP are accounted for in accordance with the AASB 2.
The fair value of shares issued under the ESP is measured by reference to their fair value using the
Black-Scholes model, as set out below.
Key
management
personnel
2014
Key
management
personnel
2013
Other
employees
2014
Other
employees
2013
Fair value at measurement date (cents)
Share price at date of issue (cents)
3.7
8.4
-
3.0
6.6
2.3
7.4
Exercise price (cents)
9.1
-
7.3
9
70%
-
70%
70%
3 years
-
3 years
3 years
Nil
-
Nil
Nil
2.5%
-
2.5%
3%
$60,918
-
$82,207
$13,723
Fair value of share options and
related assumptions
Expected volatility
Actual / assumed option life
Expected dividends
Risk-free interest rate
Share-based expense recognised
The current year volatility is intended to reflect the movement of the Company’s share price during the
financial year.
Further details of shares and options issued to directors are set out in Note 30, and in the
Remuneration Report set out on pages 20 to 25.
27. Related party disclosures
Ultimate parent
Carnarvon Petroleum Limited is the ultimate parent company.
Wholly-owned group transactions
During the reporting period there have been transactions between the Company and its controlled
entities and joint arrangements. The Company provided accounting and administrative services to its
controlled entities for which it did not charge a management fee.
The carrying value of loans to controlled entities at 30 June 2014 was $8,377,000 (2013: $8,131,000) after
provisions of $690,000 (2013: $833,000). These loans are unsecured, non-interest bearing, and have no
fixed terms of repayment.
Other related party balances and transactions
At 30 June 2014 an amount of $80,437 (2013: $84,175) is included in Company and consolidated trade
and other payables for outstanding director fees and expenses.
Additional consulting fees of $106,356 (2013:$149,987) were paid to a related entity of Ted Jacobson in
relation to exploration advisory services during the year.
Carnarvon Petroleum Limited
61
Notes to the Financial Statements
For the year ended 30 June 2014
For personal use only
28. Operating leases
Leases as lessee
Non-cancellable operating lease rentals are payable as follows:
Consolidated
2014
$000
2013
$000
Less than one year
227
298
Between one and five years
875
114
1,102
412
During the reporting period $305,000 was recognised as an expense in the consolidated income
statement in respect of operating leases (2013: $238,000).
The property lease is a non-cancellable lease with the five-year term, with rent payable in advance.
Contingent rental provisions within the lease agreement require that minimum lease payment shall be
increased by 4% per annum.
29. Segment information
62
The Group reports one segment, oil and gas exploration, development and production, to the chief
operating decision maker, being the board of Carnarvon Petroleum Limited, in assessing performance
and determining the allocation of resources. The financial information presented in the statement of
cash flows is the same basis as that presented to the chief operating decision maker.
Basis of accounting for purposes of reporting by operating segments
Unless otherwise stated, all amounts reported to the chief operating decision maker are determined
in accordance with accounting policies that are consistent to those adopted in the annual financial
statements of the Group.
Revenue by geographical region
Revenue, including interest income, is disclosed below based on the location of the external customer:
2014
$000
2013
$000
Thailand
23,317
18,350
Australia
1,450
741
24,767
19,091
The Group derives 100% of its sales revenue from one customer in the oil and gas exploration,
development and production segment.
Assets by geographical region
The location of segment assets is disclosed below by geographical location of the assets:
2014
$000
2013
$000
Thailand
65,246
128,692
Australia
67,719
15,672
132,965
144,364
2014 Annual Report
Notes to the Financial Statements
For the year ended 30 June 2014
For personal use only
30. Key management personnel disclosures
(a) Key management personnel compensation
Key management personnel compensation included in employee benefits expense, directors
emoluments, share based payments and administration expenses are as follows:
Consolidated
2014
$000
2013
$000
1,488
1,305
Post-employment benefits
50
50
Share-based payments
61
-
1,599
1,355
Short term employee benefits
Information regarding individual directors and executives’ compensation and some equity instruments
disclosures, as permitted by Corporations Regulation 2M.3.03, are provided in the Remuneration Report
section of the directors’ report as set out on pages 20 to 25.
Apart from the details disclosed in this note, no director has entered into a material contract with
the Company or the Group since the end of the previous financial year and there were no material
contracts involving directors’ interests existing at year end.
(b) Loans to key management personnel and their related parties
Details of loans to key management personnel and their related parties, which are all interest free
loans with limited recourse security over the plan shares provided in accordance with the Company’s
Employee Share Plan (“ESP”), are set out below.
Balance
1 July
2013 ($)
Balance
30 June
2014 ($)
Highest balance
in period
($)
Loaned
in period
($)
Repaid
in period
($)
PJ Leonhardt*
270,000
270,000
270,000
-
-
EP Jacobson*
540,000
540,000
540,000
-
-
PP Huizenga
1,021,300
1,164,850
1,164,850
143,550
-
AC Cook
1,528,800
1,543,550
1,543,550
14,750
-
2013
Balance
1 July
2012 ($)
Balance
30 June
2013 ($)
Highest balance
in period
($)
Loaned
in period
($)
Repaid
in period
($)
PJ Leonhardt*
270,000
270,000
270,000
-
-
EP Jacobson*
540,000
540,000
540,000
-
-
PP Huizenga
1,021,300
1,021,300
1,021,300
-
-
AC Cook
1,528,800
1,528,800
1,528,800
-
-
2014
Directors
Executives
Directors
Executives
* The loans to directors were made in 2006 in lieu of normal remuneration at a time the Company had
no full time employees and limited cash resources.
Carnarvon Petroleum Limited
63
Notes to the Financial Statements
For the year ended 30 June 2014
For personal use only
30. Key management personnel disclosures (continued)
Details regarding the aggregate of loans, all of which are interest-free, made by the Group to key
management personnel and their related parties, and the number of individuals in each group, are as follows:
Opening
balance ($)
Closing
balance ($)
Number in
group at 30 June
2014
2,550,100
2,708,400
2
2013
2,550,100
2,550,100
2
(c) Other key management personnel transactions
Amounts payable to key management personnel or their related parties at reporting date in respect of
outstanding director and consulting fees and expenses are as follows:
Consolidated
2014
$000
2013
$000
80
84
Current
Trade and other payables
(d) Movements in shares
The movement during the reporting period in the number of ordinary shares in Carnarvon Petroleum
Limited held, directly, indirectly or beneficially, by each key management person, including their related
parties, is as follows:
Held at
1 July 2013
Net acquired/
(sold)
Award under
Employee Share Plan
Received on
exercise of options
Held at 30
June 2014
PJ Leonhardt
17,750,000
-
-
-
17,750,000
EP Jacobson
31,297,635
2,890,632
-
-
34,188,267
121,955
406,250
-
-
528,205
5,900,000
740,000
250,000
-
6,890,000
4,750,000
250,000
1,400,000
-
6,400,000
Held at
1 July 2012
Net acquired/
(sold)
Award under
Employee Share Plan
Received on
exercise of options
Held at 30
June 2013
PJ Leonhardt
17,000,000
750,000
-
-
17,750,000
EP Jacobson
31,297,635
-
-
-
31,297,635
9,000,000
287,768
-
-
9,287,768
-
121,955
-
-
121,955
5,000,000
900,000
-
-
5,900,000
4,600,000
150,000
-
-
4,750,000
2014
Directors
W Foster
AC Cook
Executives
PP Huizenga
2013
Directors
NC Fearis
W Foster
AC Cook
Executives
PP Huizenga
64
2014 Annual Report
Notes to the Financial Statements
For the year ended 30 June 2014
For personal use only
30. Key management personnel disclosures (continued)
Shares allotted under the ESP were funded by interest-free loans with a limited recourse security over
the plan shares and subject to the detailed rules of the ESP.
In accordance with AASB 2 the issue of shares under the ESP is accounted for using the Black-Scholes
Option Pricing Model, and their valuation assumptions are set out in Note 26.
Information regarding individual directors’ and executives’ compensation, including company loans
used to finance the purchase of the ESP shares, is provided in the Remuneration Report section of the
directors’ report as set out on pages 20 to 25.
31. Non-key management personnel disclosures
Identity of related parties
The Group has a related party relationship with its controlled entities (see Note 32), joint operation
assets (see Note 18), and with its key management personnel (see Note 30).
32. Consolidated entities
Ownership interest
Name
Country of Incorporation
2014
2013
Carnarvon Thailand Ltd
British Virgin Islands
100%
100%
Lassoc Pty Ltd
Australia
100%
100%
SRL Exploration Pty Ltd
Australia
100%
100%
Carnarvon Petroleum (Indonesia) Pty Ltd
Australia
100%
100%
Carnarvon (NZ) Pty Ltd
New Zealand
100%
100%
Carnarvon Khian Sa Pte Ltd
Singapore
100%
100%
Company
Carnarvon Petroleum Ltd
Controlled entities
Investments in controlled entities are measured at cost in the financial statements of the Company.
33. Subsequent events
As of the 18 August 2014 the Company announced a significant oil discovery in the Phoenix South-1
well in the North West Shelf in Western Australian Permit WA-435-P. At this preliminary stage it is too
early to quantify the recoverable volumes of oil. In addition, further technical evaluation is required in
order to be in a position to announce this information.
The cost estimate for the well to completion for the Company, including additional drilling, is
estimated to be around $6,000,000. This figure is subject to change pending the finalisation of the
costs associated with the well.
Carnarvon Petroleum Limited
65
Notes to the Financial Statements
For the year ended 30 June 2014
For personal use only
33. Subsequent events (continued)
No other matters or circumstance has arisen since 30 June 2014 that in the opinion of the directors
has significantly affected, or may significantly affect in future financial years:
(i) The Group’s operations; or
(ii) The results of those operations; or
(iii) The Group’s state of affairs
34. Financial risk management
66
The Group’s activities expose it to market risk (including currency risk, commodity price risk and
interest rate risk), credit risk and liquidity risk.
This note presents qualitative and quantitative information about the Group’s exposure to each of
the above risks, their objectives, policies and procedures for managing risk, and the management of
capital. The Board of Directors has overall responsibility for the establishment and oversight of the risk
management framework.
The Group’s overall risk management approach focuses on the unpredictability of financial markets
and seeks to minimize the potential adverse effects on the financial performance of the Group. The
Group does not currently use derivative financial instruments to hedge financial risk exposures
and therefore it is exposed to daily movements in the international oil prices, exchange rates, and
interest rates.
The Group uses various methods to measure different types of risk to which it is exposed. These
methods include sensitivity analysis in the case of interest rate, foreign exchange, and commodity
price risk and ageing analysis for credit risk.
The Board’s policy is to maintain a strong capital base so as to maintain investor, creditor, and
market confidence and to sustain future development of the business. Given the stage of the
Group’s development there are no formal targets set for return on capital. There were no changes
to the Group’s approach to capital management during the year. Neither the Company nor any of its
controlled entities are subject to externally imposed capital requirements.
(a) Commodity price risk
Commodity price risk is the risk of financial loss resulting from movements in the price of the Group’s
commodity output, being crude oil.
Revenues under the Group’s contractual arrangements with its customer are denominated in US$,
linked to the US$ prices of a basket of oil products, and paid in Thai Baht at the average monthly
exchange rate. The Group does not currently use derivative financial instruments to hedge commodity
price risk and therefore is exposed to daily movements in the prices of these oil products.
Sensitivity analysis
An increase of 10% in the achieved monthly oil sale price would have increased equity and pre tax
profit and loss by the amounts shown below. This analysis assumes that all other variables other than
royalties, which are directly related to oil revenues, remain constant. The analysis is performed on the
same basis for 2013:
2014 Annual Report
Notes to the Financial Statements
For the year ended 30 June 2014
For personal use only
34. Financial risk management (continued)
Consolidated
Equity
$000
Profit
and loss
$000
30 June 2014
2,198
2,198
30 June 2013
1,739
1,739
A decrease of 10% in the achieved monthly oil sale price would have decreased equity and pre tax
profit and loss by the amounts shown below. This analysis assumes that all other variables other than
royalties, which are directly related to oil revenues, remain constant. The analysis is performed on the
same basis for 2013:
Consolidated
Equity
$000
Profit
and loss
$000
30 June 2014
(2,198)
(2,198)
30 June 2013
(1,739)
(1,739)
(b) Interest rate risk
The significance and management of the risks to the Group is dependent on a number of factors
including:
• Interest rates (current and forward) and the currencies that are held;
• Level of cash and liquid investments and their term;
• Maturity dates of investments;
• Proportion of investments that are fixed rate or floating rate.
The Group manages the risk by maintaining an appropriate mix between fixed and floating rate
investments.
At the reporting date, the effective interest rates of variable rate interest bearing financial instruments
of the Group were as follows. There were no interest-bearing financial liabilities.
Consolidated
2014
2013
Carrying amount (A$000)
Financial assets – cash and cash equivalents
49,580
19,525
Weighted average interest rate (%)
Financial assets – cash and cash equivalents
0.63%
1.12%
Carnarvon Petroleum Limited
67
Notes to the Financial Statements
For the year ended 30 June 2014
For personal use only
34. Financial risk management (continued)
68
Sensitivity analysis
All other financial assets are non interest bearing.
An increase in 50 basis points from the weighted average year-end interest rates at 30 June would
have increased equity and profit and loss by the amounts shown below. This analysis assumes that all
other variables remain constant. The analysis is performed on the same basis for 2013:
Consolidated
Equity
$000
Profit
and loss
$000
30 June 2014
199
199
30 June 2013
 96
 96
A decrease in 50 basis points from the weighted average year-end interest rates at 30 June would
have decreased equity and profit and loss by the amounts shown below. This analysis assumes that all
other variables remain constant. The analysis is performed on the same basis for 2013:
Consolidated
Equity
$000
Profit
and loss
$000
30 June 2014
(274)
(274)
30 June 2013
(110)
(110)
(c) Credit risk
Credit risk refers to the risk that a counter party will default on its contractual obligations resulting in
a financial loss to the Group, and arises principally from the Group’s receivables from customers and
cash deposits.
The Group’s trade receivables at both June 2014 and June 2013 are all due from an entity located in
Thailand and controlled by its government. This entity has an appropriate credit history with the Group.
There were no receivables at 30 June 2014 or 30 June 2013 that were past due.
Cash transactions are limited to financial institutions considered to have a suitable credit rating.
Credit risk further arises in relation to financial guarantees given to certain parties, refer to Note 25.
Exposure to credit risk is considered minimal but is monitored on an ongoing basis. The maximum
exposure to credit risk is represented by the carrying amount of each financial asset in the statement
of financial position.
2014 Annual Report
Notes to the Financial Statements
For the year ended 30 June 2014
For personal use only
34. Financial risk management (continued)
The carrying amount of the Group’s financial assets represents the maximum credit exposure. The
Group’s maximum exposure to credit risk at the reporting date was:
Consolidated
2014
$000
2013
$000
49,580
19,525
3,937
5,082
53,517
24,607
Carrying amount:
Cash and cash equivalents
Trade and other receivables
The aging of the Group’s trade receivables at reporting date was:
Not past
due
Gross
2014
$000
Impairment
2014
$000
Gross
2013
$000
Impairment
2013
$000
2,812
-
3,153
-
2,812
-
3,153
-
Based on historical default rates, the Group believes that no impairment allowance is necessary in
respect of trade receivables.
(d) Currency risk
Currency risk arises from sales, purchases, assets and liabilities that are denominated in a currency
other than the functional currencies of the entities within the Group, being the A$, THB and US$.
The Group operates predominantly in Thailand and is exposed to currency risk arising from various
foreign currency exposures, mainly with respect to the US$ and Thai Baht (“THB”).
Cash receipts from the Thai operations, which comprise 100% of the Group revenues, are received in
Thai Baht. The majority of the Group’s payments, including Thai SRB and income tax, are also payable
in THB which effectively creates a natural hedge. The Company’s foreign exchange risk predominantly
resides in its US$ loans to its controlled entities.
The Group does not currently use derivative financial instruments to hedge foreign currency risk
and therefore is exposed to daily movements in exchange rates. However, the Group intends
to maintain sufficient THB cash balances to meet its THB obligations, in particular its SRB and
income tax liabilities.
Carnarvon Petroleum Limited
69
Notes to the Financial Statements
For the year ended 30 June 2014
For personal use only
34. Financial risk management (continued)
(d) Currency risk (continued)
The Group’s exposure to foreign currency risk at balance date was as follows, based on carrying amounts.
THB
USD
A$000
A$000
Cash and cash equivalents
5,878
40,686
Trade and other receivables
3,549
185
Trade payables and accruals
(2,838)
(86)
Consolidated 2014
SRB and income tax provisions
(235)
Gross balance sheet exposure
-
6,354
40,785
Cash and cash equivalents
4,348
7,773
Trade and other receivables
4,957
191
Trade payables and accruals
(2,112)
(455)
Consolidated 2013
SRB and income tax provisions
(846)
Gross balance sheet exposure
6,347
7,509
The following significant exchange rates applied during the year:
Average rate
Reporting date spot rate
AUD to:
2014
2013
2014
2013
1 Thai baht
1 USD
0.034
1.089
0.032
0.974
0.033
1.059
0.035
1.093
Sensitivity analysis
A 10% strengthening of the AUD against the THB for the 12 months to 30 June 2014 and 30 June 2013
would have decreased equity and pre tax profit and loss by the amounts shown below. This analysis
assumes that all other variables, in particular interest rates and the exchange rate between the Thai
Baht and USD, remain constant:
Consolidated
Equity
$000
Profit
and loss
$000
30 June 2014
THB
(6,932)
(773)
(16,761)
(945)
30 June 2013
THB
A 10% weakening of the AUD against the THB for the 12 months to 30 June 2014 and 30 June 2013
would have increased equity and pre tax profit and loss by the amounts shown below. This analysis
assumes that all other variables, in particular interest rates and the exchange rate between the Thai
Baht and USD, remain constant:
70
2014 Annual Report
Notes to the Financial Statements
For the year ended 30 June 2014
For personal use only
34. Financial risk management (continued)
Consolidated
Profit
Equity
and loss
$000
$000
30 June 2014
THB
11,827
2,364
20,486
1,155
30 June 2013
THB
(f) Liquidity risk
Liquidity risk is the risk that the Group will not be able to meet its financial obligations as and when
they fall due. The Group’s approach to managing this risk is to ensure, as far as possible, that it will
always have sufficient liquidity to meet its liabilities when due under a range of financial conditions.
The net cashflows arising from its Thai assets are considered to generate sufficient working capital to
adequately address this risk.
The Group currently does not have any available lines of credit.
The following are the contractual maturities of financial liabilities, including estimated interest
payments and excluding the impact of any netting agreements:
Carrying
amount
$000
Contractual
cashflows
$000
6 months
or less
$000
6 to 12
months
$000
Consolidated 2014
Non-derivative financial liabilities
Trade and other payables
SRB and income tax provisions
4,516
4,516
4,516
-
235
235
235
-
4,751
4,751
4,751
-
3,167
3,167
3,167
-
846
846
846
-
4,013
4,013
4,013
-
Consolidated 2013
Non-derivative financial liabilities
Trade and other payables
SRB and income tax provisions
Carnarvon Petroleum Limited
71
Notes to the Financial Statements
For the year ended 30 June 2014
For personal use only
35. Fair value measurement
72
Fair value hierarchy
The following tables detail the consolidated entity’s assets and liabilities, measured or disclosed at fair
value, using a three level hierarchy, based on the lowest level of input that is significant to the entire
fair value measurement, being:
Level 1: Quoted prices (unadjusted) in active markets for identical assets or liabilities that the entity
can access at the measurement date
Level 2: Inputs other than quoted prices included within Level 1 that are observable for the asset or
liability, either directly or indirectly
Level 3: Unobservable inputs for the asset or liability
Level 1
$’000
Level 2
$’000
Level 3
$’000
Total
$’000
Deferred consideration available-for-sale
-
-
21,480
21,480
Total assets
-
-
21,480
21,480
Level 1
$’000
Level 2
$’000
Level 3
$’000
Total
$’000
Deferred consideration available-for-sale
-
-
-
-
Total assets
-
-
-
-
Consolidated - 2014
Assets
Consolidated - 2013
Assets
There were no transfers between levels during the financial year.
The carrying amounts of trade and other receivables and trade and other payables are assumed to
approximate their fair values due to their short-term nature.
Valuation techniques for fair value measurements categorised within level 2 and level 3
Deferred consideration available-for-sale has been valued using a discounted cash flow model applied
to the following:
• Production volumes - Estimate production volumes are based on the production profiles of proven
and probable reserves for the fields and take into account development plans for the fields agreed by
management as part of the long-term planning process, which have been independently verified;
• Crude oil price – forecast crude oil prices are based on independent data;
• Discount rate – A discount rate of 12%
2014 Annual Report
Notes to the Financial Statements
For the year ended 30 June 2014
For personal use only
35. Fair value measurement (continued)
Level 3 assets and liabilities
Movements in level 3 assets and liabilities during the current and previous financial year are set out
below:
Available- for-sale $’000
Consolidated
Total
$’000
Balance at 30 June 2013
-
-
Gains/(losses) recognised in other
comprehensive income
-
-
Additions
21,480
21,480
Disposals
-
-
21,480
21,480
Balance at 30 June 2014
The level 3 assets and liabilities unobservable inputs and sensitivity are as follows:
Description
Unobservable inputs
Weighted average
Sensitivity
Available-for sale
Discount rate
12%
1.00% change would increase/
decrease fair value by $732,000
Available-for sale
Net 2P production
27,858 MSTB
1.00% change would increase/
decrease fair value by $209,000
Available-for sale
Oil price
$86STB - $114STB
1.00% change would increase/
decrease fair value by $209,000
Carnarvon Petroleum Limited
73
Notes to the Financial Statements
For the year ended 30 June 2014
For personal use only
36. Parent Information
The following information has been extracted from the books and records of the parent and has been
prepared in accordance with the accounting standards:
2014
$000
2013
$000
Current Assets
44,356
14,625
Non-current assets
37,208
12,917
Total assets
81,564
27,542
1,842
821
105
-
1,947
821
90,213
87,573
(12,554)
(62,804)
Statement of financial position
Current liabilities
Non-current liabilities
Total liabilities
Equity
Issued Capital
Accumulated losses
Reserves
1,958
1,952
79,617
26,721
Total Profit / (loss)
49,602
(3,709)
Total comprehensive income
49,602
(3,709)
Total equity
Statement of comprehensive income
Parent Contingencies
In accordance with normal petroleum industry practice, the Group has entered into joint arrangements
and farmin agreements with other parties for the purpose of exploring and developing its petroleum
permit interests. If a party to a joint operation defaults and does not contribute its share of joint
operation’s obligations, then the other joint operators may be liable to meet those obligations. In this
event, the interest in the permit held by the defaulting party may be redistributed to the remaining joint
operators.
Parent
2014
$000
2013
$000
309
1,987
Parent capital and other commitments
(a) Joint operation commitments
Capital commitments of the Group to joint venture
assets:
Within one year
74
2014 Annual Report
Notes to the Financial Statements
For the year ended 30 June 2014
For personal use only
36. Parent Information (continued)
(b) Exploration expenditure commitments
Due to the nature of the Company’s operations in exploring and evaluating areas of interest it is
necessary to incur expenditure in order to retain the Company’s present permit interests. Expenditure
commitments on exploration permits can be reduced by selective relinquishment of exploration
tenure, by the renegotiation of expenditure commitments, or by farming out portions of the Company’s
equity. Failure to meet Joint Operation cash requirements may result in a reduction in equity in that
particular Joint Operation.
Exploration expenditure commitments forecast but not provided for in the financial statements are
as follows:
Less than one year
1,205
3,120
Between one and five years
1,200
3,650
2,405
6,770
257
229
Less than one year
174
155
Between one and five years
768
13
942
168
(c) Capital expenditure commitments
Data licence commitments
Non-cancellable operating lease rentals are payable as follows:
Carnarvon Petroleum Limited
75
Directors’ Declaration
In the opinion of the directors of Carnarvon Petroleum Limited:
(a)the financial statements and notes of the Group set out on pages 30 to 75 are in accordance with the
Corporations Act 2001, including:
For personal use only
(1)
(i) giving a true and fair view of the Group’s financial position as at 30 June 2014 and of its performance,
as represented by the results of its operations and its cash flows, for the financial year ended on that
date; and
(ii) complying with Australian Accounting Standards (including the Australian Accounting Interpretations)
and the Corporations Regulations 2001; and
(b)the financial statements comply with International Financial Reporting Standards as set out in
Note 2; and
(c)the remuneration disclosures that are contained in the Remuneration Report in the Directors Report
comply with the Corporations Act 2001 and the Corporations Regulations 2001; and
(d)there are reasonable grounds to believe that the Company will be able to pay its debts as and when
they become due and payable.
(2)This declaration has been made after receiving the declarations required to be made to the directors in
accordance with section 295A of the Corporations Act 2001 for the financial period ending 30 June 2014.
Signed in accordance with a resolution of the directors.
PJ Leonhardt
Director
Perth, 29 August 2014
76
2014 Annual Report
For personal use only
Independent Auditor’s Report
Carnarvon Petroleum Limited
77
For personal use only
Independent Auditor’s Report
78
2014 Annual Report
Corporate Governance Statement
For personal use only
Introduction
The Company’s directors are fully cognisant of the Corporate Governance Principles and Best Practice
Recommendations published by the ASX Corporate Governance Council (“CGC”) and have adopted those
recommendations where they are appropriate to the Company’s circumstances.
However, a number of those principles and recommendations are directed towards listed companies
considerably larger than Carnarvon, whose circumstances and requirements accordingly differ markedly
from the Company’s. For example, the nature of the Company’s operations and its low direct employee count
mean that a number of the board committees and other governance structures recommended by the CGC
are not only unnecessary in Carnarvon’s case, but the effort and expense required to establish and maintain
them would, in the directors’ view, be an unjustified diversion of shareholders’ funds.
Carnarvon’s directors are aware that according to one school of thought listed companies will be rated by
the investment community according to their compliance with the CGC’s Best Practice Recommendations.
However, in the directors’ view that approach is not soundly based, particularly where unquestioning
compliance with the recommendations would produce marginal or no benefit to shareholders.
In discharging its functions Carnarvon’s board of directors receives competent legal and other professional
advice. Based on that advice the board is satisfied that, notwithstanding non-compliance with the Best
Practice Recommendations (to the extent noted below), the Company’s governance structures are
appropriate for its circumstances and the board acts at all times in the best interests of the Company and
its shareholders.
The following additional information about the Company’s corporate governance practices is set out on the
Company’s website at www.carnarvon.com.au:
•
•
•
•
•
•
•
•
•
•
•
•
Corporate governance disclosures and explanations;
Statement of Board and management functions;
Composition of the Board and new appointments;
Committees of the Board;
Summary of code of conduct for directors;
Summary of policy on securities trading;
Audit Committee Charter;
Remuneration Committee Charter;
Summary of policy and procedures for compliance with ASX Listing Rule disclosure requirements;
Summary of arrangements regarding communication with and participation of shareholders;
Summary of Company’s risk management policy; and
Corporate code of conduct.
Skills, experience, expertise and term of office of each director
A profile of each director containing the applicable information is set out in the directors’ report.
Statement concerning availability of independent professional advice
If a director considers it necessary to obtain independent professional advice to properly discharge the
responsibility of his/her office as a director then, provided the director first obtains approval for incurring
such expense from the chairman, the Company will pay the reasonable expenses associated with obtaining
such advice.
Carnarvon Petroleum Limited
79
Corporate Governance Statement
Explanations for departures from best practice recommendations
For personal use only
From 1 July 2013 to 30 June 2014 (the “Reporting Period”) the Company complied with each of the
Essential Corporate Governance Principles (Note 1 below) and the corresponding Best Practice
Recommendations (Note 2 below) as published by the ASX Corporate Governance Council (“ASX Principles
and Recommendations”), other than in relation to the matters specified below:
Principle
Reference
Recommendation
Reference
Notification of
Departure
2
2.4
A separate Nomination
Committee has not
been formed.
The Board considers that the Company
is not currently of a size to justify the
formation of a Nomination Committee.
The Board as a whole undertakes the
process of reviewing the skills base
and experience of existing directors
to enable identification or attributes
required in new directors. Where
appropriate independent consultants
are engaged to identify possible new
candidates for the Board.
3
3.2
A diversity policy has
not been established.
Due to the size of the Company’s
workforce, the Company has not
adopted a formal diversity policy or any
gender diversity objectives. The Board
believes that there is no detriment
to the Company in not adopting a
formal diversity policy or in not setting
gender diversity objectives as the
Company is committed to providing all
employees with fair and equal access
to employment opportunities.
3
3.3
Measurable objectives
for achieving gender
diversity set in
accordance with the
diversify policy have
not been established.
See above.
Explanation for Departure
Notes
(1) A copy of the Ten Essential Corporate Governance Principles is set out on the Company’s website under
the section entitled “Corporate Governance”. (2) A copy of the Best Practice Recommendations is set out
on the Company’s website under the section entitled “Corporate Governance”.
80
2014 Annual Report
Corporate Governance Statement
For personal use only
Existence and terms of any schemes for retirement benefits for non-executive directors
The Company does not have any terms or schemes relating to retirement benefits for non-executive
directors.
Company’s remuneration policies
The Company’s remuneration policies are set out in the Remuneration Report on pages 20 to 25.
The Company has separate remuneration policies for executive and non-executive directors. Non-executive
directors receive a fixed fee and, when appropriate, share options or participation in the Employee Share
Scheme.
Executive directors receive a salary or fee and, when appropriate, shares, share options, or participation in
the Employee Share Scheme.
Material business risks
Management has reported to the Board as to the effectiveness of the Company’s management of its
material business risks.
Performance evaluation of the Board, its committees and senior executives
The Board reviews and evaluates the performance of the Board and its committees, which involves
consideration of all the Board’s key areas of responsibility.
A performance evaluation of senior executives was undertaken during the year, in the case of the Chief
Executive by the Board, and in all other cases by the Chief Executive Officer and the Chairman.
Identification of independent directors
The Company’s independent directors are considered to be Peter Leonhardt, Ted Jacobson, Neil Fearis, and
Bill Foster.
Neither of these directors was considered to have a material relationship with the Company or another
group member during the Reporting Period as professional advisor, consultant, supplier, customer, or
through any other contractual relationship, nor did they have any business or other relationship which could,
or could reasonably be perceived to, materially interfere with the director’s ability to act in the best interests
of the Company.
The Board considers “material” in this context to be where any director-related business relationship
represents the lesser of at least 5% of the Company’s or the director-related business’s revenue.
Number of Audit Committee meetings and names of attendees
The number of Audit Committee meetings and names of attendees is set out in the directors’ report.
Names and qualifications of Audit Committee members
The names and qualifications of Audit Committee members are set out in the directors’ report.
Carnarvon Petroleum Limited
81
Additional Shareholder Information
Additional information required by the ASX Limited (“ASX”) Listing Rules and not disclosed elsewhere in this
report is set out below.
For personal use only
a) Shareholdings as at 27 August 2014
Substantial shareholders
There are no substantial shareholder notices lodged with the Company.
Voting Rights
The voting rights attaching to Ordinary Shares are governed by the Constitution. On a show of hands every
person present who is a member or representative of a member shall have one vote and on a poll, every
member present in person or by proxy or by attorney or duly authorised representative shall have one vote
for each share held. No options have any voting rights.
Twenty Largest Shareholders
Name of Shareholder
Number
of shares
% held
J P Morgan Nominees Australia Limited
70,286,895
7.12
HSBC Custody Nominees (Australia) Limited
35,501,582
3.60
Citicorp Nominees Pty Limited
26,454,091
2.68
Mr Edward Patrick Jacobson
13,315,982
1.35
Log Creek Pty Ltd
12,881,702
1.30
Sunshine Group Investments Pty Ltd
12,000,000
1.22
Mr James Mark Dack
11,999,999
1.22
Jacobson Geophysical Services Pty Ltd
11,674,068
1.18
Comsec Nominees Pty Limited
9,701,885
0.98
Pendomer Investments Pty Ltd
9,500,000
0.96
Arne Investment Pty Ltd
8,052,592
0.82
Mr Peter James Leonhardt
7,700,000
0.78
Egmont Pty Ltd
7,000,000
0.71
Arne Investment Pty Ltd
6,293,851
0.64
Mr Edward Patrick Jacobson
6,000,000
0.61
Geolyn Pty Ltd
6,000,000
0.61
Zero Nominees Pty Ltd
5,950,000
0.60
Mr Philip Paul Huizenga
5,800,000
0.59
Sun Loong Corporation Pty Ltd
5,181,000
0.52
Whitehall Corporation Pty Ltd
5,000,000
0.51
281,083,935
28.47
82
2014 Annual Report
Additional Shareholder Information
For personal use only
Distribution of equity security holders
Size of Holding
Number of
shareholders
Number of
fully paid
shares
1
to
1,000
523
239,177
1,001
to
5,000
2,099
6,713,796
5,001
to
10,000
1,750
14,836,957
10,001
to
100,000
4,710
184,340,620
100,001
and over
1,273
781,046,427
10,355
987,176,977
The number of shareholders holding less than a marketable parcel of ordinary shares is 872.
b) Option holdings as at 27 August 2014
Options over ordinary shares issued
Number
on issue
Number
of holders
48,519,077
891
c) On-market buyback
There is no current on-market buyback.
Carnarvon Petroleum Limited
83
Additional Shareholder Information
d) Schedule of permits
Joint Venture
Partners
Equity
%
Phetchabun / Thailand
Carnarvon
Eco Orient Energy
Loyz Energy
20%
60%
20%
Eco Orient Energy
L33/43
Phetchabun / Thailand
Carnarvon
Eco Orient Resources
Loyz Energy
20%
60%
20%
Eco Orient Resources
L44/43
Phetchabun / Thailand
Carnarvon
Eco Orient Resources
Loyz Energy
20%
60%
20%
Eco Orient Resources
L52/50, & L53/50 Surat-Khiensa /
Thailand
Carnarvon
100%
Carnarvon
EP321
Perth / Australia
Carnarvon
2.5% of 38.25% Latent Petroleum
EP407
Perth / Australia
Carnarvon
2.5% of 42.5%
Latent Petroleum
WA-435-P,
WA-437-P
Roebuck / Australia
Carnarvon
Apache
Finder Exploration
JX Nippon
20%
40%
20%
20%
Apache
WA-436-P,
WA-438-P
Roebuck /
Australia
Carnarvon
Finder Exploration
50%
50%
Finder Exploration
WA-443-P
Roebuck /
Australia
Carnarvon
100%
Carnarvon
EP-490
Barrow / Australia
Carnarvon
100%
Carnarvon
EP-491
Barrow / Australia
Carnarvon
100%
Carnarvon
TP/27
Barrow / Australia
Carnarvon
100%
Carnarvon
Basin/Country
SW1A
For personal use only
Permit
84
Operator
2014 Annual Report
www.carnarvon.com.au
For personal use only
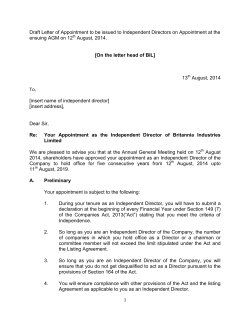


© Copyright 2026