
Artemis Resources Limited and its controlled entities Interim financial report
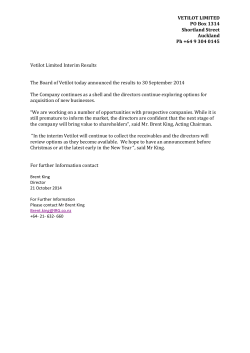
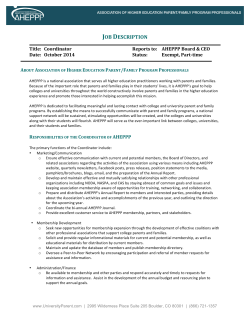
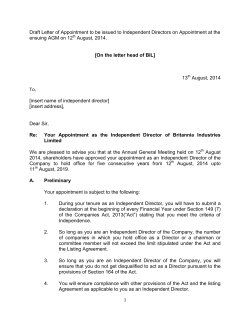
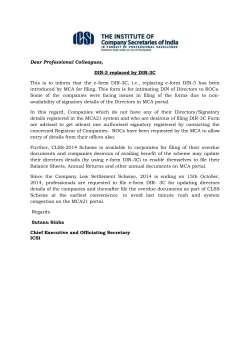
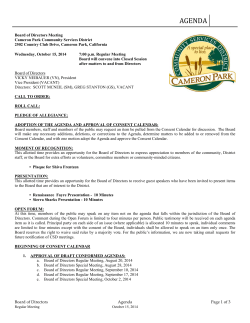
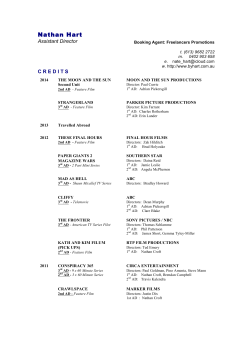
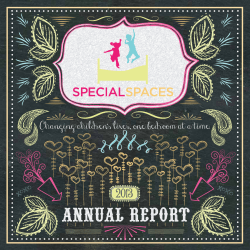
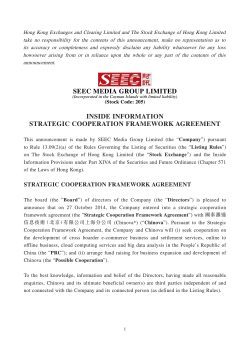
Artemis Resources Limited
and its controlled entities
Interim financial report
for the 6 months ended
31 December 2013
ABN: 80 107 051 749
Telephone: +61 2 9078 7670 Facsimile: +61 2 9078 7661
Email: [email protected]
Address: Level 9, 50 Margaret Street, Sydney NSW 2000
Postal Address: PO Box R933, Royal Exchange NSW 2205
www.artemisresources.com.au
Contents
Page
Directors’ Report
3
Auditor’s Independence Declaration
11
Consolidated Statement of Profit or Loss and Other Comprehensive Income
12
Consolidated Statement of Financial Position
13
Consolidated Statement of Changes in Equity
14
Consolidated Statement of Cash Flows
15
Notes to the Financial Statements
16
Directors’ Declaration
21
Independent Auditor’s Review Report
22
Corporate Directory
24
Page 2
DIRECTORS’ REPORT
The Directors present their report on the consolidated entity for the half year ended 31 December 2013.
Directors
The names of the Directors who held office during and since the end of the half-year:
Guy Robertson (Executive Director)
Shannon Coates (Non-Executive Director)
George Frangeskides (Non-Executive Director)
RESULT AND REVIEW OF OPERATIONS
EASTERN HILLS ANTIMONY-LEAD PROJECT
During the half year the Company achieved a significant milestone by releasing its maiden Mineral Resource
reported in accordance with JORC (2012) for the Eastern Hills Antimony-Lead (Sb-Pb) Project1 located in the
Ashburton region of Western Australia, following the completion of a successful 15 hole drilling program in
October 2013.
The combined Indicated and Inferred Resource exceeded size expectations, comprising 1.3 million tonnes at
1.7% Sb and 2.5% Pb (see Table 1 and Figure 1). Importantly, the higher confidence Indicated Resource
category returned higher grades than expected in antimony (2.0%), lead (3.1%) and gold (0.41g/t) compared
2
to the Company’s Exploration Target estimated in January 2013 .
Tonnes
Sb (%)
Grades
Pb (%) Ag (g/t)
Au (g/t)
Contained Metal
Sb (t)
Pb (t)
Indicated
810,000
2.0
3.1
26
0.41
15,900
25,200
Inferred
500,000
1.3
1.5
16
0.20
6,500
7,500
Total
1,310,000
1.7
2.5
24
0.34
22,400
32,700
1
Table 1: Eastern Hills Mineral Resource estimate based on a 1.0% Sb cutoff grade
This resource estimate only includes mineralisation from the Taipan Zone, with drill testing of the new high
3
grade Dugite Zone (containing rock chip sample results up to 35.7% Sb, 36% Pb, 1500g/t Ag and 6.80g/t Au),
scheduled for the 2014 field season.
The Total Mineral Resource for the Taipan Zone at a 1.0% Sb cutoff grade contains 22,400 tonnes of antimony
4
(Table 2). Over 70% of the Total Mineral Resource is within the Indicated category. The remaining 29% of the
resource estimate is within the Inferred category, highlighting the potential for mineralisation to continue at
depth. Antimony continues to trade at just under US$10,000/tonne.
Sb %
Cutoff Grade
1.0
Category
Sb (t)
Contained Metal
Pb (t)
Ag (oz)
Au (oz)
Indicated
15,900
10,800
687,000
25,200
Inferred
6,500
3,600
257,000
7,500
Total
22,400
14,400
945,000
32,700
1
Table 2: Eastern Hills Total Mineral Resource – contained metal
Detailed studies have yet to be completed to assess the viability of economically extracting and processing the
Eastern Hills Mineral Resource however, the latest Mineral Resource estimate will form the basis of a Scoping
Study which has now commenced.
1
ASX announcement dated 29 November 2013, some rounding has been applied to reported results
ASX announcements dated 16 and 18 January 2013
3
ASX announcement dated 12 November 2013
4
Calculated on the contained Sb metal tonnes at a 1% Sb lower cutoff grade – refer Table 2
2
Page 3
DIRECTORS’ REPORT
Figure 1: Eastern Hills – Mineral Resource, antimony zones and drillhole locations
High grade potential resource additions (Dugite, Gwardar, Tiger Zones)
5
The Company announced in September that it had identified three new zones of similar style mineralisation
that appear to be part of a more widespread mineralised system – the Dugite, Gwardar and Tiger Zones (Figure
2).
3
Results from rock chip sampling, reported during the December quarter from the Dugite Zone, located just
north of the Taipan Zone (Figure 2), have returned up to 35.7% Sb - the highest antimony grade seen to date
at the Eastern Hills Project. The same sample (Table 3) also included extremely high grades of 29.0% Pb,
1,335g/t silver (Ag), as well as 0.56g/t gold (Au). Significant rock chip results (Table 3) provide further evidence
that Eastern Hills is a significantly mineralised multi-vein system (Figure 2) predominantly containing
antimony-lead with locally rich precious metals.
Sample
ID
East
(m)
North
(m)
Sb
(%)
Pb
(%)
Ag
(g/t)
Au
(g/t)
Target Zone
238638
410,065
7,474,450
1.1
3.9
44
3.36
Dugite
238639
410,145
7,474,513
35.7
29.0
1335
0.56
Dugite
238640
410,533
7,475,097
3.8
11.7
50
0.24
Tiger
238641
410,528
7,475,093
1.6
3.0
17
0.13
Tiger
238798
409,837
7,474,399
0.5
0.3
4
3.16
Dugite
238799
409,829 7,474,393
5.4
9.2
277 1.53
Dugite
6
7
Table 3: Eastern Hills best reconnaissance sampling results – October 2013
5
ASX announcement dated 26 September 2013
Best results selected if Sb>1.0% or Au>2.0ppm
Laboratory analysis of samples undertaken by ALS Laboratories Perth and Brisbane. Analysis of individual elements, with relevant
method, is Sb (ME–XRF05, ME–XRF15b on assays greater than 1% Sb, and ME_XRF-15c on assays greater than 20% Sb), Ag (ME-ICP61 and
OG62 on assays greater than 100ppm Ag), Pb (ME-ICP61 and OG62 on assays greater than 1% Pb), Au (Au-AA23)
6
7
Page 4
DIRECTORS’ REPORT
Figure 2: Eastern Hills - Latest sampling of new zones adjacent to Taipan Zone resource
Additional rock chip sampling and mapping of the Dugite-Gwardar-Tiger Zones was completed late in the
8
December quarter, with final assay results revealing additional high grade results on new zones .
The high grade results have elevated the Dugite Zone (Figure 2) to become a key focus in the Company’s quest
for additional resources to add to the Mineral Resource reported in accordance with JORC (2012) at the
adjacent Taipan Zone.
Dugite Zone
The Dugite Zone lies immediately to the north of the Taipan Zone (Figures 1, 2 and 3). The Dugite Zone
currently has a mapped strike length of approximately 1.1km and is striking east-northeast. As mentioned
above, further encouragement was obtained from the latest rock chip sampling campaign with one particularly
high grade result (sample 238639 – Figure 3).
Artemis has also uncovered, and reviewed, historical rock chip sampling results along the Dugite Zone.
Significant historical results (Sb>5%) are displayed on Figure 3 with best results up to 33.0% Sb, 36.0% Pb,
1,500g/t Ag & 6.80g/t Au within a 50m zone of Artemis’ high grade antimony result. The historical results
provide further evidence that the eastern end of the Dugite Zone is highly prospective for exceptionally high
grade antimony, lead, silver and gold. This particular zone of mineralisation is interpreted to be the result of
northwest-southeast faults cross-cutting the Dugite silica alteration zone roughly perpendicular to its strike.
This later stage cross-cutting fault zone is interpreted to provide the fluid pathway for the antimony-leadsilver-gold mineralisation seen at the Eastern Hills deposit. This model provides encouragement for further
discoveries of mineralisation on both the Gwardar and Tiger Zones, which at this point have not been mapped
or sampled to the same level of detail as the Dugite Zone.
8
ASX announcement dated 5 March 2014.
Page 5
DIRECTORS’ REPORT
9
Figure 3: Dugite Zone (East) – Artemis and historic sampling results (refer Fig 2)
Tiger Zone
The Tiger Zone is located 500 metres to the northeast of the Taipan Zone (Figure 2) and returned a high grade
result of 5.0% Sb in the September quarter (JORC 2004). Follow-up work during October detailed further
encouraging mineralisation with 3.8% Sb and 1.6% Sb results (JORC 2012) obtained from rock chips. The Tiger
Zone has a northeast orientation which, although slightly different from the more central alteration zones, still
shows evidence of a pathway for mineralisation along the fault structure.
Gwardar Zone
The Gwardar Zone lies to the north of the Dugite Zone (Figures 1 and 2) with an approximate strike length of
700m. Only one rock chip sample was taken by Artemis from the Gwardar Zone and an encouraging result of
0.4g/t Au was reported in the September quarter (JORC 2004). A gold result of this level is encouraging as it
suggests a potential link between the nearby Mt Clement gold deposit and the western end of the Eastern Hills
mineralisation. More systematic mapping and sampling of the Gwardar Zone was undertaken late in the
December quarter with results pending.
Scoping Study Underway
With successful completion of the JORC resource estimation, planning is now underway for follow up activities
to advance the Eastern Hills deposit. A field campaign to further map and sample zones identified adjacent to
the Taipan Zone, including the new high grade Dugite Zone, was completed pre-Christmas. Results of this work
revealed an extension to the high grade Dugite East Zone and will be followed up by drill target generation for
potential resource expansion. A preliminary scoping study to assess the economic parameters around the
deposit is scheduled for early 2014, while planning is underway for follow up drilling to commence in 2014
following the northern wet season, subject to available funding.
9
Best results shown if Sb>5.0%
Page 6
DIRECTORS’ REPORT
China – Corporate / Strategic Partners
With the Eastern Hills Antimony-Lead Project attaining its maiden JORC (2012) resource status in November
2013, Artemis attended the World Antimony Conference in Guilin, China in December 2013. Artemis
subsequently went on to meet a number of key antimony corporates in Guangxi, Hunan and Guizhou
Provinces in the southeast of China, including miners, antimony ingot and trioxide producers, traders, offtakers and investors.
Artemis will continue to develop these relationships with companies seeking off-take agreements and
potential strategic partnerships in order to fund the advancement of the project.
WEST PILBARA PROJECT - High Grade Gold and Copper Targets
During the period, Artemis’ technical team conducted a short field visit to its West Pilbara Project to further
evaluate its gold, copper, silver, nickel and iron potential, in particular the gold/copper mineralisation at the
Carlow Castle Prospect. Further geological reviews of the project were also conducted and Artemis maintains
its belief that the region is under-explored and has high potential for new base metal and gold discoveries.
A further exploration program is planned subject to achieving a Native Title Agreement and, in respect of
tenement numbers E47/1745, E47/1746 and E47/1797, a Warden’s Court hearing in relation to a plaint against
these tenements. The Company has made good progress in negotiations for a Native Title Agreement and
expects a conclusion in March/April 2014 to enable exploration to proceed.
Artemis is also in discussions with several potential partners looking to invest in the West Pilbara Project
(Figure 4), to assist the Company to explore its large and highly prospective project area.
Figure 4: Key West Pilbara base and precious metal prospects
Page 7
DIRECTORS’ REPORT
CORPORATE
On 28th August 2013, the Company announced the successful closing of a renounceable Rights Issue with 79%
of the renounceable Rights Issue being subscribed for by existing shareholders.
Under the Rights Issue the Company issued 155,262,206 shares raising $931,573. Attached to each share were
one Short Dated option (1.2 cents expiring 31 March 2014) and one Long Dated option (2 cents expiring 31
August 2016).
The shortfall under the Rights Issue was placed with underwriters with the Company issuing 40,853,952
shares, raising $245,124. Options were attached on the same terms and conditions as above. With significant
demand for the shortfall, the Company issued an additional 57,577,853 shares raising a further $369,712.
Options were attached on the same terms and conditions as above.
Funds raised from the Rights Issue were used primarily to fund drilling of the Company’s Eastern Hills antimony
project as well as planned exploration work at the West Pilbara (Base and Precious Metals) and Yandal (Gold)
projects.
During the period, the Company entered into a farm out arrangement in respect of the Grants
Gully/Buchanan’s Creek project (Tantalum/Lithium) with Strategic Metals Australia Pty Limited (SMA) who will
earn 75% of the project by spending $525,000 during 2014. SMA will then have an option over the remaining
25% for a payment of $250,000, plus 250,000 shares in SMA and a 2% royalty on net sales receipts.
Competent Person Statement
The information in this document that relates to Exploration Results released to ASX prior to end September
2013 is based on information compiled or reviewed by Mr Trevor Woolfe, who is a Member of The
Australasian Institute of Mining and Metallurgy and a Member of the Australian Institute of Geoscientists. Mr
Woolfe is a consultant to the Company, and is employed by Alexander Cable Pty Ltd. Mr Woolfe has sufficient
experience which is relevant to the style of mineralisation and type of deposit under consideration and to the
activity which he is undertaking to qualify as a Competent Person as defined in the 2004 Edition of the
‘Australasian Code for Reporting of Exploration Results, Mineral Resources and Ore Reserves’. Mr Woolfe
consents to the inclusion in the report of the matters based on his information in the form and context in
which it appears. This information was prepared and first disclosed under the JORC Code 2004. It has not been
updated since to comply with the JORC Code 2012 on the basis that the information has not materially
changed since it was last reported.
Information in this document that relates to Exploration Results and Mineral Resources other than those
released to ASX prior to end September 2013 was reported in accordance with the JORC Code 2012. The
Company is not aware of any new information or data that materially affects the information included in the
relevant market announcement, and in the case of the Mineral Resource estimate, all material assumptions
and technical parameters underpinning the estimates in the relevant market announcement continue to apply
and have not materially changed.
Page 8
DIRECTORS’ REPORT
Tenement Schedule (as at 31 December 2013)
Yandal Gold Project
West Pilbara – Gold & Base Metals
E53/1026
100%
E47/1745
100%
E53/1213
100%
E47/1746
100%
E53/1214
100%
E47/1747
100%
E53/1412
80%¹
E47/1797
100%
E53/1413
80%¹
P47/1360-1375
100%
E53/1525
80%¹
P47/1380
100%
E53/1526
80%¹
P47/1386
100%
E53/1574
100%
PLA47/1112
100%
ELA/1626
100%
PLA47/1124
100%
ELA/1627
100%
PLA47/1126
100%
EL53/1662
100%
PLA47/1127
100%
PLA53/1606-1619
100%
PLA47/1131
100%
E53/1665
100%
PLA47/1134
100%
ELA53/1689
100%
E47/1806
40%
ELA53/1729
100%
E47/1807
40%
ELA53/1735
100%
E47/1878
40%
ELA53/1741
100%
M47/177
80%⁴
ELA53/1742
100%
M47/288
80%⁴
ELA53/1748
100%
P47/1518
100%
ELA53/1749
100%
P47/1519
100%
ELA53/1750
100%
PL47/1520
100%
ELA53/1759
100%
PLA47/1619
100%
PLA47/1620
100%
PLA47/1621
100%
PLA47/1622
100%
Mount Clement –Gold/Silver/Antimony
E08/1841
100%
PL47/1652
100%
E08/1606
80%
2
EL47/2645
100%
M08/191
80%²
ELA47/2652
100%
M08/192
80%²
ELA47/2696
100%
M08/193
80%²
ELA47/2716
100%
ELA47/2724
100%
ELA47/2908
100%
5
Buchanan’s Creek – Rare Metals
ML3311
100%
Mundong Well - Uranium
ML30123
100%
E08/1609
100%
ML30208
100%
E08/1892
100%
EPM13694
100%
ELA08/2273
100%
EPM14988
100%
EL08/2104
100%
EPM18490
100%
EL08/2105
100%
¹ JV with Aureus Investments Pty Ltd
Bali Hi – Base Metals
² JV with Northern Star Resources Ltd
E08/1372
70%³
E08/2129
100%
1,2,3,4
Joint venture partners
³ JV with GTI Resources Ltd
⁴ JV with Fox Resources Ltd
JV with SMA (SMA earning 75%)
5
are free carried or partially free carried by Artemis.
Page 9
DIRECTORS’ REPORT
OPERATING RESULTS
With this background, the loss after income tax for the period amounted to $1,354,166 (31 December 2012
loss: $470,758).
ANNOUNCEMENTS
The consolidated entity has made the following announcements since the close of the financial period:
30/01/2014
30/01/2014
11/02/2014
05/03/2014
Quarterly Cashflow Report
Quarterly Activities Report
Artemis Presenting at Proactive Investor Forum
High Antimony Grades Expand New Zone at Eastern Hills
SIGNIFICANT CHANGES IN STATE OF AFFAIRS
In the opinion of the Directors, other than the matters covered above in this report and the accounts and
notes attached thereto, there were no significant changes in the state of affairs of the Company that occurred
during the financial period under review.
DIVIDENDS
No dividends have been paid or declared since the end of the previous financial year to the date of this report.
AUDITOR’S INDEPENDENCE DECLARATION
The lead auditor’s independence declaration is set out on page 11 and forms part of the Directors’ Report for
the half year ended 31 December 2013.
Signed in accordance with a resolution of the Directors
Guy Robertson
Executive Director
Dated at Sydney
14 March 2014
Page 10
RSM Bird Cameron Partners
Level 12, 60 Castlereagh Street Sydney NSW 2000
GPO Box 5138 Sydney NSW 2001
T +61 2 8226 4500 F +61 2 8226 4501
AUDITOR’S INDEPENDENCE DECLARATION
As lead auditor for the review of the financial report of Artemis Resources Limited for the half year ended 31
December 2013, I declare that, to the best of my knowledge and belief, there have been no contraventions of:
(i)
the auditor independence requirements of the Corporations Act 2001 in relation to the review; and
(ii)
any applicable code of professional conduct in relation to the review.
RSM BIRD CAMERON PARTNERS
C J HUME
Partner
Sydney, NSW
Dated: 14 March 2014
Page 11
Liability limited by a
scheme approved
under Professional
Standards Legislation
Major Offices in:
Perth, Sydney,
Melbourne, Adelaide,
Canberra and Brisbane
ABN 36 965 185 036
RSM Bird Cameron Partners is a member of the RSM network. Each member
of the RSM network is an independent accounting and advisory firm which
practises in its own right. The RSM network is not itself a separate legal entity
in any jurisdiction.
CONSOLIDATED STATEMENT OF PROFIT OR LOSS AND OTHER COMPREHENSIVE INCOME
FOR THE HALF-YEAR ENDED 31 DECEMBER 2013
2013
$
2012
$
Revenue from continuing operations
16,309
44,713
Expenses from continuing operations
Administration expenses
Employee benefit expense
Occupancy costs
Legal fees
Consultancy costs
Compliance and regulatory expenses
Depreciation
Management fees
Directors’ fees
Exploration expenditure written off
Travel
Share based payments directors
Share based payments consultants
(122,053)
(25,973)
(225)
(53,000)
(15,485)
(78,316)
(3,383)
(90,000)
(67,003)
(810,451)
(20,586)
(84,000)
(68,753)
(42,437)
(25,304)
(115,398)
(43,374)
(5,836)
(100,000)
(58,913)
(8,551)
(11,905)
(35,000)
-
(1,354,166)
(1,354,166)
(470,758)
(470,758)
(10,904)
(16,800)
3,271
(7,633)
5,040
(11,760)
TOTAL COMPREHENSIVE (LOSS) FOR THE PERIOD
(1,361,799)
(482,518)
Basic and diluted (loss) per share
(0.21) cents
(0.10) cents
(LOSS) BEFORE INCOME TAX
Income tax expense
(LOSS) FOR THE PERIOD
OTHER COMPREHENSIVE (LOSS) FOR THE PERIOD
Items that may be reclassified subsequently to profit or loss
Loss on available for sale investments
Income tax relating to components of other comprehensive
income
Other comprehensive loss for the period, net of income tax
The consolidated statement of profit or loss and other comprehensive income is to be read in conjunction
with the attached notes to the financial statements.
Page 12
CONSOLIDATED STATEMENT OF FINANCIAL POSITION
AS AT 31 DECEMBER 2013
Note
CURRENT ASSETS
Cash and cash equivalents
Trade and other receivables
Other financial assets
TOTAL CURRENT ASSETS
NON-CURRENT ASSETS
Plant and equipment
Evaluation and exploration expenditure
TOTAL NON-CURRENT ASSETS
3
4
TOTAL ASSETS
CURRENT LIABILITIES
Trade and other payables
TOTAL CURRENT LIABILITIES
NON CURRENT LIABILITIES
Deferred tax liability
TOTAL NON-CURRENT LIABILITIES
TOTAL LIABILITIES
NET ASSETS
EQUITY
Issued capital
Reserves
Accumulated losses
TOTAL EQUITY
5
31 December
2013
$
30 June 2013
$
678,841
65,525
237,997
982,363
754,046
49,237
248,901
1,052,184
3,383
7,961,807
7,965,190
6,765
8,060,220
8,066,985
8,947,553
9,119,169
498,434
498,434
830,949
830,949
33,566
33,566
36,837
36,837
532,000
867,786
8,415,553
8,251,383
28,553,094
550,534
(20,688,075)
8,415,553
27,027,128
652,676
(19,428,421)
8,251,383
The consolidated statement of profit or loss and other comprehensive income is to be read in conjunction
with the attached notes to the financial statements.
Page 13
CONSOLIDATED STATEMENT OF CHANGES IN EQUITY
FOR THE HALF-YEAR ENDED 31 DECEMBER 2013
Balance at 1 July 2013
Accumulated
Losses
$
27,027,128
(19,428,421)
652,676
-
8,251,383
-
(1,354,166)
-
(7,633)
-
(1,354,166)
(7,633)
-
(1,354,166)
(7,633)
-
(1,361,799)
1,645,946
(119,981)
-
94,512
(94,512)
-
1,645,946
(119,981)
-
28,553,093
(20,688,075)
550,531
-
8,415,549
Issued
Capital
$
Accumulated
Losses
$
Loss for the period
Asset revaluation
Total comprehensive loss for
the period
Issue of capital
Cost of raising capital
Expiry of options
Balance at 31 December 2013
Balance at 1 July 2012
Non Controlling
Interest
$
Issued
Capital
$
Reserves
$
Non Controlling
Interest
$
Reserves
$
Total Equity
$
Total Equity
$
26,992,128
(17,850,380)
728,750
(459,709)
9,410,789
Loss for the period
-
(470,758)
-
-
(470,758)
Asset revaluation
-
-
(11,760)
-
(11,760)
Total comprehensive loss for
the period
Issue of capital
Other adjustment
Balance at 31 December 2012
-
(470,758)
(11,760)
-
(482,518)
35,000
-
(459,709)
-
459,709
35,000
-
27,027,128
(18,780,847)
716,990
-
8,963,271
The consolidated statement of changes in equity is to be read in conjunction
with the attached notes to the financial statements.
Page 14
CONSOLIDATED STATEMENT OF CASH FLOWS
FOR THE HALF-YEAR ENDED 31 DECEMBER 2013
2013
$
CASH FLOWS FROM OPERATING ACTIVITIES
Receipts from operations
Payments to suppliers and employees
Department of mines co-contribution funding
Interest received
NET CASH USED IN OPERATING ACTIVITIES
2012
$
(534,172)
82,500
12,496
(439,176)
16,303
(565,368)
35,030
(514,035)
(250,000)
(812,457)
(1,062,457)
(701,453)
(701,453)
1,546,409
(119,981)
1,426,428
330,000
250,000
580,000
Net (decrease) in cash held
Cash at the beginning of the period
(75,205)
754,046
(635,488)
1,993,844
CASH AT THE END OF THE PERIOD
678,841
1,358,356
CASH FLOWS FROM INVESTING ACTIVITIES
Payments for prospects
Payments for exploration and evaluation
NET CASH USED IN INVESTING ACTIVITIES
CASH FLOWS FROM FINANCING ACTIVITIES
Proceeds from issue of shares
Cost of issue of shares
Proceeds from sale of investments
Repayment of loan
NET CASH PROVIDED BY FINANCING ACTIVITIES
The consolidated statement of cash flows is to be read in conjunction
with the attached notes to the financial statements.
Page 15
NOTES TO THE FINANCIAL STATEMENTS
1.
STATEMENT OF SIGNIFICANT ACCOUNTING POLICIES
BASIS OF PREPARATION
The half year consolidated financial statements are a general purpose financial report which has been
prepared in accordance with the requirements of the Corporations Act 2001 and Australian Accounting
Standard AASB 134: Interim Financial Reporting.
The consolidated half year financial report does not include all of the information required for a full annual
financial report. The half year financial report is to be read in conjunction with the most recent annual
financial report for the year ended 30 June 2013. This report must also be read in conjunction with any public
announcements made by Artemis Resources Limited and its controlled entities during the half year.
The financial statements have been prepared on an accruals basis and are based on historical costs, modified,
where applicable, by the measurement at fair value of certain non-current assets, financial assets and financial
liabilities.
The financial statements are presented in Australian dollars which is Artemis Resources Limited’s functional
and presentation currency.
GOING CONCERN
The financial statements have been prepared on the going concern basis, which contemplates continuity of
normal business activities and the realisation of assets and discharge of liabilities in the normal course of
business.
As disclosed in the financial statements, the consolidated entity incurred a loss of $1,354,166 and had net cash
outflows from operating activities and investing activities of $439,176 and $1,062,457 respectively for the half
year ended 31 December 2013. The consolidated entity has prepared budgets and forecasts for the following
12 months, and has determined further capital is required if the company is to continue at the planned level of
operations.
These factors indicate significant uncertainty as to whether the consolidated entity will continue as a going
concern and therefore whether it will realise its assets and extinguish its liabilities in the normal course of
business and at the amounts stated in the financial report.
The Directors believe that there are reasonable grounds to believe that the consolidated entity will be able to
continue as a going concern, after consideration of the following factors:
•
The company has been successful in raising capital whenever it has approached the markets in the past
and the directors are confident in the ability to continue to raise additional funds on a timely basis,
pursuant to the Corporations Act 2001;
•
The consolidated entity has cash at bank at balance date of $678,841, net working capital of $483,929
and net assets of $8,415,553;
•
The ability of the consolidated entity to further scale back certain parts of their activities that are nonessential so as to conserve cash should capital raising be delayed or not occur; and
•
The consolidated entity retains the ability, if required, to wholly or in part dispose of interests in
mineral exploration and development assets.
Page 16
NOTES TO THE FINANCIAL STATEMENTS
•
STATEMENT OF SIGNIFICANT ACCOUNTING POLICIES (CONTINUED)
Accordingly, the Directors believe that the consolidated entity will be able to continue as a going concern and
that it is appropriate to adopt the going concern basis in the preparation of the financial report.
The financial report does not include any adjustments relating to the amounts or classification of recorded
assets or liabilities that might be necessary if the consolidated entity does not continue as a going concern.
USE OF ESTIMATES AND JUDGEMENTS
The preparation of financial statements requires management to make judgements, estimates and
assumptions that affect the application of accounting policies and the reported amounts of assets, liabilities,
income and expenses. Actual results may differ from these estimates. Estimates and underlying assumptions
are reviewed on an ongoing basis. Revisions to accounting estimates are recognised in the period in which the
estimate is revised and in any future periods affected.
Recovery of Capitalised Exploration and Evaluation Expenditure
The future recoverability of capitalised exploration and evaluation expenditure is dependent on a number of
factors, including whether the consolidated entity decides to exploit the related site itself, or if not, whether it
successfully recovers the related exploration and evaluation asset through sale.
Factors that could impact the future recoverability include the level of reserves and resources, future
technological changes, which could impact the cost of mining, future legal changes (including changes to the
environmental restoration obligations) and changes to commodity prices.
NEW AND REVISED STANDARDS AND AMENDMENTS THEREOF AND INTERPRETATIONS EFFECTIVE
FOR THE CURRENT HALF-YEAR THAT ARE RELEVANT TO THE CONSOLIDATED ENTITY
The adoption of all the new and revised Standards and Interpretations has not resulted in any changes to the
consolidated entity’s accounting policies and has no effect on the amounts reported for the current or prior
half-years. Any new, revised or amending Accounting Standards or Interpretations that are not yet mandatory
have not been early adopted.
2.
EARNINGS PER SHARE
The calculation of basic earnings and diluted earnings per share at 31 December 2013 was based on the loss
attributable to shareholders of the parent company of $1,354,166 (2012: Loss $470,758):
2013
Cents
(0.21) cents
Basic and diluted (loss) per share
No of Shares
Weighted average number of ordinary shares:
Ordinary shares
653,998,465
Page 17
2012
Cents
(0.10) cents
No of Shares
482,018,113
NOTES TO THE FINANCIAL STATEMENTS
3.
FINANCIAL ASSETS
31 December
2013
$
Current
Available for sale financial assets
Shares in listed equity securities – at fair value
4.
237,997
30 June
2013
$
248,901
INTANGIBLE EXPLORATION AND EVALUATION EXPENDITURE
Exploration and evaluation phase costs carried forward at cost:
31 December
2013
$
7,961,807
30 June
2013
$
8,060,220
(a) Exploration and Evaluation Phase Costs
Costs capitalised on areas of interest have been reviewed for impairment factors, such as resource prices,
ability to meet expenditure going forward and potential resource downgrades. It is the Directors’ opinion that
the Group has ownership or title to the areas of interest in respect of which it has capitalised expenditure and
has reasonable expectations that its activities are ongoing.
(b) Reconciliation of movement during the period
Opening balance
Add: Exploration and evaluation expenditure capitalised
Less: Exploration expenditure written off
Closing balance
5.
31 December
2013
$
8,060,220
656,651
(755,064)
7,961,807
31 December
2012
$
7,413,797
324,046
7,737,843
SHARE CAPITAL
31 December
2013
$
ISSUED CAPITAL DETAILS
755,368,655 (30 June 2013: 484,890,396) Ordinary
shares:
30 June
2013
$
28,553,094
27,027,128
Shares
484,890,396
$
27,027,128
5,400,000
196,116,158
57,577,851
11,384,250
755,368,655
54,000
1,176,697
369,712
45,537
(119,980)
28,553,094
Reconciliation of movement during the period:
Opening balance
Movements
Issues to consultants 1 July 2013
Rights Issue 2/9/13
Share placement 12/9/13
Issues to suppliers and consultants
Cost of capital raising
Closing balance
Page 18
NOTES TO THE FINANCIAL STATEMENTS
6.
SHARE CAPITAL (CONTINUED)
Terms of Issue:
Ordinary shares
Ordinary shares participate in dividends and are entitled to one vote per share at shareholders meetings. In
the event of winding up the Company, ordinary shareholders rank after creditors and are entitled to any
proceeds of liquidation in proportion to the number of shares held.
SHARE OPTIONS
The Company issued 126,846,952 listed options exercisable at 1.2 cents before 31 March 2014 and 126,846,952
listed options exercisable at 2 cents before 31 August 2016. The options were issued on the basis of one option
of each class for every two shares issued in the September 2013 capital raise. 3,933,333 options expired during
the period. The Company currently has the following outstanding options:
Shares on
Number listed on
Exercise
Expiry Date
issue
ASX
Price
Unlisted options
4 cents
14/12/2014
10,000,000
4 cents
30/11/2014
Unlisted options
10,000,000
Listed options
1.2
cents
31/03/2014
126,846,952
126,846,952
2 cents
31/08/2016
Listed options
126,846,952
126,846,952
273,693,904
7.
253,693,904
SEGMENT INFORMATION
The consolidated entity operates in Australia. The entity has three major projects, Yandal, West Pilbara and Mount
Clement. Management reporting identifies these three segments and groups other exploration activities under Other
Projects.
Exploration
Activities
Yandal
$
Exploration
- Activities
Mt
Clement
$
Exploration
- Activities
West
Pilbara
$
Exploration
- Activities
Other
Projects
$
Unallocated
$
Total
$
-
-
-
(755,064)
16,309
(615,411)
16,309
(1,370,475)
-
-
-
(755,064)
(599,102)
(1,354,166)
1,995,290
2,445,231
2,816,968
704,318
985,746
8,947,553
-
-
200,000
-
332,000
532,000
31 December 2013
Segment revenue
Segment expenses
Results from operating
activities
Segment assets
Segment liabilities
Page 19
NOTES TO THE FINANCIAL STATEMENTS
8.
SEGMENT INFORMATION (CONTINUED)
31 December 2012
Segment revenue
Segment expenses
Results from operating
activities
Segment assets
Segment liabilities
9.
-
-
-
(8,551)
44,713
(506,920)
44,713
(515,471)
-
-
-
(8,551)
(462,207)
(470,758)
1,734,023
1,969,510
2,604,869
1,429,441
1,932,203
9,670,046
-
-
450,000
-
256,775
706,775
COMMITMENTS, CONTINGENT LIABILITIES AND CONTINGENT ASSETS
There are no contingent liabilities or contingent assets.
10. EVENTS SUBSEQUENT TO 31 DECEMBER 2013
The consolidated entity has made the following announcements since the close of the financial period:
30/01/2014
30/01/2014
11/02/2014
05/03/2014
Quarterly Cashflow Report
Quarterly Activities Report
Artemis Presenting at Proactive Investor Forum
High Antimony Grades Expand New Zone at Eastern Hills
There are no events subsequent to the end of the period that would have a material effect on the consolidated
entity’s financial statements at 31 December 2013.
Page 20
DIRECTORS’ DECLARATION
The directors declare that:
(a) the financial statements and notes, set out on pages 12 to 20, are in accordance with the Corporations Act
2001, and:
(i) comply with Accounting Standard AASB 134 Interim Financial Reporting; and
(ii) give a true and fair view of the consolidated entity’s financial position as at 31 December 2013 and its
performance, for the half-year ended on that date.
(b) there are reasonable grounds to believe that the company will be able to pay its debts as and when they
become due and payable.
Signed in accordance with a resolution of the Directors
Guy Robertson
Executive Director
Dated at Sydney this 14 March 2014
Page 21
RSM Bird Cameron Partners
Level 12, 60 Castlereagh Street Sydney NSW 2000
GPO Box 5138 Sydney NSW 2001
T +61 2 8226 4500 F +61 2 8226 4501
INDEPENDENT AUDITOR’S REVIEW REPORT
TO THE MEMBERS OF
ARTEMIS RESOURCES LIMITED
Report on the Half-Year Financial Report
We have reviewed the accompanying half-year financial report of Artemis Resources Limited which comprises the
condensed statement of financial position as at 31 December 2013, the condensed statement of comprehensive
income, condensed statement of changes in equity and condensed statement of cash flows for the half-year
ended on that date, notes comprising a summary of significant accounting policies and other explanatory
information, and the directors’ declaration of the consolidated entity comprising the company and the entities it
controlled at the half-year end or from time to time during the half-year.
Directors’ Responsibility for the Half-Year Financial Report
The directors of the company are responsible for the preparation of the half-year financial report that gives a true
and fair view in accordance with Australian Accounting Standards and the Corporations Act 2001 and for such
internal control as the directors determine is necessary to enable the preparation of the half-year financial report
that is free from material misstatement, whether due to fraud or error.
Auditor’s Responsibility
Our responsibility is to express a conclusion on the half-year financial report based on our review. We conducted
our review in accordance with Auditing Standard on Review Engagements ASRE 2410 Review of a Financial
Report Performed by the Independent Auditor of the Entity, in order to state whether, on the basis of the
procedures described, we have become aware of any matter that makes us believe that the half-year financial
report is not in accordance with the Corporations Act 2001 including: giving a true and fair view of the company’s
financial position as at 31 December 2013 and its performance for the half-year ended on that date; and
complying with Accounting Standard AASB 134 Interim Financial Reporting and the Corporations Regulations
2001. As the auditor of Artemis Resources Limited, ASRE 2410 requires that we comply with the ethical
requirements relevant to the audit of the annual financial report.
A review of a half-year financial report consists of making enquiries, primarily of persons responsible for financial
and accounting matters, and applying analytical and other review procedures. A review is substantially less in
scope than an audit conducted in accordance with Australian Auditing Standards and consequently does not
enable us to obtain assurance that we would become aware of all significant matters that might be identified in an
audit. Accordingly, we do not express an audit opinion.
Page 22
Liability limited by a
scheme approved
under Professional
Standards Legislation
Major Offices in:
Perth, Sydney,
Melbourne, Adelaide,
Canberra and Brisbane
ABN 36 965 185 036
RSM Bird Cameron Partners is a member of the RSM network. Each member
of the RSM network is an independent accounting and advisory firm which
practises in its own right. The RSM network is not itself a separate legal entity
in any jurisdiction.
Independence
In conducting our review, we have complied with the independence requirements of the Corporations Act 2001.
We confirm that the independence declaration required by the Corporations act 2001, which has been given to the
directors of Artemis Resources Limited, would be in the same terms if given to the directors as at the time of this
auditor’s report.
Conclusion
Based on our review, which is not an audit, we have not become aware of any matter that makes us believe that
the half-year financial report of Artemis Resources Limited is not in accordance with the Corporations Act 2001
including:
(a)
giving a true and fair view of the consolidated entity’s financial position as at 31 December 2013 and of its
performance for the half-year ended on that date; and
(b)
complying with Accounting Standard AASB 134 Interim Financial Reporting and Corporations Regulations
2001.
RSM BIRD CAMERON PARTNERS
Sydney, NSW
Dated: 14 March 2014
C J HUME
Partner
Page 23
CORPORATE DIRECTORY
DIRECTORS
Guy Robertson (Executive Director)
George Frangeskides (Non-Executive Director)
Shannon Coates (Non-Executive Director)
SENIOR MANAGEMENT
Trevor Woolfe (General Manager Exploration)
Guy Robertson (Company Secretary)
REGISTERED OFFICE
Level 9, 50 Margaret Street
SYDNEY NSW 2000
Ph: (02) 9078 7670
Fax: (02) 9078 7661
SHARE REGISTRY
Security Transfer Registrars Pty Limited
770 Canning Highway
APPLECROSS WA 6953
Ph: (08) 9315-2333
Fax: (08) 9315-2233
www.securitytransfer.com.au
SOLICITORS
DLA Phillips Fox
AUDITORS
RSM Bird Cameron Partners
BANKERS
Westpac Limited
WEBSITE
www.artemisresources.com.au
Page 24


© Copyright 2026