
NiveshDaily FROM RESEARCH DESK October 28, 2014
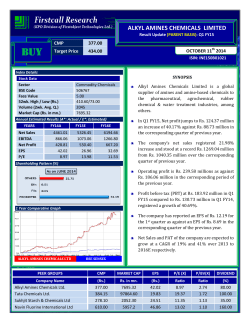
NiveshDaily October 28, 2014 INDICES Indices Previous (day) Close % chg Sensex Nifty 26,752.90 7,991.70 -0.37% -0.29% (As on 27th October, 2014) FROM RESEARCH DESK Stock Update Bajaj Finance target achieved… maintain hold with target price of Rs 2,855…. Results Preview ABB India, Jubilant Life Sciences, Lupin & Mangalam Cement Result Update Kajaria Ceramics Ltd.|Q2FY15 Result Update | Better than expectations Global Markets - Outlook IndiaNivesh Universe | Valuation Table Result Today Daljeet S. Kohli Head of Research Mobile: +91 77383 93371, 99205 94087 Tel: +91 22 66188826 [email protected] IndiaNivesh Research IndiaNivesh Securities Private Limited 601 & 602, Sukh Sagar, N. S. Patkar Marg, Girgaum Chowpatty, Mumbai 400 007. Tel: (022) 66188800 IndiaNivesh Research is also available on Bloomberg INNS, Thomson First Call, Reuters and Factiva INDNIV. Stock Update Yogesh Hotwani Research Analyst Mobile: +91 77383 93373 Tel: +91 22 66188839 [email protected] Bajaj Finance target achieved… maintain hold with target price of Rs 2,855…. We had recommended hold on Bajaj Finance in Q2FY15 result update dated 16th October 2014 at Rs 2727 with upwards revised target price of Rs 2855. On 27th October 2014, stock has reached our target price. The rationales for recommendation remains 1) strong growth in AUM of 41% yoy with focus on retail financing in Consumer and SME segment, 2) Stable asset quality with secured portfolio forming 82% of the book, Gross and Net NPA of 1.1% and 0.3% respectively and 3) best in class ROE / ROA of 20% / 3.1%. At CMP of Rs 2842, the stock is trading at P/ABV of 3x and 2.5x for FY15E and FY16E respectively. We maintain hold rating on the stock with target price of Rs 2855, valuing at 2.5x FY16E ABV. (We have initiated BUY on BFL on 24th April 2012 at Rs 847 with target price of Rs 1,040 and initiated coverage on 12th July 2013 with strong BUY rating on the stock at Rs 939 with target price of Rs 1,125. Further we have upgraded the target price continuously to Rs 2,855 which was achieved on 27th October 2014. All our earlier targets on BFL have been achieved giving the total return of 237% since 24th April 2012). IndiaNivesh Research NiveshDaily October 28, 2014 | 2 Results Preview Rahul Koli Research Associate Mobile: +91 77383 93411 Tel: +91 22 66188833 [email protected] ABB India: ABB India Ltd. Rs.In mn Net Revenue EBITDA Net Profit EPS (Rs.) Q3CY14E Q3CY13A Q2CY14A % Y-o-Y % Q-o-Q 18,502 17,859 18,222 3.6% 1.5% 1,264 1,054 1,258 19.9% 0.4% 484 381 477 27.2% 1.5% 2.28 1.80 2.25 27.2% 1.5% Standalone,Source: Company, IndiaNivesh Research Note:CY means finacial year Jan‐Dec Updates: ABB India is likely to report marginal growth in top-line of 3.6% y-o-y and 1.5% q-o-q to Rs 18.5 bn, out of a flat order book of Rs ~80 bn. We expect company to show EBITDA margin growth of 93 bps y-o-y to 6.8%, On back of Improvement in performance of power systems and process automation segment coupled with management focus on small cycle orders. Key things to watch out: Total order wins and order book at the end of quarter. Segment wise performance Valuation: At CMP of Rs 1,154, ABB is trading at CY14E and CY15E PE multiple of 90.7x and 63.8x. We do not have formal rating on the stock. Tushar Manudhane Research Analyst Jubilant Life Sciences Mobile: +91 75066 45373 Tel: +91 22 66188835 [email protected] Sales JOL IN (Rs Mn) EBITDA Adj Net Profit Q2FY15E Adj EPS Q1FY15A Y-o-Y Ch. Q-o-Q Ch. (%) 15,040 14,243 14,605 5.6 3.0 1,767 2,596 1,329 (31.9) 32.9 (15.1) 199 696 235 (71.4) - (1,502) (187) - - 199 (806) 48 NA 316.5 1.2 4.4 1.5 (71.4) (15.1) Forex (loss) gain Rep Net Profit Q2FY14A bps EBITDA Margins (%) Net Margins (%) bps 11.7 18.2 9.1 (648) 265 1.3 4.9 1.6 (356) (28) Source: Company; IndiaNivesh Research We expect Jubilant Life Sciences to show 71% y-y decline in adjusted PAT due to subdued performance in lifescience ingredients as well as pharmaceuticals business. The pharma segment was impacted in 1Q FY15 due to shut down at Montreal facility after USFDA warning letter. The site was closed for 10 weeks. We expect gradual improvement in sales from this site and as a result, the performance for the quarter is expected to be subdued. Sales are expected to grow by 5%y-y to Rs15bn and EBITDA is expected to decrease 276bps y-y to 15.5%. Key factors to watch: Pricing & volume growth, EBITDA margins, pricing scenario in chemical business and Symtet capacity utilization. Valuation: At CMP of Rs163, the stock is trading at EV/EBITDA of 8.9x and 6.1x for FY15E and FY16, respectively. We have HOLD rating with price target of Rs154 (based on 6x FY16 EV/EBITDA) on the stock. IndiaNivesh Research NiveshDaily October 28, 2014 | 3 Results Preview (contd...) Tushar Manudhane Research Analyst Lupin Mobile: +91 75066 45373 Tel: +91 22 66188835 [email protected] Sales LPC IN (Rs Mn) Q2FY15E Q2FY14A Q1FY15A Y-o-Y Ch. (%) Q-o-Q Ch. (%) 32,462 EBITDA 9,286 Adj Net Profit 5,478 26,315 32,840 23.4 (1.2) 6,232 4,062 10,579 49.0 (12.2) 6,248 34.9 (12.3) - - - - - Rep Net Profit 5,478 4,062 6,248 34.9 (12.3) Adj EPS (Rs.) 12.25 9.09 13.98 34.9 (12.3) bps bps Forex (loss) gain/exceptional EBITDA Margins (%) 28.60 23.68 32.21 492 (361) Net Margins (%) 16.88 15.44 19.03 144 (215) Source: Company; IndiaNivesh Research We expect Lupin to deliver sustained growth in earnings, with 24% y-y growth in sales and 35% y-y growth in adjusted PAT to Rs32.5bn and Rs5.5bn, respectively. This would be driven by healthy growth in domestic formulation and strong growth in US market. We expect US sales to grow by 44% y-y to US$240mn led by increased traction in existing products. Key factors to watch: Progress on approvals of key products in US market and performance in domestic formulation segment. Valuation: At CMP of Rs1,394, the stock is trading at 25.7x FY15E EPS of Rs54 and 21.7x FY16E EPS of Rs64. We have BUY rating with price target of Rs1,545 (based on 24x FY16 earnings) on the stock. Rahul Koli Research Associate Mobile: +91 77383 93411 Tel: +91 22 66188833 [email protected] Mangalam Cement Rs mn Net Revenue EBITDA Net Profit EPS (Rs) Q2FY15E Q2FY14A Q1FY15A 2,498 1,479 2,303 243 41 354 91 26 130 3.39 0.97 4.85 % Y-o-Y % Q-o-Q 68.8% 8.5% 487.6% -31.3% 251.6% -30.1% 251.6% -30.1% Standalone, Source: Company, IndiaNivesh Research Mangalam cement added capacity of 1.25 mnt in May-2014. Current total cement capacity for the company stands at 3.25 mnt For Q2FY15E, We expect Mangalam cement to report topline growth of 68.8% y-o-y and 8.5% q-o-q led by 1) increased cement capacity and 2) average blended realisation of Rs 3,633 per tn EBITDA is likely to remain under pressure on q-o-q basis due to higher power/ fuel cost and distribution expenses. EBITDA and net profit for the quarter are expected to report q-o-q decline of 31.3% and 30.1%, respectively. Valuation: At CMP of Rs 259, Mangalam cement is trading at FY15E and FY16E EV/ EBITDA multiple of 8.4x and 4.9x. We have HOLD rating on the stock with target price of Rs 276. IndiaNivesh Research NiveshDaily October 28, 2014 | 4 Result Update Kajaria Ceramics Ltd. October 28, 2014 Better than expectations Current Previous CMP : Rs.603 Rating : HOLD Rating : SELL Target : Rs.635 Target : Rs.482 STOCK INFO BSE 500233 NSE KAJARIACER Bloomberg KJC IN Reuters KAJR.BO Sector Ceramic Products Face Value (Rs) 2 Equity Capital (Rs mn) 159 Mkt Cap (Rs mn) 47,908 52w H/L (Rs) (Adj.) 690/228 3m Avg Daily Volume (BSE + NSE) 90,618 SHAREHOLDING PATTERN % Kajaria Ceramics Ltd declared Q2FY15 results that better than our estimates; however it was in-line with street estimates. We are positive on the long term prospects of the company given its leadership position and its thrust to maintain this position. We are positive on the execution capabilities of the company given the on-schedule commencement of the expansion plans. On-time execution of expansion plans is likely to result in return of 27.6% ROE in FY16E after an expected dip in FY15E at 25.4% from 27.9% in FY14. The outlook of the sector has become more robust given the government thrust on building new toilets, new government campaign of Swachh Bharat Mission and corporate participation in the mission through CSR activities. We arrive at a revised target price of Rs 635 per share by revising our target multiple upwards to 22x from 18x earlier on revised FY16E earnings estimate of Rs 28.9 per share. Accordingly, we revise our rating on the stock to HOLD from SELL earlier. Rs Mn Q2FY15 Q1FY15 5,377 779 398 5.3 5,029 798 386 5.1 Net Sales EBIDTA PAT EPS Q2FY14 QoQ (%) 4,781 653 269 3.7 YoY (%) 6.9 -2.4 3.0 3.0 12.5 19.2 47.7 43.8 INSPL Variance Estimate (%) 5073 6.0 779 0.0 323 23.1 4.3 23.1 Source: Company, IndiaNivesh Research (as on Sep. 2014) Promoters FIIs DIIs Public & Others 52.1 25.2 5.4 17.2 Net sales of the company grew 12.5% yoy to reach Rs 5377 mn in Q2FY15 from Rs 4781 mn in Q2FY14 (vs. INSPL est: Rs 5073 mn). This was driven by 7.1% yoy volume growth to reach 14.3 million square meters (msm) in Q2FY15 against 13.4 msm in Q2FY14. The share of own capacity in revenue mix stood at 52.7% in Q2FY15 (vs. INSPL est: 50.3%) against 51.8% in Q2FY14. Average realisation increased 8.3% yoy to reach Rs 376 per msm in Q2FY15 against Rs 347.1 per msm in Q2FY14. For H1FY15, net sales of the company grew 17.3% yoy to reach Rs 10406.3 mn from Rs 8874 mn in H1FY14. This was primarily driven by volume growth of 11.1% and average realisation growth of 5.6%. The volume sales for H1FY15 stood at 28.3 msm against 25.5 msm in H1FY14. The share of own capacity stood at 51.8% against 50.1% in H1FY14. Source: BSE STOCK PERFORMANCE (%) 1m KAJARIA CERAMICS 1 SENSEX 0 3m 6 3 12m 167 29 Source: Capitaline, IndiaNivesh Research KAJARIA CERAMICS v/s SENSEX 300 Revenue Details 250 200 150 100 50 Kajaria Ceramics Oct/2014 Sep/2014 Jul/2014 Aug/2014 Jun/2014 May/2014 Apr/2014 Mar/2014 Jan/2014 Feb/2014 Dec/2013 Oct/2013 Nov/2013 0 Sensex Source: Capitaline, IndiaNivesh Research Daljeet S. Kohli Head of Research Mobile: +91 77383 93371, 99205 94087 Tel: +91 22 66188826 [email protected] Prerna Jhunjhunwala Research Analyst Mobile: +91 77388 92065 Tel: +91 22 66188848 [email protected] IndiaNivesh Research Particulars Sales Volume (msm) Own JV Outsource Total Sales Value (Rs Mn) Own JV Outsource Total Avg Realisation (Rs/msm) Own JV Outsource Total Revenue Mix (%) Own JV Outsource Total Q2FY15 Q1FY15 Q2FY14 QoQ (%) 7.5 3.8 3.0 14.3 7.2 3.9 3.0 14.1 7.1 3.7 2.6 13.4 2833.4 1504.9 1038.7 5377 2553.9 1443.1 1032.3 5029.3 2402.3 1250.5 980.4 4633.2 377.3 399.2 343.9 376.0 353.7 374.8 343.0 357.2 339.3 338.9 380.0 347.1 52.7 28.0 19.3 100.0 50.8 28.7 20.5 100.0 51.8 27.0 21.2 100.0 YoY (%) H1FY15 H1FY14 %Chg 4.0 -2.1 0.3 1.6 6.1 2.2 17.1 7.1 14.65 7.61 6.04 28.3 13.2 7.0 5.3 25.5 10.8 8.9 14.6 11.1 10.9 4.3 0.6 6.9 17.9 20.3 5.9 16.1 5387.3 2948 2071 10406.3 4450.0 2370.1 2054.3 8874.4 21.1 24.4 0.8 17.3 6.7 11.2 6.5 17.8 0.3 -9.5 5.3 8.3 Bps Chg 191.4 84.5 -70.6 99.8 -120.8 -184.3 0.0 0.0 367.7 387.4 342.9 367.7 336.6 339.1 389.8 348.3 51.8 28.3 19.9 100.0 50.1 26.7 23.1 100.0 9.2 14.2 -12.0 5.6 Bps Chg 162.5 162.2 -324.7 0.0 Source: Company, IndiaNivesh Research IndiaNivesh Securities Private Limited 601 & 602, Sukh Sagar, N. S. Patkar Marg, Girgaum Chowpatty, Mumbai 400 007. Tel: (022) 66188800 IndiaNivesh Research is also available on Bloomberg INNS, Thomson First Call, Reuters and Factiva INDNIV. Result Update (contd...) EBITDA margin expansion of 82 bps EBITDA of the company grew 19.2% yoy to reach Rs 779 mn in Q2FY15 against Rs 653 mn in Q2FY14 (vs. INSPL est: Rs 779 mn). EBITDA margin expanded 82 bps at 14.5% in Q2FY15 against 13.7% in Q2FY14 (vs. INSPL est: 15.3%). The outperformance in EBITDA margin on yoy basis was on account of lower raw material cost which was partially offset by higher other expenses. Raw material cost as percentage to sales stood at 43% in Q2FY15 against 46.7% in Q2FY14. Other expenses as percentage to net sales were higher at 11.6% in Q2FY15 against 9.5% in Q2FY14. Power cost increased to 21.6% of sales in Q2FY15 against 21.2% in Q2FY14 which could be attributed to higher gas price. EBITDA for H1FY15 stood at Rs 1576 mn against Rs 1298 mn in H1FY14, signifying growth of 21.5% yoy. EBITDA margin expanded 52 bps yoy to reach 15.1% in H1FY15 from 14.6% in H1FY14. This expansion is on account of lower raw material and employee cost which was partially offset by higher power and fuel cost and other expenditure. PAT margin expanded 176 bps owing to operating and financial leverage PAT grew 47.7% yoy to reach Rs 398 mn in Q2FY15 from Rs 269 mn in Q2FY14 (vs. INSPL est.: Rs 323 mn). PAT margin expanded 176 bps to reach 7.4% in Q2FY15 from 5.6% in Q2FY14 (vs. INSPL est: 6.4%). This outperformance is on account of higher other operating income and reduction in finance cost. Finance cost reduced by 26.2% yoy to reach Rs 84 mn against Rs 114 mn in Q2FY14. Also depreciation cost increased at a lower rate than EBITDA growth, resulting in operating leverage for the company. PAT for H1FY15 stood at Rs 783 mn against Rs 527 mn in H1FY14, growth of 48.6% yoy. This growth was higher than EBITDA growth due to higher other operating income (734% yoy), lower than proportionate growth in depreciation (12.8% yoy) and decline in interest cost (-31% yoy). Effective tax rate was lower at 32.6% in H1FY15 against 34.2% in H1FY14, Expansion Plans The company commenced commercial operation of additional 4.5 msm capacity of M/s Jaxx Vitrified Pvt Ltd on 6th September 2014. The total capacity of the JV stands at 10.2 msm. The commercial operation of additional 3 msm capacity of M/s Cosa Ceramics Pvt Ltd began on 29th September 2014. With this addition, the total capacity of the JV is now increased to 5.7 msm. The remaining expansion plans announced in Q4FY14 are on schedule. Preferential allotment of shares The company allotted 3.88 mn shares on preferential basis to Westbridge Crossover Fund LLC in October 2014, on account of conversion of warrants issued earlier. The preferential allotment has been done at Rs 257.37 per share which includes a premium of Rs 255.37 per share. The revised share capital of the company would now be Rs 158.9 mn from Rs 151.2 mn earlier. Revision in estimates We have revised our estimates taking into consideration the following: IndiaNivesh Research Capacity addition of Cosa and Jaxx has come ahead of our estimates. We had assumed Jaxx and Cosa capacity to come on-stream in Q4FY15. This has resulted in pre-ponement of sales. Our volume growth assumption has consequently increased by 5.5% / 2.2% over our earlier estimates for FY15E/ FY16E respectively. This has also resulted in marginally higher average realisation in FY16E due to product mix change. The company has reported better than expected operating cash flow and working capital cycle which has resulted in lower debt for a sustainable period. Kajaria Ceramics Ltd|Result Update October 28, 2014 | 2 Result Update (contd...) We have revised our debt assumptions downwards to Rs 2461 mn/ Rs 2143 mn from Rs 3253 mn / Rs 3074 mn. Consequently, our interest cost assumptions have also been revised downwards. Our revised FY15E/ FY16E revenue and PAT increased by 4.2%/4.0% and 14.3%/ 7.8% respectively. The net profit margin is likely to expand due to higher own capacity and operating leverage. Our revised FY16E EPS stands at Rs 28.9 per share. Particulars (Rs Mn) Sales EBITDA PAT EPS EBITDA Margin (%) PAT Margin (%) New 21862 3321 1605 20.2 15.2 7.3 FY15E Earlier % Chg 20972 4.2 3271 1.5 1405 14.2 17.7 14.3 15.4 (22 bps) 6.7 64 bps New 28868 4417 2293 28.9 15.3 7.9 FY16E Earlier % Chg 27748 4.0 4414 0.1 2127 7.8 26.8 7.8 15.9 (61 bps) 7.7 28 bps Source: Company, IndiaNivesh Research Valuation and Outlook At CMP of Rs 603, the stock trades at PE of 30.0x and 20.9x its FY15E and FY16E earnings of Rs 20.2 and Rs 28.9 per share. We are positive on the long term prospects of the company given its leadership position and its thrust to maintain this position. We are positive on the execution capabilities of the company given the on-schedule commencement of the expansion plans. On-time execution of expansion plans is likely to result in return of 27.6% ROE in FY16E after an expected dip in FY15E at 25.4% from 27.9% in FY14. The outlook of the sector has become more robust given the government thrust on building new toilets, new government campaign of Swachh Bharat Mission and corporate participation in the mission through CSR activities. We arrive at a revised target price of Rs 635 per share by revising our target multiple upwards to 22x from 18x earlier on revised FY16E earnings estimate of Rs 28.9 per share. Accordingly, we revise our rating on the stock to HOLD from SELL earlier. IndiaNivesh Research Kajaria Ceramics Ltd|Result Update October 28, 2014 | 3 Result Update (contd...) Consolidated Quarterly Financials Rs in mn Q2FY15 Q1FY15 Q2FY14 QoQ (%) YoY (%) H1FY15 H1FY14 Chg (%) Net sales 5,377 5,029 4,781 6.9 12.5 10,406 8,874 17.3 Raw Materials Power and Fuel Staff cost Other expenditure Operating Expenses 2,314 1,159 502 623 4,598 2,111 1,114 485 521 4,232 2,235 1,011 428 454 4,128 9.6 4.0 3.6 19.5 8.7 3.6 14.6 17.5 37.1 11.4 4,425 2,273 988 1,144 8,830 3,963 1,849 867 897 7,577 11.7 22.9 13.9 27.5 16.5 EBITDA EBITDA Margin (%) 779 14.5% 798 15.9% 653 13.7% ‐2.4 19.2 1,576 15.1% 1,298 14.6% 21.5 Other Operating Income Other Income Depreciation Profit bef. Int. & Tax 35 14 135 692 4 13 127 688 3 20 117 558 810.5 10.9 6.9 0.6 1284.0 ‐27.6 15.3 24.0 38 27 262 1,380 5 22 232 1,092 734.8 23.3 12.8 26.3 Interest & finance ch. Profit before tax 84 608 76 612 114 444 11.2 ‐0.7 ‐26.2 36.9 160 1,220 231 861 ‐31.0 41.7 Total tax expenses Net profit 193 415 205 407 153 292 ‐5.9 2.0 26.5 42.3 398 822 294 567 35.3 45.1 Less: Minority Interest PAT 18 398 21 386 22 269 ‐17.5 3.0 ‐21.9 47.7 39 783 39 527 ‐1.8 48.6 31.7% 7.4% 33.5% 7.7% 34.3% 5.6% 32.6% 7.9% 34.2% 6.4% 5.3 5.1 3.7 10.4 7.2 Effective tax rate PAT Margins (%) EPS- Diluted 3.0 43.8 44.6 Source: Company, IndiaNivesh Research IndiaNivesh Research Kajaria Ceramics Ltd|Result Update October 28, 2014 | 4 Result Update (contd...) Consolidated Financial Statements Balance sheet Income statement Y E March (Rs m) FY 12 FY 13 FY 14 FY 15E Net sales 13115 16109 18387 21862 Growth % 37.7 22.8 14.1 18.9 Expenditure 11068 13673 15593 18541 Raw Material 6508 7485 8252 9680 Power and Fuel 2107 3066 3717 4591 Employee 1072 1364 1726 2055 Others 1381 1759 1898 2215 EBITDA 2047 2435 2794 3321 Growth % 38.6 19.0 14.7 18.9 EBITDA Margin % 15.6 15.1 15.2 15.2 Other Income 30 41 76 127 Depreciation and amortisation 393 446 470 549 EBIT 1684 2031 2400 2899 EBIT Margin % 12.8 12.6 13.1 13.3 Interest 485 454 408 345 Exceptional/Extraordinary item 0 0 0 0 PBT 1199 1577 1992 2554 PBT Margin % 9.1 9.8 10.8 11.7 Tax 381 499 678 869 Effective tax rate % 32 32 34 34 PAT 818 1078 1314 1686 Share of Minoity Interest/Associates 10 33 71 81 Net Income 809 1045 1242 1605 Growth% 33.4 29.2 18.9 29.2 PAT Margin % 6.2 6.5 6.8 7.3 FY 16E 28868 32.0 24452 12498 6524 2656 2774 4417 33.0 15.3 117 583 3950 13.7 300 0 3650 12.6 1241 34 2409 116 2293 42.9 7.9 Cash Flow Y E March (Rs m) PBT Adjustment for: Depreciation Others Changes in working capital Tax expenses Cash flow from operations Capital expenditure Free Cash Flow Others Cash flow from investments Interest Loans availed or (repaid) Proceeds from Issue of shares (incl share premium) Proceeds from Minority Interest Dividend paid (incl tax) Cash flow from Financing Net change in cash Cash at the beginning of the year Cash at the end of the year Y E March (Rs m) Share Capital Share Warrants Share Application Money Reserves & Surplus Net Worth Minority Interest Total debt Net defered tax liability Total Liabilities Gross Fixed Assets Less Depreciation Capital Work in Progress Net Fixed Assets Investments Current Assets Inventories Sundry Debtors Cash & Bank Balance Loans & advances Other Current assets Current Liabilities & provisions Net Current Assets Mis Exp not written off Total assets FY 12 147 0 0 2674 2821 72 2782 644 6319 7827 2617 24 5233 1 3676 1865 1189 72 548 2 2591 1085 0 6319 FY 13 FY 14 FY 15E FY 16E 147 151 159 159 0 250 0 0 0 4 0 0 3462 4890 7166 9137 3609 5295 7325 9296 275 409 490 605 3202 2364 2461 2143 656 713 739 812 7742 8781 11015 12856 9195 10235 13492 14301 2995 3319 3869 4452 78 405 100 30 6278 7321 9724 9879 1 1 1 1 4197 4434 4879 7159 2197 1931 1968 2743 1436 1648 1946 2540 55 61 89 862 504 791 874 1010 5 3 3 3 2734 2975 3589 4182 1463 1459 1290 2976 0 0 0 0 7742 8781 11015 12856 Key ratios FY 12 FY 13 FY 14 FY 15E FY 16E 1199 1577 1992 2554 3650 393 446 470 549 583 394 417 356 345 300 -355 -599 -154 114 -1028 -337 -483 -647 -843 -1168 1293 1358 2017 2719 2338 -751 -1543 -1568 -2952 -739 541 ‐185 449 ‐233 1599 74 52 43 0 0 ‐677 ‐1491 ‐1525 ‐2952 ‐739 -384 -407 -355 -345 -300 -23 568 -690 97 -318 0 0 -171 ‐578 37 34 72 0 170 -214 117 -17 72 55 754 62 -257 ‐486 6 55 61 750 81 -323 260 28 61 89 0 116 -323 ‐825 774 89 862 Y E March EPS (Rs) FY 12 FY 13 FY 14 FY 15E FY 16E 11.0 14.2 16.4 20.2 28.9 Cash EPS (Rs) 16.3 20.3 22.7 27.1 36.2 BVPS DPS (Rs) 38.3 49.0 2.5 3.0 70.1 3.5 92.2 117.0 3.5 3.5 PER (x) P/CEPS (x) P/BV (x) EV/EBITDA(x) M cap/sales (x) 54.9 36.9 15.7 22.7 3.4 42.5 29.8 12.3 19.3 2.8 36.7 26.6 8.6 16.8 2.5 29.9 22.2 6.5 14.7 2.2 20.9 16.7 5.2 11.0 1.7 ROCE ROE 31.5 30.8 32.1 32.5 33.5 27.9 31.4 25.4 35.9 27.6 Inventory (days) Debtors (days) Trade Payables (days) 51.9 49.8 33.1 32.5 49.4 37.6 38.3 32.7 30.2 32.9 32.5 32.9 34.7 32.1 29.2 Total Asset Turnover (x) Fixed Asset Turnover (x) 1.5 2.6 1.7 2.8 1.7 2.7 1.7 2.6 1.8 2.9 Debt/equity (x) Debt/ebitda (x) Interest Coverage (x) Dividend Yield % 1.0 1.3 3.5 0.4 0.9 1.3 4.5 0.5 0.4 0.8 5.9 0.6 0.3 0.7 8.4 0.6 0.2 0.5 13.2 0.6 Source: Company, IndiaNivesh Research IndiaNivesh Research Kajaria Ceramics Ltd|Result Update October 28, 2014 | 5 Global Markets - Outlook Dharmesh Kant VP Strategies & Fund Manager (PMS) Mobile: +91 77383 93372 Tel: +91 22 66188890 [email protected] Global Market Update US Markets: The U.S. stock market bounced between gains and losses before wrapping up Monday’s relatively benign trading session mostly unchanged. Investors flocked to stocks of large, dividend-paying companies over shares of those businesses tethered to the strength of the overall economy. But gains in shares of so-called defensive companies, like telecoms and consumer-staples stocks, which tend to pay dividends, were offset by sharp losses in so-called cyclical shares. Cyclical shares, including energy-and-materials companies, tend to be dependent on the economy. Some of the slide in cyclical energy stocks was being attributed to a research note by Goldman Sachs’s analysts, who slashed their target price for crude oil to $75 from $90. Oil prices fell more than 25% from their peak this summer. This week, markets will focus on the Federal Open Market Committee meeting, where the central bank is expected to announce the end of quantitative easing. Traders will be looking to see if the Fed drops the “considerable period” language in referencing its plans keeping rates low, at its two-day policy meeting, which concludes Wednesday. As several Fed officials have come out with dovish comments recently, investors largely expect that guidance to be reiterated. Day’s Performance: The S&P 500 closed 3 points, or 0.2%, lower at 1,961.63, with energy and materials dragging down the benchmark index. Meanwhile, the Dow Jones Industrial Average and The Nasdaq Composite eked out marginal gains, finishing up less than a percentage point. Dow industrials finished at 16,817.94 and the Nasdaq ended the day at 4,485.93. Set ups on S&P 500, Dow Industrial Average and Nasdaq 100 have corrected around 10% from their all time peak levels; we have highlighted possibility of it regularly in our daily updates. Post the correct major US indices have posted aggressive pull rally. However, we remain cautious on US markets though testing of all time highs is likely post which another round of deep correction will set in. Emerging markets: Asian stocks fell, following U.S. shares lower, after American data from home sales to manufacturing fell short of estimates and investors awaited a Federal Reserve decision on its stimulus program. Bullions & Commodities: Gold is trading at $1230 per troy ounce this morning up 0.06% from previous close. WTI Crude future is trading at 80.54 per barrel while Brent Crude future is trading at $85.28 per barrel. Currencies: The U.S. Dollar Index tracking the U.S. currency against a basket of six others currencies trading at 85.51 this morning up (0.08%) from previous close. Long term set ups up on Dollar Index are looking strong. It has broken above 84 on a weekly closing basis. Likely upside in medium term would be around 89 levels. The dollar and U.S. stocks often trade on opposite paths, with a weak dollar seen as providing investors with cheap funding to buy stocks. Plus the dollar’s drop generally helps U.S. companies’ overseas sales. Source: Bloomberg IndiaNivesh Research NiveshDaily October 28, 2014 | 5 October 28, 2014 IndiaNivesh Universe | Valuation Table Company Nam e Auto Ashok Leyland** Bajaj Auto Eicher Motors** $$$ Exide Industries Hero MotoCorp Mahindra & Mahindra** Maruti Suzuki India Tata Motors Company** TVS Motor Company SKF India $$$ Sw araj Engines Rs. Mn Mcap Rs. CMP Rs. TP Reco % (-) Dow n/(+) Up 130,199 728,467 332,345 132,940 615,627 780,589 957,503 1,510,366 121,432 58,778 12,072 46 2,517 12,262 156 3,083 1,257 3,170 504 256 1,115 972 NA 2,556 NA 195 3,157 1,212 2,214 NA 146 1,076 1,184 NEUTRAL BUY NEUTRAL BUY BUY HOLD HOLD NOT RATED HOLD HOLD BUY NA 1.5 NA 24.7 2.4 -3.6 -30.2 NA -42.9 -3.5 21.8 Information Technology Infosys Tata Consultancy Services Wipro HCL Technologies### Tech Mahindra NIIT Technologies KPIT Cummins Mastek NIIT Ltd SQS India BFSI (Thinksoft Global) 2,183,849 4,812,888 1,369,131 1,049,720 547,865 22,333 32,402 5,778 7,565 6,229 3,803 2,457 555 1,497 2,326 367 166 259 46 602 3,952 2,666 611 1,697 2,151 326 190 550 55 494 HOLD HOLD HOLD HOLD HOLD SELL BUY BUY BUY HOLD 3.9 8.5 10.1 13.4 -7.5 -11.2 14.7 112.2 20.1 -18.0 Oil & Gas Cairn India Gail India Oil India Oil & Natural Gas Corporation Reliance Industries** 519,980 617,178 359,780 3,376,424 3,044,893 277 487 599 395 941 377 468 680 462 1,111 BUY BUY BUY BUY BUY 35.9 -3.8 13.6 17.1 18.0 FMCG Bajaj Corp Godrej Consumer Products** Marico** Dabur** Tata Global Beverages** 42,561 311,250 193,559 367,782 96,656 289 914 300 209 156 279 UR UR UR 180 HOLD UR UR UR BUY -3.3 NA NA NA 15.2 (CMP as of previous day) Sales (Rs. Mn) FY14 FY15E FY16E 114,867 117,368 150,347 197,263 215,132 250,948 68,098 28,868 40,235 59,727 70,123 84,989 251,249 296,380 337,307 669,310 775,377 908,805 444,506 446,109 487,937 2,308,031 2,708,901 3,144,977 83,790 99,124 119,308 22,464 24,984 29,368 6,083 6,144 7,668 EBITDA (Rs.Mn) FY14 FY15E FY16E PAT (Rs. Mn) FY14 FY15E FY16E FY14 EPS (Rs.) FY15E FY16E P/E (x) FY15E FY16E 4,239 41,650 7,178 8,253 35,649 101,641 54,649 328,026 4,895 2,699 906 7,744 39,946 7,233 10,178 42,997 109,602 52,661 433,581 6,015 3,255 921 13,760 48,063 10,841 13,213 54,803 130,033 53,414 499,336 8,125 3,900 1,226 -1,641 33,803 3,939 4,872 21,027 46,669 28,529 119,604 1,863 1,667 670 454 35,353 4,950 6,346 28,560 48,420 28,444 189,000 3,179 2,263 702 5,623 41,098 7,700 8,362 36,624 59,464 30,374 218,829 4,627 2,724 915 -0.6 116.8 145.0 5.7 105.3 75.8 94.4 37.2 3.9 31.6 54.0 0.2 122.0 164.7 7.5 135.3 81.7 94.2 58.9 6.7 42.6 56.5 2.0 142.0 254.7 9.8 175.4 100.3 100.6 68.3 9.7 50.9 73.7 NA 20.6 74.5 20.9 22.8 15.4 33.6 8.6 38.1 26.2 17.2 23.2 17.7 48.1 16.0 17.6 12.5 31.5 7.4 26.4 21.9 13.2 539,008 604,062 972,564 1,153,284 490,894 556,458 369,777 422,853 217,827 248,231 23,142 25,724 30,319 34,324 9,541 10,683 10,393 12,429 2,349 2,827 133,604 251,528 95,078 86,660 42,076 3,631 4,204 726 598 399 146,449 291,078 106,080 93,823 45,959 3,587 4,079 739 689 552 176,100 346,961 123,185 106,711 53,147 4,090 5,011 821 1,043 576 105,999 191,639 77,967 63,690 30,288 2,305 2,490 518 178 300 117,556 217,774 81,481 70,711 31,372 2,292 2,568 436 -138 349 138,221 265,446 91,019 80,555 36,901 2,612 2,982 523 208 454 185.2 97.7 31.7 91.2 126.8 37.8 13.0 23.0 1.1 28.7 205.5 111.3 33.1 102.8 138.6 38.2 12.9 19.6 3.5 22.3 238.4 128.4 36.9 116.0 161.6 43.5 14.9 23.5 4.0 36.3 18.5 22.1 16.8 14.6 16.8 9.6 12.8 13.3 13.1 27.0 16.0 19.1 15.0 12.9 14.4 8.4 11.1 11.0 11.5 16.6 187,612 172,548 198,263 616,435 541,034 724,424 97,157 127,422 131,546 1,744,771 1,918,288 2,044,282 4,344,600 4,325,460 4,481,137 137,504 80,111 37,028 491,947 357,610 116,926 73,712 54,972 680,200 408,109 131,415 74,443 65,084 772,371 471,675 124,318 47,862 29,420 265,065 224,930 96,529 45,173 37,414 315,453 247,519 110,259 49,411 43,985 369,746 257,636 65.0 37.7 48.9 31.0 76.6 50.5 35.6 62.2 36.9 80.2 57.7 39.0 73.2 42.4 89.1 5.5 13.7 9.6 10.7 11.7 4.8 12.5 8.2 9.3 10.6 1,860 11,784 7,591 11,690 7,521 2,369 13,590 8,683 13,547 8,099 NA 16,204 10,220 16,012 9,268 1,489 7,597 4,854 9,139 4,805 1,955 9,109 5,714 10,685 4,512 NA 11,125 6,798 12,708 5,273 10.1 22.3 7.5 5.2 7.8 13.3 26.5 8.8 6.1 7.3 NA 32.4 10.5 7.3 8.5 21.7 34.5 34.1 34.3 21.4 NA 28.2 28.6 28.7 18.4 499,365 818,094 434,269 329,170 188,314 23,050 26,940 9,096 9,510 1,944 6,707 76,024 46,865 70,734 77,376 7,676 87,043 56,566 81,372 82,157 8,881 100,985 64,871 93,910 89,344 IndiaNivesh Universe | Valuation Table (contd...) Company Nam e Pharma Ajanta Pharma Aurobindo Pharma Alembic Pharma Biocon Cadila Cipla Divis Lab Dr Reddy Glenmark Jubilant Life Science Lupin Sun Pharma Ipca Lab Torrent Pharma JB Chemical Shilpa Medicare Sharon Bio-Medicine Others BASF India Ltd.** && UPL Coromandel International Ltd. Sesa Sterlite ** Kajaria Ceramics Somany Ceramics Aditya Birla Nuvo Ltd.** Radico Khaitan Ltd.** Kaveri Seed Ltd** HSIL Ltd** Jindal steel and Pow er** Godaw ari pow er and Ispat ltd Liberty Shoes Ltd HIL Ltd Pennar Industries Ltd Company Nam e Telecom Bharti Airtel Idea Cellular Sales (Rs. Mn) FY14 FY15E EBITDA (Rs.Mn) FY14 FY15E PAT (Rs. Mn) FY14 FY15E Rs. Mn Mcap Rs. CMP Rs. TP Reco % (-) Dow n/(+) Up 65,683 274,822 76,519 93,970 279,830 504,315 239,366 528,898 194,128 25,867 625,627 1,667,653 92,413 144,408 18,692 20,818 6,719 1,867 943 406 470 1,367 628 1,803 3,106 716 162 1,393 805 732 853 220 540 64 1,569 1,154 412 479 1,553 632 1,802 3,453 775 154 1,545 754 868 964 295 542 140 HOLD BUY HOLD HOLD BUY HOLD HOLD BUY HOLD HOLD BUY HOLD BUY HOLD BUY HOLD BUY -16.0 22.4 1.5 1.9 13.6 0.6 -0.1 11.2 8.3 -5.2 10.9 -6.4 18.5 13.0 33.8 0.4 120.0 12,083 80,366 18,632 28,773 70,600 101,004 25,253 132,170 60,052 58,034 112,866 160,804 32,288 40,363 10,006 5,482 13,248 13,935 121,260 22,694 33,263 84,145 112,980 31,786 150,023 69,747 62,022 135,950 186,025 35,985 48,834 11,282 7,441 15,897 16,466 137,339 26,585 38,801 99,115 136,037 38,011 169,881 80,060 70,639 158,435 202,012 40,434 48,834 12,734 9,421 19,077 3,690 21,396 3,615 7,249 12,207 21,572 10,152 25,465 11,004 11,165 30,859 71,969 8,141 10,545 1,546 1,222 1,575 4,208 24,481 4,614 7,810 16,154 22,763 13,570 33,898 14,876 10,034 33,204 78,457 8,552 12,338 1,817 1,539 1,987 4,989 25,212 5,593 8,970 19,983 28,079 16,400 37,794 17,166 11,701 39,121 81,584 9,722 13,622 2,113 1,978 2,575 2,339 11,729 2,355 4,138 8,036 13,884 7,733 21,515 5,423 1,090 18,364 31,415 4,785 6,639 615 757 703 52,090 143,990 87,281 738,352 46,114 12,034 217,014 12,432 63,347 26,105 139,569 4,959 4,741 4,969 6,535 1,203 336 305 249 610 310 1,668 93 919 395 153 151 278 666 54 NA 480 279 378 482 332 1,645 165 795 425 201 198 336 898 81 UR BUY HOLD BUY SELL HOLD BUY BUY HOLD HOLD HOLD BUY HOLD BUY BUY NA 42.9 -8.6 51.8 -21.0 7.2 -1.4 76.6 -13.5 7.5 31.8 30.8 20.8 34.9 49.2 42,347 107,709 71,269 661,524 18,387 12,629 258,934 14,122 10,111 18,582 200,040 15,409 4,835 8,657 11,133 51,510 121,670 111,207 796,156 20,972 15,853 277,997 15,878 12,136 22,029 259,617 17,103 5,808 10,984 16,366 54,903 138,703 125,040 895,475 27,748 20,483 310,730 17,859 14,615 26,642 315,044 18,976 7,410 13,840 20,784 3,642 20,484 9,982 203,918 2,818 868 46,232 1,935 2,213 2,651 55,287 2,119 394 406 898 3,294 22,009 9,675 273,759 3,271 1,013 53,413 2,273 2,973 3,229 74,281 2,854 473 1,074 1,637 4,368 26,543 10,879 303,679 4,414 1,320 62,431 2,469 3,679 4,107 84,648 3,152 654 1,748 2,182 1,279 9,498 3,565 62,985 1,242 289 11,429 712 2,090 340 19,104 578 132 71 260 Rs. Mn Rs. Rs. Mcap CMP TP Reco (-) Dow n/(+) Up 1,657,122 564,119 415 157 NA 165 SELL HOLD NA 5.2 % Sales (Rs. Mn) FY14 FY15E 857,461 264,320 960,690 302,317 FY16E FY16E NA 341,618 EBITDA (Rs.Mn) FY14 FY15E 277,778 81,430 318,082 96,741 FY16E FY16E 356,133 111,026 FY16E FY14 EPS (Rs.) FY15E FY16E 2,772 15,470 3,124 5,008 10,287 14,240 9,951 22,035 8,965 1,127 24,357 62,357 5,501 7,826 1,559 994 1,054 3,262 18,650 3,834 5,780 10,287 20,305 11,962 24,401 10,460 2,638 28,859 65,078 6,847 7,826 1,784 1,306 1,471 66.4 40.2 12.5 20.8 39.3 17.3 58.3 126.0 20.0 6.9 40.8 15.2 37.9 39.2 7.3 19.6 4.7 78.4 53.2 16.6 23.3 50.2 17.7 75.0 129.4 33.2 7.1 54.3 30.1 43.3 49.1 18.4 25.8 10.0 92.3 64.1 20.3 26.9 64.7 25.3 90.1 143.3 38.8 16.6 64.4 31.4 52.7 46.2 21.1 33.9 13.9 23.8 17.7 24.5 20.2 27.2 35.5 24.0 24.0 21.6 22.9 25.7 26.8 16.9 19.3 12.0 20.9 6.4 20.2 14.7 20.0 17.5 21.1 24.8 20.0 21.7 18.4 9.8 21.6 25.6 13.9 18.5 10.4 15.9 4.6 1,290 12,335 5,310 68,027 1,405 451 14,047 875 2,897 1,082 22,736 907 168 563 713 1,679 16,338 6,052 85,650 2,127 646 17,770 947 3,640 1,283 23,871 1,146 286 1,019 1,063 23.6 21.6 15.4 21.5 16.7 8.3 91.1 3.7 30.3 5.1 20.5 17.7 7.9 14.3 2.0 37.0 28.7 18.8 22.6 17.7 11.6 108.1 7.0 39.6 16.0 22.6 27.7 9.9 75.4 5.4 43.0 37.9 21.4 29.1 26.8 16.6 153.4 7.5 48.4 26.0 26.1 35.0 16.8 136.5 8.1 32.5 11.7 16.2 11.0 34.5 26.7 15.4 13.4 23.2 24.7 6.7 5.5 28.1 8.8 10.1 28.0 8.9 14.3 8.6 22.8 18.6 10.9 12.5 19.0 15.2 5.9 4.3 16.6 4.9 6.7 FY16E FY14 EPS (Rs.) FY15E FY16E NA 32,454 7.0 5.9 8.7 7.7 NA 9.2 PAT (Rs. Mn) FY14 FY15E 27,727 19,678 29,683 27,208 P/E (x) FY15E FY16E EV/EBITDA (x) FY15E FY16E 7.2 6.5 6.5 5.7 IndiaNivesh Universe | Valuation Table (contd...) Company Nam e Power Adani Pow er** CESC Ltd Coal India JSW Energy** NHPC NTPC Pow er Grid Corporation Reliance Pow er Torrent Pow er** Tata Pow er Company** Company Nam e Banking & Financial Services State Bank of India Punjab National Bank Allahabad Bank Bank of Baroda Corporation Bank Federal Bank Canara Bank ICICI Bank HDFC Bank** Axis Bank DCB Bank Karur Vysya Bank Sales (Rs. Mn) FY14 FY15E EBITDA (Rs.Mn) FY14 FY15E PAT (Rs. Mn) FY14 FY15E Rs. Mn Mcap Rs. CMP Rs. TP Reco % (-) Dow n/(+) Up 130,385 83,919 2,251,784 122,020 220,860 1,202,601 743,147 201,268 74,907 239,224 45 672 357 74 20 146 142 72 159 88 50 NR 422 NA NA 190 164 118 NA 104 SELL NOT RATED HOLD NOT RATED NOT RATED BUY BUY BUY NOT RATED BUY 10.1 NA 18.4 NA NA 30.3 15.5 64.5 NA 17.6 Rs. Mn Mcap Rs. CMP Rs. TP Reco % (-) Dow n/(+) Up 1,939,448 337,648 58,491 388,900 54,661 118,306 179,153 1,820,638 2,166,250 1,007,200 24,226 57,872 2,598 933 107 906 326 138 388 1,573 897 427 86 540 3,003 827 87 1,058 NA 153 383 1,600 910 450 88 620 BUY HOLD SELL BUY NOT RATED BUY HOLD HOLD HOLD BUY HOLD BUY 15.6 -11.3 -19.0 16.8 NA 10.6 -1.4 1.7 1.4 5.4 2.1 14.8 492,822 161,460 53,113 119,654 37,837 22,286 89,444 164,756 191,096 119,516 3,684 12,837 565,451 175,889 60,883 135,576 43,107 24,527 105,599 183,854 223,729 144,645 4,726 14,497 633,554 200,450 67,548 154,389 50,840 29,066 124,515 207,915 271,088 170,657 5,959 17,362 321,092 113,845 40,204 93,532 30,394 14,804 67,962 165,946 149,386 114,561 1,880 8,378 373,776 119,335 42,062 102,214 34,848 16,334 76,545 184,169 175,025 130,925 2,500 9,054 423,230 138,295 47,937 118,014 43,195 19,670 86,643 213,622 214,348 153,908 3,366 11,203 108,912 33,426 11,720 45,411 5,617 8,389 24,382 98,105 87,435 62,177 1,514 4,296 13.7 0.5 16.6 1.1 -1.4 13.6 18,989 22,153 19,821 116,830 2,295 4,038 21,910 27,202 25,089 137,304 2,658 5,202 25,985 33,694 28,813 157,365 3,088 6,581 18,470 13,490 13,929 5,060 1,466 1,278 20,915 16,832 16,913 5,574 1,712 1,949 24,971 20,553 19,507 6,703 1,995 2,750 13,172 7,190 5,948 1,395 1,287 370 LIC Housing Finance 168,658 334 380 BUY Bajaj Finance 142,499 2,842 2,855 HOLD L&T Finance Holding 117,932 69 80 BUY Max India+++ 86,730 325 329 HOLD CARE+++ 38,164 1,316 1,298 HOLD CFL 26,297 317 360 BUY Note: ** Bloomberg Est; +++ Manufacturing Format; $$$ Calendar Year; ### Y/E June, && EBIT Source: Company Filings; IndiaNivesh Research 157,541 101,109 688,100 87,054 74,159 789,217 156,754 51,748 86,811 356,487 194,821 59,564 842,422 93,675 78,375 810,753 178,396 63,220 98,706 373,593 FY16E 206,000 63,367 891,341 95,036 81,456 888,817 210,265 89,011 103,980 392,487 Net Interest Income (Rs. Mn) FY14 FY15E FY16E 49,899 17,375 178,713 NA 44,460 198,795 133,129 19,167 13,046 77,118 66,541 15,535 208,109 33,143 51,108 228,669 152,433 21,394 18,244 84,519 FY16E 72,169 16,233 240,101 31,718 52,503 207,156 180,051 39,784 19,376 87,149 Pre-Tax Pre-Prov. Profit (Rs.Mn) FY14 FY15E FY16E -2,906 4,916 151,117 7,547 12,188 114,036 45,476 10,267 1,053 -2,600 FY16E FY14 EPS (Rs.) FY15E FY16E 5,594 7,241 208,341 11,841 25,236 105,628 66,617 19,735 1,461 18,477 -1.04 39.35 23.92 4.60 1.02 13.83 9.47 3.66 2.23 -1.61 -0.31 44.10 28.40 7.32 2.09 11.69 10.51 3.72 11.95 6.16 1.82 66.79 33.00 7.37 2.27 12.69 12.73 7.00 10.23 7.27 FY16E FY14 EPS (Rs.) FY15E FY16E 132,987 37,160 11,077 50,972 2,729 9,974 26,394 107,636 103,718 69,631 1,899 4,759 155,704 41,692 13,827 61,329 7,322 12,039 29,322 121,254 128,211 81,741 2,060 5,870 146.0 92.0 21.5 105.4 33.5 9.8 52.9 85.0 36.3 26.4 6.0 40.1 178.0 103.0 20.3 118.4 16.3 11.7 57.2 93.0 42.8 30.0 7.6 39.5 209.0 115.0 25.4 142.4 43.7 14.1 63.6 105.0 52.9 35.0 8.2 48.7 2.0 1.3 1.0 1.2 0.8 1.6 0.8 2.4 4.1 2.4 1.7 1.6 1.8 1.1 0.9 1.0 0.8 1.4 0.7 2.1 3.4 2.0 1.5 1.5 13,677 8,679 6,693 1,551 1,452 847 16,332 10,523 8,344 1,777 1,680 1,299 26.1 143.0 3.5 5.2 44.4 4.5 27.1 174.0 3.9 5.8 50.1 10.3 32.3 212.0 4.9 6.7 57.9 14.1 2.0 3.0 1.7 2.8 6.7 2.2 1.8 2.5 1.5 2.6 5.8 1.9 -487 6,815 179,348 11,904 23,309 96,946 54,965 7,723 1,279 15,396 PAT (Rs. Mn) FY14 FY15E P/BV (x) FY15E FY16E 2.0 1.4 4.7 1.6 0.7 1.3 1.9 1.0 1.2 1.6 1.8 1.3 4.1 1.5 0.7 1.2 1.7 0.9 1.3 1.5 P/ABV (x) FY15E FY16E Result Today ABB India Jubilant Life Sciences Lupin Mangalam Cement Nestle India Ranbaxy Laboratories SRF IndiaNivesh Securities Private Limited 601 & 602, Sukh Sagar, N. S. Patkar Marg, Girgaum Chowpatty, Mumbai 400 007. Tel: (022) 66188800 / Fax: (022) 66188899 e-mail: [email protected] | Website: www.indianivesh.in Disclaimer: This document has been prepared by IndiaNivesh Securities Private Limited (IndiaNivesh), for use by the recipient as information only and is not for circulation or public distribution. This document is not to be reproduced, copied, redistributed or published or made available to others, in whole or in part without prior permission from us. This document is not to be construed as an offer to sell or the solicitation of an offer to buy any security. Recipients of this document should be aware that past performance is not necessarily a guide for future performance and price and value of investments can go up or down. The suitability or otherwise of any investments will depend upon the recipients particular circumstances. The information contained in this document has been obtained from sources that are considered as reliable though its accuracy or completeness has not been verified by IndiaNivesh independently and cannot be guaranteed. Neither IndiaNivesh nor any of its affiliates, its directors or its employees accepts any responsibility or whatever nature for the information, statements and opinion given, made available or expressed herein or for any omission or for any liability arising from the use of this document. Opinions expressed are our current opinions as of the date appearing on this material only. IndiaNivesh directors and its clients may have holdings in the stocks mentioned in the report. To unsubscribe please send a mail to [email protected] Home IndiaNivesh Research NiveshDaily October 28, 2014 | 6 IndiaNivesh Research is also available on Bloomberg INNS, Thomson First Call, Reuters and Factiva INDNIV.


© Copyright 2026