
Jani Trygg
Jani Trygg
Functional Cellulose Microspheres For Pharmaceutical Applications
Jani Trygg
Functional Cellulose Microspheres For
Pharmaceutical Applications
Laboratory of Fibre and Cellulose Technology
Faculty of Science and Engineering
Åbo Akademi University
2015
Turku / Åbo 2015
9 789521 231681
Åbo Akademis förlag | ISBN 978-952-12-3168-1
Jani Trygg B5 Kansi VALISTETTY s17 Inver260 28 January 2015 8:36 AM
”Education is what survives
when what has been learned
has been forgotten.”
-B.F. Skinner
Jani Trygg
Born 1981, Turku, Finland.
He received M.Sc. in chemistry from University of Turku in 2008,
started Ph.D. studies at Laboratory of Fibre and Cellulose Technology
in Åbo Akademi in 2009 and had his Ph.D. dissertation in Åbo Akademi
in 2015.
Åbo Akademis förlag
Tavastgatan 13, FI-20500 Åbo, Finland
Tfn +358 (0)2 215 3478
E-post: forlaget@abo.fi
Försäljning och distribution:
Åbo Akademis bibliotek
Domkyrkogatan 2–4, FI-20500 Åbo, Finland
Tfn +358 (0)2 -215 4190
E-post: publikationer@abo.fi
Functional Cellulose Microspheres For
Pharmaceutical Applications
Jani Trygg
Laboratory of Fibre and Cellulose Technology
Faculty of Science and Engineering
Åbo Akademi University
Turku / Åbo 2015
Supervisor
Professor Pedro Fardim
Laboratory of Fibre and Cellulose Technology
Faculty of Science and Engineering
Åbo Akademi University, Finland
Opponent
Professor Patrick Navard
Ecole des Mines de Paris / CEMEF, France
Reviewers
Professor Patrick Navard
Ecole des Mines de Paris / CEMEF, France
Professor Ilkka Kilpeläinen
Laboratory of Organic Chemistry
Department of Chemistry, Faculty of Science
University of Helsinki, Finland
ISBN 978-952-12-3168-1
Suomen Yliopistopaino Oy, Juvenes Print, Turku 2015
Abstract
Jani Trygg
Functional Cellulose Microspheres for Pharmaceutical Applications
Doctor of Philosophy in Chemical Engineering Thesis
Åbo Akademi University, Faculty of Science and Engineering,
Laboratory of Fibre and Cellulose Technology, Turku 2015.
Keywords: Cellulose, pretreatment, viscosity, degree of polymerisation, dissolution, coagulation, regeneration, microsphere, bead, surface area, porosity,
functionalisation, oxidation, drug delivery, release profile
Dissolving cellulose is the first main step in preparing novel cellulosic materials. Since cellulosic fibres cannot be easily dissolved in water-based solvents,
fibres were pretreated with ethanol-acid solution prior to the dissolution. Solubility and changes on the surface of the fibres were studied with microscopy
and capillary viscometry. After the treatment, the cellulose fibres were soluble
in alkaline urea-water solvent. The nature of this viscous solution was studied
rheologically.
Cellulose microspheres were prepared by extruding the alkaline cellulose solution through the needle into an acidic medium. By altering the temperature
and acidity of the medium it was possible to adjust the specific surface area
and pore sizes of the microspheres. A typical skin-core structure was found in
all samples.
Microspheres were oxidised in order to introduce anionic carboxylic acid
groups (AGs). Anionic microspheres are more hydrophilic; their water-uptake
increased 25 times after oxidation and they could swell almost to their original
state (88%) after drying and shrinking. Swelling was studied in simulated
physiological environments, corresponding to stomach acid and intestines
(pH 1.2-7.4).
Oxidised microspheres were used as a drug carriers. They demonstrated a
high mass uniformity, which would enable their use for personalised dosing
among different patients, including children. The drug was solidified in
microspheres in amorphous form. This enhanced solubility and could be used
for more challenging drugs with poor solubility. The pores of the microspheres
also remained open after the drug was loaded and they were dried. Regardless
of the swelling, the drug was released at a constant rate in all environments.
iii
Tiivistelmä
Jani Trygg:
Functional Cellulose Microspheres for Pharmaceutical Applications
(Muokatut selluloosahelmet farmaseuttisissa sovelluksissa)
Väitöskirja
Åbo Akademi, Luonnontieteiden ja tekniikan tiedekunta,
Kuitu- ja selluloosateknologian laboratorio, Turku 2015.
Avainsanat: Selluloosa, esikäsittely, viskositeetti, polymerisaatioaste, liuotus,
koagulointi, regenerointi, helmi, pinta-ala, huokoisuus, muokkaus, hapetus,
lääkeannostelu, vapautumisprofiili
Selluloosan liuotus on ensiaskel valmistettaessa uusia selluloosamateriaaleja.
Koska selluloosakuituja ei voi helposti liuottaa vesi-pohjaisiin liuottimiin,
kuidut esikäsiteltiin etanoli-hapolla ennen liuotusta. Muutoksia kuitujen pintarakenteessa ja liukoisuudessa tutkittiin mikroskoopeilla ja kapillaariviskometrilla. Käsittelyn jälkeen kuidut liukenivat emäksiseen urean vesiliuokseen.
Tämän liuoksen luonnetta tutkittiin reologisesti.
Selluloosahelmet valmistettiin pursuttamalla alkaalinen liuos pisaroittain
neulan läpi happamaan vesiliuokseen. Muuttamalla vesiliuoksen lämpötilaa ja happamuutta voitiin säädellä helmien ominaispinta-alaa ja huokosia.
Tyypillinen kuori-ydin -rakenne löydettiin kaikista näytteistä.
Helmiin lisättiin anionisia karboksyylihappo-ryhmiä hapettamalla. Anioniset
helmet olivat enemmän hydrofiilisiä; niiden vedenottokyky kasvoi 25 kertaiseksi hapetuksen jälkeen ja ne turposivat lähes alkuperäisiin mittoihin
(88%) kuivauksen aikana tapahtuneen kutistumisen jälkeen. Turpoamista
tutkittiin keinotekoisissa fysiologisissa ympäristöissä, jotka vastasivat vatsahappoa ja suolistoa (pH 1,2-7,4).
Hapetettuja selluloosahelmiä käytettiin lääkkeenkantajina. Ne osoittivat erittäin tasaista massajakaumaa, jota voitaisiin hyödyntää esimerkiksi henkilökohtaisessa lääkkeenannostelussa vaikka lapsipotilailla. Lääke oli kuivunut kidemuodottomaksi helmen huokosiin, joka osaltaan edisti vapautumista. Tätä
voitaisin käyttää heikkoliukoisten lääkeaineiden kuljettamisessa elimistöön.
Huokoset pysyivät auki kun lääkkeillä ladatut helmet kuivattiin. Huolimatta
turpoamisnopeudesta, lääkeaine vapautui vakionopeudella jokaisessa tutkitussa ympäristössä avonaisten huokosten ansiosta.
v
Sammanfattning
Jani Trygg: Functional Cellulose Microspheres for Pharmaceutical Applications (Funktionella cellulosapärlor för farmaceutiska tillämpningar)
Avhandling
Åbo Akademi, Fakulteten för naturvetenskaper och teknik,
Laboratoriet för fiber- och cellulosateknologi, Åbo 2015.
Nyckelord: Cellulosa, förbehandling, viskositet, polymerisationsgrad, upplösning, koagulering, regenerering, cellulosapärla, ytarea, porositet, funktionalisering, oxidering, läkemedelsdosering, profil av läkemedelsfrisättning
Upplösning av cellulosa är det första steget vid framställning av nya cellulosamaterial. Eftersom cellulosabaserade fibrer inte kan lätt upplösas i vattenbaserade lösningsmedel, gjordes en förbehandling av fibrerna med en etanolsyralösning före själva upplösningen. Förändringar i fibrernas ytstruktur och
upplösningsegenskaper studerades med mikroskop och kapillärviskometri.
Efter förbehandlingen löste sig fibrerna i alkalisk urea-vatten lösning. Denna
cellulosalösnings egenskaper karakteriserades reologiskt.
Cellulosapärlor framställdes genom att extrudera den alkaliska cellulosalösningen genom en nål till en sur vattenlösning. Genom att ändra vattenlösningens temperatur och surhetsgrad var det möjligt att skräddarsy cellulosapärlornas specifika ytarea och porstorlek. Alla prov visade sig ha en typisk
skinn-kärna struktur.
Cellulosapärlorna oxiderades för att införa anjoniska karboxylsyragrupper.
De anjoniska cellulosapärlorna visade en större hydrofilisitet; deras vattenupptagningsförmåga ökade 25-falt efter oxideringen och de kunde nästan svälla
tillbaka till sin ursprungliga storlek (88%) efter föregående torkning och
krympning. Svällningen undersöktes i simulerade fysiologiska miljöer, vilka
motsvarade magsyra och tarmar (pH 1,2-7,4).
Oxiderade cellulosapärlor användes som läkemedelsbärare. De visade sig
ha en väldigt jämn massafördelning, vilket kunde utnyttjas till personliga
läkemedelsdoseringar för olika patienter, exempelvis till barn. Medicinen var
solidifierad inne i cellulosapärlorna i en amorf form, vilket delvis gynnade
läkemedlets frigivning och löslighet. Detta kunde användas till att transportera svårlösliga läkemedel till kroppen. Cellulosapärlornas porer förblev
öppna efter att pärlorna fyllts med läkemedel och torkats. Oberoende av
svällningshastigheten frigjordes läkemedlet med en konstant hastighet i alla
de studerade miljöerna tack vare de öppna porerna.
vii
Contents
Abstract
iii
Tiivistelmä
v
Sammanfattning
vii
List of figures
xi
List of tables
xvii
Nomenclature
Preface
xx
xxvii
1 Introduction
1
1.1 Cellulose sources and structures . . . . . . . . . . . . . . . . . . .
4
1.2 Pretreatment of cellulosic pulp prior to dissolution . . . . . . .
6
1.3 Cellulose dissolution, regeneration, and coagulation . . . . . . .
7
1.3.1 Derivatisation and dissolution . . . . . . . . . . . . . . .
8
1.3.2 Direct dissolution . . . . . . . . . . . . . . . . . . . . . . .
10
1.4 Controlled release systems . . . . . . . . . . . . . . . . . . . . .
12
1.5 Characterisation of cellulosic shapes . . . . . . . . . . . . . . . . 14
1.5.1 Characterisations for pharmaceutical applications . . .
2 Experimental
2.1 Paper I: HyCellSolv-pretreatment and the solubility of the pulp
19
23
23
2.1.1 HyCellSolv-pretreatment . . . . . . . . . . . . . . . . . .
23
2.1.2 Changes in fibre surface morphology . . . . . . . . . . .
23
2.1.3 Degree of polymerisation . . . . . . . . . . . . . . . . . . . 24
2.1.4 Dissolution mechanism . . . . . . . . . . . . . . . . . . . . 24
2.1.5 Solubility of cellulose in 7% NaOH-12% urea-water . . . . 24
2.2 Paper II: Physicochemical design of the microspheres . . . . .
25
2.2.1 Preparation of the physicochemically designed microspheres . . . . . . . . . . . . . . . . . . . . . . . . . . . . .
25
2.2.2 Dimensional attributes and morphological features . .
25
ix
Contents
2.2.3 Intrinsic properties: pore size distribution and specific
surface area . . . . . . . . . . . . . . . . . . . . . . . . . .
26
2.3 Paper III: Chemical functionalisation of the microspheres . . . . 27
2.3.1 Anelli’s oxidation . . . . . . . . . . . . . . . . . . . . . . . . 27
2.3.2 Porosity and pore size distribution . . . . . . . . . . . . .
28
2.3.3 Distribution and quantity of the anionic groups . . . . .
29
2.4 Paper IV: Drug delivery with functionalised microspheres . . .
29
2.4.1 Drug loading and uniformity of the mass . . . . . . . . .
30
2.4.2 Solid state analysis: ATR/FTIR and DSC . . . . . . . . . .
30
2.4.3 Swelling behaviour of the microspheres . . . . . . . . . . . 31
2.4.4 Release profiles . . . . . . . . . . . . . . . . . . . . . . . . . 31
3 Results and discussion
33
3.1 Paper I: Pretreatment and dissolution of cellulosic fibres . . . .
33
3.1.1 Morphological changes and degree of polymerisation:
Influence on dissolution mechanism . . . . . . . . . . .
33
3.1.2 Nature of the 0-5% cellulose-7% NaOH-12% urea-water
solutions . . . . . . . . . . . . . . . . . . . . . . . . . . . .
36
3.2 Paper II: Physicochemical design of microspheres . . . . . . . .
38
3.2.1 Size, shape, and weight of microspheres . . . . . . . . .
38
3.2.2 Morphology of the cross-sections and surfaces of the
microspheres . . . . . . . . . . . . . . . . . . . . . . . . .
40
3.2.3 Intrinsic properties . . . . . . . . . . . . . . . . . . . . . . . 44
3.3 Paper III: Chemical modification of microspheres . . . . . . . . . 47
3.3.1 Oxidation mechanism and the amount of generated anionic groups . . . . . . . . . . . . . . . . . . . . . . . . . . . 47
3.3.2 Spectroscopic qualification and the distribution of anionic groups . . . . . . . . . . . . . . . . . . . . . . . . . .
49
3.3.3 Structural changes . . . . . . . . . . . . . . . . . . . . . . . 51
3.4 Paper IV: Drug delivery . . . . . . . . . . . . . . . . . . . . . . . .
53
3.4.1 Uniformity of mass and drug content . . . . . . . . . . .
53
3.4.2 Solid state analysis . . . . . . . . . . . . . . . . . . . . . .
55
3.4.3 Swelling behaviour of placebo and loaded microspheres . 57
3.4.4 Release profiles: A comparison of non-swelling and swelling
models . . . . . . . . . . . . . . . . . . . . . . . . . . . . . 59
3.5 Paper V: Discussion. Potential applications . . . . . . . . . . . .
62
3.5.1 Chromatographic columns . . . . . . . . . . . . . . . . .
62
3.5.2 Anchoring and immobilisation . . . . . . . . . . . . . . . . 64
x
Contents
3.5.3 Drug delivery . . . . . . . . . . . . . . . . . . . . . . . . . . 64
4 Concluding remarks
67
5 Acknowledgements
69
Bibliography
69
6 Original research
85
6.1 Trygg, J. & Fardim, P., Cellulose 18 (2011) 987-994. . . . . . . . . 86
6.2 Trygg, J.& et al., Carbohydrate Polymers 1 (2013) 291-299. . . . 95
6.3 Trygg, J. & et al., Cellulose 21 (2014) 1945-1955 . . . . . . . . . . 105
6.4 Trygg, J. & et al., Macromolecular Materials and Engineering
(2014) . . . . . . . . . . . . . . . . . . . . . . . . . . . . . . . . . . . 117
6.5 Gericke, M. & et al., Chemical Reviews 2013. . . . . . . . . . . . 126
xi
List of Figures
1.1 Cellulosic shapes. (Top) Native jute fibres and bacterial cellulose
(photograph and SEM image), (bottom) regenerated cellulose
fibres and films from viscose, and coagulated sponge and beads
from NaOH/urea/water. Image of bacterial cellulose from Chen
et al. (2010) and of beads from Trygg et al. (2014). . . . . . . . .
3
1.2 Representation of (A) cellulose Iβ and (B) cellulose II crystal
structures on (A1,B1) a-b plane and (A2, B2) molecules in lattice
planes 100 and 010, respectively. Figure from Zugenmaier (2001). 5
1.3 Schematic presentation of the processes from cellulosic fibres
to novel shapes. . . . . . . . . . . . . . . . . . . . . . . . . . . . .
9
1.4 Different release mechanisms. (A) Diffusion through reservoir
coated with polymer matrix, (B) drug uniformly distributed in
matrix, (C) polymer degrades and releases the embedded drug,
(D) contact with reagent or solvent in environment releases the
linked drug from matrix, (E) polymer swells and allows drug to
move outwards, (F) drug released only through porous holes,
(G) drug is pushed out though the laser-drilled hole by osmotic
pressure, and (H) release is activated e.g. by magnetic field
squeezing the drug-containing pores. Figure from Langer (1990). 13
1.5 Image analysis of microspheres with Fiji software (Schindelin,
2008). Figure from Gericke et al. (2013). . . . . . . . . . . . . . . . 14
1.6 Illustration of accessible, closed and inaccessible pores by probe
molecules. Adapted from Stone and Scallan (1968). . . . . . . .
16
1.7 Interfaces of CO2 and cellulose solution during the coagulation of cellulose microsphere. Sphere cut with blade, water
exchanged to acetone and liquid CO2 and then critical point
dried prior to FESEM imaging. Magnifications 19× and 250×.
Unpublished results. . . . . . . . . . . . . . . . . . . . . . . . . .
20
1.8 Angle of repose of dry cellulose beads. . . . . . . . . . . . . . . .
20
1.9 Old annular shear cell apparatus. Figure from Carr and Walker
(1968). . . . . . . . . . . . . . . . . . . . . . . . . . . . . . . . . . . . 21
xiii
List of Figures
2.1 Oxidation-reduction cycle of reagents in cellulose-TEMPO/NaClO/NaClO2
system. Figure from Hirota et al. (2009). . . . . . . . . . . . . . . 28
2.2 Determination of anionic groups (-COOH) from solids using the
back titration method. The excess of acid (H+ ) was measured
by titration, then microspheres were deprotonated by adding
NaOH and finally the excess of alkali (OH− ) was back titrated.
30
3.1 SEM-images of reference (A,B) and pulp treated with HyCellSolv
for 2 h at 25 (C,D) and 75 ◦ C (E,F). Magnifications are 5,000 in
the top row and 50,000× in the bottom. . . . . . . . . . . . . . . . 34
3.2 Viscosity average degree of polymerisation (DPν ) of HyCellSolvpretreated dissolving pulp at various temperatures and times.
Optical images demonstrate the behaviour of the fibres in 0.2 M
CED after corresponding pretreatment conditions. . . . . . . . . 34
3.3 0.2% HyCellSolv-pretreated pulp in 7% NaOH-12% urea-water.
Pretreatment time 2 h and temperatures (A) 25, (B) 45, (C) 55,
and (D) 65 ◦ C. Scale bars are 100 µm. . . . . . . . . . . . . . . .
35
3.4 (Left) Viscosity of 0-5% HyCellSolv-cellulose in 7% NaOH-12%
urea-water at 10-25 ◦ C as a function of shear rate. (Right) Apparent activation energies Ea of viscous flow on shear rates 0, 10,
100 and 1000 s−1 . . . . . . . . . . . . . . . . . . . . . . . . . . . .
36
3.5 Storage and loss moduli of 4-6% cellulose-7% NaOH-12% ureawater solutions. Cross-sections of the moduli indicate the gelation points. . . . . . . . . . . . . . . . . . . . . . . . . . . . . . . .
38
3.6 The effect of (A) temperature, (B) acid concentration and (C)
cellulose concentration on volume (M N), weight (H O), circularity (◦ •) and porosity (■ ä). Constant parameters are given
above the figures. . . . . . . . . . . . . . . . . . . . . . . . . . . .
40
3.7 FE-SEM images of the surface of the microspheres. 5% cellulose
solution coagulated in (A) 0.5, (B) 2, (C) 6 and (D) 10 M HNO3 at
25 ◦ C. Magnification is 10,000×. . . . . . . . . . . . . . . . . . . . 41
xiv
3.8 FE-SEM images of the interior of cross-sections of the microspheres. 5% cellulose solution coagulated in (A) 0.5, (B) 2, (C) 6
and (D) 10 M HNO3 at 25 ◦ C. Magnification is 10,000×. . . . . .
42
3.9 FE-SEM images of the edge of the cross-sections of the microspheres. 5% cellulose solution coagulated in (A) 0.5, (B) 2, (C) 6
and (D) 10 M HNO3 at 25 ◦ C. Magnification is 250×. . . . . . .
43
List of Figures
3.10 FE-SEM images of the surface, edge and interior of the CPD
cellulose microspheres coagulated in 2 M HNO3 at 25 ◦ C. Magnifications are 1,000 (edge) and 10,000× (surface and interior). . 44
3.11 (Left) Inaccessible water, saturation point and frequencies of
the pores of the microspheres coagulated from 5% cellulose
solution in 2 M HNO3 at 25 ◦ C. (Right-top) Computed pore
size distributions from the solute exclusion measurements for
microspheres coagulated in 0.5-6 M HNO3 at 25 ◦ C and (rightbottom) 2 M HNO3 at 5-50 ◦ C. . . . . . . . . . . . . . . . . . . .
46
3.12 The effect of (A) temperature, (B) acid concentration, and (C)
cellulose concentration on specific surface area of the critical
point dried cellulose microspheres. General conditions for coagulation were: 5% cellulose solution coagulated in 2 M HNO3
at 25 ◦ C. . . . . . . . . . . . . . . . . . . . . . . . . . . . . . . . . . . 47
3.13 (A) Oxidation of primary alcohols to aldehyde by oxoammonium and TEMPOH intermediates in NaClO-water solution. (B)
Degradation of oxoammonium salt at high temperature. Images
adapted from Isogai et al. (2011) and Ma et al. (2011). . . . . . .
48
3.14 (A) Oxidation of primary alcohols to aldehyde by oxoammonium and TEMPOH intermediates in NaClO-water solution. (B)
Degradation of oxoammonium salt at high temperature. Images
adapted from Isogai et al. (2011) and Ma et al. (2011). . . . . . .
49
3.15 Total anionic groups in oxidised cellulose microspheres after 248 h of oxidation at 20-80 ◦ C. Degree of substitution (DS) values
correspond to the values after 48 h of oxidation. . . . . . . . . .
49
3.16 (Top) FTIR and (bottom) Raman spectra of reference and at
60 ◦ C oxidised cellulose microsphere (OCB; oxidised cellulose
bead). . . . . . . . . . . . . . . . . . . . . . . . . . . . . . . . . . .
50
3.17 (Left) FTIR and (right) Raman spectra at specific regions for RCOO vibrations. Insets are showing the relative intensities of
indicated peaks of microspheres oxidised at 0 (reference) and
20-60 ◦ C. . . . . . . . . . . . . . . . . . . . . . . . . . . . . . . . . . 51
3.18 Confocal micrograms of cross-sections of (left) pure and (right)
48 h at 60 ◦ C oxidised cellulose microsphere labelled with fluorescent cationic dye DMS. Images are 1.55×1.55 mm. . . . . . .
52
xv
List of Figures
3.19 Micrograms of cross-sectioned CO2 critical point dried (A, B)
reference, (C, D) 2 h at 80 ◦ C and (E, F) 48 h at 60 ◦ C oxidised
microspheres. White ovals highlight some of the agglomerates.
Magnifications are 1,000 in the top row and 10,000× in the bottom. 52
3.20 Pore size distribution of cellulose microspheres before and after
oxidation in TEMPO/NaClO/NaClO2 system for 48 h at 20-60 ◦ C. 53
3.21 Uniformity of masses of loaded and placebo microspheres. . . . 54
3.22 DSC of ACBs. Heating rate 10 ◦ C min−1 and nitrogen flow
50 cm3 min−1 . . . . . . . . . . . . . . . . . . . . . . . . . . . . . .
55
3.23 DSC of pure ranitidine hydrochloride and loaded ACBs. Heating
rate 10 ◦ C min−1 and nitrogen flow 50 cm3 min−1 . . . . . . . . .
56
3.24 Raman spectra of Ranitidine HCl and ACB60 with and without incorporated drug. Inset: specific region 2750-3200 cm−1 .
Symbols are characteristics for the polymorph II of Ranitidine
HCl. . . . . . . . . . . . . . . . . . . . . . . . . . . . . . . . . . . . . 57
3.25 Swelling of the ACB0 and ACB60 with and without ranitidine
hydrochloride at pH 7.4. The height of the ordinate indicates
the average diameter of the never-dried microsphere. . . . . .
58
3.26 Released amount of ranitidine hydrochloride per one ACB at
different pH environment. . . . . . . . . . . . . . . . . . . . . . .
59
3.27 Release times (e-fold) of ranitidine hydrochloride from ACBs at
various pH environments. . . . . . . . . . . . . . . . . . . . . . .
60
3.28 Cumulative drug release rates of ranitidine hydrochloride from
ACBs at pH 7.4. . . . . . . . . . . . . . . . . . . . . . . . . . . . .
60
3.29 Affinity chromatographic techniques. Specific ligand-dye (a)
and unspecific ion exchange (b), hydrophobic (c) and hydrophobic charge induction chromatographies. . . . . . . . . . . . . .
63
3.30 Synthesis of pyrazoles and isoxazoles using cellulose beads as
a solid-state support for anchoring the reagent. Adapted from
De Luca et al. (2003). . . . . . . . . . . . . . . . . . . . . . . . . . . 64
3.31 Preparation of (a) cellulose microsphere surface functionalised
with aligned (his)-tagged antibody, (b) SEM image of microspheres and (c) schematic presentation of two-circuit system
for blood plasma purification. Adapted from Weber et al. (2005). 65
xvi
List of Figures
3.32 a) Schematic illustration of anionic cellulose microsphere and
anionic prazosin; b) Prazosin release into the buffer solution
from cellulose phosphate (-•-), carboxymethyl (ethanol dried,
-■-), and carboxymethyl microspheres (water dried, -N-) and
powder tablet (--) and pure prazosin hydrochloride (-×-). Adapted
from Volkert et al. (2009). . . . . . . . . . . . . . . . . . . . . . . 66
xvii
List of Tables
1.1 Rough classes of the pretreatment methods of the biomass and
their effects. . . . . . . . . . . . . . . . . . . . . . . . . . . . . . . .
2.1 Cellulose microspheres prepared under different conditions. .
2.2 Molar masses and diameters of dextrans in solution. . . . . . .
3.1 Gaussian parameters of normalised size distribution values
from images of cellulose microspheres prepared under different
conditions . . . . . . . . . . . . . . . . . . . . . . . . . . . . . . .
3.2 Weights of placebo and loaded microspheres, amount of Ranitidine HCl per one microsphere and loading degrees. Calculated
from the slopes of linear correlations. . . . . . . . . . . . . . . .
3.3 Swelling of ACB0 and oxidised ACBs after 24 h at pH values
1.2, 3.6, and 7.4. Values are percentages from the diameter of
corresponding never-dried CBs. . . . . . . . . . . . . . . . . . .
3.4 Release constants and correlation coefficients of fits to BakerLonsdale’s and Ritger-Peppas’s models at linear region 5-30 min.
7
25
26
39
55
58
61
xix
Nomenclature
Symbols
λ
Wavelength
c
Concentration
G’ and G”
Storage and loss moduli
k
Release constant
m
Mass
Mt and M∞
Measured amount of drug at time t and infinite time.
P
Power
pKa
Acid dissociation constant
T
Temperature
t
Time
tanα
Angle of repose
V
Volume
Units
ν
Frequency of the wave
◦
Degree
◦
C
Celsius degree
Å
Ångström, 10−10 m
cm3
Cubic centimetre
cm−1
Wavenumber
dm3
Cubic decimetre
xxi
Nomenclature
G
Standard gravity
g
Gram
g cm−3
Gram per cubic centimetre
h
Hour
K
Kelvin
M
Molar, mol dm−3
m
Metre
m2 g−1
Square metre per gram
min
Minute
mol
Mole, ∼6.022×10²³
s−1
Reciprocal seconds
V
Volt
W
Watt
Abbreviations and acronyms
-COOH
Carboxylic acid group
µ_
Micro-, 10−6
ACB
Anionic cellulose bead
AG
Anionic group
AGU
Anhydroglucose unit
API
Active pharmaceutical ingredient
BMIMAc
1-butyl-3-methylimidazolium acetate
BMIMCl
1-butyl-3-methylimidazolium chloride
CaF2
Calcium fluoride
CED
Cupriethylene diamine
xxii
Nomenclature
CMC
Carboxymethyl cellulose
CO2
Carbon dioxide
CPD
Critical point dried
CS2
Carbon disulphide
DIN
German Institute for Standardisation
DLaTGS-KBr
Deuterated L-alanine doped triglycine sulphate-potassium
bromide
DMAc/LiCl
N,N-dimethylacetamide with lithium chloride
DMS
Trans-4-[4-(Dimethyl-amino)styryl]-1-methylpyridinium
iodide
DPν
Viscosity average degree of polymerisation
DS
Degree of substitution
DSC
Differential scanning calorimeter
Ea
Apparent activation energy
EC
Ethyl cellulose
EHS
Environmental, health and safety requirements
FTIR
Fourier transform infrared spectrometer
HEMA
Poly(hydroxyethyl methacrylate)
HNO3
Nitric acid
HPC
Hydroxypropyl cellulose
HPMC
Hydroxypropyl methylcellulose
ILs
Ionic liquids
InGaAs
Indium gallium arsenide
ISO/FDIS
International Organisation for Standardisation / Final
Draft International Standard
xxiii
Nomenclature
k_
Kilo-, ×103
M_
Mega-, ×106
m_
Milli-, ×10−3
MC
Methyl cellulose
MEC
Methylethyl cellulose
n_
Nano-, ×10−9
Na
Sodium
NaCl
Sodium chloride
NaClO
Sodium hypochlorite
NaClO2
Sodium chlorite
NaH2 PO4
Sodium dihydrogen phosphate
NaOH
Sodium hydroxide
NMMO
N-methylmorpholine N-monohydrate
OCB
Oxidised cellulose bead
P- and S1,2-layer
Primary and secondary layers of the fibre
PEG
Polyethylene glycol
pH
Potential of hydrogen, acidity
PVA
Poly(vinyl alcohol)
R2
The coefficient of determination
R-
Cellulose backbone
Ran.HCl
Ranitidine hydrochloride
SAXS
Small angle X-ray scattering
SCAN-Test
Scandinavian Pulp, Paper and Board Testing Committee
SEC
Size-exclusion chromatography
xxiv
Nomenclature
SSA
Specific surface area
TEMPO
(2,2,6,6-tetramethylpiperidin-1-yl)oxidanyl
ToF-SIMS
Time of flight secondary ion mass spectrometry
USP-NF
United States Pharmacopeia - The National Formulary
xxv
Preface
This thesis is based on work done at the Laboratory of Fibre and Cellulose
Technology between 2009 and 2014 under the supervision of Professor Pedro
Fardim. The results are published in peer-reviewed scientific journals and are
referred to in the text as Papers I-V. Additionally three supporting publications
(1-3) are used in context.
Paper I
Paper II
Paper III
Paper IV
Paper V
Trygg, J. & Fardim, P., Enhancement of cellulose dissolution in
water-based solvent via ethanol-hydrochloric acid pretreatment,
Cellulose 18 (2011) 987-994.
Trygg, J.; Fardim, P.; Gericke, Mäkilä, E. & Salonen, J., Physicochemical design of the morphology and ultrastructure of cellulose beads, Carbohydrate Polymers 1 (2013) 291-299.
Trygg, J.; Yildir, E.; Kolakovic, R.; Sandler, N. & Fardim, P., Anionic
cellulose beads for drug encapsulation and release, Cellulose 21
(2014) 1945-1955.
Trygg, J.; Yildir, E.; Kolakovic, R.; Sandler, N. & Fardim, P., Solidstate properties and controlled release of ranitidine hydrochloride from tailored oxidised cellulose beads, Macromolecular Materials and Engineering (2014) DOI 10.1002/mame.201400175.
Gericke, M.; Trygg, J. & Fardim, P., Functional cellulose microspheres - Preparation, characterization, and applications. Chemical Reviews 113 (2013) 4812-4836.
xxvii
Preface
Supporting publications
1
2
3
Trygg, J.; Gericke, M. & Fardim, P., Chapter 10. Functional Cellulose Microspheres. In Valentin Popa (editor), Pulp Production and Processing: From Papermaking to High-Tech Products.
Smithers Rapra Technology, Shawburry, Shrewsbury, Shropshire,
UK, 2013.
Trygg, J.; Gericke, M. & Fardim, P., Functional cellulose spheres
for advanced applications, The 9th Biennial Johan Gullichsen
Colloquium, Proceedings, 2013.
Yildir, E.; Kolakovic, R.; Genina, N.; Trygg, J.; Gericke, M.; Hanski,
L.; Ehlers, H.; Rantanen, J.; Tenho, M.; Vuorela, P.; Fardim, P. &
Sandler, N., Tailored beads made of dissolved cellulose - investigation of their drug release properties. International Journal of
Pharmaceutics 18 (2013) 417-423.
Author’s contribution
V
All experiments excluding FE-SEM. Interpretation of the results
and writing the manuscript.
All experiments excluding FE-SEM and nitrogen adsorption. Interpretation of the results and writing the manuscript.
All experiments excluding FE-SEM and drug release measurements. Interpretation of the results and writing the manuscript.
All experiments excluding drug release measurements. Interpretation of the results and writing the manuscript.
Co-author.
1
2
3
Writing author.
Writing author.
Co-author.
I
II
III
IV
xxviii
1 Introduction
Novel cellulosic shapes have gained increasing interest among researchers,
partly due to global trends to utilise renewable materials in areas which had
formerly used, for example, oil-based products. Another motivation includes
new markets and products which had not existed before but for which there
is a niche. In either case the preparation of an adaptable product requires
preliminary research at each phase of the product development.
Forming new shapes from cellulose requires the destruction of the intermolecular network of the cellulose molecules. Dissolving cellulose either directly or
after chemical modification destroys the hydrogen bonds and separates the
molecules from each other, making it possible to “build up“ new shapes at this
level. Conventionally, cellulose has been dissolved using toxic materials such
as metal complexes or viscose process, but in the 1990’s novel water-based
solvents started to gain more attention due to environmental regulations
and academic research (Isogai and Atalla, 1998; Kamide et al., 1992). At the
beginning of the 2000s ionic liquids became more interesting due to their
ability to dissolve high amounts of cellulose (Swatloski et al., 2002). However,
the choice of the solvent is mainly influenced by the need for and possibilities
in a process, and of course the properties desired from the end product.
A new shape is formed by shaping the cellulose dope and either hindering
the effectiveness of the solvent, neutralising it, or converting soluble cellulose
derivatives back to insoluble cellulose. The shape itself can be considered a
functional property if it can be adjusted and utilised in an application.
Another possibility is to modify cellulose chemically by derivatisation, either
hetero- or homogeneously. Since the application defines the properties that
are required from the material, it is necessary to acknowledge these properties
at the very beginning of the process, for example short-chained cellulose
should be avoided if pulling a yarn for high-tensile strength applications
(Krässig and Kitchen, 1961; Woodings, C. and Textile Institute (Manchester,
England), 2001).
Different cellulosic shapes can be placed in two categories; native and ar1
Chapter 1. Introduction
tificial (Figure 1.1). The properties of the material in both categories are
connected to the geometric form of the product and cellulose as a structural
polymer. In native shapes cellulose molecules are produced by biosynthesis;
a polymerisation of the glucose units to cellulose. The shape of the product,
starting from the orientation, packing, and length of the molecules, is determined by the biological needs. The most common native cellulosic shape
is that of a plant fibre. It commonly consists of three layers, that is the primary, secondary and tertiary cell wall layers (Jensen, 1977) and can thus be
considered to have a non-uniform morphology. Bacterial cellulose consists
of microfibrils like plant fibres, but fibrils are ribbon-like, much smaller and
initially more pure (Jonas and Farah, 1998).
Artificial cellulosic shapes are commonly formed via gelation of existing cellulose molecules. Gelation is usually undertaken by slowly forming the hydrogen bond network so that the newly formed network covers the whole space
together with the liquid phase. This allows cellulose molecules to maximise
their space and surface area (Gavillon and Budtova, 2008). The liquid can
then be removed, for example by freeze-drying or critical point drying, to
avoid hornification and to maintain the morphology. Since these products
are often highly porous, they can be used, for instance, as an insulator. When
the targeted property is liquid adsorption, they are commonly referred to as
sponges. Additionally, cellulose is biocompatible (Miyamoto et al., 1989) and
can be used in wound dressings (scaffolds) or in drug delivery. Sometimes
they are called with prefix aero-, such as aerocellulose.
If the gelated shape is a spherical particle, it is commonly called a cellulose
bead or microsphere. They have a diameter greater than 10 µm, separating
them from nanomaterials, and cellulose is the main component giving the
structural properties (Gericke et al., 2013). Otherwise the attributes are mainly
the same as described above; high surface area, porosity, biocompatibility, and
so on. Their sphericity and dimensions can also be utilised in applications,
using, for example, their ability to flow.
The literature review of this doctoral thesis begins with an overview of cellulose structure and sources. Different pretreatments are presented prior to the
dissolution of cellulosic fibres. The phenomena of regeneration and coagulation is clarified in the context of the different solvent systems. The section
about controlled release systems leads the thesis to the challenges of designing polymer matrices for drug delivery. Essential characterisation methods
2
Figure 1.1: Cellulosic shapes. (Top) Native jute fibres and bacterial cellulose
(photograph and SEM image), (bottom) regenerated cellulose fibres and films
from viscose, and coagulated sponge and beads from NaOH/urea/water. Image of bacterial cellulose from Chen et al. (2010) and of beads from Trygg et al.
(2014).
3
Chapter 1. Introduction
for cellulosic shapes and pharmaceutical applications are introduced at the
end of the literature section of the thesis.
In the experimental section a complete preparation route is presented for
functional cellulose microspheres. It presents the challenges to dissolving
cellulose in water-based solvents and proposes an efficient pretreatment
method to enhance solubility (Paper I). The physicochemical modification
of microspheres is studied in order to understand the role of the coagulation
environment and its utilisation for the final product (Paper II). This study
was further expanded to be a complete study of drug delivery (Supporting
Publication 3). Microspheres were chemically modified, their properties were
characterised (Paper III) and their use in drug delivery was studied in detail
(Paper IV). A review (Paper V) of potential applications is given in the end of
the experimental section, based on the results presented in earlier papers and
on observations during the studies.
1.1 Cellulose sources and structures
Approximately 1.5×10¹² tons of cellulose biomass is produced on Earth each
year (Klemm et al., 2005). Biosynthesis routes to cellulose formation are
found in prokaryotes (Ross et al., 1991; Zogaj et al., 2001) and eukaryotes,
such as animals (tunicates), various algae, fungi, and plants (Brown, 1985).
Among cellulose producing bacteria, cyanobacteria has existed for more
than 2.8 billion years (Nobles et al., 2001). Endosymbiotic transfer of the
cellulose synthases has been proposed as occurring from cyanobacteria to
plants. Speculation about the early purpose of cellulose vary from high UV
radiation shielding of the early Earth to enhanced motility in organisms. As far
as we know, nowadays cellulose mostly acts as a structural polymer providing
strength and support for plants.
Cellulose is composed of 1→4 linked β-D-glucose units, each unit rotated
180◦ compared to the previous unit. It is a linear polymer which forms strong
hydrogen bonding network via three hydroxyl groups (-OH) on its C2, C3 and
C6 carbons. The orientation of these hydroxyl groups and the placement
of the cellulose chains compared to neighbouring chains defines the crystal
structure (allomorph) of the cellulose (Figure 1.2). Cellulose I is the most common allomorph with two suballomorphic forms, triclinic Iα and monoclinic
Iβ unit cells (Zugenmaier, 2001). The former is mainly produced by algea and
4
1.1. Cellulose sources and structures
bacteria and the latter by plants. Since the main source of artificial cellulosic
products is dissolving pulp, which is made from wood biomass, cellulose Iβ is
most used cellulose suballomorph. In this thesis, terms “cellulosic pulp”, “cellulosic fibre”, and “cellulose” exclusively refer to a material which is extracted
from wood biomass.
Figure 1.2: Representation of (A) cellulose Iβ and (B) cellulose II crystal structures on (A1,B1) a-b plane and (A2, B2) molecules in lattice planes 100 and
010, respectively. Figure from Zugenmaier (2001).
Both suballomorphs are described as thermodynamically less stable than
cellulose II. Paradoxically, cellulose I is clearly more common in nature (socalled native cellulose) and cellulose II is seldom produced in small quantities,
such as by Acetobacter Xylinum (Roberts et al., 1989). Cellulose II (generally
in the literature as regenerated cellulose) is often produced from cellulose I by
mercerization (treatment with aqueous sodium hydroxide) or after dissolution
and coagulation. Other crystal structures, such as cellulose III and IV with
their suballomorphs are even more rare in nature (Brown Jr et al., 1996),
but can be artificially converted to cellulose III by ammonia treatment, and
further to cellulose IV by heat treatment in glycerol (Zugenmaier, 2001).
5
Chapter 1. Introduction
1.2 Pretreatment of cellulosic pulp prior to dissolution
Cellulose is insoluble in most common solvents due to a strong inter- and intramolecular hydrogen bonding network (Klemm et al., 1998). If the cellulose
molecules are long, the network is more dense and the solubility lower (Qi
et al., 2008). Evolution has also developed wood fibres to be resistant against
physical and chemical impacts, yielding fibres with three layers that provide
resistivity against physical stress (Niklas, 1992) and its own chemical toxins
in order to protect it from microorganisms and chemical attacks (Scheffer,
1966).
Pretreatments aim to break the original shape and/or composition of a pulp
fibre (Mosier et al., 2005). Unwanted components in cellulosic pulp, such
as hemicelluloses and lignin, can interfere with the dissolution process or
chemical modification. The accessibility of the reagents into the fibre in both
cases is essential for the successful processing and even distribution of the
functional groups (Moigne et al., 2010).
Pretreatments can be roughly categorised into three classes: physical, chemical, and biological (Table 1.1). In physical methods, such as ball milling,
mechanical energy is used to reduce the crystallinity and open the fibre (Tassinari et al., 1980). These are often very energy demanding methods, however
(Kumar et al., 2009). Physicochemical methods, such as steam explosion and
hot water treatment, are more cost effective (McMillan, 1994; Weil et al., 1997).
They degrade hemicelluloses and disrupt lignin structures. As a downside,
their byproducts might inhibit biological methods which are often used in
biomass conversions (Palmqvist and Hahn-Hägerdal, 2000). Ammonia and
CO2 fibre explosions do not produce these inhibitory byproducts and they do
open the fibre, but they are not effective against lignin and hemicelluloses
(Kumar et al., 2009). Due to their low cost they are used as a preliminary
method before enzymatic treatment (Yang and Wyman, 2006).
Biological (enzymatic) methods are targeted against certain components.
Enzymes from biological origins are usually pH and temperature sensitive
and other components may interfere with efficiency (Schilling et al., 2009).
Chemical methods on the other hand are less specific but they are more
available and more versatile (Adel et al., 2010; Kumar et al., 2009; Mosier
et al., 2005). From a dissolution point of view, both methods, biological and
chemical, aim at degradation of cellulose molecules to enhance solubility.
6
1.3. Cellulose dissolution, regeneration, and coagulation
Table 1.1: Rough classes of the pretreatment methods of the biomass and
their effects.
Class
Physical
Example method
Refining
Milling
Physicochemical
Heating
Chemical
Biological
Description
Fibrillates and reduces crystallinity.
Reduces crystallinity.
Solubilisation of hemicelluloses
and partially lignin.
Liquid hot water
Like heating but more effective.
Steam explosion
Rapid depressurisation of water
opens the fibre.
Ozonolysis
Selective degradation of lignin, no
effect on cellulose or hemicellulose.
Acid hydrolysis
Hydrolyses hemicelluloses and cellulose.
Alkaline hydrolysis Removes hemicelluloses and swells
the fibre.
Oxidative delignifi- Like alkaline hydrolysis with oxidacation
tive component. Lignin degradation.
Organosolv
Acid hydrolysis in organic solvent.
Ref #
1
2
3
4
5
6
7
8
9
10
Enzymatic
Yeast, fungi, moulds and bacteria 11
based enzymes. Specific targets.
References: 1.Jonoobi et al. (2009), 2.Tassinari et al. (1980), 3.Hendriks and
Zeeman (2009); Mosier et al. (2005), 4.Weil et al. (1997), 5.Li et al. (2009),
6.Quesada et al. (1999), 7.Lu et al. (2007), 8.Carrillo et al. (2005), 9.Kim and
Holtzapple (2006), 10.Kumar et al. (2009), 11.Schilling et al. (2009).
1.3 Cellulose dissolution, regeneration, and coagulation
In order to dissolve cellulosic fibres, the solvent should penetrate the cell
wall layers and disrupt the hydrogen bonding network to such an extent
that cellulose molecules (and other components) no longer interact with
each other. The affinity to the solvent has to be stronger than that which the
dissolving components have for each other. If the solvent is efficient enough,
dissolution proceeds via the fragmenting mechanism directly destroying all
the layers of the fibre when in contact. This is usually the case with, for
example, metal complexes and ionic liquids. Weaker solvents usually dissolve
chemically less resistant layers first, the secondary and tertiary cell walls,
7
Chapter 1. Introduction
while the more resistant primary cell wall remains intact. This causes osmotic
pressure inside the fibre, which can be seen as a “ballooning” phenomenon.
This mechanism usually leaves undissolved fragments in the solution, as socalled ’collars’ between the balloons (Cuissinat and Navard, 2006a,b, 2008).
The hydrogen bonding network can be disrupted in two ways. In direct dissolution the network is broken by the presence of disruptors, electron donors
and acceptors, and complexing molecules (Figure 1.3, right-side, purple and
green routes). These do not react chemically with hydroxyl groups of cellulose
but block their ability to form hydrogen bonds with other hydroxyl groups. In
derivatisation a reagent reacts chemically with hydroxyl groups and removes
the possibility of hydrogen bonding. This intermediate may be either stabile and possible to isolate, or labile and needs to be processed immediately
(Figure 1.3, left-side, yellow routes).
According to the definition of coagulation, a substance changes to a gel
or thickened curdlike state from liquid through a change in environment
(McGraw-Hill, 2003; Merriam-Webster, 2014). Cellulose derivatives can be
regenerated back to cellulose by cleaving the functional group away and generating the hydroxyl groups (Figure 1.3, left route, pink box). After the cleavage,
newly formed hydroxyl groups can form hydrogen bond networks, causing
molecules to aggregate (pre-nucleation sites (Nichols et al., 2002)) and hence
to coagulate. Some materials, such as cellulose acetate, can be dissolved in
organic solvents (Klemm et al., 1998) and coagulate before regeneration by
exchanging the solvent for water.
In the case of the direct solvents coagulation occurs directly when the solvent
is either neutralised, diluted beyond the effective concentration or otherwise
invalidated, for example by changing the temperature. The coagulation box
in Figure 1.3 shows the hydrogen bonds of the 020 plane for the “up” chains,
according to Kolpak and Blackwell (1976).
1.3.1 Derivatisation and dissolution
The most common cellulose derivative is cellulose xanthate (Klemm et al.,
2005). It is prepared by activating cellulose with alkali and treating it with
carbon disulphide CS2 . The xanthate group is thermally labile and cannot be
isolated. After derivatisation cellulose xanthate is directly dissolved in alkali,
when it becomes a viscose solution. After the shaping, the xanthate group
8
1.3. Cellulose dissolution, regeneration, and coagulation
Cellulosic fibre
Derivatisation
Pretreatment
OH
Physical
Physicochemical
Chemical
O
HO
O
OH
Biological
+R
OR
O
RO
O
Direct dissolution
OR
NMMO
DMAc/LiCl
NaOH-additives-water
Ionic liquids
Dissolution of derivative
Cellulose solution
Derivative solution
Homogeneous modification / blending
Shaping
Regeneration
O R+H
O
RO
O
OR
Coagulation
OH
OH
OH
O
HO
O
HO
OH
O
O
HO
O
OH
O
HO
O
O
OH
OH
OH
OH
OH
OH
O
HO
HO
O
O
OH
OH
O
HO
O
O
HO
O
O
OH
OH
OH
Cellulosic shape
Heterogeneous modification
Figure 1.3: Schematic presentation of the processes from cellulosic fibres to
novel shapes.
9
Chapter 1. Introduction
can be cleaved away with sulphuric acid or by thermal treatment, resulting
regenerated cellulose.
Similarly, cellulose carbamate is formed when alkali-activated cellulose is
in contact with molten urea (T>130 ◦ C) (Loth et al., 2003). However, this
intermediate is stabile and can be isolated. Cellulose carbamate is soluble in
aqueous sodium hydroxide and can be regenerated with acid.
Another commonly used stabile derivative is cellulose acetate (Klemm et al.,
1998). It can be isolated and is sold commercially with a wide range of degrees
of substitution. It is soluble in organic solvents and thus polar solvents such
as water can be used for coagulation. However, this does not cleave the acetyl
group away and additional saponification is required if pure cellulose structure is desired. This opens the possibility of regeneration after the coagulation,
as demonstrated by the long regeneration area in Figure 1.3.
1.3.2 Direct dissolution
Some conventional solvents dissolve cellulose directly without changing the
chemistry of the hydroxyl groups. Most common non-derivatising solvent is
used in the Lyocell process; N-methylmorpholine N-monohydrate (NMMO)
(Fink et al., 2001). Since the solvent is very sensitive to moisture, water can
be used to hinder its solvent abilities and to coagulate the cellulosic shapes.
Another way to precipitate cellulose from an NMMO-solution is to let it cool
to 20-40 ◦ C from dispersion temperature >85 ◦ C, so that crystallites are formed
(Biganska et al., 2002). Unfortunately NMMO-solvent is also labile around
impurities, so cellulose-blends with other polymers or additives cannot be
prepared homogeneously (Konkin et al., 2008; Rosenau et al., 2001) and a
solvent system requires stabilizers.
N,N-dimethylacetamide with lithium chloride (DMAc/LiCl) is more commonly used for homogeneous cellulose modifications (Heinze et al., 2006;
Liebert, 2010). Water or acetone can be used as a non-solvent, although it is expensive and its recyclability is challenging. Other challenges with DMAc/LiCl
include its high viscosity even with low amounts of cellulose (Kaster et al.,
1993; McCormick et al., 1985). This makes it difficult to use in industrial
processes, but it is well suited to academic research.
Ionic liquids (ILs) have gained a lot of interest since the beginning of new
10
1.3. Cellulose dissolution, regeneration, and coagulation
Millenium (Gericke et al., 2012). They are defined as a group of organic salts
which have a melting point below 100 ◦ C. They can directly dissolve high
amounts of cellulose, even 10-20%, but they can still, nevertheless, be used
as a medium for dissolution and homogeneous derivatisation (Heinze et al.,
2005; Kosan et al., 2008; Swatloski et al., 2002). Majority of ILs have dialkylimidazolium cations and various anions, e.g. 1-butyl-3-methylimidazolium
chloride and acetate (BMIMCl and BMIMAc). Many of them, however, cannot
dissolve cellulose (Gericke et al., 2012). Besides the advantages to efficiently
dissolve cellulose, ILs have many unsolved issues; their properties can be
drastically changed if there are even small amounts of impurities present,
viscosity can increase even at low cellulose concentrations so that the solution
is not suitable for processing, recyclability is still questionable, they can be
difficult to purify, and some of them are chemically labile. However, research
on novel ILs continues and many of these issues can be solved (e.g. King et al.
(2011)).
Conventional water-based solvents are usually heavy metal salts and hydroxides. They form meta-stabile complexes with hydroxyl groups of cellulose
and provide good solutions with relatively low viscosities. However, environmental restrictions strongly restrain their use on a commercial scale. Their
use is still common for some standard measurements, such as the use of
cupriethylene diamine for the measurement of the limiting viscosity number
of pulp (standard ISO 5351).
Novel water-based solvents fulfill requirements in the areas of the environmental, health and safety (EHS) (Capello et al., 2007). In practice, these
solvents are aqueous NaOH solutions with or without additives. Sodium hydroxide can dissolve cellulosic fibres with a low degree of polymerisation at
low temperatures (Isogai and Atalla, 1998), although the solution is more a
suspension than a true solution (Roy et al., 2003). To enhance solubility and
delay the gelation time, additives such as urea (Cai and Zhang, 2005; Qi et al.,
2008), thiourea (Jin et al., 2007), and zinc oxide (Liu et al., 2011), are added in
solvent. Where sodium hydroxide swells and eventually dissolves cellulose,
zinc and urea hydrates prevent the re-association of cellulose molecules and
thus stabilise solutions.
11
Chapter 1. Introduction
1.4 Controlled release systems
New drug delivery systems have enabled new forms of therapies due to novel
innovations, such as binding drugs to proteins for more targeted delivery
and different release patterns (pulsating and continuous) (Langer, 1990). The
advantages of a controlled delivery system becomes clear when the drug has
a narrow therapeutic window, low dosage does not have the desired affect on
a patient and high dosage is toxic.
Generally polymer-based matrices and coatings are used for controlled release effect (Vervaet et al., 1995). Depending on the physical or chemical
properties of the polymer matrix, systems can be divided into three categories
(Langer, 1993; Leong and Langer, 1988):
1. Diffusion controlled, non-degradating matrix.
2. Diffusion controlled, swelling matrix.
3. Erosion controlled, degradating matrix.
A drug can be coated with polymer, so that it diffuses through the polymer
layer (Figure 1.4A). These are often called reservoir systems (Arifin et al., 2006).
If the drug is evenly distributed, for example by dissolving and trapping the
drug inside the matrix, or by dispersion, it is called a matrix system (Figure
1.4B). In the case of degradating matrices the drug is firmly bound to the
matrix and is only released when the degradation occurs (Figure 1.4C). When
simplified, degradation can happen via two routes; if the polymer chemically
goes through a cleavage or scission, or in the case of erosion where it loses
monomers or oligomers via a physical or chemical reaction. The erosion can
occur only on the surface or through the entire bulk at the same time (Arifin
et al., 2006). Cleavage of the drug from the polymer is one special type of this
definition (Figure 1.4D).
Swelling systems (Figure 1.4E) usually utilise hydrophilic polymers, such as
hydroxypropylmethyl cellulose (HPMC), poly(hydroxyethyl methacrylate)
(HEMA) and poly(vinyl alcohol) (PVA), to enhance the swellability and solubility of poorly soluble substances (Arifin et al., 2006). At the outer-most region
of the matrix, on the diffusion layer, the polymer also dissolves due to low
concentration and weak entanglement, however, losses are small compared
to surface erosion and do not play a role in the release rate of the drug.
12
1.4. Controlled release systems
Figure 1.4: Different release mechanisms. (A) Diffusion through reservoir
coated with polymer matrix, (B) drug uniformly distributed in matrix, (C)
polymer degrades and releases the embedded drug, (D) contact with reagent
or solvent in environment releases the linked drug from matrix, (E) polymer
swells and allows drug to move outwards, (F) drug released only through
porous holes, (G) drug is pushed out though the laser-drilled hole by osmotic
pressure, and (H) release is activated e.g. by magnetic field squeezing the
drug-containing pores. Figure from Langer (1990).
13
Chapter 1. Introduction
Figure 1.5: Image analysis of microspheres with Fiji software (Schindelin,
2008). Figure from Gericke et al. (2013).
Systems utilising osmotic pressure (Figure 1.4G) are a special type of diffusion
controlled release system. Some systems are harder to categorise into one of
the three types. Complex systems can often utilise properties from all three
categories. In Figures 1.4F and H, osmotic pressure or external force may
open the pores (partially degradating matrix), and diffusion occurs after they
open in an otherwise stable matrix.
1.5 Characterisation of cellulosic shapes
Physical dimensions The physical dimensions and shape of the aerocelluloses and sponges are usually irrelevant in academic research, since their
functionalities arise from internal properties. Spheres on the other hand use
their size and shape as part of the functionality; loading capacity (see “Porosity and pore size distribution” section below), flowability, packing density,
etc.
Spheres with a diameter of millimetres can be analysed simply by image
analysis (Figure 1.5). Image analysis can be used, for swelling studies, for
example, and as a complementary technique to determine total porosity
(Trygg et al., 2013). A small bias may originate from the tail-formation and
ellipse fitting of big spheres. Tails are formed when the highly viscose solution
leaves the tip of the syringe and contacts the coagulation medium before
minimising the surface energy, maintaining its tear-shape. Tails distort the fit
to ellipse, prolonging the values of major axes. This is observed as a decrease
in circularity values.
14
1.5. Characterisation of cellulosic shapes
Smaller spheres of 10-1000 µm can primarily be analysed by sieving, although
the results lack detailed information about the shape of the distribution
(Rosenberg et al., 2007). Another option is to dry the beads, either under
critical point drying, with liquid nitrogen or freeze-drying, and study the size
and morphology with FESEM. Drying at ambient temperature, freezing and
solvent exchange changes the size and possibly also the shape , however (Pinnow et al., 2008). This technique would give only indirect information about
the original dimensions, but it also provides information about morphology
and thus it is used rather regularly (e.g. Du et al. (2010); Trygg et al. (2013); Xia
et al. (2008). Particle size analysers use laser light diffraction to measure the
distributions of small particles in suspensions and provide a useful and rapid
way to analyse the dimensions of micrometre sized particles (Thümmler et al.,
2011).
Porosity and pore size distribution In the case of cellulosic shapes prepared by coagulation, it is likely that traditional models of pore shapes do not
apply. Since the coagulation proceeds via gelation, the real pore structure
is continuous matrix with channels of different widths. Thus the expression
“pore size distribution” would be more precise if expressed as a total volume
of channels of certain width in cellulose matrix. Some channels are narrower
and thus some spaces are not accessible to all probe molecules, creating a
combination of channels which can be called a pore.
The quality of the cellulose solution, the solvent and anti- or non-solvent
all affect the coagulation mechanism and rate, which eventually determines
the pore size distribution (Gavillon and Budtova, 2008; Trygg et al., 2013).
Probably the biggest parameter affecting on the distribution and total porosity
is the cellulose concentration in the solution; a defined space is filled with a
certain amount of solids.
Total porosity can usually be measured at the same time as pore size distribution. In the simplest case one could compare the weights of wet and
dried samples, and using a density of ∼1.5 g cm−3 (Ettenauer et al., 2011) for
cellulose it is possible to calculate the volume water occupied before drying
(Xia et al., 2007). This does not, however, indicate the volume of accessible
pores (Stone and Scallan, 1967, 1968).
Mercury intrusion or nitrogen adsorption techniques can be used as comple15
Chapter 1. Introduction
mentary tools for pore size distribution measurements; mercury intrusion
measures pores from 3 nm to 200 µm and nitrogen adsorption from 0.3 to
300 nm (Westermarck, 2000). A disadvantage is that both measurements
require a completely dried sample, which means critical point drying. Pressure is also applied to fill the pores against the surface tension of the filling
material which can compress the closed pores and destroy the matrix during
the measurement, yielding a higher volume of small and medium pores.
Pore size distribution can be measured in wet state, for example with small
angle X-ray scattering (SAXS), which measures different electron densities
between the pore wall and the water phase (Pinnow et al., 2008; Thünemann
et al., 2011). This will also measure the closed pores. The solute exclusion technique with dextrans or polyethylene glycol (PEG) macromolecules
measures only accessible pores for macromolecules of certain sizes (Figure
1.6)(Grznárová et al., 2005; Stone and Scallan, 1967, 1968). The concentration
of macromolecules is measured before and after introducing the sample to
the solution. If the water in pore is accessible to the macromolecule, it dilutes
the solution. From the differences it is possible to compute the inaccessible
and accessible volume fractions and relate them to the total volume. The
total accessible pore volume can be estimated by extrapolating the size of the
macromolecule to infinity. For dextrans the range is 1-56 nm and for PEGs
0.7-5.7 nm.
Accessible
Closed
Inaccessible
Figure 1.6: Illustration of accessible, closed and inaccessible pores by probe
molecules. Adapted from Stone and Scallan (1968).
16
1.5. Characterisation of cellulosic shapes
Specific Surface Area Specific Surface Area (SSA) becomes increasingly important if the cellulose shape is chemically modified heterogeneously after
the solidification or sample is used in any application which is based on
surface interactions, such as support in solid state synthesis, immobilisation or chromatographic separations with functional groups (Gericke et al.,
2013). Whereas the surface area of the native cellulosic fibre varies between
55 and 168 m2 g−1 (Budd and Herrington, 1989) for dried and never-dried
pulps, coagulated shapes can often have area over 200 and even as high as
450 m2 g−1 (Trygg et al., 2013). In regenerated fibre it is necessary to arrange
the molecules in tight order for required elongation and strength, but in gelation the molecules fill up the given space. This maximises the porosity and
area. However, after drying the surface area of the coagulated shapes can
diminish to below 1 m2 g−1 due to a greater tendency to hornify (Trygg et al.,
2013).
The techniques mentioned in the previous paragraph can often be used to
measure the specific surface area as well. However, if the surface area is
computed from the pore size distributions, rough assumptions and simplifications have to be made for the geometry of the pores (Stone and Scallan,
1968), which is contradictory to pore formation in gel-based shapes. If any dry
technique, such as nitrogen adsorption or mercury intrusion is used, critical
point drying may change the surface area (Svensson et al., 2013). This makes
the techniques less comparable but they are often the only realistic option
available.
Water retention value Water uptake and the ability to hold it are probably the most important properties of absorbent materials. Often standards
SCAN-C 62:00 or DIN 53814 are used to measure the water retention value of
chemical pulp fibres and textiles, respectively. They compare the mass of the
wet sample to the mass of the oven dry sample. In SCAN-C 62:00 for example,
the wet sample is centrifuged at 3000 G for 15 minutes to remove the surplus
water. This method is mainly for pulp fibres, so for other sample types the
method can be modified. Larger shapes such as sponges and spheres may be
influenced by their own weight, and larger pore entrance allows water to leak
out during centrifuging and thus the results might be distorted (Trygg et al.,
2014).
17
Chapter 1. Introduction
Strength The strength of the cellulose matrix arises from the thickness of
the pore walls. The thickness is again a result of coagulation kinetics and the
amount of material available, that is the relationship between the anti- or nonsolvent and solvent, and concentration of cellulose. Shape becomes stronger
if a greater amount of cellulose occupies the volume, and simultaneously it
decreases the volume of the pores and their size (Sescousse et al., 2011a). The
formation of a thick supportive matrix can be jeopardized by blending other
polymers in a cellulose solution which does not contribute to the matrix as
intensively as cellulose, or by chemically modifying the hydroxyl groups.
Mechanical strength is usually measured by deformation under force and
in practise this means stress-strain curves while compressing the sample.
Together with the other results this provides information about the shape
and its formation (Sescousse et al., 2011a). The bulk density can also be
deducted from the mechanical characteristics (Pekala et al., 1990). In the case
of wet samples, small spheres, and weaker shapes, applying centrifugal force
and measuring the deformation by image analysis has also been proposed
(Gericke et al., 2013), but this method has not been published in the literature
yet.
Composition and functional groups Cellulose itself can be used as a functional material; it is biocompatible, it has three hydroxyl groups per repeating
unit, and it forms an adjustable open-pore matrix and surface area. Other
properties, such as flowability and total pore volume, can also be utilised.
Many application, however, require ionic or hydrophobic interactions, for
example. If the sample is functionalised for these purposes by blending with
other polymers, composition becomes relevant and should be correlated
to the other analysis methods mentioned above. The strength of the cellulose/polymer mixtures should also be ensured since the gel-matrix may not
be supportive enough to maintain the shape (Wu et al., 2010; Zheng et al.,
2002). For example, different polymer compositions can be analysed after acid
hydrolysis or methanolysis using high performance layer chromatography or
mass spectrometer-gas chromatography.
In the case of functional groups, such as anionic groups, titration methods
are often applied. Either in conductive or potentiometric mode, titration
provides direct information about the quantity of accessible groups and in
latter mode possibly also the pKa values of the acidic and basic groups. Other
18
1.5. Characterisation of cellulosic shapes
methods for anionic groups are, for example, methylene blue and polyelectrolyte adsorptions (Fardim and Holmbom, 2003; Fardim et al., 2002). In the
case of coagulated cellulosic shapes such as spheres and sponges, diffusion
time would be too long to apply any direct or rapid method. Indirect titration
and long equilibrium times must be used (Ettenauer et al., 2011; Trygg et al.,
2014).
The distribution of such groups can be further located by labelling them with
fluorescent dyes and using a confocal fluorescent microscope (Trygg et al.,
2014), or by labelling anionic groups with methylene blue and locating the dye
with ToF-SIMS. With methylene blue sorption it is also possible to measure
the quantitative amounts of functional groups using isotherms.
Morphology Morphological study by FESEM is probably the most common
technique in scientific publications. It provides visual information about the
sample, its porosity, and morphological features (Du et al., 2010). Differences
in coagulation mechanism, kinetics, and surfaces can also be observed in
micrographs. The interface of gas and liquid, and later gelated solid surface
was observed when a gas-forming agent was used inside the coagulating
cellulose droplet (Figure 1.7). The distribution of different particles, such as
inorganic metals, which cannot be fully blended in cellulose matrix can also
be seen in cross-sections (Xia et al., 2007).
1.5.1 Characterisations for pharmaceutical applications
Powder flow Cellulose spheres utilise their shape as a part of their functionality. In pharmaceutical sciences the most common methods for measuring
the properties of powders and spheres are angle of repose, compressability,
flow rate through an orifice and shear cell (Chapter “1174. Powder Flow” in
USP 29–NF 24, page 3017). All these methods measure the flow properties
of a sample with or without external force. Additionally they provide information about shear-stress and friction, but these methods are all very much
dependent on the apparatus used.
Angle of repose relates to the interparticulate friction between particles and
resistance to movement, but it is not considered an intrinsic property of the
solid. Powder is piled into a cone shape and the width of the base and the
19
Chapter 1. Introduction
CO2 /cellulose solution interface
Cut bulk
Figure 1.7: Interfaces of CO2 and cellulose solution during the coagulation
of cellulose microsphere. Sphere cut with blade, water exchanged to acetone and liquid CO2 and then critical point dried prior to FESEM imaging.
Magnifications 19× and 250×. Unpublished results.
height are measured from the pile. The angle is calculated from equation
t an(α) =
hei g ht
.
0.5 × base
(1.1)
The classification by Carr defines
angles between 25-30◦ as excellent,
and angles above 50◦ as poor, and
rarely acceptable in pharmaceutical
processes (Carr, 1965).
The compressibility index and Hausner ratio are indirect measurements
of bulk density, but they are also
often related to moisture, size and
shape, the surface area, and cohesiveness of the materials. They are Figure 1.8: Angle of repose of dry celluboth measured from the relation- lose beads.
ships of bulk volume to the tapped
20
1.5. Characterisation of cellulosic shapes
volume. As angles of repose, they are
not intrinsic properties of the material and are very dependent on the method used.
Flow through an orifice is used in free-flowing materials to measure the mass
that flows in a defined time through an orifice. Flow rate is also often used.
Since pulsating patterns and a decrease of the flow rate have been observed
when containers empty, continuous monitoring is necessary.
Shear cell methods can measure several different parameters, such as
shear stress-strain relationship, the
angle of internal friction, yield and
tensile strengths, and various flow
factors. Powder is placed inside the
apparatus, where one plane (or disc)
is moving and other one is stationary.
This generates a measurable stress
on the sample.
Cell viability assay becomes inFigure 1.9: Old annular shear cell ap- creasingly important if the cellulose
paratus. Figure from Carr and Walker matrix is modified; Pure cellulose is
(1968).
biocompatible but derivatives might
not be (Miyamoto et al., 1989). Aerocellulose and sponges are often used as wound dressing materials and
scaffolds for new healing tissue (Lagus et al., 2013). Novel shapes must pass
the test, since skin has to be able to heal but not to grow into the cellulose
matrix, unless the matrix is simultaneously degrading.
21
2 Experimental
Dissolving pulp (Cellulose 2100 plus) from Domsjö Fabriken (Sweden) was
used in this work. The pulp is a mixture of spruce and pine (60%/40%) and
contains 93% α-cellulose and 0.6% lignin (Domsjö, 2007). The intrinsic vistosity of the pulp was 530±30 cm3 g−1 , measured according to SCAN-CM15:99. In
Papers II-IV and Supportive Article 3 the pulp was pretreated with HyCellSolvpretreatment for 2 h at 75 ◦ C. The method is described in Paper I.
Paper II describes the preparation and modification of the cellulose microspheres (beads) using the physicochemical method. Paper III mainly focuses
on the oxidation of the prepared spheres and the changes in their properties due to oxidation. Paper IV studies in detail the behaviour of anionic
microspheres and their use in drug delivery.
2.1 Paper I: HyCellSolv-pretreatment and the solubility
of the pulp
2.1.1 HyCellSolv-pretreatment
100 cm3 of technical ethanol (92.5w%) and 4 cm3 of 37w% hydrochloric acid
(Merck KGaA) was preheated to 25-75 ◦ C and 4.0 g of dissolving pulp was
immersed in it for 0.25-5 h. After the treatment the mixture was poured into
900 cm3 of cold distilled water, filtered and washed until pH was neutral,
and left in 1 dm3 of distilled water overnight to ensure the ethanol-acid had
exchanged to water. The next day the pH was confirmed to be neutral and the
pulp was filtered and dried in an oven at 60 ◦ C overnight.
2.1.2 Changes in fibre surface morphology
The morphological changes in the surface of the fibres and the opening of
the fibre cell walls in the reference and pretreated pulps (2 h at 25 and 75 ◦ C)
were examined using Leo Gemini 1530 FE-SEM with an In-Lens detector after
coating with carbon in a Temcarb TB500 sputter coater (Emscope Laboratory,
23
Chapter 2. Experimental
Ashford, UK). An optimum accelerating voltage was 2.70 kV and magnifications were 5,000 and 50,000×.
2.1.3 Degree of polymerisation
Intrinsic viscosities were measured according to ISO/FDIS 5351:2009 standard
and average degrees of polymerisation were calculated from the values (Immergut et al., 1953). Oven-dry samples were freeze-dried and weighed before
dissolution in 1.0 M cupriethylene diamine solution (CED). The temperature
of the capillary was 26.0 ± 0.1 ◦ C.
2.1.4 Dissolution mechanism
Optical microscopy (Wild M20 coupled to a Nikon Coolpix 990 digital camera)
was used to study the dissolution mechanism of the reference and pretreated
pulps at various temperatures and times. 0.2 M CED was used to simulate
weak solvent and slow dissolution. 0.2w% cellulose solutions were made
using 7% NaOH-12% urea-water as a solvent and pretreated pulps after 2 h
at 25, 45, 55 and 65 ◦ C. The types of undissolved fragments were recognised
from the solutions.
2.1.5 Solubility of cellulose in 7% NaOH-12% urea-water
The nature of the cellulose-7% NaOH-12% urea-water solutions was evaluated
rheometrically. 0-5% cellulose (pretreated 2 h at 75 ◦ C) was slurred in 7%
NaOH-12% urea-water so that the fibers were swollen. The mixture was
cooled to -10 ◦ C and stirred until a clear solution was obtained, usually less
than 20 minutes. An Anton Paar Physica MCR 300 rotational rheometer with
DG 26.7 double-gap cylinder was used to measure the dynamic viscosities at
10, 15, 20, and 25 ◦ C and the apparent activation energies Ea of viscous flow
were calculated using Arrhenius equation (Roy et al., 2003). Shear rates of 10,
100 and 1,000 s−1 were used to study the state of the solution under different
shear conditions.
Paper II: 4-6% cellulose was dissolved in 7% NaOH-12% urea-water as described above. Storage and loss moduli (G’ and G”) were measured at 20 and
25 ◦ C with the same rheometer to define the gelation point of the solutions.
24
2.2. Paper II: Physicochemical design of the microspheres
2.2 Paper II: Physicochemical design of the microspheres
2.2.1 Preparation of the physicochemically designed microspheres
Cellulose was dissolved as described in Section 2.1.5 with final concentrations
of 3-7%. The solution was extruded through the Eppendorf 5 cm3 syringe tip
into the coagulation bath. The conditions were adjusted according to Table
2.1.
Table 2.1: Cellulose microspheres prepared under different conditions.
ccel l ul ose
(%)
4
5
6
T
(◦ C)
25
25
25
cH NO 3
(M)
2
2
2
ccel l ul ose
(%)
5
5
5
5
5
5
T
(◦ C)
25
25
25
25
25
25
cH NO 3
(M)
0.5
2
4
6
8
10
ccel l ul ose
(%)
5
5
5
5
5
5
T
(◦ C)
5
25
50
5
25
50
cH NO 3
(M)
2
2
2
∗
∗
∗
∗ 10% NaCl was used instead of HNO
3
2.2.2 Dimensional attributes and morphological features
Physical dimensions, size distributions, and the shape of the never-dried
microspheres were studied by analysing photographic images with Fiji image
processing software (Schindelin, 2008). 20-100 microspheres were used in
each analysis. Weight was measured before and after drying in an oven at
105 ◦ C to determine the total porosity using equation
Por osi t y =
V H2 O
V H2 O + Vcel l ul ose
(2.1)
where VH2 O is calculated from the mass differences of the wet and dry beads,
and Vcel l ul ose from the dry mass of the beads divided by the density 1.5 g cm−3 .
The effect of the coagulation conditions (Table 2.1) on morphology was studied using a Leo Gemini 1530 FE-SEM with In-Lens detector. Never-dried
microspheres were cut prior to acetone exchange and CO2 critical point drying. Dried spheres were carbon coated before imaging with a Temcarb TB500
25
Chapter 2. Experimental
sputter coater (Emscope Laboratories, Ashfold, UK).
2.2.3 Intrinsic properties: pore size distribution and specific surface area
Pore size distribution of microspheres coagulated in 0.5, 2, and 6 M nitric
acid at 25 ◦ C and 10% NaCl solution at 5, 25, and 50 ◦ C were measured using
modified solute exclusion technique (Stone and Scallan, 1967, 1968). Approximately 4.0 g of never-dried microspheres in water (total weight 5.0 g) were
introduced to precisely 5 g of 6% dextran solutions of five different molar
masses, ranging from 6k to 2M g mol−1 (Table 2.2). After few hours of gentle
shaking, the concentrations were measured using a Perkin-Elmer 241 Polarimeter with Na-lamp radiation source (589 nm). The inaccessible volume
for each dextran was calculated using the equation
I naccessi bl e w at er = m w at er +bead s −m d r y bead s +m sol ut e −
m sol ut e × c sol ut e,0
c sol ut e, f
(2.2)
where mwater+beads is the total weight, mdrybeads is the weight after drying
at 105 ◦ C overnight, msolute the weight of the 6% dextran solution, csolute,0
and csolute,f are the initial and final concentrations of the dextran solutions.
Results were fitted to the logistic model using Origin Software (2002) and
the saturation point was computed. Finally, the results were transformed to
frequencies using equation
F r equenc y =
Tot al accesi bl e w at er − i naccessi bl e w at er
. (2.3)
Tot al accessi bl e w at er
Table 2.2: Molar masses and diameters of dextrans in solution.
Molecule
Dextrans
26
Molar mass (g mol−1 )
6k
40k
100k
500k
2000k
Size (Å)
39
91
139
290
560
2.3. Paper III: Chemical functionalisation of the microspheres
Nitrogen adsorption isotherms were measured at 77 K after CO2 critical point
drying (Section 2.2.2) using TriStar 3000 gas sorption apparatus (Micromeritics, Norcross, USA). Specific surface areas were determined from the adsorption isotherms using the equation by Brunauer et al. (1938).
2.3 Paper III: Chemical functionalisation of the microspheres
Cellulose microspheres were prepared as described in Section 2.2.1 using 2 M
nitric acid at 25 ◦ C and 5% cellulose solution. The needle used in this work
was 50 mm long with a 0.8 mm diameter.
2.3.1 Anelli’s oxidation
Microspheres were oxidised using a modified Annelli’s oxidation (Anelli et al.,
1987; Zhao et al., 1999). They were immersed in 50 mM NaH2 PO4 phosphate buffer overnight prior to oxidation. TEMPO/NaClO/NaClO2 oxidation
medium was prepared with molar ratios 0.1/10/1, according to Hirota et al.
(2009) in the same phosphate buffer. The medium was preheated to 20-80 ◦ C
and microspheres were immersed in for 2, 5, 24, and 48 h. pH was followed
regularly. The ratio of the primary oxidant sodium chlorite NaClO2 to anhydroglucose unit (AGU) of cellulose was 1.2. After oxidation, the microspheres
were washed thoroughly under running tap water overnight and several times
with distilled water. Oxidised microspheres were stored in distilled water in a
never-dried state for further use.
Spectroscopic characterisation of the air-dried (2 days at 22.5 ◦ C, 50% humidity) reference and oxidised microspheres was performed with a Nicolet iS 50
FTIR spectrometer with Raman module (Thermo Scientific). FTIR spectra
were recorded using Tungsten-Halogen source and DLaTGS-KBr detectorsplitter set-up with 4.00 cm−1 resolution and 64 scans. In Raman measurements a gold plate was used as a sample holder in order to strenghten the
signal. A diode laser (P=0.5 W, λ=1064 nm) was the source and detector was
an InGaAs with CaF2 splitter. Resolution was 8.00 cm−1 and the number of
scans 1024.
27
Chapter 2. Experimental
Figure 2.1:
Oxidation-reduction cycle of reagents in celluloseTEMPO/NaClO/NaClO2 system. Figure from Hirota et al. (2009).
2.3.2 Porosity and pore size distribution
A solute exclusion technique was used (Section 2.2.3) to measure the changes
in pore size distribution and accessible pore volumes when oxidation temperature was altered in 48 h oxidations. Total porosity was calculated using
Equation 2.1 by weighing the samples before and after oven drying at 105 ◦ C
for three hours, as described in Section 2.2.2.
28
2.4. Paper IV: Drug delivery with functionalised microspheres
2.3.3 Distribution and quantity of the anionic groups
The distribution of the anionic groups was verified with cationic fluorescent
dye, DMS. Oxidised microspheres were cut half, immersed in 15 µM DMSsolution overnight and next day washed for 4 h with tap water and distilled
water to ensure the removal of unbound dye from the pores (Conn, 1953;
Lonkar and Kale, 2011). The distribution was studied using a Leica TCS SP5
Confocal Microscope (Germany).
The quantitative number of anionic groups in oxidised microspheres was
determined with potentiometric back titration. Due to the long diffusion time
(≥30 min) direct titration was not possible. Microspheres were protonated
by immersing them in hydrochloric acid solution overnight. The next day
the concentration of the acid was titrated. The solution was alkalised and
microspheres deprotonated by adding a known amount of sodium hydroxide.
The next day the excess of alkali was titrated, and consumption of alkali by
the anionic groups in microspheres was computed from the differences with
the equation
n(−COOH ) = (n(N aOH ) − n(OH − )) − n(H + )
(2.4)
where n(-COOH) is the total number of anionic groups (mainly carboxylic
acids), n(NaOH) is the added sodium hydroxide to neutralise the supernatant
and to deprotonate the carboxylic acids, n(OH− ) is the back titrated amount
of hydroxide after the NaOH addition, and n(H+ ) is the back titrated amount
of acid in the initial solution after the protonation (Figure 2.2).
2.4 Paper IV: Drug delivery with functionalised microspheres
The oxidised cellulose microspheres prepared in Paper III were used in this
work. In Paper IV oxidised cellulose microspheres (beads) were labelled
as OCBs, the number indicating the oxidation temperature and 0 the nonoxidised reference microspheres. Oxidation temperatures were 20, 40, and
60 ◦ C and time was 48 h.
29
Chapter 2. Experimental
n(-COOH)+n(H+ ) = n(NaOH)-n(OH− )
+n(NaOH)
O−
CO
O−
CO
O−
OH− OH−
CO
CO
O
H
CO
O
H
CO
O
H
H+ H+
Figure 2.2: Determination of anionic groups (-COOH) from solids using the
back titration method. The excess of acid (H+ ) was measured by titration,
then microspheres were deprotonated by adding NaOH and finally the excess
of alkali (OH− ) was back titrated.
2.4.1 Drug loading and uniformity of the mass
ACBs were immersed in 20 mg cm−3 aqueous solution of Ranitidine hydrochloride (Ran.HCl) so that 2 microspheres were in 1 cm3 of the drug solution. Vessels were gently shaken overnight. On the next day the loaded microspheres
were surface dried by rolling them on glass plate until surplus solution was
removed from the surface and then they were kept at constant temperature
and humidity (22.5 ◦ C, 50%) for at least 48 h.
Uniformity of the mass was studied by weighing the dried empty and loaded
microspheres. The number of microspheres was increased by 5 between the
weighings until the total count was 50. Linear correlation between the weight
and the quantity was computed and the average weights were calculated from
the slopes. The amount of the drug in the loaded microspheres was estimated
from the differences in slopes.
2.4.2 Solid state analysis: ATR/FTIR and DSC
Dry ranitidine HCl loaded ACBs were analysed with ATR/FTIR and Raman
spectroscopy (Nicolet iS 50 FTIR spectrometer with Raman module, Thermo
Scientific; for details see Section 2.3.1) in order to characterise the polymorphic form of the incorporated drug and interactions between the anionic
surface of the oxidised microspheres and cationic drug. In raman measurements samples were placed on a gold plate to obtain better signal/noise ratio.
Thermal analysis of 8-9 mg of empty and ∼11 mg Ranitidine HCl loaded ACBs
30
2.4. Paper IV: Drug delivery with functionalised microspheres
was performed with DSC Q2000 (TA Instruments). Samples were placed in
Tzero low-mass pans with lids and heated from 20 to 300 ◦ C with 10 ◦ C min−1
under 50 cm3 min−1 flowing nitrogen.
2.4.3 Swelling behaviour of the microspheres
Empty and Ranitidine HCl loaded ACBs were dried at constant temperature
and humidity (22.5 ◦ C, 50%) for at least 48 h. Samples were then immersed in
buffer solutions with pH values of 1.2, 3.6, and 7.4, corresponding to various
environments in the human gastro-intestinal track. Swelling of the microspheres was monitored by imaging every hour for the first 5 hours, and finally
after 24 hours. Images were analysed with Fiji imaging software (Schindelin,
2008) by fitting binary images to ellipses and measuring the length of the
minor axes.
2.4.4 Release profiles
Release profiles were determined at pH 1.2, 3.6, and 7.4 in Sotax AT7 smart
dissolution tester (SOTAX, Switzerland) according to the USP paddle method
(United States Pharmacopeia, 35t h Ed.). Five drug loaded beads were sunk in
500 cm3 of buffer solution at 37 ◦ C and concentrations were measured using
a Perkin-Elmer Lambda 25 UV/Vis spectrometer (Germany) and computed
from calibration curves. Experiments were done in triplicate.
Release profiles were fitted to the model of exponential decay from 5 to
120 minutes with Qtiplot (2011). Y-offsets and e-folding times, that is the
maximum released amount after infinite time and the time when approximately 63% of the total amount of the drug is released, were measured and
compared with different bead types in various pH environments.
The effect of swelling on the release kinetics was studied by fitting the curves
in two models: Baker-Lonsdale’s model (Equation 2.5) for non-swelling monolithic spheres (Baker and Lonsdale, 1974) and Ritger-Peppa’s model for swelling
spheres (Equation 2.6, n=0.43) (Ritger and Peppas, 1987), where Mt and M∞
are released amounts of drug at time t and infinite time, and k is the release
31
Chapter 2. Experimental
constant.
32
Ã
¸2 !
·
3
Mt
Mt 3
−
= kt
1− 1−
2
M∞
M∞
(2.5)
Mt
= kt 0.43
M∞
(2.6)
3 Results and discussion
3.1 Paper I: Pretreatment and dissolution of cellulosic
fibres
In HyCellSolv-pretreatment dissolving pulp was immersed in preheated 2575 ◦ C ethanol-acid -solution for 0.25-5 h. After the treatment pulp was thoroughly washed and dried in an oven at 60 ◦ C overnight. The aim was to
enhance the solubility of the cellulose in 7% NaOH-12% urea-water solvent
system and characterise the significant changes in the properties of the pulp.
3.1.1 Morphological changes and degree of polymerisation: Influence on dissolution mechanism
Microfibrils in primary cell wall (P) do not have any specific orientation.
This lack of orientation in microfibrils was observed in FE-SEM images of
untreated dissolving pulp (Figure 3.1 A, B). Pulp treated with HyCellSolv for
2 h at 25 ◦ C also showed disoriented microfibrils, but the surface was clearly
damaged and the thin P-layer was not so clearly visible anymore (Figure 3.1,
C, D). The secondary cell wall S1 is thinner than P, however, and could not be
located with confidence (Jensen, 1977). After 2 h of HyCellSolv-treatment at
75 ◦ C some remnants of the P-layer could be observed, but the orientation of
the microfibrils mainly indicated that the outermost layer was secondary cell
wall S2 (Figure 3.1, E, F).
Changes in the fibre wall after the HyCellSolv-pretreatment affected the dissolution mechanism of the pulp fibres in dilute solvent (Figure 3.2, optical
images). At low temperatures (25-45 ◦ C) and short treatment times a ballooning phenomenon was observed. This is explained in the literature as the
presence of primary wall P and some parts of the secondary walls (Jensen,
1977; Navard et al., 2008). At higher treatment temperatures and longer times,
for example 3 h at 55 ◦ C ballooning was no longer so distinct, even though
regions for possible balloons could be observed. After 5 h at 55 ◦ C ballooning
could no longer be observed. This was due to a ruptured P-layer and possibly
33
Chapter 3. Results and discussion
Figure 3.1: SEM-images of reference (A,B) and pulp treated with HyCellSolv
for 2 h at 25 (C,D) and 75 ◦ C (E,F). Magnifications are 5,000 in the top row and
50,000× in the bottom.
part of the S1 as well.
Figure 3.2: Viscosity average degree of polymerisation (DPν ) of HyCellSolvpretreated dissolving pulp at various temperatures and times. Optical images
demonstrate the behaviour of the fibres in 0.2 M CED after corresponding
pretreatment conditions.
34
3.1. Paper I: Pretreatment and dissolution of cellulosic fibres
It should be noted that temperature alone did not eliminate the ballooning.
HyCellSolv-pretreatment even at 75 ◦ C for 15 minutes caused slight ballooning, although fragmenting was also observed (Figure 3.2). Since the presence
of P-layer after 15 minutes at 75 ◦ C in HyCellSolv was more clear than, for
example, after 5 h at 55 ◦ C, it is reasonable to conclude that rupture of the
P-layer is not directly connected to the degree of polymerisation. According to the factory specifications (Domsjö, 2007) pulp has a lignin content of
0.6%. It could be speculated that the high lignin content of the thin P-layer
requires more time to dissolve in HyCellSolv-solution than cellulose degrades
in whole fibre. The content of hemicelluloses did not change notably during
the pretreatment (Paper I).
After 15 minutes at 75 ◦ C the average viscosity degree of polymerisation DPν
had decreased to 261, which was 34% of the initial (760). Slight ballooning,
the presense of the P-layer, was observed at this stage. After 2 h of pretreatment at that temperature DPν was 174 (23% from the initial) and dissolution
proceeded clearly via fragmenting mechanism.
HyCellSolv-pulp was dissolved in NaOH-urea-water solvent (consistency
0.2%) after various pretreatment times. In microscope balloons or indicators
of the ballooning phase during the dissolution were observed when pretreatment temperature was below 65 ◦ C (Figure 3.3, A-C), however, clear solutions
were gained when the pretreatment temperature was higher than 65 ◦ C (Figure 3.3, D).
Figure 3.3: 0.2% HyCellSolv-pretreated pulp in 7% NaOH-12% urea-water.
Pretreatment time 2 h and temperatures (A) 25, (B) 45, (C) 55, and (D) 65 ◦ C.
Scale bars are 100 µm.
It can be concluded that HyCellSolv-pretreatment at higher temperatures
disrupted the primary cell wall and severely decreased the degree of polymerisation of cellulose. The lack of P-layer caused the fibres to dissolve via
fragmenting mechanism instead of ballooning, yielding clear solutions with35
Chapter 3. Results and discussion
out “collars” (Figure 3.3, C) or other undissolved fragments. DPν on the other
hand did not play a significant role in the dissolution mechanism (e.g. in
Figure 3.2 15 minutes at 75 ◦ C or 3 h at 55 ◦ C).
3.1.2 Nature of the 0-5% cellulose-7% NaOH-12% urea-water solutions
HyCellSolv-pulp (2 h at 75 ◦ C) was dissolved in 7% NaOH-12% urea-water
solvent system at -10 ◦ C after dispersion and swelling at room temperature.
Concentrations of cellulose were 0.2-5%, in order to study the nature of the
solution.
At low concentrations the cellulose solutions behaved like Newtonian solutions, but at higher concentrations shear thinning was observed (Figure 3.4,
left). The viscosity increased with increasing cellulose concentration and temperature. Since the viscosity of the solution is temperature dependent, it was
possible to use the Arrhenius equation to calculate the apparent activation
energies Ea for the viscous flow at extrapolated zero-shear rate and shear rates
10, 100, 1000 s−1 . Viscosities were plotted to Arrhenius plots and Ea values
were computed from the slopes (Figure 3.4, right).
Figure 3.4: (Left) Viscosity of 0-5% HyCellSolv-cellulose in 7% NaOH-12%
urea-water at 10-25 ◦ C as a function of shear rate. (Right) Apparent activation
energies Ea of viscous flow on shear rates 0, 10, 100 and 1000 s−1 .
At shear rates 0, 10, and 100 s−1 activation energies increase until the cellulose concentration exceeds 3%, then they decrease rapidly. This indicates
the formation of the aggregates, or at least less resistant flow. Polymeric solutions should increase the resistivity to the flow with increasing polymer
concentration. Addition of cellulose to the solution did not increase resistivity
36
3.1. Paper I: Pretreatment and dissolution of cellulosic fibres
to the flow, so the interactions between the polymer molecules were more
prominent than with the solution. In this case, the addition of the cellulose
decreased the activation energies rapidly, indicating strong aggregation and a
decrease in interactions between the polymer and the solvent.
At high shear rate (1000 s−1 ) activation energy increases slightly until 4%
and remains constant at 5%. If the solution is a so-called “true solution”,
the activation energy should increase, however, activation energies did not
decrease as at other shear rates. This is due to high shear, where the movement
of the molecules inhibits the formation of the stable aggregates.
Cellulose is often dissolved in aqueous alkali solvents at reduced temperatures.
One explanation for this is the formation of inclusion complexes, which
inhibit the coagulation of the molecules (Lue et al., 2007; Qin et al., 2013).
Collapse of the inclusion complexes occurs at elevated temperatures and
gelation, the formation of the hydrogen bonding network begins. When the
network is strong enough, the storage modulus takes over and the solution
becomes more gel-like than a viscous solution.
4-6% cellulose solutions were heated to 20 and 25 ◦ C and storage (G’) and
loss (G”) moduli were measured as a function of time (Figure 3.5). At 25 ◦ C
4% cellulose solution gelated after 28 minutes and the 5% solution 5 minutes
earlier. The 6% cellulose solution had already gelated after 8 minutes when
temperature was 25 ◦ C. When the 6% solution was studied at 20 ◦ C, gelation
took 33 minutes, clearly longer than even a 4% cellulose solution. This supports the results of Qin et al. (2013) that at higher temperatures inclusion
complexes are fully destroyed and cellulose molecules are exposed to the
formation of hydrogen bonds with each other.
It should also be noted that at the concentrations used in gelation studies, only
a 4% cellulose solution could have been near a “true solution” state. Others
already contained some H-bonded cellulose molecules, however, the fact that
6% gelated 25 minutes later when the temperature was lowered below the
degradation point of the inclusion complexes indicates that these aggregates
were surrounded by NaOH-urea-hydrates and could not coagulate.
37
Chapter 3. Results and discussion
Figure 3.5: Storage and loss moduli of 4-6% cellulose-7% NaOH-12% ureawater solutions. Cross-sections of the moduli indicate the gelation points.
3.2 Paper II: Physicochemical design of microspheres
3-7% cellulose-7% NaOH-12% urea-water solution was prepared from HyCellSolvpulp (pretreatment 2 h at 75 ◦ C) and the solution was extruded drop-wise
through a syringe (Eppendorf 5 cm3 ) into the conditioned antisolvent (Table
2.1). The aim of the study was to demonstrate the effect of the coagulation
conditions on the properties of the microspheres. A 3% cellulose solution
could not form stable microspheres due to a lack of the building material.
Moreover, the 7% solution was too viscous to form droplets and formed a
continuous flow instead.
3.2.1 Size, shape, and weight of microspheres
The size of a microsphere is defined by the size of the droplet detaching from
the needle through which it is extruded. Shape, on the other hand, can be
influenced by several factors. Depending on the cellulose concentration in
the dope, during the detachment from the needle the droplet stretches and
forms a tail. Higher cellulose concentration causes more stretching (tailing).
Another factor affecting the shape is the impact with the antisolvent. If the
needle is too far from the surface, the surface tension of the antisolvent causes
an impact which flattens the droplet (Sescousse et al., 2011b). Conversely, if
the needle is too close to the surface, the droplet may attach to it after passing
through the surface. Since the droplet is still denser than the antisolvent, it
tends to fall to the bottom. Attachment on the surface and gravity together
38
3.2. Paper II: Physicochemical design of microspheres
stretches the coagulating droplet and forms a tear-shaped microsphere.
The size of the cellulose microspheres increased when the 5% cellulose solution was coagulated in 2 M nitric acid and 10% NaCl solution at increasing
temperature (Figure 3.6A, Table 3.1). The same trend was observed with
increasing acid concentration (Figure 3.6B). Faster coagulation kinetics under these conditions caused the skin layer to solidify immediately after the
contact with antisolvent and maintain the initial dimensions of the droplet.
As the coagulation kinetics slowed down by decreasing temperature or acid
concentration, the interior parts of the droplet had more time to pack more
closely and the ongoing coagulation inside of the microsphere pulled the
outer layers closer and caused slight shrinking.
Table 3.1: Gaussian parameters of normalised size distribution values from
images of cellulose microspheres prepared under different conditions
Preparation conditions
ccel l ul ose
T
cH NO 3
◦
(%)
( C)
(M)
4
25
2
5
25
2
6
25
2
Gaussian parameters
Peak
FWHM a
(mm)
2.92
0.16
2.97
0.16
2.99
0.20
5
5
5
5
5
5
25
25
25
25
25
25
0.5
2
4
6
8
10
2.71
2.97
2.67
3.02
3.05
3.31
0.32
0.16
0.60
0.58
0.27
0.41
5
5
5
5
25
50
2
2
2
2.41
2.70
2.85
0.37
0.24
0.21
5
5
5
5
25
50
b
2.79
2.76
3.20
0.32
0.24
0.14
b
b
a Full width at half maximum
b 10% NaCl was used instead of HNO
3
Circularity, i.e. 4π×area/perimeter2 , was found to be unaffected by the increased acid concentration, but the increased temperature yielded slightly
39
Chapter 3. Results and discussion
Figure 3.6: The effect of (A) temperature, (B) acid concentration and (C)
cellulose concentration on volume (M N), weight (H O), circularity (◦ •) and
porosity (■ ä). Constant parameters are given above the figures.
more spherical particles. The surface tension of the acid increases with the
concentration (Weissenborn and Pugh, 1996). This accelerated the formation
of the skin layer and droplets maintained their shape after the first contact
with the acid. When the temperature of the antisolvent was increased from 5
to 50 ◦ C, the surface tension decreased by 10% (Vargaftik et al., 1983). A lower
surface tension assisted the droplet in passing through the surface boundary
without attaching to it and tail-formation was minimised.
The weight of the microspheres closely followed the volume. Porosity again
follows these two values closely, since it is calculated from the amount of
water in certain volume. When the cellulose concentration was increased
(Figure 3.6C), more solid material occupied the same volume. A slight increase
was observed in volume and weight (density of the cellulose is ∼1.5 g cm−3 ).
This caused the porosity to decrease rapidly.
3.2.2 Morphology of the cross-sections and surfaces of the microspheres
Slow coagulation in milder acid formed more coarse surfaces than fast coagulation in concentrated acid (Figure 3.7). Fast coagulation inhibited the
40
3.2. Paper II: Physicochemical design of microspheres
formation of bigger agglomerates, and fibrils can be seen on the surface of the
microspheres coagulated in 2-10 M nitric acid solution. Faster coagulation
also yielded smaller fibrils (Figure 3.7B-D).
Figure 3.7: FE-SEM images of the surface of the microspheres. 5% cellulose solution coagulated in (A) 0.5, (B) 2, (C) 6 and (D) 10 M HNO3 at 25 ◦ C.
Magnification is 10,000×.
Similar changes were observed in interior parts of the cross-sections (Figure
3.8). When coagulation was slower the size of the agglomerated fibrils was
greater. Since the concentration changes of the antisolvent are not so severe
inside the microspheres, the presence of the agglomerates was observed in
microspheres coagulated in 2 M nitric acid. However, 6 M HNO3 did not
produce agglomerates any more and only fibril-like shapes were seen in crosssection images (Figure 3.8C).
The thickness of the skin layer was noted to increase when more concentrated
acid was used for coagulation (Figure 3.9). In 0.5 M HNO3 skin layer was
hardly detectable, whereas in microspheres coagulated in 2-6 M HNO3 it was
∼3-6 µm thick. The coagulation mechanism was observed to change when
10 M acid was used; instead of simultaneous solidification (sol-gel transition)
41
Chapter 3. Results and discussion
Figure 3.8: FE-SEM images of the interior of cross-sections of the microspheres. 5% cellulose solution coagulated in (A) 0.5, (B) 2, (C) 6 and (D) 10 M
HNO3 at 25 ◦ C. Magnification is 10,000×.
42
3.2. Paper II: Physicochemical design of microspheres
from the surface towards the interior, several nucleation centres were formed
on the surface of the droplet immediately after the contact with acid. Locally
this formed “plates” which could even be ∼50 µm thick, but the plates would
not cover whole microsphere as continuous layer. The whole sphere was
labile and they could not handle physical pressure or stress as well as spheres
coagulated from milder acid environments.
Figure 3.9: FE-SEM images of the edge of the cross-sections of the microspheres. 5% cellulose solution coagulated in (A) 0.5, (B) 2, (C) 6 and (D) 10 M
HNO3 at 25 ◦ C. Magnification is 250×.
The surfaces of the microspheres prepared from 4 and 6% solutions and
coagulated in 2 M HNO3 at 25 ◦ C were very similar to those prepared from
5% solution in same antisolvent (Figure 3.10). A skin-core structure was
also observed in cross-sections on the edge. In microspheres prepared from
6% solution thicker structures were seen under the surface compared to
microspheres prepared from 4% and 5% solutions. The pores were smaller
in images showing the interior, and conversely in microspheres from the
4% solution pores were bigger. This observation is in agreement with the
total porosity values (Figure 3.6, C) which decreased over a few per cent with
increasing cellulose concentration in solution. This was explained by the
43
Chapter 3. Results and discussion
addition of solid material into a constant volume.
Figure 3.10: FE-SEM images of the surface, edge and interior of the CPD
cellulose microspheres coagulated in 2 M HNO3 at 25 ◦ C. Magnifications are
1,000 (edge) and 10,000× (surface and interior).
3.2.3 Intrinsic properties
Pore size distribution
Pores of the cellulose microspheres were probed using dextrans of various molar masses (Table 2.2). The amount of inaccessible water was computed from
the concentration differences (Equation 2.2; Figure 3.11, left) and converted
to frequencies for each dextran (Equation 2.3; Figure 3.11, right).
The total accessible water (the saturation point) for all the samples varied
between 91% and 92% (Figure 3.11, left). This is clearly lower than reported in
Figure 3.6. The difference results from the closed pores and limited range of
dextran probes; the smallest dextran used in this study can access the pore
with an entrance of 36 Å, which then excludes all the micropores (<20 Å) and
even some of the small mesopores (Westermarck, 2000).
When the acid concentration of the antisolvent was increased, coagulation
kinetics increased and macropores (≥560 Å) were favoured over mesopores
(39-290 Å; Figure 3.11, right:top). Slower coagulation gave cellulose molecules
more time to arrange themselves to fill the whole space (sol-gel transition),
which also maximised the specific surface area (Figure 3.12, B). The sum of
44
3.2. Paper II: Physicochemical design of microspheres
the mesopores (0.5 M 0.669; 2 M 0.649; 6 M 0.598) follows a nearly linear trend
and is inversely proportional to the frequencies of the macropores (0.276,
0.289, 0.348).
When the microspheres were coagulated in 2 M acid but at different temperatures, kinetics did not explain the variations in pore size distributions (Figure
3.11, right:bottom). Similar trends as with macropores in this measurement
were, however, observed in total porosity values (Figure 3.6, A:bottom, solid
squares). Coagulation at 25 ◦ C produced microspheres with the lowest porosity and amount of macropores. Since the volume (Figure 3.6, A, top, open
triangles) was almost the same at 5 and 25 ◦ C coagulated microspheres, the
higher amount of mesopores and lower amount of macropores resulted from
the faster movement of the cellulose molecules at higher temperature, and
thus more even spreading across the constant volume. However, the sol-gel
process did not take over due to the elevated temperature (note the gelation
point, Figure 3.5) but was still a result of the neutralisation.
At 50 ◦ C, however, coagulation was so rapid that the skin layer solidified faster
than at lower temperatures and generated microspheres with higher volume
(Figure 3.6, A, top, open triangles) and higher frequency of macropores (Figure
3.11, right: bottom). It should be noted that surface area decreased with
increasing temperature (Figure 3.12, A), so generally the same explanation
as for the increase of the acid concentration applies here; fast coagulation
packed the cellulose molecules more tightly to clusters, creating bigger pores
and less coverage over the space. It could be assumed that the sol-gel process
played a bigger role at 50 ◦ C than neutralisation of the solvent by antisolvent.
Specific surface area
As observed in the subsection “Pore size distribution”, the amount of small
mesopores increased when coagulation kinetics was slower (Figure 3.11, right:
top). The specific surface area (SSA) increased when microspheres were
coagulated at lower temperatures or in lower concentrations of acid (Figure
3.12, A and B), however, coagulation in 10% NaCl solution did not produce
slightly lower SSA compared to HNO3 even though coagulation kinetics was
notably slower. The trend was very similar in both, anti- and non-solvents.
The increase in SSA when 8 and 10 M HNO3 was used could be explained by
a competing coagulation mechanism, as pointed out in Section 3.2.2 (Mor45
Chapter 3. Results and discussion
Figure 3.11: (Left) Inaccessible water, saturation point and frequencies of
the pores of the microspheres coagulated from 5% cellulose solution in 2 M
HNO3 at 25 ◦ C. (Right-top) Computed pore size distributions from the solute
exclusion measurements for microspheres coagulated in 0.5-6 M HNO3 at
25 ◦ C and (right-bottom) 2 M HNO3 at 5-50 ◦ C.
phology of the cross-sections and surfaces of the microspheres). Decreased
mechanical stability was observed while handling the microspheres. This
also indicates that the supportive thicker pore walls did not have time to form
and thus the microspheres became weaker than the ones prepared in lower
acid concentrations. A high acid concentration probably resulted in smaller
precipitates in the matrix and degraded some of the supportive structures.
When the cellulose concentration was decreased in the initial cellulose solution to 4%, a clear decline was observed in SSA compared to the microspheres
prepared from 5% and 6% solutions (Figure (3.12, C). Assuming that the surface area in the microspheres produced from 5% solution was already just
about maximised, less material in apparently the same volume (Figure 3.6,
C: open triangles) undoubtedly yields less SSA. In the same manner it could
be concluded that the addition of the material (6% solution) cannot increase
already maximised SSA; further additions of cellulose would not only cause
more aggregated molecules in solution (Section 3.1.2) but also less porosity
(Figure 3.6, C). However, higher cellulose concentration yielded continuous
stream of the solution through the needle and microspheres could not be
produced. Conversely, less than 4% cellulose in the solution could not form
solid and mechanically stabile spheres in antisolvent.
46
3.3. Paper III: Chemical modification of microspheres
Figure 3.12: The effect of (A) temperature, (B) acid concentration, and (C)
cellulose concentration on specific surface area of the critical point dried
cellulose microspheres. General conditions for coagulation were: 5% cellulose
solution coagulated in 2 M HNO3 at 25 ◦ C.
3.3 Paper III: Chemical modification of microspheres
Cellulose microspheres were prepared by dropping 5% cellulose-7% NaOH12% urea-water solution into 2 M HNO3 at 25 ◦ C through the needle and
oxidised with a modified Anelli’s reaction. The aim of this work was to study
the structural changes in microspheres after heterogeneous modification.
Paper III also introduced the swelling properties of the oxidised microspheres
and their application as drug carriers, but these are presented with more
detail in Section 3.4 Paper IV: Drug delivery.
3.3.1 Oxidation mechanism and the amount of generated anionic
groups
Microspheres were oxidised with a TEMPO/NaClO/NaClO2 system (TEMPOmediated oxidation) in phosphate buffer. Sodium chlorite NaClO2 acted as
a primary oxidant converting aldehydes into carboxylic acids at C6 position
in cellulose (Hirota et al., 2009). There was an excess of NaClO2 compared
to AGU with a ratio of 1.2, which is in theory enough to convert all the C6
hydroxyl groups to carboxylic acid but in practise higher amounts of chlorite
should be used to gain even water-soluble conversion yields (Hirota et al.,
2009).
Oxidation in a TEMPO/NaClO/NaClO2 system produces hydrogen ions (Isogai et al., 2011), however, an increase in pH values was observed during the
47
Chapter 3. Results and discussion
reaction when the reaction temperature was set to 60 and 80 ◦ C (Figure 3.13).
At 60 ◦ C an increase occurred after 24 h but at 80 ◦ C it occurred after 5 h. It
is known that N-oxoammonium salt degrades under acidic conditions into
TEMPOH, oxoammonium radical, and open ring carbocation at elevated
temperatures (Ma et al., 2011; Sen and Golubev, 2009) (Figure 3.14B). Generation of additional TEMPOH to oxoammonium cation leads to increased
consumption of hypochlorite and the production of hydroxide ions (Figure
3.14A). Primary alcohols are not oxidised to aldehydes since oxoammonium
cations are degradating, hydrogen ions are not produced and the solution
alkalises.
Figure 3.13: (A) Oxidation of primary alcohols to aldehyde by oxoammonium
and TEMPOH intermediates in NaClO-water solution. (B) Degradation of
oxoammonium salt at high temperature. Images adapted from Isogai et al.
(2011) and Ma et al. (2011).
The total number of anionic groups which are protonated and deprotonated
between pH values 2 and 11 were determined by back-titration method (Figure 3.15). At 60 ◦ C oxoammonium ion degraded after 24 h, but it produced
the highest amount of carboxylic acid groups in cellulose microspheres. At
80 ◦ C yield was notably lower, probably due to a too high degradation rate at
the beginning of the reaction and non-specific oxidation by hypohalous acid
(de Nooy et al., 1995).
At 40 ◦ C the decrease in pH value is the most notable (Figure 3.13). This
indicates fast oxidation of cellulose and degradation of N-oxoammonium
ions. Zhao et al. (1999) optimised the reaction temperature to 35 ◦ C to reduce
the chlorination in Anelli’s reaction (Anelli et al., 1987).
48
3.3. Paper III: Chemical modification of microspheres
Figure 3.14: (A) Oxidation of primary alcohols to aldehyde by oxoammonium
and TEMPOH intermediates in NaClO-water solution. (B) Degradation of
oxoammonium salt at high temperature. Images adapted from Isogai et al.
(2011) and Ma et al. (2011).
Figure 3.15: Total anionic groups in oxidised cellulose microspheres after
2-48 h of oxidation at 20-80 ◦ C. Degree of substitution (DS) values correspond
to the values after 48 h of oxidation.
3.3.2 Spectroscopic qualification and the distribution of anionic
groups
Spectra of oxidised and reference microspheres were assigned according to
the literature (Larkin, 2011) (Figure 3.16). Polymorphic type cellulose II was
confirmed with Raman vibration at 1463 cm−1 (Schenzel and Fischer, 2001).
Vibrations at the transition region around 1266 cm−1 were also perceived only
for cellulose II but were not characterised exactly. Vibrations at 894 (FTIR)
and 898 cm−1 (Raman) were assigned for δHCC and δHCO angle bendings
around C(6) atom, semi-circle stretchings. This band is broader in cellulose I
49
Chapter 3. Results and discussion
and has multiple peaks due to different molecular conformation (Schenzel
and Fischer, 2001).
Figure 3.16: (Top) FTIR and (bottom) Raman spectra of reference and at 60 ◦ C
oxidised cellulose microsphere (OCB; oxidised cellulose bead).
The differences between reference and oxidised microspheres is the most
profound at the region where R-COO vibrations are found; at 1400-1600 cm−1
in FTIR and 1400-1650 cm−1 in Raman spectra (Figure 3.17). The intensity of
the R-COO vibrations increased almost linearly with oxidation temperature
(Figure 3.17, insets), as long as the reference was excluded. Since intensities
correlated well with the measured amount of total anionic groups (Figure
3.15) FTIR/Raman could be used for preliminary quantitative determination
of AGs, as long as good internal standard is available. The phase stretching
of R-COO in the FTIR spectra at 1416 cm−1 (Figure 3.17, left, open square)
especially correlated with coefficient R2 =0.9995 without any lateral shift of the
peak. Peak at 1594 cm−1 shifted when oxidation temperature was increased
from 20 to 60 ◦ C (∆ν=5.3 cm−1 ), probably due to underlying H2 O vibrations
at 1640 cm−1 . The intensity of Raman peak at 1611 cm−1 was too low for
precise quantitative analysis and 1413 cm−1 had a correlation of R2 =0.89 due
to overlapping vibrations from CH2 deformation (Figure 3.17, right).
Never-dried cross-sectioned microspheres were immersed in 15 µM DMS
50
3.3. Paper III: Chemical modification of microspheres
Figure 3.17: (Left) FTIR and (right) Raman spectra at specific regions for RCOO vibrations. Insets are showing the relative intensities of indicated peaks
of microspheres oxidised at 0 (reference) and 20-60 ◦ C.
solution overnight in order to label the anionic groups. Samples were washed
thoroughly with tap water and distilled water to ensure that fluorescent dye
would be bound only by strong ionic interactions and the excess would be
washed away from the pores.
The distribution of fluorescent dye was observed with a confocal microscope
(Figure 3.18). The slightly anionic surface of pure cellulose microspheres
bound some of the dye, but a clear difference to the oxidised microsphere
was confirmed with the same parameters of the excitation laser and detector.
In both samples anionic groups, the bound DMS giving the response signal,
were evenly distributed. A confocal microscope also revealed some of the
morphological features in stack images (Figure 3.18, right).
3.3.3 Structural changes
Cellulose forms agglomerates during the coagulation. Bigger and more dense
shapes are formed if the coagulation process is slow (Section 3.2.2 and Figure
3.19A,B). After oxidation in TEMPO/NaClO/NaClO2 for 2 and 48 h at 80 and
60 ◦ C, respectively, dense agglomerates were found to be more open and
cloudy (Figure 3.19C-F). Intensive oxidation breaks the hydrogen bonding
network by converting C(6) hydroxyl groups into carboxylic acids and at
higher temperatures it may also degrade cellulose chains (de Nooy et al., 1995)
and open the matrix, widening the pore entrances and cavities.
51
Chapter 3. Results and discussion
Figure 3.18: Confocal micrograms of cross-sections of (left) pure and (right)
48 h at 60 ◦ C oxidised cellulose microsphere labelled with fluorescent cationic
dye DMS. Images are 1.55×1.55 mm.
Figure 3.19: Micrograms of cross-sectioned CO2 critical point dried (A, B)
reference, (C, D) 2 h at 80 ◦ C and (E, F) 48 h at 60 ◦ C oxidised microspheres.
White ovals highlight some of the agglomerates. Magnifications are 1,000 in
the top row and 10,000× in the bottom.
Dextran molecules with various molar masses (Table 2.2) were used in a solute
exclusion technique to probe the pores. Macropores (diameter ≥560 Å) had
the highest frequency of all measured pores sizes (Figure 3.20). After oxidation
for 48 h at 20-60 ◦ C the relative amount of macropores decreased linearly
(R2 =0.96) with increasing temperature. Contrary to the macropores, the sum
52
3.4. Paper IV: Drug delivery
of the frequencies of small mesopores (39-139 Å) increased linearly (R2 =0.98).
Since the total porosities were all between 94-95% regardless of the oxidation
temperature (Paper III, supplementary material) and the amount of accessible
water for dextrans increased steadily from 82.28% to 84.37% in reference and
oxidised microspheres at 20-60 ◦ C, respectively, it is reasonable to hypothesise
that small pores (small meso- and micropores) became wider and closed pores
were opened during the oxidation. This enlarged the accessible volume for
dextrans but did not change the total porosity.
Figure 3.20: Pore size distribution of cellulose microspheres before and after
oxidation in TEMPO/NaClO/NaClO2 system for 48 h at 20-60 ◦ C.
3.4 Paper IV: Drug delivery
Cellulose microspheres were prepared and oxidised as described in Papers
II and III. The microspheres were assigned as ACB0-60, where 0 stands for
reference cellulose beads and 20-60 anionic cellulose beads oxidised for 48 h
at 20-60 ◦ C. The aim of this work was to study the mass uniformity of the
loaded drugs and the effect of the anionic charge on the loading and release
profiles of cationic model drugs. To better understand the release mechanism,
the behaviour of the dried microspheres was studied in physiological pH
environments.
3.4.1 Uniformity of mass and drug content
The weight of microspheres is mainly defined by the volume of droplets and
the cellulose content in solution. Since the cellulose content does not very
53
Chapter 3. Results and discussion
within the batch, the only variable is the volume. A droplet detaches from the
tip of the needle when the viscosity of the solution cannot hold the growing
weight of the droplet any longer. Since the viscosity does not notably change
if the temperature of the solution does not drastically vary (Figures 3.4 and
3.5), the volume of the droplet is in a large extent constant.
The benefit of the immersion method over, for example, the dispersion
method is that the loading degree can be adjusted by controlling the concentration of the solution and it will be the same for the whole batch. In the
dispersion technique microspheres were loaded in 20 mg cm−3 Ranitidine
HCl solution overnight and dried at constant temperature and humidity for
two days. The mass of the batch of loaded and placebo ACBs was weighed by
adding 5 microspheres until the total count was 50. Correlation coefficient
R2 for linear fit was over 0.999 in all measurements (Figure 3.21), indicating a
very even volume and loading capacity.
Figure 3.21: Uniformity of masses of loaded and placebo microspheres.
The amount of ranitidine hydrochloride was calculated from the differences
in the slopes of the linear correlations (Table 3.2). The amount of drug increased in the microspheres when the oxidation temperature was increased.
However, the high mass of placebo ACB60 was due to bound water (see Section 3.4.2) and thus the seemingly lower amount of drug than for example
ACB40. Released amounts confirm that the actual drug content is higher than
measured with gravimetric comparison (see Figure 3.26).
Even if the exact mass of loaded drug in microsphere cannot be determined
by gravimetric methods alone due to odd amounts of bound water, high
linear correlations demonstrate the uniformity of the microspheres and their
54
3.4. Paper IV: Drug delivery
Table 3.2: Weights of placebo and loaded microspheres, amount of Ranitidine
HCl per one microsphere and loading degrees. Calculated from the slopes of
linear correlations.
Weight / mg
Placebo
Loaded
ACB0
ACB20
ACB40
ACB60
4.33±0.01
5.43±0.04
5.09±0.02
5.34±0.03
5.46±0.01
6.61±0.04
6.86±0.06
6.83±0.05
Ran.HCl / mg
Loading / %
1.13±0.01
1.18±0.07
1.77±0.08
1.49±0.07
20.7
17.8
25.8
21.8
loading.
3.4.2 Solid state analysis
DSC measurements were performed after drying the ranitidine hydrochloride
loaded and placebo microspheres at constant temperature and humidity
for two days. Increased hydrophilicity of the placebo ACBs was observed as
endothermic dehydration peaked at 200-225 ◦ C (Figure 3.22). Dehydration
began at lower temperatures as the peak area, the amount of bound water,
increased in the microsphere. After the dehydration microspheres started to
depolymerise 10-20 ◦ C later (Dahiya and Rana, 2004).
Figure 3.22: DSC of ACBs. Heating rate 10 ◦ C min−1 and nitrogen flow
50 cm3 min−1 .
Crystalline ranitidine hydrochloride has a melting point of 147 ◦ C and it goes
through exothermic decomposition instantly after the melting (Perpetuo et al.,
55
Chapter 3. Results and discussion
2013). The melting point was not observed when ranitidine hydrochloride
was incorporated in the ACBs, indicating that it was solidified in amorphous
form (Figure 3.23).
The changes in the intensities of the dehydration peaks are minimal compared
to those of the placebo microspheres, indicating at least partial replacement
of the bound water by the drug in loaded microspheres (Figure 3.23). Simultaneously with the incorporation of the drug, the stability of the microspheres
decreased so that oxidised ACBs seemed to dehydrate already at 185 and ACB0
at 200 ◦ C.
Figure 3.23: DSC of pure ranitidine hydrochloride and loaded ACBs. Heating
rate 10 ◦ C min−1 and nitrogen flow 50 cm3 min−1 .
The crystal structure of the ranitidine hydrochloride was recognised as polymorph II by the characteristic region in the Raman spectra around 3000 cm−1
(Figure 3.24, inset) and the peak at 1185 cm−1 (Chieng et al., 2009). When
ranitidine hydrochloride was incorporated in ACB60 and ACB0, the peak at
1555 cm−1 widened and shifted to 1552 cm−1 and the peak at 1185 cm−1
disappeared (Figure 3.24, ACB0 not shown). This is due to the amorphous
form of the drug.
There were no changes in FT-IR spectra of oxidised ACBs when drug was
incorporated (Figure not shown). The phase stretching of R-COO group at the
region 1400-1650 cm−1 (Figure 3.17) in loaded ACBs did not change, indicating
the lack of interaction between the cationic drug and the microspheres.
56
3.4. Paper IV: Drug delivery
Figure 3.24: Raman spectra of Ranitidine HCl and ACB60 with and without
incorporated drug. Inset: specific region 2750-3200 cm−1 . Symbols are characteristics for the polymorph II of Ranitidine HCl.
3.4.3 Swelling behaviour of placebo and loaded microspheres
Never-dried ACB0-20 had a diameter of 4.2 ± 0.2 and ACB40-60 4.3 ± 0.2 mm
whether they were loaded with ranitidine hydrochloride or not. After drying
the drug loaded microspheres were slightly bigger than the placebo ones;
1.8 ± 0.2 and 1.7 ± 0.2 mm, respectively (Trygg et al., 2014).
ACB0 swell very little in any tested pH environment (Table 3.3). After 24 h
in buffer solutions ACB0 swelled to almost 50% from the initial never-dried
diameter. Swelling at pH 1.2 was noted to be slightly higher than pH environments 3.6 and 7.4, regardless of whether the microsphere was loaded with
drug or not.
Oxidised ACBs were approximately the same size after drying as ACB0, but
the swelling behaviour at all tested environments was more intense. Even at
pH 1.2, which is clearly below the pKa of carboxylic groups, the microspheres
swelled more than ACB0. Microspheres swelled up to 88% from the initial
state when the oxidation temperature was increased to 40 ◦ C. After oxidation
at 60 ◦ C the diameter of the drug loaded microsphere reached almost 90%.
Swelling mechanism was influenced by the drug loading in oxidised ABCs
(Figure 3.25). For example, ACB60 without incorporated drug (Figure 3.25,
open square) swelled during the first hour at pH 3.6 and 7.4 to the same point
as ACB0 with drug, but instead of levelling-off ACB60 increased the swelling
rate and the swelling continued for two hours before the rate decreased.
57
Chapter 3. Results and discussion
Table 3.3: Swelling of ACB0 and oxidised ACBs after 24 h at pH values 1.2,
3.6, and 7.4. Values are percentages from the diameter of corresponding
never-dried CBs.
ACB0
ACB20
ACB40
ACB60
Dry
Placebo
1.2
3.6
7.4
41.2
41.4
40.3
41.5
49.8
52.7
51.0
50.0
48.4
72.8
84.2
88.0
48.5
59.5
60.6
64.8
Dry
Loaded
1.2
3.6
7.4
47.5
47.3
48.4
47.7
54.6
57.3
58.4
55.9
49.5
78.0
88.3
89.7
52.7
63.2
66.5
64.2
After the wetting stage, water infusion, ACBs could increase their diameters
throughout the sphere without causing any tension. ACB0 swelled during the
first hour in all pH environments to its maximum value with and without the
drug, as did the oxidised ACBs at pH 1.2.
A wetting stage was not observed when oxidised ACBs were loaded with drug
and immersed in pH 3.6 and 7.4 environments (Figure 3.25, solid square).
Slow down after one hour could not be observed, but instead swelling rate increasing immediately from immersion in the buffers until levelling-off 1.5-2 h
from the beginning. The incorporated drug acted as a filler and pores stayed
open. Wetting the pores occurred as fast as highly soluble drug dissolved
away.
Figure 3.25: Swelling of the ACB0 and ACB60 with and without ranitidine
hydrochloride at pH 7.4. The height of the ordinate indicates the average
diameter of the never-dried microsphere.
58
3.4. Paper IV: Drug delivery
3.4.4 Release profiles: A comparison of non-swelling and swelling
models
Release profiles were fitted to the model of exponential decay between 5120 minutes and analysed. The total amount of the loaded drug was taken
from the maximum y-offset value at any used pH for each ACB (Figure 3.26).
This value was used to relate the release profiles (Figure 3.28). At pH 7.4 ACB60
released less drugs than it did at pH 1.2 (Figure 3.26). Swelling at this pH is
notably higher than, for example, at pH 3.6 (Table 3.3) and since the solubility of the ranitidine hydrochloride increases at elevated pH environment
(Mirmehrabi et al., 2004), it is possible that some ionic interactions between
anionic cellulose and cationic drug inhibited the complete release.
Figure 3.26: Released amount of ranitidine hydrochloride per one ACB at
different pH environment.
At pH 1.2 ranitidine hydrochloride and ACBs were in protonated form, so the
e-folding release times were short (Figure 3.27). Since the cellulose matrix did
not swell at this pH, diffusion of the solubilised drug took place through the
hornified channels. The increase in times of ACB40-60 could be explained by
higher loading capacity and more intense hornification due to higher porosity
and water content in never-dried microspheres.
At pH 3.6 release times were increased because the pH was near the pKa of
ranitidine hydrochloride and oxidised ACBs, so both were partially in ionic
form. The swelling at this pH was higher than at pH 1.2 for oxidised ACBs,
but still clearly lower than at pH 7.4 (Table 3.3). The drug and the matrix are
in ionic form at pH 7.4 and this decreased the release times, however, the
solubility of the ranitidine hydrochloride increases at elevated pH.
59
Chapter 3. Results and discussion
Figure 3.27: Release times (e-fold) of ranitidine hydrochloride from ACBs at
various pH environments.
Release profiles were nearly independent of the oxidation temperature and
the pH of the environment (Figure 3.28). Fit to the model of exponential decay
was high (R2 ≥0.998) and the similarity of the curves indicates that the pores
were already so open in dried microspheres that the highly soluble drug could
dissolve without additional opening of the oxidised cellulose matrix.
Figure 3.28: Cumulative drug release rates of ranitidine hydrochloride from
ACBs at pH 7.4.
Fit to the models of swelling and static spheres
Baker-Lonsdale model Equation 2.5 is valid for dispersed drug systems
(Baker and Lonsdale, 1974). This was used since the drug was incorporated
in microspheres by filling the pores with drug solution and then entrapping
them by drying at room temperature. The loading mechanism for dissolved
60
3.4. Paper IV: Drug delivery
Table 3.4: Release constants and correlation coefficients of fits to BakerLonsdale’s and Ritger-Peppas’s models at linear region 5-30 min.
Sample
pH
Baker-Lonsdale
k∗
R2
Ritger-Peppas, n=0.43
k∗
R2
ACB0
1.2
3.6
7.4
6.1±0.2
4.6±0.2
5.7±0.1
0.9983
0.9977
0.9996
15.5±1.2
15.3±0.4
17.5±0.7
0.9794
0.9984
0.9941
ACB20
1.2
3.6
7.4
4.5±0.1
3.3±0.1
5.4±0.1
0.9995
0.9999
0.9995
1.8±0.3
11.5±0.1
17.5±0.3
0.9445
0.9998
0.9991
ACB40
1.2
3.6
7.4
4.7±0.2
4.5±0.1
5.0±0.2
0.9926
0.9994
0.9934
1.8±0.3
14.9±0.2
16.7±0.5
0.9313
0.9994
0.9974
ACB60
1.2
3.6
7.4
5.9±0.1
3.3±0.1
4.2±0.2
0.9989
0.9998
0.9914
2.3±0.3
11.4±0.1
14.7±0.6
0.9428
0.9998
0.9948
∗
×10−3
drug systems would require sorption on to the surface.
Release profiles were fitted to the model of non-swelling monolithic spheres
(Equation 2.5). The model fits with high correlation at a linear region of
5-30 minutes early time release profile. Any significant relation was not
observed between swellability and correlation coefficients (Table 3.4). Baker
and Lonsdale (1974) stated that the higher loading of the dispersed drug yields
to lower release at a given time. This was seen at pH 7.4 but not at lower pH
values (Table 3.4). The lowest release constants were computed for pH 3.6
environment, which is consistent with fits to the exponential decay model
(Figure 3.27).
Ritger-Peppas’s model A model for swelling spheres (Equation 2.6, n=0.43)
was compared with a non-swelling model. The correlation coefficient of
the swelling model by Ritger-Peppas (1987) was poor at pH 1.2 for all the
ACBs (R2 ≤0.97), as expected since the microspheres did not swell (Table 3.3).
61
Chapter 3. Results and discussion
However, correlations were higher for ACB0 at other pH values even though
ACB0 did not swell at these environments either.
As well as the similar or poorer correlation coefficients compared to the nonswelling mode by Baker and Lonsdale, release constants at oH values 3.6
and 7.4 were not consistent with observations; higher release constants of
ACB20-60 at pH 7.4 indicate notably faster release than at pH 3.6, which was
not confirmed by the model of exponential decay nor observations. Release
profiles were almost independent of the microsphere type and pH of the
environment.
Ritger-Peppas’s model for swelling spheres did not give realistic results, and
some relatively high correlations were even gained. Spheres wee swelling in
physiological pH 3.6-7.4 but since the drug maintains the open pores during
the drying of the microspheres, a highly soluble drug dissolves and diffuses
through the open pores before swelling affects the release kinetics.
3.5 Paper V: Discussion. Potential applications
Cellulose is a nontoxic compound which is approved in pharmaceutical and
food applications in Europe under code E460. Many of its derivatives, such
as methyl, ethyl, hydroxypropyl, hydroxypropylmethyl, methylethyl and carboxymethyl cellulose (MC, EC, HPC, HPMC, MEC, CMC) are approved under
codes E461-466 and used as a thickening agents and stabilisers in food products and disintegrants in pharmaceuticals. Due to structural properties of the
backbone and the versatility of its various derivatives, cellulose is widely used
in applications. This section is an overview of the possible ways that cellulose
microspheres can be utilised in applications.
3.5.1 Chromatographic columns
Their spherical shape allows the dense packing of the cellulose microspheres
in columns. With a narrow size distribution — ideally the ratio of radii ∼0.41
and above — it is possible to achieve ∼0.74 packing density. They also have
smaller flow resistance than powders and more mechanical strength against
deformations than, for example, cross-linked dextrans (Kaster et al., 1993).
Due to the high and adjustable porosity of the cellulose microspheres they can
62
3.5. Paper V: Discussion. Potential applications
be used in size-exclusion chromatography (Oliveira and Glasser, 1996). SEC
requires that the interactions between the stationary phase and separating
molecules are minimised, so that separation would only occur according to
the hydrodynamic radii of the components. Interactions between hydroxyl
groups of the cellulose and separating molecules could be minimised by
silylation of the cellulose (Xiong et al., 2005).
In affinity chromatography the separation is created by delaying or binding
some molecules by adsorption in the stationary phase while others are elueted
first. Affinity chromatography can be specific, if, for example, dye-ligands
are used for specific binding sites (Figure 3.29). Unspecific affinity is based
on ionic or hydrophobic/-philic interactions. For example, higher affinity of
multivalent heavy metal cations towards anionic groups of oxidised cellulose
beads (Hirota et al., 2009) could be used in water purification. In the case of
total binding, the adsorbed molecules can be released afterwards by adjusting
the pH or salt concentration (Sakata et al., 2006), or introducing the more
fitting competing free counterparts.
Figure 3.29: Affinity chromatographic techniques. Specific ligand-dye (a)
and unspecific ion exchange (b), hydrophobic (c) and hydrophobic charge
induction chromatographies.
63
Chapter 3. Results and discussion
3.5.2 Anchoring and immobilisation
Functionalised cellulose microspheres can be used as a solid-state supports.
Their closed structure can protect often complex and perhaps expensive
enzymes and proteins from contaminations, and undesired reactions with
laboratory glassware, making it possible to collect and re-use the enzyme.
They also provide an isolated space where the reactions can occur in higher
yields (Guillier et al., 2000). Anchoring the reagent to the solid-state support
can assist the reaction to the intermediate state (Figure 3.30) and cleaving off
the final product simultaneously regenerates the solid support (De Luca et al.,
2003).
Figure 3.30: Synthesis of pyrazoles and isoxazoles using cellulose beads as a
solid-state support for anchoring the reagent. Adapted from De Luca et al.
(2003).
Immobilisation is used when the bound component has a specific property,
such as a value or a way to interact with the environment. To separate it from
the derivatisation, immobilised component could also perform and exist without the substrate, the cellulose microsphere, but the immobilisation enhances
its property to act in the desired manner. Weber et al. (2005) demonstrated
four times higher binding capacities of tumour necrosis factor-α when the antibodies were not randomly oriented but immobilised in a certain orientation
on the cellulose microsphere (Figure 3.31).
3.5.3 Drug delivery
Uniform distribution of drugs in carrier capsules, pellets or tablets is crucial
for several reasons; the release profile has to be steady or at least predictable,
dosing repeatable, and high or low local release dosages avoidable. Cellulose
microspheres, prepared by dissolution and coagulation via gelation phase,
have uniform internal structure and shape. When the drug is loaded in the
64
3.5. Paper V: Discussion. Potential applications
Figure 3.31: Preparation of (a) cellulose microsphere surface functionalised
with aligned (his)-tagged antibody, (b) SEM image of microspheres and (c)
schematic presentation of two-circuit system for blood plasma purification.
Adapted from Weber et al. (2005).
microsphere using the dissolution method (microsphere immersed in drug
solution, loading driven by diffusion) an equilibrium state is achieved and
distribution is even.
As we demonstrated in Paper IV, due to the dense gel-matrix inside the microspheres the drug is in an amorphous form after drying. This could enhance
the solubility of poorly soluble drugs. Adding anionic charge might create the
better solubility of these drugs by offering less attractive moiety for the ionic
counterpart. Prazosin hydrochloride is a poorly soluble drug (25 mg dm3 at
pH 6.8) but when it was coupled to anionic cellulose phosphate it dissolved
rapidly in buffer solution (Figure 3.32).
Enteric administration of APIs (active pharmaceutical ingredients) can be easily carried out with millimetre-sized microspheres. Designing the matrix (see
Section 1.4 Controlled release systems) so that the APIs are released in certain
part of the gastrointestinal track at a certain rate defines other components
and/or derivatives of the microsphere. Matrices could have, for example,
higher amounts of swelling agents, so that in certain environments the structure would disintegrate due to too extensive swelling and/or dissolution. This
could be initiated by a change in pH, temperature or even magnetic field
(Figure 1.4). Binary systems could be utilised in microspheres by derivatising
only the surface with hydrophobic groups and physically creating a small
holes in this layer (Figure 1.4G).
65
Chapter 3. Results and discussion
Figure 3.32: a) Schematic illustration of anionic cellulose microsphere and
anionic prazosin; b) Prazosin release into the buffer solution from cellulose
phosphate (-•-), carboxymethyl (ethanol dried, -■-), and carboxymethyl
microspheres (water dried, -N-) and powder tablet (--) and pure prazosin
hydrochloride (-×-). Adapted from Volkert et al. (2009).
66
4 Concluding remarks
The challenge of dissolving cellulose in water-based solvent was met with a
new type of pretreatment. Pulp was immersed in ethanol-acid solution for
different times and temperatures, and the solubility of the cellulosic fibre was
studied. Clear solutions were gained without undissolved fragments, even
though solutions with higher concentrations were not so-called true solutions
and formed aggregates between cellulose molecules.
The effect of coagulation kinetics and cellulose concentration on the properties of cellulose microspheres was studied after the dissolution. Highly
alkaline cellulose dope was extruded through a syringe into an acid of different concentrations and temperatures. Variations in coagulation kinetics
produced microspheres with different pore size distributions and specific
surface areas, whereas total porosity remained high in all samples. Variations
in measured properties had no effect, for example, on the release profiles of
the various active pharmaceutical ingredients, but the solubility of each drug
was the dominant parameter.
Microspheres were oxidised with the well-known Anelli’s oxidation system
with modifications, commonly known as TEMPO-mediated oxidation. This
introduced a high anionic charge on microspheres with even distribution.
Oxidised microspheres demonstrated enhanced water-retention, swelling
at higher pH environments, and porosity. The opening of the small microand mesopores made it possible to load more than twice as much drug in
microspheres than in non-oxidised microspheres. Drug release profiles of
the highly soluble model drug were still noted to be very similar regardless
of the oxidation level or the pH of the environment, indicating an open pore
network of the drug loaded dry microsphere.
Further analysis showed that the swelling of the anionic microspheres at
any pH does not play a role in release profiles. Fit to the model of nonswelling spheres (Baker-Lonsdale) was clearly better and was in agreement
with observations than the fit to the model of swelling spheres (Ritger-Peppas).
Solid-state analysis revealed that the model drug, ranitidine hydrochloride,
67
Chapter 4. Concluding remarks
was in amorphous form after loading in microspheres. This is one of the
challenges in the pharmaceutical industry; crystallisation of poorly soluble
drugs and their rapid release. Amorphicity of the drugs and the high swelling
capability of the oxidised microspheres could be utilised in the delivery of
these pharmaceutical ingredients.
Another clear benefit of microspheres is their even mass distribution and
easy loading. Since the droplet formation of cellulose dope is very even, each
sphere contains an exact amount of cellulose and volume. Loading degree is
constant since all the spheres are loaded in the same drug solution of known
concentration. Due to the large size of spheres, the personalised dosing of
drugs would be simple.
68
5 Acknowledgements
I am intensely grateful to my supervisor Professor Pedro Fardim, for this
opportunity to work in comfort at FCT all these years. The feeling of security
made it possible to let my mind fly and to grow as a researcher and as a person.
Thank you for your patience, sincere trust and support.
I am thankful to TEKES for financing the FuBio project and to the Finnish
Bioeconony Cluster (FiBiC) for coordinating it. Thank you for the opportunity to take part in numerous domestic and international events. These are
important lessons for us, and opportunities for networking.
I am thankful to all the members at FCT for making the environment colourful
and adventurous. It has been a pleasure to do research with all of you. I would
also like to thank the staff of 3PK and PAF for their help and cooperation. This
work could not have been done without you. Thanks also to our partners at
Pharmaceutical Sciences; Professor Niklas Sandler, Doctors Ruzica Kolakovic
and Natalja Genina, and Emrah Yildir. Half of my papers are done with you.
Thank you Agneta Hermansson, without you I would not have travelled anywhere, had lab notebooks nor pens, and my coffee breaks would have been
much more dull. Jan Gustafsson, tack ska du ha för översatte mina texter på
svenska. You also provided me with education that I should already have had
when I came to FCT. Post-docs Anne Kotiaho and Martin Gericke, a sincere
thank you for your wisdom and instructions. Colleagues Elina Heikkilä and
Carl Lange, thank you for endless philosophical and practical conversations
about life and science, wondering how to be an academic and a human, at
the same time.
At last, I would like to thank my friends along this long journey, old and new.
You know who you are. You have been understanding. Your presence has been
the source of my strength and so needed during the hard times. My family, my
parents and grandparents, your support has been most appreciated. I cannot
promise that I will get a real job after this, but I promise to go where my heart
takes me and where my mind is peaceful. Sara, thank you for your love and
smiles, they mean the world to me.
69
Bibliography
Adel, A. M., El–Wahab, Z. H. A., Ibrahim, A. A., and Al–Shemy, M. T. (2010).
Characterization of microcrystalline cellulose prepared from lignocellulosic materials. Part I. Acid catalyzed hydrolysis. Bioresource Technology,
101(12):4446–4455.
Anelli, L. P., Biffi, C., Montanari, F., and Quici, S. (1987). Fast and selective
oxidation of primary alcohols to aldehydes or to carboxylic acids and of
secondary alcohols to ketones mediated by oxoammonium salts under
two-phase conditions. The Journal of Organic Chemistry, 52:2559–2562.
Arifin, D. Y., Lee, L. Y., and Wang, C.-H. (2006). Mathematical modeling and
simulation of drug release from microspheres: Implications to drug delivery
systems. Advanced Drug Delivery Reviews, 58:1274–1325.
Baker, R. and Lonsdale, H. (1974). Advances in experimental medicine and
biology. Vol. 47 of Controlled Release of Biologically Active Agents, Chapter:
Controlled release: Mechanisms and rates, pages 15–71. Plenum Press, New
York.
Biganska, O., Navard, P., and Bédué, O. (2002). Crystallisation of cellulose/Nmethylmorpholine-N-oxide hydrate solutions. Polymer, 43:6139–6145.
Brown, R. M. (1985). Cellulose microfibril assembly and orientation: Recent
developments. Journal of Cell Science, 1985:13–32.
Brown Jr, R. M., Saxena, I. M., and Kudlicka, K. (1996). Cellulose biosynthesis
in higher plants. Trends in Plant Science, 1(5):149–156.
Brunauer, S., Emmett, P. H., and Teller, E. (1938). Adsorption of gases in
multimolecular layers. Journal of the American Chemical Society, 60(2):309–
319.
Budd, J. and Herrington, T. M. (1989). Surface charge and surface area of
cellulose fibres. Colloids and Surfaces, 36(3):273–288.
71
Bibliography
Cai, J. and Zhang, L. (2005). Rapid dissolution of cellulose in lioh/urea and
naoh/urea aqueous solutions. Macromolecular Bioscience, 5(6):539–548.
Capello, C., Fischer, U., and Hungerbuhler, K. (2007). What is a green solvent?
a comprehensive framework for the environmental assessment of solvents.
Green Chemistry, 9(9):927–934.
Carr, J. and Walker, D. (1968). An annular shear cell for granular materials.
Powder Technology, 1(6):369–373.
Carr, R. (1965). Evaluating flow properties of solids. Chemical Engineering,
72:163–168.
Carrillo, F., Lis, M., Colom, X., López-Mesas, M., and Valldeperas, J. (2005).
Effect of alkali pretreatment on cellulase hydrolysis of wheat straw: Kinetic
study. Process Biochemistry, 40(10):3360–3364.
Chen, P., Cho, S., and Jin, H.-J. (2010). Modification and applications of bacterial celluloses in polymer science. Macromolecular Research, 18(4):309–320.
Chieng, N., Rehder, S., Saville, D., Rades, T., and Aaltonen, J. (2009). Quantitative solid-state analysis of three solid forms of ranitidine hydrochloride in
ternary mixtures using raman spectroscopy and x-ray powder diffraction.
Journal of Pharmaceutical and Biomedical Analysis, 49:18–25.
Conn, H. J. (1953). Biological stains; a handbook on the nature and uses of
the dyes employed in the biological laboratory. The Williams & Wilkins
Company, Baltimore, Maryland, 6th edition.
Cuissinat, C. and Navard, P. (2006a). Swelling and dissolution of cellulose, part
1: Free floating cotton and wood fibres in N-methylmorpholine-N-oxidewater mixtures. Macromolecular Symposia, 244:1–18.
Cuissinat, C. and Navard, P. (2006b). Swelling and dissolution of cellulose, part
II: Free floating cotton and wood fibres in NaOH-water-additives systems.
Macromolecular Symposia, 244:19–30.
Cuissinat, C. and Navard, P. (2008). Swelling and dissolution of cellulose, part
iii: Plant fibres in aqueous systems. Cellulose, 15:67–74.
Dahiya, J. and Rana, S. (2004). Thermal degradation and morphological studies on cotton cellulose modified with various arylphosphorodichloridites.
Polymer International, 53(7):995–1002.
72
Bibliography
De Luca, L., Giacomelli, G., Porcheddu, A., Salaris, M., and Taddei, M. (2003).
Cellulose beads: A new versatile solid support for microwave- assisted
synthesis. Preparation of pyrazole and isoxazole libraries. Journal of Combinatorial Chemistry, 5:465–471.
de Nooy, A. E., Besemer, A. C., and van Bekkum, H. (1995). Highly selective
nitroxyl radical-mediated oxidation of primary alcohol groups in watersoluble glucans. Carbohydrate Research, 269:89–98.
Domsjö (2007). Specification Domsjö Cellulose. http://www.domsjoe.com Produkter - Specialcellulosa - Produktinformation Domsjö Cellulose. Accessed 10 November 2010.
Du, K.-F., Yan, M., Wang, Q.-Y., and Song, H. (2010). Preparation and characterization of novel macroporous cellulose beads regenerated from ionic liquid
for fast chromatography. Journal of Chromatography A, 1217(8):1298–1304.
Ettenauer, M., Loth, F., Thümmler, K., Fischer, S., Weber, V., and Falkenhagen,
D. (2011). Characterization and functionalization of cellulose microbeads
for extracorporeal blood purification. Cellulose, 18:1257–1263.
Fardim, P. and Holmbom, B. (2003). Fast determination of anionic groups in
different pulp fibers by methylene blue sorption. Tappi, 2:28–32.
Fardim, P., Holmbom, B., Ivaska, A., Karhu, J., Mortha, G., and Laine, J. (2002).
Critical comparison and validation of methods for determination of anionic
groups in pulp fibres. Nordic Pulp and Paper Research Journal, 17:346–351.
Fink, H.-P., Weigel, P., Purz, H., and Ganster, J. (2001). Structure formation of
regenerated cellulose materials from NMMO-solutions. Progress in Polymer
Science, 26(9):1473–1524.
Gavillon, R. and Budtova, T. (2008). Aerocellulose: New highly porous cellulose
prepared from cellulose-NaOH aqueous solutions. Biomacromolecules,
9(1):269–277.
Gericke, M., Fardim, P., and Heinze, T. (2012). Ionic liquids — promising but challenging solvents for homogeneous derivatization of cellulose.
Molecules, 17(6):7458–7502.
Gericke, M., Trygg, J., and Fardim, P. (2013). Functional cellulose beads: Preparation, characterization, and applications. Chemical Reviews, 113:4812–
4836.
73
Bibliography
Grznárová, G., Yu, S., Štefuca, V., and Polakovič, M. (2005). Quantitative
characterization of pore structure of cellulose gels with or without bound
protein ligand. Journal of Chromatography A, 1092(1):107–113.
Guillier, F., Orain, D., and Bradley, M. (2000). Linkers and cleavage strategies
in solid-phase organic synthesis and combinatorial chemistry. Chemical
Reviews, 100(6):2091–2158.
Heinze, T., Liebert, T., and Koschella, A. (2006). Esterification of Polysaccharides. Springer, Berlin Heidelberg.
Heinze, T., Schwikal, K., and Barthel, S. (2005). Ionic liquids as reaction medium in cellulose functionalization. Macromolecular Bioscience,
5(6):520–525.
Hendriks, A. and Zeeman, G. (2009). Pretreatments to enhance the digestibility
of lignocellulosic biomass. Bioresource Technology, 100(1):10–18.
Hirota, M., Tamura, N., Saito, T., and Isogai, A. (2009). Oxidation of regenerated cellulose with NaClO2 catalyzed by TEMPO and NaClO under acidneutral conditions. Carbohydrate Polymers, 78:330–335.
Immergut, E., Schurz, J., and Mark, H. (1953).
Viskositätszahlmolekulargewichts-beziehung für cellulose und untersuchungen von nitrocellulose in verschiedenen lösungsmitteln. Monatshefte für Chemie,
84:219–249.
Isogai, A. and Atalla, R. H. (1998). Dissolution of cellulose in aqueous NaOH
solutions. Cellulose, 5:309–319.
Isogai, A., Saito, T., and Fukuzumi, H. (2011). TEMPO-oxidized cellulose
nanofibers. Nanoscale, 3:71–85.
Jensen, V., editor (1977). Puukemia. Suomen Paperi-insinöörien Yhdistyksen
oppi- ja käsikirja I. Teknillisten Tieteiden Akatemia, 2nd edition.
Jin, H., Zha, C., and Gu, L. (2007). Direct dissolution of cellulose in
NaOH/thiourea/urea aqueous solution. Carbohydrate Research, 342(6):851–
858.
Jonas, R. and Farah, L. F. (1998). Production and application of microbial
cellulose. Polymer Degradation and Stability, 59(1–3):101–106.
74
Bibliography
Jonoobi, M., Niska, K. O., Harun, J., and Misra, M. (2009). Chemical composition, crystallinity, and thermal degradation of bleached and unbleached kenaf bast (hibiscus cannabinus) pulp and nanofibers. BioResources, 4(2):626–
639.
Kamide, K., Okajima, K., and Kowsaka, K. (1992). Dissolution of natural
cellulose into aqueous alkali solution: Role of super-molecular structure of
cellulose. Polymer Journal, 24(1):71–86.
Kaster, J. A., de Oliveira, W., Glasser, W. G., and Velander, W. H. (1993). Optimization of pressure-flow limits, strength, intraparticle transport and
dynamic capacity by hydrogel solids content and bead size in cellulose
immunosorbents. Journal of Chromatography A, 648:79–90.
Kim, S. and Holtzapple, M. T. (2006). Delignification kinetics of corn stover in
lime pretreatment. Bioresource Technology, 97(5):778–785.
King, A. W. T., Asikkala, J., Mutikainen, I., Järvi, P., and Kilpeläinen, I. (2011).
Distillable acid–base conjugate ionic liquids for cellulose dissolution and
processing. Angewandte Chemie, 123(28):6425–6429.
Klemm, D., Heublein, B., Fink, H.-P., and Bohn, A. (2005). Cellulose: Fascinating biopolymer and sustainable raw material. Angewandte Chemie (Int.Ed),
44(22):3358–3393.
Klemm, D., Philipp, B., Heinze, T., Heinze, U., and Wagenknecht, W. (1998).
Comprehensive Cellulose Chemistry: Functionalization of Cellulose. WileyVCH, Weinheim.
Kolpak, F. J. and Blackwell, J. (1976). Determination of the structure of cellulose II. Macromolecules, 9(2):273–278.
Konkin, A., Wendler, F., Meister, F., Roth, H.-K., Aganov, A., and Ambacher,
O. (2008). N-Methylmorpholine-N-oxide ring cleavage registration by ESR
under heating conditions of the Lyocell process. Spectrochimica Acta Part
A, 69(3):1053–1055.
Kosan, B., Michels, C., and Meister, F. (2008). Dissolution and forming of
cellulose with ionic liquids. Cellulose, 15(1):59–66.
Krässig, H. and Kitchen, W. (1961). Factors influencing tensile properties of
cellulose fibers. Journal of Polymer Science, 51(155):123–172.
75
Bibliography
Kumar, P., Barrett, D. M., Delwiche, M. J., and Stroeve, P. (2009). Methods for
pretreatment of lignocellulosic biomass for efficient hydrolysis and biofuel
production. Industrial & Engineering Chemistry Research, 48(8):3713–3729.
Lagus, H., Sarlomo-Rikala, M., Böhling, T., and Vuola, J. (2013). Prospective
study on burns treated with Integra ®, a cellulose sponge and split thickness skin graft: Comparative clinical and histological study - Randomized
controlled trial. Burns, 39(8):1577–1587.
Langer, R. (1990). New methods of drug delivery. Science (New York, N.Y.),
249(4976):1527–1533.
Langer, R. (1993). Polymer-controlled drug delivery systems. Accounts of
Chemical Research, 26(10):537–542.
Larkin, P. (2011). Infrared and Raman Spectroscopy. Elsevier, Oxford.
Leong, K. and Langer, R. (1988). Polymeric controlled drug delivery. Advanced
Drug Delivery Reviews, 1(3):199–233. Immunoliposomes in Vivo.
Li, J., Gellerstedt, G., and Toven, K. (2009). Steam explosion lignins; their
extraction, structure and potential as feedstock for biodiesel and chemicals.
Bioresource Technology, 100(9):2556–2561.
Liebert, T. (2010). Cellulose Solvents – Remarkable History, Bright Future, Vol.
1033 of ACS Symposium Series, Chapter: 1, pages 3–54. American Chemical
Society, Washington, USA.
Liu, W., Budtova, T., and Navard, P. (2011). Influence of ZnO on the properties of dilute and semi-dilute cellulose-NaOH-water solutions. Cellulose,
18:911–920.
Lonkar, S.S., K. G. K. J. and Kale, M. (2011). Dyes and chemicals used in biomaterial study as stains for invertebrates. International Journal of Chemistry
Research, 2:22–25.
Loth, F., Schaaf, E., Weigel, P., Fink, H. P., and Gensrich, J. (2003). WO Patent
App. PCT/EP2003/004,879, Munich, Germany. European Patent Office.
Lu, X., Zhang, Y., Yang, J., and Liang, Y. (2007). Enzymatic hydrolysis of corn
stover after pretreatment with dilute sulfuric acid. Chemical Engineering &
Technology, 30(7):938–944.
76
Bibliography
Lue, A., Zhang, L., and Ruan, D. (2007). Inclusion complex formation of
cellulose in NaOH–thiourea aqueous system at low temperature. Macromolecular Chemistry and Physics, 208(21):2359–2366.
Ma, Y., Loyns, C., Price, P., and Chechik, V. (2011). Thermal decay of TEMPO
in acidic media via an N-oxoammonium salt intermediate. Organic &
Biomolecular Chemistry, 9:5573–5578.
McCormick, C. L., Callais, P. A., and Hutchinson, B. H. (1985). Solution studies of cellulose in lithium chloride and N,N-dimethylacetamide. Macromolecules, 18:2394–2401.
McGraw-Hill (2003). McGraw-Hill Dictionary of Chemistry. McGraw-Hill,
USA, 2nd edition.
McMillan, J. D. (1994). 15. Pretreatment of Lignocellulosic Biomass. In Himmel, M. E., Baker, J. O., and Overend, R. P., editors, Enzymatic Conversion
of Biomass for Fuels Production, Vol. 566 of ACS Symposium Series, pages
292–324, Washington, USA. American Chemical Society.
Merriam-Webster (2014). Online dictionary. Keywords: Coagulation / regeneration / gelation / sponge. Encyclopaedia Britannica. Accessed in September
2014.
Mirmehrabi, M., Rohani, S., Murthy, K., and Radatus, B. (2004). Solubility,
dissolution rate and phase transition studies of ranitidine hydrochloride
tautomeric forms. International Journal of Pharmaceutics, 282:73–85.
Miyamoto, T., Takahashi, S.-i., Ito, H., Inagaki, H., and Noishiki, Y. (1989). Tissue biocompatibility of cellulose and its derivatives. Journal of Biomedical
Materials Research, 23(1):125–133.
Moigne, N. L., Spinu, M., Heinze, T., and Navard, P. (2010). Restricted dissolution and derivatization capacities of cellulose fibres under uniaxial
elongational stress. Polymer, 51:447–453.
Mosier, N., Wyman, C., Dale, B., Elander, R., Lee, Y., Holtzapple, M., and
Ladisch, M. (2005). Features of promising technologies for pretreatment of
lignocellulosic biomass. Bioresource Technology, 96(6):673–686.
Navard, P., Cuissinat, C., and Heinze, T. (2008). Swelling and dissolution
of cellulose. Part IV: Free floating cotton and wood fibres in ionic liquids.
Carbohydrate Polymers, 72:590–596.
77
Bibliography
Nichols, G., Byard, S., Bloxham, M. J., Botterill, J., Dawson, N. J., Dennis, A.,
Diart, V., North, N. C., and Sherwood, J. D. (2002). A review of the terms
agglomerate and aggregate with a recommendation for nomenclature used
in powder and particle characterization. Journal of Pharmaceutical Sciences,
91(10):2103–2109.
Niklas, K. (1992). Plant Biomechanics: An Engineering Approach to Plant Form
and Function. University of Chicago Press, USA.
Nobles, D. R., Romanovicz, D. K., and Brown, R. M. (2001). Cellulose in
cyanobacteria. Origin of vascular plant cellulose synthase? Plant Physiology,
127(2):529–542.
Oliveira, W. D. and Glasser, W. G. (1996). Hydrogels from polysaccharides. I.
Cellulose beads for chromatographic support. Journal of Applied Polymer
Science, 60(1):63–73.
Origin Software. Origin software, version 7.0. OriginLab Corporation, 2002,
Northampton, MA, USA.
Palmqvist, E. and Hahn-Hägerdal, B. (2000). Fermentation of lignocellulosic
hydrolysates. II: inhibitors and mechanisms of inhibition. Bioresource
Technology, 74(1):25–33.
Pekala, R., Alviso, C., and LeMay, J. (1990). Organic aerogels: microstructural
dependence of mechanical properties in compression. Journal of NonCrystalline Solids, 125(1-2):67–75.
Perpetuo, G., Galico, D., Fugita, R., Castro, R., Eusebio, M., Treu-Filho, O., Silva,
A., and Bannach, G. (2013). Thermal behavior of some antihistamines.
Journal of Thermal Analysis and Calorimetry, 111:2019–2028.
Pinnow, M., Fink, H.-P., Fanter, C., and Kunze, J. (2008). Characterization
of highly porous materials from cellulose carbamate. Macromolecular
Symposia, 262(1):129–139.
Qi, H., Chang, C., and Zhang, L. (2008). Effects of temperature and molecular weight on dissolution of cellulose in NaOH/urea aqueous solution.
Cellulose, 15:779–787.
Qin, X., Lu, A., Cai, J., and Zhang, L. (2013). Stability of inclusion complex
formed by cellulose in NaOH/urea aqueous solution at low temperature.
Carbohydrate Polymers, 92(2):1315–1320.
78
Bibliography
Qtiplot (2011). Version 0.9. http://soft.proindependent.com/qtiplot.html.
Accessed 30.08.2013.
Quesada, J., Rubio, M., and Gomez, D. (1999). Ozonation of lignin rich solid
fractions from corn stalks. Journal of Wood Chemistry and Technology,
19(1-2):115–137.
Ritger, P. L. and Peppas, N. A. (1987). A simple equation for description of
solute release I. Fickian and non-fickian release from non-swellable devices
in the form of slabs, spheres, cylinders or discs. Journal of Controlled
Release, 5:23–36.
Roberts, E., Saxena, I., and Brown Jr, R. (1989). Cellulose and Wood: Chemistry and Technology, Chapter: Biosynthesis of cellulose II in Acetobacter
Xylinum, pages 689–704. Wiley & Sons, New York.
Rosenau, T., Potthast, A., Sixta, H., and Kosma, P. (2001). The chemistry of
side reactions and byproduct formation in the system NMMO/cellulose
(Lyocell process). Progress in Polymer Science, 26(9):1763–1837.
Rosenberg, P., Suominen, I., Rom, M., Janicki, J., and Fardim, P. (2007). Tailored
cellulose beads for novel applications. Cellulose Chemistry and Technology,
41:243–254.
Ross, P., Mayer, R., and Benziman, M. (1991). Cellulose biosynthesis and
function in bacteria. Microbiological Reviews, 55(1):35–58.
Roy, C., Budtova, T., and Navard, P. (2003). Rheological properties and gelation
of aqueous cellulose-NaOH solutions. Biomacromolecules, 4:256–264.
Sakata, M., Nakayama, M., Yanagi, K., Sasaki, M., Kunitake, M., and Hirayama, C. (2006). Selective removal of dna from bioproducts by polycationimmobilized cellulose beads. Journal of Liquid Chromatography & Related
Technologies, 29(17):2499–2512.
Scheffer, T. C. (1966). Natural resistance of wood to microbial deterioration.
Annual Review of Phytopathology, 4(1):147–168.
Schenzel, K. and Fischer, S. (2001). NIR FT Raman Spectroscopy - Rapid
analytical tool for detecting the transformation of cellulose polymorphs.
Cellulose, 8:49–57.
79
Bibliography
Schilling, J., Tewalt, J., and Duncan, S. (2009). Synergy between pretreatment
lignocellulose modifications and saccharification efficiency in two brown
rot fungal systems. Applied Microbiology and Biotechnology, 84:465–475.
10.1007/s00253-009-1979-7.
Schindelin, J. (2008). Fiji Is Just ImageJ (batteries included). version 1.44.
ImageJ User and Developer Conference.
Sen, V. D. and Golubev, V. A. (2009). Kinetics and mechanism for acid-catalyzed
disproportionation of 2,2,6,6-tetramethylpiperidine-1-oxyl. Journal of Physical Organic Chemistry, 22(2):138–143.
Sescousse, R., Gavillon, R., and Budtova, T. (2011a). Aerocellulose from
cellulose-ionic liquid solutions: Preparation, properties and comparison
with cellulose-naoh and cellulose-nmmo routes. Carbohydrate Polymers,
83(4):1766–1774.
Sescousse, R., Gavillon, R., and Budtova, T. (2011b). Wet and dry highly
porous cellulose beads from cellulose-NaOH-water solutions: Influence of
the preparation conditions on beads shape and encapsulation of inorganic
particles. Journal of Materials Science, 46:759–765.
Stone, J. and Scallan, A. (1967). The effect of component removal upon the
porous structure of the cell wall of wood. II. Swelling in water and the fiber
saturation point. Tappi, 50:496–501.
Stone, J. and Scallan, A. (1968). A structural model for the cell wall of waterswollen wood pulp fibres based on their accessibility to macromolecules.
Cellulose Chemistry and Technology, 2:343–358.
Svensson, A., Larsson, P. T., Salazar-Alvarez, G., and Wågberg, L. (2013). Preparation of dry ultra-porous cellulosic fibres: Characterization and possible
initial uses. Carbohydrate Polymers, 92(1):775–783.
Swatloski, R. P., Spear, S. K., Holbrey, J. D., and Roger, R. D. (2002). Dissolution of cellose with ionic liquids. Journal of American Chemical Society,
124:4974–4975.
Tassinari, T., Macy, C., Spano, L., and Ryu, D. D. Y. (1980). Energy requirements
and process design considerations in compression-milling pretreatment of
cellulosic wastes for enzymatic hydrolysis. Biotechnology and Bioengineering, 22(8):1689–1705.
80
Bibliography
Thümmler, K., Fischer, S., Feldner, A., Weber, V., Ettenauer, M., Loth, F., and
Falkenhagen, D. (2011). Preparation and characterization of cellulose microspheres. Cellulose, 18:135–142.
Thünemann, A., Klobes, P., Wieland, C., and Bruzzano, S. (2011). On the nanostructure of micrometer-sized cellulose beads. Analytical and Bioanalytical
Chemistry, 401:1101–1108.
Trygg, J., Fardim, P., Gericke, M., Mäkilä, E., and Salonen, J. (2013). Physicochemical design of the morphology and ultrastructure of cellulose beads.
Carbohydrate Polymers, 93:291–299.
Trygg, J., Fardim, P., Yildir, E., Kolakovic, R., and Sandler, N. (2014). Anionic
cellulose beads for drug encapsulation and release. Cellulose, 21:1945–1955.
Vargaftik, N. B., Volkov, B. N., and Voljak, L. D. (1983). International tables of
the surface tension of water. Journal of Physical and Chemical Reference
Data, 12(3):817–820.
Vervaet, C., Baert, L., and Remon, J. P. (1995). Extrusion-spheronisation a
literature review. International Journal of Pharmaceutics, 116(2):131–146.
Volkert, B., Wolf, B., Fischer, S., Li, N., and Lou, C. (2009). Application of
modified bead cellulose as a carrier of active ingredients. Macromolecular
Symposia, 280(1):130–135.
Weber, V., Linsberger, I., Ettenauer, M., Loth, F., Höyhtyä, M., and Falkenhagen, D. (2005). Development of specific adsorbents for human tumor
necrosis factor-α: influence of antibody immobilization on performance
and biocompatibility. Biomacromolecules, 6:1864–1870.
Weil, J., Sarikaya, A., Rau, S.-L., Goetz, J., Ladisch, C., Brewer, M., Hendrickson,
R., and Ladisch, M. (1997). Pretreatment of yellow poplar sawdust by
pressure cooking in water. Applied Biochemistry and Biotechnology, 68:21–
40. 10.1007/BF02785978.
Weissenborn, P. K. and Pugh, R. J. (1996). Surface tension of aqueous solutions
of electrolytes: Relationship with ion hydration, oxygen solubility, and
bubble coalescence. Journal of Colloid and Interface Science, 184(2):550–
563.
81
Bibliography
Westermarck, S. (2000). Use of mercury porosimetry and nitrogen adsorption
in characterisation of the pore structure of mannitol and microcrystalline
cellulose powders, granules and tablets. Academic dissertation, University
of Helsinki.
Woodings, C. and Textile Institute (Manchester, England) (2001). Regenerated
Cellulose Fibres. Woodhead Publishing Limited series on fibres. CRC Press,
England.
Wu, J., Liang, S., Dai, H., Zhang, X., Yu, X., Cai, Y., Zhang, L., Wen, N., Jiang,
B., and Xu, J. (2010). Structure and properties of cellulose/chitin blended
hydrogel membranes fabricated via a solution pre-gelation technique. Carbohydrate Polymers, 79(3):677–684.
Xia, H.-F., Lin, D.-Q., Wang, L.-P., Chen, Z.-J., and Yao, S.-J. (2008). Preparation
and evaluation of cellulose adsorbents for hydrophobic charge induction
chromatography. Industrial & Engineering Chemistry Research, 47(23):9566–
9572.
Xia, H.-F., Lin, D.-Q., and Yao, S.-J. (2007). Preparation and characterization
of macroporous cellulose-tungsten carbide composite beads for expanded
bed applications. Journal of Chromatography A, 1175(1):55–62.
Xiong, X., Zhang, L., and Wang, Y. (2005). Polymer fractionation using chromatographic column packed with novel regenerated cellulose beads modified with silane. Journal of Chromatography A, 1063:71–77.
Yang, B. and Wyman, C. E. (2006). BSA treatment to enhance enzymatic
hydrolysis of cellulose in lignin containing substrates. Biotechnology and
Bioengineering, 94(4):611–617.
Zhao, M., Li, J., Mano, E., Song, Z., Tschaen, D. M., Grabowski, E. J. J., and
Reider, P. J. (1999). Oxidation of primary alcohols to carboxylic acids with
sodium chlorite catalyzed by TEMPO and bleach. The Journal of Organic
Chemistry, 64:2564–2566.
Zheng, H., Zhou, J., Du, Y., and Zhang, L. (2002). Cellulose/chitin films
blended in NaOH/urea aqueous solution. Journal of Applied Polymer Science, 86(7):1679–1683.
Zogaj, X., Nimtz, M., Rohde, M., Bokranz, W., and Römling, U. (2001). The
multicellular morphotypes of salmonella typhimurium and escherichia
82
Bibliography
coli produce cellulose as the second component of the extracellular matrix.
Molecular Microbiology, 39(6):1452–1463.
Zugenmaier, P. (2001). Conformation and packing of various crystalline cellulose fibers. Progress in Polymer Science, 26(9):1341–1417.
83
6 Original research
85
”Education is what survives
when what has been learned
has been forgotten.”
-B.F. Skinner
Jani Trygg
Born 1981, Turku, Finland.
He received M.Sc. in chemistry from University of Turku in 2008,
started Ph.D. studies at Laboratory of Fibre and Cellulose Technology
in Åbo Akademi in 2009 and had his Ph.D. dissertation in Åbo Akademi
in 2015.
Åbo Akademis förlag
Tavastgatan 13, FI-20500 Åbo, Finland
Tfn +358 (0)2 215 3478
E-post: forlaget@abo.fi
Försäljning och distribution:
Åbo Akademis bibliotek
Domkyrkogatan 2–4, FI-20500 Åbo, Finland
Tfn +358 (0)2 -215 4190
E-post: publikationer@abo.fi
Jani Trygg
Functional Cellulose Microspheres For Pharmaceutical Applications
Jani Trygg
Functional Cellulose Microspheres For
Pharmaceutical Applications
Laboratory of Fibre and Cellulose Technology
Faculty of Science and Engineering
Åbo Akademi University
2015
Turku / Åbo 2015
9 789521 231681
Åbo Akademis förlag | ISBN 978-952-12-3168-1
Jani Trygg B5 Kansi VALISTETTY s17 Inver260 28 January 2015 8:36 AM


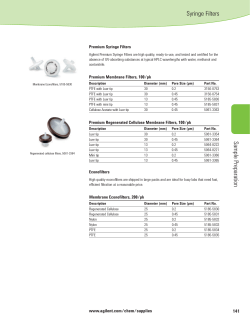


© Copyright 2026