ABC
docz
Explore
Log in
Create new account
Download
Report
No category
Plate waste and intake of school lunch based on the
Secretary`s day luncheon - Huron River Hunting & Fishing Club
to your 2015 CSUD Parent Survey in format
...lunch is on us!
Miss Rose
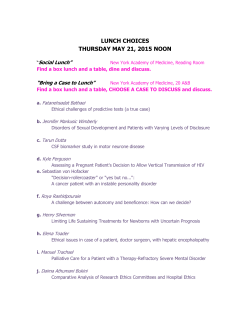
Social Lunch or Bring a Case to Lunch
May 1 â 31 55 points
Arvig`s Free Lunch & Learn â Social Media 101
Presentation Lunch - Parkdale Yacht Club
Homework2 Dead line 22/04/2015
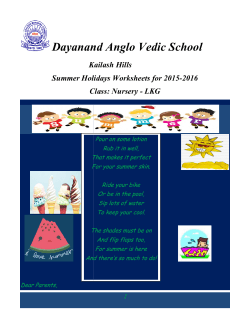
Summer Vacation Homework for Class LKG
© Copyright 2026
About abcdocz
DMCA / GDPR
Report