
Ecology in small aquatic ecosystems
UNIVERSITY OF COPENHAGEN FACULTY OF SCIENCE FRESHWATER BIOLOGICAL LABORATORY Ecology in small aquatic ecosystems Mikkel René Andersen Cover photos Top left: The study site. Bottom right: The study site. Background: Dense Chara aspera bed at the study site. 1 Ecology in small aquatic ecosystems Ph.D. thesis Author Mikkel René Andersen Freshwater Biological Laboratory Universitetsparken 4, 3rd floor. 2100 Copenhagen Ø Denmark Principal Kaj Sand-Jensen supervisor Freshwater Biological Laboratory Universitetsparken 4, 3rd floor. 2100 Copenhagen Ø Denmark Co-supervisor Peter A. Staehr Department of Bioscience - Marine Diversity and Experimental Ecology Frederiksborgvej 399. B1.19 4000 Roskilde Denmark Committee Photos Dr. Ole Petersen (Chair) University of Copenhagen Dr. Eleanor Jennings Dundalk Institute of Technology Dr. Torben Linding Lauridsen Aarhus University All photos by Mikkel René Andersen, unless otherwise specified. 2 Table of contents ABSTRACT ......................................................................................................................... 4 DANSK RESUMÉ ................................................................................................................ 4 INTRODUCTION ................................................................................................................. 8 AIM .................................................................................................................................... 17 PAPER SYNOPSIS ........................................................................................................... 17 CONCLUSIONS AND IMPLICATIONS ............................................................................. 25 REFERENCES .................................................................................................................. 28 PAPER 1 - PROFOUND DAILY VERTICAL STRATIFICATION AND MIXING IN A SHALLOW, WIND-EXPOSED POND WITH SUBMERGED MACROPHYTES. ................ 30 PAPER 2 - RECURRING STRATIFICATION AND MIXING GENERATE EXTREME DIURNAL OXYGEN AND CARBON CYCLES IN SHALLOW VEGETATED LAKES ........ 60 PAPER 3 - DISTINCT DIURNAL PATTERNS OF ECOSYSTEM METABOLISM IN A SMALL CHAROPHYTE-LAKE ........................................................................................... 78 PAPER 4 - WHOLE-STREAM METABOLISM IN NUTRIENT-POOR CALCAREOUS STREAMS ON ÖLAND, SWEDEN .................................................................................. 110 PAPER 5 - CAUGHT BETWEEN DROUGHT AND FLOODING ON ÖLANDS GREAT ALVAR (IN SWEDISH, ENGLISH ABSTRACT) ............................................................... 139 ACKNOWLEDGEMENTS ............................................................................................... 148 3 Abstract Small ecosystems are many-fold more abundant than their larger counterparts. Both on regional and global scale small lakes outnumber medium and large lakes and account for a much larger surface area. Small streams are also far more common than rivers. Despite their abundance small ecosystems are grossly understudied. In this thesis I present new insights into the dynamic nature of small aquatic ecosystems. I show that small lakes can stratify and that the resulting gradients are much steeper than in larger lakes. In a 30-40 cm shallow water-column the surface waters can be more than 200 % supersaturated in oxygen while the bottom waters becomes anoxic. Dense charophyte stands influenced the hydrodynamics and created favorable conditions for the apical parts in the surface waters, while the basal parts withstood anoxia for up to 12 hours in the bottom waters. Nocturnal convective mixing oxygenated the bottom waters and replenished the DIC pool in the surface waters every night. Nocturnal mixing and small distances resulted in similar metabolic signals recorded by many oxygen sensors placed across the small lake. Respiration and gross primary production (GPP) were tightly coupled (1:1 ratio) both in the small lakes and in the small ephemeral streams on the Great Alvar. Downstream respiration was decoupled from GPP as respiration rates were much higher due to agricultural impact. Dansk resumé Små økosystemer meget mere almindelige end deres større modstykker. Små søer og vandløb udgør det typiske ferskvandshabitat både i Danmark og globalt, men dette til trods er de stærkt underrepræsenteret i videnskabelige undersøgelser hvor fokus meget oftere har været på de større ikoniske søer og floder. 4 Man har ofte antaget at små søer var fuldt opblandede, mens større søer kan have komplekse opblandings og lagdelings mønstre. Denne forsimpling af de små søer er dog foretaget uden videnskabeligt belæg. I kapitel 1 viser vi at helt små søer kan lagdele hvis indkommende solenergi afsættes i toppen af vandsøjlen og den fysiske opblanding som følge af vindens friktion mod vandoverfladen samtidigt hæmmes. Vi undersøger disse varmeflukse og den rolle tæt bevoksning af kransnålalger har i en lille sø. Vi viser fysiske modeller som forudsiger at søen i forhold til dens overflade areal hvorpå vinden afsættes skal være 4 gange dybere end den er før den vil lagdele. Alligevel lagdeler den kun 30-40 cm dybe sø næsten hver dag mellem slutningen af marts og slutningen af maj. Vi måler temperaturforskelle på op til 15 °C mellem top og bund. Om natten opstår en meget ustabil situation når overfladevandet køles ned til 1-5 grader under bundvandstemperaturen, dette resulterer i kraftige konvektive strømme som opblander vandsøjlen fuldstændigt. Denne lagdeling muliggøres af kransnålebevoksningen, da op imod 90 % af den indkommende solenergi afsættes i de øverste 5-20 cm af vandsøjlen som varmes op, friktionen mellem vinden og søens overflade skaber strømhvirvler men disse svækkes kraftigt af den tætte kransnålalgebevoksning og når ikke bundvandet der derfor forbliver koldt. De natlige konvektive strømme påvirkes derimod kun lidt af kransnålalgebevoksningen da de er retningsbestemte mod bunden som følge af tyngdekraften. Dermed har kransnålalgerne en udtalt effekt på søen. I kapitel 2 undersøger vi de gradienter som opstår som følge af daglige lagdeling af søen. Om dagen overmættes overfladevandet med ilt til over 200 % af atmosfæreligevægten, mens bundvandet bliver iltfrit. I overfladevandet hvor der er lys, forbruges uorganisk kulstof i fotosyntesen og pH stiger, herved skabes de forhold hvor kalk (CaCO3) kan fælde ud som krystaller, i denne proces frigives CO2 til fotosyntesen uden at pH stiger yderligere. 5 CaCO3 krystallerne synker mod bunden, her i det kolde bundvand hvori respirationsprocesser har frigivet CO2 og sænket pH opløses CaCO3 krystallerne, herved ophobes uorganisk kulstof og CO2 ved bunden om dagen. I det iltfrie bundvand reduceres desuden ferrijern og sulfat til ferrojern og sulfid som er giftig for mange organismer. Den natlige opblanding bringer ilt til bunden som oxiderer de reducerede stoffer og samtidig føres det ophobede uorganiske kulstof tilbage til overfladevandet. Disse processer betyder at denne næringsfattige sø kan have høj produktivitet og tæt bevoksning. I kapitel 3 viser vi at den høje produktivitet hænger sammen med en ligeledes høj respiration, forskellen mellem disse er tæt på nul, hvilket vil sige at nettoproduktiviteten i systemet er meget lav. Kun i nogle få timer først på dagen er produktiviteten høj nok til at opveje respirationen, og allerede først på eftermiddagen er respirationen større end produktionen. Da der er masser af lys tilstede hæmmes produktionen af mangel på CO2, i stedet bruges bikarbonat og kalk. Vi undersøger heterogeniteten i systemet ved dels at måle på metabolismen ned gennem vandsøjlen og på tværs af søen med mange sensorer forskellige steder i overfladevandet. Vi finder ensartede resultater ved målinger på tværs af søen, hvilket formentligt skyldes den effektive natlige opblanding og de korte afstande i søen. Hvis man ikke tager højde for lagdelingen i søen får man underestimeret respirationen som dominerer i den nederste del af vandsøjlen. Om natten aftager respirationsraten som følge af manglende substrat. I kapitel 4 undersøger vi metabolismen i de små vandløb på Ölands Store Alvar, hvis øvre dele ofte tørrer ud om sommeren. Her er flere ligheder med metabolismen i de små søer. Produktiviteten og respirationen er tæt koblet og forhold i mellem dem er tæt på 1:1 og nettoproduktiviteten er meget lav. Længere nedstrøms løber vandet gennem landbrugspræget opland, her stiger respirationen og afkobles dermed fra produktiviteten. Respirationsraten aftager også om natten i vandløbene. 6 Kapitel 5 (på svensk) opsummeres flere studier på Ölands Alvar, og vi viser eksempler på de landskabsmæssige gradienter som findes her. Vandløb som tørrer ud, rå kalkflader som oversvømmes skaber damme og udtørres igen, samt mere permanente små søer hvor vandspejlet ændres dramatisk over året. Der gives eksempler på biologien i disse habitater. 7 Introduction Small aquatic ecosystems are many-fold more abundant than the larger and often iconic lakes and rivers (Downing et al. 2006). Small ecosystems have highly dynamic physico-chemical dynamics and house species that must be adapted to such dynamic – often extreme – environments (Wesenberg-Lund 1915, Christensen et al. 2013). Nonetheless, small lakes and streams have been greatly understudied despite that many new aspects of ecosystem ecology and species adaptation can apparently be discovered and understood in this abundant, widespread but forgotten environment (Herb & Stefan 2005). I should add, that the small aquatic ecosystem are so common that ecosystem processes such as storage of terrestrial fixed organic carbon and CO 2 emission to the atmosphere have a much greater contribution to these processes for the entire landscape than that of medium-sized and large lakes and running waters (Hanson et al. 2007, Sand-Jensen & Staehr 2012). With this entrance I have very much argued for the focus and title of my Ph.D. thesis: Ecology in small aquatic ecosystems. First of all, because small aquatic ecosystems are greatly understudied my investigation was likely to offer new insight and knowledge that would furthermore be relevant on the landscape level. Secondly, being highly dynamic environments, small aquatic ecosystems are extremely fascinating and appealing which is motivating during long field days and tiresome data analysis. I was not let down by the results that appeared. Discovering recurring daytime stratification and nocturnal mixing in a small charophyte-lake was a great experience to me and my co-authors (paper 1), not to mention the documentation of 15 °C changes of water temperature and vertical gradients of the same magnitude during a summer day. Finding anoxia in bottom waters during daytime alternating with oxic conditions at night was a big surprise and an interesting discovery which is obviously a huge challenge to the survival of plants, algae and immobile animals (paper 2). Being able to present highly reproducible diurnal patterns of ecosystem 8 production and respiration in a small charophyte-lake and subsequently explain them by relationships to characteristically diurnal courses of environmental variables was highly rewarding. It comes at a time where recent reports of extreme spatial variability of estimates of ecosystem metabolism in medium-sized lakes by multiple oxygen sensors placed at different locations (Van de Bogert et al. 2012) threaten to make the approach of deploying numerous temperature, O2, pH and other sensors in the free-water less attractive because the ecosystem estimates attained can apparently be so noisy that useful interpretation of results are difficult (paper 3). That we, in contrast, could demonstrate distinct diurnal courses of ecosystem metabolism (i.e. afternoon depression of photosynthesis and declining nocturnal respiration from sunset to sunrise, paper 3) as well as approximately balanced production and respiration rates under highly oligotrophic conditions in small charophyte-lakes as well as in small ephemeral streams on the open, oligotrophic limestone grasslands of Öland, SE Sweden was also a new finding and confirmation of a hypothesis that was originally predicted by the father of aquatic ecosystem metabolism, Howard T. Odum more than fifty years ago (Odum 1956) (papers 4 and 5). Abundance of small ecosystems – With my Danish background I know that very small lakes (< 1 ha) are counted in numbers exceeding 100,000 in the country, while medium-sized and larger lakes (> 10 ha) are 100-fold less abundant (Sand-Jensen 2001). Also small narrow streams (< 2.5 m width) stretches for 48.000 km through the landscape compared to 1.500 km for larger Danish streams (> 8 m width, SandJensen et al. 2006). If we turn to other lowland countries such as England (Biggs et al. 2005, Davies et al. 2008) and the American mid-West (Hanson et al. 2007) the dominance of small lakes and streams is repeated. The same pattern is even more pronounced on the Arctic tundra (Anderson & Stedmon 2007) and in the deltas and backwaters of major rivers (Emmerton et al. 2007). 9 On the large Swedish island of Öland, which became the region of my investigation, there are no major streams and only one major lake (Lake Hornsjöen). In contrast, there are many small, shallow streams, mostly ephemeral that dry out during summer (Fig. 1) and there a many shallow lakes, often filled with charophytes or submerged flowering plants because of the shallow, nutrient-poor and transparent waters (paper 4 and 5). Shallow lakes cover large surface areas of Ölands Great Alvar (Unesco World Heritage) during winter, but are markedly reduced in size and numbers during summer drought where many waterbodies dry out completely. The same changing water levels are experienced by the many small lakes in the abandoned limestone quarry surrounded by the undisturbed Räpplinge Alvar, where I made the largest part of my Ph.D. study (Fig. 2). Figure 1 Ephemeral stream on Öland (Åbybäcken) that has dried This area has about twenty small lakes out in the summer drought. and my studies could be made undisturbed by intruders and under kind observation of the owner such that we experienced no loss of equipment during the three year study. I should also emphasize that we selected small lakes and streams on Öland as study objects because they are calcareous and oligotrophic and represents a contrast to most ecosystems in other parts of the European lowlands that have been greatly disturbed by excessive eutrophication from urban areas and intensely cultivated farmland (paper 4 and 5). This destructive development has not occurred to nearly the same extent on Öland as yet. Thus, we are studying ecosystems as they 10 were throughout Europe before World War II and as they still are in unspoiled regions and as they may once again become following reduced nutrient loadings. Small lakes: ephemeral or permanent and terrestrial impact – Small shallow lakes can dry out and undergo refilling on a regular basis, though the nature of the processes are stochastic such that drying-out and refilling can occur several times a year and in different Figure 2 Arial photograph of an abandoned limestone quarry, dominated by ponds and small lakes, seen as predominantly as dark brown patches © Google. seasons or not take place whatsoever in wet years. The small charophytelake we studied lost 73% of its water from winter to early summer in 2014 (paper 1). According to the landowner, it dries out completely approximately once every 15 years. Charophytes and flowering plants can sustain complete water loss, while fish populations are more susceptible, though they were indeed present. There are important implicit scaling functions concerning water retention time, external loading of organic material and nutrients as well as incident irradiance and wind exposure to surface area and water volume of lakes (Sand-Jensen & Staehr 2007, Staehr et al. 2012). Small lakes have a longer coastline relative to surface area than large lakes; i.e. the contact to the surrounding terrestrial landscape is higher. In fact for the same shape, the length of the coastline relative to surface area declines in proportion to the linear dimensions of the lake. Therefore, small shallow lakes tend to have shorter water retention time, greater external loading of organic material and nutrients to surface area and volume than large deeper lakes, and are also likely to be more shaded by riparian vegetation and less exposed to wind (Sand-Jensen & Staehr 11 2007, Staehr et al. 2012). Small forest lakes can be so extensively shaded that autochthonous production is negligible and the metabolism is entirely based on input of terrestrial material. In contrast, small lakes located in open landscapes host very productive plant communities whose primary production by far outweighs the input of allochthonous material that may come from the low plants in the surroundings. Commonly, temperate lakes on open agricultural landscapes receive heavy external nutrient loads resulting in blooms of microalgae, floating duckweeds or submerged plants and anoxia following die-back and decomposition of the produced plant material. The small lakes on Öland, in contrast, are surrounded by nutrient-poor open grassland with thin soils on the very slowly weathering Ordovician limestone. Thus, external input of nutrients and organic material is low and the lake water is crystal clear (Sand-Jensen et al. 2010, paper 5). Ecosystem processes should, therefore, mostly be of autochthonous character and gross primary production and community respiration pretty close to each other. Warming, cooling and hydrodynamics – Small shallow lakes can respond much faster to meteorological drivers than large, deep lakes because the smaller water column requires less energy to heat up or cool down. It has mostly been over-looked and forgotten, but already 40 years ago, Martin (1972) showed that very small lakes can undergo daily thermal stratification. The fast response to meteorological conditions and the fact that small shallow lakes can indeed stratify open up the possibility of very dynamic and complex thermal regimes. Nonetheless, small shallow lakes are usually assumed to be fully mixed with little justification (Branco & Torgersen 2009). In contrast, it is realized that large lakes have complex thermodynamics (Staehr et al. 2009), probably because scientific studies and knowledge of these lakes are much more comprehensive. Since the early 1900, lakes have been classified based 12 on their stratification pattern (Hutchinson & Löffler 1956), and refined classifications have been introduced more recently (Lewis (1983). A deep lake located at our latitude stratifies during summer, mix in autumn, can have reverse temperature stratification under winter-ice and become fully mixed following ice-out in spring. We were very interested in analyzing how stratification and mixing patterns are in small shallow lakes with dense submerged vegetation because vegetation should greatly impede wind-induced mixing by offering great resistance to water movements (Losee & Wetzel 1993, Sand-Jensen & Pedersen 1999). Also, dense submerged vegetation generates extremely steep light attenuation and the possibility of particularly strong surface warming. Both strong dissipation of turbulent energy and strong warming of surface waters should facilitate formation of vertical density gradients. Indeed it turns out that the temporal and spatial thermal pattern of a deep temperate lake from spring, through summer to autumn is repeated in the shallow charophyte-lake during every 24-hours day-night cycle in summer (paper 1) with great consequences for water chemistry (paper 2). Stratification and water chemistry – There are several reasons why temperature and coupled stratification-mixing patterns are crucial for understanding physico-chemical and biological processes in lakes. The thermocline acts like a boundary between surface waters and bottom waters such that different processes result in diverging chemistry. The density gradient between the two water layers marks the lower limit to where turbulent mixing can effectively penetrate such that dissolved ions and gases are predominantly transported by slow molecular diffusion, while dense particles influenced by gravity can sink into the bottom waters (Boehrer & Schultze 2008). In the surface mixed layer organic production by photosynthesis will typically surpass respiration during daytime leading to accumulation of oxygen, increase of pH and depletion of dissolved inorganic carbon (DIC). In the bottom waters, being physically separated from surface waters by the density gradient, the 13 opposite processes (i.e. depletion of oxygen, decline of pH and DIC accumulation) take place leading to strong vertical gradients. The crucial question is now how these processes behave and influence chemical gradients in small lakes that develop dense stands of macrophytes and possibly form vertical density gradients despite shallow water. In dense stands of charophytes and flowering plants with steep vertical light attenuation, the chemical gradients are enhanced by the contrast between well-illuminated surface waters warming up during daytime and shaded bottom waters. When vertical stratification develops on a daily basis within macrophyte stands we anticipate the development of much more profound temporal and vertical gradients of substrates and products involved in photosynthesis and plant respiration as well as oxygenic and anoxic bacterial processes than usually encountered in large lakes. pH changes coupled to photosynthesis and respiration can also induce precipitation of calcium carbonate in surface waters and dissolution in bottom waters. The rate of these processes and the resulting vertical gradients should be particularly strong because all metabolic activity is packed in a shallow water column. Perhaps the dynamics could become intermediate between that experienced in the upper few millimeters of wellilluminated surface sediments where diffusion processes and extremely high metabolic rates normalized to volume prevail (Jørgensen & Revsbech 1985) and the conditions in meter-thick well-mixed water columns of lakes. If stratification lasts long enough, surfaces waters may become depleted in plant nutrients and bottom waters enriched in the same nutrients. In the case of development of strong vertical oxygen gradients bacterial processes and animals will be greatly influenced. Anoxia induces sulphate, nitrate, manganese and iron reduction and animals may try to escape from the risk of anoxia and accumulation of sulphide and reduced iron. The stratification-mixing regime sets the scene for all the biological and chemical processes and their direct and indirect ecological consequences. This scene should be quite different in small shallow lakes 14 with dense macrophyte stands than the well-known scene in the open water column and even within the littoral vegetation of large lakes where vertical and horizontal turbulence and water flow should be much stronger and weaken the gradients. Ecosystem metabolism – Technological improvements of O2 sensors as well as other sensors for free-water measurements of temperature, light, pH, conductivity, etc. have made it possible to estimate ecosystem processes of gross primary production (GPP), net ecosystem production (NEP) and respiration and the environmental conditions regulating them without enclosing the organisms in bottles and chambers under unnatural environmental conditions. After years of progress and optimism, we have now been warned that perhaps we have been over-optimistic concerning the potentials of free-water measurements to determine the processes and demonstrate their regulation because of surprisingly high differences in metabolism estimates derived from multiple sensors at different locations in medium-sized lakes (Van de Bogert et al. 2007, Van de Bogert et al. 2012). Experience suggested that we ought to maintain optimism regarding the ability of single and multiple sensors to yield reproducible estimates of ecosystem metabolism in small lakes (Christensen et al. 2013) because shorter vertical and horizontal distances may reduce delays between processes actually occurring and being registered and at the same time homogenizing oxygen (and other chemical signals) signals from different sections of the small lakes. This motivated us to perform the whole-lake studies in the small Charophyte-lake (papers 2 and 3). Studies of ecosystem studies of streams are the classical ones which were initiated already in the 1920-1930ies. Because of the unidirectional flow, oxygen balances can be established by the two-station method of H. T. Odum and the later refinements. One challenge is to ensure accurate determination of air-water gas exchange. We made direct measurements of gas exchange using flow chambers in the small alvar streams on Öland and were able to obtain highly accurate and 15 reproducible results. We were particularly interested in these streams because they are oligotrophic and collect virtually no sediment because most sediment is washed out during winter stormflow following the low-flow spring and summer period and what remains of organic particles is metabolized when the streams dry out in summer. We hypothesized that autochthonous production and community respiration should be very low compared to most other, more nutrient-rich and flow-stable temperate streams and production and respiration should be in approximate balance. The small shallow lakes, being filled with water for most of the year and indeed collecting sediment, develop a dense cover of charophytes and should, thus, have much higher rates of ecosystem production and respiration. This was an interesting contrast that we wanted to evaluate (paper 5). 16 Aim The aim of this thesis was to: i. Investigate surface heat fluxes and stratification-mixing in a small charophyte dominated lake. ii. Investigate if macrophytes themselves can influence the hydrodynamics of the lake sufficiently to cause it to stratify. iii. Investigate the physico-chemical gradients that may develop in a stratified charophyte-lake. iv. Investigate ecosystem metabolism of small oligotrophic lakes and streams. v. Investigate if the horizontal and vertical heterogeneity of metabolic signals in such systems differ from larger lakes and rivers. Paper synopsis Paper 1 - Profound daily vertical stratification and mixing in a small, shallow, windexposed lake with submerged macrophytes. We studied a small (< 1000 m2), shallow (< 0.6 m) lake with dense submerged macrophytes located in an open landscape on Öland, SE Sweden, between March and May to investigate thermal regimes, surface heat fluxes and effects of macrophytes Water temperature (C) on stratification and mixing processes. 35 30 25 20 15 10 5 0 March April May Figure 3 Surface water temperature (dashed line) and bottom water temperature (bold line) in the shallow lake during the investigation. 17 The small lake heated up from March to May. Profound daytime temperature differences developed between surface and bottom-waters ranging from 3 °C in March to 15 °C in May (Fig 3). Maximum relative thermal resistance to mixing (RTRM) exceeded 50 (a literaturederived value for the certain onset of stratification) on 11 days in April and 25 days in May while the mixed depth dropped from 100 % of the water column to just 25 % (calculations of mixed depth showed, however, that the small lake stratified moderately even in late March). Nocturnal cooling of surface waters to 1-5 °C below bottom water temperature led to full convective mixing of the water column every night. Nocturnal surface cooling and convective mixing were enhanced by the extraordinary daytime warming of surface waters above air temperatures. Convective mixing was only weakly affected by the charophytes. The daytime focal depth of the thermocline was 25 cm below the water surface in early May and just 15 cm in late May following a parallel shallowing of the lake bringing the charophyte canopy closer to the water surface. The strength of stratification peaked in the early afternoon although diel wind speeds were highest at this time (Fig. 4). Mixed depth (%) aa RTRM 150 100 50 0 -50 00 03 06 09 12 15 18 21 24 Wind speed (m s -1) 200 100 1500 3 b ab PAR (µmol m-2 s-1) 250 2 50 0 00 1 0 00 03 03 06 06 09 09 12 12 15 15 18 18 21 21 24 b 1000 500 0 00 24 03 06 25 100 Surf. water temp. (°C) d averages of windspeed (m s -1) Figure 4 Diel averages of RTRM (dimensionless) (panel a) and diel Relative humidity (%) 09 12 15 18 Time of Day of Day TimeTime of Day Time of Day 90 ( panel b). Blue line is March, green line is April and red line is May. 80 e 20 15 70 10 The coinciding peaks in wind speed and strength of stratification was possible 60 5 because the dense macrophyte cover rapidly attenuated depth penetration of the 50 00 03 06 09 12 15 Time of Day 18 21 24 0 00 03 06 18 09 12 15 Time of Day 18 radiative fluxes, while also greatly attenuating the depth penetration of wind-induced turbulent mixing. Thus, by facilitating build-up of temperature, chemical and density gradients the macrophytes profoundly influenced their own environment. Paper 2 - Recurring stratification and mixing generate extreme diurnal oxygen and carbon cycles in shallow vegetated lakes. Vertical stratification-mixing patterns are main determinants of biogeochemistry. Here we show that a small, wind-exposed, shallow (ca 0.4 m) lake with submerged macrophytes underwent recurring daytime stratification and nocturnal mixing during summer accompanied by extreme variations in temperature, oxygen, pH and dissolved inorganic carbon (DIC) with time and depth. During daytime stratification, surface waters attained 230 % oxygen saturation and strong CO2 depletion (< 10 % air saturation, Fig. 5). 19 Water depth (m) 0 35 C a 30 C 0.1 25 C 0.2 20 C 15 C 0.3 10 C 0.4 500 5 C b O2 (M) 400 300 0.08 m 0.24 m 0.34 m 200 100 pH 14 c 12 9.0 10 ANC (meq L -1) 8.0 6 1.5 4 1.0 2 0.5 0.4 d DIC 1.0 0.3 0.2 CO32- 0.5 0.1 CO2 0.0 0 12 0 12 0 12 0 12 0 12 0 12 August 13 August 14 August 15 August 16 August CO32- / CO 2 (mM) 1.5 DIC (mM) 8 2.0 Calcite saturation index (green) 10.0 0.0 Figure 5 Time series of temperature, O2, pH, ANC, calcite saturation index, DIC, individual carbon species with depth in a shallow charophyte-lake during six days. a, Temperature isopleths calculated from measurements at 5-cm depth intervals. b, Oxygen measured at 0.08 m (dark blue), 0.24 m (green) and 0.34 m (red) below the water surface. c, pH (blue) and ANC (green) in surface waters (0.08 m). d, DIC (red), CO32- (orange) and CO2 (blue) in surface waters (0.08 m). Where b-d background color show day/night cycle (white = day, grey = night). Deeper waters were colder and became anoxic. In the cold anoxic bottom waters, reduced compounds such as ferrous iron and sulphide accumulated during the day and CO2 built up to more than 1500 % super-saturation (Fig. 6). 20 Water depth (m) 0.0 0.1 0.2 0.3 0 10 20 30 Fe2+ (M) 40 0 0.1 0.2 0.3 0.4 Sulphide ( M) 1 2 3 DIC (mM) Figure 6 Depth profiles of Fe2+, sulphide and DIC in a shallow charophyte lake during a diurnal cycle. At 6:00 (red), 11:00 (blue), 16:00 (green) and 22:00 (orange) o’clock. The water column was vertically mixed at 6.00 o’clock and stratified below 0.20 m at 11:00 - 16.00 and below 0.25 m at 22:00 o’clock. High daytime pH in surface waters induced CaCO3 precipitation while releasing CO2 for ongoing photosynthesis without further pH rise. The majority of the precipitated CaCO3 was re-dissolved in bottom waters leading to a buildup of DIC (Fig. 6). Vertical gradients disappeared during nocturnal convective mixing which oxygenated the bottom waters and regenerated the DIC pool in the surface waters. These processes add new dimensions to our understanding of the regulation of ecosystem photosynthesis and respiration and the adaptation of sessile plants and mobile animals to the extreme variability of environmental stressors. Paper 3 - Distinct diurnal patterns of ecosystem metabolism in a small charophytelake. We wanted to characterize the temporal and spatial variability of metabolic parameters: gross primary production (GPP), respiration (R) and net ecosystem production (NEP) in a small, shallow lake with dense charophyte stands. To do so we collected data from many O2 sensors placed along a vertical mid-lake profile and across the lake surface in late May and early June. Similar diurnal patterns derived both from individual surface sensors and multiple sensors. Maximum NEP-rates 21 occurred between 8:00 and 11:00 am and was followed by strong afternoon depression with rates close to zero (Fig. 7). While NEP rates dropped along with DIC and CO2 concentrations, O2 concentration, pH and temperature all rose profoundly in the surface waters from morning to late afternoon. Figure 7 Mean volume-weighted GPP (red) and NEP (blue) for the entire lake, based on the seven oxygen sensors Inorganic carbon limitation of photosynthesis and temperature enhancement of respiration could account for the profound afternoon depression of NEP. Nocturnal respiration declined systematically from sunset to sunrise due to falling temperature and presumably depletion of respiratory substrates. Mean temperature-corrected respiration rates at sunrise were 63% of that at sunset. The dense charophyte canopy accounted for 90% of ecosystem respiration and the entire primary production. Mean daily estimates of GPP and R varied only 2-fold and small, negative NEP-rates varied less between surface sensors at different locations across the lake (Table 1). 22 Table 1 . Mean daily rates of GPP, NEP and R derived from continuous oxygen measurements at seven different positions (A to G) and the overall mean of all measurements in a small lake during a week in early June. Daily minimum and maximum daily rates are in parenthesis. In the small oligotrophic lake rates of GPP and R were tight coupled and both about 20-fold higher than NEP (Table 1). Multiple oxygen sensors representing the main depths and sections of the small lake could provide reliable and accurate measurements of diurnal course and daily rates of metabolism, probably because a relatively uniform oxygen signal was ensured by small distances and very efficient nocturnal mixing. Paper 4 - Whole-stream metabolism in nutrient-poor calcareous streams on Öland, Sweden. We studied whole-stream metabolism in three headwater non-forested stream reaches on the island of Öland, Sweden in order to characterize the metabolism of this unusual ecosystem and to compare it with other stream ecosystems in NW Europe. Gross primary production (GPP) was low (< 4 g O2 m-2 d-1) with the lowest GPP recorded in the most upstream, shallow reach draining the thin soils of the limestone Alvar plains. Here, completely flooded terrestrial plants could account for the whole primary production. Respiration (R) increased several-fold downstream with increasing agricultural impact, resulting in heterotrophic stream conditions and higher 23 light requirements for GPP to outweigh the higher respiration. Some similarities between the small oligotrophic lakes (paper 3) and the most nutrient-poor reaches of the stream were observed. GPP and R were tightly coupled and temperature-corrected respiration rates were highest in the beginning of the night and decreased towards the end of the night (Fig. 8), indicating that nocturnal respiration depleted photosynthetic products and became limited by organic substrates in the streams too. Broad-scale comparison of open NW European streams showed a 1:1 relationship, indicating a tight link between daily GPP and R during summer (April-August) but not during winter. Figure 8 Respiration rates declining during the night in a We extended the range of GPP and R small nutrient-poor Alvar stream. measurements to include nutrient-poor NW European streams, thereby increasing the knowledge on stream metabolism in this region, otherwise, highly impacted by agriculture. We documented a strong relationship between GPP and R in streams, ranging from extremely nutrient-poor to moderately nutrient-rich conditions during spring and summer. Paper 5 - Caught between drought and flooding on Ölands Great Alvar The Great Alvar plain on the Swedish island of Öland is characterized by thin soils covering the hard limestone pavements. This gives rise to widely fluctuating water levels between winter flooding and summer drought and strong hydrological gradients across small changes in elevation. In the semi-natural grassland, the intermittent streams and the ponds are all strongly influenced by the fluctuating water levels and the extremely low phosphorus availability. These factors have selected for 24 phototrophs with low metabolic rates and growth, and communities of low photosynthesis and respiration. Plant species were distinctively distributed according to their characteristic plant traits along a moisture gradient from ponds to dry alvar. High root porosity to ensure efficient oxygen transport was strongly selected for among species in wet soils, while small, thick leaves were strongly selected for on thin, dry soils. Overall, six plant traits could predict 66% of the variation in abundance of plant species in the communities along the gradient. The alvar streams had only modest biomasses during maximum development of benthic algae in May, and community photosynthesis was 5–10 times lower than corresponding levels in nutrient-rich streams in cultivated lowlands of Scandinavia. During June–September streams dried out and the re-establishment of flow in winter and spring led to an export of nutrients. Shallow ponds also dried out during summer and had low metabolic rates just like the streams, while permanent ponds developed dense stands of charophytes, despite undetectable levels of N and P in the water. Photosynthesis and community respiration were in approximate balance in permanent ponds. The maximum rates were comparable to those in eutrophic, phytoplanktonrich lakes. Conclusions and implications Several concrete results have emerged from this thesis. Small lakes can stratify and exhibit temperature differences between the surface mixed layer and the hypolimnion that rival that of much larger lakes. Because the stratification takes place in a very shallow water column, the resulting gradients are extremely steep. It was a new insight that a water column of just 0.3-0.4 meter could be more than 200 % supersaturated in the surface waters and anoxic in the bottom waters. 25 The carbon pool in the surface waters in such a lake is regenerated in DIC and CO2 which is dissolved in the anoxic bottom waters during the day and distributed in the water column by the efficient convective nocturnal mixing. On particularly cold days when the water column does not stratify photosynthesis in the surface water becomes carbon-limited much earlier during the day. While the stratification presents plants and animals with challenges for survival, it also provides the basis on which they depend and have adapted. Physical models of mixing resulting from surface wind shear show that the lake would have to be roughly 4 times as deep as it was in order to stratify, and the only explanation is that the attenuation of both radiative heat fluxes and wind-induced turbulent mixing due to the presence of macrophytes is the reason why the lake stratifies. The macrophytes then create the physical and chemical environment on which they themselves depend. Potential harmful effects of elevated pH levels in the surface waters were limited by the fact that as the day progressed productivity depended more and more on CaCO3 precipitation which release CO2 and is pH neutral. In this highly dynamic system we observed the same metabolic patterns with individual oxygen sensors as we did with a volume-weighted average of many sensors placed across the lake. Respiration was underestimated when calculations of metabolic parameters did not account for stratification, but the results were still of the same order of magnitude. We credit the small distances and the recurring nocturnal mixing for integrating possible local differences in metabolic rates to a common oxygen signal. Investigating the metabolism in detail revealed some interesting patterns. Positive NEP rates were restricted to mornings and early afternoons. Later in the day respiration speeded up due to elevated temperatures and productivity dwindled as the surface water became depleted on metabolic substrates. Nocturnal respiration slowed down during the night, even when corrected for the drop of temperature. This finding suggests that respiration too is limited by availability of substrate. Both productivity 26 and respiration rates were high on areal basis in this oligotrophic system, while NEP was close to 0. This validates our metabolism model as the very shallow lake would simply be filled up if respiration did not closely follow production, and in the ~30 years in which the small lake has existed, only a few (4-10) centimeters of sediment have accumulated. Some of the same patterns were observed in the small intermittent streams we investigated on the Great Alvar. Productivity and respiration was tightly coupled with a 1:1 ratio, and respiration rates dropped markedly as the night progressed. Both productivity and respiration was several fold lower than in other low land streams, owing to the extremely low nutrient- and DIC-concentrations in the water and the winter wash-out of sediments. As we moved downstream into agricultural areas, respiration was decoupled from production as it became much larger and the differences between the Öland streams and other lowland streams was less marked, although productivity remained reasonably low. This thesis has implications for conservation and ecology on a broad scale. My coauthors and I show that stratification can occur in very small lakes. Two drivers are necessary for a small lake to stratify: The incoming heat flux must be attenuated unevenly through the water column. The turbulent mixing must be insufficient to ensure full mixing of the water column. In this study the charophytes attenuated almost 90 % of the incoming short-wave radiation in the top 5-20 cm of the water column. In other small lakes light could be attenuated effectively in the surface water by dense microalgae or high densities of humic substances. The charophytes also effectively attenuated mixing, in other systems mixing could be limited by the surroundings, for instance by forests or crevasses between fault lines in mountains. 27 The implication is that many small lakes may have complex thermal regimes and may behave vastly different than assumed in global estimates of temperature response, carbon sinks etc. It also means that the palette of ecological niches may be larger on local and global scales than previously assumed. For system ecologists this thesis provides the basis for investigating physical, metabolic and ecological patterns for a wider range of small lakes and streams. It remains unanswered how sessile organisms survive the harsh conditions of the bottom waters in the small charophyte-lakes. It is my hope that this thesis may be an inspiration to physiological studies of adaptations to extreme environmental conditions for algae, plants and animals in small lakes. References Anderson, N., and Stedmon, C. A. 2007. The effect of evapoconcentration on dissolved organic carbon concentration and quality in lakes of SW Greenland. Freshwater Biology 52:280-289. Biggs, J., Williams, P., Whitfield, M., Nicolet, P., and Weatherby, A. 2005. 15 years of pond assessment in Britain: results and lessons learned from the work of Pond Conservation. Aquatic Conservation: Marine and Freshwater Ecosystems 15:693-714. Boehrer, B., and Schultze, M. 2008. Stratification of lakes. Reviews of Geophysics 46. Branco, B. F., and Torgersen, T. 2009. Predicting the onset of thermal stratification in shallow inland waterbodies. Aquatic Sciences-Research Across Boundaries 71:65-79. Christensen, J., Sand‐Jensen, K., and Staehr, P. A. 2013. Fluctuating water levels control water chemistry and metabolism of a charophyte‐dominated pond. Freshwater Biology 58:1353-1365. Davies, B., Biggs, J., Williams, P., Lee, J., and Thompson, S. 2008. A comparison of the catchment sizes of rivers, streams, ponds, ditches and lakes: implications for protecting aquatic biodiversity in an agricultural landscape. Hydrobiologia 597:7-17. Downing, J., Prairie, Y., Cole, J., Duarte, C., Tranvik, L., Striegl, R., McDowell, W., Kortelainen, P., Caraco, N., and Melack, J. 2006. The global abundance and size distribution of lakes, ponds, and impoundments. Limnology and Oceanography 51:2388-2397. Emmerton, C. A., Lesack, L. F., and Marsh, P. 2007. Lake abundance, potential water storage, and habitat distribution in the Mackenzie River Delta, western Canadian Arctic. Water Resources Research 43. Hanson, P. C., Carpenter, S. R., Cardille, J. A., Coe, M. T., and Winslow, L. A. 2007. Small lakes dominate a random sample of regional lake characteristics. Freshwater Biology 52:814-822. Herb, W. R., and Stefan, H. G. 2005. Model for wind-driven vertical mixing in a shallow lake with submersed macrophytes. Journal of Hydraulic Engineering 131:488-496. 28 Hutchinson, G., and Löffler, H. 1956. The thermal classification of lakes. Proceedings of the National Academy of Sciences of the United States of America 42:84. Jørgensen, B. B., and Revsbech, N. P. 1985. Diffusive boundary layers and the oxygen uptake of sediments and detritus. Limnology and Oceanography 30:111-122. Lewis, W. M. 1983. A revised classification of lakes based on mixing. Canadian Journal of Fisheries and Aquatic Sciences 40:1779-1787. Losee, R. F., and Wetzel, R. C. 1993. Littoral flow rates within and around submersed macrophyte communities. Freshwater Biology 29:7-17. Martin, N. 1972. Temperature fluctuations within English lowland ponds. Hydrobiologia 40:455-470. Odum, H. 1956. Primary production in flowing waters. Limnology and Oceanography 1:102-117. Sand-Jensen, K. 2001. Lakes - A Protected Nature Type (Danish). Gad Publishing. Sand-Jensen, K., Baastrup-Spohr, L., Winkel, A., Moller, C. L., Borum, J., Brodersen, K. P., Lindell, T., and Staehr, P. A. 2010. Plant distribution patterns and adaptations in a limestone quarry on Oland. Svensk Botanisk Tidskrift 104:23-31. Sand-Jensen, K., Friberg, N., and Murphy, J. 2006. Running Waters: Historical development and restoration of lowland Danish streams. Aarhus Universitetsforlag. Sand-Jensen, K., and Pedersen, O. 1999. Velocity gradients and turbulence around macrophyte stands in streams. Freshwater Biology 42:315-328. Sand-Jensen, K., and Staehr, P. A. 2007. Scaling of pelagic metabolism to size, trophy and forest cover in small Danish lakes. Ecosystems 10:128-142. Sand-Jensen, K., and Staehr, P. A. 2012. CO2 dynamics along Danish lowland streams: water-air gradients, piston velocities and evasion rates. Biogeochemistry 111:615-628. Staehr, P., Bade, D., Bogert, M., Koch, G., Williamson, C., Hanson, P., Cole, J., and Kratz, T. 2009. Lake metabolism and the diel oxygen technique: State of the science. Staehr, P. A., Baastrup-Spohr, L., Sand-Jensen, K., and Stedmon, C. 2012. Lake metabolism scales with lake morphometry and catchment conditions. Aquatic Sciences 74:155-169. Van de Bogert, M. C., Bade, D. L., Carpenter, S. R., Cole, J. J., Pace, M. L., Hanson, P. C., and Langman, O. C. 2012. Spatial heterogeneity strongly affects estimates of ecosystem metabolism in two north temperate lakes. Limnology and Oceanography 57:1689. Van de Bogert, M. C., Carpenter, S. R., Cole, J. J., and Pace, M. L. 2007. Assessing pelagic and benthic metabolism using free water measurements. Limnology and Oceanography: Methods 5:145-155. Wesenberg-Lund, C. 1915. Insektlivet i ferske vande. Gyldendal, Nordisk forlag. 29 Paper 1 - Profound daily vertical stratification and mixing in a shallow, wind-exposed pond with submerged macrophytes. 30 Profound daily vertical stratification and mixing in a shallow, wind-exposed pond with submerged macrophytes. Mikkel René Andersen1, Kaj Sand-Jensen1, R. Iestyn Woolway2 and Ian D. Jones3. 1 Biological Institute, Freshwater Biological Laboratory, University of Copenhagen, Universitetsparken 4, 2100 Copenhagen, Denmark. 2 Department of Meteorology, Reading University, Reading, RG6 6BB, United Kingdom. 3 Centre for Ecology & Hydrology, Lancaster Environment Centre, Library Avenue, Bailrigg, Lancaster, LA1 4AP, United Kingdom. Submitted to Freshwater Biology Keywords: temperature stratification, vertical mixing, pond, macrophytes, charophytes 31 Summary 1) Ecology of small shallow lakes and ponds have been grossly understudied in freshwater ecology although they are 100-fold more abundant than large, deep lakes and cover a much larger area globally. Mixing patterns are essential because they regulate distribution of gases, solutes and organisms. Here, we studied a small (< 1000 m2), shallow (< 0.6 m) pond with dense submerged macrophytes located in an open landscape on Öland SE Sweden between March and May to investigate thermal regimes, surface heat fluxes and effects of macrophytes on stratification and mixing processes. 2) The pond heated up from March to May as surface heat fluxes were positive. Profound daytime temperature differences developed between surface and bottom waters ranging from 3 °C in March to 15 °C in May. Maximum relative thermal resistance to mixing (RTRM) exceeded a threshold of 50 on 11 days in April and 25 days in May while the mixed depth dropped from 100 % of the water column to just 25 %. Nocturnal cooling of surface waters to 1-5 °C below bottom waters temperature led to full convective mixing of the water column every night. Nocturnal surface cooling and convective mixing were enhanced by the extraordinary daytime warming of surface waters above air temperatures. 3) The daytime focal depth of the thermocline was 25 cm below the water surface in early May and just 15 cm in late May following a parallel shallowing of the pond bringing the charophyte canopy closer to the water surface. The strength of stratification peaked in the early afternoon although diel wind speeds were highest at this time. The dense macrophyte cover rapidly attenuated depth penetration of radiative fluxes and wind-induced mixing. 4) Dense macrophyte stands can influence their own environment by facilitating build-up of temperature, chemical and density gradients while lack of macrophytes permits continuous mixing and uniform conditions. 32 Introduction Ponds are far more abundant than lakes, and ponds have a combined surface area which far exceed that of lakes (Downing et al. 2006). While it is well known that lakes have complex thermodynamics (Boehrer & Schultze 2008), studies of surface forcing, mixing and stratification in ponds are rare. Ponds are typically treated as fully mixed systems with little or no justification (Branco & Torgersen 2009). This is problematic as stratification and mixing dynamics in the water column are major determinants of environmental conditions (Branco et al. 2005), distribution, metabolism and survival of organisms (Vad et al. 2013). Ecosystem properties such as carbon metabolism (Staehr et al. 2010), the flux of gases between water and air (Boehrer & Schultze 2008, Coloso et al. 2011) and production rates of the greenhouse gas, methane are also highly influenced by thermodynamics (Bastviken et al. 2011). Accurate characterization of heat exchange between lakes and atmosphere is important for analysis of lake hydrodynamics (Lofgren & Zhu 2000). Positive net heat input results in a positive buoyancy flux, stabilizing the warmer surface layer, while a net surface heat loss cools the surface waters and promotes vertical mixing (Imberger 1985). Wind-induced vertical mixing produced by wind shear on the surface acts as a destabilizing force (Imberger & Hamblin 1982). This mechanical vertical mixing deepens the mixed layer and reduces the likelihood of temperature stratification in wind-exposed shallow lakes (Imberger 1985, Boehrer & Schultze 2008, Branco & Torgersen 2009). Thus, vertical temperature stratification in lentic ecosystems takes place when the stabilizing influence of surface heating from solar radiation and infrared radiation from the sky exceeds the destabilizing influence of turbulent mixing generated by the wind and cooling of the surface waters (Gorham & Boyce 1989, Imboden & Wüest 1995). In general, the shallower the lake, and the 33 more wind-exposed, the less likely is it to stratify (Imberger 1985, Gorham & Boyce 1989). It was, therefore, a surprise that a very shallow (< 0.6 m) and small (< 1000 m2) pond exposed to the wind on the open calcareous Alvar plains on the Island of Öland, Sweden, apparently underwent profound vertical stratification during most days and full mixing every night according to vertical oxygen dynamics (Andersen et al. 2015). Formation of anoxia in bottom waters during the day was probably made possible by strong vertical density stratification, because surface waters were always oxygenated and strongly supersaturated during the day. The pond, though, had a dense macrophyte cover that can result in strong vertical light attenuation. High light attenuation in humic waters can increase surface water temperatures due to absorbed radiation (Persson & Jones 2008, Read & Rose 2013) but increase in surface water temperature also causes a lake to lose more heat from sensible, latent and long-wave fluxes than one with a cooler surface (Persson & Jones 2008) and, when this heat loss exceeds incoming heat, will promote mixing. Thus, vegetation cover can potentially affect the hydrodynamics in lakes if the macrophyte canopy is dense enough to significantly enhance light attenuation. This effect will be stronger if the macrophytes are located close to the surface as the macrophytes will absorb more energy relative to the water column, and this energy will subsequently be dissipated in a smaller volume of water. In transparent oligotrophic waters the strong light attenuation effect of macrophytes will dominate as light attenuation directly in the water is small. Thus, the effect of macrophyte light attenuation on hydrodynamics should be stronger in clear than unclear waters. Similarly, if cover is sufficiently dense, macrophytes can inhibit mechanical mixing by dissipating turbulent kinetic energy (Sand-Jensen & Mebus 1996, Folkard et al. 2007). We therefore initiated continuous measurements of temperature structure at high spatial and temporal resolution in a calcareous pond with dense charophyte beds, in order to investigate if the charophytes could influence the stratifying and 34 mixing dynamics sufficiently to cause diel stratification. To calculate heat fluxes a meteorological measuring station was established next to the pond. Our specific objectives in this study were to determine: (i) the heat fluxes in a small pond with dense macrophyte cover, (ii) when and where stratification and mixing take place during daily and monthly periods, and (iii) the impact of macrophytes on stratification and mixing dynamics. Materials and methods Site description The investigation was conducted in a small permanent pond in an abandoned limestone quarry on Räpplinge Alvar on Öland, SE Sweden (56.81168°N, 16.6094°E; Sand-Jensen & Jespersen 2012). The quarry supports about 20 temporary and permanent small ponds (Sand-Jensen et al. 2010, Christensen et al. 2013). The substratum in the quarry consists of exposed solid limestone pavements, which are almost devoid of vegetation over large areas. The quarry which is surrounded by the natural Alvar was abandoned about 30 years ago. The area is kept open by grazing horses. The local climate is quite dry (mean annual precipitation 510 mm; 19601990), with moderately cold winters (January mean -1.2o C) and mild summers (July mean 16.2o C) (SMHI 2013). The precipitation is evenly distributed throughout the year (monthly mean range 32-54 mm), but temperature variations lead to large seasonal differences in evapotranspiration and water availability (SMHI 2013). Between April and August in 2010 local surface temperature on the exposed limestone pavements exceeded 40o C on 37 days (Sand-Jensen & Jespersen 2012). The drainage water from the limestone soils filling the shallow ponds has a high acidneutralizing capacity and a pH of 8.0 at air saturation (Sand-Jensen et al. 2010, Christensen et al. 2013). The ponds have extremely low concentrations of soluble 35 inorganic nitrogen and phosphorus close to the limit of detection (Christensen et al. 2013). A meteorological station was established next to the study pond 2.0 m above the water surface. The station was equipped with sensors for incident irradiance (HOBO PAR sensor (400-700 nm): S-LIA-M003, Onset Computers, Bourne, MA, USA), wind speed and direction (HOBO anemometer and direction, SWSET-A, Onset Computers), air temperature and relative humidity (HOBO U23 Pro v2, Onset Computers). Measurements were stored on a data logger (HOBO micro station, H21-002, Onset Computers). A Swedish meteorological station is located at Kalmar Airport 25 km away. This national station offered measurements of daily precipitation, wind speed and direction when data collection failed for a short period at our station. We used the regression equation established between the two sets of measurements when both stations operated to convert Kalmar Airport measurements to the pond setting. Wind speed was closely correlated (r2: 0.68, P < 0.0001) between our station and the Kalmar station nearby. Maximum water level, surface area and water volume in the pond are set by overflow across its rim onto the adjacent Alvar plains. Water depths were measured in a grid of 258 measurements across the pond surface. Water level in the pond was measured at 10 minute intervals with an accuracy of 3 mm by recording pressure differences between a submerged water level data logger (HOBO U-20-00104, Onset Computers) and a similar logger in air allowing continuous calculations of water depth, surface area and water volume of the pond, while correcting for atmospheric changes in barometric pressure. From early March through May of 2014, maximum water depth dropped from 0.59 to 0.30 m and surface area declined from 972 to 661 m2 (Fig. S1). The maximum fetch across the pond in the main West-East wind direction ranged from 10 to 30 m. Water volume was reduced from early March through May from 343 to 99 m3 as a result of higher evaporation than precipitation (Fig. S1). Evaporation and 36 precipitation were the main components in the water balance during the period (data not shown). Sediments were dominated by fine mineral particles with a high content of calcium carbonate (47% of dry mass) and a medium level of organic matter (10%) (M. Andersen and K. Sand-Jensen, pers. comm. 2013). Sediments were deposited directly on top of the hard limestone and varied in thickness from 4.0 to 9.5 cm (mean 5.8 cm). The pond was covered by dense vegetation of charophytes. The dominant species was Chara aspera and additional charophyte species included C. vulgaris, C. virgata and C. globularis. Phanerogams comprised small populations of Potamogeton crispus, Potamogeton natans and the emergent plants Phragmites australis, Typha latifolia, Alisma plantago-aquatica and Alisma lanceolata. Pond measurements Vertical temperature and light profiles were measured in the middle of the pond at 810 positions and about 5-cm depth intervals from the water surface to the sediment surface using small temperature-light sensors (HOBO UA-002-64, Onset Computers) logging the signals every 10 minutes. Measurements were conducted from March to late May 2014. Sensors were calibrated relative to each other before and after use by setting them up in shallow water in the pond in natural daylight (10-cm depth and no vegetation) for 24 hours and subsequently correcting the response of the individual sensors relative to the mean value of all sensors. Temperature readings were in full agreement with measurements by a high-precision thermometer. Because the HOBOloggers work in steps of 0.14 °C, we judge this as the absolute accuracy. Irradiance data through the water column were recorded in May and used in relative mode to calculate light attenuation between sensors positioned at different depths. Temperature-light sensors were mounted on a vertical steel peg rising from a heavy steel plate buried in the sediment. Individual sensors were fastened to thin 5-cm long plastic brackets keeping the sensors horizontal and pointing in 37 different directions to avoid internal shading and minimize influence on the natural temperature, light and flow regimes. Temperature profiles were used to construct isopleths of temperature with depth and time and to calculate the relative thermal resistance to mixing (RTRM, Wetzel (2001)). RTRM is the non-dimensional ratio between the difference in density of bottom and surface water normalized to the difference in density between waters at temperatures of 4.0 and 5.0 °C: RTRM= (ρz -ρz ) 2 1 (ρ4 -ρ5 ) , where ρ is specific mass density of water (kg m-3), ρz1 is for the surface water, ρz2 is ρ at the bottom water and ρ4-ρ5 is the difference in specific mass density of water at 4 °C and 5 °C respectively. Specific mass density of water was calculated from water temperature according to Bigg (1967). Temperature profiles through the water column at the time of maximum Wetzel stability were used to determine the depth interval in which the maximum change in water temperature occurred. The mid-point of this depth interval is an analogue to the focal depth of the thermocline (zThCline) used for lakes. Light data within the water column were not recorded for March and April, but for May light data were collected and profiles of daily irradiance with depth (z, m) below the water surface (Ez) were integrated over the day and used to determine the mean daily light attenuation coefficients (η, m-1) with depth below the water surface (z) by linear regression analysis according to: Ln (Ez) = -η*z. The attenuation coefficient was used to calculate the depth (z10%) at which the subsurface irradiance was reduced to 10 % according to: z10% = 2.3*η-1. Biomass samples were collected in the charophyte bed on three occasions. Six to ten randomly located cores (inner diameter 10 cm) were placed over the vegetation and 38 gently pushed into the sediment. All above-ground charophyte material within the cores was removed by hand, carefully rinsed and dry weight (DW) determined after 48 h at 105 °C. Mean biomass density was calculated both per unit surface area and per unit water volume. Air temperature, relative humidity, PAR-light and wind speed were measured every minute and stored every 10 minutes. The first HOBO temperaturelight sensor which was fully submerged was used for surface water temperature. The MatLab© version of Lake Heat Flux Analyzer (Woolway et al. 2015) was used to calculate surface heat fluxes, net incoming short-wave radiation (Qsin), the reflected component of short-wave radiation (Qsr), sensible heat flux (Qh), latent heat flux (Qe), incoming long-wave radiation (Qlin), outgoing long-wave radiation (Qlout), net longwave heat flux (Qlnet; Qlin - Qlout) and total surface heat flux (Qtot), as well as the dimensionless drag coefficient, CD, and the transfer coefficient for latent heat, CE. The transfer coefficient for sensible heat was assumed equal to that for latent heat (Zeng et al. 1998). Lake Heat Flux Analyzer calculates fluxes and transfer coefficients from standard, established equations in the air-water literature, including calculating the transfer coefficients, CD10 and CE10, at the standard reference height of 10 m. Turbulent flux equations are based on Zeng et al. (1998), incoming long-wave radiation is modelled after Crawford and Duchon (1999) and Fresnel’s equation is used to calculate the reflected solar radiation (Woolway et al. 2015). The wind energy flux, referenced to 10 m, P10, was calculated following (Wüest et al. 2000) as P10 = ρa*CD10*U103, where ρa is the density of air calculated as Verburg and Antenucci (2010) and U10 is the wind speed at 10 m, calculated from the measured wind speed and atmospheric stability using Lake Heat Flux Analyzer. Results Meteorological variables Surface irradiance reached daily peaks at noon above 1000 µmol m-2 s-1 on most of the investigated days from March to May (Fig. 1). Days of lower irradiance were 39 scattered throughout the period. Wind speed was moderate (< 4 m s-1) during 94% of the time and only on 12 % of the days was the maximum wind speed above 6 m s-1. Wind speed peaked in the afternoon to 2-2.5 times the nocturnal wind speed, and there was no difference between months (Fig. 2). PAR light had slightly lower midday peaks in March than May. Surface water temperatures followed air temperatures but were consistently higher; both peaked in the afternoon and both increased from March to May. The relative humidity dropped in the afternoon at increasing air temperature and declined from March to April, but did not differ between April and May. Light attenuation and charophyte density Irradiance was rapidly attenuated with depth in the pond because of the high biomass density of charophytes. The mean daily light attenuation coefficient from just below the water surface to 8 cm above the sediment surface was 10-25 m-1, resulting in absorption of 90 % of subsurface irradiance in the upper 9-23 cm of the water column (Fig. 3). The depth at which subsurface irradiance was reduced to 10 % (z10%) shallowed significantly during May along with falling maximum water depth (z10% = 0.75 * zmax - 0.12; r2: 0.39, P < 0.001) because falling water depth led to the canopy of the charophyte vegetation being closer to the pond surface. The pond water itself is highly transparent with light attenuation coefficients of only about 0.5 m-1. The steep reduction of irradiance with water depth is due to charophytes having high areal biomasses of 642-773 g DW m-2 in March-May. Biomass density per unit volume was 2275-2569 g DW m-3 in March-May corresponding to biomass specific light attenuation coefficients of 6-10 m-1 (kg DW m-3)-1 after correcting for background light attenuation in the water. Surface fluxes The pond heated up throughout the period with consistently positive daily accumulated Qtot values (Fig. 4). Net incoming solar radiation followed the expected diurnal cycle. Reflected short-wave radiation was greatest during mornings and 40 evenings, even though the incoming radiation was low at this time, as the low angle of the incident light resulted in a large fraction being reflected (Fig. 4). The net longwave radiation (with positive values indicating heating i.e. Qlin - Qlout), being dependent on both outgoing and incoming long-wave radiation and therefore dependent on air temperature, water temperature, relative humidity and cloud cover showed a relatively complex diel cycle, but one that did not change greatly between day and night. Both latent and sensible heat fluxes (where positive values indicate cooling), however, had dramatic diel cycles with much greater cooling during the day, driven by the large increases in wind speed and water temperature and the marked day-time reduction in relative humidity (Figs. 4 and S2). As the wind energy flux is proportional to the cube of the wind speed it was far greater during the day than the night (Fig. 4). Transfer coefficients The transfer coefficients for latent heat, referenced to 10 m, CE10, ranged between 0.7x10⁻³ and 4.4x10⁻³, with an average of 2.13xI0-3, while the drag coefficients, referenced to 10 m, CD10, generally had lower maximum and average values but the same minimum, ranging between 0.7x10⁻³ and 3.2x10⁻³, with an average of 1.76x10⁻³. Throughout the period CD10 was 17.6 % lower than CE10 (Fig. S3). Both transfer functions dropped at midday to 45-66 % of the maximum nocturnal values and both were slightly higher in May than in April. A few exceptional measuring points lead to March standing out as very different from the other two months because a hail and snow storm passed the site in two of the measuring days greatly affecting the atmospheric stability (Fig. 5). Stratification The RTRM did not exceed the threshold value for stratification of 50 in March, and RTRM was only above 50 once in the first half of April (Fig. 6). For the last half of April and all of May the RTRM exceeded the threshold every day, except for six particularly cold and windy days. The RTRM dropped to negative values almost 41 every night. In May the RTRM exceeded 50 around 9 am, peaked early in the afternoon at 200 and stayed above 50 until 8 pm. While the RTRM exceeded 50 in May, the mixed depth was reduced to 25 % of the water column during the day but the pond was fully mixed every night (Fig. 7). Although the RTRM did not exceed 50 in March, day-time surface temperatures were regularly a few degrees higher than bottom temperatures (Figs 8 & 9) and calculations showed that the mixed depth did not remain at 100 % of the water column throughout the day, but dropped to 87 % of the water column around midday. The temperature differences between surface and bottom waters exceeded 15 °C on some warm days in late May (Fig. 8). Surface waters were consistently colder than bottom waters at night. Isopleth plots of temperature clearly showed daily stratification and nocturnal cooling (Fig. 9), weak or no stratification in late March, stratification on most days in late April and strong stratification on most days in late May. Regardless of the strength of stratification the water column was fully mixed every night. Discussion Daily stratification Daytime stratification and nocturnal mixing were recurring phenomena in this small and densely vegetated pond on the open alvar. The mixed depth during daytime was below 100 % of the water column for all three months, but at 100 % every night and there was a distinct temperature decline from surface to bottom waters during the day with a reversal during the night. From mid-April to the end of May the cycle was profound; relative thermal resistance to mixing (RTRM) was above the threshold value of 50 during most of these days and the daytime temperature gradients rose to over 15 °C in less than half a meter of water. The strength of the diel stratification typically peaked around midday despite the wind speed also peaking then, clearly demonstrating that wind-induced mixing was not sufficient to fully mix the pond. This consistent pattern developed despite the shallow water and the wind-exposed location. Calculations of reduced mixed depth during the day throughout the period, 42 even on days when RTRM was below 50, suggest that the suggested threshold value for stratification at RTRM > 50 is too large, at least in shallow systems. Gorham and Boyce (1989) derived an empirical equation for determining which lakes will typically stratify based on their length (L), approximated as the square root of the surface area, and their depth (H): H = 0.34L0.5; a lake would not be expected to stratify unless its actual depth was greater than H predicted by this equation. Although both surface area and depth varied in the pond in this study, by this estimate the pond would always be significantly shallower than the expected depth, at least 1.7 m, necessary for stratification. Indeed, the implication of this empirical fit is that any pond less than a meter deep would have to have a smaller surface area than 75 m2 in order to be likely to stratify. While this equation is only an approximation, nevertheless it is indicative that, a priori, ponds of the size studied here might not be expected to stratify, particularly if situated in an exposed location. This is reiterated by Branco and Torgersen (2009) who also found that it was unlikely for a small wind-exposed pond to stratify. Gorham and Boyce (1989) and Branco and Torgersen (2009) worked with lakes with no macrophyte cover, and indeed in the pelagic of larger lakes macrophytes are of little or no influence. However, in the littoral zone or in small ponds macrophytes can enhance light attenuation, increase surface warming and reduce vertical mixing to a large extent. It has been well documented that an increase in light attenuation, by affecting the depths at which incoming solar radiation is absorbed, can substantially reduce mixed depths and increase stratification (e.g. Kling 1988, Persson & Jones 2008, Gaiser et al. 2009). Lake studies have documented that submerged macrophyte beds can increase temperature stratification by strong light absorption (Dale & Gillespie 1977). In the present study high density of charophytes through most of the water column was, no doubt, a key to the development of strong density gradients and restriction of the mixed layer to the uppermost part of the water column during the day. 43 Incident irradiance only penetrated a few centimeters into the charophyte canopy. The depth at which 10 % of surface irradiance is left then makes a proper estimation of the depth of the upper canopy. During May, when continuous irradiance data were available, the thermocline depth was just 0-9 cm (average 5 cm) into the charophyte canopy (Fig. 3). Dense charophyte vegetation resulted in a very uneven distribution of incoming short-wave energy throughout the water column as almost all the energy was absorbed in the upper 3-cm of the vegetation. These findings accord with model predictions and empirical comparisons of temperature dynamics between macrophyte beds and open water locations by Herb and Stefan (2005a, b). Falling water depth throughout May brought the upper part of the charophyte canopy and the main attenuation of short-wave energy closer to the surface and, thereby, further inhibited wind-induced mixing and reduced the mixed layer depth. As the pond stratified all of the incoming heat would be confined to the mixed layer and additionally stabilize the water column. Strong reduction of local flow velocities within dense macrophyte stands and restriction of strong turbulence to the upper few cm of the canopy have been documented in shallow streams (Sand-Jensen & Mebus 1996, Sand‐ Jensen & Pedersen 1999). Effective dampening of local flow and turbulence by macrophyte beds can also account for their ability to reduce mixing and thus stimulate particle sedimentation and reduce resuspension (Barko & James 1998, Sand‐ Jensen 1998, Vermaat et al. 2000). It is therefore likely that the macrophytes influenced the mixing processes both through light attenuation and by inhibition of mechanical mixing. Nocturnal mixing The regular pattern of daytime stratification and nighttime mixing was driven by the pronounced diel cycle in the heat fluxes and wind mixing. Solar and atmospheric long-wave radiation heated the pond during the day, but the shallowness of the mixed layer enabled surface temperatures to climb rapidly, promoting significant cooling through outward long-wave and turbulent heat loss. Although winds calmed 44 markedly during the night, the temperature differential between water and air was still sufficiently high to allow significant cooling to take place each night. The heat loss cooled surface waters down to 1-5 °C below bottom waters temperatures and produced an unstable water density profile resulting in penetrative convective mixing (Imberger 1985) to the sediment surface. Whilst the wind energy flux would also have some impact, it was an order of magnitude lower at night than during the day (Fig. 4g), emphasizing the importance of the nocturnal cooling. The dominance of the nocturnal cooling was in line with Read et al. (2012) who showed that for small lakes penetrative cooling frequently generates more surface turbulence than wind shear. High densities of submerged macrophytes have relatively little influence on mixing processes by natural convection caused by surface cooling (Herb & Stefan 2005b). Natural convection carries potential energy down from the surface via plunging thermals and although submerged macrophyte surfaces may reduce the kinetic energy generated by the plunging downward flow, the mixing depth is not greatly influenced (Herb & Stefan 2005b). The sinking plumes imply the existence of coherent rising plumes because of the continuity of mass, and the surface layer is subject to intense stirring (Imboden & Wüest 1995). According to Deardorff et al. (1969) and Wüest (1987), sinking water parcels still have part of their kinetic energy left (e.g. 30%) when they reach the bottom of the mixed layer and can, therefore, penetrate the density gradient and push heavier water from below into the mixed layer leading to its deepening. This situation is very different from the influence of macrophytes on turbulence induced by wind shear on the water surface which must penetrate the canopy from above via undirected isotropic eddies which are effectively dissipated by contact with macrophyte surfaces (Sand‐ Jensen & Pedersen 1999, Herb & Stefan 2005b). Because the energy of sinking plumes is more directed than that of windinduced mixing, plumes generated by surface cooling generally have greater mixing efficiency (Imboden & Wüest 1995). 45 A further impact of the temperature increases associated with heating being concentrated in a shallow surface layer was for there to be a strongly unstable atmosphere above the pond. This resulted in transfer coefficients being higher than often reported (see Verburg & Antenucci 2010), which, in turn, contributed to increased wind mixing and turbulent heat loss. The transfer coefficients, CD10 and CE10, were also around 25 % higher during the night than the day (Fig.5), owing to the low nocturnal wind speeds, unstable atmospheric conditions and smooth flow conditions (see Verburg & Antenucci, 2010). This nighttime increase in transfer coefficients was a further factor driving the nocturnal mixing processes. Implications of stratification-mixing patterns The dynamics of vertical mixing is crucial because of its overriding impact on physical, chemical and biological conditions (Branco et al. 2005). The recurring daytime stratification and nighttime mixing is not unique for the shallow open ponds with dense charophyte vegetation studied here. It can also develop in the littoral zone with submerged vegetation of large lakes (Herb & Stefan 2005a, Herb & Stefan 2005b, Coates & Folkard 2009) as well as in small, wind-protected lakes devoid of submerged macrophytes where dense growth of phytoplankton or humic water lead to strong vertical light attenuation and surface warming (Gu et al. 1996, Ford et al. 2002, Song et al. 2013). Temperature itself is a key variable for the distribution and metabolic activity of all organisms. In our study pond, sessile organisms and macrophytes were exposed to diel temperature amplitudes of 1.9°C-18.9°C in the surface waters and 0.5°C-6.1°C in the bottom waters between late March and the end of May. This highly variable environment is both a challenge to survival and a trigger of highly variable metabolic rates with time. Assuming that only the temperature range of 17.0 °C influences metabolism, then for typical Q10-values of 1.5-3 metabolic rates can be expected to change between 2 and 8-fold. 46 The diurnal stratification and mixing of the shallow lakes and ponds are accompanied by profound vertical dynamics of pH, oxygen, nutrients and redox potentials (Gu et al. 1996, Ford et al. 2002, Branco et al. 2005, Song et al. 2013). In our study pond, for example, daytime stratification is accompanied by anoxia and accumulation of CO2, sulphide and reduced ferrous-Fe in the lower 10 cm of the water column, while oxygen reappears and sulphide and ferrous-Fe disappear in the bottom waters during nocturnal mixing (Andersen et al. 2015). Macrophytes and the sessile fauna in the sediment and in the lower part of the water column do not only have to withstand profound diel temperature excursions but also alternating oxicanoxic and oxidized-reduced conditions. Small water bodies are far more common world-wide than the iconic, charismatic lakes often studied (Downing et al. 2006). Their temperature, mixing, and stratification dynamics, which drive the lake ecology, are therefore of great interest; a huge number of them will have complex thermal patterns resulting in very dynamic stratification and mixing mechanisms as documented here. A priori, it is not obvious that a pond, such as the one studied here, should stratify at all. Almost certainly this regular diel stratification is promoted by the macrophyte presence both influencing the vertical absorption of solar radiation and the mechanical mixing within the pond. The macrophytes are thereby profoundly influencing their own environment. References Andersen, M. R., Kragh, T., and Sand-Jensen, K. 2015. Recurring stratification and mixing generate extreme diurnal oxygen and carbon cycles in shallow vegetated lakes. in prep. Barko, J. W., and James, W. F. 1998. Effects of submerged aquatic macrophytes on nutrient dynamics, sedimentation, and resuspension. In: E. Jeppesen, M. Sondergaard, M. Sondergaard and K. Christoffersen (eds.). The structuring role of submerged macrophytes in lakes. Springer, New York. 423 p. : 197-214. Bastviken, D., Tranvik, L. J., Downing, J. A., Crill, P. M., and Enrich-Prast, A. 2011. Freshwater methane emissions offset the continental carbon sink. Science 331:50-50. Bigg, P. 1967. Density of water in SI units over the range 0-40 C. British Journal of Applied Physics 18:521. Boehrer, B., and Schultze, M. 2008. Stratification of lakes. Reviews of Geophysics 46. 47 Branco, B., Torgersen, T., Bean, J. R., Grenier, G., and Arbige, D. 2005. A new water column profiler for shallow aquatic systems. Limnology and Oceanography: Methods 3:190-202. Branco, B. F., and Torgersen, T. 2009. Predicting the onset of thermal stratification in shallow inland waterbodies. Aquatic Sciences-Research Across Boundaries 71:65-79. Christensen, J. P. A., Sand-Jensen, K., and Staehr, P. A. 2013. Fluctuating water levels control water chemistry and metabolism of a charophyte-dominated pond. Freshwater Biology 58:1353-1365. Coates, M. J., and Folkard, A. M. 2009. The effects of littoral zone vegetation on turbulent mixing in lakes. Ecological Modelling 220:2714-2726. Coloso, J. J., Cole, J. J., and Pace, M. L. 2011. Short-term variation in thermal stratification complicates estimation of lake metabolism. Aquatic Sciences 73:305-315. Crawford, T. M., and Duchon, C. E. 1999. An improved parameterization for estimating effective atmospheric emissivity for use in calculating daytime downwelling longwave radiation. Journal of Applied Meteorology 38:474-480. Dale, H., and Gillespie, T. 1977. The influence of submersed aquatic plants on temperature gradients in shallow water bodies. Canadian Journal of Botany 55:2216-2225. Deardorff, J. W., Willis, G. E., and Lilly, D. K. 1969. Laboratory investigation of non-steady penetrative convection. Journal of Fluid Mechanics 35:7-31. Downing, J., Prairie, Y., Cole, J., Duarte, C., Tranvik, L., Striegl, R., McDowell, W., Kortelainen, P., Caraco, N., and Melack, J. 2006. The global abundance and size distribution of lakes, ponds, and impoundments. Limnology and Oceanography 51:2388-2397. Folkard, A. M., Sherborne, A. J., and Coates, M. J. 2007. Turbulence and stratification in Priest Pot, a productive pond in a sheltered environment. Limnology 8:113-120. Ford, P. W., Boon, P. I., and Lee, K. 2002. Methane and oxygen dynamics in a shallow floodplain lake: the significance of periodic stratification. Hydrobiologia 485:97-110. Gaiser, E. E., Deyrup, N. D., Bachmann, R. W., Battoe, L. E., and Swain, H. M. 2009. Effects of climate variability on transparency and thermal structure in subtropical, monomictic Lake Annie, Florida. Fundamental and Applied Limnology/Archiv für Hydrobiologie 175:217-230. Gorham, E., and Boyce, F. M. 1989. Influence of lake surface area and depth upon thermal stratification and the depth of the summer thermocline. Journal of Great Lakes Research 15:233-245. Gu, R., Luck, F. N., and Stefan, H. G. 1996. Water Quality Stratification In Shallow Wastewater Stabilization Ponds. Wiley Online Library. Herb, W. R., and Stefan, H. G. 2005a. Dynamics of vertical mixing in a shallow lake with submersed macrophytes. Water Resources Research 41. Herb, W. R., and Stefan, H. G. 2005b. Model for wind-driven vertical mixing in a shallow lake with submersed macrophytes. Journal of Hydraulic Engineering 131:488-496. Imberger, J. 1985. The diurnal mixed layer. Limnology Oceanography 30:737-770. Imberger, J., and Hamblin, P. 1982. Dynamics of lakes, reservoirs, and cooling ponds. Annual Review of Fluid Mechanics 14:153-187. Imboden, D. M., and Wüest, A. 1995. Mixing mechanisms in lakes. Pages 83-138. Physics and Chemistry of Lakes. Springer. Kling, G. W. 1988. Comparative transparency, depth of mixing, and stability of stratification in lakes of Cameroon, West Africa. Limnology and Oceanography 33:27-40. Lofgren, B. M., and Zhu, Y. 2000. Surface energy fluxes on the Great Lakes based on satellite-observed surface temperatures 1992 to 1995. Journal of Great Lakes Research 26:305-314. Persson, I., and Jones, I. D. 2008. The effect of water colour on lake hydrodynamics: A modelling study. Freshwater Biology 53:2345-2355. Read, J. S., Hamilton, D. P., Desai, A. R., Rose, K. C., MacIntyre, S., Lenters, J. D., Smyth, R. L., Hanson, P. C., Cole, J. J., and Staehr, P. A. 2012. Lake‐size dependency of wind shear and convection as controls on gas exchange. Geophysical Research Letters 39. 48 Read, J. S., and Rose, K. C. 2013. Physical responses of small temperate lakes to variation in dissolved organic carbon concentrations. Limnology and Oceanography 58:921-931. Sand-Jensen, K., Baastrup-Spohr, L., Winkel, A., Møller, C. L., Borum, J., and Brodersen, K. P. 2010. Ett kalkbrott på Ölands alvar. Svensk Botanisk Tidskrift 104:23-30. Sand-Jensen, K., and Jespersen, T. S. 2012. Tolerance of the widespread cyanobacterium Nostoc commune to extreme temperature variations (-269 to 105 degrees C), pH and salt stress. Oecologia 169:331-339. Sand-Jensen, K., and Mebus, J. R. 1996. Fine-scale patterns of water velocity within macrophyte patches in streams. Oikos:169-180. Sand‐Jensen, K. 1998. Influence of submerged macrophytes on sediment composition and near‐bed flow in lowland streams. Freshwater Biology 39:663-679. Sand‐Jensen, K., and Pedersen, O. 1999. Velocity gradients and turbulence around macrophyte stands in streams. Freshwater Biology 42:315-328. SMHI 2013. Swedish Meteorological and Hydrological Institute. http://www.smhi.se/klimatdata/meteorologi/temperatur/dataserier-med-normalvarden-1.7354. Song, K., Xenopoulos, M. A., Buttle, J. M., Marsalek, J., Wagner, N. D., Pick, F. R., and Frost, P. C. 2013. Thermal stratification patterns in urban ponds and their relationships with vertical nutrient gradients. Journal of Environmental Management 127:317-323. Staehr, P. A., Bade, D., Van de Bogert, M. C., Koch, G. R., Williamson, C., Hanson, P., Cole, J. J., and Kratz, T. 2010. Lake metabolism and the diel oxygen technique: State of the science. Limnology and Oceanography: Methods 8:628-644. Vad, C. F., Horvath, Z., Kiss, K. T., Toth, B., Pentek, A. L., and Acs, E. 2013. Vertical distribution of zooplankton in a shallow peatland pond: the limiting role of dissolved oxygen. Annales de LimnologieInternational Journal of Limnology 49:275-285. Verburg, P., and Antenucci, J. P. 2010. Persistent unstable atmospheric boundary layer enhances sensible and latent heat loss in a tropical great lake: Lake Tanganyika. Journal of Geophysical Research: Atmospheres (1984–2012) 115. Vermaat, J. E., Santamaria, L., and Roos, P. J. 2000. Water flow across and sediment trapping in submerged macrophyte beds of contrasting growth form. Archiv für Hydrobiologie 148:549-562. Wetzel, R. 2001. Limnology, lake and river ecosystems. Academic. San Diego. Woolway, R. I., Jones, I. D., Hamilton, D. P., Maberly, S. C., Muraoka, K., Read, J. S., Smyth, R. L., and Winslow, L. A. 2015. Automated calculation of surface energy fluxes with high-frequency lake buoy data. Environmental Modelling & Software 70:191-198. Wüest, A. 1987. Ursprung und Grösse von Mischungsprozessen im Hypolimnion natürlicher Seen. Diss. Naturwiss. ETH Zürich, Nr. 8350, 1987. Wüest, A., Piepke, G., and Van Senden, D. C. 2000. Turbulent kinetic energy balance as a tool for estimating vertical diffusivity in wind‐forced stratified waters. Limnology and Oceanography 45:1388-1400. Zeng, X., Zhao, M., and Dickinson, R. E. 1998. Intercomparison of bulk aerodynamic algorithms for the computation of sea surface fluxes using TOGA COARE and TAO data. Journal of Climate 11:2628-2644. Figure legends. Figure 1. Surface irradiance (a), air temperature (b), relative humidity (c) and wind speed (d) measured next to the pond at 2.0 m above ground level during the investigation. 49 Figure 2. Diel averages of wind speed (a), surface irradiance (b), air temperature (c), relative humidity (d) and surface water temperature (e) for March (blue line), April (green line) and May (red line). Figure 3. Daily mean light attenuation coefficients in the pond from immediately below the surface to 8 cm above the sediment surface (dotted line), daily mean depth to which 10 % of subsurface light remains (white surface) and daily mean focal depth of the thermocline (full line). The sediment surface is shown in black. Figure 4. Diel averages of incoming short-wave radiation (a), reflected short-wave radiation (b), net long-wave radiation (c), latent heat flux (d), sensible heat flux (e),total heat flux (f) and wind energy flux (g) for March (blue line), April (green line) and May (red line). Figure 5. Diel averages of transfer coefficients (dimensionless) for March (blue line), April (green line) and May (red line). CD10 (a) and CE10 (b). Figure 6. Relative thermal resistance to mixing (RTRM) calculated during the investigation. Threshold value for onset of stratification (RTRM = 50) and no relative thermal resistance to mixing (RTRM = 0) shown as dotted lines. Figure 7. Diel averages of relative thermal resistance to mixing (RTRM) (a) and mixed depth (percentage of the water column) (b) for March (blue line), April (green line) and May (red line). Figure 8 Surface water temperature (dashed line) and bottom water temperature (bold line) in the pond during the investigation. 50 Figure 9 Daily time course of water temperature with depth in the pond during 5 days in late March, April and May based on measurements at 5-cm depth intervals every 10 minutes. The white area (25th May) marks a period when sensors were retrieved and redeployed. Supplementary figure legends Figure S1. Temporal changes in surface area (dashed line) and water volume of the pond (full line; upper panel) and maximum water depth (dotted line) and precipitation (columns; lower panel). Figure S2. Heat fluxes calculated during the investigation. Incoming short-wave radiation (a), reflected short-wave radiation (b), net long-wave radiation (c), latent heat flux (d), sensible heat flux (e) and total heat flux (f). Figure S3. Transfer coefficients (dimensionless) calculated during the investigation. CD10 (top panel) and CE10 (bottom panel). 51 Wind speed (m s -1) Relative humidity (%) Air temperature ( C) PAR (µmol m-2 s-1) Figures Figure 1 3000 25 80 a 2000 1000 0 b 20 15 10 5 -5 0 60 c 40 20 0 d 6 4 2 0 March April May 52 Figure 2 2 1 0 00 03 06 09 12 15 18 21 1000 500 0 00 24 20 b Air temp. (C) 1500 a PAR (µmol m-2 s-1) Wind speed (m s -1) 3 03 06 25 d Surf. water temp. (°C) Relative humidity (%) 100 90 80 70 60 50 00 03 06 09 12 15 Time of Day 09 12 15 18 21 24 Time of Day Time of Day 18 21 24 c 15 10 5 0 00 03 06 09 12 15 18 21 24 Time of Day e 20 15 10 5 0 00 03 06 09 12 15 18 21 24 Time of Day Figure 3 53 Figure 4 600 400 0 b Qlnet (W m -2) 60 a Qsr (W m -2) Qsin (W m -2) 800 40 20 200 0 00 03 06 09 12 15 18 21 0 00 24 03 06 Time of Day 15 18 21 -150 00 24 100 06 09 12 15 06 18 21 24 12 15 18 21 24 18 21 24 f 30 20 0 00 09 600 10 03 03 Time of Day Qtot (W m -2) 150 0 00 -100 e Qh (W m -2) Qe (W m -2) d 50 03 06 09 12 15 18 21 400 200 0 -200 00 24 03 Time of Day Time of Day Wind mixing (W m -2) 12 -50 Time of Day 40 200 0.25 09 c 06 09 12 15 Time of Day g 0.20 0.15 0.10 0.05 0.00 00 03 06 09 12 15 18 21 24 Time of Day Figure 5 0.004 0.004 a 0.003 CE10 CD10 0.003 0.002 0.001 0.000 00 b 0.002 0.001 03 06 09 12 15 Time of Day 18 21 24 0.000 00 03 06 09 12 15 18 21 24 Time of Day 54 Figure 6 500 RTRM 400 300 200 100 50 0 -100 March April May Figure 7 250 100 a Mixed depth (%) 200 RTRM 150 100 50 0 -50 00 03 06 09 12 15 Time of Day 18 21 24 b 50 0 00 03 06 09 12 15 18 21 24 Time of Day Water temperature (C) Figure 8 35 30 25 20 15 10 5 0 March April May 55 Figure 9 26-30 March 22-26 April 23-27 May 56 Supplementary figures 500 1100 400 1000 900 300 800 200 700 100 600 0 500 Max depth (m) 16 0.5 0.4 12 0.3 8 0.2 4 0.1 0.0 March April May Precipitation (mm day -1) 0.6 Surface area (m2) Volume (m3) Figure S1 0 57 Figure S2 1500 Qsin (W m -2) a 1000 500 0 Qsr (W m -2) 100 b 50 0 Qlnet (W m -2) 0 c -50 -100 -150 -200 Qe (W m -2) 400 d 300 200 100 0 Qh (W m -2) 80 e 60 40 20 0 -10 Qtot (W m -2) 1200 f 800 400 0 -400 March April May 58 Figure S3 0.004 CD10 0.003 0.002 0.001 0.000 CE10 0.004 0.003 0.002 0.001 0.000 March April May 59 Paper 2 - Recurring stratification and mixing generate extreme diurnal oxygen and carbon cycles in shallow vegetated lakes 60 Recurring stratification and mixing generate extreme diurnal oxygen and carbon cycles in shallow vegetated lakes Mikkel Rene Andersen, Theis Kragh and Kaj Sand-Jensen Freshwater Biological Laboratory, Biological Institute, University of Copenhagen, Universitetsparken 4, DK-2100 Copenhagen Denmark Target Journal: Nature Communications Environmental conditions in small lakes (< 1 ha) have been grossly understudied although they globally exist in millions and are several-fold more abundant than larger lakes1,2. Vertical stratification-mixing patterns are main determinants of biogeochemistry and metabolism of organisms3, but small, shallow lakes have usually been assumed to be homogeneously mixed, though with little justification4. Here we show that a small, wind-exposed, shallow (ca 0.4 m) lake with submerged macrophytes underwent recurring daytime stratification and nocturnal mixing during summer accompanied by extreme variations in temperature, oxygen, pH and inorganic carbon with time and depth. During daytime stratification, surface waters attained 230 % oxygen saturation and strong CO2 depletion (<10 % air saturation), while 6-14 oC colder bottom waters developed anoxia and accumulated reduced iron, sulphide and >1500 % CO2 saturation. High daytime pH in surface waters induced carbonate precipitation releasing CO2 for ongoing photosynthesis without further pH rise, while most precipitated CaCO3 was re-dissolved in bottom waters. Vertical gradients disappeared during nocturnal mixing injecting oxygen into bottom waters for aerobic respiration and regenerated inorganic carbon into surface waters for 61 photosynthesis. These processes add new dimensions to our understanding of the regulation of ecosystem photosynthesis and respiration and the adaptation of sessile plants and mobile animals to the extreme variability of environmental stressors. Turbulent mixing of the water column in shallow lakes is expected to prevent formation of vertical gradients of temperature, oxygen and solutes. Hydraulic models predict that small, wind-exposed temperate lakes (1000 m2) should be deeper than 3 m to become vertically stratified5. While no vertical gradients are expected to form, intense daytime photosynthesis and nocturnal respiration may generate profound diurnal cycles of temperature and solutes6,7. It was, therefore, unexpected that a 0.4 m-deep lake underwent strong temperature stratification during daytime and nocturnal mixing. Here we show that recurring stratification and mixing, because of the presence of submerged macrophytes, generate extreme vertical and diurnal cycles of pH, inorganic carbon and oxygen - including anoxia and reducing conditions in bottom waters during daytime and oxic conditions at night. This overlooked dynamics should be common in small vegetated lakes and within macrophyte beds in large lakes and adds new dimensions to our understanding of biogeochemical cycles, macrophyte adaptation and animal behavior. We recently discovered an unexpected behavior of the great pond snail (Lymnaea stagnalis) in shallow lakes dominated by characean macroalgae during summer in open south-Swedish habitats8. The snails concentrated in surface waters before noon to ventilate the vascularized lung with atmospheric air as if they rapidly needed to recover from a threatening oxygen debt. A similar behavior has been described for dragonfly larvae actively ventilating the gills in the rectum with 62 atmospheric air9. Oxygen concentrations were high in the surface waters before noon8 and it was unclear where the snails had developed the suggested oxygen debt that led to their awkward behavior and risky exposure to predators. The environmental conditions should be highly variable considering the high macrophyte density in the shallow water. To document the conditions, we measured light, temperature, oxygen, pH and conductivity at high vertical resolution in one of the shallow lakes during weeks in May and August along with meteorological parameters. During a diurnal cycle, we also determined the vertical distribution of dissolved inorganic nutrients, sulphide, ferrous iron, calcium, total (DIC) and individual carbon species (i.e., DIC = CO2 + HCO3- + CO32-) closely linked to photosynthesis and respiration. Acid neutralizing capacity (ANC = HCO3- + 2 CO32- + OH- - H+) was measured directly during the diurnal cycle and was calculated from conductivity during longer periods because HCO3- is the main determinant of ANC and the dominant anion is closely linearly related to conductivity (Suppl. Fig. S1). The shallow lake developed strong daytime vertical stratification of temperature and specific density on four days during the week in May (Fig. 1) and all examined days in August (Fig. 2). No vertical stratification formed on two cold windy days in May (Fig. 1). At night, the water column was always fully mixed. Maximum daytime differences between temperatures in surface and bottom waters on days with vertical stratification were 11.2-14.4oC in May and 6.2-8.9oC in August (Suppl. table S1). The steepest vertical temperature gradient (0.3-1.9oC cm-1) formed at 14.5-18.5-cm depth in May and 15.9-22.5-cm in August. This exceptionally strong daytime vertical stratification can be explained by the dense charophyte vegetation (5685-11340 g fresh weight m-3) reaching up to from the bottom to a few cm below the water surface and effectively attenuating both the radiative heat flux and the turbulent wind-driven mixing with depth. Thus, 90% of the daytime radiative heat flux was absorbed within the upper 11-cm of water column in May (Suppl. table. S2). The lake water was transparent and the vegetation was responsible for most (98%) of 63 the vertical light attenuation. Water turbulence generated by wind shear on the lake surface must penetrate the macrophyte canopy from above via undirected isotropic eddies which are effectively dissipated by contact with macrophyte surfaces10,11, thereby, preventing full mixing. On two cold and windy days in May turbulence was sufficiently strong to disrupt the formation of vertical temperature stratification. At night, cooling of surface waters to 0.1-4.1 oC below bottom temperatures produced inverse unstable water density profiles resulting in penetrative convective mixing of the entire shallow water column. Submerged macrophytes, even of high density, have relative little influence on convective mixing caused by surface cooling12. Natural convection carries potential energy down from the surface via directed plunging thermals and although submerged macrophyte surfaces may reduce the kinetic energy generated by the plunging downward flow, the mixing depth is not greatly influenced10,11. The sinking plumes induce coherent rising plumes because of the continuity of mass resulting in intense mixing13. Because the daytime heat flux is absorbed within a very thin surface layer it becomes markedly warmer than the air (Suppl. Fig. S2) and is cooled that more strongly during the evening and night inducing effective convective mixing. Alternating daytime stratification and nocturnal mixing and steep vertical attenuation of photosynthetic irradiance can account for the astonishing vertical and temporal dynamics of oxygen, pH, ANC and inorganic carbon species (Figs 1 and 2). Oxygen and pH in surface waters (2, 9 and 16 cm) followed the same diurnal course on six days in May according to the balance between photosynthesis and respiration. Maximum values (205-235 % O2 saturation, pH 9.1-9.6) were recorded in the early afternoon and minimum values (12-25 % O2 saturation, pH 7.1-8.0) shortly after sunrise. The lowest oxygen concentrations at sunrise were observed after warm nights because nocturnal respiration increased with temperature14. During vertical mixing, oxygen and pH at 23 cm below the water surface followed the same pattern as at the surface. During stratification, in contrast, oxygen dropped to zero and pH to 64 7.0-7.5 at 23 cm water depth because of respiratory oxygen consumption and CO2 release. Intermittent vertical stratification (at noon, May 28) led to immediate decline of oxygen and pH showing that respiration was much higher than photosynthesis at this depth. Continued photosynthesis and rising pH in the surface waters from morning to afternoon were accompanied by falling DIC, ANC and free CO2 and increasing CO32- as a result of coupled photosynthesis and calcification (i.e., Ca2+ + 2 HCO3-→ CaCO3 (precipitated) + CO2 (assimilated)15. The decline of ANC in surface waters could either be due to CaCO3 precipitating directly on charophyte surfaces coupled to photosynthesis and/or to formation and sinking of minute calcite crystals in the water because of high pH and CO32- (i.e. HCO3- + OH-→ CO32-)16. The calcite saturation index, representing the ionic molar product of Ca2+ and CO32- relative to the solubility product at ambient temperature3,16, was high in the afternoon on all days (i.e. >10) and should promote calcite formation (Fig. 2). Daytime loss of ANC in surface waters was apparently due to precipitation and sinking of calcite crystals which were re-dissolved in bottom waters because of high CO2 concentrations resulting in accumulation of DIC and ANC until vertical mixing in the evening and at night. This interpretation was supported by measurements of diurnal cycles and vertical chemical profiles (Fig. 3). Diurnal cycles resembled each other very closely during all examined days in August (Fig. 2). Following minimum oxygen concentrations at all depths shortly after sunrise, oxygen concentration rapidly increased in surface waters as temperature stratification was established, while oxygen simultaneously declined in bottom waters turning fully anoxic around midday and staying anoxic for the next 12 hours until midnight before effective convective mixing generated homogeneous physico-chemical conditions again. Surface water pH was also lowest (about 8) shortly after sunrise and highest (9.4-9.6) in the afternoon after many hours of photosynthesis and was accompanied by DIC and ANC decline, drop of CO2 to 65 almost zero and increase of CO32-. Daytime loss of ANC in surface waters caused by CaCO3 precipitation averaged 0.57 meq L-1 on five consecutive days, but 0.51 meq L(90%) had returned to surface waters on the next day following vertical mixing because most CaCO3 precipitated from surface waters during daytime photosynthesis was solubilized in bottom waters with low pH and excess CO2. This interpretation of carbon dynamics was confirmed by direct analyses of the vertical distribution of ANC and Ca2+ during a full diurnal cycle (Fig. 3). Daytime decline of ANC and Ca2+ in surface waters by calcification was accompanied by increasing concentrations in bottom waters by carbonate dissolution. The latter process continued throughout the night giving rise to increasing concentrations of ANC, Ca2+ and DIC in the water column until photosynthesis picked up after sunrise. These tightly coupled vertical and diurnal cycles of precipitation and dissolution of carbonates have not been disclosed before. The implications are very important because daily calcification delivers protons and ensures conversion of HCO3- to free CO2 for continued photosynthesis preventing pH to rise to strongly inhibiting levels (i.e., Ca2+ + 2 HCO3-→ CaCO3 + CO2)8,15, while direct HCO3- use without calcification leads to release of OH- and continued pH rise (HCO3- → CO2 + OH-)17. The daytime net decline of DIC in surface waters averaged 0.77 mM, and 0.48 mM of this amount represented direct uptake and 0.29 mM represented CO2 use coupled with CaCO3 precipitation of the same magnitude. Most of the daytime decline of the DIC pool (91%) was restored by respiration and carbonate dissolution before the next morning. Sediment incubations confirmed this pattern showing the release of two moles of DIC for every mole of O2 consumed in the process, because of concomitant respiration and CaCO3 dissolution (org. C + O2 + CaCO3 → Ca2+ + H2O + 2HCO3-, Sand-Jensen, Petersen, Kragh & Andersen pers. comm.). The contrast to deeper lakes is stunning. In deep lakes temperature stratification is permanent during several summer months with surface waters 66 gradually being depleted and bottom waters gradually enriched in DIC, ANC and Ca2+ 16,18. The injection of these soluble substances are delayed until autumn overturn after light has become limiting to photosynthesis thereby preventing the stimulation of photosynthesis that takes place daily by nocturnal mixing in the shallow lake. Anoxic conditions in bottom waters after midday on days of vertical temperature stratification had further consequences (Fig. 3). During anoxia, sulphide and ferrous iron accumulated because of reduction of sulphate and ferric iron served as electron acceptors during anaerobic respiration19. Sulphide accumulation in bottoms waters was small, while accumulation of ferrous iron was larger and continued throughout the stratification period showing that ferric iron was a more important electron acceptor than sulphate during anoxia. Sulphide and ferrous iron were re-oxidized following vertical mixing when oxygen was reintroduced to the bottom waters. Ammonium accumulated to a small extent in the bottom waters during temperature stratification, while concentrations of nitrate and phosphate remained close to the limits of detection (< 0.3 µM, data not shown) stressing the oligotrophic nature of the calcareous lake. This study adds new dimensions to the understanding of environmental conditions and biogeochemistry in shallow vegetated lakes, in that recurring vertical stratification during daytime and nocturnal mixing generated unexpected and profound diurnal cycles of oxygen, pH and inorganic carbon species. Shallow lakes in open habitats have hitherto been considered to be permanently mixed and if profound oxygen depletion developed it was confined to heavily organically polluted lakes and to nocturnal periods during degradation of algal blooms in hypereutrophic lakes2,3. Our study showed that temperature stratification and mixing were recurring diurnal phenomena during summer in a shallow vegetated lake because dense charophyte stands strongly attenuated depth penetration of light and wind-driven turbulence during the day, while surface cooling at night induced penetrative convective mixing. Daytime decoupling between photosynthesis at high irradiance in 67 the upper canopy and respiration in darkness in the lower canopy generated oxygen accumulation and DIC depletion in surface waters and anoxia and DIC accumulation in bottom waters, while nocturnal mixing injected regenerated DIC for photosynthesis in surface waters and oxygen for oxygenic respiration in bottom waters. If regenerated DIC had been trapped in stagnant bottom water, charophyte photosynthesis would become severely constrained. Despite the oligotrophic environment and low growth rates typical of charophytes20, profound diurnal cycles of oxygen, pH and DIC, nonetheless, developed in the lake because of gradual development of a substantial charophyte-biomass attaining high metabolic rates of the community8. Concerning adaptations to the extreme environmental variability, basal parts of charophyte tissues exposed to bottom waters would have to withstand up to 12 hours of anoxia and accumulation of potentially toxic sulphide and ferrous iron every day, while apical tissues experienced wider diurnal amplitudes in temperature and oxygen, though no anoxia. Charophytes, in contrast to flowering plants, lack air lacunae for longitudinal oxygen transport from apical to basal tissues located in anoxic water and rhizoids in anoxic sediments. How they cope with this metabolic challenge is not known, though anoxic fermentation is most likely. Preliminary experiments show that basal parts are indeed alive and have retained their photosynthetic and respiratory activity (data not shown). Mobile animals can move over short distances in the shallow lake to escape from the worst environmental stress21. For example, vertical upward movement from 23 to 16 cm below the surface in the lake during daytime stratification in May would be sufficient to escape anoxia. In order to unravel whether the large facultative air-breathing Lymnaea snails had suffered from earlier exposure to anoxia and toxic reduced ions in the bottom waters or low oxygen concentrations in surface waters at sunrise, we would need to track their position over time. This requires new technology not yet available. 68 More generally, our findings of extreme vertical and diurnal variability of temperature, oxygen, pH and solutes should be widespread in shallow vegetated lakes that are found in millions throughout the world. Small lentic water bodies (< 1 ha) have been grossly understudied, although they are 100-fold more abundant than larger (> 10 ha) intensely studied lakes1,2. The preference for studying large lakes have given us a wrong perception of environmental conditions, species adaptations and ecosystem processes for the natural range of lentic water bodies22,23. Our findings suggest that the evolutionary processes and the geographical dispersal of organisms in freshwaters could be particularly important in small lakes because they are highly abundant and variable24 and the environmental conditions can be extremely challenging and drive adaptation to high and globally rising temperatures and oxygen stress25. Methods summary The study was conducted in one of several small, shallow lakes located in the sparsely vegetated calcareous grassland at Greby on Öland, SE Sweden (56.81168°N, 16.6094°E)8. The examined lake varied in surface area from 630-745 m2 in late-May to 825-859 m2 in mid-August and maximum depth from 0.30 to 0.46 m. According to methods described previously26, meteorological parameters (incident light, wind speed and temperature) were measured next to the lake at 2.0 m above the ground and vertical profiles of light and temperature were measured at the deepest site at 5 cm depth intervals at 10 minutes intervals. Depth profiles of dissolved oxygen and pH were measured at 7cm depth intervals at 1 minute time intervals logging the mean signal every 10 minutes. Conductivity was also measured at 10-minutes intervals and corrected to 20 °C. During a diurnal cycle, water samples were collected at 7 cm depth intervals and analyzed for DIC27, ANC, calcium, ferrous iron, sulphide, orthophosphate, nitrate and ammonium by standard methods28. Weekly surface samples for 69 measurements of ANC (meq. L-1), pH and specific conductivity (Cond, µ Siemens cm-1) were used to construct closely linear relationships of conductivity to total ANC (= HCO3- + 2 CO32- + OH- + H+): total ANC = 0.009399 * Cond - 0.1410 (r2 = 0.72). This relationship enabled continuous estimates of DIC and proportions of individual carbon species from measurements of temperature, pH and specific conductivity29. 70 Water depth (m) 0 30 C 25 C 0.1 20 C 15 C 0.2 10 C 600 500 O2 (M) 35 C a 5 C b 400 300 200 100 10 0.02 m 0.09 m 0.16 m 0.23 m c pH 9 8 7 2.5 d 0.02 m DIC (mM) 0.6 1.5 0.5 DIC 0.4 1.0 0.3 CO2 0.5 2.5 0.2 CO32- e 0.1 0.23 m DIC 0.8 0.7 0.6 0.5 1.5 0.4 1.0 CO2 0.3 0.2 0.5 0.1 CO320.0 0 12 25 May 0 12 26 May 0 12 27 May 0 CO32- / CO 2 (mM) 2.0 DIC (mM) 0.7 CO32- / CO 2 (mM) 2.0 0.8 12 28 May 0 12 29 May 0 0.0 28 71 Fig. 1.Time series of temperature, O2, pH, ANC, DIC and individual carbon species with depth in a shallow charophyte lake during six days in May. a, Temperature isopleths calculated from measurements at 5-cm depth intervals. b, c, Oxygen and pH measured at 0.02 m (dark blue),0.09 m (light blue), 0.16 m (green) and 0.23 m (red) below the water surface. d, DIC (red), CO32- (orange) and CO2 (blue) in surface waters (0.02 m). e, DIC (red), CO32- (orange) and CO2 (blue) in deeper waters (0.23 m). Where b-e background color show day/night cycle (white = day, grey = night). 72 Water depth (m) 0 35 C a 30 C 0.1 25 C 0.2 20 C 15 C 0.3 10 C 0.4 500 5 C b O2 (M) 400 300 0.08 m 0.24 m 0.34 m 200 100 pH 14 c 12 9.0 10 ANC (meq L -1) 8.0 2.0 6 1.5 4 1.0 2 0.5 0.4 d DIC 1.0 0.3 0.2 CO32- 0.5 0.1 CO2 0.0 0 12 0 12 0 12 0 12 0 12 0 12 August 13 August 14 August 15 August 16 August CO32- / CO 2 (mM) 1.5 DIC (mM) 8 Calcite saturation index (green) 10.0 0.0 Fig. 2. Time series of temperature, O2, pH, ANC, calcite saturation index, DIC, individual carbon species with depth in a shallow charophyte-lake during six days in August. 73 a, Temperature isopleths calculated from measurements at 5-cm depth intervals. b, Oxygen measured at 0.08 m (dark blue), 0.24 m (green) and 0.34 m (red) below the water surface. c, pH (blue) and ANC (green) in surface waters (0.08 m). d, DIC (red), CO32- (orange) and CO2 (blue) in surface waters (0.08 m). Where b-d background color show day/night cycle (white = day, grey = night). Water depth (m) 0.0 06:00 11:00 16:00 22:00 0.1 0.2 0.3 1 2 3 0 0.5 DIC (mM) 1 1.5 2 0 1 Ca2+ (mM) 2 3 4 ANC (meq L -1) Water depth (m) 0.0 0.1 0.2 0.3 0 10 20 30 Fe2+ (M) 40 0 0.1 0.2 0.3 Sulphide ( M) 0.4 0 5 10 15 20 25 30 NH4+ (M) Fig. 3. Depth profiles of DIC, ANC, Ca2+, Fe2+, ∑H2S and NH4+ in a shallow charophyte lake during a diurnal cycle. Measurements on May 26 at 6.00 (red), 11.00 (blue), 16.00 (green) and 22.00 o’clock (orange). The water column was vertically mixed at 6.00 o’clock and stratified below 0.20 m at 16.00 and below 0.25 m at 22.00 o’clock. 74 Supplementary ANC (meq L-1) 4 3 2 1 0 0 100 200 300 400 Sp. conductivity (S cm-1) Fig S1. ANC in lake water as a function of specific conductivity. ANC = 0.009399*Sp.cond.-0.1410. R2=0.72. The line is forced through coordinates (15,0). The specific conductivity of rainwater in the region is 15 μS cm-1. Temperature (C) 35 30 25 20 15 10 5 0 12 0 12 0 12 0 12 0 12 0 0 12 0 12 0 12 0 12 0 12 0 May 25 26 27 August 28 29 12 13 14 15 16 Fig S2. Surface water temperature (full line) and air temperature (dashed line) for 5 days in May and 5 days in August. 75 Table S1. Diel minimum and maximum differences between surface and bottom water temperature in May and August. Negative values denote surface water colder than bottom water. Date Minimum Maximum 25-05-2014 -0.10 12.86 26-05-2014 -1.43 14.36 27-05-2014 -3.98 0.57 28-05-2014 -4.11 3.93 29-05-2014 -3.63 11.18 12-08-2013 -1.62 6.22 13-08-2013 -1.52 8.63 14-08-2013 -1.24 6.20 15-08-2013 -1.43 8.91 16-08-2013 -0.96 7.94 Table S2. Mean daily vertical attenuation coefficients and depths at which 10 % of surface light remains. 1 2 3 Light attenuation Depth at which 10 % of Date coefficient (m-1) surface light remains (m) 25-05-2014 22.7 0.10 26-05-2014 17.5 0.13 27-05-2014 21.6 0.11 28-05-2014 25.3 0.09 29-05-2014 22.7 0.10 Downing, J. et al. The global abundance and size distribution of lakes, ponds, and impoundments. Limnology and Oceanography 51, 2388-2397 (2006). Sand-Jensen, K. Lakes - A Protected Nature Type (Danish). (Gad Publishing, 2001). Kalff, J. Limnology: inland water ecosystems. (Prentice Hall New Jersey, 2002). 76 4 5 6 7 8 9 10 11 12 13 14 15 16 17 18 19 20 21 22 23 24 25 26 27 28 29 Branco, B. F. & Torgersen, T. Predicting the onset of thermal stratification in shallow inland waterbodies. Aquatic Sciences-Research Across Boundaries 71, 65-79 (2009). Gorham, E. & Boyce, F. M. Influence of lake surface area and depth upon thermal stratification and the depth of the summer thermocline. Journal of Great Lakes Research 15, 233-245 (1989). Ford, P. W., Boon, P. I. & Lee, K. Methane and oxygen dynamics in a shallow floodplain lake: the significance of periodic stratification. Hydrobiologia 485, 97-110 (2002). Vad, C. F. et al. Vertical distribution of zooplankton in a shallow peatland pond: the limiting role of dissolved oxygen. Annales de Limnologie-International Journal of Limnology 49, 275-285 (2013). Christensen, J. P. A., Sand-Jensen, K. & Staehr, P. A. Fluctuating water levels control water chemistry and metabolism of a charophyte-dominated pond. Freshwater Biology 58, 1353-1365 (2013). Corbet, P. S. Dragonflies: behaviour and ecology of Odonata. (Harley Books, 1999). Sand-Jensen, K. & Pedersen, O. Velocity gradients and turbulence around macrophyte stands in streams. Freshwater Biology 42, 315-328 (1999). Herb, W. R. & Stefan, H. G. Dynamics of vertical mixing in a shallow lake with submersed macrophytes. Water resources research 41 (2005). Imberger, J. The diurnal mixed layer. Limnol. Oceanogr 30, 737-770 (1985). Imboden, D. M. & Wüest, A. Mixing mechanisms in lakes. (Springer, 1995). Andersen, M. R., Kragh, T. & Sand-Jensen, K. Vertical heterogeneity in metabolism and oxygen dynamics in a shallow, macrophyte dominated, oligotrophic, temperate lake (in prep). (2015). McConnaughey, T. Calcification in Chara corallina: CO2 hydroxylation generates protons for bicarbonate assimilation. Limnology and Oceanography 36, 619-628 (1991). Kelts, K. & Hsü, K. in Lakes - Chemistry, Geology & Physics (ed A. Lerman) 295-323 (Springer, 1978). Madsen, T. V. & Sand-Jensen, K. Photosynthetic carbon assimilation in aquatic macrophytes. Aquatic Botany 41, 5-40 (1991). McConnaughey, T. A. et al. Carbon budget for a groundwater-fed lake: Calcification supports summer photosynthesis. Limnology and Oceanography, 1319-1332 (1994). Jørgensen, B. B. in Marine Geochemistry (eds H.D. Schulz & M. Zabel) 173-207 (Springer, 2000). Kautsky, L. Life strategies of aquatic soft bottom macrophytes. Oikos, 126-135 (1988). Iversen, T. M. The ecology of a mosquito population (Aedes communis) in a temporary pool in a Danish beech wood. Archiv für Hydrobiologie 69, 309-332 (1971). Hanson, P. C., Carpenter, S. R., Cardille, J. A., Coe, M. T. & Winslow, L. A. Small lakes dominate a random sample of regional lake characteristics. Freshwater Biology 52, 814-822 (2007). Sand-Jensen, K. & Staehr, P. A. Scaling of pelagic metabolism to size, trophy and forest cover in small Danish lakes. Ecosystems 10, 128-142 (2007). Williams, P. et al. Comparative biodiversity of rivers, streams, ditches and ponds in an agricultural landscape in Southern England. Biological Conservation 115, 329-341 (2004). Verberk, W. C. & Bilton, D. T. Respiratory control in aquatic insects dictates their vulnerability to global warming. Biology letters 9, 20130473 (2013). Andersen, M. R., Jones, I. D., Woolway, R. I. & Sand-Jensen, K. Profound daily stratification and vertical mixing in a shallow, wind-exposed pond with submerged macrophytes (in prep). (2015). Vermaat, J. E. & Sand-Jensen, K. Survival, metabolism and growth of Ulva lactuca under winter conditions: a laboratory study of bottlenecks in the life cycle. Marine Biology 95, 55-61 (1987). University_of_Copenhagen. Limnological Methods(Danish). (Ferskvandsbiologisk Laboratorium. Københavns Universitet (Ed.), Akademisk Forlag, København, 1977). Lewis, E. & Wallace, D. Program Developed for CO2 System Calculations (Carbon Dioxide Information Analysis Center, Oak Ridge National Laboratory, US Dept. of Energy, Oak Ridge, TN). ORNL/CDIAC-105 (1998). 77 Paper 3 - Distinct diurnal patterns of ecosystem metabolism in a small charophyte-lake 78 Distinct diurnal patterns of ecosystem metabolism in a small charophyte-lake Theis Kragh, Mikkel René Andersen and Kaj Sand-Jensen, Freshwater Biological Section, Biological Institute, University of Copenhagen, Universitetsparken 4, 2100 Copenhagen Target journal: Limnology and Oceanography 79 Abstract To characterize the temporal and spatial variability of metabolism (gross primary production (GPP), respiration (R) and net ecosystem production (NEP)) in a small, shallow Swedish lake with dense charophyte stands, we collected data from many O2 sensors placed along a vertical mid-lake profile and across the lake surface in late May and early June. Similar diurnal patterns derived from single surface sensors and multiple sensors showed maximum NEP-rates between 8 and 11 am and strong afternoon depression with rates close to zero accompanying profound rise of O2, pH and temperature and depletion of inorganic carbon and CO2 from morning to late afternoon. Inorganic carbon limitation of photosynthesis and temperature enhancement of respiration could account for profound afternoon depression of NEP. Nocturnal respiration declined from sunset to sunrise due to falling temperature and presumably depletion of respiratory substrates. Mean temperature-corrected respiration rates at sunrise were 63% of that at sunset. The dense charophyte canopy accounted for 90% of ecosystem respiration and the entire primary production. Mean daily estimates of GPP and R varied only 2-fold and small, negative NEP-rates varied less between surface sensors at different locations across the lake. In conclusion, multiple oxygen sensors representing the main depths and sections of the lake can provide reliable and accurate measurements of diurnal course and daily rates of metabolism in small lakes probably because a relatively uniform oxygen signal is ensured by small distances and nocturnal mixing. During colder periods of continuous mixing a single mid-station sensor should provide reliable metabolism estimates. Introduction Ecosystem metabolism is essential to the understanding of carbon cycling and functional properties of gross primary production (GPP), respiration (R) and net ecosystem production (NEP; Odum 1957, Kelly et al. 1983, Staehr et al. 2012c). 80 During recent years there has been renewed interest in ecosystem metabolism of freshwaters because of technical improvements and the recognition that freshwaters are hot spots for storage of terrestrially fixed carbon and CO2 emission to the atmosphere (Cole et al. 2007, Sand-Jensen & Staehr 2012). Most determinations of ecosystem characteristics and metabolism are from large to medium-sized lakes (> 10 ha), while small lakes and ponds (< 1 ha) which are particularly abundant in the landscape are grossly underrepresented in the studies (Downing et al. 2006, Hanson et al. 2007, Staehr et al. 2012a). In Denmark, for example, there are about 1000 lakes larger than 10 ha but more than 100,000 lakes smaller than 1 ha, whose combined contribution to CO2 emission by far exceeds that of the larger lakes (Sand-Jensen & Staehr 2007, Staehr et al. 2012a). Ecosystem metabolism changes markedly from small to large lakes because of the reduced input of water, organic carbon and nutrients relative to surface area and volume in gradually larger and deeper lakes and the increase of incident irradiance, wind exposure and turbulence (Sand-Jensen & Staehr 2007, Staehr et al. 2012a). Thus, most small lakes exhibit strongly negative rates of NEP and high atmospheric CO2 evasion relative to surface area (Staehr et al. 2012a), though nutrient-poor lakes in terrestrial landscapes with thin soils of low organic carbon export may show positive NEP and release O2 to the atmosphere during summer (Christensen et al. 2013). This situation calls for stronger future emphasis on rates and regulations of ecosystem metabolism in small lakes. Technological improvements of O2 sensors have made it easier to use free-water measurements to obtain continuous estimates of ecosystem metabolism in many freshwater localities and reach broad-scale overviews of their role in carbon balances of the landscape. Estimates of whole-lake metabolism have usually been based on a single O2 sensor located in surface waters at the deepest point of the lake with the implicit assumption that it is representative of the pelagic waters, if not the metabolism of the entire lake. However, spatial heterogeneity of estimates of 81 ecosystem metabolism may exists both within and between pelagic and littoral habitats depending on underlying differences in ecosystem structure and extent of physical isolation of water masses (Vadeboncoeur et al. 2002, Vadeboncoeur et al. 2006, Van de Bogert et al. 2007, Langman et al. 2010, Staehr et al. 2012b, Van de Bogert et al. 2012). Within-lake heterogeneity may be due to measurements of strong O2 signals from “hot spots” of intensive daytime photosynthesis and nocturnal respiration in dense periphyton or macrophyte communities alternating with weak O2 signals from “cold spots” of low metabolism on naked sediments and clear pelagic waters (Van de Bogert et al. 2012). Detected O2 signals are, in addition to the underlying metabolic activity, influenced by physical processes of transport, mixing and atmospheric gas exchange causing sensors to measure on water parcels of different metabolic and physical time history (Mackay et al. 2011, Van de Bogert et al. 2012). Under conditions of low wind and water mixing, distinct differences in recorded metabolism may exist between sensors located in littoral and pelagic habitats (Van de Bogert et al. 2007, Sadro et al. 2011a). In contrast, homogenization of water masses due to strong wind forcing and mixing and/or short horizontal and vertical distances may generate a uniform integrated O2 signal in the water across the lake despite variation of metabolism among sites and over time. Here we focused on ecosystem metabolism of a small lake (ca. 1000 m2) and tested the reproducibility of estimates of multiple sensors covering the horizontal and vertical gradients in the lake. We measured directly gas exchange velocity as a function of wind velocity and fetch allowing us to construct a model to account for atmospheric gas exchange for every 10-minute estimate of metabolism among sites. Because the small, shallow lake is covered by charophytes across the entire bottom and undergoes recurring mixing during summer nights, we expect that the variability of daily estimates of metabolism derived from O2 sensors located in surface waters across the lake should be relatively small compared with the surprisingly high variability published for larger lakes (Van de Bogert et al. 2012). 82 Regulation of metabolic rates takes place at temporal scales of seconds, minutes and hours, while ecosystem metabolism based on free-water measurements is usually expressed on a daily basis due to lack of sensitivity at shorter time scales. Many important metabolic regulations (i.e. afternoon depression of productivity by lower CO2 and higher O2, and falling respiration during the night by declining temperature and lower availability of respiratory substrates; Markager & Sand-Jensen 1989, Alnoee et al. 2015) are missed at the integrated daily scale, but may turn up on shorter time scales and may also reveal greater short time variability among sensors with different spatial location. The temporal variability of temperature, O2, CO2 and pH can be very profound in small lakes like the one we studied (e.g. Christensen et al. 2013). Our overall goal was to determine rates of GPP and NEP at 10-minute intervals to test whether the mean metabolic signal for all sensors and the signal for individual sensors resembled each other and showed the same diurnal course. The two specific goals was to test the possibility of afternoon depression of GPP and NEP and the decline of R as the night progresses. We tested directly the possibility of afternoon depression of NEP because of inorganic carbon limitation by comparing photosynthetic rates of apical charophyte shoots during in situ incubations in the afternoon in naturally DIC- and CO2-depleted surface water versus enriched bottom waters. We also tested whether respiration rates declined as the night progresses and evaluated to what extent falling temperature and depletion of respiratory substrates, following temperature correction, could account for the predicted decline. Finally, direct measurements of sediment respiration allowed us to evaluate its contribution to ecosystem respiration relative to that of the dense charophyte canopy as respiration in the clear water was negligible. 83 Materials and methods Study site and lake characteristics - The study was conducted in a small lake located in a limestone quarry abandoned 30 years ago on Räpplinge Alvar on Öland, SE Sweden (56.81168°N, 16.6094°E). The area is very sparsely vegetated grassland (alvar) with thin soils covering the hard Ordovician limestone. The lake is fed by rainwater and runoff from the almost naked limestone surfaces and overflow from nearby lakes during periods of heavy rain (Christensen et al. 2013). The lake was 847 m2 large and had a maximum depth of 46 cm and a mean depth of 21 cm during the first intensive study period in June 8th -15th , 2013, while it was 700 m2 large and had maximum and minimum depths of 34 and 29 cm during the second study period in May 24th – 30th, 2014. A georeferenced bathymetric chart was created from 258 measurements of depth and position in a grid allowing extrapolation limits between measurements of less than 1 m across the lake surface. Changes in water level were followed continuously with an accuracy of 3 mm by recording pressure differences between a submerged water level data logger (HOBO U 20 – 001-04, Onset Computers, Bourne, USA) and a similar logger in air. The lake had transparent water and very low summer concentrations of ammonium (about 2 µM), nitrate (undetectable), ortho-phosphate (about 0.06 µM) and phytoplankton chlorophyll (about 1 µg L-1; Sand-Jensen et al. 2010). The lake sediment was 4-10 cm thick calcareous gyttja of low organic content (10% of dry mass) deposited on top of the solid limestone surface (Sand-Jensen et al. 2010, Andersen and Sand-Jensen 2013, pers. comm). The lake bottom was covered by dense charophyte vegetation (mainly Chara aspera and some C. contraria, C. virgata and C. vulgaris) with less than 10% representation of submerged angiosperms (Myriophyllum spicatum, Potamogeton crispus and Zannichellia palustris; Sand-Jensen et al. 2010). The lake was free of shading bank vegetation and mostly of emergent vegetation except for scattered Typha angustifolia and Phragmites australis at location F (see map in Fig. 3). 84 A meteorological station was established next to the lake at 2.0 m above the ground. The station was equipped with sensors for incident irradiance (HOBO PAR sensor (400-700 nm) S-LIA-M003, Bourne Ma, USA), wind speed and direction (Hobo anemometer and direction, S-WSET-A), air temperature and relative humidity (HOBO U23 Pro v2) that took measurements every 1 minute and averaged readings for every 10 minutes on a HOBO micro station data logger (H21-002). Temperature, oxygen and air-water gas exchange - The horizontal variability of water temperature and dissolved O2 was determined across the lake in June 2013 by deploying seven MiniDOT sensors (PME, Vista, Ca, USA) at different positions immediately above the charophyte canopy and 8-12 cm below the lake surface (positions in Fig. 3). In May 2014, the vertical variation of temperature and dissolved O2 was recorded at five depths through the water column and the charophyte canopy at a 31-cm deep site by deploying one MiniDOT sensor at 2 cm and four Firesting Pyroscience fiber optic sensors (Aachen, Germany) at 9, 16, 23 and 30 cm depth below the surface. Before each deployment MiniDOT sensors and Firesting optodes were calibrated in air-saturated and anoxic water. After each deployment, all sensors were tested in air-saturated water for several hours to make sure that no sensor drift had occurred. In no instance did we need to compensate for drift during measurements. During O2 measurements in May 2014 we also recorded pH (pHTemp2000 Madgetech, Warner, NH, USA)and conductivity (HOBO U24-001) continuously in surface waters. All pH electrodes were calibrated before deployment and controlled for drift after deployment. A close linear relationship between parallel direct measurements of carbonate alkalinity (= HCO3- + 2 CO32-) and conductivity normalized to 20 oC has previously been established for the lake (Andersen et al. 2015a,b). This enabled calculations of total dissolved inorganic carbon (DIC) and CO2 from carbonate alkalinity, pH, temperature and conductivity according to Mackereth et al. (1978). 85 Previous measurements on a similar small lake dominated by charophytes (Christensen et al. 2013) have shown that wind-based models of air-water oxygen exchange rate such as those in Jähne et al. (1987) and Cole and Caraco (1998) overestimated exchange rates and produced erratic model predictions. We, therefore, made a series of direct gas exchange measurements to account for the characteristics of this particular lake (e.g., size, depth and charophyte cover) and the sitespecific effects of wind velocity and fetch across the lake. Air-water gas exchange was measured as CO2 exchange in free-floating flux chambers resembling those applied by Raymond et al. (2012). CO2 was measured continuously in the flux chamber by a portable IRGA (LiCor 840, Lincoln, Ne, USA) and CO2 in the water was determined by continuous measurements of pH and temperature and frequent measurements of DIC (dissolved inorganic carbon). Calculations of CO2 in the water and gas exchange rates followed the procedures used by Sand-Jensen and Staehr (2012) and Alnoee et al. (2015) and the precision and reproducibility were as high as in their measurements. To convert measured gas exchange rates for CO2 to O2, we corrected for chemical enhancement according to the measured temperature and pH (Bade & Cole 2006) and the basic difference in exchange rate between the two gases according to molecular weight (Wanninkhof 1992, Sand-Jensen & Staehr 2012). For every location of the flux chamber we made three consecutive measurements and used the average in further evaluations. Overall, we determined air-water exchange rate at 21 locations, wind velocities and fetches. The air-water exchange rate (k600) was positively related to mean wind speed, mean wind gust speed and to fetch at the particular location of the flux chamber according to wind direction. The best relationship to k600 (y, cm h-1) found by multiple regression using bidirectional stepwise selection was for mean wind gust speed (x, m s-1) averaged for 2 hours prior to measurements and mean wind speed grouped below and above 2 m s-1 during the same period. At mean wind speed below 2 m s-1 the relationship was: y = 0.14 x + 0.04 (R² = 0.60, n=6). Above 2 m s-1 the relationship was: y = 0.87 x – 2.10 (R² = 86 0.76, n=15). The oxygen flux between the atmosphere and the water (F) was calculated in time steps of 10 minutes as: F = k600 (O2surface - O2sat), where O2surface is the measured concentration in surface waters and O2sat is the concentration in water at equilibrium with the atmosphere at ambient water temperature and atmospheric pressure. The flux was calculated for each time step using one of the two equations for k600 depending on average wind speed and wind gust speed. Oxygen metabolism The vertical series - In measurements in May 2014 the O2 pool through the water column was weighted according to the depth and water volumes represented by each of the five sensors. For calculation of the air-water flux only temperature and O2 concentration in the surface water were used. The horizontal series - Measurements in June 2013, using O2 concentrations and temperature from the horizontally dispersed sensors, were averaged and NEP rates normalized to surface area determined. Ecosystem rates for the entire lake was determined after weighting according to the surface area represented by each sensor. The sensor position was plotted on the map created and half of the distances to neighbouring sensors were used as boundaries of the area represented by the sensor. Boundaries were extrapolated onto the shore. The area covered by each sensor could be calculated using the georeferenced map and weighted against the total lake area. Ecosystem Respiration and GPP - Respiration rates in the lake during the night were measured directly as the decline of O2 concentration in the water corrected for gas exchange with the atmosphere. Respiration rates were integrated for the entire night defined by incident photon irradiance below 1.3 µmol m-2 s-1 (PAR). Nocturnal respiration rates were also determined for the initial 30 minutes (RIni) and the final 90 minutes (REnd) of the night by calculating the mean rate of O2 decline for 3 and 9 pairs of O2 measurements, respectively. These data allowed us to test whether respiration rates declined from early to late during the night for temperature87 uncorrected rates and rates normalized to 20 oC applying a general Q10 value of 2.0. Thus, the decline of temperature-corrected respiration rates during the night can be represented by the quotient REnd (corr.)/RIni (corr) with values below 1.0 suggesting a depletion of respiratory organic substrates. Daytime respiration rates were calculated from the initial rate of O2 decline during the first 30 minutes of the following night (RIni). This initial dark respiration rate was assumed to be equal to the daytime respiration rate as organic carbon limitation of respiration can be expected to be small and of the same magnitude. Daytime respiration was corrected to ambient temperature applying the Q10 value of 2. GPP was calculated for each ten minute step as the increase of O2 concentration corrected for atmospheric exchange and with respiration added. Averages of NEP and GPP were calculated for the entire measuring period, but only including measurements for entire days. Standardized diurnal courses (Fig. 2 and 3) were calculated as the mean of measurements in each time interval on the different days. Values of NEP-day and NEP-night (= nocturnal respiration) were calculated for the daytime and the night period as described above, and mean hourly respiration rates were calculated by dividing cumulated NEP-night by the duration of the night for comparison with sediment respiration rates. Sediment respiration - Five sediment cores representing the different regions of the small lake were retrieved in late May for measurements of aerobic sediment respiration at ambient temperature (15 oC). Cores were made of Acrylic plastic of low gas permeability, were 40 cm long, had an inner diameter of 5.2 cm and were closed with rubber stoppers. Cores were incubated in a temperature-controlled water bath filled with anoxic water preventing significant O2 influx to the sediment cores while O2 was gradually depleted by sediment consumption over 4 days. Water within the cores was kept homogeneous by a magnetic stirrer bars fastened to the upper rubber stopper and driven by a large slowly-rotating magnet placed in the center and 88 surrounded by the five sediment cores. Oxygen concentrations were continuously recorded in each core by a Firesting Pyroscience fiber optic sensor. Oxygen readings showed constant sediment respiration rates during the first three days of incubation, then used for calculation, and a decline on the fourth day. Charophyte production - Charophyte production rates and the influence of gradual self-limitation by depletion of CO2 and enrichment of O2 in the water during photosynthesis were measured in situ in early June by incubating small apical shoots of Chara aspera in 50 ml glass bottles placed immediately above the charophyte canopy. Four replicate bottles were filled with surface water and four additional replicate bottles were filled with bottom water at 2 pm on a sunny day with profound density stratification typical of summer (Andersen et al. 2015a). Three blanks without charophytes were incubated with either surface or bootom water and showed negligible O2 changes. Before incubation, surface water had been enriched in O2 (520 µM, 206% saturation) and depleted in CO2 and DIC (1.37 mM) by photosynthesis before noon, while bottom water located in the shade below the canopy had been depleted in O2 (95 µM, 35% saturation) and enriched in CO2 and DIC (2.37 mM) forming a distinct contrast and test for afternoon depression of photosynthesis in surface water because of O2 accumulation and DIC depletion by ongoing photosynthesis. Net photosynthesis was calculated as the release of O2 from 2 to 4 pm relative to plant dry mass. Results Environmental conditions - The sky was clear and the incident irradiance followed a regular sinusoid course on day 1, 2 and 5 in late May (Fig. 1). The water column underwent strong daytime surface heating and vertical stratification at about 20 cm depth on day 1 and 2 (Andersen et al. 2015a). Day 5 was colder and surface heating and stratification were much weaker than on day 1 and 2 (Fig. 1 and Table 1). The 89 weather was partly overcast, colder and windy on day 3 and 4 and no vertical stratification developed. The water column underwent convective mixing by surface cooling every night (Andersen et al. 2015a). Dissolved O2 and pH in surface waters exhibited profound and regular sinusoid diurnal courses on day 1 and 2, while diurnal amplitudes were smaller and less regular on the other days. Photosynthesis during the day depleted CO2 in surface waters below air saturation to only 0.42-2.92 µM late in the afternoon on the five days, while O2 rose above air saturation to 430-509 µM. The molar quotient of CO2 to O2 dropped to only 0.0009-0.0063. Vertical daytime stratification was accompanied by strong DIC depletion by photosynthesis and CaCO3 precipitation from surface waters at high pH, while DIC was replenished by respiration and dissolution of CaCO3 at high CO2 concentration at low pH in bottom waters during the day and continued throughout the night restoring the DIC pool for photosynthesis on the following day (Andersen et al. 2015b). DIC replenishment in bottom waters was weaker on day 3-5, because daytime vertical mixing prevented the build-up of high CO2 concentrations in bottom waters conducive to CaCO3 dissolution, leading to a marked decline of the mean DIC concentration before noon from 1.30 mM on day 2 to only 0.84 mM on day 5 (Table 1). Surface and vertically integrated metabolism - Average diurnal patterns of GPP and NEP for the week in late May based on the surface sensor at 2 cm depth and all five sensors dispersed through the water column at a mid-site were both highly regular (Fig. 2) compared to the more irregular course of NEP estimated from the surface sensor during individual days (Fig. 1). The average course of GPP reached a maximum between 8 and 12 o’clock, while rates were lower in the afternoon. GPP was slightly higher when based on measurements in surface waters alone than for the entire water column (Fig. 2). Rates of NEP were positive from sunrise to the early afternoon, close to zero in the late afternoon and negative during the evening and the night. Nocturnal respiration declined from sunset to sunrise. Overall, diurnal patterns 90 of NEP were the same when based on measurements in surface waters or the entire water column except that dark respiration was about 50 % higher when calculated with data for the entire water column rather than surface waters alone. Horizontal variability and integrated lake metabolism - Mean diurnal patterns of GPP and NEP for the week in early June 2013 resembled each other between the seven different positions of the O2 sensors and the volume-weighted average for the entire lake (Fig. 3). Diurnal patterns also resembled those already described for the mid-site in late May (Fig. 2). As expected, GPP was close to zero during the night, reached a daytime maximum before noon, was somewhat lower in the afternoon and then dropped steeply in the late afternoon and early evening. The lower GPP in the afternoon than before noon took place at higher temperatures, O2 concentrations and pH and lower availability of CO2 and DIC than before noon as described before (Fig. 1). Afternoon depression was more profound for NEP than GPP reflecting the much higher respiration rate at high temperature and O2 concentration in the afternoon than at lower temperature and O2 before noon. Positive values of NEP were typically recorded for 12 hours between 5 and 17 o’clock and maximum rates between 8 and 11 o’clock. At night, respiration rates dropped from sunset to sunrise as temperature and O2 declined similar to the nocturnal course in late May (Figs. 1 and 2). Mean daily NEP (mmol O2 m-2 d-1) for the week was almost the same (-5 to -9) for the different horizontal positions and the integrated average of the lake (Table 2). The minimum (-7 to – 14) and maximum daily NEP rates (6 to 13) also resembled each other among locations. Rates of GPP and R were both about 20-fold higher than the small difference (NEP) between them. Mean rates of GPP and R varied about 2-fold between different horizontal positions (e.g. GPP: 125-266 mmol m-2 d-1) and tended to be smaller in very shallow water with a short charophyte canopy (e.g., location E) than in deeper water with a taller canopy (locations B and D). Ecosystem and sediment respiration – During all 11 nights in late May and early June, ecosystem respiration rates declined significantly as the night progressed. 91 Respiration rates during the last 90 minutes of the night were 28-84% (avg. 58%) of the rate during the first 30 minutes immediately after sunset (Table 2). After correction for falling temperature during the night, respiration before sunrise still remained 29-90% (avg. 63%) of the rate immediately after sunset. The charophyte canopy was more active in terms of GPP and nocturnal respiration in late May than in early June although temperature was higher in June (Tables 1 and 2). Thus, the mean nocturnal respiration was 7.9 mmol m-2 h-1 in late May and 6.8 mmol m-2 h-1 in early June (Table 1). The mean respiration rate after sunset corrected to a common temperature of 20 oC was significantly higher in late May (15.7±1.8) than in early June (8.2±1.4 mmol m-2 h-1, mean ± 95% C.L). Sediment respiration in late May at 15 oC was 0.70±0.15 mmol m-2 h-1 (mean ± 95% C.L.) and only about 10% of total ecosystem respiration. Because respiration in the transparent, oligotrophic water was negligible, the dense charophyte canopy accounted for about 90% of total ecosystem respiration. On a diurnal basis sediment respiration averaged 16.8 mmol m-2 d-1 which is of the same order of magnitude as the mean diurnal NEP in late May (5 mmol m-2 d-1) and early June (- 7 mmol m-2 d-1). When sediment respiration was accounted for in the ecosystem balance, mean net production of the charophyte canopy was slightly positive in late May and early June (21.8 and 9.8 mmol m-2 d-1, respectively. Regulation of daily and short-time variability of GPP and NEP – Rates of GPP and NEP can be influenced by day-to-day and and short-time variability of irradiance, temperature, DIC, CO2 and O2 concentrations through their impact on photosynthesis and respiration. Daily GPP and NEP were not significantly correlated to day-to-day variability of daily irradiance and temperature during the two measuring weeks (Table 1). Though too few days were examined to test the relationship between daily GPP and NEP and available DIC and CO2 in late May, data pointed at distinct impacts. On day 5 with very low DIC and CO2 concentrations before noon, daytime NEP was extremely low and GPP was 2 times lower than rates on day 1 and 2 when 92 DIC and CO2 were much higher (Table 1). The data suggest that availability of DIC and CO2 represents a stronger constraint on daily GPP and NEP than irradiance and temperature. We evaluated further the influence of irradiance and pH on short-time variations og GPP and NEP during 10-minutes intervals. pH was used as a proxy for inorganic carbon availability relative to O2 because progressively higher pH during the day accompanied depletion of DIC and CO2 and accumulation of O2 (Fig. 1, Andersen et al. 2015b). We examined production rates as a function of irradiance and pH separately before and after noon (Fig. 4). We only examined the patterns on sunny days with clear skies where irradiance, temperature, O2 and pH follow regular courses. It was apparent that GPP as a function of incident irradiance above 50 µmol m-2 s-1 followed almost the same pattern before and after noon with approximate saturation being attained above 500 µmol m-2 s-1. In contrast, rates of NEP were a positive function of irradiance before noon, while rates were much lower and close to zero and virtually independent of irradiance during the afternoon supporting that other environmental variables constrained NEP. Rates of GPP were more similar before and after noon than those of NEP because respiration rates are higher in the afternoon at higher temperatures and GPP is the sum of NEP and respiration. The relationship of GPP and NEP to pH between 8.0 (typical late morning pH) and 9.3 (typical late afternoon pH) was examined at irradiances above 500 µmol m-2 s-1 to ensure light saturation of photosynthesis (Fig. 4) The relationship of GPP to increasing pH was slightly negative, while that of NEP to pH was strongly negative reaching zero at about pH 9.3. In the relationships of GPP and NEP to pH, afternoon measurements took place at systematically higher temperature than before noon conducive to higher afternoon respiration and, therefore, particularly low rates of NEP compared with GPP. Test of afternoon depression – We performed a direct test of afternoon depression of charophyte photosynthesis as a result of DIC depletion and O2 accumulation in 93 surface waters by comparing rates of O2 release in surface waters (DIC/O2 molar quotient of 2.7) with those obtained in DIC- enriched and O2-depleted bottom waters (DIC/O2 quotient of 29). Net photosynthesis of apical shoots at high irradiance were stimulated almost 4-fold by incubation in water collected near the bottom (151±52) relative to shoots incubated in surface waters (40± 28 µmol g -1 DM h-1, mean±95 C.L.) confirming strong afternoon depression of photosynthesis by the build-up of O2 and the drawdown of DIC and CO2. Discussion Diurnal course of metabolism – Net ecosystem metabolism (NEP) exhibited two profound features: afternoon depression and falling respiration during the night at all locations and during all days of measurements. Positive NEP was mainly restricted to the period from sunrise to shortly after noon , while NEP was close to zero during the later afternoon and strongly negative during the evening until midnight. From the morning to the afternoon the marked rise of temperature, O2 and pH and the decline of CO2 and DIC can probably account for the distinct afternoon depression of NEP. This explanation was supported by the steep decline of NEP with rising pH at high irradiance and confirmed by in situ experiments showing almost 4-fold higher photosynthesis of apical charophyte shoots incubated in DIC-enriched and O2depleted bottom waters compared with DIC-depleted and O2-enriched surface waters. While NEP represents direct estimates from changes of concentrations and atmospheric exchange of O2, GPP is the sum of NEP and R and is, therefore, dependent on the selected temperature coefficient for respiration and the assumption that daytime respiration rates is best represented by respiration rates immediately after sunset, which is supported by most measurements (Markager & Sand-Jensen 1994). Thus, a lower estimate of the basic respiration rate (e.g. the average for the night instead of the early night) and a lower temperature coefficient of respiration than the selected Q10 of 2.0 would reduce respiration and, thus, depress GPP further in 94 the afternoon relative to rates before noon.Temperature rose 2-12 oC from sunrise to late afternoon during our measurements. For a Q10 of 2.0, respiration would increase 0.4-2.4-fold. Because GPP and R are high relative to NEP (= GPP – R), the increase of respiration contributed to the shift from maximum NEP values before noon to very low NEP values during late afternoon. As a result afternoon depression is more prominent for NEP than GPP. The daytime depletion of DIC by photosynthesis and carbonate precipitation and the even stronger decline of CO2 due to rising pH and temperature will increase inorganic carbon limitation of photosynthesis (Madsen & Sand-Jensen 1991, Pedersen et al. 2013). Maximum inorganic carbon concentrations in surface waters in the morning were 32-337 µM CO2 and 0.75-1.26 mM HCO3-, while minima late in the afternoon were 0.39-2.7 µM CO2 and 0.62-0.82 mM HCO3-. Charophytes are capable of using both HCO3- and CO2 for photosynthesis, but the affinity is higher for CO2 than HCO3(Lucas 1985). Earlier in situ incubation experiments at light saturation showed that net photosynthesis of communities of the charophyte, Chara virgata in these small lakes declined almost 2-fold when exposed to higher pH (9.5) and lower CO2 (1 µM) characteristic of the afternoon relative to the rate under early morning conditions (e.g., pH 7.5 and 150 µM CO2; Christensen et al. 2013). While the latter experiment reflects the direct impact on photosynthesis of the charophyte community of higher pH and lower CO2 at the same concentrations of DIC and O2, the stronger almost 4fold stimulation of net photosynthesis in the incubations of small charophyte shoots in surface waters versus bottom waters reported here can be explained by the additional constraints by lower DIC and higher O2 accompanying higher pH and lower CO2 in surface waters during the afternoon. Lower DIC and higher O2 concentrations in itself and added lower molar quotients of DIC/O2 and CO2/O2 restrict photosynthesis and enhance photorespiration of submerged plants and algae (Sand-Jensen & Frost-Christensen 1998) and high water temperatures enhance mitochondrial respiration and photorespiration even further (Beardall et al. 2003). 95 These general phenomena will apply to charophytes, though their specific responses have not been studied. The inhibition of net carbon fixation depends on the ability of charophytes to increase CO2 in the cells by active carbon concentrating mechanisms (Lucas 1985, McConnaughey 1991). The CO2/O2 quotient at the site of Rubisco activity is a main regulator of the balance between photosynthetic CO2 assimilation and CO2 loss by photorespiration because of competitive inhibition between carboxylase and oxygenase activity of Rubisco (Sand-Jensen & Frost-Christensen 1998, Beardall et al. 2003). Incubation experiments in bottles in the lake with the dominant Chara species confirmed that net photosynthesis dropped from the morning to almost zero in the afternoon when O2 within incubation bottles approached 700800 µM (3-fold supersaturation) and CO2 declined below 1 µM (Andersen, Kragh and Sand-Jensen pers, comm, 2015). Our field measurements also confirmed that NEP reached zero in the afternoon when O2 approaced 400 µM and CO2 dropped to 0.5-5 µM in surface waters. All together these measurements stress the strong selflimitation of net photosynthesis of the dense charophyte stands in the shallow water. As predicted, respiration rates declined progressively during the night. On average, respiration rates in the lake before sunrise were 58% of the rate immediately after sunset and 63% when respiration rates were corrected for falling nocturnal temperatures from sunset to sunrise. Because charophytes are responsible for 90% of ecosystem respiration, we suggest that diminishing pools of respiratory substrates due to ongoing consumption during the evening and the night can account for the declining rates following temperature correction. Declining respiratory rates during the night have been observed in other field studies in oligotrophic lakes and streams of low organic productivity (Sadro et al. 2011b, Solomon et al. 2013, Alnoee et al. 2015), but also in dense communities of microalgae (Gibson 1975, Markager & Sand-Jensen 1989). The falling respiratory rates during the night can be correlated to consumption of the main pools of soluble carbohydrates and neutral lipids (Gibson 1975, Lacour et al. 2012).We cannot exclude that synchronization of metabolic 96 activity involved in different synthetic pathways during diurnal cycles can also influence the course of nocturnal respiration. In whole-system measurements endogenous rhytms in synthetic pathways cannot be separated from the influence of variable respiratory substrate pools. Resemblance of GPP and R – Mean daily rates of GPP and R integrated across the entire lake during the week in early June (198 and 191 mmol O 2 m-2 d-1) were close to each other such that NEP shifted from slightly negative to slightly positive rates between days (-15 to 10 mmol m-2 d-1), though with an overall negative average for the week (-7 mmol m-2 d-1). Because of the complete cover of the lake bottom by charophytes they were responsible for the entire gross production and 90% of respiration in the lake. Sediment respiration was mainly fueled by degradation of dead charophyte debris, the surrounding terrestrial landscape being very oligotrophic, sparsely vegetated and having thin soils (Baastrup‐ Spohr et al. 2015). Low sediment respiration rates can be explained by the low organic content in sediments (about 10% of DM) and regular exposure of shallow sediments to atmospheric air during summer drought (Christensen et al. 2013, Sand-Jensen et al. 2015) resulting in enhanced decomposition of organic material with access to the atmosphere and no O2 consumption from the lake water. Net production of the charophyte community was slightly positive during the two weeks in late May and early June (about 22 and 10 mmol m-2 d-1, respectively). These low rates are expected when the charophyte community has obtained the observed high density at which a net increase of the biomass and an associated positive daily O2 balance for the charophyte community is prevented by profound self-shading, depletion of inorganic carbon and accumulation of O2 during the day. Slightly negative daily NEP rates have been observed before in similar lakes dominated by dense charophyte communities during mid-summer, when GPP and NEP reached about 200-300 mmol O2 m-2 d-1, while positive NEP rates (about 40 mmol m-2 d-1) have been measured during active growth of the charophyte biomass in spring and in 97 late summer after refilling of the shallow waterbody following mid-summer drought (Christensen et al. 2013). Reproducible metabolic estimates across the lake – Trust in the reported metabolic features is strengthened by the calculations of reproducible diurnal courses from single surface sensors at different locations and integrated responses from many sensors along the vertical profile and across the lake. The variability of estimated rates between sensors was also relatively modest. For example, nocturnal respiration exhibited a characteristic decline from sunset to sunrise during all 11 nights. Also, all seven O2 sensors located across the lake showed almost the same average rates (mmol m-2 d-1) of NEP during a week measurements (-5 to – 9), while GPP (125 to 266) and R (-118 to – 256) varied 2-fold. Some of the shallow sites had a shorter charophyte canopy and a thinner sediment on the limestone (e.g. location E and G) which may account for the lower rates of GPP and R than deeper sites with taller charophytes. The reproducible patterns are probably due to the continuous charophyte cover across the small shallow lake. The short vertical and horizontal distances and the recurring nocturnal mixing will tend to homogenize the water masses, the O2 signals and the estimated metabolism despite vertical stratification of temperature and O2 at the deepest sites during summer days. In addition, we made a special effort to directly determine gas exchange with the atmosphere as a function of wind speed as part of the metabolic estimates permitting us to perform running corrections for the air-water O2 exchange. Outside the summer, continuous mixing of the entire water mass should make the O2 signal from a single mid-station sensor in this small lake sufficiently reliable for estimating whole-system metabolism. In many other lakes, metabolic activity and physical dispersion of O2 signals are much more complex and several sensors and more sophisticated models of air-water gas exchange are needed to obtain reliable metabolic rates(Lauster et al. 2006, Van de Bogert et al. 2007, Sadro et al. 2011a, Van de Bogert et al. 2012). This is the 98 situation in lakes with a high spatial physical and biological complexity because of a shoreline with variable development of benthic phototrophs and heterotrophs on different sediment types and partly separated surface and bottom waters of variable volumes and diverging metabolic activity (Staehr et al. 2012b). However, even in lakes with a regular shape and bathymetry, variability of metabolic estimates between sensors can be astonishingly high; e.g. GPP from - 132 to 250 mmol O2 m-2 d-1 during ten days in Sparkling Lake (Van de Bogert et al. 2012). Using four randomly placed oxygen sensors increased the precision of daily metabolism estimates 4-fold over single-location measures in Van de Bogert et al.’s study. The generality and possible reasons for the high variability of metabolism estimates should be checked in future studies because the results sincerely question the reliability of free-water approaches to estimate metabolism in large and medium-sized lakes. This high within-lake variability could explain why long-time series of metabolism estimates may show extensive day-to-day variation that is only partially explainable by known driving variables such as irradiance, temperature, vertical mixing and desiccation-refilling (Sand-Jensen & Staehr 2007, Coloso et al. 2011, Christensen et al. 2013). Alternatively, if there are time-delays between driving variables (e.g. mixing) and metabolism, or important driving variable (e.g. nutrient availability) are not accounted for in model analyses, metabolism estimates could still reflect the actual conditions. In the present multiple-sensor study and a previous single-sensor study of metabolism in small charophyte-dominated lakes (Christensen et al. 2013), we found reproducible diurnal patterns and long-term patterns closely related to environmental characteristics known to regulate photosynthesis and respiration (e.g., irradiance, temperature, DIC, pH, O2, and phototroph biomass). To confirm the effect of these variables it is essential, that the free-water approach are combined with controlled experiments in the field or in the laboratory on field samples retrieved for immediate analysis. Such experiments allowed us to confirm afternoon depression of charophyte 99 photosynthesis by elevated O2 and pH and declining DIC and CO2. It is recommended to perform controlled experiments with field material concurrent with free-water measurements (Alnoee et al. 2015). Controlled chamber experiments coupled to open-water measurements help identifying the main processes and mechanisms that are driving ecosystem metabolism and its photosynthetic and respiratory processes. References Alnoee, A. B., Riis, T., Andersen, M. R., Baattrup-Pedersen, A., and Sand-Jensen, K. 2015. Whole-stream metabolism in nutrient-poor calcareous streams on Öland, Sweden. Aquatic Sciences 77:207-219. Andersen, M. R., Jones, I. D., Woolway, R. I., and Sand-Jensen, K. 2015a. Profound daily stratification and vertical mixing in a shallow, wind-exposed pond with submerged macrophytes. Submitted. Andersen, M. R., Kragh, T., and Sand-Jensen, K. 2015b. Recurring stratification and mixing generate extreme diurnal oxygen and carbon cycles in shallow vegetated lakes. in prep. Bade, D. L., and Cole, J. J. 2006. Impact of chemically enhanced diffusion on dissolved inorganic carbon stable isotopes in a fertilized lake. J. Geophys. Res 111:C01014. Beardall, J., Quigg, A., and Raven, J. A. 2003. Oxygen consumption: photorespiration and chlororespiration. Pages 157-181. Photosynthesis in algae. Springer. Baastrup‐Spohr, L., Sand‐Jensen, K., Nicolajsen, S. V., and Bruun, H. H. 2015. From soaking wet to bone dry: predicting plant community composition along a steep hydrological gradient. Journal of Vegetation Science. Christensen, J., Sand‐Jensen, K., and Staehr, P. A. 2013. Fluctuating water levels control water chemistry and metabolism of a charophyte‐dominated pond. Freshwater Biology 58:1353-1365. Cole, J., and Caraco, N. 1998. Atmospheric exchange of carbon dioxide in a low-wind oligotrophic lake measured by the addition of SF6. Limnology and Oceanography 43:647-656. Cole, J., Prairie, Y., Caraco, N., McDowell, W., Tranvik, L., Striegl, R., Duarte, C., Kortelainen, P., Downing, J., and Middelburg, J. 2007. Plumbing the global carbon cycle: integrating inland waters into the terrestrial carbon budget. Ecosystems 10:172-185. Coloso, J. J., Cole, J. J., and Pace, M. L. 2011. Short-term variation in thermal stratification complicates estimation of lake metabolism. Aquatic Sciences 73:305-315. Downing, J., Prairie, Y., Cole, J., Duarte, C., Tranvik, L., Striegl, R., McDowell, W., Kortelainen, P., Caraco, N., and Melack, J. 2006. The global abundance and size distribution of lakes, ponds, and impoundments. Limnology and Oceanography 51:2388-2397. Gibson, C. 1975. A field and laboratory study of oxygen uptake by planktonic blue-green algae. The Journal of Ecology:867-879. Hanson, P. C., Carpenter, S. R., Cardille, J. A., Coe, M. T., and Winslow, L. A. 2007. Small lakes dominate a random sample of regional lake characteristics. Freshwater Biology 52:814-822. Jähne, B., Heinz, G., and Dietrich, W. 1987. Measurement of the diffusion coefficients of sparingly soluble gases in water. Journal of Geophysical Research 92:10767-10776. 100 Kelly, M. G., Thyssen, N., and Moeslund, B. 1983. Light and the annual variation of oxygen-based and carbon-based measurements of productivity in a macrophyte-dominated river. Limnology and Oceanography 28:503-515. Lacour, T., Sciandra, A., Talec, A., Mayzaud, P., and Bernard, O. 2012. Diel variations of carbohydrates and neutral lipids in nitrogen‐sufficient and nitrogen‐starved cyclostat cultures of isochrysis sp. 1. Journal of Phycology 48:966-975. Langman, O., Hanson, P., Carpenter, S., and Hu, Y. 2010. Control of dissolved oxygen in northern temperate lakes over scales ranging from minutes to days. Aquatic Biology 9:193-202. Lauster, G. H., Hanson, P. C., and Kratz, T. K. 2006. Gross primary production and respiration differences among littoral and pelagic habitats in northern Wisconsin lakes. Canadian Journal of Fisheries and Aquatic Sciences 63:1130-1141. Lucas, W. J. 1985. Bicarbonate utilization by Chara: a re-analysis. Pages 229-254. Inorganic carbon uptake by aquatic photosynthetic organisms. American Society of Plant Physiology Rockville, Maryland, USA. Mackay, E. B., Jones, I. D., Thackeray, S. J., and Folkard, A. M. 2011. Spatial heterogeneity in a small, temperate lake during archetypal weak forcing conditions. Fundamental and Applied Limnology/Archiv für Hydrobiologie 179:27-40. Mackereth, S., Heron, J., and Talling, J. 1978. Water analysis: some revised methods for limnologists. Freshwater Biological Association. Science Publ 36. Madsen, T. V., and Sand-Jensen, K. 1991. Photosynthetic carbon assimilation in aquatic macrophytes. Aquatic Botany 41:5-40. Markager, S., and Sand-Jensen, K. 1989. Patterns of night-time respiration in a dense phytoplankton community under a natural light regime. The Journal of Ecology:49-61. Markager, S., and Sand-Jensen, K. 1994. The physiology and ecology of light-growth relationship in macroalgae. Progress in phycological research:209-298. McConnaughey, T. 1991. Calcification in Chara corallina: CO2 hydroxylation generates protons for bicarbonate assimilation. Limnology and Oceanography 36:619-628. Odum, H. T. 1957. Primary Production Measurements in Eleven Florida Springs and a Marine Turtle‐Grass Community. Limnology and Oceanography 27:85-97. Pedersen, O., Colmer, T. D., and Sand-Jensen, K. 2013. Underwater photosynthesis of submerged plants recent advances and methods. Frontiers in Plant Science 4. Raymond, P. A., Zappa, C. J., Butman, D., Bott, T. L., Potter, J., Mulholland, P., Laursen, A. E., McDowell, W. H., and Newbold, D. 2012. Scaling the gas transfer velocity and hydraulic geometry in streams and small rivers. Limnology & Oceanography: Fluids & Environments 2:41-53. Sadro, S., Melack, J. M., and MacIntyre, S. 2011a. Spatial and Temporal Variability in the Ecosystem Metabolism of a High-elevation Lake: Integrating Benthic and Pelagic Habitats. Ecosystems:1-18. Sadro, S., Nelson, C. E., and Melack, J. M. 2011b. Linking diel patterns in community respiration to bacterioplankton in an oligotrophic high‐elevation lake. Limnology and Oceanography 56:540-550. Sand-Jensen, K., Båstrup-Spohr, L., Christensen, J. P. A., Alnøe, A. B., Andersen, M. R., Jespersen, T. S., Riis, T., and Bruun, H. H. 2015. Caught Between Drought and Flooding on Ölands Great Alvar (Swedish). Svensk Botanisk Tidskrift 109. Sand-Jensen, K., Baastrup-Spohr, L., Winkel, A., Moller, C. L., Borum, J., Brodersen, K. P., Lindell, T., and Staehr, P. A. 2010. Plant distribution patterns and adaptations in a limestone quarry on Oland. Svensk Botanisk Tidskrift 104:23-31. Sand-Jensen, K., and Frost-Christensen, H. 1998. Photosynthesis of amphibious and obligately submerged plants in CO2-rich lowland streams. Oecologia 117:31-39. Sand-Jensen, K., and Staehr, P. A. 2007. Scaling of pelagic metabolism to size, trophy and forest cover in small Danish lakes. Ecosystems 10:128-142. Sand-Jensen, K., and Staehr, P. A. 2012. CO2 dynamics along Danish lowland streams: water-air gradients, piston velocities and evasion rates. Biogeochemistry 111:615-628. 101 Solomon, C. T., Bruesewitz, D. A., Richardson, D. C., Rose, K. C., Van de Bogert, M. C., Hanson, P. C., Kratz, T. K., Larget, B., Adrian, R., and Babin, B. L. 2013. Ecosystem respiration: Drivers of daily variability and background respiration in lakes around the globe. Limnol. Oceanogr 58:849-866. Staehr, P. A., Baastrup-Spohr, L., Sand-Jensen, K., and Stedmon, C. 2012a. Lake metabolism scales with lake morphometry and catchment conditions. Aquatic Sciences 74:155-169. Staehr, P. A., Christensen, J. P., Batt, R. D., and Read, J. S. 2012b. Ecosystem metabolism in a stratified lake. Limnology and Oceanography 57:1317-1330. Staehr, P. A., Testa, J. M., Kemp, W. M., Cole, J. J., Sand-Jensen, K., and Smith, S. V. 2012c. The metabolism of aquatic ecosystems: history, applications, and future challenges. Aquatic Sciences 74:15-29. Vadeboncoeur, Y., Kalff, J., Christoffersen, K., and Jeppesen, E. 2006. Substratum as a driver of variation in periphyton chlorophyll and productivity in lakes. Journal of the North American Benthological Society 25:379-392. Vadeboncoeur, Y., Vander Zanden, M. J., and Lodge, D. M. 2002. Putting the Lake Back Together: Reintegrating Benthie Pathways into Lake Food Web Models. BioScience 52:1. Van de Bogert, M. C., Bade, D. L., Carpenter, S. R., Cole, J. J., Pace, M. L., Hanson, P. C., and Langman, O. C. 2012. Spatial heterogeneity strongly affects estimates of ecosystem metabolism in two north temperate lakes. Limnology and Oceanography 57:1689. Van de Bogert, M. C., Carpenter, S. R., Cole, J. J., and Pace, M. L. 2007. Assessing pelagic and benthic metabolism using free water measurements. Limnology and Oceanography: Methods 5:145-155. Wanninkhof, R. 1992. Relationship between wind speed and gas exchange. J. Geophys. Res 97:7373–7382. Legends Fig. 1. Diurnal course of incident irradiance and surface temperature (upper panel), dissolved oxygen and pH in surface waters (middle panel), and GPP and NEP (lower panel) based on measurements of a single oxygen sensor in surface waters in the middle of the 0.31-m deep lake during six days in late May 2014. Fig. 2. Mean diurnal patterns of GPP and NEP based on measurements during six days in late May 2014 from two oxygen sensors near the water surface (2 and 9 cm, upper panel) and a total of five sensors placed along the vertical profile (2 to 30 cm, lower panel) at a 31-cm deep site in the middle of the lake. Fig. 3. Mean diurnal patterns of GPP and NEP based on measurements during seven days in early June from seven oxygen sensors (A-G) placed at 8-12 cm depth below the surface at different locations in a small charophyte-dominated lake. The mean volume-weighted GPP and NEP for the entire lake based on the seven oxygen sensors was determined. Depth contours and location of sensors are shown on the map. 102 Fig. 4. Rates of GPP and NEP as a function of irradiance and pH before noon and in the afternoon on three days in late May with a clear sky and regular sinusoid diel changes in irradiance, temperature, oxygen and pH. Rates are based on measurements of dissolved oxygen every 10 minutes from five oxygen sensors placed across the vertical profile (2 to 30-cm depth) at a 31-cm deep site in the middle of the lake. Measurements in the left panels were restricted to irradiances above 50 µmol m-2 s-1, while measurements in the right panels were restricted to irradiances above 500 µmol m-2 s-1. 103 1000 10 0 600 0 Temp (C) PAR (µmol m-2 s-1) 2000 PAR Temp 20 300 200 100 0 40 GPP and NEP (mmol m-2 h-1) 9 400 pH Oxygen (µM) 500 O2 8 pH GPP 7 NEP 20 0 -20 Day 1 Day 2 Day 3 Day 4 Day 5 Day 6 104 Surface waters 30 GPP and NEP (mmol m-2 h-1 ) 20 10 0 -10 30 Water column GPP NEP 20 10 0 -10 0 4 8 12 16 20 24 Time of day 105 20 20 A 10 10 0 0 F -10 E -10 G 20 20 B F A 10 10 B 0 0 C -10 -10 20 E C 10 0 -10 20 D GPP and NEP (mmol m -2 h-1 ) GPP and NEP (mmol m -2 h-1) D 20 10 0 -10 20 10 10 0 0 -10 -10 0 4 8 12 16 Time of day 20 24 G 0 M ean 4 8 12 16 20 24 Time of day 106 GPP (mmol m-2 h-1) 30 20 10 0 NEP (mmol m-2 h-1) -10 30 Before noon Afternoon 20 10 0 -10 0 500 1000 1500 Irradiance (µmol m-2 s-1) 8 9 10 pH 107 Table 1. Daily incident photon irradiance (PAR), surface temperature, surface inorganic carbon concentrations (DIC and CO2) and integrated daytime NEP, nocturnal NEP (= nocturnal respiration) and diurnal NEP during 5-6 days in late May and early June in a small lake. Photon irradiance and temperature are mean values for the entire day, while DIC and CO2 are concentrations at noon. Mean duration of the night was 6.7 hours in late May and 5.7 hours in early June resulting in a mean nocturnal ecosystem respiration rate of 7.87 and 8.23 mmol O2 m-2 h-1 in late May and early June, respectively. 108 Table 2. Nocturnal respiration rates in the small lake for 5-6 days in late May and early June during the first 30 minutes (RIni) and the last 90 minutes (REnd) of the night. Respiration rates and the quotient REnd/RIni are shown both uncorrected and corrected for temperature changes (Q10 = 2) during the night. Table 3. Mean daily rates of GPP, NEP and R derived from continuous oxygen measurements at seven different positions (A to G) and the overall mean of all measurements in a small lake during a week in early June. Daily minimum and maximum daily rates are in parenthesis. 109 Paper 4 - Whole-stream metabolism in nutrient-poor calcareous streams on Öland, Sweden 110 Whole stream metabolism in nutrient-poor calcareous streams on Öland, Sweden Anette B. Alnoee 1), Tenna Riis1), Mikkel R. Andersen2), Annette Baattrup-Pedersen1) and Kaj Sand-Jensen2) 1) Department of Bioscience, Aarhus University, Ole Worms Alle 1, 8000 Aarhus C, Denmark 2) Department of Biology, Freshwater Biology, University of Copenhagen, Universitetsparken 4, 2100 København Ø, Denmark Keywords: seasonal metabolism, primary production, ecosystem respiration, surface irradiance, headwater streams Aquatic Sciences 2015, 77(2), 207-219 111 Abstract We studied whole-stream metabolism in three headwater non-forested stream reaches on the island of Öland, Sweden in order to characterize the metabolism of this unusual ecosystem and to compare it with other stream ecosystems in NW Europe. Gross primary production (GPP) was generally low (< 4 g O2 m-2 d-1) with the lowest GPP recorded in the most upstream, shallow reach draining the thin soils of the limestone Alvar plains. Here, completely flooded terrestrial plants could account for the whole primary production at baseflow. Ecosystem respiration (ER) increased several fold with agricultural impact, resulting in heterotrophic stream conditions downstream and higher light requirements for photosynthesis to outweigh respiration. A strong relationship between daily GPP and ER was found at the two most nutrient-poor sites. Temperature corrected instantaneous ER rate was highest in the beginning of the night, but decreased at the end of the night at the same reaches, indicating that dark respiration depleted photosynthetic products and became limited by organic substrates. The broad-scale comparison of open NW European streams showed a 1:1 relationship, indicating a tight link between daily GPP and ER during summer (April-August) but not during winter. This study has extended the range of GPP and ER measurements to include nutrient-poor NW European streams, thereby increasing the knowledge on stream metabolism in this, otherwise, highly agricultural impacted region. It also documented a strong relationship between GPP and ER in streams, ranging from extremely nutrient poor to moderately nutrient rich conditions during spring and summer. 112 Introduction Land use has proven to be an important factor determining whole stream metabolism. Agricultural and urban streams receive additional nutrients and are more productive than natural streams which are relatively unaffected by human activities (Bernot et al. 2010). Most open streams in north-temperate lowland regions of Europe drain deep, fertile agricultural soils, they are rich in dissolved nutrients and support high biomasses of benthic microalgae and submerged macrophytes (e.g. Sand-Jensen et al. 1988; 1989; Kristensen and Hansen 1994; European Environment Agency 2005). Gross primary production (GPP) of benthic algae and macrophytes is high under wellilluminated conditions from spring to autumn, and ecosystem respiration (ER) is relatively high year-round due to degradation of allochthonous and autochthonous material (Edwards and Owens 1962; Kelly et al. 1983). The open lowland streams are heterotrophic (ER > GPP) on an annual basis, though GPP may exceed ER during periods in spring-summer with intense phototrophic growth (Sand-Jensen 1997). Therefore, the magnitude and temporal pattern of GPP and ER reflect both the intensity and timing of phototrophic production and organic decomposition which, in turn, are influenced by light availability, nutrient richness and input of easily degradable organic matter (Simonsen 1974; Mulholland et al. 2001). Streams with very low nutrient availability due to thin, slowly mineralizing or wellleached soils in the catchment supposedly have low in-stream growth of benthic phototrophs and heterotrophic communities. Daily GPP and ER should be low and in approximate balance provided that the external input of easily degradable organic matter is low and less than the autochthonous material, and that the temporal and spatial coupling between production and decomposition is close (Odum 1971; Solomon et al. 2013). Low daytime photosynthesis may also lead to extensive organic carbon limitation of respiration by phototrophs and bacteria during the subsequent night period and gradually lower respiration rates as the night progresses and respiratory organic pools are consumed, as previously shown for pelagic algal communities (Gibson 1978; Markager and SandJensen 1989). In open shallow clear-water streams, the incident solar UV-flux during the day could also disrupt the organic aromatic compounds and facilitate coupled bacterial degradation during the early part of the night. We propose that close coupling of daily GPP and ER and gradually decreasing night-time respiration rates may prevail for small, shallow nutrient-poor streams draining the thin soils on the open Ordovician limestone pavements of the great Alvar plain on the island of Öland, SW Sweden (Ekstam and Forshed 2002). The streams on Öland are small and shallow, have low slopes and low current velocities, facilitating the coupling between production 113 and decomposition. The small ephemeral and permanent ponds on the Alvar have highly transparent waters and concentrations of organic matter and dissolved inorganic nutrients are notably low (Sand-Jensen et al. 2010; Christensen et al. 2013). We expect that water chemistry is similar in the streams on the Alvar plain and that this may explain why there is little visible growth of algae on the stream bottom. Here we present a case study including three stream reaches located on Öland, Sweden in order to include hitherto unexplored nutrient-poor streams in a comparison of the metabolism of open, NW European temperate streams to evaluate the range of metabolic rates and the coupling between GPP and ER. The three stream reaches included an upstream reach, reach I, draining the natural sparsely vegetated grassland on the thin soils of the great Alvar plain, reach II, impacted by agricultural land use over short distances, and reach III draining deeper soils and impacted by mixed forest and agricultural fields over longer distances. From reach I to reach III, our predictions were that (i) the biomass of benthic algae would increase from very low to higher values, (ii) GPP, and in particular ER, would increase from very low to higher values, generating stronger heterotrophy, and (iii) the coupling between GPP and ER would decrease. Material and methods Study site description The study was conducted in two stream systems in separate catchments originating on the great Alvar plain on the large Swedish island of Öland located in the southern Baltic Sea. These Alvar streams experience approximately the same climatic conditions as the nutrient-rich Danish and United Kingdom streams draining fertile agricultural soils (Edwards and Owens 1962; Simonsen 1974). Annual mean precipitation is around 500 mm and mean temperature is -1°C in January and 15°C in July (www.smhi.se). The great Alvar plain is a 260 km2, genuine nature reserve (UNESCO World Heritage) having a species-rich, unproductive grassland vegetation with very few deciduous trees occurring only in fissures in the horizontal, almost impermeable, limestone plates and small areas with thicker soil layers covering the limestone surfaces. As the streams leave the Alvar plain and pass through 0.5-4 km wide strips of agricultural land towards the Baltic Sea located in the East, they become deeper and more influenced by bank shading and agriculture. The upstream reach I is supplied by rain water and aquifers close to the surface of the Alvar plain and regularly dries out for 2-4 months between May and August, and occasionally also 114 in September-October (Leberfinger and Hermann, 2011). Reach II and III receive some water from deeper cultivated moraine soils and may retain small discharges during summer. Therefore, to allow measurement and comparison, we conducted all measurements in May 2010 and May and October 2011 when all three reaches were transporting water. Reach I (56° 32.473’N, 16° 34.037’E) was located in River Frösslundabäcken close to the spring on the Alvar plain and 6.5 km from the Baltic Sea (Leberfinger and Hermann, 2011, their Fig. 1). Reach II (56° 32.695’N, 16° 36.644’E) was located 4 km downstream of reach I in River Frösslundabäcken after the stream had passed about 2 km of open Alvar and meadow and 2 km of cultivated grain fields. Reach III (56° 35.680’N, 16° 39.165’E) was located in the lower part of River Åbybäcken in an agricultural area east of Gårdby. This reach was 5 km from the spring on the Alvar plain and 3.5 km from the sea. Reach I and II are in one catchment while reach III is in another. The proportion of catchment occupied by Alvar plain ranged from 100% at reach I, to 40% at reach II to 15% at reach III. In contrast, agricultural land use occupied 30% and 40% at reach II and III, respectively, as determined by GIS analysis of maps showing land use. The length of the study reaches varied from 130 to 246 m. To describe the physical conditions and vegetation composition and abundance, transects were placed across the stream every 10 m along the reaches. In each transect, stream width was measured and water depth, substrate type and macrophyte species occurrence were determined at five points at equal distances. In each reach, the proportions of run, riffle and pool flow types were estimated by visual assessment at 10 m intervals. Average current velocity and travel time of water for the whole reach were measured by injecting a pulse of NaCl and recording conductivity over time downstream of the reach (White 1978). Discharge was calculated as the product of mean current velocity and mean cross-sectional stream area for the whole reach. The slope of the reaches was determined during the first visit using standardized leveling equipment to measure change in the surface water level along the stream reach. Reach III had a much lower discharge in October 2011 than in May 2011, and slope measurements were repeated. In-stream plant cover on the reach scale was calculated by dividing the number of points in transects with plant observations by the total number of points examined. The relative frequency of species occurrence was calculated by dividing all observations per species by the total number of plant observations. Two water samples were collected at each reach and during each sampling period, and analyzed in the laboratory for NO3- and NH4+ using a flow injection analyzer (Lachat, QuikChem 115 FIA+, 8000series, Method 10-107-04-1-C and Method 10-107-06-3-D, respectively). Detection limits are 0.01 mg N L-1 for NO3- and 0.005 mg N L-1 for NH4+. Soluble reactive phosphorus (SRP) and total phosphorus (TP) were measured using the methods described by Brix and Schierup (2001) based on spectrophometry, and total nitrogen (TN) and particulate organic carbon (POC) was determined on a TOC-VCPH analyzer (Shimadzu, TNMU). Detection limits were 1 µg P L-1 for TP and SRP, 0.1 mg N L-1 for TN, and 0.56 mg C L-1 for POC. Water samples for NO3-, NH4+ and SRP were filtered before analyses. Alkalinity was determined by acidimetric end point titration (pH 3.7) using 0.05 M HCl (Rebsdorf 1972). From alkalinity and pH, we determined free CO2 content using Table 3 in Pedersen et al. (2013). Stream reach metabolism Stream reach metabolism was measured by the upstream-downstream two-station oxygen change technique described by Odum (1956) following improvements by Marzolf et al. (1994, 1998) and Young et al. (1998). We used YSI 6600 V2-2, Multiparameter Water Quality Probes to measure dissolved O2 (DO, mg L-1), pH and temperature every 10 minutes. Surface irradiance was measured with a LiCor (Li-1400) quantum sensor (Lincoln, Nebraska) placed on the bank. The probes were calibrated at 100% saturation in calibration caps before they were deployed in the streams. To correct for drift of O2, the probes were placed together in the stream before and after measurements for at least half an hour. Drift in the O2 sensors was assumed to be linear over time, and any difference between sensors over time was corrected accordingly. Average drift between two sensors was 0.08 mg O2 L-1 day-1. We measured reaeration rate based on measurements of gas exchange velocity (min-1) for gas exchange over the air-water interface using cylindrical chambers of the same type as described by Sand-Jensen and Staehr (2012). Bott et al (2006) recommends to measure reaeration using propane gas, but a gas chromotograph (GC) could not be brought for the remote fieldwork, so the chamber method was used. The chambers permit a natural, undisturbed water flow below a water-air interface area of 0.39 m2 inside the chamber holding an air volume of 47.9 L. The chamber was placed at the water surface and flushed with N2-gas from a pressure tank. Subsequently, the influx rate of CO2 from the water to the enclosed air volume was recorded at 3 second intervals using an infrared gas analyzer (LI-COR Environmental Li-840) connected to a laptop computer. The gas exchange was recorded for 10 minute intervals and repeated three times at each location. CO2 concentrations in the chamber increased linearly over time (r2: 0.994-0.999), and the mean coefficient of variation of triplicate calculation of evasion rates (CV: SD/xmean) was only 116 0.08. The calculated values for reaeration was normalized to 20 ˚C, which corresponds to a Schmidt number of 600 (k600), to allow comparisons between gas exchange velocities measured at ambient temperatures. The reaeration speeds was normalized according to the equation by Raymond et al. (2012): (1) k gas1 k gas2 Sc gas1 Sc gas 2 n which is based on work done by Jähne et al. (1987) and Wanninkhof (1992), where kgas1 and kgas2 is the reaeration rate at ambient temperature and 20˚C respectively, Sc is Schmidt number for the two gasses and n is a constant expressing the mixing regime. In streams, n is set to 0.5 according to Benson et al. (2014). The same equation was used to convert reaeration rates for CO2 to reaeration rates for O2. Schmidt numbers for CO2 and O2 at different temperatures are available in Wanninkhof (1992). The reaeration rate was measured for the different flow types (run, riffle and pool). At each site, we measured reaeration three times in a row and the measurements were averaged. Relative cover of flow types was multiplied by the respective reaeration rates and summed to attain a whole-reach flow-weighted reaeration. In May 2010, reaeration rates were measured at two runs at reach I, and at two runs and one riffle at reach II. In May 2011 at reach II, we measured reaeration at two runs (one slow and one fast) and at two riffles. No pools were present in the reach, but one of the runs had deep slow flowing water. At reach III, we measured reaeration at two runs (one slow and one fast). In October 2011, we measured reaeration rates at two runs and one riffle (the only one on the reach) at reach I. At reach II, we measured reaeration at two riffles (one slow and one fast), at one run and one pool, and at reach III, we measured reaeration rate at two runs (one slow and one fast). Metabolism was measured on sunny days, and therefore, measured GPP (g O2 m-2 d-1) is considered as maximum values for the reaches and periods. Net O2 changes corrected for reaeration were calculated at 10-min intervals during the 24 hours. Metabolism calculations followed Bott (2006). Daily net ecosystem production (NEP, g O2 m-2 d-1) was determined from one hour after sunrise to one hour before sunset (according to timeanddate.com). ER (g O2 m-2 d-1) was determined from changes in metabolism in the dark period between 0 and 3 a.m. and multiplied by 24 to attain daily ER. GPP was calculated as the sum of NEP during the photic period plus hourly ER rates multiplied by the photic hours. NEP was converted to NEP g O2 m-2 min-1 from the 10 minute measurements and plotted against surface irradiance to compare the potential production between the three reaches. Here we omitted measurements from the afternoon in reach I and 117 measurements before noon in reach II and III due to shading from bank vegetation to be able to compare measurements made in full sun between the reaches. During night-time, the progressive changes in dark respiration were determined after correcting the metabolism (R15) for temperature changes according to an Arrhenius equation (2) with a Q10 of 2.0 as being a general Q10 for biological processes: (2) R15 = Ra * Exp[(15-T a)*0.0693] where, R15 is the calculated metabolism at 15 °C, Ra (g O2 m-2 min-1) is the measured respiration rate at ambient temperature (Ta) and 0.0693 (˚C-1) is a constant temperature coefficient corresponding to Q10 of 2 (Sand-Jensen et al. 2005). Chlorophyll a (g chl. a m-2) was measured on four sediment types (mud, sand, gravel and stone). Five replicates were collected on mud, sand and gravel and 10 on stone (five stones from run and five from riffles). Sand and mud were sampled using a small cylindrical core (area = 6.7 cm2) and gravel with a large core (area = 22.2 cm2). Chlorophyll was extracted from a 1 cm (sand and mud) and a 3 cm (gravel) surface sediment core. Chlorophyll on stones was measured by scrubbing the stones thoroughly and filtering the particles onto glass fiber filters (GFC) for ethanol extraction. Chl. a was measured in triplicate in May and October 2011 by filtering stream water onto glass fiber filters. All chlorophyll extractions were made in 90% ethanol for 24 hours, and chlorophyll was measured in a spectrophotometer (Shimadzu, UV-1800) and calculated according to Lichtenthaler (1987). Organic matter (ash-free dry mass, AFDM) in sediment samples was also measured at all reaches and for all sediment types using the same number and type of samples as for chlorophyll determination. Organic matter was measured as loss on ignition at 550 °C for 24 hours of 60 °C dried samples. For chl. a and organic matter, we calculated habitat-weighted chl. a (mg chl. a m-2) and organic matter (g AFDM m-2) by multiplying chl. a biomass and organic matter content with the proportional cover of the different sediments and adding all values together. Photosynthesis experiment For the dominant in-stream plant species (Alopecurus geniculatus L., Carex flacca Schreb., Galium palustre L., Mentha aquatic L.) and algae species (Spirogyra sp. and Cladophora sp.) at reach I and II, a photosynthetic experiment was performed in May 2010 to estimate the possible contribution of plants to in-stream primary production and respiration. Before the 118 experiment, the oxygen electrode (OX500; Unisense, Aarhus, Denmark) was calibrated in water with 0% and 100% air saturation obtained by bubbling with N2 and atmospheric air, respectively. Separate plant leaves or algal filaments were incubated in triplicate in ambient stream water in 50 mL glass-stoppered glass bottles, placed on a rotating wheel in a temperature-constant incubator (15 o C) and illuminated with 450 µmol m-2 s-1 for 2 hours, without reaching supersaturation. Subsequently, the bottles were transferred to the dark for 20 hours to measure respiration. Ambient stream water without plants was used in four blank bottles. Oxygen concentration was measured in samples and blanks after light and dark incubation. Plants and algae were then freeze-dried and weighed to calculate the photosynthetic rate (Pambient, mg O2 g DW-1 d-1) and dark respiration (R, mg O2 g DW-1 d-1) relative to dry weight (DW). To estimate the contribution from the different plants and algae to the metabolism of the entire reach, we multiplied net photosynthesis and respiration relative to DW with the biomass in the field expressed as DW m-2 d-1, thereby getting GPP (g O2 m-2 d-1) and R24 (g O2 m-2 d-1). Hourly rates were converted to daily rates by multiplying with day length. Photosynthetic rates will, therefore, overestimate in situ rates because the calculation assumes that tissues are fully light saturated throughout the day, even in dense stands, which is unlikely to be fulfilled. Furthermore, the measurements did not include respiration from roots, thus, the photosynthetic calculations represent maximum capacity under ambient conditions rather than realized rates. In the initial survey, we determined the coverage (25, 50 or 75% cover) of the following plants: A. geniculatus, C. flacca, G. palustre, and M.aquatica, and of two macroalgae: Spirogyra sp. and Cladophora sp.. We sampled the different species in triplicate (bottom area = 22.2 cm2) within the 25, 50 and 75% cover, dried the samples and measured DW, after which the data obtained were used to calculate in-stream plant DW m-2 stream bed. Comparison of metabolism among streams To identify variability and regulating factors for the metabolic parameters (GPP, ER, GPP/ER), we compared daily values for stream reaches on Öland with those reported for other open reaches in North European lowland streams (Edwards and Owens 1962; Simonsen 1974; Kelly et al. 1983; Riis et al. 2012; 2014; Alnoee unpubl. data). We examined the relationship between daily GPP and ER for the spring-summer period (April-August) when irradiance is high and the autumnwinter period (September-March) when irradiance is low. Furthermore, we compared GPP/ER with surface irradiance for open reaches from all over the world where these values have been measured simultaneously (Edwards and Owens 1962; Simonsen 1974; Fellows et al. 2001; Mulholland et al. 119 2001; Acuña et al. 2011; Rasmussen et al. 2011). This relationship was constructed to evaluate if Öland streams separate from other streams due to strong nutrient limitation. If the streams are nutrient limited, one should expect that the GPP/ER ratio would be lower than in streams in nutrient-rich areas at the same irradiance. Results Physics and chemistry All three stream reaches on Öland were small, had low downstream slopes and low current velocities (Table 1). Reach I and II ran close to the riparian ground surface, whereas reach III was incised and more shaded by emergent plants on the south bank. Travel time varied from 41 to 256 min between reaches. Alkalinity was consistently high (3.01-4.88 meq L-1, Table 2), and the concentrations of TP (4.89-14.88 µg P L-1, Table 2) and SRP were extremely low (<0.01-7.73 µg P L-1). Reach I on the Alvar plain was only weakly supersaturated (about two-fold) with CO2 (30 µmol L-1), while saturation was about 20-fold higher in reach III (250-380 µmol L-1). Water pH declined with increasing concentrations of CO2. Oxygen concentrations were close to air saturation in reach I and II and consistently undersaturated in reach III. While NO3- was under the detection limit and NH4+ was very low (0.01-0.03 mg N L1 ) in reach I, both NO3- (0.05-0.24 mg N L-1) and NH4+ (0.02-0.08 mg N L-1) increased in reach II after passage through an agricultural section (Table 2). The influence of agriculture and more fertile soils on NO3- concentrations (0.70-1.99 mg N L-1) was even stronger in reach III. Sediment, vegetation and organic matter Sediment cover varied between sampling periods and reaches (Table 3). The main sediment types were thin deposits of sand and gravel on the limestone pavement in reach I, bare limestone pavement and thin organic deposits on the limestone pavements in reach II, and thicker sand deposits in reach III. The in-stream plant species were A. geniculatus, C. flacca, G. palustre, M. aquatica and Potentilla acaulis L. covering 73-78 % of reach I, Menyanthes trifoliata L., Berula erecta (Huds.) Coville, Sium latifolium L. and M. aquatica covering 27-29% of reach II, and B. erecta, S. latifolium and Phragmites australis (Cav.) Trin. ex Steud covering 43-69% of reach III. These species were amphibious plants able to live submerged as well as emerged. Obligate submerged macrophytes were only represented by filamentous green algae (Cladophora sp. and Spirogyra sp.) covering 5-17% of reach II. 120 Habitat-weighted benthic chlorophyll a varied from 32 to 398 mg chl. a m-2 with reach II having higher content than reach I and III (Table 3). The chl. a content was consistently low in the water at the three reaches (0.6 to 1.1 μg chl. a L-1). Compared to benthic chl. a, the chl. a content in pelagic microalgae relative to stream bed area was negligible (i.e. < 0.5 mg chl. a m-2). Habitat-weighted organic matter (AFDM) varied from 338 g m-2 to 1221 g m-2 (Table 3). Values varied the most between sampling periods at reach II and the least at reach III. There was no tendency of reach III having higher organic matter content on the stream bed (Table 3) or suspended in the water (Table 2). Stream metabolism Daily GPP was generally low but reach II attained moderately high values in May 2010 (Fig. 1, App. 1). Daily ER increased several fold from reach I to reach III in both May and October. As a result, GPP/ER declined downstream mainly due to the increase of ER. In May, GPP/ER was close to 1.0 in reach I and II, but lower in reach III. In October, all GPP/ER values were below 0.32. Variation in GPP, ER and GPP/ER was small between days within sampling periods (Fig. 1). NEP during the day exhibited a hyperbolic saturation response to surface irradiance for measurements conducted before noon in reach I and in the afternoon in reach II and III when shading by bank vegetation was minimal (Fig. 2). NEP required gradually higher incident irradiances to reach zero further downstream. Thus, 80% of the maximum NEP rate was obtained at 1370 µmol PAR m-2 s-1 in reach I, whereas reach II and III had not reached this level at 2500 µmol PAR m-2 s-1. Temperature-corrected dark respiration rates were very low and decreased as the night progressed in reach I and II, except for October in reach II (Fig. 3). In reach III, respiration rates were much higher and changed less during the night compared to reach I and II (Fig. 3). The contribution of submerged plants to the overall stream metabolism showed that the photosynthetic rates varied seven-fold among species, with the filamentous macroalgae, Cladophora sp. and Spirogyra sp., being the most productive (Table 4). The habitat-weighted metabolism of the different species derived from the laboratory measurements showed that they could contribute substantially to the in situ rates of GPP (1.2 to 14.1 g O2 m-2 d-1, corresponding to 52% to 210%; Table 4) and R24 (0.2-0.9 g O2 m-2 d-1, corresponding to 3% to 43%). Adding up the estimates of Pambient to GPP from the different individual plant species, yielded high values for reach I (6.1 g O2 m-2 d-1) and reach II (15.7 g O2 m-2 d-1), suggesting that in-stream plants, in theory, could account for the measured whole-system rates in reach I (2.3 g O2 m-2 d-1, Table 4, Fig. 1, App. 1) 121 and reach II (6.7 g O2 m-2 d-1, Table 4, Fig. 1, App. 1). The sum of habitat weighted dark respiration rates of plants yielded rates (3.0 in reach I and 1.1 g O2 m-2 d-1 in reach II, Table 4) that were within the range of the in situ measurements recorded in reach I (2.1 g O2 m-2 d-1, Fig. 1) and substantially lower than the rates in reach II in May 2010 (6.4-7.8 g O2 m-2 d-1, Fig. 1). Metabolic variability among Northern European streams There was a strong positive relationship between GPP and ER in the April-August measurements in NW European open lowland streams (r2 = 0.78, Fig. 4a). GPP values for the most nutrient-poor reach, reach I, on the Alvar plain were 5-10-fold lower than most values from nutrient-rich streams in the United Kingdom and Denmark. GPP and ER values for reach I and II on Öland were close to the 1:1 line, while the deviation was higher for reach III (Fig. 4a). The regression line including all points in figure 4a did not have a significantly different slope (p = 0.61) or intercept (p = 0.47) from the 1:1 line. During autumn-winter (September-March, Fig. 4b), GPP rates were low and typically lower than the ER rates. In accordance with these findings, the ratio of GPP to ER in a range of stream reaches increased with mean surface irradiance, reaching values above 1.0 at 43 mol PAR m-2 day-1 and a mean value of about 1.2 for even higher irradiances (Fig. 5). The shift from heterotrophy to autotrophy at 43 mol PAR m-2 d-1 can take place from April to September (5 months) in Denmark and South-Sweden following the seasonal change in irradiance at these latitudes. Discussion Downstream gradients in chemistry, biomass and metabolism We found a generally low GPP and ER in the upstream extremely nutrient-poor reach I. GPP peaked in reach II moderately affected by agriculture and ER peaked with very high values in reach III. SRP remained low along the streams from the Alvar plain to the reaches located 4-6 km downstream after passage of cultivated moraine soils, whereas NO3- gradually increased from below detection limits in reach I to relatively high concentration in reach III. Therefore, growth of benthic algae should be severely constrained by P availability at all reaches (Bothwell 1985; Kjeldsen et al. 1996), although we expect that the P input to the stream increases downstream due to more agricultural activity in the catchment. The lower P concentration at reach III compared to reach II in May 2010 and from reach I to downstream stations in October 2011 could be due to concomitant P uptake by P-limited benthic algae and bacteria. As originally predicted, the chl. a content increased from reach I to II but decreased from reach II to reach III along with more agricultural impact. This decline in chl. a could support 122 the presence of P-limitation on benthic chl. a or be explained by less available light reaching the benthic algae in the deeper and more shaded reach III, which, in contrast to the shallower and less shaded reach I and II, is incised and shaded by emergent plants and tall banks. Thus, no obligate submerged plants were present in reach III. As a consequence of changes in nutrient availability, benthic chl. a and light availability, GPP peaked in reach II and was lower in reach I and III. There was also a high cover of in-stream obligate macrophytes dominated by filamentous macroalgae at reach II. It is most likely that benthic microalgae had a strong effect on GPP, because GPP in May 2010 was almost threefold higher and chl. a was four-fold higher in reach II than in reach I. The same pattern was found in October where reach I and III had a lower chl. a content and GPP than reach II. In October, the highest GPP for all three reaches was only 1.67 g O2 m-2 d-1, probably due to lower daily irradiance and temperature. GPP was generally low in our study, but comparable with the findings of other European studies conducted at oligotrophic conditions (Kelly et al. 1983; Von Schiller et al. 2008). In the extremely nutrient-poor Alvar stream (reach I), GPP was only 2-3 g O2 m-2 d-1 during sunny summer days with high irradiance and favorable temperatures. GPP between 2-3 g O2 m-2 d-1 is low compared to other more nutrient-rich unshaded streams with similar irradiance and temperature levels (Kelly et al. 1983), and our study thus increases the range of measured GPP in European streams. However, our measurements were higher than those reported by Bunn et al. (1999) for some shaded Australian forest streams (0.33-0.53 g O2 m-2 d-1) and by Fellows et al. (2006) for some American montane and forest streams (0.05-1.4 g O2 m-2 d-1). Our result is consistent with results found by Bernot et al. (2010) which showed that natural streams have a lower GPP than agriculture and urban streams. We found a close coupling between GPP and ER in the most nutrient-poor reach I and II in May. This is consistent with the highly oligotrophic conditions and algae being the primary source for heterotrophic metabolism, and it suggests low external input of degradable organic matter at these two reaches and low influence of the hyporheric zone. A much lower GPP than ER in October in reach I and II suggested supplementary decomposition of terrestrial material supplied by senescing plants in autumn (Roberts et al. 2007). The high respiration but low primary production in reach III indicates high influence of the hyporheic zone and high input of allochthonous degradable material as also reported by Graeber et al. (2012), although we could not measure higher content of organic matter in surface sediment or seston. The sediments in reach I were solid limestone pavements with no or thin sand deposits, the sediment in reach II was bare 123 limestone pavements covered by thin layers of organic matter, while the sediment in reach III was mainly deeper sand deposits such that a substantial respiration may take place in the hyporheic zone deeper down below the surface sediment. It is known that the hyporheric zone may account for 4093% of ER (Fellows et al. 2001). Reach III was always strongly heterotrophic and had a metabolism comparable to that measured in Sonoran desert streams in Arizona (Uehlinger et al. 2002), which showed GPP/ER values below 0.17. This pattern is accompanied by gradually higher irradiances needed for photosynthesis to balance ecosystem respiration and for photosynthesis to become light saturated. While the rates of ER in reach I were 5-10-fold below the summer values recorded in nutrient-rich Danish streams with the same climate (7.3-22.9 g O2 m-2 d-1, Simonsen, 1974), the rates in reach III approached similarly high levels. Rates of photosynthesis and ecosystem respiration were particularly low in reach I and II where dark respiration appeared to deplete photosynthetic products during the night to the extent that respiration rates declined and approached zero as the night progressed. In contrast, in reach III respiration rates and supposedly the supply rates of organic substrates were higher and respiration remained approximately constant during the night. Such a decline in night-time respiration has to our knowledge only been demonstrated a few times in streams (Tobias et al. 2007; Hotchkiss and Hall 2014), but the mechanism is also known from phytoplankton communities (Gibson 1978; Markager and Sand-Jensen 1989). Future studies should test whether the gradual respiration decline during night is a general phenomenon for oligotrophic streams fuelled by daytime photosynthesis. The importance of the Alvar vegetation In-stream plant coverage was high in all three stream reaches and during all three sampling periods, reach I having the highest cover (about 75%). By calculating the potential contribution of plants to whole-stream metabolism using habitat-weighted estimates in reach I, we found that respiration was less than 1 g O2 m-2 d-1 for all plants and that GPP varied from 1.2 to 14.1 g O2 m-2 d-1. The estimated whole stream rates of GPP and R24 in reach I were 6.1 g O2 m-2 d-1 and 3.0 g O2 m-2 d-1, respectively, and thus the plants dominated by terrestrial grass species, could account for the whole stream metabolism. In reach II, respiration of submerged macrophytes dominated by filamentous macroalgae could only account for one fifth of the total respiration, whereas they could account for the entire production. Acuña et al. (2011) also found that macroalgae habitats in streams were able to account for 30-90% of GPP at the Pampean investigated reach but only for 2-20% of ER. Our results suggest that in-stream terrestrial plants may have a strong influence on whole-stream metabolism in intermittent reaches where this plant type may cover large parts of the stream bed. 124 The terrestrial in-stream plants in May 2010 in reach I remained photosynthetically active despite the restricted availability of 30 µmol L-1 of CO2 in the water. All former experiments have shown that these plant types are unable to exploit the abundant source of HCO3- in the water (Sand-Jensen et al. 1992; Maberly and Madsen 2002). However, some species (e.g. Carex flacca and Alopecurus geniculatus) retain a thin gas film on the leaves under water, allowing stomata to operate, gases to bypass the resistant cuticle and higher rates of photosynthesis and respiration to take place than is the case for leaves devoid of a gas film (Colmer and Pedersen 2007). Inorganic nutrients were mostly undetectable in the stream water in reach I, which suggests strong constraints of the chl. a development and productivity of benthic algae. In contrast, vascular plants can enhance the dissolution of phosphorus from the calcareous soils by root release of organic acids (Tyler and Ström 1995; Ström et al. 2005). After decomposition of plant tissue and terrestrial detritus, nutrients are transferred to the streams during high-flow periods and become available to benthic algae. The intermittent flow in the Alvar streams increases the likelihood that dissolved nutrients are exported during the early phase of resumed flow before benthic algae have had the time to develop an appreciable biomass for nutrient uptake. Intermittent flow supposedly restricts benthic biomass and, in particular, prevents development of perennial species, which contrasts the situation in permanent ponds on the Alvar plain where a gradual build-up of a high charophyte biomass occurs via exploitation of sediment rather than water nutrient resources (Christensen et al. 2013). Such charophyte beds in Alvar ponds attain a high GPP and ER (about 10 g O2 m-2 d-1) at the biomass peak in July (Christensen et al. 2013). Thus, provided a long time period and availability of alternative sediment resource, slow-growing species can establish a high biomass and substantial rates of GPP, although they do not reach the peak values recorded in nutrient-rich lowland streams (e.g. 25 g O2 m-2 d-1, Fig. 4). In conclusion, we found generally low GPP in the Öland streams and some six-fold lower rates than the maximum rates found in shallow streams in agricultural landscape of NW Europe. A strong positive relationship between daily GPP and ER was found at the two most nutrient-poor sites with very thin sediments on limestone pavements and low influence from the hyporheric zone. Temperature corrected instantaneous ER rate was highest in the beginning of the night, but decreased at the end of the night at all three reaches, indicating that dark respiration depleted photosynthetic products and became limited by organic substrates. This study has extended the range of GPP and ER measurements in NW Europe by including a very nutrient poor stream, increased the knowledge on stream metabolism in this, otherwise, highly agricultural impacted 125 region, and documented a strong relationship between GPP and ER in streams ranging from extremely nutrient poor to moderately nutrient rich conditions during spring and summer. Acknowledgements The authors acknowledge The Danish Council for Independent Research, Carlsberg Foundation and Villum Kann Rasmussen Foundation to "Centre of Excellence for Lake Restoration" (grants for T. Riis and K. Sand-Jensen). We also thank Peter Anton Staehr for comments to the paper, Anne Mette Poulsen for valuable editorial comments and four anonymous reviewers. 126 References Acuña V, Vilches C, Giorgi A. (2011) As productive and slow as a stream can be-the metabolism of a Pampean stream. JNABS 30: 71-83. Benson A, Zane M, Becker TE, Visser A, Uriostegui SH, DeRubeis E, Moran JE, Esser BK, Clark JF (2014) Quantifying Reaeration Rates in Alpine Streams Using Deliberate Gas Tracer Experiments. Water 6: 1013-1027. Bernot, M.J., Sobota, D.J., Hall, R.O., Mulholland, P.J., Dodds, W.K., Webster, J.R., Tank, J.L., Ashkenas, L.R., Cooper, L.W., Dahm, C.N., Gregory, S.V., Grimm, N.B., Hamilton, S.K., Johnson, S.L., McDowell, W.H., Meyer, J.L., Peterson, B., Poole, G.C., Maurice Valett, H.M., Arango, C., Beaulieu, J.J., Burgin, A.J., Crenshaw, C., Helton, A.M., Johnson, L., Merriam, J., Niederlehner, B.R., O'Brien, J.M., Potter, J.D., Sheibley, R.W., Thomas, S.M. & Wilson, K. (2010) Inter-regional comparison of land-use effects on stream metabolism. Freshwater Biol 55: 1874-1890. Bothwell ML (1985) Phosphorus limitation of lotic periphyton growth rates: an intersite comparison using continuous-flow troughs (Thompsen River system, British Columbia). Limnol Oceanogr 30: 527-547. Bott, T. L. (2006) Primary production and community respiration. In: Methods in stream ecology. Eds: Hauer, R.F. and Lamberti, G.A. 2nd edition. Elsevier, Oxford, pp. 855. Brix H, Schierup HH (2001) Limnologi, Analyseforeskrifter (in Danish). Afdeling for Botanisk Økologi, Aarhus University. Bunn SE, Davies PM, Mosisch TD (1999) Ecosystem measures of river health and their response to riparian and catchment degradation. Freshwater Biol 41: 333-345. Christensen JPA, Sand-Jensen K, Staehr PA (2013) Fluctuating water levels control water chemistry and metabolism of a charophyte dominated pond. Freshwater Biol 58: 1353-1365 Colmer T, Pedersen O (2007) Underwater photosynthesis and respiration in leaves of submerged wetland plants: gas films improve CO2 and O2 exchange. New Phytol 177: 918-926. Edwards RW, Owens M (1962) The effects of plants on river conditions IV. The oxygen balance of a chalk stream. J Ecol: 50 207-220. Ekstam U, Forshed N (2002) Svenska Alvarmarker – historie och ekologi (in Swedish). Naturvårdsverket Förlag, Stockholm. European Environment Agency (2005) Source apportionment of nitrogen and phosphorus input into the aquatic environment. EEA report 7: 1-48. 127 Fellows CS, Valett HM, Dahm CN (2001) Whole-stream metabolism in two montane streams: Contribution of the hyporheic zone. Limnol Oceanogr 46: 523-531. Fellows CS, Valett HM, Dahm CN, Mulholland PJ, Thomas SA (2006) Coupling nutrient uptake and energy flow in headwater streams. Ecosystems, 9, 788-804. Gibson CE (1978) Field and laboratory observations on the temporal and spatial variation of carbohydrate content in planktonic blue-green algae in Lough Neagh, Northern Ireland. J Ecol 66: 77-115. Graeber D, Gelbrecht J, Pusch MT, Anlanger C, von Schiller D. 2012. Agriculture has changed the amount and composition of dissolved organic matter in Central European headwater streams. Sci Total Environ, 438, 435-46. Hotchkiss ER, Hall RO (2014) High rates of daytime respiration in three streams: Use of d18OO2 and O2 to model diel ecosystem metabolism. Limnol Oceanogr 59: 798-810. Jähne B, Heinz G, Dietrich W, (1987) Measurement of the diffusion coefficients of sparingly soluble gases in water. J Geophys Res 92: 10767–10776. Kelly MG, Thyssen N, Moeslund B (1983) Light and the annual variation of oxygen- and carbonbased measurements of productivity in a macrophyte-dominated river. Limnol Oceanogr 28: 503-515. Kjeldsen K, Iversen TM, Thorup J, Lund-Thomsen P (1996) Three-year study of benthic algal spring bloom development in a small Danish lowland stream. Hydrobiologia 335: 183-192. Kristensen P, Hansen HO (1994) European Rivers and Lakes - Assessment of their Environmental State. European Environment Agency, Copenhagen. Leberfinger K, Herrmann J (2011) The importance of terrestrial resource subsidies for shredders in open-canopy streams revealed by stable isotope analysis. Freshwater Biol 56: 470-480. Lichtenthaler HK (1987) Chlorophylls and carotenoids: pigments of photosynthetic biomembranes. Method Enzymol 148: 350–382. Maberly SC, Madsen TV (2002) Freshwater angiosperm carbon concentrating mechanisms. Funct Plant Biol 29: 393-405. Markager S, Sand-Jensen K (1989) Patterns of night-time respiration in a dense phytoplankton community under a natural light regime. J Ecol 77: 49-61. Marzolf ER, Mulholland PJ, Steinman AD (1994) Improvements to the diurnal upstreamdownstream dissolved oxygen change technique for determining whole-stream metabolism in small streams. Can J Fish Aquat Sci 51: 1591-1599. 128 Marzolf ER, Mulholland PJ, Steinman AD (1998) Reply: Improvements to the diurnal upstreamdownstream dissolved oxygen change technique for determining whole-stream metabolism in small streams. Can J Fish Aquat Sci 55: 1786-1787. Mulholland PJ, Fellows CS, Tank JL, Grimm NB, Webster JR, Hamilton SK, et al. (2001) Interbiome comparison of factors controlling stream metabolism. Freshwater Biol 46: 1503-1517. Odum HT (1956) Primary production in flowing waters. Limnol Oceanogr 1: 102-117. Odum HT (1971) Fundamentals of ecology (3rd ed.). Saunders, Philadelphia. Pedersen O, Colmer TD, Sand-Jensen, K (2013) Underwater photosynthesis of submerged plants – recent advances and methods. Frontiers in Plant Science 4: 1-19. Rasmussen JJ, Baattrup-Pedersen A, Riis T, Friberg N (2011) Stream ecosystem properties and processes along a temperature gradient. Aquat Ecol 45: 231-242. Raymond PA, Zappa CJ, Butman D, Bott TL, Potter J, Mulholland P, Laursen AE, McDowell WH, Newbold D (2012) Scaling the gas transfer velocity and hydraulic geometry in streams and small rivers. Limnology and Oceanography: Fluids Environment 2: 41–53. Rebsdorf Aa (1972) The carbon dioxide system in freshwater: a set of tables for easy computation of total carbon dioxide and other components of the carbon dioxide system. Freshwater Biological Laboratory, University of Copenhagen, Hilleroed. Roberts BJ, Mulholland PJ, Hill WR (2007) Multiple scales of temporal variability in ecosystem metabolism rates: Results from 2 years of continuous monitoring in a forested headwater stream. Ecosystems 10: 588-606. Riis T, Dodds WD, Kristensen PB, Baisner AJ (2012) Nitrogen cycling and dynamics in a macrophyte-rich stream as determined by a 15N-NH4+ release. Freshwater Biol 57: 15791591. Riis T, Dodds WD, Kristensen PB, Baisner AJ (2014) Corringendum: Nitrogen cycling and dynamics in a macrophyte-rich stream as determined by a 15N-NH4+ release. Freshwater Biol, Sand-Jensen K (1997) Macrophytes as biological engineers in the ecology of Danish streams. In K. Sand-Jensen O. Pedersen (eds.). Freshwater biology: Priorities and Development in Danish Research, pp. 74-101. G.E.C. Gad Publishers, Copenhagen. Sand-Jensen K, Jeppesen E, Nielsen K, van der Bijl L, Hjermind L, Nielsen LW et al. (1989) Growth of macrophytes and ecosystem consequences. Freshwater Biol 22: 15-32. Sand-Jensen K, Møller J, Olsen BH (1988) Biomass regulation of microbenthic algae in Danish lowland streams. Oikos 53: 332-340. 129 Sand-Jensen K, Baastrup-Spohr L, Winkel A, Møller CL, Borum J, Brodersen K et al. (2010) Plant distribution and adaptation in a limestone quarry on Öland. Svensk Botanisk Tidsskrift 104: 23-31. Sand-Jensen K, Pedersen MF, Nielsen SL (1992) Photosynthetic use of inorganic carbon among primary and secondary water plants. Freshwater Biol 9: 1-11. Sand-Jensen K, Pedersen NL, Søndergaard, M (2005) Bacterial metabolism in small temperate streams under contemporary and future climates. Freshwater Biol 52: 2340-2353. Sand-Jensen K, Staehr P (2012) CO2 dynamics along Danish lowland streams: water - air gradients, piston velocities and evasion rates. Biogeochemistry-US 111: 615-628. Simonsen JF (1974) Oxygen fluctuations in streams. Ph.D.-thesis. Laboratoriet for Teknisk Hygiejne, Danmarks Tekniske Højskole (Technical University of Denmark), Lyngby, Copenhagen. Solomon CT, Bruesewitz DA, Richardson DC, Rose KC, Van de Bogert MC, Hanson PC et al. (2013) Ecosystem respiration: Drivers of daily variability and background respiration in lakes around the globe. Limnol Oceanogr 58: 849-866. Ström L, Owen AG, Godbold DL, Jones DL (2005) Organic acid behaviour in a calcareous soil – implications for rhizosphere nutrient cycling. Soil Biol Biochem 37: 2046-2054. Tobias CR, Böhlke JK, Harvey JW (2007) The oxygen-18 isotope approach for measuring aquatic metabolism in high-productivity waters. Limnol Oceanogr 52: 1439-1453. Tyler G, Ström L (1995) Differing organic acid exudation pattern explaining calcifuge and acidofuge behaviour of plants. Ann Bot-London 75: 75-78. Uehlinger U, Naegeli M, Fisher SG (2002) A heterotrophic desert stream? The role of sediment stability. Western N Am Naturalist 62: 466-473. Von Schiller D, Marti E, Riera JL, Ribot M, Marks JC, Sabater F (2008) Influence of land use on stream ecosystem function in a Mediterranean catchment. Freshwater Biol 53: 2600-2612. Wanninkhof R (1992) Relationship between wind-speed and gas-exchange over the ocean. J Geophys Res 97: 7373–7382. White KE (1978) Dilution methods. In R.W. Herschy (Ed.) Hydrometry. Wiley, New York. Young RG, Huryn AD, Marzolf ER, Mulholland PJ, Steinman AD (1998) Comment: Improvements to the diurnal upstream-downstream dissolved oxygen change technique for determining whole-stream metabolism in small streams. Can J Fish Aquat Sci 55: 1784-1787. 130 Table 1 Mean physical conditions in reach I, II and III during the three sampling periods. Further details on study sites are found in Methods Slope (m km-1) Velocity (cm s-1) Discharge (L s-1) Width (m) Depth (m) Travel time (min) Reaeration rate (min-1) Reach I May 2010 Oct 2011 0.23 1.4 0.3 2.21 2.39 0.11 0.10 255.5 0.021 0.011 May 2010 0.23 3.7 22 3.85 0.15 130.3 0.015 Reach II May 2011 2.8 11 3.24 0.13 148.9 0.008 Oct 2011 4.9 24 3.34 0.15 84.2 0.021 Reach III May 2011 Oct 2011 0.07 0.04 6.0 1.3 130 23 4.56 4.01 0.47 0.33 40.58 183.9 0.005 0.009 Table 2 Water chemistry, oxygen concentration (O2, mg L-1) and temperature in reach I, II and III for the three sampling periods pH Alkalinity (meq L-1) CO2 (μmol L-1) POC (mg C L-1) TP (μg L-1) SRP (μg L-1) Org-N (mg L-1) NH4+ (mg L-1) NO3- (mg L-1) O2 max (mg O2 L-1) O2 min (mg O2 L-1) Temperature (˚C) Reach I May 2010 Oct 2011 8.43 8.38 3.01 3.07 30 30 4.53 5.55 4.89 10.74 <0.01 3.43 0.29 0.31 0.01 0.03 <0.01 <0.01 12.1 13.7 8.9 11.2 14.39 5.63 May 2010 8.15 3.74 60 5.22 14.88 5.82 0.41 0.02 0.15 13.1 8.0 12.48 Reach II May 2011 8.01 3.74 100 2.44 13.23 7.73 0.07 0.08 0.24 13.1 8.3 11.97 Oct 2011 8.02 4.12 90 3.68 11.66 <0.01 0.17 0.04 0.05 12.1 10.1 6.51 Reach III May 2011 Oct 2011 7.48 7.64 4.24 4.88 380 250 3.69 4.68 11.34 10.93 2.72 <0.01 0 0.1 0.03 0.05 1.99 0.7 9.1 7.0 6.2 5.5 6.47 6.73 Table 3 Sediment cover (%), macrophyte cover (%), habitat-weighted benthic chl. a (mg chl. a m-2) and habitat-weighted organic matter (g AFDM m-2) in reach I, II and III for the three sampling periods Sand (%) Gravel (%) Stone and limestone plates (%) Obligate water plants (%) Amphibious plant (%) Benthic chl. a (mg chl. a m-2) Organic matter (g AFDM m-2) Reach I May 2010 Oct 2011 48.1 50.6 41.2 32.6 10.7 16.8 0.9 1.7 77.7 73.0 99.6 31.9 939.4 840.6 May 2010 26.2 9.6 64.2 16.6 27.6 398.1 1220.7 Reach II May 2011 19.0 23.5 57.5 5.0 28.6 194.4 690.6 Oct 2011 24.0 15.6 60.4 6.4 25.5 215.3 337.8 Reach III May 2011 Oct 2011 63.6 68.1 20.3 18.9 16.1 13.0 0 0 42.5 69.2 108.8 169.9 557.9 525.5 131 Table 4 In-stream plant cover (%) in May 2010 in Reach I and II, dry weight (DW, g m-2), leaf photosynthesis (Pambient, mg O2 g DW-1 d-1), leaf respiration (R, mg O2 g DW-1 d-1), and habitatweighted and reach scale GPP (mg O2 m-2 d-1) and R24 (mg O2 m-2 d-1) for the five dominant submerged plants, obtained by ex situ experiments n Plant cover (%) Reach I Reach II DW (g m-2) Pambient (mg O2 g DW-1 d-1) R (mg O2 g DW-1 d-1) Habitat-weighted metabolism GPP (g O2 m-2 d-1) R24 (g O2 m-2 d-1) Reach I Reach II Reach I Reach II Alopecurus geniculatus 4 38.3 72.0 30.5 ±6.9 30.0 ±5.2 Carex flacca 4 23.5 116.3 20.4 ±9.9 17.4 ±3.6 Galium palustre 1 17.4 72.0 70.9 66.2 Mentha aquatica 3 17.4 17.5 116.3 58.3 ±48.3 45.9 ±39.5 Spirogyra and Cladophora 1 34.0 317.9 136.1 2.4 Total 1.6 0.8 - 1.2 0.5 - 1.7 0.8 - 1.6 1.6 0.9 0.9 14.1 0.2 6.1 15.7 3.0 1.1 132 Reach scale 2.3 6.7 2.1 7.1 Fig. 1 Mean daily GPP (g O2 m-2 d-1), ER (g O2 m-2 d-1) and GPP/ER in the three stream reaches in May 2010 and 2011 and October 2011. Dashed line shows GPP/ER = 1. In May, n = 1 in reach I, in reach II n = 2 in 2010 and n = 5 in 2011, n = 2 in reach III in 2011. In October, n = 2 in reach I and II and n = 3 in reach III. Exact numbers are shown in appendix 1 Fig. 2 Relationships between surface irradiance (μmol m-2 s-1) and NEP (g O2 m-2 min-1) in the three reaches. To reduce the influence from bank shading, data in reach I were from before noon in May 2010, and data in reach II and III were from the afternoon in May 2011. Overall significant hyperbolic relationships are shown Fig. 3 Night-time respiration rate (g O2 m-2 min-1) corrected for temperature variations in the three stream reaches for three sampling periods. One night per sampling period is shown. Please note that the scale for the y-axis of reach III differs from that of reach I and II Fig 4 Relationships between daily GPP (g O2 m-2 d-1) and ER (g O2 m-2 d-1) in different streams in Northern Europe during two seasons; April-August (Spring-summer) and September-March (Autumn). Overall significant linear regressions are shown, and the dashed line shows GPP/ER = 1. Data were summarized from Edwards Owens (1962), Simonsen (1974), Kelly et al. (1983), Riis et al. (2012;2014), Alnoee et al. (unpubl. data), and this study Fig. 5 Relationships between GPP/ER and daily surface irradiance (mol m-2 d-1) in temperate streams. An overall significant hyperbolic relationship is applied. Data were summarized from Edwards and Owens (1962), Simonsen (1974), Fellows et al. (2001), Mulholland et al. (2001), Rasmussen et al. (2011), Acuña et al. (2011), and this study 133 Figure 1 134 Figure 2 135 Figure 3 136 Figure 4 137 Figure 5 Appendix 1 Mean daily GPP (g O2 m-2 d-1), ER (g O2 m-2 d-1) and GPP/ER in the three stream reaches in May 2010 and 2011 and October 2011. Values are shown in figure 1 n GPP (g O2 m-2 d-1) ER (g O2 m-2 d-1) P/R Reach I May 2010 Oct 2011 1 2 2.26 0.38 2.05 1.20 1.10 0.32 May 2010 2 6.69 7.13 0.95 Reach II May 2011 5 3.09 ±0.20 2.89 ±0.45 1.08 ±0.11 Oct 2011 2 1.67 6.35 0.26 Reach III May 2011 Oct 2011 2 3 3.30 0.38 ±0.01 7.98 27.24 ±0.18 0.42 0.01 ±0.00 138 Paper 5 - Caught Between Drought and Flooding on Ölands Great Alvar (in Swedish, English abstract) © Ole Petersen 139 140 141 142 143 144 145 146 147 Acknowledgements First of all I want to thank my principal supervisor Kaj Sand-Jensen for taking me on this scientific journey which has taught me so much! For your invaluable guidance and support, for taking time to discuss matters even on the busiest of days and in weekends, for many fantastic days in the field, “hunting” rare flowers and birds, for interesting talks and for almost coming to peace with the fact that I don’t find grasses and half grasses interesting. I want to thank my co-supervisor Peter Stæhr for always having an open door, for introducing me to the possibilities in international collaborations, for great times in the field on all kind of projects and for technical guidance. I am grateful to the VIPs at the department. Ole, Kirsten and Dean I have had the great pleasure to teach courses with. Jens, dit skrummel, you are the heart, soul and entertainment of the department! I want to thank Theis for technical guidance and many great hours on Öland. I want to thank my old officemate Jesper for all the help and time you have given even in your free time and for showing me how to relax in stressed situations. Lars I want to thank for many hours in the field and for making the long days a little bit more fun. I am grateful to have met so many fantastic people at the Freshwater Biological Laboratory: Trine, Winkel, Anja, Ane, Claus Møller, Frandsen, Matteo, Laci, Stine, Petur, Søren, Søren, Jesper, Magnus, Lasse, Dennis, Max, Jos, Iversen, Emilie, Anne, Emil and Kenneth. A special thanks to kuttersøstrerne (our Kathrines) and Mikkel MØ who have all helped me in my field work, you make our office a nicer place to work in. I want to mention Eleanor, Bas, Biel and Rafa from NetLake, Anette and Tenna from Århus. In England I met Ian, Iestyn, Alex and Stephen. Going there was a great experience. The staff at Freshwater Biological Laboratory Anne, Finn, Allan, and their predecessors Birgit, Nils and Flemming have all been incredibly helpful. Special thank goes to Ayoe, you are amazing, and the department would never be as productive without you to kick the asses that need kicking or without your incredibly helpful attitude when mountains of samples show up and need processing “yesterday”. Thanks and much love to my friends and family who have supported me all along. Mange tak til jer alle!! 148


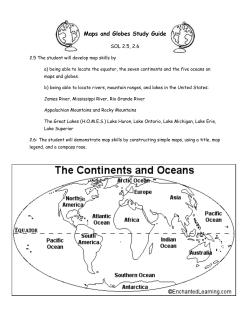


© Copyright 2026