
ASSOCIATED BRITISH FOODS plc Annual Results Announcement Year ended 13 September 2014
For release 4 November 2014 ASSOCIATED BRITISH FOODS plc Annual Results Announcement Year ended 13 September 2014 1 For release 4 November 2014 Associated British Foods plc results for 52 weeks ended 13 September 2014 ABF delivers 6% earnings growth Financial Highlights Actual Constant currency1 Group revenue £12.9bn -3% +1% Adjusted operating profit £1,163m* -1% +2% Adjusted profit before tax up 2% to £1,105m** Adjusted earnings per share up 6% to 104.1p** Dividends per share up 6% to 34.0p Net capital investment of £691m Net debt reduced to £446m Operating profit down 1% to £1,080m, profit before tax up 18% to £1,020m and basic earnings per share up 30% to 96.5p George Weston, Chief Executive of Associated British Foods, said: “I am pleased to report growth of 6% in adjusted earnings per share. Significant progress was achieved in operating profit by Grocery, Agriculture, Ingredients and Primark, all of which substantially out-performed last year. Primark’s trading success and significant expansion delivered another magnificent year. Much lower sugar prices in the EU held back the group’s profit growth although, operationally, Sugar performed well.” * ** before amortisation of non-operating intangibles, and profits less losses on disposal of noncurrent assets. before amortisation of non-operating intangibles, profits less losses on disposal of non-current assets, and profits less losses on the sale and closure of businesses. All adjustments to profit measures are shown on the face of the consolidated income statement. 1 Constant currency is derived by translating the 2013 results at 2014 average exchange rates. For further information please contact: Until 15.00 only Associated British Foods: John Bason, Finance Director Flic Howard-Allen, Head of External Affairs Tel: 020 7638 9571 Citigate Dewe Rogerson: Chris Barrie, Angharad Couch, Eleni Menikou Tel: 020 7638 9571 Jonathan Clare Tel: 07770 321881 After 15.00 John Bason, Finance Director Flic Howard-Allen, Head of External Affairs Tel: 020 7399 6500 2 Notes to Editors Associated British Foods is a diversified international food, ingredients and retail group with sales of £12.9bn and 118,000 employees in 47 countries. It has significant businesses in Europe, southern Africa, the Americas, China and Australia. Our aim is to achieve strong, sustainable leadership positions in markets that offer potential for profitable growth. We look to achieve this through a combination of growth of existing businesses, acquisition of complementary new businesses and achievement of high levels of operating efficiency. Prior year restatement The results for the year ended 14 September 2013 have been restated upon adoption of IAS19 Employee Benefits Revised. The impact of this restatement on the income statement and segmental analysis is summarised below together with adjustments to reflect the merger, in 2014, of the activities of AB Mauri’s yeast and bakery ingredients businesses in Australia and New Zealand with the flour milling business of George Weston Foods, and a small disposal made in the year ended 13 September 2014, the details of which are provided on page 30. restated Adjusted operating profit (£m) Adjusted operating profit from continuing businesses (£m) Adjusted profit before tax (£m) Adjusted earnings (£m) Adjusted earnings per share (p) Segmental analysis Continuing businesses Adjusted operating profit: Grocery (£m) Sugar (£m) Ingredients (£m) Retail (£m) Central (£m) Disposed businesses Grocery Ingredients Year ended 14 September 2013 Transfer and IAS 19 disposals adjustments 1,180 - (5) 1,172 1,088 775 98.1 (2) - (5) (8) (6) (0.8) 224 434 5 513 (51) (6) 4 (2) (1) (1) (1) 2 6 2 - The IAS19 adjustments only affect the United Kingdom geographic segment. The transfers and disposals all arise in the Asia Pacific segment. 3 - previously reported 1,185 1,179 1,096 781 98.9 232 435 1 514 (50) 6 ASSOCIATED BRITISH FOODS plc ANNUAL RESULTS ANNOUNCEMENT FOR THE 52 WEEKS ENDED 13 SEPTEMBER 2014 For release 4 November 2014 CHAIRMAN'S STATEMENT I am pleased to report growth of 6% in adjusted earnings per share for the financial year. Significant progress was achieved in operating profit by Grocery, Agriculture, Ingredients and Primark, all of which substantially outperformed last year. Much lower sugar prices in the EU held back the group’s profit growth although, operationally, Sugar performed well. Earnings also benefited from the strength of the group’s balance sheet and effective cash management which resulted in a much lower interest charge than last year. The financial year was characterised by price deflation in many food commodities and a strengthening of sterling against our major trading currencies. The impact of this is evident in the lower revenues of our food businesses and, in this context, the profit growth in Grocery, Agriculture and Ingredients is all the more impressive. Grocery margin advanced with strong performances from Twinings Ovaltine and ACH Foods in the US and Mexico, and a further recovery in the bakery and meat businesses of George Weston Foods in Australia. Our yeast and bakery ingredients business, AB Mauri, is achieving a strong turnaround from the challenges of recent years with the promise of further improvement to come. AB Agri achieved another record result. Primark had another magnificent year, increasing profit by 30% at constant currency and adding a net 1.2 million sq ft of selling space taking our total estate to over 10 million sq ft at the financial year end. Our highly successful entry into France this year brings the number of countries in which Primark operates to nine. Primark has now developed experience in establishing the brand in new markets and has achieved considerable trading success in each of them. We recently announced that the next new market would be in the north-east of the US, with the first stores expected to open late in 2015 and with up to 10 stores by the end of 2016. The results of our sugar operations reflect a major fall in EU sugar prices and a very low world sugar price. Looking back to 2011/12, a shortage of sugar available for sale in the EU and relatively high world prices at the time drove EU prices to very high levels which clearly benefited our Sugar profit in that year. This was exceptional. Since then more sugar has become available, sugar stocks in the EU have risen, the European Commission has confirmed the abolition of sugar quotas from October 2017, and world sugar prices have declined dramatically. We have seen increased competition as European producers position themselves for a post-quota market. This has driven a fall in prices which we expect to continue in 2015. We anticipate restructuring in the European sugar industry and, as the high stock levels are liquidated, we expect to see volatility in market prices. This structural change is painful, but AB Sugar has risen to challenges of this nature before, and does so this time with a programme of continuous performance improvement. We are one of the most efficient producers in the EU and will continue to take the necessary action to ensure that we are well placed to operate in the post-quota environment. We have a good track record of investing for the long term and this year was no exception with net capital investment of £691m, up from £600m last year. The higher level of capital expenditure was driven by a larger number of new Primark stores opened, or still to open but in the process of fitout, during the year. The five-year investment programme at Allied Bakeries to create a state-ofthe-art baking capability across the UK is now substantially complete and ensures the reliable supply of high quality bread to our customers. This programme also sets a new benchmark for standards of food safety in the bakery sector and has enhanced safety in our workplace. Cash flow was again stronger than the previous year driven by a working capital inflow more than offsetting the increase in net capital investment. Net debt at the year end was £358m lower than last year at £446m. With the group’s cash generating ability, the lower net debt and the committed borrowing facilities available, we have the capacity to meet our growth ambitions for the foreseeable future. 4 Corporate responsibility Last year we published a comprehensive Corporate Responsibility Report which outlined the close alignment between our values and good business practice, and highlighted our commitment to improving productivity and reducing waste. This report was well received by all of our stakeholders and updates are now available to reflect the achievements of the last 12 months. The report is available online at www.abf.co.uk/responsibility. Of particular note is the further progress Primark has made in its ethical trade programme with an enlarged team of specialists, now located in seven countries, which is critical to supporting sustainable improvements within supplier factories. As a responsible business, AB Sugar is actively contributing to the debate about the role that sugar can play as part of a healthy, balanced diet with its Making Sense of Sugar campaign. The board remains committed to the highest ethical standards across the group. The board The Senior Independent Director, Tim Clarke, was appointed to the board in 2004 and, in accordance with the UK Corporate Governance Code, having completed nine years’ service, his independence must be confirmed annually by the rest of the board. This having been done, we are delighted that Tim has agreed to continue as a member of the board and as the Senior Independent Director. Three other independent directors will complete nine years on the board in 2015 and 2016. To avoid the possibility of a significant loss of experience in a short period we have temporarily expanded the board. Ruth Cairnie was appointed as an independent non-executive director with effect from 1 May 2014. Ruth was recently Executive Vice President Strategy & Planning at Royal Dutch Shell plc where she had also held a number of senior commercial roles gaining experience in European and emerging markets. We very much look forward to Ruth’s participation in the board’s deliberations. Employees I would like to thank all our employees for their contribution to the group’s success in the past year. Operational improvements have underpinned the increased profitability in Grocery and Ingredients, and have become part of everyday business at AB Sugar. Together with the excellent performances from Agriculture and Primark these results are a tribute to the dedication and commitment of our employees. Dividends I am pleased to report that a final dividend of 24.3p is proposed, to be paid on 9 January 2015 to shareholders on the register on 12 December 2014. Together with the interim dividend of 9.7p paid on 4 July 2014, this will make a total of 34.0p for the year, an increase of 6%. Outlook In the coming year, we expect Primark’s expansion to continue and Grocery, Ingredients and Agriculture to make further progress. With the continuing fall in EU sugar prices, and volatility in the world sugar price, we expect a further large reduction in profit from AB Sugar, but this will put much of the effect of the structural changes in EU prices behind us. At this early stage we expect a marginal decline in adjusted operating profit for the group but the impact on earnings will be mitigated by much lower tax and interest charges. We therefore see limited opportunity to grow adjusted earnings per share in the new financial year. With the strength of the group’s balance sheet and strong cash generation, we have every reason to be confident of further progress for the group thereafter. Charles Sinclair Chairman 5 CHIEF EXECUTIVE’S STATEMENT The delivery of an adjusted operating profit for the group in line with last year reflects the considerable achievement of all of our businesses in a year when EU sugar prices declined substantially. This financial year saw sterling strengthen against all of our major trading currencies and particularly those in emerging markets. Group revenue declined by 3% to £12.9bn but at constant currency actually increased by 1%. Adjusted operating profit was 1% lower at £1,163m but increased by 2% at constant currency. Currency movements have had a significant impact on our business segments this year and in order to understand the underlying operating performance of each of them, we have referred to the year-on-year changes at constant currency. A key influence on this year’s performance has been the impact on our food businesses of price deflation in some of our major commodities. The prices of wheat, barley, corn oil and rice all fell during the year. World sugar prices have also fallen and, as discussed elsewhere in this report, we are in the midst of a structural change in EU sugar prices. As a consequence the growth in revenues achieved by our food businesses in recent years has not been sustained this year. It is against this background that I am pleased with the profit and margin improvements delivered by Agriculture, Grocery and Ingredients. Operationally AB Sugar had an excellent year with good factory performances and further substantial cost reductions from the performance improvement programmes which are well embedded in each of the businesses. We expect EU prices to fall further during the coming year, but remain confident that our well-invested sugar assets position us amongst the world’s lowestcost sugar producers. At Primark, a strong store opening programme, excellent buying, and higher sales densities in our new stores, all came together to drive revenues to within a fraction of £5bn with a further improvement in margin. As well as expanding in our more established UK market we also opened large stores in a number of major cities across Europe, including Lisbon, Madrid, Berlin, Cologne, Dusseldorf and Vienna. This year saw the opening of our first stores in France, firstly in Marseille quickly followed by Dijon and then three stores in the suburbs of Paris. We were delighted by the success of these French stores, both for the size of the crowds on opening days, which were overwhelming, but more importantly for the tremendous customer enthusiasm for Primark, in very different cities, which was sustained throughout the rest of the year. Primark’s response to the Rana Plaza disaster in Bangladesh in 2013, has been extensive. In addition to the payment of compensation to the victims and their families, Primark was a founding signatory to the Accord on Fire and Building Safety in Bangladesh. This Accord is a contract between over 150 apparel brands and retailers, international and local trade unions and NGOs, which are committed to carrying out factory inspections and improving working conditions in the Bangladesh garment industry. Primark carried out building surveys in Bangladesh to assess the structural integrity of all of the 80 factories from which we source garments. These structural assessments will be extended to other countries shortly. Grocery made very good progress with profit and margin well ahead of last year. Twinings Ovaltine had another excellent year, both in the UK and overseas, and trading was much improved at ACH Foods in the US and Mexico. The recovery in profitability at George Weston Foods in Australia was well established this year. AB Agri deserves credit for the further development of the business, particularly for the strides made by AB Vista as it extends its global customer reach. Profit in Ingredients recovered strongly this year as the new management team at AB Mauri, our yeast and bakery ingredients business, made significant progress in reducing the cost base, restructuring operations and integrating the newly acquired European bakery ingredients business. Our businesses are encouraged to take advantage of the technical skills, geographical presence, capabilities and experience that are available elsewhere in the group, in the development of their own operations. This Operating Review showcases some examples of our success in leveraging the benefits of being part of a larger group, an illustration of which was the collaboration between 6 our enzymes, cereal extrusion and Agri businesses to deliver the new cereal extrusions factory at Evansville in the US which would not have been achieved by any of the individual businesses on their own. OPERATING REVIEW SUGAR Revenue £m Adjusted operating profit £m Adjusted operating profit margin Return on average capital employed 2014 2,083 189 9.1% 10.5% 2013 2,677 434 16.2% 23.3% Actual fx -22% -56% Constant fx -17% -54% Revenue and adjusted operating profit for AB Sugar were substantially lower than last year driven by declining sugar prices, lower volumes and adverse currency translation. The price and volume effects were predominantly seen in Europe where prices were driven down by increased market competition as our competitors seek to establish new market positions ahead of the removal of quotas in 2017, and by a desire to reduce quota stock levels across the EU which have been higher than normal. The world sugar price, which has more of an impact on EU exports and our Chinese business, was low, and fell further, throughout the year but we consider this to be unsustainable given that it is markedly below the global average cost of production. Our sugar businesses have been actively engaged in performance improvement programmes for a number of years. All businesses have undertaken a review of overheads, substantial reductions have already been delivered and the programmes are continuing. These are aimed at extending our cost leadership in all regions to ensure that AB Sugar is well positioned as a globally competitive producer. British Sugar produced 1.32 million tonnes of sugar compared with 1.15 million tonnes last year. Good growing conditions extended into the mild winter resulting in higher beet yields and sugar content than last year. All UK factories performed well with further progress achieved in performance improvement initiatives and in health, safety and environmental metrics. The crop for the 2014/15 campaign has benefited from excellent growing conditions, with every indication that it will be much larger than that processed in the previous year. The new campaign has started well with production ahead of schedule and with our Newark and Wissington factories already exceeding daily beet throughput records. This larger crop will provide the opportunity to confirm our ability to process the higher volumes that we expect to become the norm in a postquota environment. The beet price payable to growers for the 2014/15 crop was agreed in summer 2013, at a substantial increase over the price for the year under review, and at an increased cost to British Sugar of some £30m. Negotiations for delivered beet costs for the 2015/16 campaign have now been concluded with a reduction of some 20% on the previous year. This will make a major contribution to ensuring a more sustainable UK beet sugar industry reflective of the new commercial environment for EU sugar. In Spain, sugar beet volumes were lower than last year with a larger crop area in the south not compensating for a reduction in the area planted in the north due to waterlogged fields during the spring. As a consequence, total beet sugar production was 338,000 tonnes, down from 405,000 tonnes in the previous year. 200,000 tonnes of imported raw sugar was refined at Guadalete and a further 59,000 tonnes was co-refined at the northern beet plants supplementing the beet sugar production and minimising logistics costs to market. Contract negotiations with our EU customers for the 2014/15 marketing year are proving to be as challenging as last year. There are high stocks of sugar in the EU, competition continues to be intense and both of these factors have continued to drive EU prices downward. In response to this 7 difficult commercial environment we have undertaken a review of our cost base and a provision of £22m for the cost of overhead reduction has been charged to adjusted operating profit this year. After a complex commissioning process, production volumes at the Vivergo biofuels plant increased significantly this year. Although inclusion levels of ethanol in gasoline continued to rise in the EU year-on-year, gasoline consumption has fallen which has led to lower prices. Vivergo sustained a loss this year but further enhancements to the plant in the new financial year will improve reliability and throughputs are expected to meet or exceed rated capacity. Combined with lower wheat prices the profitability of Vivergo is therefore expected to improve. Profit at Illovo saw some reduction. Sugar production of 1.70 million tonnes this financial year compared with 1.87 million tonnes last year, primarily as a result of lower production in Zambia and Swaziland where the phasing of the campaign is slightly later than last year. Domestic pricing increased in line with local inflation with the exception of Tanzania and South Africa which were affected by low-cost imports. However, import tariffs have now been introduced in South Africa which has resulted in some improvement in local pricing. The profitability of exports of raw sugar to the EU market under preferential import arrangements was adversely affected by the lower pricing in that market. Co-product contribution, which is of growing importance to Illovo, increased this year with the successful operation of the new potable alcohol distillery in Tanzania. In China, profitability has improved with the implementation of a number of overhead reduction and efficiency initiatives. In the south, excellent growing conditions and a higher sugar content in the cane resulted in an increase in sugar production from 500,000 tonnes last year to 560,000 tonnes this year. However, flooding in Heilongjiang province led to a reduction in beet supplied to our factories which resulted in much lower sugar production in the north, at 116,000 tonnes. The campaigns at Qianqi and Zhangbei were excellent with good factory throughput and a high sugar content in the beet following our success in working with the growers over a number of years. A significant level of imports and increased domestic production resulted in very low domestic prices throughout the year. AGRICULTURE Revenue £m Adjusted operating profit £m Adjusted operating profit margin Return on average capital employed 2014 1,312 50 3.8% 17.3% 2013 1,410 47 3.3% 16.4% Actual fx -7% +6% Constant fx -6% +11% AB Agri had another excellent year with adjusted operating profit 11% ahead of last year at constant currency. The decline in revenue reflected lower wheat and other commodity costs. However, cash margins in UK feed were maintained and the profit growth was delivered by the higher margin businesses. The wet winter in the UK, particularly in the west country, adversely impacted livestock farming but excellent forage growing conditions during a dry spring and summer, as well as a softening commodity market, led to a period of more stable prices and increased confidence amongst farmers. UK feed volumes remained resilient. Oversupply in the UK poultry market depressed prices during the summer but the market is now beginning to stabilise. Strong growth was achieved by AB Vista driven by the success of Quantum Blue, its phytase feed enzyme, notably in Latin America and the Middle East but also in the EU where it was launched recently following its approval by the European Food Safety Authority. The new granulation facility at Evansville, Indiana, is operating successfully providing additional capacity to meet the increasing demand for these enzymes. Good commercial and procurement management drove a strong performance at Speciality Nutrition, our UK pre-mix and starter feeds business. Expansion and modernisation of its plant at Rugeley enabled the business to meet increasingly stringent customer demands for high-quality 8 pre-mixes. AB Sustain’s responsible sourcing programme achieved growth during the year and this programme has now been extended into overseas markets. AB Agri China maintained margins through good procurement and a favourable product mix. Consumer demand for meat in China continues to grow with a particular need to ensure reliable and high-quality sources. As meat production in China therefore transitions from small, family-run concerns towards large-scale commercial operations, there is increasing demand for high-quality feed supplied by modern, efficient feed mills. Construction and commissioning of our new feed mill at Zhenlai was completed to plan in August and good progress is being made with construction of a mill at Rudong, both of which will supply these large, integrated meat processors. Profit at Frontier was ahead of last year. Fine weather during the planting seasons saw strong demand for cereal and rape seed and the growing conditions of a mild winter and warm spring drove demand for crop inputs such as fungicides. Encouragingly, the warm dry summer resulted in an early wheat harvest of excellent yield and quality. RETAIL 2014 Revenue £m Adjusted operating profit £m Adjusted operating profit margin Return on average capital employed 2013 restated 4,273 513 12.0% 26.0% 4,950 662 13.4% 33.2% Actual fx Constant fx +16% +29% +17% +30% Sales at Primark were 17% ahead of last year at constant currency. This excellent result was driven by an increase in retail selling space, like-for-like sales growth of 4%, and superior sales densities in the new stores. The year was characterised by success for our autumn/winter and spring/summer ranges. Sales over the Christmas period were excellent and were boosted in the third quarter by warm weather, especially in the spring and early summer. We began trading in France in December last year and sales across all five stores have been exceptional. Eight years on from our initial entry into Iberia, this year’s like-for-like growth achieved by our Spanish stores was particularly strong. The adjusted operating profit margin in the first half was higher than last year reflecting the benefit of warehouse and distribution efficiencies and lower freight rates. These benefits continued in the second half and, with strong trading over the summer resulting in a lower level of markdowns, the margin for the full year reached 13.4%. This lower level of markdowns was a consequence of a strengthening of our buying and merchandising teams and the success of our seasonal range. In the immediate aftermath of last year’s collapse of Rana Plaza in Bangladesh, Primark committed to meeting its responsibilities in full and to paying long-term compensation to the workers employed by its supplier or their dependants. We began making these long-term payments in March 2014 and, throughout the process, we have provided broadly based support. Primark also paid short-term aid to the families of all the workers employed at Rana Plaza, most of whom were making clothes for its competitors. Primark’s total commitment amounts to US$12m, of which US$7m was provided in last year’s results and US$5m has been charged this year. The safety of the staff employed by our suppliers is a high priority. We have now undertaken structural assessments of all of our supplier factories in Bangladesh. We further strengthened our in-country teams of ethical trading specialists who are critical in supporting sustainable improvements within supplier factories, and providing greater visibility across the supply chain. We conducted 2,058 audits in the last calendar year, and ethical trade training continues to be provided to every new Primark employee. We intend to extend our programme of structural assessments to include factories producing for us outside Bangladesh. The pace of selling space expansion quickened further this year with the gross addition of 1.4 million sq ft. We relocated three stores, extended three stores and opened in 25 new locations. 9 It is perhaps worth putting this growth into context - in the year 2000 when we opened our 100th store after 31 years of trading, the entire estate was just 1.4 million sq ft and now, 14 years later, the estate is seven times larger. This year saw the entry of Primark into France where we now have five stores: Marseille, Dijon and three in the suburbs of Paris. We closed seven smaller stores, primarily where larger, better located, premises became available in the same city, resulting in a net increase in selling space of 1.2 million sq ft. This brings our total estate to 278 stores and 10.2 million sq ft at the financial year end. Responding to the increasing scale of our business in continental Europe, we doubled the size of our warehouse in Torija, Spain this summer and the Mönchengladbach warehouse in Germany, which services the stores in northern Europe, is being extended by 60% and will become fully operational early in 2015. Iberia UK September 2013 Change in year September 2014 Northern Continental Europe Republic of Ireland Total sq ft ‘000 stores sq ft ‘000 stores sq ft ‘000 stores sq ft ‘000 stores sq ft ‘000 stores 5,760 161 1,330 41 880 17 1,030 38 9,000 257 280 3 240 6 680 13 - (1) 1,200 21 6,040 164 1,570 47 1,560 30 1,030 37 10,200 278 +5% +18% +77% - +13% We have a very strong pipeline of new stores in Europe extending over a number of years. We have already opened five new stores since the year end: one in Portugal, two in the Netherlands and two in Germany, with a further five scheduled to open before Christmas including a relocation in Northampton to a store more than three times the size. We expect the increase in selling space for the financial year to be a little less than 1.0 million sq ft, to be followed in the autumn of 2015 by a strong programme of European openings. We have announced that, after extensive research, we have decided to take Primark to consumers in the north-east of the US. We have chosen stores which are located close to areas of high urban density and which benefit from high levels of existing customer footfall. Our strategy is to generate interest in, and awareness of, the Primark brand. A lease for some 70,000 sq ft of selling space at Downtown Crossing in the heart of Boston, Massachusetts was signed in April and we expect this store to open in late 2015. We have subsequently signed the lease of a further seven stores in this region including an 80,000 sq ft store in the King of Prussia shopping mall in Pennsylvania, one of the busiest in the US. We intend that all eight stores will be trading from 0.5 million sq ft by late 2016. These stores will be supported by leased warehousing. New store openings: Spain Albacete Cartagena Fuengirola Huelva Logrono Madrid – Plenilunio Roquetas de Mar Tenerife Germany Berlin – Alexanderplatz Portugal Lisbon Austria Vienna France Dijon Marseille Paris – Creteil SC Paris – O’Parinor Paris – VLG Quartz 10 UK Bath Canterbury Cardiff Crawley Leeds – Trinity Warrington The Netherlands Eindhoven Enschede Nijmegen Cologne Dusseldorf Relocations or closures: Spain La Coruna Madrid - Plenilunio Zaragoza Zoetermeer UK Cardiff Crawley Leytonstone Republic of Ireland Dundalk GROCERY 2014 Revenue £m Adjusted operating profit £m Adjusted operating profit margin Return on average capital employed 3,337 269 8.1% 20.8% 2013 restated 3,568 224 6.3% 16.9% Actual fx Constant fx -6% +20% -1% +24% Grocery operating profit increased by 24% at constant currency with George Weston Foods in Australia, ACH Foods in the US and Twinings Ovaltine all well ahead of last year. Revenues were level with last year at constant currency and were held back by lower food commodity prices. Twinings Ovaltine delivered strong revenue growth in tea with record market shares achieved in each of its four largest markets. Growth was achieved in all categories in the UK led by excellent progress in green teas and infusions, and we remain the fastest growing tea brand in the US. Ovaltine again performed well in its developing markets, particularly Brazil, where the brand was supported by a new advertising campaign, in south east Asia, and in Nigeria where our new Ovaltine packing plant is now fully operational. Tea manufacturing conversion costs were lower than last year with the benefit of higher volumes, further improvements in operating efficiency at the factory in Poland and more high-speed packing equipment at Andover. At Allied Bakeries, revenues and profit were ahead of last year with higher branded sales and an increase in market share. Successful new products this year included Kingsmill Great White, a white bread with as much fibre as a wholemeal loaf, which was launched in February supported by an in-store marketing campaign and television advertising. New re-sealable packaging with a refreshed design drove further growth of Kingsmill wraps, and towards the end of the year we launched Sandwich Thins which are proving very popular. Following its relaunch last year, the Allinson brand received further national advertising support this year and achieved further growth. The five-year capital investment programme to upgrade our UK bakeries is almost at an end with completion of the modernisation of the Glasgow bakery during the year and the installation of a new bread plant in Stevenage which is due to be commissioned in November. The proposed closure of the Orpington bakery was announced in August with employee consultation nearing conclusion. Silver Spoon’s revenue and profitability was well below last year reflecting an especially competitive year for the UK packed sugar market which saw the loss of a number of granulated sugar contracts. This was mitigated in part by a reduction in overheads at the Bury packaging plant. New product launches resulted in Truvia growing its share of the stevia sweeteners market and, in the home baking sector, Allinson maintained its position as the leading bread flour brand following last year’s relaunch. Revenue and profit at Jordans and Ryvita were ahead of last year with good growth in our international business, particularly in France, Canada and Australia. The new Ryvita Thins line at the Poole factory yielded improvements in production efficiency and product quality, enabling supply to keep pace with substantially increased demand. On 20 October, after clearance from the Competition and Markets Authority, we completed the acquisition of Dorset Cereals. This premium brand, with particular strength in the growing Muesli sector, will complement our existing Jordans 11 cereals and Ryvita crispbread brands. We intend to maintain Dorset Cereals’ existing production facility in Poundbury, Dorset. AB World Foods achieved revenue growth in the UK for Patak’s and Blue Dragon which are, respectively, the largest Indian and Oriental ambient food brands. Both brands also performed well internationally, particularly in Canada where social media campaigns to coincide with ethnic festivals proved to be an effective way of promoting awareness of the product range. The core brands of Westmill Foods, Lucky Boat noodles and Elephant Atta flour, both achieved further growth and, towards the end of the year, we relaunched the Rajah spice brand with new packaging, advertising support and in-store trial. George Weston Foods in Australia achieved a major improvement in performance with higher bread prices, increased meat volumes, the delivery of a number of cost reduction initiatives and improved commodity procurement. In a challenging retail and competitor environment, Tip Top successfully implemented bread price rises in the first half of the year which, together with an increase in the proportion of higher margin products sold and further productivity improvements, led to a higher operating profit for the bakery business. Factory productivity was also better at Don KRC which contributed to better meat yields and a reduction in labour costs. Enhanced product quality and improved customer service levels resulted in a number of new contracts being secured and an increase in market share. The opening of the new meat factory in Castlemaine enabled the closure of our factory near Perth in Western Australia and the redevelopment of the substantial site. Good progress has been made with the preparation of this site for housing development, and a number of lots were sold this year. Sales at ACH were ahead of last year, largely the result of increased demand for Mazola with positive consumer reaction to a plant sterols advertising campaign highlighting the cholesterollowering benefits of corn oil. In our Flavours business, volume increases were secured in barbeque and grilling spices with a very successful marketing campaign, ‘Grilling with the Greats’, in association with Major League Baseball. Capullo, our premium oil brand in Mexico, increased its market share which, together with the benefit of lower input costs, drove profit ahead of last year. INGREDIENTS Continuing businesses Revenue £m Adjusted operating profit £m Adjusted operating profit margin Return on average capital employed 2014 2013 restated 1,360 5 0.4% 0.6% 1,261 41 3.3% 5.8% Actual fx Constant fx -7% +4% Ingredients’ revenues were 4% ahead of last year at constant currency but with most of these businesses being located overseas, the strengthening of sterling resulted in a decline of 7% at actual rates. Profit recovery was substantial, driven by much stronger trading from AB Mauri and the benefit from the non-recurrence of last year’s restructuring and accelerated depreciation charges. AB Mauri made progress in all of its regions and in both yeast and bakery ingredients. Good revenue growth was achieved in South America where, in a very competitive market, cost inflation was either recovered through pricing or offset by improvements in efficiency. Higher volumes and a focus on business development drove growth in North America and the new yeast factory in Mexico is now supplying the markets of North and Central America. In China, the site of our Meishan yeast factory in Guangzhou City is to be redeveloped by the local government, the factory has been closed and provision for the small associated cost has been made. Customer requirements will be met from our other factories in China. In January, AB Mauri completed the acquisition of a small bakery ingredients business operating across western Europe which offers craft and industrial customers a range of high-quality bakery ingredients. Its integration with our existing operations will broaden our product offering and our ability to respond to customer needs in a number of key markets. 12 At ABF Ingredients, good growth was achieved in extruded cereals in the US and in speciality ingredients which provide enhanced functionality when incorporated into pharmaceutical formulations. Further progress was made in baking enzymes with several new products launched during the year and, following a series of successful trials in the pulp and paper industry, a number of mills have converted to the use of enzymes to reduce costs and lessen their environmental impact. The next phase of expansion at the enzymes manufacturing facility in Finland is under way. The closure of the yeast extracts plant in China, for which provision was made last year end, was well managed and profit benefited from the transfer of production to lower cost facilities elsewhere in the group. The new cereal extrusions factory in the US at Evansville, Indiana, is now in production, providing increased capacity to meet the growing demand both for extruded cereal products and AB Vista’s granulated feed products. In view of the complementary product portfolios and common customer base, the Australian and New Zealand yeast and bakery ingredients businesses of AB Mauri have been integrated with the flour milling business of George Weston Foods in Australia. This will reduce overheads and allow the combined business to bring its technologies to market more effectively. Reflecting this change, the results of the Australian milling business, which were previously included within the Grocery segment, are now included within the Ingredients segment. The comparative results for 2013 have been restated resulting in £272m of sales and £4m of operating profit being transferred from Grocery to Ingredients. SUMMARY Looking ahead to the next few years we see excellent prospects for Primark and further development of Grocery, Ingredients and Agriculture. We expect a further large reduction in profit for AB Sugar during 2014/15 and some volatility in the medium term with the reduction of excess stocks and as the sugar industry restructures. By the end of our 2015 financial year much of the structural change in EU prices will be behind us and we have every reason to be confident of further progress for the group thereafter. George Weston Chief Executive 13 FINANCIAL REVIEW GROUP PERFORMANCE Group revenue increased by 1% at constant exchange rates, but the strengthening of sterling against our major trading currencies, particularly in the second half of the year, resulted in a decline in revenues of 3% at actual rates, to £12.9bn. Adjusted operating profit of £1,163m was 2% ahead of last year at constant rates but 1% lower at actual rates. In calculating adjusted operating profit, the amortisation charge on non-operating intangibles and any profits or losses on disposal of non-current assets are excluded. On an unadjusted basis, operating profit was 1% below last year at £1,080m. Comparative results for 2013 have been restated for the effects of adopting the revised accounting standard for employee benefits, details of which are provided under ‘Pensions’ below. During the year we merged the activities of AB Mauri’s Australian and New Zealand yeast and bakery ingredients businesses with the flour milling business of George Weston Foods in Australia. The results of the Australian milling business, which were previously included within the Grocery segment, are now included within the Ingredients segment. The comparative results for 2013 have been restated resulting in £272m of sales and £4m of operating profit being transferred from Grocery to Ingredients. The income statement benefited from the non-recurrence of last year’s loss of £128m on the sale or closure of businesses in our Ingredients and Sugar segments. Finance expense less finance income of £58m compared with a net charge of £87m last year. This reduction reflected the retirement of expensive long-term debt, including the redemption of British Sugar’s £150m 10¾% debenture on 4 July 2013 and the repayment of £194m of private placement notes, $120m of which was repaid mid way through last year and $194m was repaid this year. The average level of debt also benefited from another strong cash flow performance. Profit before tax increased from £868m to £1,020m. On an adjusted basis, where the amortisation of non-operating intangible assets and any profits or losses on the sale of non-current assets and on the sale and closure of businesses are excluded, profit before tax increased by 2% to £1,105m. TAXATION We recognise the importance of complying fully with all applicable tax laws as well as paying and collecting the right amount of tax in every country in which the group operates. We have had a board-adopted tax policy for many years which is based on seven tax principles that are embedded in the financial and non-financial processes and controls of the group. Our tax principles are included in the appendix to our Corporate Responsibility Report. The tax charge for the year of £237m included an underlying charge of £257m at an effective rate of 23.3% (2013 – 24.2%) on the adjusted profit before tax. The reduction in the effective rate is a result of the mix of profits earned in different tax jurisdictions and the reduction in the UK corporation tax rate from 23% to 21% with effect from 1 April 2014. A further reduction in the UK rate to 20% is due to take effect on 1 April 2015. The legislation to effect these rate changes was enacted before the prior year balance sheet date and as deferred tax is measured at the rates that are expected to apply in the periods when the underlying timing differences reverse, opening and closing UK deferred tax balances have both been calculated using a rate of 20%. The overall tax charge for the year benefited from a £21m (2013 - £29m) credit for tax relief on the amortisation of non-operating intangible assets and goodwill arising from previous acquisitions. EARNINGS AND DIVIDENDS Earnings attributable to equity shareholders were £762m, £177m higher than last year, and the weighted average number of shares in issue during the year used to calculate earnings per share was 790 million (2013 - 790 million). Earnings per ordinary share were 30% higher than last year 14 at 96.5p with the absence of losses on sales and closure of businesses. Adjusted earnings per share, which provides a more consistent measure of trading performance, increased by 6% from 98.1p to 104.1p. The interim dividend was increased by 4% to 9.7p and a final dividend has been proposed at 24.3p which represents an overall increase of 6% for the year. The proposed dividend is expected to cost £192m and will be charged next year. Dividend cover, on an adjusted basis, is just over three times. BALANCE SHEET Non-current assets of £6.8bn were similar to last year. Intangible assets were £114m lower, mainly reflecting the amortisation charge for the year and foreign exchange translation losses. Property, plant and equipment increased by £113m with capital expenditure in the year running ahead of depreciation. Working capital at the year end was £164m lower than last year reflecting lower food commodity prices and the benefit of management action to reduce the average level of working capital throughout the year. When expressed as a percentage of sales, this also showed further improvement. Net borrowings at the year end were £358m lower than last year at £446m as a consequence of the very strong cash flow. A currency loss of £250m arose on the translation into sterling of the group’s foreign currency denominated net assets. The group’s net assets increased by £234m to £6,753m. Return on capital employed (ROCE) for the group increased further this year to 18.9%, up from last year’s restated return of 18.4%. All businesses with the exception of Sugar delivered an improvement through higher profits, with the average level of capital employed in the business little changed from last year. ROCE is calculated by expressing adjusted operating profit as a percentage of the average capital employed for the year. CASH FLOW Net cash flow from operating activities was very strong again this year, increasing from £1,276m to £1,439m with a working capital inflow of £100m compared to last year’s outflow of £97m. We continued to invest in the future growth of the group and the £691m spent on property, plant and equipment and intangibles net of disposals during the year was an increase on last year’s investment of £600m. Primark spent £378m on the acquisition of new stores, the fit-out of new and existing stores and warehousing. Expenditure in the food businesses was lower than last year but major projects included further investment in the modernisation of our UK bakeries, new tea packing machines in Twinings’ three factories, two animal feed mills in China and the redevelopment of a former bakery site in Western Australia including ground works and utilities in preparation for its sale for housing development. FINANCING The financing of the group is managed by a central treasury department. The group has total committed borrowing facilities amounting to £2.2bn, which comprise: £579m of US private placement notes maturing between 2016 and 2024; £1.2bn provided under a newly negotiated syndicated, revolving credit facility which matures in July 2019 with an option to extend by two years; a £120m loan from the European Investment Bank maturing in January 2015 and £328m of local committed facilities in Africa and Spain. During the financial year we repaid, from existing cash resources, US$194m of private placement notes. At the year end, £821m was drawn down under these committed facilities. The group also had access to £644m of uncommitted credit lines under which £132m was drawn at the year end. Cash and cash equivalents totalled £519m at the year end. 15 The financial strength and flexibility of the group is enhanced by diversifying our sources of funding and having certainty of finance over a long period. The strength and breadth of the 12 banks in the syndicate reflect the scale and international presence of the group and during the renegotiation this year we included another European bank in the syndicate to reflect the increasing activities of the group in continental Europe through Primark’s expansion. The average fixed interest coupon on the private placement notes is 5.1%. PENSIONS Pension liabilities in the group’s defined benefit pension schemes exceeded employee benefit assets at the year end by £43m compared with last year’s restated deficit of £15m. The UK scheme accounts for 91% of the group’s total pension assets and the increase in the market value of these assets during the year was slightly more than the increase in the present value of scheme liabilities. Total contributions to defined benefit plans in the year amounted to £41m (2013 - £69m), the lower amount reflecting the end of the £30m p.a. deficit contributions that were paid in each of the last five years. A triennial valuation of the UK scheme was undertaken as at 5 April 2014, which was agreed by the trustees after the group’s year end, and revealed a surplus of £78m. As a result there is no requirement to agree a recovery plan with the trustees. On 1 October 2012 new legislation came into effect which required all eligible UK employees to be automatically enrolled into a qualifying pension scheme. We embraced this new legislation by providing an attractive scheme with employer contribution rates in excess of the statutory minimum and we saw a high take-up. The charge for the year for the group’s defined contribution schemes, which is equal to the contributions made, amounted to £76m (2013 - £66m) and this is the first year that defined contribution costs have exceeded the cash contribution made to the defined benefit schemes reflecting the changing shape of pension provision in the group. The accounting standard under which the group’s pension schemes are accounted, IAS 19 Employee benefits, has been revised, and the new provisions were adopted by the group with effect from 15 September 2013. The comparative results for the financial year 2013 have been restated as a prior year adjustment, the effect of which was to reduce the reported operating profit by £5m to reflect a change in the treatment of administration costs, and to increase other financial expenses by £3m due to the replacement of the expected rate of return on assets with the discount rate. There was little difference between the expected rates of return on assets and the discount rates in the group’s schemes in 2013 hence the small adjustment. John Bason Finance Director The annual report and accounts is available at www.abf.co.uk and will be despatched to shareholders on 6 November 2014. The annual general meeting will be held at Congress Centre, 28 Great Russell Street, London. WC1B 3LS at 11am on Friday, 5 December 2014. 16 PRINCIPAL RISKS AND UNCERTAINTIES Each business is responsible for its own risk management assessment which is reported to the group’s Director of Financial Control annually. Our decentralised business model empowers the boards and management of our businesses to identify, evaluate and manage the risks they face on a timely basis. Key risks and internal control procedures are reviewed at group level by the board. We require all businesses to implement appropriate levels of risk management to ensure compliance with all relevant legislation, our group health, safety and environment policies, our overriding business principles and group policies relating to them, taking into account business needs and local circumstances. Each business is responsible for regularly assessing its health, safety and environmental risks with managers, operators, contracting companies and specialist staff working together to identify hazards. Appropriate operational procedures and controls are put in place to mitigate risks and all employees are provided with appropriate information, training and supervision. Further details of our risk mitigation activities can be found in our Corporate Responsibility Report at www.abf.co.uk/responsibility. The board reviews annually the material financial and non-financial risks facing our businesses and, on a rolling cycle basis, reviews the effectiveness of the risk management process and the resources that our individual businesses devote to them. The principal risks currently identified by our businesses and reviewed by the board are: People Issue Risk Mitigation Product safety Reputational damage caused by food hygiene or product safety incidents. Food safety is put before economic considerations. Non-compliance with regulatory requirements. Public concerns over materials used in packaging and ingredients in products. Our businesses employ quality control specialists and operate strict policies to ensure consistently high standards are maintained in our operations and in the sourcing and handling of raw materials. Food safety systems are regularly reviewed for efficacy and legal compliance. We participate in independent food health and safety audits. Quality and food safety audits are undertaken at our manufacturing sites. Documented and tested product recall procedures are embedded in all our businesses and are regularly reviewed. We proactively monitor the regulatory and legislative environment as well as emerging scientific research. Health and nutrition Health concerns over fat, salt and calorie content of foods. Responding correctly to the spectrum of food poverty and malnutrition versus obesity. Recipes are regularly reviewed and reformulation is conducted to improve the nutritional value of products, with a focus on reducing fat, salt and calorie content where possible. Our UK Grocery group has signed the UK government’s ‘Public Health Responsibility Deal’ and associated pledges to reduce salt, remove trans fats and promote healthy eating and lifestyle options to our employees. All of our grocery products are labelled with nutritional information. Inappropriate advertising to children. Our UK Grocery portfolio contains only a small number of products specifically intended for children. These products are marketed responsibly, following accepted codes of practice and within the parameters of a clear, operational business policy. We are looking further to continue programmes related to health and nutrition, and to develop partnerships to help educate people about health and nutrition. 17 Workplace health and safety Potential for fatal accidents and serious injuries to employees, contractors and visitors. Group Health and Safety Policy and practices are embedded with a strong ethos of workplace safety across the group. We maintain a programme of audits to verify implementation and support continuous improvement. Loss of healthy workforce and supply chain due to diseases such as HIV/AIDS, TB and malaria in high-risk countries. Accountable senior executives and specialists are appointed. We provide health and safety training and continue to share guidance and best practice with our businesses. We have extended the internal and external auditing of health, safety and management reporting. We continue to invest in health and safety management. Management succession Failure to plan for succession to key roles could lead to a lack of management continuity and suboptimal operational or financial performance. Each business has a succession plan which is reviewed with group management twice a year, and with the board annually. Development of our senior managers is co-ordinated by the Group HR Director and the Head of Executive Development. A small number of executive search companies have been briefed to introduce us to talented executives from other companies who could add value to the group. Suppliers and supply chain reliability Damage to brands caused by supply chain weakness, e.g. poor conditions for workers. Problems with supply reliability caused by natural disasters and other incidents. Understanding the sustainability and responsible business practices of our suppliers. Maintain programme of supplier audits where appropriate. Extensive audit programme for labour standards of suppliers. We have introduced a Supplier Code of Conduct which is being implemented across all our businesses, tailored to their requirements. We continue to work, in partnership with suppliers and NGOs, to improve working conditions, e.g. via training. Continued focus on worker safety and safe working conditions. We have built up an intensive programme of ethical audits in Primark’s supply chain. Primark has maintained its classification as a leader, by the Ethical Trade Initiative, and we are mapping second tier suppliers (subcontractors). The Grocery division conducts independent reviews of the environmental and ethical risks in its supply chains to increase understanding. External communication and transparency on the management of our supply chain in Primark and Grocery has been enhanced. Business continuity and disaster recovery plans are regularly reviewed. Ethical business practices Unacceptable business practices which contravene our business principles. Reputational damage through irresponsible business practices of individuals. Penalties imposed through bribery, corruption or unfair competition. All businesses are signed up to the group’s Business Principles and Anti-Bribery and Corruption Policy. A programme of training and compliance has been implemented for all employees. Appointment of anti-bribery and corruption specialists. Businesses work co-operatively to ensure visibility of reputational risk within supply chains and draw upon best practice management expertise across the group including Primark and Twinings. Environment Environment management including climate change Long-term increase in energy prices. Compliance with the group’s Environment Policy and annual reporting of environmental impact. Physical threats to operations from climate change, e.g. flooding. Best available techniques are employed to reduce energy consumption – statutory requirement for all sites subject to the EU’s Pollution Prevention and Control regime. 18 Climate change impact altering growth rates of raw materials we use. Increasing cost to operations to adapt to climate change and mitigate impact. Negative impact on the environment and the communities which depend on land used by our operations. Agricultural raw materials are sourced from a wide range of geographical locations and suppliers. We have a continued focus on reducing our environmental impact and implementing changes to our operations to maximise opportunities such as recycling more waste and using more renewable sources of fuel. We have implemented infrastructural protections against weatherrelated risks such as floods. Greenhouse gas emissions are measured and reported annually and subject to assurance by KPMG LLP. Substantial investment is made to improve environmental risk management, with a focus on energy efficiency, when investing in new capital projects. Water use and availability Securing access to sources of water and maintaining water availability for all. Ensuring good practices in sharing and managing water supplies with local communities. Operating in water stress areas. Water-intensive sites in areas of water stress identified, and efforts focused on water efficiencies in these areas. Investing heavily in the quality of our water usage data to enable improved measurement and management of water use and water quality. Investment in irrigation systems. Look to build long-term partnerships to address water issues at a local level. Finalise the standardised approach to water measurement across the group so that we can target investment and build an effective water stewardship. Financial and regulatory Competition rules Financial, currency and commodity risks Penalties for failing to comply with the 1998 Competition Act, the 2003 Enterprise Act, relevant EU law and all relevant competition legislation. Clear policy direction and close support from specialist in-house legal department. Loss sustained as a result of failure of internal controls or fraud, and exposure to foreign currencies, interest rates, counterparty credit risk, liquidity risk, and changes in market prices especially for energy and commodities. Adherence to the group’s financial control framework and anti-fraud policy. Compulsory awareness training. Treasury operations are conducted within a framework of boardapproved policies and guidelines. Sufficient funding is maintained by way of external loans and committed bank facilities, which are renewed or extended on a timely basis, having regard to the group’s projected funding needs. Financial transactions are dealt through financial institutions with a credit rating of A or better. Details of the group’s accounting and risk management policies with respect to financial instruments and associated quantitative and qualitative disclosures are set out in note 24 on pages 118-127 in the Annual Report. Tax compliance IT security breach Failure to comply with local tax law resulting in underpayment of tax and exposure to related interest and penalties. The group has a financial control framework and a board adopted tax policy requiring all businesses to comply fully with all relevant local tax law. Data loss or theft. Group IT Security policies and procedures are rolled out across the businesses. Provision is made for known issues based on management’s interpretation of country specific tax law and the likely outcome. Any interest and penalties on tax issues are provided for in the tax charge. Business disruption. Employee awareness campaigns are undertaken to highlight key activities to minimise IT security risks. 19 Technical security controls are in place over key IT platforms. Head of IT Security is tasked with identifying security risks and working with the businesses to implement mitigating controls. Internal audit reviews of compliance with policies and procedures are undertaken. Loss of a major site The loss of one of our key sites could present significant operational difficulties. Our businesses have in place business continuity plans to manage the impact of such an event and group insurance programmes to mitigate the financial consequences. Regulatory and political Failure to recognise political or cultural differences in the many countries in which we operate could directly impact the success of our operations. We remain vigilant to future changes and the risk presented by operating in emerging markets. Proposals to end sugar quotas in 2017. Major capital projects and acquisitions Risk of overspending initial cost estimates, overrunning construction timelines and failure to meet design specifications. We engage with governments and NGOs to ensure the views of our stakeholders are represented and we try to anticipate, and contribute to, important changes in public policy. Our financial control requirements are consistently applied wherever we operate. All major projects are managed by dedicated teams who work in close liaison with business management. Project plans are reviewed and approved by group management and, for larger projects, by the board. Updates on progress are provided throughout the project. CAUTIONARY STATEMENTS This report contains forward-looking statements. These have been made by the directors in good faith based on the information available to them up to the time of their approval of this report. The directors can give no assurance that these expectations will prove to have been correct. Due to the inherent uncertainties, including both economic and business risk factors underlying such forward-looking information, actual results may differ materially from those expressed or implied by these forward-looking statements. The directors undertake no obligation to update any forwardlooking statements whether as a result of new information, future events or otherwise. 20 DIRECTORS’ RESPONSIBILITIES IN RESPECT OF THE FINANCIAL STATEMENTS We, the directors of the Company, confirm that, to the best of our knowledge: • the financial statements prepared in accordance with the applicable accounting standards, give a true and fair view of the assets, liabilities, financial position and profit of the Company and the undertakings included in the consolidation taken as a whole; and • the Strategic Report includes a fair review of the development and performance of the business and the position of the group, together with a description of the principal risks and uncertainties that it faces. The contents of this announcement, including the responsibility statement above, have been extracted from the annual report and accounts for the 52 weeks ended 13 September 2014 which can be found at www.abf.co.uk and will be despatched to shareholders on 6 November 2014. Accordingly this responsibility statement makes reference to the financial statements of the Company and the group and to the relevant narrative appearing in that annual report and accounts rather than the contents of this announcement. On behalf of the board Charles Sinclair Chairman George Weston Chief Executive 4 November 2014 21 John Bason Finance Director CONSOLIDATED INCOME STATEMENT For the 52 weeks ended 13 September 2014 2014 2013 (restated) Continuing operations Note Revenue 1 Operating costs Share of profit after tax from joint ventures and associates Profits less losses on disposal of non-current assets £m 12,943 13,315 (11,865) (12,240) 1,078 1,075 13 13 (11) Operating profit Adjusted operating profit 1 £m - 1,080 1,088 1,163 1,180 Profits less losses on disposal of non-current assets (11) Amortisation of non-operating intangibles (72) (92) (2) (128) Profits less losses on sale and closure of businesses 2 Profit before interest 1,078 - 960 Finance income 15 13 Finance expense (73) (100) Other financial income/(expense) - (5) Profit before taxation 1,020 868 Adjusted profit before taxation 1,105 1,088 Profits less losses on disposal of non-current assets (11) Amortisation of non-operating intangibles (72) (92) (2) (128) – UK (117) (111) – Overseas (120) (129) (237) (240) 783 628 762 585 21 43 783 628 Profits less losses on sale and closure of businesses Taxation 3 Profit for the period - Attributable to Equity shareholders Non-controlling interests Profit for the period Basic and diluted earnings per ordinary share (pence) 4 96.5 74.0 Dividends per share paid and proposed for the period (pence) 5 34.0 32.0 22 CONSOLIDATED STATEMENT OF COMPREHENSIVE INCOME For the 52 weeks ended 13 September 2014 2014 2013 (restated) Profit for the period recognised in the income statement £m £m 783 628 (25) 33 3 (7) (22) 26 (275) (114) 25 (20) Other comprehensive income Remeasurements of defined benefit schemes Deferred tax associated with defined benefit schemes Items that will not be reclassified to profit or loss Effect of movements in foreign exchange Net gain/(loss) on hedge of net investment in foreign subsidiaries Deferred tax associated with movements in foreign exchange - Current tax associated with movements in foreign exchange 2 - Reclassification adjustment for movements in foreign exchange on subsidiaries disposed - 7 Movement in cash flow hedging position 2 55 6 Deferred tax associated with movement in cash flow hedging position (11) (2) Share of other comprehensive income of joint ventures and associates (5) - Items that are or may be subsequently reclassified to profit or loss (209) (121) Other comprehensive income for the period (231) (95) Total comprehensive income for the period 552 533 Equity shareholders 580 527 Non-controlling interests (28) Total comprehensive income for the period 552 Attributable to 23 6 533 CONSOLIDATED BALANCE SHEET At 13 September 2014 2014 £m 2013 (restated) £m Non-current assets Intangible assets Property, plant and equipment Biological assets Investments in joint ventures Investments in associates Employee benefits assets Deferred tax assets Other receivables 1,467 4,665 96 180 32 90 152 164 1,581 4,552 97 182 36 81 273 148 1,769 4,541 89 174 40 45 189 151 Total non-current assets 6,846 6,950 6,998 Current assets Inventories Biological assets Trade and other receivables Derivative assets Cash and cash equivalents 1,631 109 1,293 74 519 1,581 112 1,342 27 362 1,500 109 1,236 33 391 Total current assets 2012 (restated) £m 3,626 3,424 3,269 TOTAL ASSETS 10,472 10,374 10,267 Current liabilities Loans and overdrafts Trade and other payables Derivative liabilities Income tax Provisions (358) (2,046) (15) (193) (72) (394) (1,881) (38) (166) (47) (538) (1,752) (50) (150) (98) Total current liabilities (2,684) (2,526) (2,588) (607) (29) (266) (133) (772) (30) (431) (96) (914) (38) (373) (112) Total non-current liabilities (1,035) (1,329) (1,437) TOTAL LIABILITIES (3,719) (3,855) (4,025) 6,753 6,519 6,242 Non-current liabilities Loans Provisions Deferred tax liabilities Employee benefits liabilities NET ASSETS Equity Issued capital Other reserves Translation reserve Hedging reserve Retained earnings TOTAL EQUITY ATTRIBUTABLE TO EQUITY SHAREHOLDERS Non-controlling interests 45 175 238 29 5,950 45 175 440 (13) 5,508 45 175 532 (17) 5,120 6,437 316 6,155 364 5,855 387 TOTAL EQUITY 6,753 6,519 6,242 24 CONSOLIDATED CASH FLOW STATEMENT For the 52 weeks ended 13 September 2014 2014 2013 (restated) £m Cash flow from operating activities Profit before taxation Profits less losses on disposal of non-current assets Profits less losses on sale and closure of businesses Finance income Finance expense Other financial expense Share of profit after tax from joint ventures and associates Amortisation Depreciation Impairment of property, plant and equipment Impairment of operating intangibles Impairment of goodwill Net change in the fair value of biological assets Share-based payment expense Pension costs less contributions Increase in inventories Decrease/(increase) in receivables Increase in payables Purchases less sales of current biological assets Increase in provisions Cash generated from operations Income taxes paid Net cash from operating activities Cash flows from investing activities Dividends received from joint ventures and associates Purchase of property, plant and equipment Purchase of intangibles Purchase of non-current biological assets Sale of property, plant and equipment Purchase of subsidiaries, joint ventures and associates Sale of subsidiaries, joint ventures and associates Loans to joint ventures Purchase of non-controlling interests Interest received Net cash from investing activities Cash flows from financing activities Dividends paid to non-controlling interests Dividends paid to equity shareholders Interest paid Financing: Decrease in short-term loans Decrease in long-term loans Sale of shares in subsidiary undertakings to non-controlling interests Movements from changes in own shares held Net cash from financing activities Net increase/(decrease) in cash and cash equivalents Cash and cash equivalents at the beginning of the period Effect of movements in foreign exchange Cash and cash equivalents at the end of the period 25 £m 1,020 11 2 (15) 73 (13) 94 402 (21) 15 7 (119) 19 200 (3) 13 1,685 (246) 1,439 868 128 (13) 100 5 (13) 130 405 27 4 10 (26) 15 (24) (112) (158) 173 (2) 11 1,528 (252) 1,276 17 (676) (32) 17 (8) 15 (15) 10 (672) 11 (593) (22) (1) 15 (75) 35 (4) (1) 10 (625) (21) (256) (77) (29) (232) (107) (158) (10) 1 (59) (580) (258) (23) 1 (10) (658) 187 243 (31) 399 (7) 245 5 243 CONSOLIDATED STATEMENT OF CHANGES IN EQUITY For the 52 weeks ended 13 September 2014 Attributable to equity shareholders Balance as at 15 September 2012 (restated) Issued capital £m 45 Other Translation reserves reserve £m £m 175 532 Hedging reserve £m (17) Retained earnings £m 5,120 585 Total £m 5,855 Noncontrolling interests £m 387 Total equity £m 6,242 585 43 628 Total comprehensive income Profit for the period recognised in the income statement (restated) - - - - Remeasurements of defined benefit schemes (restated) Deferred tax associated with defined benefit schemes (restated) Items that will not be reclassified to profit or loss - - - - 35 (7) 28 35 (7) 28 (2) (2) 33 (7) 26 Effect of movements in foreign exchange Net loss on hedge of net investment in foreign subsidiaries Deferred tax associated with movements in foreign exchange Reclassification adjustment for movements in foreign exchange on subsidiaries disposed Movement in cash flow hedging position Deferred tax associated with movement in cash flow hedging position Items that are or may be subsequently reclassified to profit or loss - - (86) (13) - - 2 (86) (13) 2 (28) (7) - (114) (20) 2 - - 7 - 6 - 7 6 - - (92) (2) 4 2 (2) (86) (35) Other comprehensive income - - (92) 4 30 (58) (37) (95) Total comprehensive income - - (92) 4 615 527 6 533 45 175 440 (13) (232) 5 (227) 5,508 (232) 5 (227) 6,155 (29) (29) 364 (232) 5 (29) (256) 6,519 Total comprehensive income Profit for the period recognised in the income statement - - - - 762 762 21 783 Remeasurements of defined benefit schemes Deferred tax associated with defined benefit schemes Items that will not be reclassified to profit or loss - - - - (25) 3 (22) (25) 3 (22) Effect of movements in foreign exchange Net gain on hedge of net investment in foreign subsidiaries Current tax associated with movements in foreign exchange Movement in cash flow hedging position Deferred tax associated with movement in cash flow hedging position Share of other comprehensive income of joint ventures and associates Items that are or may be subsequently reclassified to profit or loss - - - - - - Other comprehensive income - Total comprehensive income - 45 175 Transactions with owners Dividends paid to equity shareholders Net movement in own shares held Dividends paid to non-controlling interests Total transactions with owners Balance as at 14 September 2013 Transactions with owners Dividends paid to equity shareholders Net movement in own shares held Current tax associated with share-based payments Dividends paid to non-controlling interests Acquisition of non-controlling interests Total transactions with owners Balance as at 13 September 2014 26 (224) 25 2 - 53 - (224) 25 2 53 (11) - (11) (5) (202) 42 - (5) (160) - (202) 42 (22) - (202) 42 740 238 29 (256) (44) 2 (298) 5,950 - - (51) 2 - 7 6 (2) (121) (25) 3 (22) (275) 25 2 55 (11) (49) (5) (209) (182) (49) (231) 580 (28) 552 (256) (44) 2 (298) 6,437 (21) 1 (20) 316 (256) (44) 2 (21) 1 (318) 6,753 NOTES TO THE ANNUAL RESULTS ANNOUNCEMENT For the 52 weeks ended 13 September 2014 1. Operating segments The group has five operating segments, as described below. These are the group’s operating divisions, based on the management and internal reporting structure, which combine businesses with common characteristics. The board is the chief operating decision-maker. Inter-segment pricing is determined on an arm’s length basis. Segment result is adjusted operating profit, as shown on the face of the consolidated income statement. Segment assets comprise all non-current assets except employee benefits assets and deferred tax assets, and all current assets except cash and cash equivalents. Segment liabilities comprise trade and other payables, derivative liabilities and provisions. Segment results, assets and liabilities include items directly attributable to a segment as well as those that can be allocated on a reasonable basis. Unallocated items comprise mainly corporate assets and expenses, cash, borrowings, employee benefits balances and current and deferred tax balances. Segment non-current asset additions are the total cost incurred during the period to acquire segment assets that are expected to be used for more than one year, comprising property, plant and equipment, operating intangibles and biological assets. The group is comprised of the following operating segments: Grocery Sugar Agriculture Ingredients Retail The manufacture of grocery products, including hot beverages, sugar & sweeteners, vegetable oils, bread & baked goods, cereals, ethnic foods, herbs & spices, and meat products, which are sold to retail, wholesale and foodservice businesses. The growing and processing of sugar beet and sugar cane for sale to industrial users and to Silver Spoon, which is included in the grocery segment. The manufacture of animal feeds and the provision of other products and services for the agriculture sector. The manufacture of bakers’ yeast, bakery ingredients, enzymes, lipids yeast extracts and cereal specialities. Buying and merchandising value clothing and accessories through the Primark and Penneys retail chains. Geographical information In addition to the required disclosure for operating segments, disclosure is also given of certain geographical information about the group’s operations, based on the geographical groupings: United Kingdom; Europe & Africa; The Americas; and Asia Pacific. Revenues are shown by reference to the geographical location of customers. Profits are shown by reference to the geographical location of the businesses. Segment assets are based on the geographical location of the assets. Revenue 52 weeks 52 weeks ended ended 14 September 13 September 2013 2014 Operating segments Grocery Sugar Agriculture Ingredients Retail Central Businesses disposed: Grocery Ingredients Adjusted operating profit 52 weeks 52 weeks ended ended 13 September 14 September 2014 2013 (restated) £m £m £m £m 3,337 2,083 1,312 1,261 4,950 12,943 3,568 2,677 1,410 1,360 4,273 13,288 269 189 50 41 662 (49) 1,162 224 434 47 5 513 (51) 1,172 12,943 27 13,315 1 1,163 2 6 1,180 5,631 3,924 1,211 2,177 12,943 5,728 3,790 1,282 2,488 13,288 602 393 127 40 1,162 710 386 103 (27) 1,172 12,943 27 13,315 1 1,163 6 2 1,180 Geographical information United Kingdom Europe & Africa The Americas Asia Pacific Businesses disposed: The Americas Asia Pacific See page 29 for details of the restatement of 2013 comparative data 27 NOTES TO THE ANNUAL RESULTS ANNOUNCEMENT continued For the 52 weeks ended 13 September 2014 1. Operating segments for the 52 weeks ended 13 September 2014 Grocery £m Revenue from continuing businesses Internal revenue External revenue from continuing businesses Businesses disposed Revenue from external customers Agriculture £m Ingredients £m Retail £m 1,312 1,312 1,312 1,423 (162) 1,261 1,261 4,950 4,950 4,950 3,344 (7) 3,337 3,337 2,164 (81) 2,083 2,083 254 15 1 270 6 (50) 226 215 (26) 189 (17) 172 36 14 50 1 (3) 48 31 10 41 (2) (2) 37 662 662 (14) 648 226 172 48 37 648 2,431 38 2,469 2,327 13 2,340 312 113 425 1,266 48 1,314 2,948 2,948 Adjusted operating profit before joint ventures and associates Share of profit after tax from joint ventures and associates Businesses disposed Adjusted operating profit Profits less losses on disposal of non-current assets Amortisation of non-operating intangibles Profits less losses on sale and closure of businesses Profit before interest Finance income Finance expense Taxation Profit for the period Segment assets (excluding joint ventures and associates) Investments in joint ventures and associates Segment assets Cash and cash equivalents Deferred tax assets Employee benefits assets Segment liabilities Loans and overdrafts Income tax Deferred tax liabilities Employee benefits liabilities Net assets Sugar £m (495) (385) (125) (251) (784) Central £m (250) 250 - Total £m 12,943 12,943 12,943 (49) (49) (4) (53) 15 (73) (237) (348) 1,149 13 1 1,163 (11) (72) (2) 1,078 15 (73) (237) 783 215 215 519 152 90 (122) (965) (193) (266) (133) (703) 9,499 212 9,711 519 152 90 (2,162) (965) (193) (266) (133) 6,753 1,974 1,955 300 1,063 2,164 153 96 64 - 103 80 20 - 28 7 6 - 65 44 4 4 394 171 - 1 4 - 744 402 94 4 United Kingdom £m 5,631 3,951 279 184 22 - Europe & Africa £m 3,924 3,220 351 122 19 - The Americas £m 1,211 968 34 27 43 - Asia Pacific £m 2,177 1,572 80 69 10 4 Total £m 12,943 9,711 744 402 94 4 Non-current asset additions Depreciation Amortisation Impairment of goodwill on closure of business Geographical information Revenue from external customers Segment assets Non-current asset additions Depreciation Amortisation Impairment of goodwill on closure of business 28 NOTES TO THE ANNUAL RESULTS ANNOUNCEMENT continued For the 52 weeks ended 13 September 2014 1. Operating segments for the 52 weeks ended 14 September 2013 (restated) Grocery £m Revenue from continuing businesses Internal revenue External revenue from continuing businesses Businesses disposed Revenue from external customers Agriculture £m Ingredients £m Retail £m 1,410 1,410 1,410 1,544 (184) 1,360 27 1,387 4,273 4,273 4,273 (323) 323 (51) (51) (51) 13 (100) (5) (240) (383) 1,159 13 8 1,180 (92) (128) 960 13 (100) (5) (240) 628 187 187 362 273 81 (112) (1,166) (166) (431) (96) (1,068) 9,440 218 9,658 362 273 81 (1,996) (1,166) (166) (431) (96) 6,519 3,576 (8) 3,568 3,568 2,808 (131) 2,677 2,677 216 8 2 226 (19) 207 449 (15) 434 (21) (15) 398 35 12 47 (1) 46 (3) 8 6 11 (51) (113) (153) 513 513 513 207 398 46 (153) 513 2,510 33 2,543 2,432 34 2,466 319 99 418 Adjusted operating profit before joint ventures and associates Share of profit after tax from joint ventures and associates Businesses disposed Adjusted operating profit Amortisation of non-operating intangibles Profits less losses on sale and closure of businesses Profit before interest Finance income Finance expense Other financial expense Taxation Profit for the period Segment assets (excluding joint ventures and associates) Investments in joint ventures and associates Segment assets Cash and cash equivalents Deferred tax assets Employee benefits assets Segment liabilities Loans and overdrafts Income tax Deferred tax liabilities Employee benefits liabilities Net assets Sugar £m (496) (398) (121) 1,315 52 1,367 (250) 2,677 2,677 (619) Central £m Total £m 13,288 13,288 27 13,315 2,047 2,068 297 1,117 2,058 158 102 36 - 158 86 37 8 4 10 3 14 10 7 3 - 77 55 54 19 74 - 220 151 - 6 4 - 629 405 130 27 4 10 77 14 United Kingdom £m 5,728 3,863 260 177 35 - Europe & Africa £m 3,790 3,096 209 102 26 19 - The Americas £m 1,309 1,022 51 28 39 - Asia Pacific £m 2,488 1,677 109 98 30 8 4 10 77 14 Total £m 13,315 9,658 629 405 130 27 4 10 77 14 Non-current asset additions Depreciation Amortisation Impairment of property, plant and equipment Impairment of operating intangibles Impairment of goodwill Impairment of property, plant and equipment on closure of business Impairment of goodwill on sale of business Geographical information Revenue from external customers Segment assets Non-current asset additions Depreciation Amortisation Impairment of property, plant and equipment Impairment of operating intangibles Impairment of goodwill Impairment of property, plant and equipment on closure of business Impairment of goodwill on sale of business The comparative results for 2013 have been restated for the adoption of IAS19 Revised - Employee benefits During the year, the activities of AB Mauri’s yeast and bakery ingredients businesses in Australia and New Zealand were merged with the flour milling business of George Weston Foods. The results of the flour milling business, which were previously included within the Grocery segment, are now included in the Ingredients segment. The comparative results for 2013 have been reclassified, resulting in £272m of revenue and £4m of adjusted operating profit being transferred from Grocery to Ingredients. Segment assets and liabilities have also been restated in this respect. Disposed businesses comprise the disposal during the year of the group’s interest in a US associate in the Ingredients segment and an associated Australian royalty stream in the Grocery segment, together with the prior year disposal of the group’s US whey protein businesses in the Ingredients segment. 29 NOTES TO THE ANNUAL RESULTS ANNOUNCEMENT continued For the 52 weeks ended 13 September 2014 2. Profits less losses on sale and closure of businesses 2014 The group disposed of its interest in a US associate in the Ingredients segment for a profit of £7m. Cash consideration was £12m, deferred consideration was £1m, share of net assets disposed was £2m and provisions made were £4m. In addition, a charge of £9m was made in the Ingredients segment in China and India for restructuring costs associated with business closures, including a £4m impairment of goodwill. 2013 Loss on sale and closure of businesses of £128m comprised £113m for disposals and closures in the Ingredients segment and £15m for the loss on disposal of the sugar business in Chifeng, north China. Included within the amount charged in the Ingredients segment was a loss of £26m in respect of the disposal of our US whey protein operation, a charge of £72m to write down the carrying value of certain Ingredients assets in China and to provide for restructuring costs and a charge of £13m to write down the value of yeast plants in India. 3. Income tax expense 52 weeks ended 13 September 2014 £m Current tax expense UK – corporation tax at 22.1% (2013 – 23.5%) Overseas – corporation tax UK – under/(over) provided in prior periods Overseas – overprovided in prior periods Deferred tax expense UK deferred tax Overseas deferred tax UK – overprovided in prior periods Overseas – overprovided in prior periods Total income tax expense in income statement Reconciliation of effective tax rate Profit before taxation Less share of profit after tax from joint ventures and associates Profit before taxation excluding share of profit after tax from joint ventures and associates Nominal tax charge at UK corporation tax rate of 22.1% (2013 – 23.5%) Different tax rates on overseas earnings Effect of changes in tax rates on income statement Expenses not deductible for tax purposes Disposal of assets covered by tax exemptions or unrecognised capital losses Deferred tax not recognised Adjustments in respect of prior periods Income tax recognised directly in equity Deferred tax associated with defined benefit schemes Current tax associated with share-based payments Deferred tax associated with movement in cash flow hedging position Deferred tax associated with movements in foreign exchange Current tax associated with movements in foreign exchange 52 weeks ended 14 September 2013 (restated) £m 137 148 3 (2) 286 143 145 (9) (10) 269 (17) (19) (6) (7) (49) 237 (23) 2 (8) (29) 240 1,020 (13) 868 (13) 1,007 222 (11) 4 25 855 201 (15) (19) 24 2 7 (12) 237 39 37 (27) 240 (3) (2) 11 (2) 4 7 2 (2) 7 Following the enactment of legislation by the UK government prior to 14 September 2013 to reduce the corporation tax rate to 20% with effect from 1 April 2015, UK deferred tax has been calculated using a rate of 20%. The impact of this change was a reduction of £18m in the deferred tax charge for the year ended 14 September 2013. 30 NOTES TO THE ANNUAL RESULTS ANNOUNCEMENT continued For the 52 weeks ended 13 September 2014 4. Earnings per share The calculation of basic earnings per share at 13 September 2014 was based on the net profit attributable to equity shareholders of £762m (2013 - £585m), and a weighted average number of shares outstanding during the year of 790 million (2013 – 790 million). The calculation of the weighted average number of shares excludes the shares held by the Employee Share Ownership Plan Trust on which the dividends are being waived. Adjusted earnings per ordinary share, which exclude the impact of profits less losses on disposal of non-current assets and the sale and closure of businesses, amortisation of non-operating intangibles and any associated tax credits, is shown to provide clarity on the underlying performance of the group. The diluted earnings per share calculation takes into account the dilutive effect of share incentives. The diluted, weighted average number of shares is 790 million (2013 – 790 million). There is no difference between basic and diluted earnings. 52 weeks ended 13 September 2014 52 weeks ended 14 September 2013 (restated) pence pence Adjusted earnings per share Disposal of non-current assets Sale and closure of businesses Tax effect on above adjustments Amortisation of non-operating intangibles Tax credit on non-operating intangibles amortisation and goodwill Non-controlling interests’ share of amortisation of non-operating intangibles net of tax Earnings per ordinary share 104.1 (1.4) (0.3) (0.1) (9.1) 2.7 98.1 (16.2) (0.8) (11.7) 3.7 0.6 96.5 0.9 74.0 5. Dividends 2014 pence per share 22.65 9.70 32.35 2012 final 2013 interim 2013 final 2014 interim 2013 pence per share 20.00 9.35 29.35 2014 £m 179 77 256 2013 £m 158 74 232 The 2014 interim dividend was declared on 23 April 2014 and paid on 4 July 2014. The 2014 final dividend of 24.3 pence, total value of £192m, will be paid on 9 January 2015 to shareholders on the register on 12 December 2014. Dividends relating to the period were 34.0 pence per share totalling £269m (2013 – 32.0 pence per share totalling £253m). 31 NOTES TO THE ANNUAL RESULTS ANNOUNCEMENT continued For the 52 weeks ended 13 September 2014 6. Acquisitions and disposals 2014 During 2014, the group acquired a bakery ingredients business in Western Europe and a small animal feed specialist in the UK, which had the following effect on the group’s assets and liabilities: Recognised values on acquisition Net assets £m Non-operating intangibles 4 Property, plant and equipment 2 Inventories 4 Trade and other receivables 11 Cash and cash equivalents 5 Trade and other payables (8) Loans (4) Provisions (4) Employee benefits liabilities (1) Taxation (1) Net assets and liabilities and total consideration 8 Satisfied by Cash consideration Deferred consideration 7 1 Net cash Cash consideration Cash and cash equivalents acquired 7 (5) 2 Pre-acquisition carrying amounts were the same as recognised values on acquisition apart from a £4m non-operating intangible recognised in respect of customer relationships. The acquisitions in aggregate contributed revenue of £27m and adjusted profit before tax of £1m for the period between the dates of acquisition and 13 September 2014. Aggregate contributions to revenue and adjusted profit before tax had the acquisitions occurred at the beginning of the period have not been disclosed, as appropriate financial information prepared under Adopted IFRS is not available. The net cash of £2m in the acquisition table above differs by £6m from the cash outflow of £8m on the purchase of subsidiaries, joint ventures and associates shown in the cash flow statement. This difference relates to a £5m investment in an existing joint venture and £1m of deferred consideration paid in respect of prior year acquisitions. During the year, the group disposed of its interest in a US associate in the Ingredients segment for a profit of £7m. Cash consideration was £12m, deferred consideration was £1m, share of net assets disposed was £2m and provisions made were £4m. In addition, a charge of £9m was made in the Ingredients segment in China and India for restructuring costs associated with business closures including a £4m impairment of goodwill. 2013 During 2013, the group completed no new business combinations. Cash flow on purchase of subsidiaries, joint ventures and associates of £75m comprised £71m of deferred consideration in respect of previous business combinations, a £2m investment in a joint venture and a £2m adjustment to goodwill for a previous acquisition. Goodwill and deferred consideration were both reduced by £7m in respect of deferred consideration for previous acquisitions no longer payable. Loss on sale and closure of businesses of £128m comprised £113m for disposals and closures in the Ingredients segment and £15m for the loss on disposal of the sugar business in Chifeng, north China. Included within the amount charged in the Ingredients segment was a loss of £26m in respect of the disposal of our US whey protein operation. Cash consideration for the US disposal was £20m, tangible assets disposed amounted to £8m and goodwill disposed was £27m. Provisions made were £4m and foreign exchange differences recycled from equity were £7m. A charge of £72m was made to write down the carrying value of certain Ingredients assets in China and to provide for restructuring costs, and a charge of £13m to write down the value of yeast plants in India. Cash flow on sale of subsidiaries, joint ventures and associates of £35m comprised £20m in respect of the US whey protein business and £15m of deferred consideration received for previous disposals. 32 NOTES TO THE ANNUAL RESULTS ANNOUNCEMENT continued For the 52 weeks ended 13 September 2014 7. Analysis of net debt At 14 September 2013 £m Cash at bank and in hand, cash equivalents and overdrafts Short-term loans Long-term loans Cash flow Acquisitions £m £m 243 (275) (772) (804) 187 158 10 355 Non-cash items £m (4) (4) At 13 September 2014 £m Exchange adjustments £m (124) 124 - (31) 7 31 7 399 (238) (607) (446) Cash and cash equivalents comprise bank and cash balances, call deposits and short-term investments with original maturities of three months or less. Bank overdrafts that are repayable on demand of £120m form an integral part of the group’s cash management and are included as a component of cash and cash equivalents for the purpose of the cash flow statement. 8. Related party transactions The group has a controlling related party relationship with its parent company, Wittington Investments Limited, which is also its ultimate parent company. The group also has a related party relationship with its associates and joint ventures and with its directors. In the course of normal operations, related party transactions entered into by the group have been contracted on an arm’s length basis. Material transactions and year end balances with related parties were as follows: 2014 2013 £’000 £’000 403 338 9,125 1,442 8,277 1,297 43 30 2 3 4 952 93 12,459 864 2 16,538 4 4 1,418 1,456 21,337 30,248 372,496 16,266 182,254 3,274 33,095 6,640 787 2,227 18,488 19,460 397,449 20,805 163,170 1,790 30,806 1,059 Sub note Charges to Wittington Investments Limited in respect of services provided by the Company and its subsidiary undertakings Dividends paid by ABF and received in a beneficial capacity by: (i) trustees of the Garfield Weston Foundation (ii) directors of Wittington Investments Limited who are not trustees of the Foundation (iii) directors of the Company who are not trustees of the Foundation and are not directors of Wittington Investments Limited (iv) a member of the Weston family employed within the Associated British Foods group Sales to fellow subsidiary undertakings on normal trading terms Sales to companies with common key management personnel on normal trading terms Commissions paid to companies with common key management personnel on normal trading terms Amounts due from a company with common key management personnel Sales to joint ventures on normal trading terms Sales to associates on normal trading terms Purchases from joint ventures on normal trading terms Purchases from associates on normal trading terms Amounts due from joint ventures Amounts due from associates Amounts due to joint ventures Amounts due to associates 1. 2. 3. 4. 1 The Garfield Weston Foundation (‘the Foundation’) is an English charitable trust, established in 1958 by the late W Garfield Weston. The Foundation has no direct interest in the Company, but as at 13 September 2014 was the beneficial owner of 683,073 shares (2013 – 683,073 shares) in Wittington Investments Limited representing 79.2% (2013 – 79.2%) of that company’s issued share capital and is, therefore, the Company’s ultimate controlling party. At 13 September 2014 trustees of the Foundation comprised two children and two grandchildren of the late W Garfield Weston and five children of the late Garry H Weston. A member of the Weston family who is employed by the group and is not a director of the Company or Wittington Investments Limited and is not a trustee of the Foundation. The fellow subsidiary undertaking is Fortnum and Mason plc. The companies with common key management personnel are the George Weston Limited group, in Canada, and Selfridges & Co. Limited. Amounts due from joint ventures comprise £14m (2013 - £15m) of finance lease receivables and £145m (2013 - £130m) of loan receivables. The remainder of the balance is trading balances. The loan receivables are all non-current (2013 – all noncurrent), and all but £3m (2013 - £3m) of the finance lease receivables are non-current. 33 NOTES TO THE ANNUAL RESULTS ANNOUNCEMENT continued For the 52 weeks ended 13 September 2014 9. Other information The financial information set out above does not constitute the Company's statutory accounts for the 52 weeks ended 13 September 2014, or the 52 weeks ended 14 September 2013. Statutory accounts for 2013 have been delivered to the Registrar of Companies and those for 2014 will be delivered following the Company’s annual general meeting. The auditors have reported on those accounts. Their reports were (i) unqualified, (ii) did not include references to any matters to which the auditors drew attention by way of emphasis without qualifying their reports and (iii) did not contain a statement under section under section 498(2) or (3) of the Companies Act 2006 in respect of the accounts. 10. Basis of preparation Associated British Foods plc (‘the Company’) is a company domiciled in the United Kingdom. The consolidated financial statements of the Company for the 52 weeks ended 13 September 2014 comprise those of the Company and its subsidiaries (together referred to as ‘the group’) and the group's interests in joint ventures and associates. The consolidated financial statements were authorised for issue by the directors on 4 November 2014. The consolidated financial statements have been prepared and approved by the directors in accordance with International Financial Reporting Standards (‘IFRS’) as adopted by the EU. Under IFRS, management is required to make judgements, estimates and assumptions about the reported amounts of assets and liabilities, income and expense and the disclosure of contingent assets and liabilities. The estimates and associated assumptions are based on experience. Actual results may differ from these estimates. The estimates and underlying assumptions are reviewed on a regular basis. Revisions to accounting estimates are recognised from the period in which the estimates are revised. The consolidated financial statements are presented in sterling, rounded to the nearest million. They are prepared on the historical cost basis except that biological assets and certain financial instruments are stated at fair value. Assets classified as held for sale are stated at the lower of carrying amount and fair value less costs to sell. The consolidated financial statements of the group are prepared to the Saturday nearest to 15 September. Accordingly, these financial statements have been prepared for the 52 weeks ended 13 September 2014. To avoid delay in the preparation of the consolidated financial statements, the results of certain subsidiaries, joint ventures and associates are included up to 31 August 2014. The results of Illovo are included for the period to 30 September 2014 in line with Illovo’s local reporting date. Adjustments are made as appropriate for significant transactions or events occurring between 31 August and 30 September. 11. Significant accounting policies The accounting policies applied by the group in this annual results announcement are substantially the same as those applied by the group in its consolidated financial statements for the 52 weeks ended 14 September 2013. There have been a number of minor changes to standards which have become applicable for the year ending 13 September 2014, none of which have been assessed as having a significant impact on the group. The revised IAS 19 Employee Benefits is applicable to the group for the first time in 2014 and makes changes to measurement and disclosure requirements for defined benefit post-employment arrangements. The expected return on plan assets and the interest charge on scheme liabilities have been replaced by net interest income or expense calculated by applying the liability discount rate to the net pension asset or liability. Scheme administration costs are expensed as incurred and the reserve for scheme costs, which was previously included in scheme liabilities, has been removed. IAS 19 service cost is charged to operating profit and pension financing costs are charged to other financial expense. 34 NOTES TO THE ANNUAL RESULTS ANNOUNCEMENT continued For the 52 weeks ended 13 September 2014 11. Significant accounting policies (continued) The impact of adoption of the revised standard, which has been applied with retrospective effect from the 2012 balance sheet date, is set out below. The impact of all charges is reflected in retained earnings in equity and is wholly attributable to equity shareholders. 52 weeks ended 14 September 2013 (previously (restated) reported) £m £m Income statement Adjusted operating profit Operating profit Other financial expense Adjusted profit before taxation Profit before taxation Taxation Profit for the period 1,180 1,088 (5) 1,088 868 (240) 628 pence 74.0 98.1 Basic earnings per share Adjusted earnings per share Other comprehensive income Remeasurements of defined benefit schemes Deferred tax associated with defined benefit schemes Balance sheet Net employee benefits balances Net deferred tax balances 1,185 1,093 (2) 1,096 876 (242) 634 pence 74.8 98.9 £m £m 33 (7) 24 (5) (15) (158) (44) (151) In the 2012 balance sheet, the £95m net pension liability decreased by £28m to £67m and net deferred tax liabilities of £177m increased by £7m to £184m. These adjustments had no effect on net cash from operating activities but the cash flow statement does reflect the above adjustments to profit before taxation offset by an equal and opposite adjustment to pension costs less contributions. 35
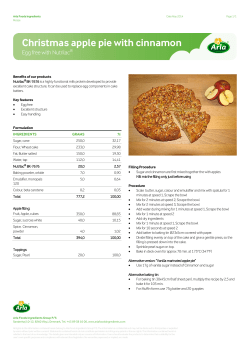
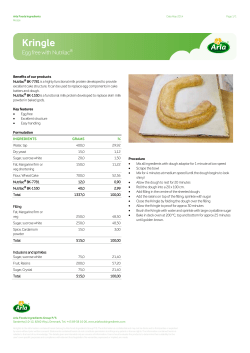


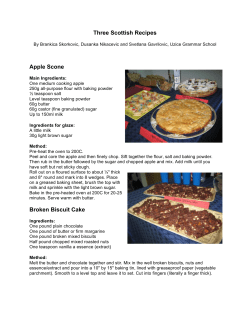
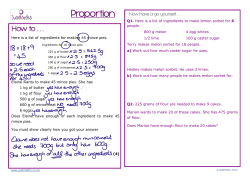


© Copyright 2026