
On the Markets A Treat, Not a Trick
GLOBAL INVESTMENT COMMITTEE / COMMENTARY
NOVEMBER 2014
On the Markets
MICHAEL WILSON
Chief Investment Officer
Morgan Stanley Wealth Management
TABLE OF CONTENTS
2
Making the Case for European Stocks
Growth, inflation, earnings and valuation
trends could lead to a year-end rally.
4
Activists at the Gates
Activist investors pressure companies to
break up and spin off business units.
5
Better Outlook for Holiday Sales
Higher income and lower gas prices suggest consumers will spend more this year.
7
Head Fake for Bond Investors
As far as yields go, 2014 is turning out to
be the opposite of 2013.
9
Bullish on High Yield
The risk/reward proposition has become
more attractive.
10
Anticipating an Upturn in Oil
In our view, the fundamentals are in place
for a rebound in crude prices.
11
Filling the Income Gap
Annuities may be able to help investors
navigate the changes in pension plans.
A Treat, Not a Trick
After a strong September, it appeared as if we might avoid
the volatile markets typically experienced in the fall.
Instead, the second half of the month and first half of
October played an early Halloween trick on investors, as
several things conspired to create what we believe
amounted to one of the most aggressive risk-off periods
experienced since the financial crisis of 2008 and 2009.
First, the Fed was scheduled to finally end its controversial Quantitative Easing
program in October. Many investors were nervous that the exit would leave the markets
vulnerable. Meanwhile, geopolitical risk had been rising all year, and the sanctions on
Russia were having an impact on Germany—the healthy part of Europe. Finally, the
Ebola virus hit the US, which was about as welcomed by markets as a Red Sox fan at
Yankee Stadium.
The bottom line is that the Global Investment Committee believes the Fed’s exit from
QE this year is the first stage of monetary tightening in this economic cycle. It is normal
for markets to act jittery as this tightening process gets under way, and we have written
about this extensively throughout the year. We believe this latest bout of volatility
actually marks the end rather than the beginning of this adjustment, as some pundits
have been suggesting this past week. In fact, we believe global equity markets have
much to look forward to during the next six to 12 months.
First, earnings continue to come in very strong. To wit, two-thirds of the companies
in the S&P 500 Index have reported third-quarter earnings and they have surpassed
estimates by some 5%—double the expected growth rate going into earnings season.
Europe and Japan are also delivering solid results thus far for the third quarter and are
showing even stronger growth than US companies. Second, the US midterm elections,
scheduled for Nov. 4, have historically marked a good time to own US stocks. Using the
prior 27 midterms as evidence, the S&P 500 has rallied 12% on average during the 10
months following the election; when the Fed is in the middle of a tightening cycle, the
number jumps to 22%.
Finally, energy prices have collapsed during the past four months and, while some
investors see this is as a sign of collapsing global growth, we believe it’s been more the
result of excess supply. As a result, these declines will act as a sizable tax cut for the
global consumer which, should begin to positively impact growth as soon as this quarter
and well into 2015. That sounds more like a treat rather than a trick. n
ON THE MARKETS / EQUITIES
Making the Case for
European Equities
SEBASTIAN RAEDLER
European Equity Strategist
Morgan Stanley & Co.
E
uropean equities have had several
tough months, but we continue to
recommend an overweight in the asset
class—and we would not be surprised if
markets rallied some 5% to 10% through
the end of the year. In our view, the 11%
correction in the MSCI Europe Index
during the past two months (see chart) was
triggered by the combination of a
slowdown scare, a liquidity scare and a
deflation scare. For each, we now see the
following factors driving a positive turn:
Growth momentum appears to be
stabilizing. Looking at the relative
economic strength of the US and the lack
of it elsewhere, investors had been
struggling with the question of whether the
US will pull up the rest of the world or
weakness elsewhere will pull the US
down. Part of the growth scare of the last
month resulted from some US data that
suggested its momentum was succumbing.
Since then, however, the macro data
coming both from the US and the rest of
the world has been cheerier. Strong reports
for US industrial production, initial jobless
claims and the housing market have put to
rest the notion that US economic
momentum is being dragged down by
broader weakness, while the preliminary
PMIs for October in the Euro Zone and
China suggest growth momentum outside
the US has started to stabilize. To the
degree to which we see a further
stabilization in global growth momentum
in line with Morgan Stanley & Co.
economists’ view, this should be a positive
for markets—especially given that they
already seem to be priced for a significant
further deterioration in macro momentum.
Expectations for a rate hike have
been pushed out. The market sell-off over
the past two months led to a sharp
reassessment of the likely date for the
Federal Reserve’s first rate hike, with the
market-implied fed-funds rate for the end
of 2015 and that for the end of 2016
falling to lower levels than they had
reached at any point before. While markets
continue to be concerned about the impact
of the end of Quantitative Easing, the push
back in the expected date for the first rate
hike in itself constitutes a form of financial
easing. This acts as a palliative for ratesensitive market segments, such as
emerging market assets and commodities.
Inflation expectations are stabilizing.
Some investors interpreted sharply falling
inflation expectations in Europe and the
US during the sell-off as pointing to a
significant increase in disinflationary
pressures—and, hence, an increased
likelihood of a deflationary shock to the
global economy. However, in spite of the
fact that inflation expectations are
designed to track medium-term
inflationary trends, they have tended to
follow short-term commodity price
fluctuations. In this particular episode,
inflation expectations have simply fallen
in line with the falling oil price. In the
view of Morgan Stanley & Co.’s energy
commodity strategist, Adam Longson, the
latter has not been due to underlying
demand, which would be consistent with
economic weakness. Instead, the price
decline is a temporary pause in refining
demand, as well as stronger-than-expected
supply. With refining demand set to
increase again and the market positioning
very short, he expects the oil price to
trough at current levels. This should halt
the fall in inflation expectations, in our
view, and hence reduce concerns about
deflationary risks. The fact that the
growth, liquidity and deflation scares
appear to be subsiding simultaneously
removes important obstacles to positive
equity market performance, in our view.
European earnings have not been as
bad as feared. Around one-third of
European companies have reported thirdquarter results so far, with beats
outnumbering misses by two to one;
earnings per share (EPS) in aggregate is up
11% year over year. This suggests that
A Volatile Year for European Equities
125
MSCI Europe Index, Local Currency
120
115
110
105
100
Source: Bloomberg as of Oct. 27, 2014
Please refer to important information, disclosures and qualifications at the end of this material.
November 2014
2
fears about a sharp deterioration of
European corporate earnings this year
might have been overblown. We continue
to target 6% EPS growth for this year and
10% for 2015.
Many of our sentiment indicators are
close to capitulation levels. During the
correction, many of our sentiment
indicators have fallen close to capitulation
levels. To start with, our Market Timing
Indicator (MTI) has dropped to -1, a fouryear low and a level that, in the past, has
been associated with the market rising by
9% over the subsequent six months. The
market has risen around 80% of the time
on these occasions. Furthermore, the
Morgan Stanley Global Risk Demand
Index fell to -3.8 in mid October, the
lowest level since August 2011. While it
has since recovered to -1.2, this is still
only at the 16th percentile of its 10-year
range. Finally, hedge fund exposure to
European equities has fallen to the lowest
level in nearly two years. At the same
time, outflows out of European-equity
exchange-traded funds have been running
close to eight-year-peak levels.
Relative to Bonds, Valuation of European Stocks Most
Attractive in More Than 40 Years
4.5
MSCI Europe Index
Earnings Yield to Bond Yield Ratio
Ratio Average
4.0
3.5
3.0
2.5
2.0
1.5
1.0
0.5
0.0
'70
'75
'80
'85
'90
'95
'00
'05
'10
Source: MSCI, Morgan Stanley Research as of Oct. 24, 2014
Relative valuations are attractive. As
a consequence of the sharp fall in core
bond yields, relative equity valuations now
look even more attractive than they did
before the sell-off. In particular, the MSCI
Europe earnings yield stands four percent-
Please refer to important information, disclosures and qualifications at the end of this material.
age points above the GDP-weighted
average of European 10-year government
bond yields, which is the largest gap since
the start of our data set in 1970. n
November 2014
3
ON THE MARKETS / EQUITIES
A cynic may argue that all of this
activity reflects a red flag regarding the
current economic and market cycles. That
is to ask, are management teams simply
stretching for returns, or are they pursuing
creative and disruptive strategies to spur
shareholder returns amid an environment
of lackluster growth and a dearth of
investment opportunities?
INVESTORS’ FOCUS. We do not believe
such cynicism reflects the case today.
Much of the activists’ focus has been on
companies where there have been missteps
by management and where technology is
forcing change. Media companies are a
good example, where there is a trend of
splitting off the slow-growth print
businesses from faster-growing segments
like film, television and internet. In
technology, changes in consumer and
enterprise preferences are also driving
portfolio realignment; and, in energy,
improved extraction methods and differing
growth outlooks are leading to portfolio
restructurings. Importantly, we do not see
the end of the economic expansion on the
near-term horizon, and so revenue and
earnings should continue to improve.
Therefore, while remaining confident
that the rise of the activists does not signal
a market top, we think their influence has
raised the bar on smart capital allocation.
That’s certainly a win for shareholders. n
Activists at
the Gates
DAN SKELLY
Senior Equity Strategist
Morgan Stanley Wealth Management
T
hey say that breaking up is hard to do,
but not when activist investors are
pressuring corporate boards and managers
to do it. That’s because the latest wave of
activist-investor involvement has led to a
record number of spinoffs, divestitures and
various other strategic actions, which often
elicit cheers from shareholders.
GREATER IMPACT. Activist investors,
usually through hedge funds they control,
typically take a large equity stake in a
company in order to obtain board seats or
other means of control. They seek to boost
the value of their stakes by driving
significant organizational restructuring or
changes in capital allocation. Notably,
while the volume of activist campaigns has
clearly ramped up in recent quarters, so
too has their impact. So far this year,
activists have had a 72% success rate in
proxy fights, up from 60% in 2013 and
just 36% a decade ago, according to
FactSet (see chart). Directly or indirectly,
many of these campaigns are prompting
corporate directors to pursue spinoffs,
typically a tax-free distribution of a
particular business unit. Indeed, there have
been 57 spinoffs by nonfinancial US
companies so far this year, up from 44 for
all of 2013 and 33 in all of 2012,
according to Standard & Poor’s.
With this magnitude of strategic activity
and broadly positive investment performance from activist managers, investors
have taken notice. In fact, activist investing was the top-performing strategy
among hedge funds in 2013, and inflows
to the funds have remained strong this
year. Driven by increasing mergers-andacquisitions volume, as well as activist
trends, investors allocated roughly $15.7
billion to event-driven hedge funds in the
first half of 2014, with the activist-only
component garnering $9.4 billion.
WHY NOW? We believe there are
several reasons for these trends. With the
financial crisis well in the rear-view
mirror, its lingering effects of uncertainty
and risk aversion are finally receding. No
longer are managers operating with the
crisis-driven mentality of maintaining size
as a buffer against economic turmoil.
Rather, management teams have become
more confident in taking risks to pursue
more focused strategies. Second, we
believe herd mentality is also at work, as
the initial strategic actions from certain
companies prompted by activist
involvement have led to broadly positive
gains in their stock prices. Finally, amid an
environment in which investment
managers with different strategies have
struggled to keep up with market returns,
activist strategies can provide an
opportunity to outperform.
Increasing Success for Dissidents’ Proxy Battles
80 %
72
Dissident Success Rate, Proxy Fights*
70
60
50
40
55
50
44
46
60
59
57
49
51
54
55
52
36
30
20
*Number of outright victories, partial victories or settlements by the dissident as a percentage
of all proxy fights where an outcome has been reached.
Source: FactSet as of October 2014
Please refer to important information, disclosures and qualifications at the end of this material.
November 2014
4
ON THE MARKETS / ECONOMICS
Consumers in Better
Shape for the Holidays
Who Benefits From Consumers’ Income Gains?
Recreation Services
Food Services and
Accommodations
Clothing and Footwear
Disposable Income Elasticity of Demand, 2009 to 2013
Motor Vehicles and Parts
4.5
4.0
3.5
3.0
2.5
2.0
1.5
1.0
0.5
0.0
Transportation Services
hat chill in the air reminds us that the
holiday shopping season is near and,
compared with one year ago, households
have more spending potential. On balance,
we find that households have roughly $129
billion in additional real discretionary
income going into the fourth quarter—a
4.3% gain compared with the same period
last year—that has been driven primarily
by gains in aggregate wages and salaries.
Moreover, nominal income will be boosted
by as much as an additional $40 billion
year over year should lower gas prices
continue.
Of course, that additional income can
be saved as well as spent. To be sure, the
personal savings rate has risen by more
than one percentage point since the start of
this year. That said, Americans don't save
100% of their after-tax income.
So, which categories of spending are
likely to reap the benefit? Gauging the
income elasticity of demand for major
categories of consumer spending, that is,
identifying those categories that stand to
benefit most for every $1 increase in
income, we find that furnishings and
recreational goods and vehicles, are the
top beneficiaries when wage and salary
income increases (see chart).
How do we come to this assessment of
US households’ financial wherewithal?
Let’s look at the components:
Jobs and Unemployment. Year to date
through Sept. 30, some 2.0 million net
new jobs have been created, compared
with 1.7 million during the same period
last year. This year could have the best job
gains since 1999.
Financial Services and
Insurance
T
Average hourly earnings remain
sluggish, but the existing work force is
working more hours and, with more jobs,
there's more aggregate income. Moreover,
the unemployment rate was 1.3 percentage
points lower this September than last
September. Even accounting for a 0.5percentage-point drop in labor-force
participation, unemployment is 0.8
percentage points lower compared with
September 2013.
Income. Accounting for changes in
taxes, year-on-year growth in aggregate
disposable personal income is improving,
trending at a 4.2% rate over the past three
months compared with a 2.1% pace over
the same period last year. In August, US
consumers had $522.7 billion in additional
nominal disposable income compared with
one year ago, while, at 5.4%, the personal
savings rate was just 0.1 percentage points
higher. Moreover, growth in wages and
Recreational Goods and
Vehicles
Senior US Economist
Morgan Stanley & Co.
Furnishings
ELLEN ZENTNER
salaries accounted for 2.4 percentage
points of the 4.2% year-over-year growth
in disposable personal income.
As for expenses, if we further reduce
disposable income by the dollars devoted
to meeting regular financial obligations
and spending on necessities, momentum in
discretionary income also looks to be in
better shape this fall compared with one
year ago. We find that, on net, households
have roughly $129 billion in additional
real discretionary income going into the
fourth quarter compared with about $3
billion in additional real discretionary
income in the same period last year.
Gas Prices. Gas prices are quite a bit
more supportive of spending today compared with one year ago. In the week of
Oct. 27, the average retail price across all
grades of gasoline was $3.14 per gallon
compared with $3.37 in the corresponding
week of 2013 (see chart, page 6). Lower
pump prices immediately free up discretionary income to be saved or spent.
In the third quarter, we estimate that
lower retail gasoline prices added about
0.2 percentage points to annualized growth
in real consumer spending. Going forward,
wholesale gasoline prices implied by
Source: Bureau of Economic Analysis, Morgan Stanley & Co. Research as of Oct. 27, 2014
Please refer to important information, disclosures and qualifications at the end of this material.
November 2014
5
front-month futures contracts suggest
further declines in retail gas prices lie
ahead. On Oct. 30, end-November
wholesale gasoline futures fell to $2.20,
the lowest level since November 2010—
29 cents lower compared with one month
ago and nearly 46 cents lower compared
with one year ago. If those wholesale
prices remain through the year’s end, retail
gas prices across all grades could average
just under $3 per gallon in the fourth
quarter compared with $3.37 in the fourth
quarter of 2013. Such a move would free
up more than $40 billion in consumer
spending power compared with last year.
Financials. US households’ financial
well-being continues to improve. With
gains in disposable income outpacing
additions to household debt, the debt-todisposable-income ratio fell to 1.07 in the
second quarter. At the same time, meeting
monthly financial obligations remained
extraordinarily low relative to income.
Indeed, in the second quarter, US
households devoted the smallest share of
disposable income to meet these payments
since 1980, when the data series began.
Reflecting better debt and income
dynamics, delinquency rates on consumer
debt and mortgages continue to decline.
Yet despite better household finances,
consumers have remained unconvinced
these gains will be sustained. This lack of
confidence in future finances suggests that
consumer pessimism is still a headwind to
a broader pickup in spending.
In the press conference following the
September meeting of the Federal Open
Market Committee, when asked about the
sluggish recovery, Chairman Yellen
explained that the committee sees that
“households' expectations about their
likely income paths remain quite
depressed relative to precrisis levels, and
that’s something that may be holding back
consumer spending.” Truer words have
never been spoken. Encouragingly, more
recent data suggest this pessimism may be
shifting.
Consumer Confidence. Posting gains
in consumer confidence has been an uphill
Falling Gas Prices Could Fuel Holiday Spending
$ 3.90
Gasoline, US Average Across All Grades, Retail Price per Gallon
3.80
3.70
3.60
2013
2014
3.50
3.40
3.30
3.20
3.10
Jan
Feb
Mar
Apr
May
Jun
Jul
Aug
Sep
Oct
Source: Energy Information Administration, Morgan Stanley & Co. Research as of Oct. 27, 2014
battle during the recovery, but it has
generally trended upward. Most recently,
the Conference Board Consumer Confidence Index rebounded sharply in October
after a brief drop in September following
four straight months of improvement,
coming to rest 22.1 points higher compared with one year ago. October’s surge
in confidence is likely in response to the
sharp decline in gasoline prices.
The headline index comprises two
subindexes, one measuring households'
assessment of their current finances and
one measuring how households feel about
their future finances. On a year-over-year
basis in October, the present-situation
index was 21.1 points higher, while the
expectations index was 22.8 points higher.
This recent surge in expectations is important to note.
We have underscored in numerous
analyses how households feel about their
future finances tends to dictate how they
spend today. Despite the gains in aggregate jobs and income this year, the lack of
a pickup in consumer expectations—until
recently—has suggested households may
be unwilling to boost spending proportionately. Until October, survey details have
revealed a lack of confidence that recent
financial gains will be sustained.
According to the Conference Board,
“Consumers have regained confidence in
Please refer to important information, disclosures and qualifications at the end of this material.
the short-term outlook for the economy
and labor market, and are more optimistic
about their future earnings potential.”
UNEVEN GAINS. Until October, the
gains in confidence had been uneven
across income groups. For example, on a
year-over-year basis in September, confidence among households with annual
income less than $15,000 had about a twopoint decline, while confidence among
households with annual income greater
than $50,000 saw a more than 13-point
increase. The former is most affected by
long-term unemployment and little-to-no
gains in hourly wage growth for lowskilled sectors. The latter gets support
from hourly wage gains among higherskilled industries and substantial gains in
financial equity. In October, however, the
surge in confidence was fairly evenly
spread across income groups.
Since the financial crisis, uncertainty
about future income has weighed on
spending decisions, and it explains why
real consumer spending has tracked lower
than gains in buying power. Nevertheless,
the gains in income, even if much of it is
saved, will likely be expressed in the form
of generosity with more and/or higherdollar gifts. That is why the holiday sales
outlook is picking up, and that is what
retailers are counting on. n
November 2014
6
ON THE MARKETS / FIXED INCOME
A Head Fake for
Bond Investors
JONATHAN MACKAY
Market Strategist
Morgan Stanley Wealth Management
JOHN DILLON
Chief Municipal Bond Strategist
Morgan Stanley Wealth Management
T
his year has been full of surprises for
bond investors. Coming off one of the
worst years in total-return terms since
1994, many investors were understandably
wary of what the bond market might
produce for them in 2014. Yet the story
has been almost the exact opposite of what
happened last year when US Treasury
yields rose dramatically across the curve,
generating negative returns for many ratesensitive fixed income asset classes (see
chart).
There are multiple reasons for falling
yields, including: lower Treasury issuance;
pension fund immunizations; and idiosyncratic events such as the RussiaUkraine conflict, the rise of ISIS in the
Middle East and the spread of Ebola. In
our view, the most important driver of
lower Treasury yields has been the growing risk of deflation in Europe. Investors
wary of deflation have driven government
bond yields in countries like Germany well
below 1%, which, in turn, made the nearrecord-low yields on US bonds appear
juicy in comparison. Are these low bond
yields sustainable, or could we be in for a
repeat of what happened in 2013?
severe winter weather. Core inflation
remains subdued at 1.7%, and inflation
expectations for both the short and long
term have fallen recently, in line with the
decline in energy prices. Morgan Stanley
& Co.’s US Economics team expects
quarterly GDP growth in the mid-2% area
in 2015, which is better than the strong but
choppy growth we have seen so far in
2014. They also expect inflation to move
up slightly to above 2%. Stable growth and
modestly higher inflation should put
upward pressure on US yields during the
next 12 months and, if Europe surprises on
growth—which seems like a possibility
given recent action by the European
Central Bank, as well as the completion of
the asset quality review and bank stress
tests—US bond yields may also lose their
luster relative to European government
yields.
FED WATCHING. The other factor that is
likely to push yields higher over the next
A Tale of Two Years in the US Treasury Market
125 Basis Points
Change in Yield, 2013
Change in Yield, 2014 YTD*
75
127.2
127.1
101.9
101.8
41.3
25
STRONGER GROWTH EXPECTATIONS.
Long-term bond yields are traditionally
driven by growth and inflation
expectations. Generally, as growth and
inflation rise and fall, so do long-term
bond yields. US economic growth has
been running at roughly a 3% clip in the
second half of this year, while the first half
was closer to 1% due to the impact of
year is the looming first Fed rate hike. MS
& Co. expects it to occur in the first
quarter of 2016, while the futures market
is expecting a fourth-quarter 2015 hike. In
our view, the timing of the first hike
matters less than the fact that the Fed has
been tightening policy for the last 10
months by tapering asset purchases. We
believe that when the Fed started dialing
back on Quantitative Easing in December
2013, it was the equivalent of the first rate
hike in a traditional tightening cycle. In
fact, the bond market has reacted in a
similar fashion to the 2004-to-2006
tightening cycle, when the Fed hiked rates
a total of 425 basis points. The yield on the
10-year Treasury rose heading into the
first rate hike in June 2004 before
dropping immediately after and then
resuming its rise 12 months later in June
2005. That’s almost exactly what has
happened to the 10-year over the past 18
months.
In our view, the 10-year Treasury note,
at 2.38%, is not compensating investors
for better growth, the risk of higher
inflation, any improvement in the
economic environment in Europe or the
fact that the Fed tightening cycle has
essentially started. Thus, we expect bond
-25
13.3
-0.2
3.8
-26.1
-52.4
-75
-77.1
-93.2
-125
2-Year
3-Year
5-Year
7-Year
10-Year
30-Year
*Year to date
Source: Bloomberg as of Oct. 27, 2014
Please refer to important information, disclosures and qualifications at the end of this material.
November 2014
7
yields to rise over the next 12 to 18
months, eating into investors’ returns. MS
& Co.’s US Treasury Strategist, Matt
Hornbach, forecasts the 10-year Treasury
will be at 2.7% in 12 months. If that were
to happen, investors would be left with a
slightly negative total return; that is after a
simple rise in yields of just 32 basis points.
In our opinion, fixed income investors
should continue to favor credit over ratesensitive investments, with a strong
preference for high yield credit and lowerrated investment grade credit (see page 9).
We also recommend shorter maturities
over longer maturities. Yet, we believe, as
the 10-year moves up toward the 2.75%to-3.0% range, investors should consider
moving further out the curve and adopting
a barbell approach.
Municipals
Considering weak economic data from
Europe generally, renewed concerns and
volatility for Greece, questions about the
growth momentum in China, weaker
German data and now a spate of lackluster
US economic data amid continued belowtarget inflation, the idea of 10-year US
Treasury yields in the low-2% area seems
to be gaining acceptance both at home and
on the global stage—and the Fed may
need to account for this global fragility in
the coming months.
LOWER FOR LONGER. While taxexempt yields may be uninspiring for
many muni buyers, lower-for-longer US
Treasury yields combined with mildly
positive US economic momentum, would
likely bode well for states and
municipalities. Under this scenario, we
expect revenues to grow modestly,
Our Muni Sector Recommendations
Minimum Rating* Commentary
Tax revenues are softening; pension
State General Obligation/Appropriated Debt All
challenges exist, but market access is
likely to be maintained.
Locals are more dependent on housing;
Local General Obligation
A2/A
pension challenges exist.
Essential-purpose is beneficial, where
Essential Service (Water & Sewer)
Baa2/BBB
applicable; however, leverage increasing to
meet infrastructure needs.
Near essential-service status, evolving
US Public Power
Baa2/BBB
power markets may create long-term
challenges.
Offers diversified business models, but
State Housing Finance Agencies
A2/A
direct exposure (positive or negative) to
housing market.
Expense growth exceeds revenue growth.
Higher Education
A2/A
Opt for large, well-known institutions.
Favor major metro areas and hubs;
US Airports
A2/A
potential for more passengers; oil prices
must be monitored.
With major changes ahead, larger systems
Not-for-Profit Hospitals
AA3/AAare a conservative choice.
Sector
*Table lists minimum credit rating we are comfortable recommending for buy-and-hold investors.
Please consider referenced rating with a stable outlook. Tactical decisions on whether a bond is
overvalued or undervalued should be evaluated on a case-by-case basis.
Source: Moody’s, S&P, Thomson Reuters Municipal Market Data and Morgan Stanley Wealth
Management Investment Resources as of Oct. 15, 2014
austerity policies to fade gradually and
continued refinancing opportunities to
arise for municipal issuers. Furthermore,
substantial cash on the sidelines has fueled
US equity gains, which helps state and
local pension funds. Indeed, the positive
impact of low rates and strong equities has
improved pension funding for the first
time in six years, though the increases
have not been consistent nationally and
laggards continue to disappoint.
MS & Co.’s recently adjusted base case
for US Treasuries still calls for higher
yields, with the 10-year note forecast to be
2.40% by the year’s end, suggesting the
road to materially higher yields may be
longer than originally envisioned. That
said, we would generally maintain
duration in municipal bond portfolios, with
Please refer to important information, disclosures and qualifications at the end of this material.
the notable exception of selectively selling
into strength the sub-4.5% coupon
structures on the long end of the yield
curve.
BARBELL STRATEGY. Other than
opportunistically using market strength to
improve portfolios, we advocate a barbell
strategy comprising maturities primarily
within four-to-nine years and some 20year paper, as well as adding a modest
allocation to attractively priced floatingrate notes for performance when rates do
begin to rise. We continue to suggest a 5%
coupon structure and are maintaining our
A-rated parameters for general-obligation
bonds, which are more conservative than
our BBB guidance for essential-service
revenue bonds (see table). n
November 2014
8
ON THE MARKETS / FIXED INCOME
target gets us to a total return of about 7%.
In our view, that return is not only
attractive in absolute terms, but also in
relation to the alternatives.
CHANGING EMPHASIS. Within high
yield, we have moved toward B and CCC
credits and away from the higher-quality
BBs. At the start of the year, the market’s
view was that interest rates were heading
higher and the right move was to buy
credit risk in the form of lower-rated
issues rather than higher-quality issues,
which are more sensitive to rates. Today,
rate fears have eased and, since June,
spreads on CCCs have widened more than
twice as much as on BBs. Now, we believe
the risk/reward of Bs and CCCs has
improved dramatically relative to BBs. If
we are wrong on timing, given a yield of
9.6% for CCCs, spreads could widen by
120 basis points before they start to
underperform BBs in a one-year holding
period.
Finally, while we put little weight on
seasonality, we note that high yield is
entering a seasonally strong period (see
chart). History may not repeat, but over
the past 23 years, the November-throughJanuary period has typically been a very
good one in which to own high yield
credit. n
Why We’re Bullish
On High Yield
Entering a Historically Strong Period for High Yield
1.20 % 1.11
Median Monthly High Yield Excess Return*
1.00
0.80
0.61
0.68
0.60
0.41
0.39
0.35
0.40
0.47
0.13
0.20
0.00
-0.08
-0.20
-0.13
-0.15
-0.05
Dec
Nov
Oct
Sep
Aug
Jul
Jun
-0.40
May
or most of this year, we have maintained a cautious view on high yield
bonds, with a preference for the higherquality issues, namely those rated BB. We
did so because monetary policy was becoming less easy, and the markets needed
to adjust. What’s more, valuations were
rich and investor sentiment was extremely
bullish. However, during the past few
months, as markets adjusted to a
weakening liquidity environment, coupled
with global growth fears, high yield sold
off and sentiment became a lot less bullish.
Now we see high yield’s risk/reward
proposition as more attractive than it has
been in more than a year. We recommend
buying high yield, and within the asset
class, increasing exposure to issues rated B
and CCC while lightening up on the BBs.
FOCUS ON THE FED. Assuming Fed
expectations have driven performance,
what makes us believe that the pain is
over? Certainly, we see a risk that if
economic data surprise to the upside in the
near term, short-term Treasury yields
could move higher, leading to further
weakness in high yield. However, even
though a meaningful rise in Treasury
yields could pressure high yield bonds, we
believe most spread widening is behind us.
Other than the summer of 2011, this selloff has been quite large, and larger than
what markets saw around the last three
first rate hikes—1994, 1999 and 2004.
Clearly it can get worse, but barring a
meaningful shock, much larger spread
Apr
F
Mar
High Yield Credit Strategist
Morgan Stanley & Co.
widening within a bull market is actually
somewhat rare.
In our view, high yield investors were
complacent earlier this year. Even at a 5%
yield, we often heard arguments along the
lines of “What else is there to buy?” Now,
investor complacency is much lower and
quantitative sentiment measures are
showing buy signals.
The final rationale for our call is that
valuations have moved from rich to fair in
absolute terms and from fair to cheap in
relative terms. We believe high yield is
now around fair value, compared with 120
basis points rich to fair value earlier this
summer. Why not wait until the sector is
cheap? We do not believe it will get there.
What’s more, the recent market action
has changed our return expectations. In
early September, we detailed a spread
target of 375 basis points one year hence.
That translated to a projected 3% total
return for the next year, which was decent
but uninspiring. Now, the same spread
Feb
Head of US High Yield and Leverage Loan
Strategy
Morgan Stanley & Co.
JEFF FONG
Jan
ADAM RICHMOND
*Return in excess of comparable US Treasuries
Source: The Yield Book, Morgan Stanley & Co. as of Oct. 6, 2014
Please refer to important information, disclosures and qualifications at the end of this material.
November 2014
9
ON THE MARKETS / COMMODITIES
Anticipating an
Upturn in Oil
ADAM LONGSON, CFA, CPA
Lead Energy Commodity Strategist
Morgan Stanley & Co.
ELIZABETH VOLYNSKY
Energy Commodity Strategist
Morgan Stanley & Co.
D
espite the recent sell-off in crude oil,
we see several positive developments
emerging in physical markets. Even if
OPEC is not overly responsive before the
year’s end, we believe the fundamentals
have turned—a development that should
eventually lift crude prices. Calling the
bottom is difficult, and macro fears and
speculation could continue to pressure the
oil market. However, we see the potential
for a positive bounce into the end of the
year, particularly given extremely bearish
sentiment and positioning.
The oil markets are healing and the
risk/reward is attractive, in our view. We
see demand rising through the current
quarter both sequentially and on a year-
over-year basis. After subdued runs during
most of the summer, refining margins are
now healthy, refineries are returning from
maintenance and they will contend with
seasonal heating/travel demand. This is
reinforced by the structural repricing of oil
in the Atlantic Basin markets, supportive
pricing from the Middle East and refinery
turnarounds in the US (which, given that
the US cannot export crude freely, places
more demand on foreign crude supplies
and refining). Relative strength in product
pricing and high-frequency demand data
also suggests key product demand isn’t
that bad. Outside of Europe, Japan and
Mexico, most countries are reporting
healthy demand growth, especially for the
main transport fuels.
POSITIVE SIGNS. We see several
positive signs in physical markets that
support our more constructive view. At
current pricing, the practice of storing
Is the Slide in Crude Prices Over?
$120
ICE Brent Crude Futures, Price per Barrel*
115
110
105
100
95
90
85
80
inventory on tankers no longer makes
sense. To us, this suggests inventory
overhangs may be moderating. In addition,
West African and North Sea differentials
relative to dated Brent, a measure of
tightness in the oil market, are stable or
rallying. Buyers are returning, too, as
manifested in recent Chinese purchases
and stronger markets in Dubai.
The latest round of weakness in oil is
not a product of suddenly weaker end-user
demand or an economic slowdown, in our
view. Rather, we've seen strong
seasonality in crude runs accentuated by
some supply growth, an overdue
realignment of trade flows and a slow
response from OPEC. The potential for a
broad economic slowdown is a concern
but more for 2015, as refiners are already
primed to run through the fourth quarter.
LONGER-TERM OUTLOOK. To be sure,
the outlook for 2015 and 2016 remains
challenging because OPEC intervention
will be required to help maintain pricing.
Assuming supply delivers as scheduled,
OPEC will likely have to cut its quota by
about 500,000 barrels per day in both
years to balance the market. As we’ve long
noted, for OPEC to remain disciplined,
prices should trade in a lower range. We
continue to see prices averaging in the
mid-$90 per barrel range, with a trading
band of plus or minus $10 per barrel. The
futures price is now about $85 (see chart).
However, as we look to later in the
decade, the outlook for oil becomes bullish
again. Even if all projects—including
high-cost ones—deliver on time, demand
growth should outpace supply growth by
2018 or 2019. This supply growth was
already in question, but lower prices will
only put more downward pressure on
investment. That, in turn, will impact oil
supply several years down the road.
Moreover, higher prices will eventually be
needed to support investment in the
higher-cost projects. n
*Nearest month to expiration
Source: Haver Analytics as of Oct. 27, 2014
Please refer to important information, disclosures and qualifications at the end of this material.
November 2014
10
ON THE MARKETS / RETIREMENT
Annuities Can Help Fill the
Retirement Income Gap
annuities have drawbacks: Fees are
generally higher than for traditional
retirement accounts and they are relatively
illiquid.
What Are Annuities?
LISA SHALETT
Head of Investment and Portfolio Strategies
Morgan Stanley Wealth Management
DANIEL HUNT, CFA
Senior Asset Allocation Strategist
Morgan Stanley Wealth Management
ZI YE, CFA
Quantitative Strategist
Morgan Stanley Wealth Management
TAE KIM, CFA, FRM
Asset Allocation Strategist
Morgan Stanley Wealth Management
D
uring the past few decades, the shift
in retirement savings toward selfdirected 401(k)s and Individual Retirement
Accounts and away from traditional
defined benefit (DB) pension plans has
increased risk and complexity for investors
in ways both obvious and subtle. The most
obvious dimension is that in traditional DB
pension plans, the plan absorbed the
considerable investment risk, backstopped
by the employer’s balance sheet and the
Pension Benefit Guaranty Corp. Today,
retirees assume the risk associated with the
investment of their retirement savings, and
they must do so without recourse to a
corporate balance sheet or to an insurance
fund should their decisions ultimately do
damage to their financial position.
A more subtle but equally substantial
component of today’s retirement challenge
is the planning itself. Often lost in
discussions around investment strategy is
the most important determinant of the
success or failure of a retirement plan: the
amount of savings before retirement and
portfolio distributions after, both of which
are a function of lifetime spending
decisions and the timing of retirement.
AMBIGUITY AND COMPLEXITY. A DB
pension plan takes most of the guesswork
out of this process. Retirement date and
sustainable distributions can each be read
directly from plan documents that spell out
the benefit calculation. By contrast,
retirees or near-retirees with self-directed
retirement accounts must infer from a
statement balance when they can retire and
how much they can sustainably spend in
retirement, which is hardly a back-of-theenvelope calculation. The ambiguity that
arises from this complexity opens the door
to damaging overspending or a premature
retirement, as it is easy to overestimate the
degree to which an investment portfolio
can be stretched.
Added to the new risks and logistical
challenges facing retirees is the adversity
facing the global economy and the capital
markets. As a consequence of the centralbank policies instituted to manage the
deleveraging of the global economy after a
multidecade debt binge, interest rates and
expected returns have collapsed across the
board. These policies, which have
introduced the term “financial repression”
to the lexicon, are useful when managing
down the global debt burden and overall
economic leverage, but they come at a
substantial cost for retirement savers1.
The Global Investment Committee
believes annuities can help investors meet
this challenge. Annuities with optional
protection features can supplement or, in
some cases, replace the income once
provided by DB plans. Such annuities
make it easier to know what sustainable
income will be even during stressful
periods in the markets. Of course,
1
Central-bank policies and the current low interest
rate, low-growth environment are not the only
factors that weigh against our forecasts of
prospective returns. Other factors, such as
unfavorable global demographic and productivity
trends, also challenge the capability of the capital
markets to repeat their historical performance.
Please refer to important information, disclosures and qualifications at the end of this material.
Annuities are issued by insurance
companies and shift risk in some form or
fashion from the purchaser of the annuity
to the insurer. Most annuities share the
fundamental capability to provide a
continuous stream of income for the life of
the annuity owner, much like a traditional
DB pension plan or Social Security.
Depending on when payments are
scheduled to begin, annuities fall into one
of two categories: immediate and deferred.
Immediate annuities begin making income
payments to the contract holder
immediately after purchase. The simplest
of all annuity types is single premium
immediate annuity (SPIA) (see table, page
12). SPIA investors make a single lumpsum payment up front and are guaranteed
to receive predictable income payments
for life or for a given term or both,
according to the terms of the annuity
contract.
SIMPLEST STRUCTURE. The simplest
type of SPIA is known as a “life only”
SPIA, which pays its contract holder for
the duration of his or her life regardless of
how long that is. This form of SPIA
cannot be reversed or modified after
purchase, which can create liquidity
constraints within a retirement plan. A
slightly more complex version of a SPIA
is one that has a “life with period certain”
payout option, which pays its contract
holder or contract holder’s beneficiaries
for a specified number of years should the
contract holder pass before the term is up.
In addition to providing for some return
of capital to beneficiaries in the event of
the contract holder’s early death, a “period
certain” provision enhances the annuity
contract’s liquidity, as it is often possible
to exchange period-certain income
payments for a lump-sum distribution.
Period-certain annuities typically have
November 2014
11
Annuities With Lifetime Income Payments
Accumulation Phase
Payout Phase
Types of Annuities*
Key Characteristics
Single Premium Immediate
Annuity (SPIA), Life-Only
§ Highest payout rate of all immediate annuities. Payments made for the duration of contract holder’s life
§ Irreversible after purchase
Single Premium Immediate
Annuity (SPIA), Life With
Period Certain
§ Payments made for the greater of the duration of the contract holder’s life and a set period of time
§ Lower payout rate than life-only SPIA in exchange for increased liquidity and protection for early mortality
Variable Annuity With
Guaranteed Lifetime
Withdrawal Benefits
§ Premiums invested in stock and bond investments through subaccounts. Rider provides a guaranteed payout rate
for life, which may be significantly lower than a comparable SPIA
§ Income resets higher if contract value is higher than benefit base at anniversary, the “high-water mark”
Deferred Fixed Annuity (DFA)
§ Value grows at a fixed rate for “guarantee period” and resets based on prevailing interest rates
§ Option to take a lump sum, scheduled withdrawals, defer further or begin taking payments, i.e., “annuitize” value to
an immediate annuity, at the end of the accumulation phase
Deferred Income Annuity (DIA)
§ High payout rate, like SPIA, beginning at least a year after the annuity purchase. Payment schedule and growth
rates set at the time of purchase
§ “Life-only” version is irreversible with no death benefits in the event of early mortality
§ “Life with period-certain” version provides more liquidity and protection for early mortality but lower payout rate
Variable Annuity With
Guaranteed Lifetime
Withdrawal Benefits
§ Premiums are invested in stock and bond investments through subaccounts. Rider provides a guaranteed minimum
payout rate for life which may be significantly lower than a comparable DIA
§ Benefit base grows at fixed “roll-up” rate during the deferral period regardless of investment performance and resets
higher at any time if it is lower than the contract value at anniversary—the “high-water mark”
§ Option to take a lump sum or scheduled withdrawals or “annuitize” the value at the end of the accumulation phase
Source: Morgan Stanley Wealth Management GIC *For more about the risks to Annuities, please see the Risk Considerations section
beginning on page 17 of this report.
lower payout rates than those without such
a provision, with the payout rate
decreasing more as the length of the
period-certain term increases.
VARIABLE ANNUITIES. The second
major type of annuity is what is known as
a variable annuity (VA)—in particular,
variable annuities with guaranteed lifetime
withdrawal benefits. Cash placed in VAs
is invested through subaccounts into both
fixed income and equity investments.
While SPIAs pay a predictable, fixed
income stream, the contract value of an
immediate VA, and therefore its payouts,
can increase based on the performance of
the underlying investments of the annuity.
Although the payout rate is lower than
those of a comparable SPIA, VA payments
have the potential to increase as the value
of the underlying investments moves
higher. This offers the annuity owner the
potential to participate in upside market
moves while still receiving a minimum
income stream.
In contrast to immediate annuities,
deferred annuity payments begin on a date
some years in the future. Deferred fixed
annuities grow at a fixed interest rate for a
stated “guarantee period,” after which the
growth rate depends on the value of future
short-term interest rates. Deferred income
annuities (DIAs) involve even less
guesswork as their payment terms, and
thus deferral period growth rates, are fixed
in the contract at the outset and depend
largely on long-term interest rates.
CHANGING VALUES. By contrast, with
a DIA or deferred fixed annuity, the
contract of a deferred VA with guaranteed
lifetime withdrawal benefits will change in
value depending on the performance of its
underlying investments. Note that a VA’s
minimum withdrawal benefits are
calculated using a separate metric known
as the benefit base, which is distinct from
its contract value. A VA’s benefit base
will typically grow at a fixed rate known
as a “roll-up rate” during the deferral
period unless strong investment
performance propels the contract value
above the benefit base on a specified date.
In that scenario, the benefit base will reset
Please refer to important information, disclosures and qualifications at the end of this material.
higher to the contract value. A VA’s
benefit base typically will not decline
regardless of what happens to the contract
value, which is how the market-protection
feature works. Thus, once a benefit base is
reset higher, those gains are locked in.
This is what’s known as a “high-water
mark” provision.
During the life of the annuity and
subject to any restrictions, deferred fixed
and deferred variable annuity owners have
the option to take a lump sum or scheduled
withdrawals or to simply “annuitize” the
value into an annual payment stream
similar to an immediate annuity. DIA
owners generally do not have the option to
cash out—though, as discussed in the
context of a SPIA, DIA contracts with
period-certain provisions tend to have
greater liquidity. n
For a complete copy of the white paper,
“Annuities in a Portfolio Solution Context:
Introducing a New Framework,” please
contact your Financial Advisor.
November 2014
12
Global Investment Committee
Tactical Asset Allocation
The Global Investment Committee provides guidance on asset allocation decisions through its various model
portfolios. The eight models below are recommended for investors with up to $25 million in investable
assets. They are based on an increasing scale of risk (expected volatility) and expected return. Hedged
strategies include hedge funds and managed futures.
>>>
CONSERVATIVE
MODEL 1
14% High Yield
MODEL 2
1% Commodities
3% Emerging Markets
Fixed Income
MODEL 3
2% Commodities
2% MLPs
6% Hedged Strategies
and Managed Futures
2% REITs
1% Emerging
Markets Fixed
Income
8% High
Yield
1% InflationLinked Securities
53%
Investment
Grade Fixed
Income
>>>
MODERATE
14%
Cash
3% MLPs
2% REITs
9% Hedged Strategies
and Managed Futures
1%
Emerging
Markets
Fixed
Income
12% US
Equity
9%
Cash
16% US
Equity
29% Cash
36%
Investment
Grade Fixed
Income
15%
International
Equity
6% High
Yield
28%
Investment
Grade Fixed
Income
3% Emerging
Markets Equity
>>>
MODERATE
3%
Commodities
4%
Cash
22%
International
Equity
5% High
Yield
21% Investment
Grade Fixed Income
11% Investment
Grade
Fixed Income
4% MLPs
4%
Commodities
3%
REITs
24% US
Equity
2%
High Yield
26%
International
Equity
2%
Investment
Grade Fixed
Income
11% Emerging Markets
Equity
13% Hedged Strategies
and Managed Futures
1%
Cash
28% US
Equity
31%
International
Equity
12% Emerging
Markets Equity
>>>
14% Hedged Strategies
and Managed Futures
4%
Commodities
12%
Emerging
Markets
Equity
2%
Cash
4% High
Yield
MODEL 7
3% REITs
12% Hedged Strategies
and Managed Futures
3% REITs
8% Emerging Markets
Equity
AGGRESSIVE
4% MLPs
4% MLPs
20% US
Equity
3% REITs
MODEL 6
MODEL 5
11% Hedged Strategies
and Managed Futures
3%
Commodities
6% Emerging
Markets Equity
>>>
MODEL 4
3% MLPs
18%
International
Equity
MODEL 8
4% MLPs
14% Hedged Strategies
and Managed Futures
3% Cash
4%
Commodities
32% US
Equity
31%
International
Equity
CASH
26% US
Equity
3% REITs
14% Emerging
Markets
Equity
KEY
35%
International
Equity
GLOBAL FIXED INCOME
GLOBAL EQUITIES
ALTERNATIVE INVESTMENTS
Note: Hedged strategies consist of hedge funds and managed futures.
Source: Morgan Stanley Wealth Management GIC as of Oct. 31, 2014
Please refer to important information, disclosures and qualifications at the end of this material.
November 2014
13
Tactical Asset Allocation Reasoning
Global Equities
Relative Weight
Within Equities
US
Overweight
While US equities have done exceptionally well since the global financial crisis, they still offer attractive upside
potential, particularly relative to bonds. We believe the US and global economies continue to heal, making recession
neither imminent nor likely in 2014 or 2015. This is constructive for global equities, including the US.
International Equities
(Developed Markets)
Overweight
We maintain a positive bias for Japanese and European equity markets given the political and structural changes
taking place in Japan and our expectation for an improving economic outlook in Europe. Japan underperformed in the
first half of 2014 due to the recently enacted consumption tax. We expect performance to improve as consumption
rebounds. Conversely, Europe performed well during the first half, but has sold off sharply on concerns about slowing
growth and the lack of an effective policy response. As a result, European equities are now very cheap making them
attractive investments over the next 12-to-18 months. We believe that Europe will avoid a triple-dip recession.
Emerging Markets
Global Fixed
Income
US Investment Grade
International
Investment Grade
Inflation-Linked
Securities
High Yield
Emerging Market
Bonds
Alternative
Investments
Underweight
Emerging market equities surprised to the upside earlier this year, and we were tactically underweight. However,
performance got ahead of the fundamentals and has since corrected. We remain underweight the region as policy
remains out of sync with what is necessary in many countries. Furthermore, the Fed’s rate-hike cycle began with the
tapering of Quantitative Easing and is likely to lead to further US dollar strength—another negative for this region.
Going forward, the EM will likely remain idiosyncratic and, thus, we recommend selectivity with a focus on India,
Mexico, China, Taiwan and Indonesia.
Relative Weight
Within Fixed
Income
Overweight
Equal Weight
Underweight
Overweight
Underweight
We have recommended shorter-duration* (maturities) since March 2013 given the extremely low yields and potential
capital losses associated with the rising interest rates. However, we recently reduced the size of our overweight in
short duration as we expect short-term interest rates to move higher as the Fed moves closer to its first rate hikes.
Within investment grade, we prefer BBB-rated corporates and A-rated municipals over US Treasuries.
Yields are low globally, so not much additional value accrues to owning international bonds beyond some
diversification benefit.
We have been underweight inflation-linked securities since March 2013 given negative real yields across all maturities.
Recently, these yields have turned modestly positive but remain unattractive, in our view, due to the longer-duration
characteristics of TIPS and limited risk for unexpected inflation.
Yields and spreads are near record lows. However, default rates are likely to remain muted as the economy recovers
slowly, keeping corporate and consumer behavior conservative. We prefer shorter-duration and higher-quality (B to
BB) issues and vigilance on security selection at this stage of the credit cycle.
Similar to emerging market equities, we remain underweight on the basis that the beginning of the Fed’s rate hike
cycle will likely be a disproportionate headwind for emerging market debt relative to other debt markets.
Relative Weight
Within Alternative
Investments
REITs
Equal Weight
Falling interest rates have led to very good performance for REITs this year. At current levels, we believe REITs are
fairly valued and offer select opportunities. The industrial and commercial segments tend to outperform at this stage of
the recovery. Non-US REITs should also be favored relative to domestic REITs at this point.
Commodities
Equal Weight
After a strong start to 2014, we cut our strategic weighting to commodities by 50% in April. Since then, most
commodities have underperformed significantly with energy leading the charge lower. While commodities look more
attractive at this point as a diversifier against poor weather and geopolitical shocks, the fundamental case keeps us
with an equal-weight tactical recommendation.
Master Limited
Partnerships*
Equal Weight
Master limited partnerships (MLPs) should continue to do well as they provide diversification benefits to traditional
assets and a substantial yield that is valuable in a low interest rate world. Many MLPs are levered to commodity
consumption, which is more predictable than prices. Focus on the midstream.
Hedged Strategies
(Hedge Funds and
Managed Futures)
Equal Weight
This asset class can provide uncorrelated exposure to traditional risk-asset markets. It has outperformed equities when
growth has slowed and has worked well in more challenging financial markets.
Source: Morgan Stanley Wealth Management GIC as of Oct. 31, 2014
*For more about the risks to Master Limited Partnerships (MLPs) and Duration, please see the Risk Considerations section beginning on
page 17 of this report.
Please refer to important information, disclosures and qualifications at the end of this material.
November 2014
14
ON THE MARKETS
Index Definitions
CONSUMER CONFIDENCE INDEX This
Conference Board index is a proprietary
monthly measure of the public’s confidence in
the health of the US economy.
MORGAN STANLEY COMBINED MARKET TIMING
INDICATOR (CMTI) The CMTI is an average
across the Risk, Fundamentals and Composite
Valuation Indicators.
MORGAN STANLEY GLOBAL RISK DEMAND
INDEX This index tracks risk sentiment as
reflected in the relative price movements of
seven “risky” assets versus their “safer”
counterparts; plus, three volatility indicators.
MSCI EUROPE INDEX This
index captures large-,
mid- and small-cap representation across 16
developed-markets countries in Europe. With
1,372 constituents, the index covers
approximately 99% of the free float-adjusted
market capitalization across the developedmarket countries of Europe.
S&P 500 INDEX Regarded
as the best single gauge
of the US equities market, this capitalizationweighted index includes a representative sample
of 500 leading companies in leading industries in
the US economy.
PURCHASING MANAGERS’ INDEX (PMI) These
economic indicators are derived mostly from
monthly surveys of private-sector companies.
The principal producers of PMIs are Markit
Group, which conducts PMIs for more than 30
countries, and the Institute for Supply
Management, which conducts PMIs for the US.
Please refer to important information, disclosures and qualifications at the end of this material.
November 2014
15
ON THE MARKETS
Glossary
ACCUMULATION PHASE The
period in an annuity
contract prior to the point at which distributions
to the annuitant begin. In this period, the value
of the annuity can grow.
ANNUITANT The
person or persons whose age
and life expectancy the payments are based on
during the payout phase.
The money passed from an
annuity contract to its beneficiary upon the death
of the owner and/or annuitant. This can include
specific death benefit provisions for which the
annuity holder pays a fee, or the period-certain
provision of a single-premium immediate annuity
or a deferred income annuity, or simply the
residual contract value of a variable annuity upon
death of the owner and/or annuitant.
DEATH BENEFIT
DEFERRAL PERIOD The
ANNUITY A
contract in which an insurance
company agrees to provide a periodic income
payable for the lifetime of one or more persons,
or for a specified period.
time in between when an
investor originally purchases an annuity and
when distributions commence. See accumulation
phase.
practice of converting an
annuity into a fixed series of periodic income
payments over the span of one’s life or for a
specified period.
BENEFIT BASE The benefit base is used to index
the payments from a variable annuity with an
income rider such as a guaranteed lifetime
withdrawal benefit. By contrast with the
contract value, defined below, the benefit base
does not represent the annuity owner’s equity in
the contract, but is rather an accounting
construct by which minimum withdrawal
benefits are calculated. During the deferral
period, a benefit base will typically grow by a
preset “roll-up” amount regardless of what
happens to the investments in the annuity. This
feature provides protection from market risk.
Most typically, if a contract value increases
above the benefit base on the contract’s reset
date, the benefit base will reset higher to the
contract value, proportionally increasing future
benefits.
CONTRACT VALUE The contract value of an
annuity represents the equity the annuity owner
holds in that contract. The initial contract value
is equal to the initial premium paid, and will
fluctuate subsequently based on the net of
additional premiums, withdrawals and the
investment perform-ance net of fees. Contract
value defines the upside, liquidity and death
benefit dimensions of a variable annuity with
guaranteed lifetime withdrawal benefits. This
contrasts with the benefit base, which is used
only to index regular payments, and cannot be
liquidated or transferred to a beneficiary upon
death.
PAYOUT PHASE The period during which the
money accumulated in an annuity is paid out to
an annuitant.
PERIOD-CERTAIN A
type of guarantee that if the
annuitant dies before payments have been made
for a minimum number of years, payments to the
beneficiary will continue until the end of the
stated period.
The roll-up rate is the guaranteed
percentage that the benefit base of a variable
annuity increases by each year during the
accumulation stage.
ROLL-UP RATE
DEFERRED ANNUITY An
ANNUITIZATION The
A class of annuities whose
payments begin immediately after the initial
purchase.
IMMEDIATE ANNUITIES
annuity contract with a
deferral period. For some annuities, such as
deferred fixed or variable annuities, the length of
the deferral period is flexible. For deferred
income annuities, it is set at contract initiation.
A type of
deferred annuity that grows during the deferral
period based on prevailing short-term interest
rates, which can fluctuate after an initial
guarantee period.
DEFERRED FIXED ANNUITY (DFA)
class of
annuities whose payment schedule and growth
rates are determined at the time of the initial
purchase.
SINGLE PREMIUM IMMEDIATE ANNUITY (SPIA) An
annuity purchased with a single premium on
which income payments begin within one year of
the contract date. With fixed immediate
annuities, the payment is based on a specified
interest rate. Payments are made for the life of
the annuitant(s), for a specified period, or both
(e.g., 10 years certain and life).
DEFERRED INCOME ANNUITY (DIA) A
GUARANTEE PERIOD The period of time a
deferred fixed annuity grows at the rate stated
when the annuity was purchased, after which its
growth rate will depend on the prevailing level of
short-term interest rates.
HIGH-WATER MARK PROVISION When
the contract
value of a variable annuity with a guaranteed
lifetime withdrawal benefit rider is higher than
the contract’s benefit base at anniversary, the
benefit base will be reset higher to the contract
value. Even if the performance of the underlying
investments then deteriorates and the contract
value falls precipitously, the contract’s benefit
base will not reset lower, and any guaranteed
roll-ups will accrue from that level. In other
words, the “high-water mark” refers to the fact
that, once the benefit base has been reset higher,
these gains are considered “locked-in.”
VARIABLE ANNUITY An
annuity contract into
which the buyer makes a lump-sum payment or
series of payments. In return, the insurer agrees
to make periodic payments beginning
immediately or at some future date. Purchase
payments are directed to a range of investment
options, which may be mutual funds or direct
investment into the separate account of the
insurance company that manages the portfolios.
The value of the account during accumulation,
and the income payments after annuitization vary
depending on the performance of the chosen
investment options.
VARIABLE ANNUITY SUBACCOUNT A portfolio
that comprises stocks, bonds or money market
securities. Subaccounts can either be actively or
passively managed.
Please refer to important information, disclosures and qualifications at the end of this material.
November 2014
16
Risk Considerations
Annuities
Morgan Stanley Smith Barney LLC offers insurance products in conjunction with its licensed insurance agency affiliates.
Variable annuities are sold by prospectus only. The prospectus contains the investment objectives, risks, fees, charges and expenses,
and other information regarding the variable annuity contract and the underlying investments, which should be considered carefully
before investing. Prospectuses for both the variable annuity contract and the underlying investments are available from your Financial
Advisor. Please read the prospectus carefully before you invest.
Variable annuities are long-term investments designed for retirement purposes and may be subject to market fluctuations, investment risk, and
possible loss of principal. All guarantees, including optional benefits, are based on the financial strength and claims-paying ability of the issuing
insurance company and do not apply to the underlying investment options.
Optional riders may not be able to be purchased in combination and are available at an additional cost. Some optional riders must be elected at time
of purchase. Optional riders may be subject to specific limitations, restrictions, holding periods, costs, and expenses as specified by the insurance
company in the annuity contract.
If you are investing in a variable annuity through a tax-advantaged retirement plan such as an IRA, you will get no additional tax advantage from the
variable annuity. Under these circumstances, you should only consider buying a variable annuity because of its other features, such as lifetime
income payments and death benefits protection.
Taxable distributions (and certain deemed distributions) are subject to ordinary income tax and, if taken prior to age 591/2, may be subject to a 10%
federal income tax penalty. Early withdrawals will reduce the death benefit and cash surrender value.
MLPs
Master Limited Partnerships (MLPs) are limited partnerships or limited liability companies that are taxed as partnerships and whose interests (limited
partnership units or limited liability company units) are traded on securities exchanges like shares of common stock. Currently, most MLPs operate in
the energy, natural resources or real estate sectors. Investments in MLP interests are subject to the risks generally applicable to companies in the
energy and natural resources sectors, including commodity pricing risk, supply and demand risk, depletion risk and exploration risk.
Individual MLPs are publicly traded partnerships that have unique risks related to their structure. These include, but are not limited to, their reliance
on the capital markets to fund growth, adverse ruling on the current tax treatment of distributions (typically mostly tax deferred), and commodity
volume risk.
The potential tax benefits from investing in MLPs depend on their being treated as partnerships for federal income tax purposes and, if the MLP is
deemed to be a corporation, then its income would be subject to federal taxation at the entity level, reducing the amount of cash available for
distribution to the fund which could result in a reduction of the fund’s value.
MLPs carry interest rate risk and may underperform in a rising interest rate environment. MLP funds accrue deferred income taxes for future tax
liabilities associated with the portion of MLP distributions considered to be a tax-deferred return of capital and for any net operating gains as well as
capital appreciation of its investments; this deferred tax liability is reflected in the daily NAV; and, as a result, the MLP fund’s after-tax performance
could differ significantly from the underlying assets even if the pre-tax performance is closely tracked.
Duration
Duration, the most commonly used measure of bond risk, quantifies the effect of changes in interest rates on the price of a bond or bond portfolio.
The longer the duration, the more sensitive the bond or portfolio would be to changes in interest rates. Generally, if interest rates rise, bond prices
fall and vice versa. Longer-term bonds carry a longer or higher duration than shorter-term bonds; as such, they would be affected by changing
interest rates for a greater period of time if interest rates were to increase. Consequently, the price of a long-term bond would drop significantly as
compared to the price of a short-term bond.
International investing entails greater risk, as well as greater potential rewards compared to U.S. investing. These risks include political and
economic uncertainties of foreign countries as well as the risk of currency fluctuations. These risks are magnified in countries with emerging markets,
since these countries may have relatively unstable governments and less established markets and economies.
Alternative investments which may be referenced in this report, including private equity funds, real estate funds, hedge funds, managed futures
funds, and funds of hedge funds, private equity, and managed futures funds, are speculative and entail significant risks that can include losses due to
leveraging or other speculative investment practices, lack of liquidity, volatility of returns, restrictions on transferring interests in a fund, potential lack
of diversification, absence and/or delay of information regarding valuations and pricing, complex tax structures and delays in tax reporting, less
regulation and higher fees than mutual funds and risks associated with the operations, personnel and processes of the advisor.
Managed futures investments are speculative, involve a high degree of risk, use significant leverage, have limited liquidity and/or may be generally
illiquid, may incur substantial charges, may subject investors to conflicts of interest, and are usually suitable only for the risk capital portion of an
investor’s portfolio. Before investing in any partnership and in order to make an informed decision, investors should read the applicable prospectus
and/or offering documents carefully for additional information, including charges, expenses, and risks. Managed futures investments are not intended
to replace equities or fixed income securities but rather may act as a complement to these asset categories in a diversified portfolio.
Investing in commodities entails significant risks. Commodity prices may be affected by a variety of factors at any time, including but not limited to,
(i) changes in supply and demand relationships, (ii) governmental programs and policies, (iii) national and international political and economic events,
war and terrorist events, (iv) changes in interest and exchange rates, (v) trading activities in commodities and related contracts, (vi) pestilence,
Please refer to important information, disclosures and qualifications at the end of this material.
November 2014
17
technological change and weather, and (vii) the price volatility of a commodity. In addition, the commodities markets are subject to temporary
distortions or other disruptions due to various factors, including lack of liquidity, participation of speculators and government intervention.
Physical precious metals are non-regulated products. Precious metals are speculative investments, which may experience short-term and long
term price volatility. The value of precious metals investments may fluctuate and may appreciate or decline, depending on market conditions. If sold
in a declining market, the price you receive may be less than your original investment. Unlike bonds and stocks, precious metals do not make interest
or dividend payments. Therefore, precious metals may not be suitable for investors who require current income. Precious metals are commodities
that should be safely stored, which may impose additional costs on the investor. The Securities Investor Protection Corporation (“SIPC”) provides
certain protection for customers’ cash and securities in the event of a brokerage firm’s bankruptcy, other financial difficulties, or if customers’ assets
are missing. SIPC insurance does not apply to precious metals or other commodities.
Bonds are subject to interest rate risk. When interest rates rise, bond prices fall; generally the longer a bond's maturity, the more sensitive it is to this risk.
Bonds may also be subject to call risk, which is the risk that the issuer will redeem the debt at its option, fully or partially, before the scheduled maturity date.
The market value of debt instruments may fluctuate, and proceeds from sales prior to maturity may be more or less than the amount originally invested or the
maturity value due to changes in market conditions or changes in the credit quality of the issuer. Bonds are subject to the credit risk of the issuer. This is the
risk that the issuer might be unable to make interest and/or principal payments on a timely basis. Bonds are also subject to reinvestment risk, which is the risk
that principal and/or interest payments from a given investment may be reinvested at a lower interest rate.
Bonds rated below investment grade may have speculative characteristics and present significant risks beyond those of other securities, including greater
credit risk and price volatility in the secondary market. Investors should be careful to consider these risks alongside their individual circumstances, objectives
and risk tolerance before investing in high-yield bonds. High yield bonds should comprise only a limited portion of a balanced portfolio.
Interest on municipal bonds is generally exempt from federal income tax; however, some bonds may be subject to the alternative minimum tax
(AMT). Typically, state tax-exemption applies if securities are issued within one's state of residence and, if applicable, local tax-exemption applies if
securities are issued within one's city of residence.
Treasury Inflation Protection Securities’ (TIPS) coupon payments and underlying principal are automatically increased to compensate for inflation
by tracking the consumer price index (CPI). While the real rate of return is guaranteed, TIPS tend to offer a low return. Because the return of TIPS is
linked to inflation, TIPS may significantly underperform versus conventional U.S. Treasuries in times of low inflation.
The initial interest rate on a floating-rate security may be lower than that of a fixed-rate security of the same maturity because investors expect to
receive additional income due to future increases in the floating security’s underlying reference rate. The reference rate could be an index or an
interest rate. However, there can be no assurance that the reference rate will increase. Some floating-rate securities may be subject to call risk.
Rebalancing does not protect against a loss in declining financial markets. There may be a potential tax implication with a rebalancing strategy.
Investors should consult with their tax advisor before implementing such a strategy.
Equity securities may fluctuate in response to news on companies, industries, market conditions and general economic environment.
Investing in smaller companies involves greater risks not associated with investing in more established companies, such as business risk,
significant stock price fluctuations and illiquidity.
Asset allocation and diversification do not assure a profit or protect against loss in declining financial markets.
The indices are unmanaged. An investor cannot invest directly in an index. They are shown for illustrative purposes only and do not represent the
performance of any specific investment.
The indices selected by Morgan Stanley Wealth Management to measure performance are representative of broad asset classes. Morgan
Stanley Smith Barney LLC retains the right to change representative indices at any time.
REITs investing risks are similar to those associated with direct investments in real estate: property value fluctuations, lack of liquidity, limited
diversification and sensitivity to economic factors such as interest rate changes and market recessions.
Because of their narrow focus, sector investments tend to be more volatile than investments that diversify across many sectors and companies.
Investing in foreign emerging markets entails greater risks than those normally associated with domestic markets, such as political, currency,
economic and market risks.
Investing in foreign markets entails greater risks than those normally associated with domestic markets, such as political, currency, economic and
market risks. Investing in currency involves additional special risks such as credit, interest rate fluctuations, derivative investment risk, and
domestic and foreign inflation rates, which can be volatile and may be less liquid than other securities and more sensitive to the effect of varied
economic conditions. In addition, international investing entails greater risk, as well as greater potential rewards compared to U.S. investing. These
risks include political and economic uncertainties of foreign countries as well as the risk of currency fluctuations. These risks are magnified in
countries with emerging markets, since these countries may have relatively unstable governments and less established markets and economies.
The majority of $25 and $1000 par preferred securities are “callable” meaning that the issuer may retire the securities at specific prices and dates
prior to maturity. Interest/dividend payments on certain preferred issues may be deferred by the issuer for periods of up to 5 to 10 years, depending
on the particular issue. The investor would still have income tax liability even though payments would not have been received. Price quoted is per
$25 or $1,000 share, unless otherwise specified. Current yield is calculated by multiplying the coupon by par value divided by the market price.
Please refer to important information, disclosures and qualifications at the end of this material.
November 2014
18
The initial rate on a floating rate or index-linked preferred security may be lower than that of a fixed-rate security of the same maturity because
investors expect to receive additional income due to future increases in the floating/linked index. However, there can be no assurance that these
increases will occur.
Yields are subject to change with economic conditions. Yield is only one factor that should be considered when making an investment decision.
Credit ratings are subject to change.
Certain securities referred to in this material may not have been registered under the U.S. Securities Act of 1933, as amended, and, if not, may not
be offered or sold absent an exemption therefrom. Recipients are required to comply with any legal or contractual restrictions on their purchase,
holding, sale, exercise of rights or performance of obligations under any securities/instruments transaction.
Disclosures
Morgan Stanley Wealth Management is the trade name of Morgan Stanley Smith Barney LLC, a registered broker-dealer in the United States. This
material has been prepared for informational purposes only and is not an offer to buy or sell or a solicitation of any offer to buy or sell any security or
other financial instrument or to participate in any trading strategy. Past performance is not necessarily a guide to future performance.
The author(s) (if any authors are noted) principally responsible for the preparation of this material receive compensation based upon various factors,
including quality and accuracy of their work, firm revenues (including trading and capital markets revenues), client feedback and competitive factors.
Morgan Stanley Wealth Management is involved in many businesses that may relate to companies, securities or instruments mentioned in this
material.
This material has been prepared for informational purposes only and is not an offer to buy or sell or a solicitation of any offer to buy or sell any
security/instrument, or to participate in any trading strategy. Any such offer would be made only after a prospective investor had completed its own
independent investigation of the securities, instruments or transactions, and received all information it required to make its own investment decision,
including, where applicable, a review of any offering circular or memorandum describing such security or instrument. That information would contain
material information not contained herein and to which prospective participants are referred. This material is based on public information as of the
specified date, and may be stale thereafter. We have no obligation to tell you when information herein may change. We make no representation or
warranty with respect to the accuracy or completeness of this material. Morgan Stanley Wealth Management has no obligation to provide updated
information on the securities/instruments mentioned herein.
The securities/instruments discussed in this material may not be suitable for all investors. The appropriateness of a particular investment or strategy
will depend on an investor’s individual circumstances and objectives. Morgan Stanley Wealth Management recommends that investors
independently evaluate specific investments and strategies, and encourages investors to seek the advice of a financial advisor. The value of and
income from investments may vary because of changes in interest rates, foreign exchange rates, default rates, prepayment rates,
securities/instruments prices, market indexes, operational or financial conditions of companies and other issuers or other factors. Estimates of future
performance are based on assumptions that may not be realized. Actual events may differ from those assumed and changes to any assumptions
may have a material impact on any projections or estimates. Other events not taken into account may occur and may significantly affect the
projections or estimates. Certain assumptions may have been made for modeling purposes only to simplify the presentation and/or calculation of any
projections or estimates, and Morgan Stanley Wealth Management does not represent that any such assumptions will reflect actual future events.
Accordingly, there can be no assurance that estimated returns or projections will be realized or that actual returns or performance results will not
materially differ from those estimated herein.
This material should not be viewed as advice or recommendations with respect to asset allocation or any particular investment. This information is
not intended to, and should not, form a primary basis for any investment decisions that you may make. Morgan Stanley Wealth Management is not
acting as a fiduciary under either the Employee Retirement Income Security Act of 1974, as amended or under section 4975 of the Internal Revenue
Code of 1986 as amended in providing this material.
Morgan Stanley Wealth Management and its affiliates do not render advice on tax and tax accounting matters to clients. This material was
not intended or written to be used, and it cannot be used or relied upon by any recipient, for any purpose, including the purpose of
avoiding penalties that may be imposed on the taxpayer under U.S. federal tax laws. Each client should consult his/her personal tax and/or
legal advisor to learn about any potential tax or other implications that may result from acting on a particular recommendation.
This material is disseminated in Australia to “retail clients” within the meaning of the Australian Corporations Act by Morgan Stanley Wealth
Management Australia Pty Ltd (A.B.N. 19 009 145 555, holder of Australian financial services license No. 240813).
Morgan Stanley Wealth Management is not incorporated under the People's Republic of China ("PRC") law and the research in relation to this report
is conducted outside the PRC. This report will be distributed only upon request of a specific recipient. This report does not constitute an offer to sell or
the solicitation of an offer to buy any securities in the PRC. PRC investors must have the relevant qualifications to invest in such securities and must
be responsible for obtaining all relevant approvals, licenses, verifications and or registrations from PRC's relevant governmental authorities.
If your financial adviser is based in Australia, Dubai, Germany, Italy, Switzerland or the United Kingdom, then please be aware that this report is
being distributed by the Morgan Stanley entity where your financial adviser is located, as follows: Australia: Morgan Stanley Wealth Management
Australia Pty Ltd (ABN 19 009 145 555, AFSL No. 240813); Dubai: Morgan Stanley Private Wealth Management Limited (DIFC Branch), regulated by
the Dubai Financial Services Authority (the DFSA), and is directed at Professional Clients only, as defined by the DFSA; Germany: Morgan Stanley
Private Wealth Management Limited, Munich branch authorized by the Prudential Regulation Authority and regulated by the Financial Conduct
Authority and the Bundesanstalt fuer Finanzdienstleistungsaufsicht; Italy: Morgan Stanley Bank International Limited, Milan Branch, authorized by the
Prudential Regulation Authority and regulated by the Financial Conduct Authority and the Prudential Regulation Authority, the Banca d'Italia and the
Please refer to important information, disclosures and qualifications at the end of this material.
November 2014
19
Commissione Nazionale per Le Societa' E La Borsa; Switzerland: Bank Morgan Stanley AG regulated by the Swiss Financial Market Supervisory
Authority; or United Kingdom: Morgan Stanley Private Wealth Management Ltd, authorized and regulated by the Financial Conduct Authority,
approves for the purposes of section 21 of the Financial Services and Markets Act 2000 this material for distribution in the United Kingdom.
Morgan Stanley Wealth Management is not acting as a municipal advisor to any municipal entity or obligated person within the meaning of Section
15B of the Securities Exchange Act (the “Municipal Advisor Rule”) and the opinions or views contained herein are not intended to be, and do not
constitute, advice within the meaning the Municipal Advisor Rule.
This material is disseminated in the United States of America by Morgan Stanley Smith Barney LLC.
Third-party data providers make no warranties or representations of any kind relating to the accuracy, completeness, or timeliness of the data they
provide and shall not have liability for any damages of any kind relating to such data.
Morgan Stanley Wealth Management research, or any portion thereof, may not be reprinted, sold or redistributed without the written consent of
Morgan Stanley Smith Barney LLC.
© 2014 Morgan Stanley Smith Barney LLC. Member SIPC.
Please refer to important information, disclosures and qualifications at the end of this material.
November 2014
20

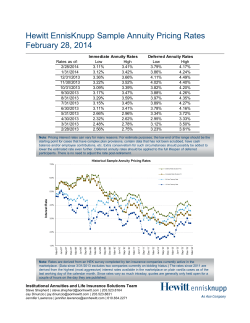


© Copyright 2026