
ADBI Working Paper Series
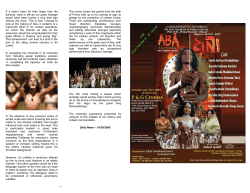
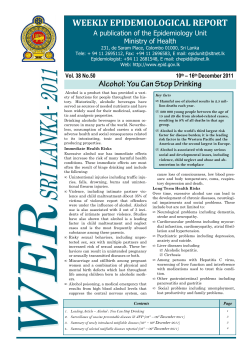
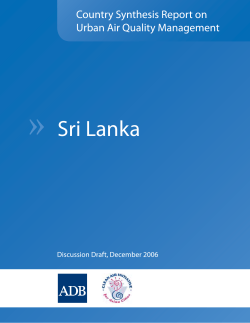
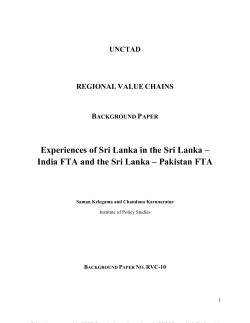
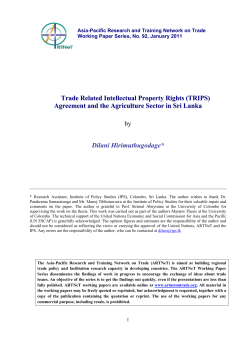
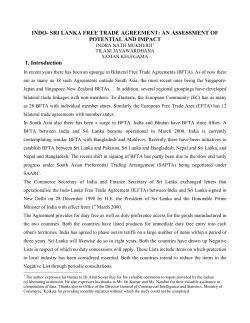
ADBI Working Paper Series
The India–Sri Lanka Free Trade
Agreement and the Proposed
Comprehensive Economic
Partnership Agreement:
A Closer Look
Saman Kelegama
No. 458
February 2014
Asian Development Bank Institute
Saman Kelegama is the Executive Director of the Institute of Policy Studies of Sri Lanka
(IPS) and a Fellow of the National Academy of Sciences of Sri Lanka. The author
gratefully acknowledges research assistance from Ashani Abeysekera, Research Officer,
IPS, Colombo, in preparing this paper.
The views expressed in this paper are the views of the author and do not necessarily
reflect the views or policies of ADBI, the ADB, its Board of Directors, or the governments
they represent. ADBI does not guarantee the accuracy of the data included in this paper
and accepts no responsibility for any consequences of their use. Terminology used may
not necessarily be consistent with ADB official terms.
The Working Paper series is a continuation of the formerly named Discussion Paper series;
the numbering of the papers continued without interruption or change. ADBI’s working
papers reflect initial ideas on a topic and are posted online for discussion. ADBI encourages
readers to post their comments on the main page for each working paper (given in the
citation below). Some working papers may develop into other forms of publication.
Suggested citation:
Kelegama, S. 2014. India-Sri Lanka Free Trade Agreement and the Proposed
Comprehensive Economic Partnership Agreement: A Closer Look.
ADBI Working Paper 458. Tokyo: Asian Development Bank Institute. Available:
http://www.adbi.org/working-paper/2014/02/06/6131.india.sri.lanka.free.trade.agreement/
Please contact the author for information about this paper.
Email: [email protected]
Asian Development Bank Institute
Kasumigaseki Building 8F
3-2-5 Kasumigaseki, Chiyoda-ku
Tokyo 100-6008, Japan
Tel:
Fax:
URL:
E-mail:
+81-3-3593-5500
+81-3-3593-5571
www.adbi.org
[email protected]
© 2014 Asian Development Bank Institute
ADBI Working Paper 458
Kelegama
Abstract
The India–Sri Lanka Free Trade Agreement has been in operation for more than a decade.
The paper provides the Sri Lankan perspective of the Free Trade Agreement (FTA)
highlighting both the positive outcomes and the negative aspects. The paper shows that the
FTA has worked in favor of Sri Lanka but its full potential has not yet been realized due to
market access problems in India, and the lack of supply capacity for some products in Sri
Lanka. The India–Sri Lanka Comprehensive Economic Partnership Agreement addressed
many of the negative aspects of the FTA in a broader economic integration framework but
was unable come into operation due to public misconceptions and lack of entrepreneurial
and political leadership in Sri Lanka.
JEL Classification: F13, F15
ADBI Working Paper 458
Kelegama
Contents
1.
Introduction ................................................................................................................ 3
2.
Experience of the India–Sri Lanka Free Trade Agreement: Recent Trends ............... 3
2.1
2.2
2.3
2.4
Trade in Goods .............................................................................................. 3
Investment ..................................................................................................... 7
Services ......................................................................................................... 8
Problematic Areas.......................................................................................... 9
3.
The Comprehensive Economic Partnership Agreement: Way Forward Toward
Increased Integration ............................................................................................... 11
4.
Concluding Remarks ............................................................................................... 14
References ......................................................................................................................... 16
ADBI Working Paper 458
Kelegama
1. INTRODUCTION
Economic relations between India and Sri Lanka were strong in pre-colonial times, but
these relations diluted during the nearly four-and-a-half centuries of colonial rule. Soon
after independence in both countries, economic relations strengthened but not
significantly due to inward-looking economic policies dominating in both economies
until about the mid-1980s. Economic links began to pick up in the 1990s with the liberal
economic regimes consolidating in both economies and, received a boost in 1998
when the two countries signed a bilateral India–Sri Lanka Free Trade Agreement
(ILFTA) which came into operation in March 2000. This was a pioneering attempt in the
direction of trade liberalization in the South Asia region and involved the liberalization
of trade in goods. Sri Lanka’s economic objectives were to increase trade ties with
South Asia’s dominant economic power, to induce the transformation of Sri Lanka’s
exports from low value added goods to high value added goods aimed at niche
markets and to provide low-income groups with cheap consumer imports from India
(Kelegama 1999).
The ILFTA was formulated based on the “negative list” approach; each country extends
tariff concessions/preferences to all commodities except those indicated in its negative
list. 1 The two countries agreed for preferential treatment on 5,112 tariff lines.
Over the years much research has been done on how to design an FTA between a
small and large country to work out a “win–win” situation. This is done by taking the
asymmetry between the two countries into account and building Special and
Differential Treatment (SDT) for the smaller country into the FTA, with the larger
country not insisting on reciprocity by the smaller country. SDT was built into the ILFTA
in favor of Sri Lanka through a longer negative list, longer trade liberalization schedule,
favorable Rules of Origin (ROO), and so on. 2
This paper provides a broad-brush Sri Lankan perspective of the current situation of
India–Sri Lanka trade and investment, while highlighting some of the findings of indepth studies done on the FTA so far. The paper goes on to highlight the impediments
faced and various constraints that have prevented the FTA moving to a higher stage of
a Comprehensive Economic Partnership Agreement (CEPA). It also highlights the
opportunities of a CEPA through which Sri Lanka can benefit, especially at a time when
its traditional export markets are undergoing a recession.
2. EXPERIENCE OF THE INDIA–SRI LANKA FREE
TRADE AGREEMENT: RECENT TRENDS
2.1 Trade in Goods
Sri Lanka’s trade with India changed dramatically following the implementation of the
FTA. In the period 1995–2000, immediately preceding the agreement, average annual
exports from Sri Lanka to India were US$39 million (close to 1% of Sri Lanka’s overall
1
2
Sri Lanka’s negative list comprises mainly agricultural products, key revenue items such as motor
vehicles and items of significant domestic production such as ceramics and footwear.
The immediate duty-free list (319 items) and 50% preferential duty list (889 items) were considerably
smaller than those offered by India (1,351 items and 2,799 items respectively), while the Sri Lankan
negative list (1,180 items) was considerably larger than India’s (196 items) (Kelegama and Mukherji
2007).
3
ADBI Working Paper 458
Kelegama
exports) while average imports were US$509 million (close to 10% of Sri Lanka’s
overall imports). While India was an important source of imports even prior to the FTA,
it was not a major export market, and in 2000 it ranked 14th in terms of export
destinations. By 2005, Sri Lanka’s exports to India reached US$566 million, a tenfold
increase compared to 2000, and stood at US$567 million in 2012 (see Table 1). India
was the fifth largest destination for Sri Lanka’s exports in 2008, and by 2012 India had
become the third largest export destination after the European Union (EU) and the
United States (US).
Table 1: India–Sri Lanka Merchandise Trade, 2000–2012
Year
2000
2001
2002
2003
2004
2005
2006
2007
2008
2009
2010
2011
2012
Exports to
India ($ million)
58
72
170
245
391
566
489
515
418
322
474
519
567
Imports from
India ($ million)
600
601
832
1,076
1,439
1,835
2,173
2,610
3,447
1,820
2,570
4,431
3,640
Sri Lanka
Share of total
exports (%)
1.0
1.5
3.6
4.6
6.8
8.9
7.1
6.7
5.2
4.5
5.6
4.9
5.8
Source: Central Bank of Sri Lanka, Annual Report, Various Issues.
Share of total
imports (%)
9.0
10.5
13.8
16.1
18.0
20.7
21.2
23.1
24.5
17.8
19.0
21.9
19.0
Import:Export
Ratio
10.3:1
8.4:1
5.0:1
4.4:1
3.7:1
3.2:1
4.4:1
5.1:1
8.2:1
5.7:1
5.4:1
8.5:1
6.4:1
The number of products exported by Sri Lanka to India also increased substantially
during this time. While in 1999 Sri Lanka exported 505 tariff lines to India, by 2005 this
had increased to 1,062, and by 2012 had further increased to 2,100. In the early years
of the FTA there was trade creation, with a number of new products being exported
from both countries (Mukerjhi, Kelegama, and Jayawardena 2003). The ILFTA did not
become a discriminatory trading framework for the rest of the world and according to
Joshi (2010) it had a trade creation effect on the rest of the world.
Sri Lanka gradually began to export higher value added products as the FTA
progressed. In 1999, Sri Lanka’s main exports to India included pepper, waste and
scrap steel, areca nuts, dried fruit, cloves, and waste paper. By 2008, there were still a
number of primary products exported to India; however, several value-added products
such as insulated wires and cables, pneumatic tires, ceramics, vegetable fats and oils,
refined copper products, and furniture were among the top exports to India. 3 Imports,
too, have grown at a rapid rate following the implementation of the FTA. Imports from
India, which amounted to US$600 million in 2000, reached US$3,640 million in 2012—
a sixfold increase. India has been Sri Lanka’s main source of imports since 1997.
An aggregate view of trade between India and Sri Lanka since the FTA came into
being suggests a positive picture, with overall trade growing close to sixfold and
exports from Sri Lanka growing tenfold. Furthermore, the increased diversity and
greater value addition in exports from Sri Lanka is a positive development.
There were, however, some unfavorable trends in Sri Lanka’s exports to India during
2005–2007. Although exports from Sri Lanka to India reached a high of US$566 million
in 2005, these exports were largely concentrated in two products—copper and
3
Department of Commerce, Sri Lanka website: http://www.doc.gov.lk.
4
ADBI Working Paper 458
Kelegama
vanaspati (a vegetable oil)—with 49.66% of Sri Lanka’s exports to India being from the
export of these two tariff lines. If vanaspati and copper were excluded from the trade
figures, Sri Lanka’s exports to India would have increased from US$58 million in 2000
to just US$278 million in 2005, an increase of fivefold compared to the tenfold increase
with the inclusion of vanaspati and copper. Why did these two industries dominate
during a brief period in the mid-2000s?
2.1.1
The Vanaspati and Copper Boom
The rise in exports of these items was not due to any distinct comparative advantage
that Sri Lanka held, but rather was due to short-term tariff arbitrage by Indian
manufacturers investing in Sri Lanka. 4 The vanaspati industry was only viable as long
as there was a difference between the Indian and Sri Lankan tariffs on palm oil
imports—the main input ingredient of vanaspati. In Sri Lanka, duty-free importation
facility for palm oil for industrialists was listed under the Board of Investment (BOI) in
addition to the duty free exporting facility to India, while in India a tariff close to 60%
applied for importation of palm oil. In response to the increase in global commodity
prices in 2007/2008, India cut import tariffs on various food imports including palm oil,
making vanaspati exports from Sri Lanka unviable. Unsurprisingly, vanaspati exports in
2008 were SLRs4.5 billion, a fall of 72% from exports in 2007 which amounted to
SLRs16 billion. Vanaspati exports completely disappeared by 2009.
Copper exports from Sri Lanka were also subject to much scrutiny from India, based on
their low domestic value addition, arguing that copper exports from Sri Lanka were
under-invoiced and violated the ROO criteria. India insisted that pricing of iron ore
inputs for copper should be based on the London Metal Exchange prices, and since
adhering to this rule a large proportion of Sri Lankan copper exports were deemed
ineligible to the Indian market (IPS 2008). With the change in invoicing measures,
copper exports from Sri Lanka were the first to be affected, with exports falling from
US$145 million in 2005 to US$13 million in 2008.
With the collapse of vanaspati and copper exports in 2008, Sri Lanka’s total exports to
India in 2008 declined substantially to US$418 million, the lowest since 2004 (US$391
million) and a 26% fall in export value since the peak in 2005. In 2009, due to the
global financial crisis, exports to India further fell to US$322 million and then recovered
gradually closer to the 2005 level of exports by 2012. In short, the vanaspati and
copper episodes and the global financial crisis dipped Sri Lankan exports to India for
nearly 7 years from 2005.
2.1.2
Increased Value-Added Exports
As stated, since 2008 there has been rapid growth in exports of high value added
manufacturing goods to India, and by 2011, insulated wires and cables, intimate
garments, animal feed, refrigerators, and freezers were prominent exports (Figure 1).
Moreover, value-added tea, furniture, tableware, machinery, rubber gloves, and refined
copper products, were able to capture niches in the Indian market. Over 70% of Sri
Lankan exports to India went under the FTA during the post-2007 period and in 2011
the share was 83%.
4
India maintained high tariffs on imports of crude palm oil from countries such as Malaysia, while Sri
Lanka maintained relatively low tariffs on imports of these products. Thus Indian manufacturers set up
vanaspati manufacturing plants in Sri Lanka, imported crude palm oil, processed it in Sri Lanka to form
vanaspati and exported it to India free of duty under the FTA.
5
ADBI Working Paper 458
Kelegama
Figure 1: Top Exports from Sri Lanka to India, 2007–2011
Source: Export Development Board of Sri Lanka, Export Performance Indicators.
At the same time, imports from India have increased considerably in recent years. In
2008, imports from India reached US$3,443 billion, a growth of 37% compared to 2007.
However, the major cause for the increase in imports was the increased cost of
petroleum products in global markets. 5 The import of petroleum products from India is
not influenced by the FTA as petroleum imports are in Sri Lanka’s negative list. In fact,
the bulk of Indian imports into Sri Lanka (petroleum, vehicles, sugar, cotton, iron and
steel, and pharmaceutical products) are not subject to reduced tariffs through the FTA
as over 70% of Sri Lanka’s import value from India is from products that are either in
the negative list or are exempt from most favored nation duty. According to the
Department of Commerce, Sri Lanka’s imports under the FTA were only about 14% of
the country’s total imports from India in 2007 and 13% in 2011.
These observations suggest that the growth of the trade deficit between India and Sri
Lanka is not largely a result of the FTA between the two countries, since most of the
major traded items are not subject to the FTA. Figure 2 clearly shows that that there is
hardly a deficit between the two countries for actual goods moving under the FTA.
Normal trade patterns between the two countries are likely to have resulted in an even
wider trade deficit since the FTA has provided some scope for Sri Lankan exports to
India.
Figure 2: Sri Lanka’s Trade under the FTA with India, 2006–2011
FTA = free trade agreement.
Sources: Central Bank of Sri Lanka, Annual Report, Various Issues and Department of Commerce of Sri
Lanka, 2012.
5
Crude oil reached US$148 a barrel in June 2008.
6
ADBI Working Paper 458
Kelegama
The trade deficit between the two countries could be viewed from the import–export
ratio and as clearly seen in Table 1 this ratio improved from 10.3:1 in 2000 to 6.4:1 in
2012 indicating that the overall deficit too has improved in favor of Sri Lanka. In fact, if
the exceptional year of vanaspati and copper boom of 2005 is examined, Table 1
clearly shows that the ratio had reached a peak level in favor of Sri Lanka to 3.2:1.
It must be noted that a country need not be overly concerned about bilateral trade
deficits. Given the nature of globalization and international division of labor, it is
impossible to maintain trade surpluses with all trading partners, and these are simply a
reflection of the industrial specialization that is associated with trading economies. Sri
Lanka imports largely from countries such as India and the People’s Republic of China
(PRC) (and has large trade deficits with these countries) and exports to Europe and the
US (and has large trade surpluses with these countries). Even if the trade deficit has
expanded in the current account, this has been largely balanced by investment flows
from India to Sri Lanka on the capital account.
2.2 Investment
There have been three waves of Indian investments in Sri Lanka after opening up of
the Sri Lankan economy in 1977. The first wave saw companies such as Ashok
Leyland coming in 1982 to manufacture buses for the domestic market. After the 1983
political turbulence there was hardly any Indian investment. The second wave of
investment started in the mid-1990s after India became the largest source of imports to
Sri Lanka. Investments were seen in areas such as steel, cement, roofing sheets, and
paint manufacturing. The third wave was seen after the FTA in 2000 and many of the
popular companies such as ICIC bank, Bharat Airtel, IOC, Apollo Hospitals, etc.,
starting to come to Sri Lanka. Indian investment amounted to 14% of total FDI flows to
Sri Lanka in 2008. India is now the second biggest investor in the country, surpassed
only by Malaysia.
Indian cumulative investment in Sri Lanka is above US$1 billion and Indian companies
have committed to nearly US$2 billion of investments in Sri Lanka for the next 5 years.
Figure 3 shows the increasing Indian investment in Sri Lanka. The bulk of the existing
Indian investment in Sri Lanka is in services such as telecoms (Bharat Airtel), energy
(Indian Oil Corporation), banking (ICIC Bank), and tourism (Taj Hotels), etc., amounting
to nearly 60% of Indian investment. India is the main destination for Sri Lankan foreign
investment and companies such as Carson Cumberbatch, Brandix (US$1 billion
“apparel city” in Vizag), MAS Holdings, John Keells, Hayleys, Aitken Spence, Damro,
Dankotuwa Porcelain, Ceylon Biscuits, and Atlas Stationery are some of the
companies that already have investments in India.
7
ADBI Working Paper 458
Kelegama
Figure 3: Cumulative FDI from India to Sri Lanka, 1999–2011
100000
140
90000
120
100
70000
60000
80
50000
60
40000
30000
No. of Projects
FDI from India (Rs. Million)
80000
Indian FDI
No. of Projects
40
20000
20
10000
0
0
1999 2000 2001 2002 2003 2004 2005 2006 2007 2009 2011
FDI = foreign direct investment.
Source: Board of Investment of Sri Lanka, 2012
In the mid-2000s, much of the investment that came into Sri Lanka was associated with
products such as vanaspati and copper, as foreign investors from India and third
parties saw an opportunity to break into India’s market through Sri Lanka. Employment
creation was also limited. According to the BOI, by 2008, 5,900 jobs were created as a
result of Indian investment. But this includes 1,500 employees in the Indian Oil
Company retail outlets, which entailed re-hiring staff from the Ceylon Petroleum
Corporation-owned outlets rather than creation of new jobs.
While the dominance of services suggests that the impact of the FTA (which only deals
with trade in goods) on the investment decision (Indian firms investing in Sri Lanka to
take advantage of the FTA to export products to India) is limited, it could be argued that
the surge of investment between 2000 and 2012 was influenced by the increased
profile of economic ties between the two countries and increased investor confidence
as a result of the FTA.
2.3 Services
Monetary measurement of trade in services is very limited (due to the intangible nature
of services) and therefore exact figures of trade in services are difficult to calculate.
However, the extent of commercial services exchange between the two countries has
increased as demonstrated by the following examples. Many Sri Lankan students and
patients travel to India to purchase education and health services each year,
approximately 70% of the Colombo Port’s income is from transshipment earnings from
India, approximately 40% of Sri Lanka Airlines’ revenue is from the Indian market while
Indian airliners, Jet and Spicejet (and sometime back Kingfisher) have operations in Sri
Lanka. Sri Lankan information technology firms have provided technical solutions to
Indian companies.
Sri Lankan tourist sector firms such as Aitken Spence and Jetwing have also ventured
into the Indian market. India has become the largest source of tourists to Sri Lanka.
India now accounts for 20% of tourist arrivals to Sri Lanka. Figure 4 shows the
increasing trend of Indian tourist flows to Sri Lanka. Improved bilateral relations,
8
ADBI Working Paper 458
Kelegama
including unilateral visa liberalization by Sri Lanka contributed to the rapid growth of
Indian arrivals. Meanwhile, Sri Lanka is among the top five countries that supply
tourists to India. Travel of Buddhist pilgrims to India has increased of late due to better
connectivity and the availability of a budget airline in Sri Lanka.
Figure 4: Tourist Arrivals from India to Sri Lanka, 2000–2011
180,000
160,000
No. of Tourists
140,000
120,000
100,000
80,000
60,000
40,000
20,000
0
2000 2001 2002 2003 2004 2005 2006 2007 2008 2009 2010 2011
Source: Central Bank of Sri Lanka, Annual Report, Various Issues.
2.4 Problematic Areas
While the aggregate figures resulting from the ILFTA are impressive, the full potential
of the FTA has not been reaped by Sri Lanka. The key question, in terms of moving
forward and for lessons for the future is: why hasn’t there been a greater positive
impact on the Sri Lankan economy as a result of the ILFTA? Several reasons have
been identified.
First, intra-industry trade between the two countries did not grow significantly to
stimulate overall trade between the two countries. Abeyratne (2013) finds that Sri
Lankan manufacturers have not been successful in linking up with Indian supply chains
and this supports the earlier findings of de Mel and Jayaratne (2012) that vertical
integration of Sri Lankan industries with Indian industries is at a very low level. The
explanation for this could be found in the level of industrialization in India compared to
that of the ASEAN region. Abeyratne (2013) argues that the level of industrialization is
less sophisticated to encourage large-scale supply chains developing with regional
suppliers. It may be noted in this context that India made a shift from agriculture to
industrialization, but before the level of industrialization deepened, India made a rapid
shift toward the service sector surpassing the shift to services in many other developing
countries.
Second, there were a number of impediments for market access in the Indian market.
Some of them are highlighted below.
Tariff rate quotas on major exports
Tea, ready-made garments, and textiles, which make up 50% of Sri Lanka’s total
exports, were placed under quotas in the ILFTA. Also, quota utilization has been
minimal due to stringent ROO requirements and port restrictions. Quota utilization has
9
ADBI Working Paper 458
Kelegama
somewhat improved at present following a degree of relaxation of ROO and port
restrictions in 2007. 6
Sri Lankan ready-made garment exports to India were negligible even after the FTA.
Ready-made garments were granted preferential market access of 50% for 8 million
pieces per year while textiles were granted a preferential margin of 25% with no
quantitative restrictions. Out of the 8 million pieces, 3 million were required to have
Indian fabrics as per the ROO. While this condition remained until the end of 2012, the
8 million pieces were made duty free in 2006. The quota utilization for the 5 million
pieces was 10%–15% while for the 3 million pieces it was 100% as Sri Lankan readymade garment exports with Indian fabrics were not competitive in the Indian market. In
2013, the Indian fabrics usage conditionality was completely removed.
Non-tariff barriers
Many Sri Lankan exporters have faced difficulties in entering the Indian market due to
the maintenance of non-tariff barriers (NTBs) such as state taxes, quality requirements,
and administrative procedures, which are outside the scope of tariff reduction under the
FTA. One example is state taxes charged by Tamil Nadu, where Sri Lankan exporters
are taxed at 21% while local products are taxed at 10.5% on sales (Kelegama and
Mukherji 2007).
Rules of origin
Besides the stringent ROO within the tariff rate quotas (TRQs) for ready-made
garments, the more general case of requiring a change of tariff heading (CTH) at the
four-digit level has been burdensome for certain Sri Lankan exports. This rule has had
a detrimental effect on Sri Lanka’s blended tea exports where a CTH at the four-digit
level is difficult to achieve even when blended with Indian tea.
Unilateral imposition of quotas
Following the surge of vanaspati imports from Sri Lanka to India, the two countries
entered into negotiations in 2006 to apply a quota on vanaspati exports due to the
disruptions caused to the Indian domestic industry. The two countries initially agreed to
a quota of 250,000 metric tons per year. However, in 2006 India unilaterally reduced
this quota to 100,000 metric tons and canalized all vanaspati imports from Sri Lanka
through national procurement agency. 7 Further negotiations took place and the quota
was reverted to 250,000 metric tons. Similar problems have occurred in exports such
as bakery shortening, pepper, and copper. More than the disruptions to the industries
as a result of such quantitative restrictions, what is of concern is the undermining of
confidence in the FTA as a whole due to strong unilateral measures.
A rough estimate shows that if all exports of Sri Lanka go to India it would have
amounted to 2% of India’s overall imports; and in this context, India removing more of
the NTBs to Sri Lankan exports should not be an issue. However, given the
concentration of production and the federal state structure in India, the issue of
restriction removal becomes more complicated. For instance, the state of Kerala
accounts for 92% of Indian pepper exports, 74% of cardamom exports, and 63% of
ginger exports among others, and accounts for 67.5% of total spice exports from India
6
7
India removed the port restrictions on tea imports from Sri Lanka within a quota of 12.5 million kilograms,
and 3 million garment pieces now enjoy duty-free access to India (de Mel 2008a).
See
http://www.lankabusinessonline.com/news/Sri_Lanka-India_trade_talks_to_resume_controversial_vana
spati_exports,_inconclusive/1450011840
10
ADBI Working Paper 458
Kelegama
(Ahmed and Jena 2012). It is reported that the ILFTA contributed to the depression of
pepper prices in the Kerala market that led to lot of hue and cry among local producers
in Kerala. In 2006, the Indian Pepper Spices Trade Association pressurized the central
government to impose quota restrictions on Sri Lankan pepper imports. 8 Accordingly,
the central government imposed an annual import cap of 2,500 tons on Sri Lankan
pepper imports and designated one port, Kochi, for such imports in order to monitor
quantity and quality of such imports as there were allegations that third-country pepper
was coming to India via Sri Lanka through the FTA.
3. THE COMPREHENSIVE ECONOMIC PARTNERSHIP
AGREEMENT: WAY FORWARD TOWARD
INCREASED INTEGRATION
Given the early success of the FTA, both parties were aware of the importance and
benefits of broader economic integration and thus keen on deepening and broadening
the FTA. Based on the recommendations of the Joint Study Group of 2003 report, it
was decided to include trade in services, investment and economic cooperation, along
with further liberalization of the goods sector, under the ambit of a Comprehensive
Economic Partnership Agreement (CEPA) (JSG 2003). Negotiations for the CEPA
began in 2005, and after 3 years of negotiations the CEPA framework agreement was
scheduled for signature by the respective heads of states of the two countries in
parallel with the 15th South Asian Association for Regional Cooperation Summit in
Colombo in July 2008. However, due to the reservations expressed by a group of local
industrialists with strong connections with the government and a left-oriented political
party, the CEPA was not signed during the summit and has remained in limbo since.
The reservations expressed by critics of the CEPA were based on two broad concerns;
the first, about the nature of the CEPA itself, and the second that the drawbacks in the
FTA should be dealt with first, prior to embarking on a CEPA. The first concern was
largely related to the inclusion of trade in services, specifically the movement of natural
persons (Mode 4) which was understood as a move toward free movement of labor
between the two countries. But critics failed to take into account the fact that like the
FTA, the CEPA also made room for the economic asymmetry between the two
countries, and therefore accorded special and differential treatment to Sri Lanka—Sri
Lanka was not expected to fully reciprocate India’s commitments. Furthermore, the
CEPA services agreement was based on a positive list framework, where the two
countries exchange request lists for the liberalization of a specific sector and each
country can choose to make an offer which is in line with their comfort levels and
developmental interests. Moreover, Mode 4 was linked to Mode 3 and there was no
stand-alone Mode 4 liberalization unless there was a special request by a particular
sector in Sri Lanka. In the stakeholder consultations, such requests were made for ship
repairing and the IT sector in Sri Lanka. Given such flexibility, concerns about a flood
of Indian labor in the Sri Lankan market were completely misplaced.
The second concern, that the shortcomings in the FTA should be addressed before
CEPA, is made with very little understanding of the agreement. At the onset of
discussions on CEPA, it was recognized that in the modern world trade in goods and
8
In 1999, prior to the ILFTA, India exported US$69,025 worth of pepper (HS 090411) to Sri Lanka and
with the FTA in place in 2005 pepper exports declined to US$9,203 while pepper imports from Sri Lanka
kept on rising.
11
ADBI Working Paper 458
Kelegama
services are inter-related and also closely linked to investment. Given these interlinkages, the negotiation teams of both countries were of the view that all barriers for
economic integration between both countries should be addressed in a broader
framework that consisted of trade in goods, services, and investment. Both Mutual
Recognition Agreements and Memorandums of Agreement were to be signed covering
broad subject areas. Thus, CEPA was negotiated with the very objective of addressing
the shortcomings in the FTA, such as the removal of port restrictions, NTBs, ROO
requirements in ready-made garments, and so on. 9
Also, increasing exports to India requires a general change in the perceptions and
preferences of Sri Lankan exporters—a process that will take time. Despite the
geographic and cultural proximity of the two countries, India has not been a major
export market of Sri Lanka since independence, with exporters preferring developed
markets in the Western world. The current limitations on established export items due
to the global economic crisis mean that new export products have to be developed
from scratch—economies of scale need to be achieved, brand development must be
carried out, and marketing and buyer relations must be developed. This process
becomes more challenging given the size and competitiveness of the Indian market.
Furthermore, supply capacities in developing economies like Sri Lanka take time to
develop. With the improvement of the security situation in the country, it is hoped that
foreign investment in the country would gradually build up.
There are many successful Sri Lankan exporters to India, as was clearly seen from the
increase in the number of products exported from Sri Lanka to India. However, many of
these successful exporters are reluctant to come out in support of the CEPA due to a
number of reasons. For example, a successful strawberry exporter from Sri Lanka to
India says his main problem is inadequate domestic supplies and not NTBs in the
Indian market and would not like to come out and openly support the CEPA as he fears
that his rivals will eat into his market share in the Indian market.
Among the CEPA criticisms in Sri Lanka, the NTBs in the Indian market have been
highlighted time and again. However it would not be prudent to over-emphasize the
NTBs in the Indian market without looking at the overall picture. The question could be
posed as to how PRC exports to India increased from a mere US$1.5 billion in 2001 to
over US$50 billion by 2011 despite the existence of these same NTBs in the Indian
market and without the benefit of an FTA? While this question needs detailed study, it
is clear that NTBs alone do not explain the problem facing Sri Lankan exporters
capturing a bigger share of the Indian market. A factor that clearly stands out from this
example is that Sri Lanka does not possess the supply capacity like that of the PRC to
fully exploit the growing Indian market. One way of addressing this issue is by
promoting joint investment ventures with Indian companies with buy-back
arrangements like, for example, CEAT Kelani tires, which exports tires produced in Sri
Lanka to India among other countries.
For large Indian companies to be engaged in such ventures, BOI incentives alone
would not be adequate. There is a need to create a ruled-based investment regime
with renewed double taxation agreements, investment protection agreements, preestablishment national treatment, and so on. The FTA has now matured for over a
decade for these to be built in, as Sri Lankan investors too have been moving
increasingly to the Indian market since of late and these investors too will be more
secured under a rule-based system.
9
Many of the misconceptions on CEPA have been addressed in Analyst (2008).
12
ADBI Working Paper 458
Kelegama
With the CEPA negotiations being stopped, the only forum for addressing shortcomings
of the FTA has been closed. Delaying the CEPA until all the issues in the FTA are
addressed would result in the hijacking of potential national gains by vested interests
and hold up the benefits of liberalization of these sectors.
Given the fact of geographic proximity and socio-political and historical relations
between the two countries, economic exchange is inevitable. Furthermore, in the
context of Sri Lanka continuing to have a concentrated export basket, both in terms of
destination (US and EU) and products (ready-made garments and tea), diversification
becomes essential. This necessity has been highlighted in the recent global economic
crisis as Sri Lanka became particularly vulnerable given the concentration of exports to
the most adversely affected markets. Whilst the US and EU markets have faced a
recession, emerging markets such as India and PRC have managed to sustain some
degree of economic growth despite the global downturn. The Indian economy has been
growing at an average of around 7% during 2009–2012. Had Sri Lanka maintained a
more diverse export basket, the country would have been less vulnerable to external
shocks by exploiting the neighborhood markets, in particular, India.
The ILFTA has somewhat helped in shifting Sri Lanka’s trade toward alternative
emerging markets by encouraging exporters to move beyond their traditional buyers.
This strategy will be essential in the medium to long-term given the fact that world trade
can no longer rely on the unsustainable credit-based consumption booms, particularly
in the US. The global imbalances (production and savings by East Asia and the Middle
East along with credit-based consumption in developed markets) that had shaped the
world economy in recent years will no longer be viable, and increased domestic
consumption in Asia and the Middle East will be required to re-balance the system.
Given Sri Lanka’s proximity with India, the country is in an ideal position to take
advantage in this shift in global economic powers toward the East.
The CEPA should be seen as an attempt to manage Sri Lanka’s trading relationship
with India. The Agreement provides a legal framework which defines the rules and
regulations under which trade and investment occur between the two countries. The
lack of a rule-based regime to manage bilateral relations is a problem, especially for
small states. While a rule-based regime that is entered into on the basis of principles of
fairness by parties that are equally endowed with knowledge and power are definitely
the best option, even when there is substantial asymmetry of power among the parties
and the rules are not perfect, rule-based systems are superior to anarchy. Given these
conditions, the continued failure to proceed with the CEPA is unfortunate and
detrimental to Sri Lanka’s trade policy.
While countries continue to move ahead with negotiations at various levels, the multiple
and overlapping agreements of such negotiations can involve considerable transaction
costs. For example, Sri Lanka has entered into bilateral and multilateral negotiations in
the South Asian region such as the ILFTA, Pakistan–Sri Lanka FTA (PLFTA), South
Asian Free Trade Area (SAFTA), and Asia-Pacific Trade Agreement (APTA), each
involving different ROO, tariff preferences, etc. In the absence of progress in regional
frameworks such as APTA and SAFTA, the best option available to Sri Lanka is a
bilateral framework within a rule-based disciplinary framework. Also, given the fact that
India is currently engaged in negotiating a number of bilateral trade agreements with
much larger economies such as Japan and the EU, it would be unwise to delay the
already negotiated CEPA.
Also, given the slow progress of the World Trade Organization services negotiations,
Sri Lanka stands to benefit from early access to the large and growing Indian services
sector by engaging in the CEPA. As upper–middle class individual incomes increase at
13
ADBI Working Paper 458
Kelegama
almost double digits annually, the demand for services will continue to expand in India.
Furthermore, with economic growth, wages in India have increased relative to those in
Sri Lanka, and coupled with the effect of an appreciating Indian rupee, services offered
by Sri Lanka have become relatively competitive in the Indian market (de Mel 2008). It
is also possible that access to the Indian market may attract investment from third
parties into Sri Lanka, looking to export services to India through joint ventures with Sri
Lankan firms. While India’s regime is at present quite liberal, this is not a guaranteed
position over time. The CEPA will provide legally binding market access to India over
and above what is available to other countries. Given Sri Lanka’s limited domestic
market, the required economies of scale can never be achieved without sufficient
international integration. In the present climate, there is no better opportunity than the
Indian market.
The experience of the current global economic crisis has stressed the need for more
inclusive and equitable trade and growth policies. The CEPA is important in this
context, as increased importing of services such as health and education from India at
a reasonably low cost through service sector liberalization is beneficial to the lower and
middle-income Sri Lankans who face domestic supply constraints. While wealthy Sri
Lankans can obtain these services from Singapore, Europe, and the US, India is the
only option for the poorer population.
All in all, CEPA lacked entrepreneurial and political leadership in Sri Lanka to take it
forward. The critics of CEPA rode on the wave of economic nationalism that became
part of the socio-political system in Sri Lanka in the last stages of the North/East war.
The political establishment found it difficult to make any departures from economic
nationalism that they themselves whipped up, and those entrepreneurs who supported
CEPA were reluctant to come out openly to support it as they felt that they would be
identified as opponents of economic nationalism.
4. CONCLUDING REMARKS
The FTA has now been in operation for 12 years. It has many achievements to its
credit but is not free of problems. The full potential of the FTA is yet to be fully exploited
by Sri Lanka, and in this context, the paper argues that deepening and broadening the
FTA is the way forward. Policy tools under the command of the respective
governments need to be put into action to give more dynamism to the FTA and the
trade–investment nexus is a very powerful component that could be used for this
purpose. The causality from trade leading to investment is commonly seen, but the
casualty the other way round of investment leading to trade, needs strengthening and
this is what will stimulate intra-industry trade, supply chains, production networks, etc.,
and further stimulate trade. This is what Sri Lanka must aim for beyond the FTA and
how both countries could enhance the overall trading between the two countries from
the current US$5 billion to the target of US$10 billion by 2016 as agreed by both
governments in January 2013. 10
In conclusion, the key opportunity is to tap into the large and dynamic Indian market, by
moving beyond the ILFTA toward broader economic integration. The CEPA,
implemented with proper regulatory mechanisms in order to accommodate the disparity
between the countries, provides an opportunity for Sri Lanka to integrate more closely
with the Indian economy and accrue some of the benefits that would undoubtedly be
10
Target set at the meeting of the two External Affairs Ministers of both countries in January 2013.
14
ADBI Working Paper 458
Kelegama
enjoyed by India. Today, as an economic crisis grips Sri Lanka’s traditional export
markets and the global economy is experiencing a slow recovery, Sri Lanka should
view India as an opportunity and not a threat, and strive toward more meaningful
cooperation in facilitating sustainable development.
15
ADBI Working Paper 458
Kelegama
REFERENCES
Abeyratne, S. 2013. Integration of Sri Lanka into Indian Supply Chains under the
Bilateral Free Trade Agreement. South Asia Economic Journal 14(2): 275–292.
Ahmed, F., and P. C. Jena. 2012. India’s Experiences on Preferential Trade
Agreements. Jaipur, India: CUTS International.
Analyst. 2008. India–Sri Lanka FTA (IL-FTA) and Comprehensive Economic
Partnership Agreement (CEPA). Sri Lanka Exporter 62:13–19.
Central Bank of Sri Lanka. 2008. Annual Report 2008. Colombo: Central Bank of Sri
Lanka.
de Mel, D. 2008. India–Sri Lanka: Comprehensive Partnership Agreement. World
Trade Net Business Briefing.
http://www.economicswebinstitute.org/essays/cepaindiasrilanka.pdf.
de Mel, D. 2009. Indo-Lanka Trade Agreements: Performance and Prospects.
Economic Review 35(5, 6): 23–28.
de Mel, D., and S. Jayartane. 2011. Verticle Integration of Industries in South Asia. In
Regional Integration and Economic Development in South Asia, edited by H.-P.
Brunner, S. Kathri, and S. H. Rahman. Cheltenham, UK: Edward Elgar.
Institute of Policy Studies of Sri Lanka (IPS). 2008. Sri Lanka State of the Economy 2008. Colombo: IPS.
Joint Study Group (JSG). 2003. Joint Study Group Report on India–Sri Lanka
Comprehensive Economic Partnership Agreement.
http://www.ips.lk/publications/series/gov_reports/indo_srilanka_cepa/islcepa.pdf
Joshi, V. 2010. An Econometric Analysis of India–Sri Lanka Free Trade Agreement.
HEID Working Paper No. 04/2010. Geneva: The Graduate Institute of
International Studies.
Kelegama, S. 1999. Indo-Sri Lanka Trade and the Bilateral Free Trade Agreement: A
Sri Lankan Perspective. Asia-Pacific Development Journal 6(2): 87–106.
Kelegama, S., and I. N. Mukherji. 2007. India–Sri Lanka Bilateral Free Trade
Agreement: Six Years Performance and Beyond. RIS Discussion Paper. New
Delhi, India: Research and Information System for Developing Countries.
Mukherji, S., Kelegama, S., and T. Jayawardena. 2003. India–Sri Lanka Free Trade
Agreement: An Assessment of Potential and Impact.
http://www.saneinetwork.net/File/03_02pdf.
16
© Copyright 2026