
PDF hosted at the Radboud Repository of the Radboud University Nijmegen
PDF hosted at the Radboud Repository of the Radboud University
Nijmegen
This full text is a publisher's version.
For additional information about this publication click this link.
http://hdl.handle.net/2066/18678
Please be advised that this information was generated on 2014-11-24 and may be subject to
change.
Stellingen
behorende bij het proefschrift:
In vivo
13
C MR spectroscopy for human investigations
1. De associatie van het getal 13 met ongeluk is niet altijd terecht, het voorkom en van
een koolstofvariant met 13 kerndeeltjes is voor de MR spectroscopist een geluk te
noemen (dit proefschrift).
2.
De toepassing van protonontkoppeling ten behoeve van humaan onderzoek kan
geschieden binnen de geldende limieten voor RF depositie (dit proefschrift).
3. Op basis van tem peratuur en verm ogens metingen gedurende proton ontkoppeling
kan geconcludeerd worden dat de richtlijnen voor specifieke absorptie ratio te con
servatief zijn (dit proefschrift).
4. Signaalruisverbetering door middel van heteronucleaire polarizatie transfer geeft in
vivo 13C MR spectroscopie een meer dynamisch karakter (dit proefschrift).
5. Glucosevoeding resulteert in een sneller spierglycogeenherstel dan fructosevoeding
(dit proefschrift).
6 . De spierglycogeenvorming en de totale spier glucoseconcentratie tijdens een hyperinsulinemische euglycem ische clamp zijn beide goede parameters voor insuline
sensitiviteit (dit proefschrift).
7. Afrikaanse percussie w ordt het best benaderd door de kakofonie van de gradiënten
tijdens een map shim sequentie (eigen waarneming).
8. Het illegale CDcircuit zorgt niet alleen voor inkomstenderving van vele artiesten maar
ook voor een grotere naamsbekendheid.
9. Bij het beklimmen van een steile heuvel met de ATB speelt niet zozeer gewicht een
rol maar eerder de verdeling daarvan (eigen waarneming).
10. Door het plaatsen van meerdere spectroscopisten in één werkkam er neemt niet
alleen de ruis toe, maar ook het signaal af (anonieme kamergenoot).
Nijmegen, 13 april 1999
A.J. van den Bergh
In vivo
AO
C MR spectroscopy for human investigations
Een wetenschappelijke proeve op het gebied van de Medische Wetenschappen
Proefschrift
ter verkrijging van de graad van doctor
aan de Katholieke Universiteit Nijmegen,
volgens het besluit van het College van Decanen
in het openbaar te verdedigen
op dinsdag 13 april 1999
des namiddags te 3.30 uur precies
door
Adrianus Johannes van den Bergh
geboren op 20 oktober 1966
te Breda
Promotor:
Prof. Dr. A. Heerschap
Manuscriptcommissie: Prof. Dr. J.M.F. Trijbels
Prof. Dr. C.W. Hilbers
Dr. A. Hermus
ISBN: 90 - 9012516 - 7
Financial support by:
• Glaxo Wellcome
• Campro Scientific
• Stichting Radiologisch Onderzoek Nijmegen (Rad-ON)
• Diabetes Fonds Nederland
is greatfully acknowledged.
-S-tflMftSfr
(Lao Tzu)
Al zwervende vergaar ik
(Jan P. Strijbos)
Contents
List of abbreviations and symbols
6
Chapter 1
Introduction
9
Chapter 2
Calibration of the H decoupling field strength and
37
experimental evaluation of the specific RF absorption
1
rate in H decoupled human
Chapter 3
13
C MRS
Skin temperature increase during local exposure to
51
high power RF levels in humans
Chapter 4
Heteronuclear cross polarization for enhanced
sensitivity of in vivo
13
63
C MR spectroscopy on a clinical
1.5 T MR system
Chapter 5
Muscle glycogen recovery after exercise during
glucose and fructose intake monitored by
Chapter 6
13
C-NMR
Assessment of human muscle glycogen synthesis
and total glucose content by in vivo
13
79
93
C MR
spectroscopy under euglycemic clamp conditions
Summary
110
Samenvatting
112
Dankwoord
114
Curriculum vitae
116
Publications
117
List of abbreviations and symbols
18FDG
2-fluoro-2-deoxy-D-glucose
B0
static magnetic field
B1
pulsed magnetic field generated by transmit coil
B2
pulsed magnetic field generated by transmit coil 2 nd RF
channel
CHO
carbohydrate
CSI
chemical shift imaging
C W decoupling
continuous wave decoupling
Cyclpot-Vosing
cyclic polarization transfer - volume selective editing
DC
duty cycle
D EP T
distortionless enhancement by polarization transfer
FDA
food and drug administration
FID
free induction decay
FF
fructose feeding
G 6P
glucose-6-phosphate
ge-H M Q C
gradient enhanced heteronuclear multiple quantum
coherence
GF
glucose feeding
GRR
glycogen recovery rate
IN E PT
Insensitive Nucleus Enhancement by Polarization Transfer
ISIS
image selected in vivo spectroscopy
Luise
lovely user interface spectroscopy evaluation
MQF
multiple quantum filter
MR
magnetic resonance
MRI
magnetic resonance imaging
M RS
magnetic resonance spectroscopy
m-VL
muscle vastus lateralis
NID DM
non insulin dependent diabetes mellitus
NMR
nuclear magnetic resonance
NO E
nuclear Overhauser enhancement
PET
positron emission tomography
List of abbreviations and symbols
PO C E
proton observed carbon edited
ppm
parts per million
P R E C IS E L Y
PRoton Excited C -13 Im age-SElected in vivo Localized
spectroscopY
PRESS
point resolved spectroscopy
sup
P90
Ptotal
power required to generate a 90° flip angle at the surface
P used
power applied to coil
peak power applied to coil
Ql
quality factor loaded
Qu
quality factor unloaded
RGC
relative glycogen content
RF
radio frequency
rpm
revolutions per minute
SAR
specific absorption rate
S IN E P T
sine-dependent polarization transfer
SNR
S sup
signal to noise ratio
Stis
tissue specific absorption rate
T1
spin lattice relaxation time
T2
longitudinal or transverse relaxation time
Tend
end temperature reached after decoupling protocol
Tmax
maximum temperature reached during decoupling protocol
VOI
volume of interest
W A LT Z
W ideband Alternating-phase Low-power Technique for Zero
superficial specific absorption rate
residual splitting
W BGU
whole body glucose uptake
W m ax
W./total
to
maximum power output
total tissue weight within coil
g
gyromagnetic ratio
V
precession frequency
s
screening factor
Introduction
A.J. van den Bergh
Department of Radiology, University of Nijmegen, The Netherlands
History of MR
The phenomenon of nuclear magnetic resonance (NMR) was demonstrated for
the first time in 1946 independently by Bloch et al. and Purcell et al. ; in 1952 they
received the Nobel prize for their discovery (1, 2). The chemical shift, the
property of a small but specific displacement of the resonance frequency of a
particular nucleus in a different chemical compound made NMR to one of the
most powerful analytical tools in chemistry and biochemistry. Since the 1950’s
NMR is used as a tool for studying chemical structure, configuration, and
chemical reaction processes.
In 1973, it was Lauterbur, who gave the first demonstration of the concept of
magnetic resonance imaging (3). Pictures of fruit, animals and finally humans
were obtained later during the 70’s. In the same period Hoult et al. reported in
1974 on the application of NMR spectroscopy to intact, freshly excised muscle
from the leg of a rat (4). More studies followed on the isolated heart, liver and
other organs. Subsequently, the logical step from these tissue studies to in vivo
NMR spectroscopy of whole animals was made (5).
Since the first commercial MR scanners for human examinations became
available around 1981, both magnetic resonance imaging (MRI), and in vivo
magnetic resonance spectroscopy (MRS) rapidly evolved. MRI has become a
major imaging modality in radiology. Besides the use of MRI as a tool to study
the internal anatomy of the body, it has also been used to obtain functional
Chapter 1
information; i.e. of brain activity, several recent review articles have summarized
the current status on this topic (6-9).
With MRS one can have access to physiology and biochemistry of living human
tissue. The biochemical status of the human body can be assessed in a non
invasive manner, which makes it possible to perform longitudinal examinations to
study the dynamics of biochemical processes in the human body.
Basics of MR
A nucleus is composed of protons and neutrons. These nucleons have spins,
and the spin of a nucleus as a whole is the vector sum of the spins of the
individual nucleons. This vector sum varies from one nucleus to another, and
depends on the way nucleons are coupled to each other. If this vector sum is not
equal to zero, than the nucleus has a magnetic moment. A nucleus that possess
a magnetic moment can be used to perform an NMR experiment. The hydrogen
atom
H, with one proton in its nucleus is one of the most important nuclei in
biological MR.
W ithout the presence of an external magnetic field the spins of these nuclei are
randomly oriented, so there will be no net magnetization. In the presence of a
magnetic field, the nuclei will align parallel or anti-parallel along the applied field
axis. The parallel orientation has a slightly lower energy state, therefore more
nuclei will align parallel and produce a net magnetic moment (macroscopic
magnetization).
This magnetic moment is not exactly aligned with the external magnetic field but
it precesses around it. The frequency with which it precesses is given by the
Larmor equation.
V0 = yB0/2n
[1]
In which g is the gyromagnetic ratio (dependent on the type of nucleus), B0 is the
strength of the applied external magnetic field, and
v0
is the frequency of
precession (Larmor frequency). Both g and B0 determine the energy difference
10
Introduction
between the parallel and anti parallel states. A higher energy difference (higher
product of gB0) leads to a larger population difference between the states, and
thus to a proportionally higher sensitivity. This is one of the reasons why MR
spectroscopists keep buying more powerful magnets. Another advantage is the
improved spectral resolution at higher field strengths. This can be explained by
looking at equation 2.
V = g(B0 -oB0)/2rc
[2]
The screening factor s is introduced, it depends on the chemical environment of
each nucleus. From the equation it is clear that the frequency v is proportional
the external magnetic field B0. The effect of g on the frequency is large compared
to the effect of s. So resonance frequencies differ strongly going from one
nuclear species to another, and slight differences occur within one nuclear
species, these differences in frequency depending on the chemical environment
are called chemical shift.
In order to create an MR image or spectrum, the resonance condition must be
fulfilled. There must be a situation of alternating absorption and dissipation of
energy. By applying a radio frequency (RF) magnetic field at the Larmor
frequency “on resonance”, the nuclei can be placed in a higher energy state by
the absorption of the RF energy. W hen returning back to the low energy state,
the spins emit RF energy to the environment, which can be picked up by a
receiver coil. The application of different RF pulses and RF acquisition schemes
in combination with the use of magnetic field gradients can result in MR images
or spectra.
Isotopes of interest for clinical in vivo MR spectroscopy
The atomic nuclei that are potentially useful for biomedical in vivo MR
spectroscopy applications are given in table 1. with their MR related properties.
Brief descriptions of the
most commonly applied
nuclei for in vivo MR
spectroscopy studies are given below.
11
Chapter 1
1
H:
this nucleus has almost 100% natural abundance and is present in most
biochemicals. It has the highest intrinsic sensitivity of all stable nuclei, and
it is therefore a very interesting nucleus for in vivo MR spectroscopy.
Some important metabolites detectable by
H MR spectroscopy are:
choline compounds, citrate, creatine, glutamate, glutamine, lactate, myo
inositol and N-acetyl-aspartate. It has two drawbacks, the limited chemical
shift range and the need for water and lipid signal suppression. Its main
applications are in brain, muscle and prostate spectroscopy. (10-13)
31
P:
phosphorus has a 100% natural abundance and a reasonable sensitivity. It
is very suitable for the study of high energy phosphate metabolites and
other phosphorus containing metabolites such as phospho mono- and diesters. Applications of in vivo
31
P MR spectroscopy are in the study of
muscle, cardiac, and brain metabolism and also in monitoring tum or
therapy (14-24). Besides the study of metabolites,
31
P MR spectroscopy
can be used as a noninvasive technique to monitor the intracellular pH
(25-27).
13
C:
13
12
C has only 1.1% natural abundance ( C has an occurrence of over 98%
and no magnetic moment) and a low intrinsic sensitivity. It can be detected
in a large number of biochemically important compounds in a broad
spectral range. Furthermore, the ability to use selectively enriched
substrates for the study of metabolic pathways makes this nucleus
interesting for in vivo applications.
19
F:
the abundance of the
19
F nucleus is 100% and its sensitivity almost equals
that of protons. Because of its presence in tum or therapeutics, this
nucleus has a particular clinical interest (28-33).
In spite of the low sensitivity of
13
C, this nucleus is very well suited for obtaining
biochemically important information. This thesis is focused on the application of
in vivo
13
C MR spectroscopy in human investigations. In the next sections, the
current status of human in vivo
12
13
C MR spectroscopy is reviewed.
Introduction
Nucleus
Spin
g/2p
Natural Abundance
(MHz/Tesla)
(%)
1
Sensitivity vs. H
1H
1/2
42.57
99.98
1
13C
1/2
10.71
1.108
0.00025
14n
1
3.08
99.63
0.0019
15n
1/2
-4.31
0.37
0.0000068
17O
5/2
-5.77
0.037
0.000019
19f
1/2
40.05
100
0.85
3/2
11.26
100
0.13
1/2
17.24
100
0.83
3/2
1.99
93.1
0.001
23Na
31 p
39k
Table 1.
Spin, gyrom agnetic ratios, natural abundance and relative sensitivity com pared to proton, of
biological interesting nuclei.
Human metabolism studied by in vivo
13
C MR spectroscopy
Natural abundance:
Natural abundance
13
C MR spectroscopy is limited to highly concentrated
compounds such as triglycerides and glucose units in glycogen, because of the
low intrinsic sensitivity of this technique.
The resonances of triglycerides are dispersed over a broad spectral range.
1
Signals that co-resonate in the H spectrum can be resolved in the
which makes
13
13
C spectrum,
C the favorable technique for the study of triglycerides, despite its
lower sensitivity. Special interest goes to the degree of saturation of lipids (34). It
has been shown that in neonatal development the amount of unsaturated fatty
acids increase with maturity (35). In this study similar differences were found for
13
Chapter 1
gestational age. Preterm infants showed a relatively lower unsaturated fatty acid
content compared to full term infants. The relation between diet and adipose
tissue fatty acid composition was also studied. The ratio of unsaturated to total
fatty acid composition in adipose tissue correlated with the same ratio as in diet
fat, after a minimal diet period lasting half a year (36). Another study revealed
differences in the adipose tissue composition of vegans compared to vegetarians
and omnivores (37). Vegans showed a higher level of unsaturated fatty acids.
Differences in the degree of saturation of fatty acids were reported of carcinoma
compared to non-cancerous tissue of human breast (38). The comparison of
cystic fibrosis patients with healthy volunteers by in vivo
13
C MR spectroscopy
revealed a difference in the amount of polyunsaturated fatty acid content (39).
More challenging in natural abundance in vivo
13
C MR spectroscopy is the
detection of metabolites such as glycogen, creatine, citrate, myo-inositol. Jue et
al. demonstrated that the C-1 signal of glycogen is observable in humans, the
other glycogen signals are less well resolved (40).
13
C MR spectroscopy has
emerged as an appropriate noninvasive alternative for biopsy methods for the
detection of muscle glycogen (41). Several studies report on muscle glycogen
depletion and repletion after exercise (42-48). Price et al. investigated the
glycogen resynthesis after depletion and found an insulin dependent and insulin
independent phase after depletion up to 25% (45). Other studies focused on the
glycogen resynthesis with carbohydrate intake during the recovery period (46
48). Glucose feeding during recovery resulted in a faster resynthesis rate
compared to fructose ingestion (47).
Natural abundance detection of glycogen is also possible in vivo in the human
liver (42, 49-53).
A more clinical application of the study of glycogen metabolism is in glycogen
storage disease, in which muscular or liver glycogen content can be studied noninvasively by natural abundance
14
13
C MR spectroscopy (54-57).
Introduction
Other potentially clinical important metabolites that can be detected by in vivo
natural abundance
13
C MR spectroscopy are citrate (58), myo-inositol (59-61)
and creatine (42, 47, 62).
13C labeling:
One can benefit from the low natural abundance of the
body and that is by the application of selectively
the administration of
13
13
13
C nucleus in the human
C enriched substrates. After
C labeled substrates the observation of the applied label
and its metabolic intermediates or end products can be used to study fluxes
through metabolic pathways. These techniques can be applied to study brain,
liver and muscle metabolism.
Beckmann et al. demonstrated in 1991 that labeled C-1 glucose and its labeled
metabolic products C-2, C-4 and C-3 glutamate/glutamine and lactate could be
detected in the human brain in vivo during hyperglycemic glucose clamping (63).
1
In the same year, it was shown by H detected
13
C MR spectroscopy that glucose
was actively metabolized to lactate in a patient with a 32 day old cortical infarct
(64). Glucose steady state concentrations and glucose transport activity into the
brain were also determined with the use of labeled
13
C-1-glucose in combination
with in vivo brain MR spectroscopy (65, 66). Other in vivo brain MR spectroscopy
studies demonstrated that this technique can provide more information than
positron emission tomography (PET) regarding the metabolic processes beyond
the uptake of glucose into the brain, the metabolic flux from glucose to glutamate
could be followed (67, 68). Using a mathematical model, several metabolic rates
for the human neocortex could be determined from in vivo
13
C MR spectroscopy
data (69). Shulman et al. discussed the role of MR spectroscopy and other MR
techniques in the study of brain function (70).
The incorporation of labeled C-1-glucose has also been studied in the liver (71,
72). It was demonstrated that liver glycogen synthesis and breakdown occur
simultaneously during net glycogen synthesis (73). Studies comparing healthy
subjects with patients with poorly controlled insulin dependent diabetes mellitus
15
Chapter 1
(NIDDM)
demonstrate
that
these
patients
have
an
increased
hepatic
gluconeogenesis and relative decreased rates of hepatic pyruvate oxidation (74).
The fate of infused labeled
13
C-1-glucose in muscle tissue is important in the
study of exercise and diabetes. In 1989, Jue et al. showed that under conditions
of hyperglycemia and hyperinsulinemia, a majority of the infused glucose was
converted to muscle glycogen in normal man (76). Using the same method it was
shown that defects in muscle glycogen synthesis have a dominant role in the
insulin resistance that occurs in patients with NIDDM (77). It was demonstrated
that the degradation and synthesis of muscle glycogen can occur simultaneously
during
prolonged
low-intensity
exercise
(75).
Combined
13
C
/
31
P
MR
spectroscopy suggests that the post-transport steps do not play a significant role
in the control of muscle glucose disposal, and that glucose transport/hexokinase
activity maybe impaired in patients with NIDDM (78-81). Similar conclusions were
drawn for insulin resistant obese subjects (82).
All of the human in vivo
13
C MR spectroscopy studies mentioned above used
labeled glucose as a substrate for infusion. There is a great potential in the use
of other labeled compounds as currently in use in in vivo animal studies or
isolated organ studies. For example to study the pharmacology of certain types
of drugs (83-86). Also the use of multi-labeled compounds can be of clinical
interest because of the additional information that can be obtained due to the
spin spin interaction of adjacent
In vivo
13
13
C nuclei (87-90).
C MR spectroscopy: double resonance
Most of the metabolites studied by in vivo
13
C MR spectroscopy have attached
protons. The spin spin interaction that exists between neighboring
nuclei results in a multiplet splitting in the
obtained in the
the
13
13
13
1
H and
13
C
C spectrum. The multiplet structure
C spectrum is dependent on the number of attached protons to
C nucleus. If the number of attached protons equals n, than the multiplet
consists of n+1 peaks, thus information about the molecular structure can be
16
Introduction
obtained. However, these multiplets complicate spectrum analysis and decrease
sensitivity. In order to utilize the full potential of in vivo
1
13
C MR spectroscopy it is
13
necessary to remove these H- C multiplet splittings by proton decoupling during
the
13
C signal acquisition period. The spectrum obtained with
1
H decoupling is
simplified and sensitivity is enhanced by gathering all the intensity of a multiplet
into a singlet.
1
13
H- C decoupling and other double resonance techniques require some special
hardware which is not standard installed on a clinical imaging system, such as a
second radio frequency channel, filters to ensure signal separation and a dual
frequency high sensitivity coil (see below).
The application of a radio frequency decoupling field for in vivo studies in
humans is of concern since it could lead to tissue heating (91). At the present
time, two levels of concern are issued by the US Food and Drug Administration
(FDA): guidelines for specific absorption rate (SAR) and temperature increase
induced by RF (92).
Selective decoupling of a single proton frequency requires minimal energy, this
method is often applied for the detection of the C-1 resonance of glycogen in
liver and muscle (43, 49). This approach is very useful if one is interested in one
particular metabolite signal, other signals present in the spectrum remain proton
coupled.
Broadband proton decoupling results in higher SAR levels, but it may help to
reveal additional metabolite signals and to uncover resonances otherwise
obscured by the intense triglyceride signals. Studies performed at the clinical
field strength of 1.5T indicate that broadband proton decoupling using W ALTZ
sequences is possible within FDA guidelines (42, 54). Broadband decoupling at
higher field strength requires more power, not only because of the broader
chemical shift range to be covered, but also due to the higher frequency (f),
according to Röschmann [SAR] ^ f2145 (93). Bomsdorf et al. suggested that
broadband proton decoupling at 4T would violate safety guidelines (51).
Recently, Gruetter et al. demonstrated the possibility of broadband proton
17
Chapter 1
decoupling
at 4T
using
a quadrature
proton
coil
(94,
95).
For these
measurements at 4T the relationship between SAR and frequency holds true.
However, recently this relationship has been refuted for ultra high magnetic field
strengths on a whole body 8T system (96).
The RF field inhomogeneity of surface coils leads to an inefficient use of RF
power required for decoupling (97, 98). B2 insensitive hyperbolic secant pulses
used for decoupling can result in lower SAR values for broadband decoupling
compared to W ALTZ type sequences (99, 100).
Application of a decoupling RF field can also result in Nuclear Overhauser
Enhancement (NOE), so sensitivity is further improved. The effect of NOE and
decoupling were investigated for phantoms and lipid tissue of the human calf and
breast (101). Bi-level irradiation for optimal NOE and decoupling as used in in
31
13
vivo P MR spectroscopy are not often used in C MR spectroscopy because of
the increased SAR level (102, 103).
Another means of signal enhancement by double resonance techniques is
1
13
transfer of polarization. Polarization transfer from H to C can result in a signal
1 13
enhancement of g H/g C » 4. The highest possible signal can be obtained when
excitation and detection are performed on the sensitive proton nucleus, this is
the so-called indirect detection, enhancements of (g1H/g13C)5/2 » 32 can be
achieved theoretically. Only a limited number of studies report on indirect
detection of
13
C in humans in vivo. Knüttel et al. demonstrated that indirect
detection of the unsaturated fatty acid carbon signals and glycogen is possible in
vivo using Cyclpot-Vosing (104, 105). This volume selective technique is based
on multiple-quantum filtering (MQF) and cyclic polarization transfer. Indirect
detection was also applied in the study of labeled compounds in normal brain
metabolism and in a patient with stroke (64, 67). A modified proton observe
carbon edited (POCE) sequence was recently used for the natural abundance
detection of brain N-acetyl aspartate (106). As for the use of labels, the
development in techniques is ahead in animal studies. A very promising
technique which has yet only been applied in vivo in cat brain to monitor
18
13
C-1
Introduction
glucose and its metabolites is the gradient-enhanced heteronuclear multiple
quantum coherence (ge-HMQC) technique (107).
As shown by the studies mentioned above, indirect detection offers high
sensitivity, but it also has some disadvantages, it requires a good water
suppression and it has a lower resolution compared to detection at the carbon
nucleus.
Several methods are in use for the transfer of polarization from
1
H to
13
C for
sensitivity enhancement. The sine-dependent polarization transfer (SINEPT)
technique was applied to humans in vivo for the detection of glycogen and fatty
acid resonances (108, 109). This sequence requires no 180° pulses and due to
its sequential arrangement of RF pulses it can be implemented on a single
channel MR system. Distortionless enhancement by polarization transfer (DEPT)
has also been applied in vivo to humans (95, 110). First attempts of Insensitive
Nucleus Enhancement by Polarization Transfer (INEPT) were shown by Kreis et
al.
(111). An alternative approach,
not based
on pulse
interrupted
free
precession, but by which transfer of magnetization is achieved by heteronuclear
isotropic mixing, has recently been reported to be feasible in animals and
humans (112, 113). An adiabatic variant of this heteronuclear cross polarization
has been proposed for in vivo applications (114).
These recent developments and improvements in double resonance in vivo
13
C
MR spectroscopy will facilitate the applications of these techniques in the clinical
situation. Due to these developments a debate started comparing 18FDG PET
with
13
C-glucose MR spectroscopy (115, 116). Both techniques have their
advantages and disadvantages and it is the research question that should
determine the technique of choice.
Radio Frequency coils for in vivo
13
C MR spectroscopy
Radio frequency coils are used for transmitting and/or receiving. A crucial
problem for in vivo
13
C MR spectroscopy applied to humans is the need for
19
Chapter 1
proton decoupling with limited RF deposition so that safety guidelines are not
exceeded. To perform a
13
C in vivo experiment, a coil configuration is required
13
with the highest possible sensitivity for
C, and an efficient
1
H coil for
decoupling, while interactions between coils must be minimized.
Therefore, surface coils are often used for
13
C because of their good filling factor
which yields a good signal to noise ratio. In addition, these types of coils allow a
crude form of localization because of their inhomogeneous B1 field. For the
proton decoupler coil several arrangements are possible in combination with the
carbon surface coil. A circular concentric coplanar configuration with a inner
13
C
coil and an outer H coil has been used in several studies (49, 54, 101, 117). A
problem that arises with these type of coils is the strong interaction between the
coils, the RF of the proton coil is partially blocked by the
13
C inner coil which can
result in excessive power requirements for decoupling.
To reduce coil interactions, an orthogonal arrangement can be used. Figure-8
and
butterfly
shaped
coils
are
reported
to
obtain
orthogonality
in
configurations (42, 47, 109, 118). The rapidly decreasing B2 field along the
coil
13
C
coil axis can result in high local SAR values which is of concern with human
application (98).
Alternatively, double tuned coils can be used which lack the blockage of the
proton RF (119). Another advantage of these type of coils is the matching of the
RF fields which
is important in polarization transfer techniques (112). A
disadvantage of double tuned coils is that it is difficult to achieve optimal
performance for both nuclei and sufficient channel separation.
A more recent development, is a quadrature proton coil combined with a circular
13
C coil (94). This coil combines the two important properties of a high sensitivity
for
13
C and an efficient proton decoupling.
Volume coils provide a homogeneous RF field and are therefore interesting for
polarization transfer experiments. A combination of a volume proton coil with a
13
C surface coil was used for polarization transfer by SINEPT (108). A birdcage
transm it coil in combination with a double tuned surface receiver coil was used in
20
Introduction
the VOSING technique (104). Heteronuclear cross polarization was performed
with a combination of a birdcage proton coil and a half volume
13
C coil (113).
Spatial localization for 13C MRS
As mentioned above, surface coils provide excellent signal to noise ratios and a
crude form of localization. However, the volume sampled by a surface coil is not
well defined. Therefore, additional techniques are required to obtain spectra from
a volume of interest (VOI), without contamination with signal from outside the
selected VOI.
In in vivo
13
C MR spectroscopy the intense signals originating from superficial
lipid tissue are often unwanted. Suppression of these signals from outside the
VOI can be performed in several ways. A simple method is by the application of
a rectangular pulse with a high flip angle 180°- 200° in the plane of the surface
coil (54). An alternative for this method is the use of an adiabatic rapid half
passage excitation preceded by a low flip angle rectangular pulse followed by a
dephasing gradient (42, 47). Tailored pulses for the detection of wanted signals
and suppression of unwanted can also be used (49).
In the above described techniques the VOI is not sharply delineated, only
unwanted signals form the surface are suppressed. A well defined VOI can be
obtained by the application of frequency selective RF pulses in combination with
B0 gradients. ISIS (image selected in vivo spectroscopy) (120) is a suitable single
voxel technique for
13
C because T2 relaxation losses are limited, another
advantage is that signals are not adversely affected by J modulation as in spin
echo sequences. ISIS was successfully used to obtain a 3D localized spectrum
of the human brain (59). Due to the large chemical shift range of the
13
C nucleus
a chemical shift displacement error occurs when the technique of frequency
selective excitation in combination with a B0 gradient is applied for localization. In
localization by chemical shift imaging (CSI), this chemical shift displacement
error is much sm aller (121). Another advantage of CSI is that multiple voxels are
21
Chapter 1
obtained within a single measurement. The use of
13
C 1D CSI was demonstrated
in vivo in humans (122). The detection of myo-inositol in the human brain was
performed by
13
C 3D CSI, showing that low concentrated compounds can be
detected in a well defined volume (61).
Another way to circumvent the large chemical shift displacement error in
13
C MR
spectroscopy is by excitation of the H nucleus followed by polarization transfer
to
13
1
C. In this way, the precise localization on H, the signal gain by polarization
transfer and the high spectral resolution of the
13
C nucleus are combined. Using
this approach, localized spectra of the human calf muscle could be obtained
(110). Gruetter et al. used localization based on ISIS, followed by DEPT
polarization transfer on the human brain, the acronym PRECISELY is proposed
(PRoton Excited C-13 Image-SElected in vivo Localized spectroscopY) (95).
Kreis et al. demonstrated that the combination of PRESS and INEPT was
feasible (111). Indirect detection methods (see double resonance section) also
allow for the precise localization via the H nucleus.
Quantification
In in vivo
13
C MR spectroscopy often relative changes of metabolite levels are
monitored. However, in many cases absolute quantification of metabolite levels
is desired. Absolute quantification can be performed by using an external
reference solution of known concentration. Taylor et al. compared muscle
glycogen concentrations obtained with MR using external referencing with biopsy
results
and
demonstrated
a
high
accuracy
for
the
MR
spectroscopy
determination (41). Absolute quantification by comparing data with a phantom
has been demonstrated to be feasible for brain myo-inositol (59), for muscle
glucose (80) and liver glycogen (57).
Tissue concentration determination of metabolites can also be made by internal
referencing, using a biochemical compound of known concentration. The
advantage of this method is that the reference signal originates from the same
22
Introduction
volume. The compounds under study should be homogeneously distributed over
the tissue and completely MR visible. Creatine was used as an internal reference
to quantify muscle glycogen (47, 123)
Absolute quantification of metabolites is difficult in spectra obtained with
polarization transfer techniques. W hether an internal or external reference is
used, the efficiency of polarization transfer of the metabolite under study and of
the reference must be known exactly, in vivo efficiency levels are difficult to
obtain.
Research goals
For clinical acceptance of in vivo
13
C MR spectroscopy it is important that
techniques for data collection and analysis become possible in the clinical
environment. Nearly all the research in in vivo
13
C MR spectroscopy on humans
has been performed on experimental MR systems at high magnetic field
strengths > 2T. However, the standard clinical MR system, available in most
clinical research institutes operates at 1.5T. The work presented in the next
chapters was performed on a modified clinical imaging system; equipped with a
second RF transm it channel. The main purposes of the current work are: 1) to
optimize the
13
C MR spectroscopy technique for human applications while
ensuring patient safety; 2) to explore the utilization of this technique in human
physiology and pathology related to glycogenesis.
Outline of this thesis
chapter 2:
A method was developed to optimize decoupling power settings for
surface coils by which RF deposition in the body could be reduced.
Information obtained by this method was also used to calculate the
amount of energy deposited in the tissue at the position of the
highest RF field.
23
Chapter 1
Chapter 3: The thermoregulatory response of the skin was investigated during
exposure to RF radiation with a surface coil at several power levels.
The skin temperature of the calf muscle was monitored in healthy
male subjects.
Chapter 4: The potential of heteronuclear cross polarization was investigated.
Phantom studies were performed, and in vivo studies on the human
leg and on a neonatal piglet brain. The latter study was performed in
combination with the introduction of labeled
13
C-1-glucose.
Chapter 5: Glycogen recovery rates were studied in healthy male subjects after
depletion. A comparison was made between glucose and fructose
feeding during the recovery period.
Chapter 6:
Insulin stimulated glycogenesis in muscle was studied in subjects
ranging from insulin sensitive to insulin resistant, by the combination
of in vivo
13
C MR spectroscopy and infusion of
13
C labeled glucose.
In addition, the effect of treatment with troglitazone on insulin
resistance was investigated.
References
1.
E. M. Purcell, H. C. Torrey, R. V. Pound, Resonance absorption by nuclear
m agnetic moments in a solid. Phys. Rev., 69, 37-38, (1946).
2.
F. Bloch, W. W . Hansen, M. Packard, The nuclear induction experiment. Phys.
Rev., 70, 474-485, (1946).
3.
P. C. Lauterbur, Image formation by induced local interactions: examples employing
nuclear magnetic resonance. Nature, 242, 190-191, (1973).
4.
D. I. Hoult, S. J. Busby, D. G. Gadian, G. K. Radda, R. E. Richards, P. J. Seeley,
Observation of tissue metabolites using 31P nuclear magnetic resonance. Nature,
252, 285-287, (1974).
5.
J. J. Ackerman, T. H. Grove, G. G. W ong, D. G. Gadian, G. K. Radda, Mapping of
metabolites in whole animals by 31P NMR using surface coils. Nature, 283, 167
170, (1980).
24
Introduction
6.
7.
8.
9.
10.
11.
12.
13.
14.
15.
16.
S. G. Kim, K. Ugurbil, Functional magnetic resonance imaging of the human brain.
J. Neurosci. Methods,74, 229-243, (1997).
P. A. Bandettini, E. C. Wong, Magnetic resonance imaging of human brain function.
Principles, practicalities, and possibilities. Neurosurg. Clin. N. Am., 8, 345-371,
(1997).
S. Rabe-Hesketh, E. T. Bullmore, M. J. Brammer, The analysis of functional
magnetic resonance images. Stat. Methods. Med. Res., 6 , 215-237, (1997).
S. Ogawa, R. S. Menon, S. G. Kim, K. Ugurbil, On the characteristics of functional
magnetic resonance imaging of the brain. Annu. Rev. Biophys. Biomol. Struct., 27,
447 - 474 , (1998).
F. A. Howe, R. J. Maxwell, D. E. Saunders, M. M. Brown, J. R. Griffiths, Proton
spectroscopy in vivo. Magn.Reson.Q., 9, 31-59, (1993).
B. D. Ross, S. Bluml, R. Cowan, E. Danielsen, N. Farrow, R. Gruetter, In vivo
magnetic resonance spectroscopy of human brain: the biophysical basis of
dementia. Biophys. Chem., 68, 161-172, (1997).
A. Heerschap, G. J. Jager, M. van der Graaf, J. O. Barentsz, J. J. de la Rosette, G.
O. Oosterhof, E. T. Ruijter, S. H. Ruijs, In vivo proton MR spectroscopy reveals
altered metabolite content in malignant prostate tissue. Anticancer Res., 17, 1455
1460, (1997).
J. Kurhanewicz, D. B. Vigneron, S. J. Nelson, H. Hricak, J. M. MacDonald, B.
Konety, P. Narayan, Citrate as an in vivo marker to discriminate prostate cancer
from benign prostatic hyperplasia and normal prostate peripheral zone: detection
via localized proton spectroscopy. Urology, 45, 459-466, (1995).
D. J. Bryant, G. M. Bydder, H. A. Case, A. G. Collins, I. J. Cox, A. Makepeace, J. M.
Pennock, Use of phosphorus-31 MR spectroscopy to monitor response to
chemotherapy in non-Hodgkin lymphoma. J. Comput. Assist. Tomogr., 12, 770-774,
(1988).
B. Chance, Applications of 31P NMR to clinical biochemistry. Ann. N. Y. Acad. Sci.,
428, 318-332, (1984).
C. B. Higgins, M. Saeed, M. Wendland, W. M. Chew, Magnetic resonance
spectroscopy of the heart. Overview of studies in animals and man. Invest. Radiol.,
24, 962-968, (1989).
25
Chapter 1
17. E. F. Hoffenberg, P. Kozlowski, T. A. Salerno, R. Deslauriers, Evaluation of cardiac
31P magnetic resonance spectroscopy: reviewing NMR principles. J. Surg. Res.,
62, 135-143, (1996).
18. X. Maldonado, J. Alonso, J. Giralt, M. G. Cucurella, J. M. del Campo, A. Rovira, E.
Felip, J. Capellades, E. Grive, D. Rubio, J. Gili, 31Phosphorus magnetic resonance
spectroscopy in the assessment of head and neck tumors . Int. J. Radiat. Oncol.
Biol. Phys., 40, 309-312, (1998).
19. L. f. R, R. Sauter, H. Kolem, A. Haase, M. von Kienlin, Localized Spectroscopy from
Anatomically Matched Compartments: Improved Sensitivity and Localization for
Cardiac 31P MRS in Humans. J. Magn. Reson., 134, 287-299, (1998).
20. G. K. Radda, R. D. Oberhaensli, D. J. Taylor, The biochemistry of human diseases
as studied by 31P NMR in man and animal models. Ann. N. Y. Acad. Sci., 508,
300-308, (1987).
21. O. M. Redmond, J. P. Stack, O. C. NG, D. N. Carney, P. A. Dervan, B. J. Hurson, J.
T. Ennis, 31P MRS as an early prognostic indicator of patient response to
chemotherapy. Magn. Reson. Med., 25, 30-44, (1992).
22. S. R. Smith, P. A. Martin, J. M. Davies, R. H. Edwards, A. N. Stevens, The
assessment of treatment response in non-Hodgkin's lymphoma by image guided
31P magnetic resonance spectroscopy. Br. J. Cancer, 61, 485-490, (1990).
23. M. Delivoria Papadopoulos, J. E. DiGiacomo, 31P nuclear magnetic resonance
spectroscopy in the human neonatal brain. Semin. Perinatol., 14, 248-257, (1990).
24. R. Gruetter, C. Fusch, E. Martin, C. Boesch, Determination of saturation factors in
31P NMR spectra of developing human brain. Magn. Reson. Med., 29(1), 7-11,
(1993).
25. W. Negendank, Studies of human tumors by MRS: a review. NMR Biomed., 5, 303
324, (1992).
26. K. E. Jensen, C. Thomsen, O. Henriksen, In vivo measurement of intracellular pH in
human brain during different tensions of carbon dioxide in arterial blood. A 31PNMR study. Acta. Physiol. Scand., 134, 295-298, (1988).
27. K. Iwanaga, M. Sakurai, T. Minami, Y. Kato, K. Sairyo, Y. Kikuchi, Is the intracellular
pH threshold an anaerobic threshold from the view point of intracellular events?: a
brief review. Appl. Human. Sci., 15, 59-65, (1996).
26
Introduction
28. C. W. Li, O. Gonen, Simultaneous 3D NMR spectroscopy of fluorine and
phosphorus in human liver during 5-fluorouracil chemotherapy. Magn. Reson. Med.,
35, 841-847, (1996).
29. J. Murphy-Boesch, C. W. Li, L. He, K. A. Padavic-Shaller, W. Negendank, T. R.
Brown, Proton-decoupled 19F spectroscopy of 5-FU catabolites in human liver.
Magn. Reson. Med., 37, 321-326, (1997).
30. H. P. Schlemmer, P. Bachert, W. Semmler, P. Hohenberger, P. Schlag, W. J.
Lorenz, G. van Kaick, Drug monitoring of 5-fluorouracil: in vivo 19F NMR study
during 5-FU chemotherapy in patients with metastases of colorectal
adenocarcinoma. Magn. Reson. Imaging, 12, 497-511, (1994).
31. W. Wolf, M. J. Albright, M. S. Silver, H. Weber, U. Reichardt, R. Sauer, Fluorine-19
NMR spectroscopic studies of the metabolism of 5- fluorouracil in the liver of
patients undergoing chemotherapy. Magn. Reson. Imaging, 5, 165-169, (1987).
32. Y. J. Kamm, A. Heerschap, G. Rosenbusch, I. M. Rietjens, J. Vervoort, D. J.
Wagener, 5-Fluorouracil metabolite patterns in viable and necrotic tumor areas of
murine colon carcinoma determined by 19F NMR spectroscopy. Magn. Reson.
Med., 36, 445-450, (1996).
33. V. J. Kamm, I. M. Rietjens, J. Vervoort, A. Heerschap, G. Rosenbusch, H. P. Hofs,
D. J. Wagener, Effect of modulators on 5-fluorouracil metabolite patterns in murine
colon carcinoma determined by in vitro 19F nuclear magnetic resonance
spectroscopy. Cancer Res., 54, 4321-4326, (1994).
34. C. T. Moonen, R. J. Dimand, K. L. Cox, The noninvasive determination of linoleic
acid content of human adipose tissue by natural abundance carbon-13 nuclear
magnetic resonance. Magn. Reson. Med., 6 , 140-157, (1988).
35. E. L. Thomas, J. D. Hanrahan, M. Ala-Korpela, G. Jenkinson, D. Azzopardi, R. A.
Iles, J. D. Bell, Noninvasive characterization of neonatal adipose tissue by 13C
magnetic resonance spectroscopy. Lipids, 32, 645-651, (1997).
36. N. Beckmann, J. J. Brocard, U. Keller, J. Seelig, Relationship between the degree
of unsaturation of dietary fatty acids and adipose tissue fatty acids assessed by
natural-abundance 13C magnetic resonance spectroscopy in man [published
erratum appears in Magn. Reson. Med., 1993 Apr;29(4):581]. Magn. Reson. Med.,
27, 97-106, (1992).
27
Chapter 1
37. E. L. Thomas, G. Frost, M. L. Barnard, D. J. Bryant, S. D. Taylor-Robinson, J.
Simbrunner, G. A. Coutts, M. Burl, S. R. Bloom, K. D. Sales, J. D. Bell, An in vivo
13C magnetic resonance spectroscopic study of the relationship between diet and
adipose tissue composition. Lipids, 31, 145-151, (1996).
38. T. A. Victor, A. Bergman, R. H. Knop, Detecting fatty acids of dietary origin in
normal and cancerous human breast tissue by 13C nuclear magnetic resonance
spectroscopy. Br. J. Cancer, 68, 336-341, (1993).
39. R. J. Dimand, C. T. Moonen, S. C. Chu, E. M. Bradbury, G. Kurland, K. L. Cox,
Adipose tissue abnormalities in cystic fibrosis: noninvasive determination of monoand polyunsaturated fatty acids by carbon-13 topical magnetic resonance
spectroscopy. Pediatr. Res. 24, 243-246, (1988).
40. T. Jue, J. A. Lohman, R. J. Ordidge, R. G. Shulman, Natural abundance 13C NMR
spectrum of glycogen in humans. Magn. Reson. Med., 5, 377-379, (1987).
41. R. Taylor, T. B. Price, D. L. Rothman, R. G. Shulman, G. I. Shulman, Validation of
13C NMR measurement of human skeletal muscle glycogen by direct biochemical
assay of needle biopsy samples. Magn. Reson. Med., 27, 13-20, (1992).
42. A. Heerschap, P. R. Luyten, J. I. van der Heyden, L. J. Oosterwaal, J. A. den
Hollander, Broadband proton decoupled natural abundance 13C NMR
spectroscopy of humans at 1.5 T. NMR Biomed., 2, 124-132, (1989).
43. M. J. Avison, D. L. Rothman, E. Nadel, R. G. Shulman, Detection of human muscle
glycogen by natural abundance 13C NMR. Proc. Natl. Acad. Sci. USA, 85, 1634
1636, (1988).
44. T. B. Price, D. L. Rothman, M. J. Avison, P. Buonamico, R. G. Shulman, 13C-NMR
measurements of muscle glycogen during low-intensity exercise. J. Appl. Physiol.,
70, 1836-1844, (1991).
45. T. B. Price, D. L. Rothman, R. Taylor, M. J. Avison, G. I. Shulman, R. G. Shulman,
Human muscle glycogen resynthesis after exercise: insulin- dependent and independent phases. J. Appl. Physiol., 76, 104-111, (1994).
46. K. T. Moriarty, D. G. O. McIntryre, K. Bingham, R. Coxon, P. M. Glover, P. L.
Greenhaff, I. A. Macdonald, H. S. Bachelard, P. G. Morris, Glycogen resynthesis in
liver and muscle after exercise: measurement of the rate of resynthesis by 13C
magnetic resonance spectroscopy. Magma., 2, 429-432, (1994).
28
Introduction
47. A. J. van den Bergh, S. Houtman, A. Heerschap, N. J. Rehrer, H. J. van den
Boogert, B. Oeseburg, M. T. Hopman, Muscle glycogen recovery after exercise
during glucose and fructose intake monitored by 13C-NMR. J. Appl. Physiol., 81,
1495-1500, (1996).
48. R. Taylor, T. B. Price, L. D. Katz, R. G. Shulman, G. I. Shulman, Direct
measurement of change in muscle glycogen concentration after a mixed meal in
normal subjects. Am. J. Physiol., 265, E224-E229, (1993).
49. T. Jue, D. L. Rothman, B. A. Tavitian, R. G. Shulman, Natural-abundance 13C NMR
study of glycogen repletion in human liver and muscle. Proc. Natl. Acad. Sci. USA,
, 1439-1442, (1989).
50. P. Jehenson, G. Bloch, Elimination of surface signals by a surface-spoiling
magnetic field gradient. Theoretical optimization and application to human in vivo
NMR spectroscopy. J. Magn. Reson., 94, 59-72, (1991).
51. H. Bomsdorf, T. Helzel, D. Kunz, P. Roschmann, O. Tschendel, J. Wieland,
Spectroscopy and imaging with a 4 tesla whole-body MR system . NMR Biomed., 1,
151-158, (1988).
52. H. Ikehira, T. Obata, M. Koga, K. Yoshida, Human hepatic carbohydrate
metabolism. Dynamic observation using 13C MRS without proton decoupling. Acta.
Radiol., 38, 998-1002, (1997).
53. H. Barfuss, H. Fischer, D. Hentschel, R. Ladebeck, A. Oppelt, R. Wittig, W. Duerr,
R. Oppelt, In vivo magnetic resonance imaging and spectroscopy of humans with a
4 T whole-body magnet. NMR Biomed., 3, 31-45, (1990).
54. N. Beckmann, J. Seelig, H. Wick, Analysis of glycogen storage disease by in vivo
13C NMR: comparison of normal volunteers with a patient. Magn. Reson. Med., 16,
150-160, (1990).
55. P. Jehenson, D. Duboc, G. Bloch, M. Fardeau, A. Syrota, Diagnosis of muscular
glycogenosis by in vivo natural abundance 13C NMR spectroscopy. Neuromuscul.
Disord., 1, 99-101, (1991).
56. P. Labrune, P. Jehenson, A. Syrota, M. Odievre, In vivo 13C-NMR evaluation of
glycogen content in a patient with glycogen storage disease. J. Inherit. Metab. Dis.,
15, 723-726, (1992).
86
29
Chapter 1
57. W. Roser, N. Beckmann, U. Wiesmann, J. Seelig, Absolute quantification of the
hepatic glycogen content in a patient with glycogen storage disease by 13C
magnetic resonance spectroscopy. Magn. Reson. Imaging., 14, 1217-1220, (1996).
58. L. O. Sillerud, K. R. Halliday, R. H. Griffey, C. Fenoglio Preiser, S. Sheppard, In vivo
13C NMR spectroscopy of the human prostate. Magn. Reson. Med., 8, 224-230,
(1988).
59. R. Gruetter, D. L. Rothman, E. J. Novotny, R. G. Shulman, Localized 13C NMR
spectroscopy of myo-inositol in the human brain in vivo. Magn. Reson. Med., 25,
204-210, (1992).
60. A. J. van den Bergh, H. J. van den Boogert, H. Heerschap. Natural abundance 13C
CSI of the human brain, in "SMR 2nd Meeting, San Francisco, 1994," p. 567
61. A. J. van den Bergh, H. J. van den Boogert, H. Heerschap. In vivo three
dimensional 13C chemical shift imaging of the human brain, in "ISMRM 4th Annual
Meeting, New York, 1996," p. 1215
62. N. Beckmann, In vivo 13C spectroscopy in humans, in "NMR basic principles and
progress vol. 28", 74-99, Springer-Verlag, Berlin Heidelberg,1992.
63. N. Beckmann, I. Turkalj, J. Seelig, U. Keller, 13C NMR for the assessment of
human brain glucose metabolism in vivo. Biochemistry., 30, 6362-6366, (1991).
64. D. L. Rothman, A. M. Howseman, G. D. Graham, O. A. Petroff, G. Lantos, P. B.
Fayad, L. M. Brass, G. I. Shulman, R. G. Shulman, J. W. Prichard, Localized proton
NMR observation of [3-13C]lactate in stroke after [1-13C]glucose infusion. Magn.
Reson. Med., 21, 302-307, (1991).
65. R. Gruetter, E. J. Novotny, S. D. Boulware, D. L. Rothman, G. F. Mason, G. I.
Shulman, R. G. Shulman, W. V. Tamborlane, Direct measurement of brain glucose
concentrations in humans by 13C NMR spectroscopy. Proc. Natl. Acad. Sci USA,
89, 1109-1112, (1992).
66 . R. Gruetter, E. J. Novotny, S. D. Boulware, D. L. Rothman, G. F. Mason, G. I.
Shulman, W. V. Tamborlane, R. G. Shulman, Non-invasive measurements of the
cerebral steady-state glucose concentration and transport in humans by 13C
nuclear magnetic resonance. Adv. Exp. Med. Bio.,l 331, 35-40, (1993).
67. D. L. Rothman, E. J. Novotny, G. I. Shulman, A. M. Howseman, O. A. Petroff, G.
Mason, T. Nixon, C. C. Hanstock, J. W. Prichard, R. G. Shulman, 1H-[13C] NMR
30
Introduction
68 .
69.
70.
71.
72.
73.
74.
75.
76.
measurements of [4-13C]glutamate turnover in human brain. Proc. Natl. Acad. Sci.
USA, 89, 9603-9606, (1992).
R. Gruetter, E. J. Novotny, S. D. Boulware, G. F. Mason, D. L. Rothman, G. I.
Shulman, J. W. Prichard, R. G. Shulman, Localized 13C NMR spectroscopy in the
human brain of amino acid labeling from D-[1-13C]glucose. J. Neurochem., 63,
1377-1385, (1994).
G. F. Mason, R. Gruetter, D. L. Rothman, K. L. Behar, R. G. Shulman, E. J.
Novotny, Simultaneous determination of the rates of the TCA cycle, glucose
utilization, alpha-ketoglutarate/glutamate exchange, and glutamine synthesis in
human brain by NMR. J. Cereb. Blood. Flow. Metab., 15, 12-25, (1995).
R. G. Shulman, A. M. Blamire, D. L. Rothman, G. McCarthy, Nuclear magnetic
resonance imaging and spectroscopy of human brain function. Proc. Natl. Acad.
Sci. USA, 90, 3127-3133, (1993).
M. Ishihara, H. Ikehira, S. Nishikawa, T. Hashimoto, K. Yamada, F. Shishido, T.
Ogino, K. Cho, S. Kobayashi, M. Kawana, et al., Dynamic human glycogen and
glucose metabolism detection utilizing in vivo 13C NMR. Am. J. Physiol. Imaging, 7,
32-35, (1992).
N. Beckmann, R. Fried, I. Turkalj, J. Seelig, U. Keller, G. Stalder, Noninvasive
observation of hepatic glycogen formation in man by 13C MRS after oral and
intravenous glucose administration. Magn. Reson. Med., 29, 583-590, (1993).
I. Magnusson, D. L. Rothman, B. Jucker, G. W. Cline, R. G. Shulman, G. I.
Shulman, Liver glycogen turnover in fed and fasted humans. Am. J. Physiol., 266,
E796-E803, (1994).
G. W. Cline, D. L. Rothman, I. Magnusson, L. D. Katz, G. I. Shulman, 13C-nuclear
magnetic resonance spectroscopy studies of hepatic glucose metabolism in normal
subjects and subjects with insulin- dependent diabetes mellitus. J. Clin. Invest., 94,
2369-2376, (1994).
T. B. Price, R. Taylor, G. F. Mason, D. L. Rothman, G. I. Shulman, R. G. Shulman,
Turnover of human muscle glycogen with low-intensity exercise. Med. Sci. Sports.
Exerc., 26, 983-991, (1994).
T. Jue, D. L. Rothman, G. I. Shulman, B. A. Tavitian, R. A. DeFronzo, R. G.
Shulman, Direct observation of glycogen synthesis in human muscle with 13C
NMR. Proc. Natl. Acad. Sci. USA, 86, 4489-4491, (1989).
31
Chapter 1
77. G. I. Shulman, D. L. Rothman, T. Jue, P. Stein, R. A. DeFronzo, R. G. Shulman,
Quantitation of muscle glycogen synthesis in normal subjects and subjects with
non-insulin-dependent diabetes by 13C nuclear magnetic resonance spectroscopy.
N. Engl. J. Med., 322, 223-228, (1990).
78. D. L. Rothman, I. Magnusson, G. Cline, D. Gerard, C. R. Kahn, R. G. Shulman, G. I.
Shulman, Decreased muscle glucose transport/phosphorylation is an early defect in
the pathogenesis of non-insulin-dependent diabetes mellitus. Proc. Natl. Acad. Sci.
USA, 92, 983-987, (1995).
79. R. Roussel, G. Velho, P. G. Carlier, L. Jouvensal, G. Bloch, In vivo NMR evidence
for moderate glucose accumulation in human skeletal muscle during
hyperglycemia. Am. J. Physiol., 271, E434-438, (1996).
80. R. Roussel, P. G. Carlier, C. Wary, G. Velho, G. Bloch, Evidence for 100% 13C
NMR visibility of glucose in human skeletal muscle. Magn. Reson. Med., 37, 821
824, (1997).
81. R. G. Shulman, D. L. Rothman, T. B. Price, Nuclear magnetic resonance studies of
muscle and applications to exercise and diabetes. Diabetes, 45 Suppl 1, S93-98,
(1996).
82. K. F. Petersen, R. Hendler, T. Price, G. Perseghin, D. L. Rothman, N. Held, J. M.
Amatruda, G. I. Shulman, 13C/31P NMR studies on the mechanism of insulin
resistance in obesity. Diabetes, 47, 381-386, (1998).
83. E. J. Novotny, Jr., T. Ogino, D. L. Rothman, O. A. Petroff, J. W. Prichard, R. G.
Shulman, Direct carbon versus proton heteronuclear editing of 2-13C ethanol in
rabbit brain in vivo: a sensitivity comparison. Magn. Reson. Med., 16, 431-443,
(1990).
84. H. J. Muller, D. Lanens, T. J. De Cock Buning, F. L. Van de Vyver, F. C.
Alderweireldt, R. Dommisse, M. Spanoghe, G. J. Mulder, J. Lugtenburg,
Noninvasive in vivo 13C-NMR spectroscopy in the rat to study the pharmacokinetics
of 13C-labeled xenobiotics. Drug. Metab. Dispos., 20, 507-509, (1992).
85. D. Artemov, Z. M. Bhujwalla, R. J. Maxwell, J. R. Griffiths, I. R. Judson, M. O.
Leach, J. D. Glickson, Pharmacokinetics of the 13C labeled anticancer agent
temozolomide detected in vivo by selective cross-polarization transfer. Magn.
Reson. Med., 34, 338-342, (1995).
32
Introduction
86 .
87.
88.
89.
90.
91.
92.
93.
94.
95.
96.
97.
K. Albert, G. Kruppa, K. P. Zeller, E. Bayer, F. Hartmann, In vivo metabolism of [413C]phenacetin in an isolated perfused rat liver measured by continuous flow 13C
NMR spectroscopy. Z. Naturforsch., 39, 859-862, (1984).
A. Lapidot, A. Gopher, Cerebral metabolic compartmentation. Estimation of glucose
flux via pyruvate carboxylase/pyruvate dehydrogenase by 13C NMR isotopomer
analysis of D-[U-13C]glucose metabolites. J. Biol. Chem., 269, 27198-27208,
(1994).
C. R. Malloy, A. D. Sherry, F. M. Jeffrey, Analysis of tricarboxylic acid cycle of the
heart using 13C isotope isomers. Am. J. Physiol., 259, H987-H995, (1990).
S. Cerdan, B. Kunnecke, J. Seelig, Cerebral metabolism of 1,2-13C2acetate as
detected by in vivo and in vitro 13C NMR. J. Biol. Chem., 265, 12916-12926,
(1990).
E. Kustermann, J. Seelig, B. Kunnecke, Ascorbic acid, a vitamin, is observed by in
vivo 13C nuclear magnetic resonance spectroscopy of rat liver. Am. J. Physiol.,
274, E65-71, (1998).
P. A. Bottomley, P. B. Roemer, Homogeneous tissue model estimates of RF power
deposition in human NMR studies. Local elevations predicted in surface coil
decoupling. Ann. N.Y. Acad. Sci., 649, 144-159, (1992).
FDA, Guidence for Content and Review of a Magnetic Rosonance Diagnostic
Device 510(k) Application, US Food and Drug Administration: Rockville, MD.
P. Roschmann, Radiofrequency penetration and absorption in the human body:
limitations to high-field whole-body nuclear magnetic resonance imaging. Med.
Phys., 14, 922-931, (1987).
G. Adriany, R. Gruetter, A half volume coil for efficient proton decoupling in humans
at 4 Tesla. J. Magn. Reson., 125, 178-184, (1997).
R. Gruetter, G. Adriany, H. Merkle, P. M. Andersen, Broadband decoupled, 1Hlocalized 13C MRS of the human brain at 4 Tesla. Magn. Reson. Med., 36, 659
664, (1996).
P. M. L. Robitaille, A. Kangarlu, A. M. Abduljalil. On RF power requirements in
magnetic resonance imaging, in "ESMRMB, Geneva, 1998," p. 96
J. Mispelter, B. Tiffon, E. Quiniou, J. M. Lhoste, Optimization of 13C-{1H} double
coplanar surface-coil design for the WATLZ-16 decoupling sequence. J. Magn.
Reson., 82, 622-628, (1989).
33
Chapter 1
98. A. J. van den Bergh, H. J. van den Boogert, A. Heerschap, Calibration of the 1H
decoupling field strength and experimental evaluation of the specific RF absorption
rate in 1H-decoupled human 13C- MRS. Magn. Reson. Med., 39, 642-646, (1998).
99. A. J. van den Bergh, H. J. van den Boogert, H. Heerschap. In vivo 13C-NMR
spectroscopy of humans: a comparison between WALTZ-4 and adiabatic
broadband 1H decoupling schemes, in "ISMRM 5th Annual Meeting, Vancouver,
1997," p. 1347
100. P. R. Luyten, G. Bruntink, F. M. Sloff, J. W. Vermeulen, J. I. van der Heijden, J. A.
den Hollander, A. Heerschap, Broadband proton decoupling in human 31P NMR
spectroscopy. NMR Biomed., 1, 177-183, (1989).
101. G. Ende, P. Bachert, Dynamic 13C-1H nuclear polarization of lipid methylene
resonances applied to broadband proton-decoupled in vivo 13C MR spectroscopy
of human breast and calf tissue. Magn. Reson. Med., 30, 415-423, (1993).
102. R. van Sluis, G. S. Payne, M. O. Leach, Increased NOE enhancement in 1H
decoupled 31P MRS. Magn. Reson. Med., 34, 893-897, (1995).
103. T. R. Brown, R. Stoyanova, T. Greenberg, R. Srinivasan, J. Murphy-Boesch, NOE
enhancements and T1 relaxation times of phosphorylated metabolites in human
calf muscle at 1.5 Tesla. Magn. Reson. Med., 33, 417-421, (1995).
104. A. Knuttel, R. Kimmich, K.-H. Spohn, Indirect 13C tomography and volumeselective spectroscopy via proton NMR. I Spectroscopic Techniques . J. Magn.
Reson., 86, 526-541, (1990).
105. A. Knuttel, R. Kimmich, K. H. Spohn, Motion-insensitive volume-selective pulse
sequences for direct and proton-detected 13C spectroscopy: detection of glycogen
in the human liver in vivo. Magn. Reson. Med., 17, 470-482, (1991).
106. W. Chen, G. Adriany, X. H. Zhu, R. Gruetter, K. Ugurbil, Detecting natural
abundance carbon signal of NAA metabolite within 12- cm3 localized volume of
human brain using 1H-13C NMR spectroscopy [In Process Citation]. Magn. Reson.
Med., 40, 180-184, (1998).
107. P. C. van Zijl, A. S. Chesnick, D. DesPres, C. T. Moonen, J. Ruiz Cabello, P. van
Gelderen, In vivo proton spectroscopy and spectroscopic imaging of [1-13C]glucose and its metabolic products. Magn. Reson. Med., 30, 544-551, (1993).
34
Introduction
108. M. Saner, G. McKinnon, P. Boesiger, Glycogen detection by in vivo 13C NMR: A
comparison of proton decoupling and polarization transfer. Magn. Reson. Med., 28,
65-73, (1992).
109. H. Bomsdorf, P. Roschmann, J. Wieland, Sensitivity enhancement in whole-body
natural abundance 13C spectroscopy using 13C/1H double-resonance techniques
at 4 Tesla. Magn. Reson. Med., 22, 10-22, (1991).
110. N. Beckmann, S. Muller, Analysis of localized polarization transfer for 13C volumeselective spectroscopy with surface coils. J. Magn. Reson., 93, 299-318, (1991).
111. R. Kreis, J. Slotboom, J. Felblinger, C. Boesch. 13C-MR spectroscopy on a 1.5T
scanner with 1H-localization using PRESS, INEPT polarization transfer, adiabatic
pulses and WALTZ decoupling, in "ISMRM 5th Annual Meeting, Vancouver, 1997,"
p. 1438
112. D. Artemov, Z. M. Bhujwalla, J. D. Glickson, In vivo selective measurement of (113C)-glucose metabolism in tumors by heteronuclear cross polarization. Magn.
Reson. Med., 33, 151-155, (1995).
113. A. J. van den Bergh, H. J. van den Boogert, A. Heerschap, Heteronuclear cross
polarization for enhanced sensitivity of in vivo 13C MR spectroscopy on a clinical
1.5 T MR system. J. Magn. Reson., 135, 93-98, (1998).
114. H. Kostler, R. Kimmich, Adiabatic J cross polarization for localized direct and
proton-detected 13C spectroscopy. J. Magn. Reson., Series B 102, 285-292,
(1993).
115. M. E. Bellemann, G. Brix, NMR studies of brain 13C-glucose uptake and
metabolism: present status [letter; comment]. Magn. Reson. Imaging, 15, 997-1003,
(1997).
116. P. C. van Zijl, D. Rothman, NMR studies of brain 13C-glucose uptake and
metabolism: present status [see comments]. Magn. Reson. Imaging, 13, 1213
1221, (1995).
117. B. Tiffon, J. Mispelter, J.-M. Lhoste, A Carbon-13 in vivo double surface-coil NMR
probe with efficient low-power proton decoupling at 400 MHz using Waltz-16
sequence. J. Magn. Reson., 68, 544-550, (1986).
118. P. A. Bottomley, C. J. Hardy, P. B. Roemer, O. M. Mueller, Proton-decoupled,
Overhauser-enhanced, spatially localized carbon-13 spectroscopy in humans.
Magn. Reson. Med., 12, 348-363, (1989).
35
Chapter 1
119. J. A. den Hollander, K. L. Beha9, R. G. Shulman, Use of double-tuned surface coils
for the application of 13C NMR to brain metabolism. J. Magn. Reson.,, (1992).
120. R. J. Ordidge, A. Connelly, J. A. B. Lohman, Image-selected in vivo spectroscopy
(ISIS). A New technique for spatially selective NMR spectroscopy. J. Magn. Reson.,
66 , 283-294, (1986).
121. T. R. Brown, B. M. Kincaid, K. Ugurbil, NMR chemical shift imaging in three
dimensions. Proc. Natl. Acad. Sci. USA, 79, 3523-3526, (1982).
122. N. Beckmann, S. Muller, Natural-abundance 13C spectroscopic imaging applied to
humans. J. Magn. Reson., 93, 186-194, (1991).
123. S. Rotman, J. Slotboom, C. Boesch, E. Jequier. Muscle glycogen recovery after
exercise measured by 13C-NMR in humans: Effect of nutritional solutions, in
"ESMRMB, Geneva, 1998," p. 562
36
C a l i b r a t i o n o f t h e 1H d e c o u p l i n g f i e l d
2
s t r e n g t h a n d e x p e r im e n ta l e v a lu a t io n o f t h e
s p e c i f i c R F a b s o r p t i o n r a t e i n 1H d e c o u p l e d
h u m a n 13C M R S
A.J. van den Bergh, H.J. van den Boogert and A.
Heerschap
Department of Radiology, University of Nijmegen, The Netherlands
Abstract
For patient safety in human 1H decoupled 13C-MRS, it is absolutely necessary to
evaluate the specific RF absorption rate (SAR) of the tissue exposed to H
frequency irradiation. With the use of surface coils, the local SAR at the body
surface is of most concern due to the inherent RF field inhomogeneity. An
empirical procedure to spatially calibrate the decoupler power level and to
evaluate the local SAR at the body surface is described. For head, liver, muscle
gastrocnemius and muscle vastus lateralis the SAR at the body surface was
estimated for an 1H/ 13C double surface coil setup. Optimized duty cycle values
obtained with this procedure show that broadband 1H decoupled 13C-MR
spectroscopy is clinically feasible at 1.5 T for such a coil configuration within
safety guidelines.
---------------------------------------------------------------- ;--------------------1------------------------------------------This chapter is based on the publication: Calibration of the H decoupling field strength
and experimental evaluation of the specific RF absorption rate in 1 H-decoupled human
13C-mRs. A.J. van den Bergh, H.J. van den Boogert, A. Heerschap, Magn Reson Med,
39: 642-646 (1998).
Chapter 2
Introduction
The use of radio frequency (RF) fields in magnetic resonance applied to humans
is of concern since it could lead to tissue heating (1-5). In 31P and 13C-MR
spectroscopy an H decoupling RF field often is applied during the data
acquisition period to remove multiplet splittings for improved sensitivity and
resolution (6-8). Especially in 13C-MRS where relatively large 1H- 13C couplings
have to be removed this may pose problems as the specific RF absorption rate
(SAR) may exceed safety limits.
To estimate the SAR for volume coils their spatial RF distribution can be
evaluated by computational techniques. The impedance method which uses
anatomical models has been described for the human torso (9, 10) and for the
human head (11). In another approach geometrical models have been used (5,
12).
For 1H decoupling in 13C-MRS mostly surface type coils are used. In contrast to
volume coils, calculation of the local SAR is complex with these coils. Because of
the inherent RF field inhomogeneity of surface coils, the local SAR will sooner
exceed the safety guidelines (2) than the average SAR in the sensitive region of
the coil. Several attempts have been made to estimate the SAR by
computational techniques for the use of surface coils (12-16).
For patient safety, it is absolutely necessary to evaluate the local SAR for every
applied experimental condition of 1H decoupling in 13C-MRS. In this study we
describe an experimental approach that matches the experimental conditions
applied during decoupling to estimate the local SAR instead of using a
computational model.
The basis of our approach is a pulse sequence which is well known in high
resolution 13C NMR to calibrate the decoupler field strength (17). Extended with
phase encoding this sequence provides spatial information about the RF field
distribution of the decoupler coil (18). The spatial information of the decoupler RF
field strength obtained by this technique, can be used to optimize the decoupler
field strength and to calculate the local (surface) SAR.
38
Experimental evaluation of the SAR in 1H decoupled 13C MRS
Materials and Methods
Measurements were performed on an 1.5 T Magnetom SP 4000 (Siemens,
Erlangen, Germany) equipped with a second RF transmit channel. Double
resonance experiments were performed using a double surface coil consisting of
an 11 cm diameter 13C surface coil and a 17 x 23 cm 1H butterfly coil. The slightly
“V” shaped 1H coil was placed below the 13C coil to avoid the high flux regions of
the coil wires near the patient. The patient to coil distance was 32 mm in the
center and 16 mm at the outside of the coil. Dielectric losses in the distant
patient volume were further minimized by using a transmission line resonater coil
with distributed tuning capacitance (19). The H coil was cooled by airflow to
prevent possible mismatching caused by heating the coil due to power deposited
in the coil during decoupling.
To evaluate whether the SAR remains within safety guidelines it is necessary to
know the highest local SAR. The highest local SAR with the use of surface coils
is assumed to occur at the body surface closest to the surface coil. To estimate
this time averaged superficial SAR (Ssup) we used equation 1 (7).
During a decoupling experiment the peak power actually applied to the surface
[1]
coil (Pused) and the pulse duty cycle (DC) are known. So the time averaged SAR
at the body surface (Ssup) can be calculated if the Ps9ü, which is the peak power
applied to the surface coil to obtain a 90° pulse at the body surface and Stis the
specific power absorbed by the tissue are known.
The latter one was determined for a 90° pulse of 500 ^s (WALTZ element) in a
homogeneous RF field using equation 2.
S tis = (1 -Q l/Q u ) x Ptotal / W total
[2]
ti
s
To obtain the S value we used a regular knee coil linearly polarized, and placed
a certain amount of fresh meat (weight: Wtotal) in it. The quality factor (Q) of the
coil was determined loaded (Ql) and unloaded (Qu) with a network analyzer
model 8752A (Hewlett Packard, Santa Rosa, California). Power applied to the
coil (Ptotal) was measured using a powermeter model 8542B supplied with
S sup = [ P used/Ps0p ] x S tis x D C
39
Chapter 2
80350A peak power sensors (Giga-tronics Inc., San Ramon, California). Cable
losses were measured and corrected for.
With the use of efficient transmitter coils, as done in this study, dielectric losses
are considered to be negligible, and thus the power absorbed by the tissue is
mainly due to the induced electric field which arises from the magnetic field (2, 5,
12). It is assumed that whenever the B1 field strength is equal at a location in the
homogeneous coil and at a location in the sensitive region of the surface coil the
SAR will also be equal. To assess P90, the pulse power needed for a 90° H flip
angle at a certain location, we modified a sequence previously described by Bax
(17). The original sequence enables one to calibrate the decoupler RF field
strength. However, this calibration is not spatially resolved. In our modified
sequence we use phase encoding to perform localized calibration of the
decoupler RF field strength (18).
Phase encoding
----------------#
----------------------------
Figure 1
Schematic representation of the spatial RF field calibration sequence. The delay A has to be set
1/(2J) of a directly bonded 13C-1H pair. At the location where the proton pulse flip angle Q equals
p/2, no carbon magnetization will be observed for the 13C resonance of the 13C-1H pair.
40
Experimental evaluation of the SAR in 1H decoupled 13C MRS
A schematic representation of this modified sequence is given in figure 1. The
delay A has to be adjusted to 1/(2J), where J is the H carbon spin coupling
constant for a directly bonded 13C- 1H pair. In the region where the proton pulse
flip angle 0 equals p/2, no carbon magnetization will be observed for the carbon
resonance of the 13C- 1H pair, so it’s easy to assess the P90 for this region.
The 13C doublet signals at ± 128 ppm of unsaturated triglycerides in superficial
adipose tissue were used as the 13C- 1H pair for in vivo estimations of the
superficial 90° peak power. In order to obtain these Ps9ü values, we acquired at
least four 1D-CSI measurements with different peak powers applied to the
surface coil. These measurements were performed for the head, liver, muscle
gastrocnemius and muscle vastus lateralis from 5 different healthy volunteers
after receiving a written informed consent. Mean age of the subjects was 28 yr.
(range 22-46 yr.), body mass 73 kg (63-90 kg).
Measurement parameters of the calibration 1D-CSI were as follows, 32 phase
encoding steps, a field of view of 160 mm resulting in slices of 5 mm, a repetition
time of 400 ms, total number of acquisitions 1280, 1024 datapoints were
acquired, A was set to 3.289 ms which corresponds to 1/(2J) of the unsaturated
triglycerides. The pulse duration of the H pulse on the second RF channel was
500 ms.
On a cylindrical phantom with diameter 14 cm, containing sunflower oil, 3D-CSI
calibration measurements were performed and in addition B1 field map images
(11) were made in three orthogonal planes of a rectangular container 14 x 27 x
37 cm (h x w x l) filled with water, both to obtain information about the RF field
distribution of the H decoupling coil in 3 dimensions.
To verify the correlation between the calibration and decoupling performance we
used the cylindrical phantom. The settings for the decoupling 1D-CSI matched
the settings of the calibration sequence, decoupling was performed with WALTZ4 with a basic 90° pulse of 500 ms, corresponding to a decoupling field yB2/2p =
500 Hz. The proton bandwidth with these settings over which the 13C-MRS
resonance peak from unsaturated triglycerides remains within 85% of its fully
41
Chapter 2
1
decoupled value was determined to be ±400 Hz which is sufficient for H
decoupling at 1.5 T.
Spectral data were analyzed using the Luise software (Siemens, Erlangen,
Germany). CSI data were zerofilled in spatial as well as spectral dimension to a
64 x 2048 matrix. The CSI voxels were shifted to match with the superficial
adipose tissue. Unsaturated triglyceride signals of superficial adipose tissue were
fitted and integrated. Integrated areas of resonances multiplied by their peak sign
were plotted against the RF peak power applied to the decoupler surface coil and
the zero-crossing was chosen as the value for the Ps9q.
175
150
125
175
150
125
chemical shift (ppm)
Figure 2
(a) Stack plot of spectra obtained with the 1D-CSI RF field calibration sequence from a cylindrical
phantom filled with sunflower oil. The delay A was set to 1/(2J) of the unsaturated 13C-1H pair of
triglycerides from sunflower oil. 13C-MR spectra were collected from 0.5 cm slices. (b) Stack plot of
spectra collected with a corresponding 1D-CSI using WALTZ-4 decoupling. The same peak power
was applied to the decoupler coil in the calibration sequence and during WALTZ-4 decoupling.
Results
Figure 2a. shows 1D-CSI 13C-MR spectra obtained with the spatial RF calibration
sequence from the cylindrical phantom filled with sunflower oil. In this stack plot
42
Experimental evaluation of the SAR in 1H decoupled 13C MRS
one can clearly see that in the slice at a depth of 4 cm there is almost no
magnetization left, the H pulse flip angle 0 in this region is approximately p/2. In
the region closer to the coil the H pulse angle 0 > p/2. Further away from the
coil (4.5 cm) the pulse angle generated by the decoupler coil is less than p/2. If
we look at the corresponding 1D-CSI 13C-MRS measurement with WALTZ-4
decoupling at the same proton RF peak power (figure 2b.) one can see that the
decoupling performance close to the coil is excellent. Beyond the region where
the H pulse angle 0 is estimated to be p/2 with the use of the 1D-CSI calibration
sequence, we can see sidebands appearing due to insufficient decoupling
power. This shows that RF calibration and decoupling performance are in good
agreement.
The average Stis (equation 2.) measured with a regular knee coil of fresh meat
samples was found to be 9.09 Watt/kg (SD= 1.36, n=4).
peak power (Watt)
Figure 3
Integrated areas of the unsaturated triglyceride signals multiplied with their peak sign plotted against
the RF amplitude of the decoupling channel.
Spectra were obtained from the head of a healthy subject, placed with the occipitoparietal region
facing the surface coil. Four 1 D-CSI measurements were performed with different peak power on
the decoupler RF channel. Spectra originating from the subcutaneous adipose tissue were
analyzed.
43
Chapter 2
1
In figure 3 the results of a RF calibration of the H decoupling coil loaded with the
human head are presented. The data are obtained from four different 1D-CSI
calibration measurements, all with different peak power on the decoupler RF
channel, taken from the slice matching with the superficial lipid tissue (in this
case of the human head). From this graph one can easily derive a value for Ps9o.
Similar studies were performed for liver and skeletal muscle. Averaged values
from 5 healthy volunteers of the Ps9o for these tissues are given in table 1.
The data obtained from the cylindrical phantom, filled with sunflower oil, with the
3D-CSI calibration sequence showed a much larger variation in pulse angle as a
function of distance from the coil compared to variations in pulse angle in a plane
parallel to the coil.
Tissue
min.
max.
mean
(n=5)
SD
head
5.01
5.85
5.49
0.35
liver
9.06
14.95
11.79
2.35
muscle vastus lateralis
7.15
11.78
9.01
1.99
muscle gastrocnemius
5.28
6.80
6.06
0.71
Table 1.
Mean Psg§ (Watt) values from 5 healthy subjects, obtained with the 1D-CSI calibration sequence
from the head, liver, muscle vastus lateralis and muscle gastrocnemius.
When the power was set to achieve an excitation pulse angle of 90° in the
second plane parallel to the coil with the use of the 1D-CSI calibration, the voxels
in the bottom plane all showed excitation angles larger than 90°. The voxels in
the second plane all showed very small signals or no signal at all for the 13C- 1H
pair, meaning an excitation angle close to 90°. The voxels in the third plane all
showed an excitation angle less than 90°.
44
Experimental evaluation of the SAR in 1H decoupled 13C MRS
B1 field maps reconstructed from images of the large rectangular phantom, filled
with water and placed on top of the 13C surface coil gave a more detailed picture
of the relative field strength within the excitation volume of the decoupling coil.
The field maps perpendicular to the plane of the coil showed a decreasing B1
field moving away from the coil as in figure 2. A “butterfly” shaped field map
image was obtained in a 6 mm thick slice adjacent and parallel to the 13C coil.
The latter field map showed three regions with slightly increased intensity. These
regions were connected with each other, with one at the center above the 13C
surface coil and with two side lobs above both loops of the H coil. Setting the
pixel with the highest B1 field strength to 100 % resulted in an average B1 field
strength of 91.8 % (SD = 2.45 %) for a large rectangle, 212 x 100 mm covering
the 3 regions, which indicates a fairly uniform B1 field distribution. The average
B1 field of the decoupler coil within the sensitive area of the 13C coil ( a circle with
diameter 100 mm) was 90.6 % (SD = 2.41).
The actual power used (P used) to acquire broadband decoupled 13C-MR spectra
of the tissues studied in this paper, resulted in Pused/ Ps9Q values ranging from 1
for superficial lipid to 11 for the liver. Using formula 1 one can calculate duty
cycle values to remain within safety guidelines for the local SAR (2) to be 0.88
and 0.08 respectively. For signals like the C1 of glycogen in muscle or liver an
adequate signal to noise ratio can be achieved with these duty cycles within
acceptable measurement times (20).
Discussion
1
In this paper an experimental method to obtain spatial information of the H
decoupling RF field strength in 1H decoupled 13C-MRS is presented. With this
method the minimum power needed to obtain adequately decoupled spectra can
be determined. Furthermore the calibration procedure makes it possible to obtain
exact values of the power needed to generate a 90° excitation angle at the
surface and thereby enabling a local (surface) SAR calculation.
45
Chapter 2
Localization for this calibration procedure was performed in only one direction
parallel to the surface coil. With phase encoding in only one direction we were
able to acquire four data sets with a good signal to noise ratio with respect to the
unsaturated triglyceride signals within acceptable measurement times. To justify
the use of 1D-CSI calibration of the decoupling RF field strength, we had to
assume that the RF field strength of our decoupling coil varies more in depth
than in a plane parallel to the coil. This assumption was verified with a 3D-CSI
calibration experiment performed on the cylindrical phantom containing
sunflower oil. The results from this 3D-CSI experiment showed that the in plane
variation was small compared to the variation between planes parallel to the coil.
Similar results were obtained by using a B1 field map imaging technique.
These B1 field map images show some similarity with the computer contour plots
of the magnitude of the transverse RF field produced by a 8 x 13 cm figure eight
surface coil (12), notwithstanding the difference in coil sizes and shape.
Although the B1 field map imaging technique can give quick access to the RF
field distribution of a coil in several orientations, it only gives relative information
about the RF field distribution. In this study we need to know the amount of
power to apply to the surface coil to generate a 90° pulse at a certain location
and this information can exactly be obtained with the calibration procedure.
A possible limitation of the SAR estimation procedure is that it evaluates the
sensitive area of the 13C surface coil, and thus may overlook higher field
strengths of the decoupler coil outside this area to which the subject may be
exposed. However, the B1 field maps obtained in a plane adjacent to the 13C coil
from a phantom extending well beyond the viewing area of the H coil showed
that, for the current used coil configuration, the B1 field strength the in region
used for the SAR estimation deviated less than 10 % from the most intense spot
of the B1 field of the decoupler coil. Furthermore, in actual in vivo H decoupling
experiments the subjects tissue is positioned in such a way that its only exposed
to the central region of the B1 field of the decoupler coil.
In this study we used the superficial adipose tissue to estimate the Ps9o and used
equations 1 and 2 to calculate the local (surface) SAR. To obtain Stis we used
46
Experimental evaluation of the SAR in 1H decoupled 13C MRS
fresh meat which mainly contains muscle tissue whose conductivity is higher
than that of adipose tissue (10). In this way we may overestimate the local SAR
for superficial adipose tissue. However care should be taken because of the skin
adjacent to the superficial lipid (closer to the surface coil) whose conductivity is
similar to that of muscle.
The RF field inhomogeneity of circular surface coils leads to an inefficient use of
RF power used for decoupling (21). This is also true for the butterfly coil used in
the present experiments, as shown by the high Pused/ Ps9Q ratios. With different
coil configuration types it maybe possible to make more efficient use of the
power applied to the decoupling coil(22).
Acknowledgment
The authors thank dr. Leon, Th. E. O van Erning for critically reading the
manuscript.
References
1.
2.
3.
4.
5.
6.
T. F. Budinger, Emerging nuclear magnetic resonance technologies. Health and
safety. Ann. N. Y. Acad. Sci., 649, 1-18, (1992).
F. G. Shellock, E. Kanal, "Magnetic Resonance bioeffects, safety, and patient
managment," Raven Press, New York, 1994.
F. G. Shellock, E. Kanal, Policies, guidelines, and recommendations for MR
imaging safety and patient management. SMRI Safety Committee. J. Magn. Reson.
Imag., 1, 97-101, (1991).
R. E. Gangarosa, J. E. Minnis, J. Nobbe, D. Praschan, R. W. Genberg, Operational
safety issues in MRI. Magn. Reson. Imag., 5, 287-292, (1987).
P. A. Bottomley, R. W. Redington, W. A. Edelstein, J. F. Schenck, Estimating
radiofrequency power deposition in body NMR imaging. Magn. Reson. Med., 2,
336-349, (1985).
P. R. Luyten, G. Bruntink, F. M. Sloff, J. W. Vermeulen, J. I. van der Heijden, J. A.
den Hollander, A. Heerschap, Broadband proton decoupling in human 31P NMR
spectroscopy. NMR Biomed., 1, 177-183, (1989).
47
Chapter 2
7.
8.
9.
10.
11.
12.
13.
14.
15.
16.
17.
18.
19.
48
A. Heerschap, P. R. Luyten, J. I. van der Heyden, L. J. Oosterwaal, J. A. den
Hollander, Broadband proton decoupled natural abundance 13C NMR
spectroscopy of humans at 1.5 T. NMR Biomed., 2, 124-132, (1989).
N. Beckmann, In vivo 13C spectroscopy in humans, in "NMR basic principles and
progress vol. 28", 74-99, Springer-Verlag, Berlin Heidelberg,1992.
M. Grandolfo, A. Polichetti, P. Vecchia, O. P. Gandhi, Spatial distribution of RF
power in critical organs during magnetic resonance imaging. Ann. N. Y. Acad. Sci.,
649, 176-187, (1992).
O. P. Gandhi, J. Y. Chen, Absorption and distribution patterns of RF fields. Ann. N.
Y. Acad. Sci., 649, 131-143, (1992).
D. Simunic, P. Wach, W. Renhart, R. Stollberger, Spatial distribution of highfrequency electromagnetic energy in human head during MRI: numerical results
and measurements. IEEE. Trans. Biomed. Eng., 43, 88-94, (1996).
P. A. Bottomley, P. B. Roemer, Homogeneous tissue model estimates of RF power
deposition in human NMR studies. Local elevations predicted in surface coil
decoupling. Ann. N. Y. Acad. Sci., 649, 144-159, (1992).
J. R. Keltner, J. W. Carlson, M. S. Roos, S. T. Wong, T. L. Wong, T. F. Budinger,
Electromagnetic fields of surface coil in vivo NMR at high frequencies. Magn.
Reson. Med., 22, 467-480, (1991).
D. J. Schaefer. Estimation of current limits for RF power deposition from planar,
transmit surface coils, in "Proc., ISMRM 4th Scientific Meeting, New York, 1996," p.
1446
R. J. Strilka, S. Li, M. B. Smith. A numerical study of RF deposition using surface
coils in high field MRI, in "Proc., ISMRM 4th Scientific Meeting, New York, 1996," p.
1448
M. E. Bellemann, F. Hauert, P. Bachert, H.-J. Zabel, W. J. Lorenz. Local RF power
deposition in broadband 1H decoupling experiments with transmission line
resonators, in "Proc., SMRM, 10th annual meeting, San Francisco, 1991," p. 972
A. Bax, A simple method for the calibration of decoupler radiofrequency field
strength. J. Magn. Reson., 52, 76-80, (1983).
A. J. van den Bergh, H. J. van den Boogert, H. Heerschap. Spatially localized
calibration of the decoupler radio frequency field strength, in "Proc.,SMR 2nd
Meeting,San Francisco, 1994," p. 760
C.-N. Chen, D. I. Hoult, The visualization of RF probe electric fields. Magn. Reson.
Experimental evaluation of the SAR in 1H decoupled 13C MRS
Med., 29, 386-390, (1993).
20. A. J. van den Bergh, S. Houtman, A. Heerschap, N. J. Rehrer, H. J. van den
Boogert, B. Oeseburg, M. T. Hopman, Muscle glycogen recovery after exercise
during glucose and fructose intake monitored by 13C-NMR. J. Appl. Physiol., 81,
(4), 1495-1500, (1996).
21. J. Mispelter, B. Tiffon, E. Quiniou, J. M. Lhoste, Optimization of 13C-{1H} double
coplanar surface-coil design for the WATLZ-16 decoupling sequence. J. Magn.
Reson., 82, 622-628, (1989).
22. G. Adriany, R. Gruetter, A half volume coil for efficient proton decoupling in humans
at 4 Tesla. J. Magn. Reson., 125, (1), 178-184, (1997).
49
S k in t e m p e r a t u r e in c r e a s e d u r in g lo c a l
3
e x p o s u r e t o h ig h p o w e r R F le v e ls in h u m a n s
A.J. van den Bergh, H.J. van den Boogert and A.
Heerschap
Department of Radiology, University of Nijmegen, The Netherlands
Abstract
The thermoregulatory response of the skin was investigated in 5 healthy
volunteers during prolonged exposure to RF radiation by a surface coil.
Temperature changes induced by RF radiation were measured at the skin of the
calf muscle by a fluoroptic probe. Exposure to superficial SAR levels of 6.5, 12
and 22 Watt/kg resulted in skin temperature increases, the highest temperature
recorded was 38.3 °C. Although the maximum values of each temperature curve
correlated with the applied superficial SAR levels, these values did not exceed
the recommended temperature limit for the extremities such as given by the
FDA. None of the subjects experienced the changes in skin temperature. For
subjects with normal thermoregulatory function, these findings suggest that the
recommended SAR limit for the extremities may be too conservative.
This chapter is based on a paper submitted to Magnetic Resonance in Medicine.
Chapter 3
Introduction
Proton decoupling and nuclear Overhauser enhancement (NOE) are often
applied in in vivo 13C and 31P MR spectroscopy in humans (1-6). Benefits of
these techniques are, improvement of spectral resolution (spectrum
simplification) and improvement in signal to noise ratio. A better signal to noise
ratio means that measurement time can be reduced, which is important for
patient comfort.
However, proton decoupling and NOE require relatively high level RF radiation
often applied with high duty cycles. Heating, induced by this RF radiation during a
MR examination, is of concern because of possible tissue damage (7-11).
Precautions should be taken in experimental procedures, especially in 13C MRS,
in which relatively large 1H- 13C couplings have to be removed (1, 2, 5, 12, 13).
To perform a 13C in vivo MR spectroscopy experiment, a coil configuration is
required with the highest possible sensitivity for 13C, and an efficient 1H coil for
decoupling. Therefore, often surface coils are used (1, 4, 14-16). Because of the
inherent RF field inhomogeneity of these type of coils, they produce a high local
specific absorption rate (SAR) and a low total body SAR. Recently, we developed
an empirical procedure to predict the local SAR at the body surface, for surface
coils using the unsaturated carbon signals of subcutaneous lipid tissue (17).
However, power deposition in the skin is not directly evaluated by this method.
The skin probably reflects the worst case because of its properties and its
position in the RF field of the surface coil.
Either SAR levels or temperature criteria can be used as guidelines for safety
precautions (18). Several animal and human studies have been performed to
study the temperature increase at different locations on the body during imaging
protocols using a body coil (19-22). Temperature changes by a proton
decoupling protocol using a surface coil were reported by Morvan et al. (23). In
the latter study temperature changes were measured by an imaging technique,
based on the temperature dependence of the diffusion coefficient of water.
Temperature change was measured in muscle tissue after 20 minutes of
52
Skin temperature increase during exposure to RF
decoupling. To our knowledge, measurements of absolute skin temperature
during decoupling have not yet been reported.
The aim of the present study was to investigate if exposure to high local SAR
levels applied with a surface coil could result in skin temperatures above the
recommended criteria for safe MR operation (18).
Experimental
Subjects. Five healthy male subjects participated in this study. Subjects were
screened for contra-indications to undergo a MR procedure. All subjects were
experienced MR investigators and were well aware of the possible tissue heating
effects of high level RF radiation. The subjects were in contact with the MR
operator during decoupling experiments; experiments could be terminated at any
time.
System. Experiments were performed at 1.5 T using a Siemens Vision whole
body system (Siemens, Erlangen, Germany) supplied with a second RF transmit
channel. We used a double surface coil configuration consisting of an 11 cm
diameter 13C coil and a 17 x 23 cm butterfly proton coil. The slightly V-shaped
proton coil was placed below the 13C coil to avoid the high flux regions of the coil
wires near the patient. This coil was cooled by air flow to prevent possible
mismatching caused by heating the coil due to power deposited in the coil during
decoupling. The ambient conditions were: room temperature 21 ± 1.0 ° C, relative
humidity between 50 % and 70 %.
Subjects laid in a supine position with the calf muscle of the right leg positioned
on the double surface coil. In total 4 experiments were performed on each
subject. The first experiment was to determine the Ps9o, which is the power
applied to the surface coil to obtain a 90° pulse at the body surface (superficial
lipid tissue). This was done by a spatially resolved calibration sequence
according to (17). In order to obtain information of the thermoregulatory function
of the skin during exposure to RF radiation, 3 subsequent experiments were
performed at different occasions with respectively 6.5, 12 and 22 Watt/kg local
53
Chapter 3
SAR (Ssup) deposited as determined for subcutaneous adipose tissue. This
superficial SAR value for each individual was calculated using Eq. 1 (1, 17).
s sup = [ P used/ P - p ] x S tis x D C
[1]
The specific absorption of muscle tissue Stis was determined to be 9.09 Watt/kg
for a 500 ms rectangular 90° pulse (17). The value for Pused and the duty cycle
(DC) can be set to desired values. In the current study, the DC was fixed at 27 %
and Pused was changed to achieve the required superficial SAR value.
The subjects were inside the magnet for approximately 10 minutes prior to the
start of decoupling. During this period imaging and shimming was performed and
the temperature of the skin could stabilize.
During the 60 minutes that each decoupling experiment lasted the skin
temperature of the muscle gastrocnemius at the center of both coils, which
reflects the worst case, was monitored with a fluoroptic thermometry system
(Luxtron 712, California, USA). A control fluoroptic probe was attached to the
skin of the same leg at the muscle quadriceps femoris outside the RF field of the
double surface coil. Temperature was sampled with 30 second time intervals.
The fluoroptic probes were attached to the skin with micropore tape.
Temperatures at the start of each experiment were determined for both
temperature probes. The maximum skin temperature (Tmax) and the temperature
at the end of each experiment (Tend) were derived from the temperature curves.
Results
The amplitude required for a 500 ms 90° pulse at the body surface ranged from
6.7 to 7.8 Watt (mean ± SD; 7.2 ± 0.47 Watt).
The mean skin temperature at the start of the decoupling periods was 30.23 ±
0.63 °C. This temperature was lower than the mean control temperature at the
start of the decoupling experiments, which was 33.56 ± 0.78 °C. This difference
was due to the cooling of the coil on which the leg was positioned.
54
Skin temperature increase during exposure to RF
tim e (minutes)
tim e (minutes)
Figure 1.
Figure A, experimental data of subject 2, skin temperature increase of the calf muscle during 60
minutes of decoupling with different local (superficial) SAR levels, — 6 .5 ,--------12 a n d --------22
Watt/kg. Figure B, experimental data of skin temperature overshoot at 22W/kg local SAR of three
subjects: — subject 3 ,--------subject 4, an d --------subject 5. Temperature was monitored with time
intervals of 30 seconds using a fluoroptic probe attached to the skin.
At the onset of decoupling the skin temperature within the RF field rapidly
increased in all experiments, at all power levels. During further decoupling the
temperature rise slowed down. In most experiments the temperature curve
occurred as an one phase exponential as illustrated in figure 1A for an individual
subject. Fitting the experimental data of this subject with an one phase
exponential function resulted in R values > 0.99. In these cases the Tend
corresponds with Tmax. The relation between the applied power level and the
maximum temperature reached is clearly visible in this figure. The initial
temperature rise is also higher at higher local SAR levels.
In three experiments, all with the highest local SAR applied, the temperature
curves followed a different shape, see figure 1B. Skin temperature first
increased, followed by a decrease after which it stabilized.
Summarized results for each individual and for each SAR level are given in the
table 1. In figure 2, the relationship between the applied superficial SAR and the
Tmax is shown. This relation between local SAR and Tmax is not linear. Since for
55
Chapter 3
three individuals the Tend at the superficial SAR level of 22 Watt/kg was different
from the Tmax, this value is also shown in figure 2.
38
1
U
O
I
■
<D
D
13
(D
36
œ
E
0
£Z
w 34
6.5
12.0
22.0
superficial SAR level (W/kg)
Figure 2.
Mean and standard deviation (n=5) of the Tmax (■) during a proton decoupling protocol applied to the
calf muscle plotted against superficial SAR level. Tend value ( • ) is shown for the superficial SAR
level of 22 Watt/kg.
None of the subjects experienced any tissue heating effects, nor did they report
any other discomfort during the decoupling procedures.
In 12 out of 15 experiments the control skin temperature recorded outside the RF
field of the proton decoupler coil fluctuated in a range of ± 0.5 °C, with no clear
increase or decrease. Three cases showed a clear rise of the control
temperature during decoupling, of which the largest was 1.8 °C, during an
experiment with 6.5 Watt/kg superficial SAR.
56
Skin temperature increase during exposure to RF
Subject
Age
(year)
Dsup
body
P90 22 W/kg
weight
(kg) (Watt)
Tmax
85
7.1
36.8
12 W/kg 6.5 W/kg
Tend
36.8
Tmax
37.0
Tmax
34.6
1
31
2
26
75
6.8
36.4
36.4
35.1
32.6
3
49
87
7.9
38.1
37.8
35.6
33.1
4
33
65
7.5
38.3
37.9
35.1
33.1
5
26
87
6.7
37.4
37.2
35.2
33.1
Table 1.
Subject information and summarized results of the calibration and decoupling experiments. PfO
values are given for each individual as well as Tmax and Tend values for the three applied superficial
SAR levels.
Discussion
In this study the effect of RF radiation by an H decoupling coil on the skin
temperature was investigated. The duration of the applied decoupling is
representative for several consecutive 1H decoupled 13C MR spectroscopy
examinations such as in dynamic studies.
The RF radiation by the H surface coil during decoupling induced changes in
temperature that could be described by an one phase exponential increase in all
except for three experiments. In three subjects, at the highest superficial SAR
level the temperature curve showed an overshoot. The Tmax in these three
subjects was higher than 37 °C, in the other two subjects the Tmax remained
below 37 °C at the same superficial SAR level.
Thermophysiological responses are difficult to predict; several studies report on
whole body thermophysiology (24-27). Studies on local tissue temperature stress
suggest that the heat removed from or supplied to the tissue by blood circulation
is one of the most important factors in thermoregulation (28-30). Heat induced by
57
Chapter 3
RF and heat loss to the environment also play a major role in the local tissue
heat balance, conductive heat transfer through tissue and metabolic heat
production are less important (28, 29, 31).
It goes beyond the scope of this study to model the temperature curves. Similar
increments in skin temperature as observed in this study could be accounted for
by Buse et al. in an one-dimensional mathematical model study (32). Overshoots
above the core temperature as in the present study were also described. The
weighting factor of the skin temperature feedback and the depth of the skin
receptors could be modeled to match the experimental data (32).
A steady state skin temperature is reached in most experiments, at that time,
there is an equilibrium between heat induced by RF irradiation and the total heat
loss. Higher local SAR levels result in higher equilibrium skin temperatures.
When skin temperature rises above the core temperature, heat removal by the
blood circulation and (local) sweat production starts to play an important role,
and a non-linear relation between the locally applied SAR and the equilibrium
skin temperature is expected as seen in figure 2.
Morvan et al. reported a temperature increase in muscle tissue close to the skin
of 5 °C after 20 minutes of decoupling at a level of 6 Watt input power (23). It is
not clear to what level of superficial SAR this corresponds. As shown in figure 1,
the temperature increase did not reach a steady state within 20 minutes in our
experiments. The temperature overshoot, as observed in our experiments,
demonstrate that it is also important to monitor temperature during decoupling.
Furthermore, the temperature registered by imaging was obtained within 1
minute after cessation of decoupling, our data (not shown here) showed a
decrease in temperature of 0.5 °C within the first minute after cessation of
decoupling.
Locally we measured a rather large temperature increase as a result of RF
radiation applied with a surface coil. It is not likely that these experiments will
result in an increase in core temperature. The highest total average body SAR in
our experiments was 0.15 W/kg. No statistically significant differences in mean
58
Skin temperature increase during exposure to RF
body temperatures were reported by Shellock et al. during a 30 minute MR
imaging protocol with up to 4.0 W/kg mean SAR (20).
Despite the relatively large increase in skin temperature, none of the subjects
sensed these changes. Skin temperature can change during the circadian
rhythm or in response to the environment in a broader range than detected
during this study (33).
These findings that at SAR levels above the spatial peak power level of 8 W/kg
recommended by the FDA do not result in temperature increase above 40 °C
which is temperature limit for the extremities (18), suggest that recommended
RF radiation safety levels for MRI/MRS procedures may be too conservative in
humans with normal thermoregulatory function for the extremities. Previously this
has been discussed for whole body procedures in (20). For comparison, the
metabolic rate of humans is 1.5 W/kg during sleep, 5 W/kg during moderate
exercise and 15 W/kg for very heavy exercise, so the locally applied SAR values
in this study (which corresponds with a maximum body average SAR of 0.15
Watt/kg) are not that extreme (10).
However care should be taken because a given SAR can result in different
temperature increases depending on the type of tissue and blood flow. Especially
in patients with a diminished thermoregulatory function as in diabetes, obesity or
cardiovascular disease. Therefore, temperature changes seem to be a more
direct indication for possible tissue damage. (20, 21, 23).
References
1.
2.
3.
A. Heerschap, P. R. Luyten, J. I. van der Heyden, L. J. Oosterwaal, J. A. den
Hollander, Broadband proton decoupled natural abundance 13C NMR
spectroscopy of humans at 1.5 T. NMR Biomed., 2, 124-132, (1989).
N. Beckmann, In vivo 13C spectroscopy in humans, in "NMR basic principles and
progress vol. 28", 74-99, Springer-Verlag, Berlin Heidelberg,1992.
P. R. Luyten, G. Bruntink, F. M. Sloff, J. W. Vermeulen, J. I. van der Heijden, J. A.
den Hollander, A. Heerschap, Broadband proton decoupling in human 31P NMR
spectroscopy. NMR Biomed., 1, 177-183, (1989).
59
Chapter 3
4.
5.
6.
7.
8.
9.
10.
11.
12.
13.
14.
15.
16.
60
P. A. Bottomley, C. J. Hardy, P. B. Roemer, O. M. Mueller, Proton-decoupled,
Overhauser-enhanced, spatially localized carbon-13 spectroscopy in humans.
Magn. Reson. Med., 12, 348-363, (1989).
M. J. Avison, D. L. Rothman, E. Nadel, R. G. Shulman, Detection of human muscle
glycogen by natural abundance 13C NMR. Proc. Natl. Acad. Sci. USA, 85, 1634
1636, (1988).
G. Ende, P. Bachert, Dynamic 13C-1H nuclear polarization of lipid methylene
resonances applied to broadband proton-decoupled in vivo 13C MR spectroscopy
of human breast and calf tissue. Magn. Reson. Med., 30, 415-423, (1993).
T. F. Budinger, Emerging nuclear magnetic resonance technologies. Health and
safety. Ann. N. Y. Acad. Sci., 649, 1-18, (1992).
F. G. Shellock, E. Kanal, "Magnetic Resonance bioeffects, safety, and patient
managment," Raven Press, New York, 1994.
F. G. Shellock, E. Kanal, Policies, guidelines, and recommendations for MR
imaging safety and patient management. SMRI Safety Committee. J. Magn. Reson.
Imag., 1, 97-101, (1991).
R. E. Gangarosa, J. E. Minnis, J. Nobbe, D. Praschan, R. W. Genberg, Operational
safety issues in MRI. Magn. Reson. Imaging, 5, 287-292, (1987).
P. A. Bottomley, R. W. Redington, W. A. Edelstein, J. F. Schenck, Estimating
radiofrequency power deposition in body NMR imaging. Magn. Reson. Med., 2,
336-349, (1985).
P. A. Bottomley, P. B. Roemer, Homogeneous tissue model estimates of RF power
deposition in human NMR studies. Local elevations predicted in surface coil
decoupling. Ann. N. Y. Acad. Sci., 649, 144-159, (1992).
A. J. van den Bergh, S. Houtman, A. Heerschap, N. J. Rehrer, H. J. van den
Boogert, B. Oeseburg, M. T. Hopman, Muscle glycogen recovery after exercise
during glucose and fructose intake monitored by 13C-NMR. J. Appl. Physiol., 81,
1495-1500, (1996).
J. A. den Hollander, K. L. Behar, R. G. Shulman, Use of double-tuned surface coils
for the application of 13C NMR to brain metabolism. J. Magn. Reson.,, (1992).
J. Mispelter, B. Tiffon, E. Quiniou, J. M. Lhoste, Optimization of 13C-{1H} double
coplanar surface-coil design for the WATLZ-16 decoupling sequence. J. Magn.
Reson., 82, 622-628, (1989).
B. Tiffon, J. Mispelter, J.-M. Lhoste, A Carbon-13 in vivo double surface-coil NMR
Skin temperature increase during exposure to RF
17.
18.
19.
20.
21.
22.
23.
24.
25.
26.
27.
probe with efficient low-power proton decoupling at 400 MHz using Waltz-16
sequence. J. Magn. Reson., 68, 544-550, (1986).
A. J. van den Bergh, H. J. van den Boogert, A. Heerschap, Calibration of the 1H
decoupling field strength and experimental evaluation of the specific RF absorption
rate in 1H-decoupled human 13C- MRS. Magn. Reson. Med., 39, 642-646, (1998).
Guidence for Content and Review of a Magnetic Resonance Diagnostic Device
510(k) Application, US Food and Drug Administration: Rockville, MD, (1988).
B. J. Barber, D. J. Schaefer, C. J. Gordon, D. C. Zawieja, J. Hecker, Thermal
effects of MR imaging: worst-case studies on sheep. AJR. Am. J. Roentgenol., 155,
1105-1110, (1990).
F. G. Shellock, D. J. Schaefer, J. V. Crues, Alterations in body and skin
temperatures caused by magnetic resonance imaging: is the recommended
exposure for radiofrequency radiation too conservative? Br. J. Radiol., 62, 904-909,
(1989).
F. G. Shellock, D. J. Schaefer, E. Kanal, Physiologic responses to an MR imaging
procedure performed at a specific absorption rate of 6.0 W/kg. Radiology, 192, 865
868, (1994).
W. P. Shuman, D. R. Haynor, A. W. Guy, G. E. Wesbey, D. J. Schaefer, A. A.
Moss, Superficial- and deep-tissue temperature increases in anesthetized dogs
during exposure to high specific absorption rates in a 1.5-T MR imager. Radiology,
167, 551-554, (1988).
D. Morvan, A. Leroy Willig, P. Jehenson, C. A. Cuenod, A. Syrota, Temperature
changes induced in human muscle by radio-frequency H-1 decoupling:
measurement with an MR imaging diffusion technique. W ork in progress.
Radiology, 185, 871-874, (1992).
E. R. Adair, L. G. Berglund, Predicted thermophysiological responses of humans to
MRI fields. Ann. N. Y. Acad. Sci., 649, 188-200, (1992).
J. Werner, M. Buse, Temperature profiles with respect to inhomogeneity and
geometry of the human body. J. Appl. Physiol., 65, 1110-1118, (1988).
J. Werner, M. Buse, A. Foegen, Lumped versus distributed thermoregulatory
control: results from a three-dimensional dynamic model. Biol. Cybern., 62, 63-73,
(1989).
M. F. Iskander, O. Khoshdel-Milani, Numerical calculations of the temperature
distribution in realistic cross sections of the human body. Int. J. Radiat. Oncol. Biol.
61
Chapter 3
28.
29.
30.
31.
32.
33.
62
Phys., 10, 1907-1912, (1984).
M. B. Ducharme, P. Tikuisis, Role of blood as heat source or sink in human limbs
during local cooling and heating. J. Appl. Physiol., 76, 2084-2094, (1994).
A. J. Milligan, P. B. Conran, M. A. Ropar, H. A. McCulloch, R. K. Ahuja, R. R.
Dobelbower, Jr., Predictions of blood flow from thermal clearance during regional
hyperthermia. Int. J. Radiat. Oncol. Biol. Phys., 9, 1335-1343, (1983).
W. F. Taylor, J. M. Johnson, O. L. D, M. K. Park, Effect of high local temperature on
reflex cutaneous vasodilation. J. Appl. Physiol., 57, 191-196, (1984).
M. B. Ducharme, W. P. VanHelder, M. W. Radomski, Tissue temperature profile in
the human forearm during thermal stress at thermal stability. J. Appl. Physiol., 71,
1973-1978, (1991).
M. Buse, J. Werner, Closed loop control of human body temperature: results from a
one-dimensional model. Biol. Cybern., 61, 467-475, (1989).
J. Werner, T. Reents, A contribution to the topography of temperature regulation in
man. Eur. J. Appl. Physiol., 45, 87-94, (1980).
H e te r o n u c le a r c r o s s p o la r iz a tio n f o r
4
e n h a n c e d s e n s i t i v i t y o f i n v i v o 13C M R
s p e c t r o s c o p y o n a c lin ic a l 1 .5 T M R s y s t e m
A.J. van den Bergh H.J. van den Boogert and A.
Heerschap
Department of Radiology, University of Nijmegen,
The Netherlands
Abstract
The potential of heteronuclear { 1H- 13C} cross polarization was studied for
optimization of the signal to noise ratio in in vivo 13C MR spectroscopy at the
clinical field strength of 1.5 T. Experiments on the human calf showed a
significant chemical shift selective signal enhancement on triglyceride signals of
3.9 by heteronuclear cross polarization, compared to a standard pulse-acquire
sequence. Studies on a neonatal piglet brain showed an enhancement by cross
polarization of 2.2 for the detection of 13C-1-glucose. This enhancement allowed
a fourfold improvement in time resolution in dynamic 13C MR of 13C-1-glucose
inflow in piglet brain. Phantom experiments demonstrated the efficiency of this
technique for interleaved detection of two spectral regions. Tests with a volume
coil showed the feasibility of signal enhancement by cross polarization over a
large volume of interest.
This chapter is based on the publication: Heteronuclear cross polarization for enhanced sensitivity of
in vivo 1 C MR spectroscopy on a clinical 1.5T MR system. A.J. van den Bergh, H.J. van den
Boogert, A. Heerschap, J Magn Reson, 135: 93-98 (1998)
Chapter 4
Introduction
In vivo 13C MR spectroscopy enables one to obtain metabolic information of
humans not easily obtained by other non-invasive methods. The large chemical
shift range of 13C MR spectra allows the resolution of resonances of a large
number of substances, and thereby the study of some metabolites of which the
signals are difficult to resolve in H MR spectroscopy.
One of the major drawbacks of 13C MR spectroscopy applied to humans is its low
sensitivity, that is a consequence of the low natural abundance (1.1%) and the
low gyromagnetic constant g of the carbon nucleus ( g1H / g13C » 4). Furthermore,
most carbons have attached protons, resulting in multiplet structures which
further decrease sensitivity and complicate spectrum analyses.
Most 13C MR studies performed on humans use proton decoupling to remove the
multiplet-splittings, thereby enhancing sensitivity and resolution (1-5). With
nuclear Overhauser enhancement (NOE) the sensitivity of 13C MR spectroscopy
can be further increased (6-8).
Heteronuclear polarization transfer provides another way to enhance sensitivity.
This polarization transfer can be performed from the sensitive to the insensitive
nucleus or vice versa (9, 10). The theoretically highest signal gain can be
obtained when excitation and detection are performed at the sensitive nucleus
(11-15).
This study focuses on the polarization transfer from protons to carbons to
enhance sensitivity. Only a few studies have been reported in which this was
applied to in vivo 13C MR spectroscopy of humans, e.g., by the SINEPT method
(16, 17) and by the DEPT method (18, 19). An alternative approach, not based
on pulse-interrupted free precession, but by which transfer of magnetization is
achieved by heteronuclear isotropic mixing, has recently been reported to be
feasible in vivo at high magnetic field on a small bore NMR system (20). An
adiabatic variant of this heteronuclear cross polarization has been proposed for
in vivo applications (21). The technique of heteronuclear cross polarization has
64
Heteronuclear { 1H- 13C}crosss polarization at 1.5T
some advantages compared to the pulse-interrupted free precession methods:
(i) the resulting peaks are not in mixed phase as may occur in SINEPT which
makes analyses of the signals easier; (ii) the magnetization transfer function is
less critically dependent on the scalar coupling; (iii) in the DEPT sequence strong
180° refocusing pulses are used, which are often a source of artifacts in the case
of inhomogeneous B1 fields; (iv) the transfer does not depend on the multiplicity
like in DEPT; (v) relaxation losses during the magnetization transfer period are
limited (20); (vi) one can use decoupling without the need for a delay (which
results in a further decrease in enhancement) between the polarization transfer
pulses and the decoupling / acquisition period as in SINEPT (16).
The objective of this study was to explore the potential of heteronuclear { 1H- 13C}
cross polarization, using a WALTZ isotropic mixing period, to enhance the
sensitivity of 13C MR spectroscopy on a clinical MR system at 1.5 T. The
WALTZ-4 based cross polarization sequence is shown in figure 1.
1H
90°
WALTZ-4
decoupling
Figure 1.
The WALTZ-4 based heteronuclear cross polarization sequence. Duration of the WALTZ-4 contact
pulse was 6.5 ms, which is optimal for proton-carbon coupling constants of 150 Hz.
65
Chapter 4
Experimental
Measurements were performed on an 1.5 T Magnetom SP 4000 (Siemens,
Erlangen, Germany) equipped with a second RF transmit channel. Two types of
coil configurations were used for the different 13C / 1H double resonance
experiments, depending on the volume of interest. The surface coil set-up
consisted of an 11 cm diameter 13C transmit / receive surface coil and a 17 x 23
cm 1H transmit / receive butterfly1 coil. As a volume coil an H linear vertically
polarized birdcage constructed within the original housing of a Siemens SP head
coil was used, combined with a transmit / receive 13C horizontally polarized
curved half volume coil (22).
Two pulse sequences were used in this study. First, a 13C pulse-acquire
sequence with optional proton decoupling during the acquisition period and
secondly a cross polarization sequence as described in (23). The mixing period
in the latter sequence consisted of one WALTZ-4 cycle with a duration of 6.5 ms,
decoupling was also optional in this sequence.
For the direct detection experiments the power of the hard 260ms excitation pulse
was optimized for maximal signal intensity. This optimized power level was also
used for the contact pulse in polarization transfer experiments. The RF field
strength of the H coil for decoupling as well as polarization transfer was
optimized for a certain volume using a localized calibration technique (24) which
enables optimal settings for polarization transfer despite the use of two differently
shaped coils.
Phantom studies
To demonstrate the feasibility of this sensitivity enhancement technique several
phantom studies were performed. To test the surface coil set-up we used a
cylindrical phantom with diameter 10 cm, containing sunflower oil, or a solution of
109 mM glycosyl units rabbit liver glycogen. Another phantom spherical in shape,
with diameter 8 cm, contained a solution of glucose, lactate and glutamate. The
66
Heteronuclear { 1H- 13C}crosss polarization at 1.5T
latter phantom was used to study interleaved cross polarization at two different
frequencies.
To investigate the effect of the larger matching volume of the RF fields of the
volume coil set-up we used a large spherical phantom (diameter 15 cm) filled
with sunflower oil. Localized spectra were acquired using 2 dimensional chemical
shift imaging (CSI); the phase encoding was applied after the polarization
transfer from 1H to the 13C nucleus to compare the results with conventional 13C
2D-CSI measurements.
In vivo studies
Postmortem decoupling and cross polarization studies were performed with the
surface coil set-up on a neonatal piglet brain, containing 13C-1 labeled glucose,
to optimize the Hartmann-Hahn matching. In vivo 13C MR spectroscopy was
performed on the brain of an anesthetized neonatal piglet to monitor the influx of
labeled 13C-1-glucose. The piglet was anesthetized with pentobarbital, and
catheterized in the carotid artery. Inside the magnet, anesthesia was maintained
by pump-ventilating with ethrane. During spectroscopy, rectal temperature and
ECG were monitored. Over a period of 15 minutes, glucose 20 % (30% enriched)
(Campro Scientific, Veenendaal, The Netherlands) was infused with an
infusion speed of 0.5 ml/min. In this case cross polarization was performed at
one frequency region to achieve the highest time resolution possible.
Furthermore, 13C MR spectra of the human calf were obtained to show that
signal enhancement using cross polarization is realizable on humans in vivo. In
this experiment, the SAR at the body surface of RF power deposition from the H
surface coil was estimated to be 2.9 Watt/kg, as calculated according to the
procedure described in (24) and this is well below safety guidelines (25). This
SAR value was mainly due to the decoupling part of the sequence, and not the
WALTZ-4 contact period. Contribution of the 13C channel was negligible because
of the much lower duty cycle and its lower frequency (26).
Spectral analyses was performed using Siemens Luise software (Siemens,
Erlangen, Germany). Spectra were zero-filled to 4K data-points, multiplied by a
67
Chapter 4
gauss function of 64 ms, phase and baseline corrected, peaks of interest were
fitted to a gaussian lineshape. Chemical shift imaging data were filtered with a
hamming filter prior to fourier transformation. Spectra of individual voxels were
analyzed as mentioned above.
Chemical shift scaling was performed placing the methyl signal of
tetramethylsilane at 0 ppm.
ß/a C-1 glucose
100
75
C-3 lactate
ppm
50
25
Figure 2.
13C MR spectra recorded from a spherical phantom containing an aqueous solution of glucose 300
mM, lactate 250 mM and glutamate 200 mM. Shown are spectra obtained with a pulse-acquire
sequence (A) compared to spectra (B, C) obtained with chemical shift selective cross polarization.
Measurement parameters were as follows: 256 FIDs were accumulated for spectrum (A), for spectra
(B) and (C) in an interleaved fashion: 2 times 2 blocks of 128 accumulations at each frequency, the
13C frequency was placed at the C-1-glucose region (94 ppm) and at the C-3-lactate region (20 ppm)
with a difference of 1200 Hz. Spectral width was 8 kHz, 512 datapoints were collected, and the
repetition time was 1 s.
68
Heteronuclear { 1H- 13C}crosss polarization at 1.5T
Results
Phantom studies
Figure 2A shows an 1H decoupled 13C MR pulse-acquire spectrum of a phantom
filled with an aqueous solution of glucose, lactate, and glutamate, obtained with a
surface coil set-up. Resonances of carbon spins from all substances are clearly
visible. Spectra in figure 2B and 2C show the results of the enhancement by the
use of chemical shift selective cross polarization applied in an interleaved mode
for two specific spectral regions, i.e., at the C-1 resonance of glucose (94 ppm)
and at the C-3 resonance of lactate (20 ppm). Enhancement factors of both
resonances were 3.1 and 3.6, respectively. The present use of WALTZ-4 based
cross polarization makes the experiment chemical shift selective; polarization
transfer occurs in a small spectral region (yB1/2p » 900 Hz). Cross polarization
experiments targeting a single frequency region were performed with the surface
coil set-up on phantoms containing sunflower oil and a glycogen solution. On the
oil phantom enhancement factors of 3.8 for the unsaturated as well as the
saturated lipid carbon resonances could be achieved, which is close to the
theoretical maximum enhancement of » 4. The signal gain of 2.1 obtained for the
C-1 signal of glycogen in solution was considerably lower.
Experiments with the volume coil and 13C MR spectroscopy acquisition extended
with 2D-CSI localization resulted in the data presented in figure 3. Spectral maps
of the C=C spectral region at 130 ppm of the 2D-CSI data sets are shown; the
spectra drawn in white were obtained with 1H broadband decoupled 13C 2D-CSI.
Spectra drawn in red were obtained with the polarization transfer pulse sequence
optimized for the C=C spectral region; broadband H decoupling was also
applied.
All voxels showed a significant signal increase, signal gains of the individual
voxels ranged from 2.68 to 3.85, mean signal gain was 3.18 (SE = 0.04). The
lowest signals in both experiments are in the top row voxels. These voxels are
69
Chapter 4
outside the sensitive volume of the 13C half volume coil which was wrapped
around the bottom side of the phantom; coil wires are marked in the figure.
■
■
R
3
■
■
I
1
B
G
■
S
i
■
K 1
J
M
I
Id
.AA
■ M i H
i
Hl 1
I Ü É H
i
H
1
Î
i
A
ä
i
T
I
P
f
m
m
■
i
M
l i
H HliM
H
1
ji
H
W
.
■
Ê
i
.
Ê
Ê
..u
K
A
C
Figure 3
Spectral maps obtained from a large spherical phantom containing sunflower oil, measured using an
1H / 13C volume coil configuration. Spectra acquired using heteronuclear cross polarization are
drawn in red, compared to the spectra obtained with a pulse-acquire technique shown in white,
plotted with the same scaling. Positions of the 13C half volume coil wires are indicated.
The matrix size of the CSI data was 16 x 16 x 1024, spectral width was 6 kHz, field of view of 240
mm resulting in a voxel size of 15 x 15 mm, repetition time in both puls-acquire and heteronuclear
cross polarization was 1.5 s, and total measurement time of a CSI data set was 6 min. 36 s. Cross
polarization was optimized for the C=C spectral region around 130 ppm.
In vivo studies
Postmortem cross polarization studies on the brain of a neonatal piglet resulted
in a signal enhancement of 2.2 for the C-1 signals of 13C-labeled glucose,
present in the brain (figure 4A and 4B). Figure 4C shows a stack plot of spectra
70
Heteronuclear { 1H- 13C}crosss polarization at 1.5T
recorded during infusion of 13C labeled glucose using heteronuclear cross
polarization applied in vivo to the brain of a piglet. The time resolution was 3
minutes. The first spectrum was obtained before the start of the 13C-1-glucose
infusion. The subsequent spectra clearly show increasing glucose signals during
the infusion period and a decrease thereafter.
A
----- 1
----- 1
----- 1
----- 1
----- 1
----- 1
----- 1
----- 1
----- 1
---
0
3
6
9 12 15
time (minutes)
18
21
24
Figure 4
13C MR spectra of a postmortem neonatal piglet brain containing 13C-1-glucose are shown in figure
4 A and B. Spectrum A was obtained using heteronuclear cross polarization and spectrum B using
direct detection and proton decoupling. In vivo 13C MR spectra recorded from a neonatal piglet
brain before, during and after administration of 13C-1-glucose are shown in figure 4C. Only the C-1glucose spectral region is shown, 80-110 ppm. Experimental parameters: 240 acquisitions,
repetition time of 750 ms.
In vivo 13C MR spectra of the unsaturated triglyceride carbons originating from
superficial adipose tissue of the human leg are shown in figure 5. For the
71
Chapter 4
spectrum in figure 5A no decoupling was used whereas for the spectrum in figure
5B, WALTZ-4 proton decoupling was applied during the signal acquisition period.
Spectrum C was obtained using both cross polarization and WALTZ-4
decoupling. Enhancement factors for spectrum B and C are respectively 2.7 and
10.6 with respect to the non-decoupled spectrum. A gain larger in magnitude
than 2 for decoupling can be explained by partial NOE. Cross polarization
accounted for a signal gain of 3.9 in the latter experiment. Until now, no signal
enhancement could be achieved in vivo for the C-1 signal of glycogen in human
muscle compared to direct acquisition with enhancement by decoupling and
NOE.
Discussion
This study shows that the sensitivity of 13C MR spectroscopy at the clinical field
strength of 1.5 T can be improved significantly with the use of heteronuclear
cross polarization from protons to carbons. The gains obtained for triglyceride
signals are close to the theoretical value, g1H / g13C » 4. The total gain achieved
with cross polarization, decoupling and NOE was 10.6 for the unsaturated
triglyceride carbons in in vivo 13C MR spectra of the human calf. Polarization
transfer experiments performed on the human calf with which we compare these
results are from Bomsdorf et al. (16). They reported a total signal enhancement
of 6 for the unsaturated fatty acid signals with the use of SINEPT and H
decoupling at 4 T.
Knüttel et al. (27) demonstrated the detection of unsaturated carbons of fatty
acids by an indirect method of selecting 13C attached protons. Theoretically a
higher signal enhancement is possible with this method but the resulting
spectrum showed some disadvantages.
Firstly, only one of the lines of the doublet is visible in the proton detected
spectrum; the other line coincides with the water resonance. Secondly, at the low
resolution in proton detection, one cannot discriminate between mono- and poly72
Heteronuclear { 1H- 13C}crosss polarization at 1.5T
unsaturated fatty acids, as is possible in the cross polarization enhanced 13C
spectrum, see figure 3.
Figure 5.
Natural abundance 13C MR spectra
of the human calf. Spectra were
obtained (A) without 1H decoupling,
(B) with broadband 1H decoupling
using WALTZ-4 and (C) with
heteronuclear cross polarization
optimized for the C=C spectral region
(130 ppm) and broadband 1H
decoupling, using the surface coil
setup. Spectra are plotted on the
same
scaling.
Experimental
parameters:
64
acquisitions,
repetition time of 3 s, 512 data
points, and spectral width 8 kHz.
Subject was a 23 year old female
weighing 52 kg. The study was
performed after an informed consent
was obtained.
A
150
125
ppm
100
In general, indirect detection of carbons in H spectra requires good water
suppression; it often results in distorted baselines and suffers a low spectral
resolution (27-29). With labeled compounds often broadband 13C decoupling is
required during proton detection to obtain maximum signal gain and resolution.
73
Chapter 4
This requires much more power than broadband 1H decoupling during 13C signal
acquisition and is of concern regarding RF deposition safety guidelines.
In phantom studies, detection of the C-1 signal of glycogen using heteronuclear
cross polarization, decoupling and partial NOE resulted in an signal gain of 2.1
compared to direct detection with decoupling and partial NOE. No signal gain
was achieved in vivo with respect to H decoupling and partial NOE. A
significantly lower transfer efficiency for glycogen C-1 compared to lipid signals
was reported for the SINEPT polarization transfer scheme (16, 17). This is likely
due to a shorter (effective) T2 of the glycogen C-1 compared to the triglyceride
carbons. Knüttel et al. showed that detection of liver glycogen is possible using
proton-detected 13C spectroscopy (28).
The most promising application of cross polarization in vivo is probably the
possibility to enhance the time resolution in dynamic 13C-labeling studies. The
increase in magnitude of the C-1 signals of glucose in the neonatal piglet brain
by a factor of 2.2 improves the temporal resolution for detection of these signals
by a factor over 4. An improved time resolution was also reported in a 13C
labeling study of RIF-1 tumors with the use of heteronuclear cross polarization
(20).
Although the effective chemical shift range of the cross polarization method as
applied in this study is limited, it is demonstrated that more chemical shift regions
can be covered by interleaved cross polarization at different frequencies. The
total measurement time, for cross polarization of two chemical shift regions, can
still be shorter than the time to obtain a 13C MR spectrum with the same signal to
noise ratio, using the pulse-acquire method. Chemical shift selective
enhancement by cross polarization at two frequencies has also been reported by
Artemov et al. (20).
In the cross polarization experiments broadband H WALTZ-4 decoupling was
applied during the acquisition period to enable a comparison with the
conventional 1H decoupled 13C MR spectroscopic pulse-acquire technique.
Because of the chemical shift selective character of the present cross
74
Heteronuclear { 1H- 13C}crosss polarization at 1.5T
polarization method broadband decoupling is not really necessary. The use of
CW decoupling relaxes RF power deposition and therefore higher duty cycles
can be used which further decreases measurement times.
Part of the results in this study was obtained with a double surface coil set-up, to
achieve a high signal to noise ratio. However, one problem arises with surface
coils and cross polarization techniques: the RF fields of both coils have to match
to fulfill the Hartmann-Hahn condition. A partly mismatch may have contributed to
the lack of enhancement for the C-1 signal of glycogen from the muscle as
compared to an enhancement of 2.1 for this signal of glycogen in solution.
To achieve easy matching of the RF fields over a large volume of interest, we
explored the use of a homogeneous 1H coil in which a 13C half volume coil was
placed. Calibration of the necessary power to be applied to the H coil was
straightforward. For comparison of the signal gain in the individual CSI voxels the
RF pulse amplitudes used on the 13C half volume coil, in the pulse-acquire
experiment and the cross polarization experiment were set to the same value.
Signal gain was similar for all voxels in the sensitive area of the 13C coil, showing
good Hartmann-Hahn matching of the RF fields over the large volume of the
phantom.
In this study both non-localized spectra and CSI localized spectra were
measured. Improvements in localization can be made by using a slice selective
proton excitation pulse or other means of volume selection like ISIS (8, 9, 18, 19,
30) which can be placed before the polarization transfer element in the
sequence.
Acknowledgement
The authors thank Theo Arts for animal preparation.
75
Chapter 4
References
1.
M. J. Avison, D. L. Rothman, E. Nadel, R. G. Shulman, Detection of human muscle
glycogen by natural abundance 13C NMR. Proc. Natl. Acad. Sci. USA, 85, 1634
1636, (1988).
2. C. T. Moonen, R. J. Dimand, K. L. Cox, The noninvasive determination of linoleic
acid content of human adipose tissue by natural abundance carbon-13 nuclear
magnetic resonance. Magn. Reson. Med., 6 , 140-157, (1988).
3. A. Heerschap, P. R. Luyten, J. I. van der Heyden, L. J. Oosterwaal, J. A. den
Hollander, Broadband proton decoupled natural abundance 13C NMR
spectroscopy of humans at 1.5 T. NMR Biomed., 2, 124-132, (1989).
4. N. Beckmann, In vivo 13C spectroscopy in humans, in "NMR basic principles and
progress vol. 28", 74-99, Springer-Verlag, Berlin Heidelberg,1992.
5. A. J. van den Bergh, S. Houtman, A. Heerschap, N. J. Rehrer, H. J. van den
Boogert, B. Oeseburg, M. T. Hopman, Muscle glycogen recovery after exercise
during glucose and fructose intake monitored by 13C-NMR. J. Appl. Physiol., 81,
1495-1500, (1996).
6.
G. Ende, P. Bachert, Dynamic 13C-1H nuclear polarization of lipid methylene
resonances applied to broadband proton-decoupled in vivo 13C MR spectroscopy
of human breast and calf tissue. Magn. Reson. Med., 30, 415-423, (1993).
7. P. A. Bottomley, C. J. Hardy, P. B. Roemer, O. M. Mueller, Proton-decoupled,
Overhauser-enhanced, spatially localized carbon-13 spectroscopy in humans.
Magn. Reson. Med., 12, 348-363, (1989).
8.
R. Gruetter, D. L. Rothman, E. J. Novotny, R. G. Shulman, Localized 13C NMR
spectroscopy of myo-inositol in the human brain in vivo. Magn. Reson. Med., 25,
204-210, (1992).
9. W. P. Aue, S. Muller, J. Seelig, Localized 13C NMR spectra with enhanced
sensitivity obtained by volume-selective excitation. J. Magn. Reson., 61, 392-395,
(1985).
10. M. G. Irving, S. J. Simpson, W. M. Brooks, R. S. Holmes, D. M. Doddrell,
Application of the reverse dept polarization-transfer pulse sequence to monitor in
vitro and in vivo metabolism of 13C- ethanol by 1H-NMR spectroscopy. Int. J.
Biochem., 17, 471-478, (1985).
76
Heteronuclear { 1H- 13C}crosss polarization at 1.5T
11. S. M. Fitzpatrick, H. P. Hetherington, K. L. Behar, R. G. Shulman, The flux from
glucose to glutamate in the rat brain in vivo as determined by 1H-observed, 13Cedited NMR spectroscopy. J. Cereb. Blood. Flow. Metab., 10, 170-179, (1990).
12. C. Kunze, R. Kimmich, Motion-insensitive localized 13C spectroscopy using cyclic
and slice-selective J cross polarization. J. Magn. Reson., series B 105, 38-44,
(1994).
13. P. C. van Zijl, A. S. Chesnick, D. DesPres, C. T. Moonen, J. Ruiz Cabello, P. van
Gelderen, In vivo proton spectroscopy and spectroscopic imaging of [1-13C]glucose and its metabolic products. Magn. Reson. Med., 30, 544-551, (1993).
14. E. J. Novotny, Jr., T. Ogino, D. L. Rothman, O. A. Petroff, J. W. Prichard, R. G.
Shulman, Direct carbon versus proton heteronuclear editing of 2-13C ethanol in
rabbit brain in vivo: a sensitivity comparison. Magn. Reson. Med., 16, 431-443,
(1990).
15. D. L. Rothman, K. L. Behar, H. P. Hetherington, J. A. den Hollander, M. R. Bendall,
O. A. Petroff, R. G. Shulman, 1H-Observe/13C-decouple spectroscopic
measurements of lactate and glutamate in the rat brain in vivo. Proc. Natl. Acad.
Sci. USA, 82, 1633-1637, (1985).
16. H. Bomsdorf, P. Roschmann, J. Wieland, Sensitivity enhancement in whole-body
natural abundance 13C spectroscopy using 13C/1H double-resonance techniques
at 4 Tesla. Magn. Reson. Med., 22, 10-22, (1991).
17. M. Saner, G. McKinnon, P. Boesiger, Glycogen detection by in vivo 13C NMR: A
comparison of proton decoupling and polarization transfer. Magn. Reson. Med., 28,
65-73, (1992).
18. N. Beckmann, S. Muller, Analysis of localized polarization transfer for 13C volumeselective spectroscopy with surface coils. J. Magn. Reson., 93, 299-318, (1991).
19. R. Gruetter, G. Adriany, H. Merkle, P. M. Andersen, Broadband decoupled, 1Hlocalized 13C MRS of the human brain at 4 Tesla. Magn. Reson. Med., 36, 659
664, (1996).
20. D. Artemov, Z. M. Bhujwalla, J. D. Glickson, In vivo selective measurement of (113C)-glucose metabolism in tumors by heteronuclear cross polarization. Magn.
Reson. Med., 33, 151-155, (1995).
77
Chapter 4
21. H. Kostler, R. Kimmich, Adiabatic J cross polarization for localized direct and
proton-detected 13C spectroscopy. J. Magn. Reson., Series B 102, 285-292,
(1993).
22. H. J. van den Boogert, A. J. van den Bergh, A. Heerschap. A multipurpose coil
configuration for 1H decoupled 31P or 13C MRS, in "ISMRM 4th Annual Meeting,
New York, 1996," p. 1423
23. D. Y. Artemov, WALTZ-16-Based heteronuclear cross polrization. J. Magn. Reson.,
91, 405-407, (1991).
24. A. J. van den Bergh, H. J. van den Boogert, A. Heerschap, Calibration of the 1H
decoupling field strength and experimental evaluation of the specific RF absorption
rate in 1H decoupled human 13C-MRS. Magn. Reson. Med., 39, 642-646, (1998).
25. F. G. Shellock, E. Kanal, Policies, guidelines, and recommendations for MR
imaging safety and patient management. SMRI Safety Committee. J. Magn. Reson.
Imag., 1, 97-101, (1991).
26. M. Grandolfo, A. Polichetti, P. Vecchia, O. P. Gandhi, Spatial distribution of RF
power in critical organs during magnetic resonance imaging. Ann. N. Y. Acad. Sci.,
649, 176-187, (1992).
27. A. Knuttel, R. Kimmich, K.-H. Spohn, Indirect 13C tomography and volumeselective spectroscopy via proton NMR. I Spectroscopic Techniques. J. Magn.
Reson., 86, 526-541, (1990).
28. A. Knuttel, R. Kimmich, K. H. Spohn, Motion-insensitive volume-selective pulse
sequences for direct and proton-detected 13C spectroscopy: detection of glycogen
in the human liver in vivo. Magn. Reson. Med., 17, 470-482, (1991).
29. D. L. Rothman, A. M. Howseman, G. D. Graham, O. A. Petroff, G. Lantos, P. B.
Fayad, L. M. Brass, G. I. Shulman, R. G. Shulman, J. W. Prichard, Localized proton
NMR observation of [3-13C]lactate in stroke after [1-13C]glucose infusion. Magn.
Reson. Med., 21, 302-307, (1991).
30. R. J. Ordidge, A. Connelly, J. A. B. Lohman, Image-selected in vivo spectroscopy
(ISIS). A New technique for spatially selective NMR spectroscopy. J. Magn. Reson.,
, 283-294, (1986).
66
78
M u s c le g ly c o g e n r e c o v e r y a f t e r e x e r c is e
d u r in g g lu c o s e a n d f r u c t o s e in t a k e
m o n i t o r e d b y 13C - N M R
3 H.
A.J. van den Bergh 1, S. Houtman 2, A. Heerschap 1, N. J. R ehrer,
J. van den Boogert 1, B. Oeseburg , M. T.E. Hopman 2
^Department of Radiology, University of Nijmegen, The Netherlands
2)Department of Physiology, University of Nijmegen, The Netherlands
3)School of Physical Education, Otago University, Dunedin, New
Zealand
Abstract
The purpose of this study was to examine muscle glycogen recovery with
glucose feeding (GF) in comparison to fructose feeding (FF) during the first eight
hours after partial glycogen depletion using 13C Nuclear Magnetic Resonance
(13C-NMR) on a clinical 1.5 T MR system. After measuring the glycogen
concentration of the vastus lateralis (VL) muscle, glycogen stores of the VL were
depleted by bicycle exercise in seven male subjects. During eight hours following
completion of exercise, subjects were orally given either GF or FF, while the
glycogen content of the VL was monitored by 13C-NMR spectroscopy every
second hour. The muscular glycogen concentration was expressed as a
percentage of the glycogen concentration measured before exercise. The
glycogen recovery rate during GF (4.2±0.2 %/h) was significantly higher (p <
0.05) compared to FF (2.2 ± 0.3 %/h). This study shows: 1) muscle glycogen
levels are perceptible by 13C-NMR spectroscopy at 1.5 T, 2) the glycogen
restoration rate is higher following GF compared to FF._______________________
This chapter is based on the publication: Muscle glycogen recovery after exercise during glucose
and fructose intake monitored by 13C-NMR. A.J. van den Bergh, S. Houtman, A. Heerschap, N.J.
Rehrer, H.J. van den Boogert, B. Oeseburg, M.T.E. Hopman, J Appl Physiol, 81:1495-1500 (1996)
2
Chapter 5
Introduction
One of the most important limiting factors in long term muscular performance is
the depletion of glycogen in the working muscle (1-3). It has been suggested that
some of the feelings of tiredness associated with overtraining are related to
lowered glycogen reserves. The resynthesis of muscle glycogen during the
recovery period is therefore an important metabolic process. Muscle glycogen
repletion is highly dependent on adequate carbohydrate (CHO) intake (4, 5).
Biopsy studies of the vastus lateralis (VL) muscle have shown that glucose
feeding (GF) results in a faster recovery of muscle glycogen levels than fructose
feeding (FF) (6).
However, the performance of biopsies is difficult at short time intervals from the
same muscle and it may affect metabolic processes. 13C Nuclear Magnetic
Resonance (13C-NMR) spectroscopy has emerged as an appropriate non
invasive alternative for the assessment of muscle glycogen metabolism. Taylor
et al. (7) showed that the C-1 resonance from glycogen, which is well resolved
from other spectral components, can be used to quantify muscle glycogen levels.
Price et al. (8, 9) studied muscle glycogen resynthesis employing 13C-NMR
spectroscopy. After depletion up to 25% of its original amount, glycogen repletion
was fast in the first hour and slower in the following hours without any feeding.
Recently Moriarty et al. (10) also used 13C-NMR spectroscopy to study glycogen
utilization and restoration in liver and skeletal muscle. In their study, the effect of
the consumption of glucose and sucrose drinks on glycogen repletion was
compared. No difference was detected between glycogen recovery rates (GRRs)
as a result of glucose and sucrose intake. These two studies (9, 10) were
performed at magnet field strengths of 4.7 and 3.0 T. It has been demonstrated
that glycogen depletion and recovery can also be observed at the more
commonly available field strength of 1.5 T (11, 12).
So far no 13C-NMR data is available comparing glycogen restoration during GF
and during FF after glycogen depletion. In the present study muscle glycogen
80
Muscle glycogen recovery monitored by 13C MR spectroscopy
recovery was examined the first 8 hours after depletion during GF and FF with
13C-NMR spectroscopy at 1.5 T.
Methods
Subjects. Seven healthy, well trained, male subjects participated in this study
after an informed consent was obtained. Mean age of the subjects was 24 yr
(range: 23-27 yr), body mass 78 kg (71-90 kg), height 1.87 m (1.79-1.93 m), and
fat percentage 10 % (7.0-12.0 %). The Medical Faculty Ethics Committee
approved this study.
Preparation protocol. At least 1 week before the actual experiments were
performed, the individual maximum power output (Wmax) was determined on an
electromagnetically braked bicycle-ergometer (LODE, The Netherlands), using a
continuous incremental exercise test. The exercise started at 20 Watt (W) and
increased with 20 W/min. The subjects had to maintain the revolution rate
between 60-80 revolutions/min (rpm). The individual Wmax was equal to the last
power output completed for 1 minute with a pedalling rate above 60 rpm.
All subjects performed two glycogen 'depletion-restoration' experiments with at
least five days in between. Subjects were asked not to participate in exhaustive
exercise two days in advance of both experiments and to fast (except for water)
10 hours before the start of the experiments. The actual experiment started with
the determination of the glycogen content of the VL muscle using 13C-NMR
spectroscopy.
Glycogen depletion protocol. All subjects performed bicycle exercise according
to a protocol described by Kuipers et al. (13), in order to deplete the VL of
glycogen. Bicycle exercise was performed on an electro-magnetically braked
bicycle-ergometer. The glycogen depletion protocol consisted of alternating 2
minute intervals of 90 % Wmax and 50 % Wmax. When the subject was unable
to perform at 90 % Wmax, the workload was lowered to subsequently 80 %, 70
% and 60 % Wmax. When 60 % Wmax could not be maintained the exercise
81
Chapter 5
was stopped and the glycogen content of the VL was determined again by
13C-NMR spectroscopy to measure the extent of the glycogen depletion. The
exercise was performed at ± 18 °C, and subjects were free to drink water.
-1
0
1
2
3
4
5
6
7
Figure 1
Schematic presentation of experiment 1 and 2. During 8 hours following glycogen depletion
13C-NMR measurements and feeding hours were alternated. The feeding and NMR hours were
structured as shown in the enlarged sections.
CHO-feeding protocol. During 8 hours after the depletion exercise and the
second NMR measurement, CHO-ingestion was alternated with glycogen
measurements every hour, according to figure 1.
During the CHO-feeding hours, subjects drank 500 ml of a CHO solution at 0
minutes, 250 ml at 30 minutes and 250 ml at 60 minutes. CHO feeding was
given in counter balanced order: in one experiment GF, in the other experiment
FF. CHO solutions consisted of 80 g CHO (AMYLUM NV, Belgium) and 1.15 g
NaCl (MERCK, Germany) dissolved in 950 ml tap-water. The CHO solutions
were stored at ± 6 °C, for an optimal fast resorption.
Blood- and urine samples were obtained to verify possible loss of glucose. Blood
glucose was determined in a capillary blood sample from the finger using a
photometer apparatus (HEMOCUE AB, Sweden). Urine was checked for glucose
using glucosticks (BAYER, Germany).
82
8
Muscle glycogen recovery monitored by 13C MR spectroscopy
During CHO intake the actual 13C-NMR measurement started always exactly 2
hours after the start of the previous 13C-NMR measurement.
13C-NMR spectroscopy. VL glycogen levels were monitored by natural
abundance 13C-NMR spectroscopy at 1.5 T on a Siemens Magnetom SP63/84
(SIEMENS, Germany), equipped with a second radio frequency channel. The
radio frequency probe consisted of two surface coils; a butterfly shaped (0.11 x
0.24 m) 1H-coil and a circular 13C-coil (0.10 m diameter). The proton coil was
used for shimming, imaging and decoupling. The line width at half height of the
water resonance was shimmed below 30 Hz.
The pulse sequence for acquisition of 13C-NMR spectra consisted of an adiabatic
excitation pulse of 2.56 ms length preceded by a low angle hard pulse and a
dephasing gradient to reduce signals from superficial fat. During the first 65 ms
of the acquisition period broadband WALTZ-4 proton decoupling was used. A
chemical shift imaging (CSI) based calibration program was used to compute an
optimum for repetition time and decoupling power within the guidelines for
specific absorption rate (SAR) recommended by the FDA (14). Average power
dissipated at the body surface was 7.5 W/kg and 0.9 W/kg averaged over the
tissue sampled by the coil, calculated according to Heerschap et al. (12). The
repetition time was 0.7 s, the sample width 8000 Hz and the number of data
points was 1024. Each 13C-NMR measurement consisted of 3000 acquisitions,
which equals to 35 minutes of acquisition time. The total measurement time was
50 minutes including imaging and shimming. Possible Nuclear Overhauser
enhancement (NOE) and saturation of the creatine C-3 resonance under the
present measurement conditions were determined for 3 volunteers by acquiring
spectra without decoupling and at a repetition time of 1.4 s. Possible NOE and
saturation of the glycogen C-1 resonance were determined in a 110 mM (glucose
units) glycogen solution.
Positioning. The anterolateral part of the right leg was placed on the 13C-surface
coil with the center of the coil at 65 % of the distance from the spina iliaca
anterior superior to the medial femoral epicondyle. By means of an NMR image
83
Chapter 5
the position of the VL was checked. Once the first glycogen measurement was
done at a certain position this position was reproduced as closely as possible for
the subsequent measurements.
Spectroscopic analysis. The spectroscopic data was analyzed using the software
package Luise (SIEMENS, Germany). Free induction decays (FIDs) were
zerofilled to 4 K, multiplied by a 10 Hz gauss filter, Fourier transformed and
phase and baseline corrected. The C-1 resonance of glycogen and the C-3
resonance of creatine were fitted to a gaussian line shape. The natural line width
at one-half maximum of the C-1 resonance of glycogen before exercise ranged
from 55-89 Hz. The fit program was allowed to vary the line width between 50
100 Hz in all evaluations. These line width limits for the glycogen C-1 resonance
were the only prior knowledge constraints used in the fitting procedure.
Integrated areas of the fits were taken for further evaluation. Signal to noise
ratios (SNRs) were calculated by the formula: 2.5 x signal heigt/peaknoise.
Glycogen restoration data are presented as relative glycogen content (RGC),
with RGC at time t = (peak integral at t/peak integral before depletion) x 100.
Statistical analysis. Least-squares linear regression lines were fitted through the
averaged RGC values (N= 7) of each time point. Slopes and intercepts of both
monosaccharides were tested by analysis of variance for significant differences.
All statistical analysis were two-sided, with p-values < 0.05 considered being
statistically significant.
Results
The mean exercise time of the glycogen depletion protocol was 96 minutes
(range 54-130 minutes). The mean absolute difference within subjects between
the first and second glycogen depletion was 7 minutes in duration, which was not
statistically significant.
Blood glucose during GF (mean ± standard deviation: 6.3 ± 1.4 mM) was
significantly different (p < 0.05) from blood glucose during FF (4.6 ± 0.6 mM).
84
Muscle glycogen recovery monitored by
13
C MR spectroscopy
The blood glucose level remained between 3.1 and 10.0 mM throughout both
feeding periods. Glucosuria was not detected in any subject (loss < 5.5 mM).
chemical shift (ppm)
Figure 2.
13C-NMR spectra recorded pre-exercise (bottom) and post-exercise (top) of the vastus lateralis
muscle of a volunteer obtained during one experiment with glucose intake. The muscle was
depleted up to 62 % of the initial glycogen content.
13
C-NMR spectroscopy. Figure 2 shows two
13
C-NMR spectra obtained at 1.5 T
from the VL muscle of a volunteer during a depletion-repletion experiment with
GF. The bottom spectrum was recorded pre-exercise. Glycogen signals can be
observed at 100.5 ppm (C-1) and also at 70-74 ppm (C-2 - C-5) close to the
glycerol backbone C-2 resonance. The top spectrum was obtained shortly after
exercise. Depletion of muscle glycogen is clearly visible in the top spectrum, for
the resonance at 100.5 ppm and also in the region 70-74 ppm despite the
overlapping signals from the glycerol backbone. Notice the good reproducibility
85
Chapter 5
of the spectra for signals of other muscle compounds, for instance creatine at
157
ppm.
The
reproducibility,
performance, of the
concerning
positioning
and
instrument
13
C-NMR experiment was examined in 3 volunteers.
Glycogen signal levels were measured in the non-depleted state under the same
conditions during two successive examinations. The mean coefficient of variation
was 5.0 ± 4.0 %. The SNR of the glycogen C-1 resonance in the resting state
was found to vary between 4 and 13 with an average of 8 ± 1 ( ± SE). A paired ttest of the SNR values before GF and FF revealed an effective pairing (one tailed
P-value: 0.039) and a non-significant difference between these groups ( two
tailed P-value: 0.99).From each control spectrum, obtained at rest before the
start of a GF or FF experiment, the glycogen/creatine signal integral ratio was
determined. This ratio showed, as with the SNR values, a quite large intersubject
variability: i.e. it ranged from 0.6 to 2.2 with an average of 1.36 ± 0.13 ( ± SE).
However, for all individuals this ratio was almost the same in both experiments. A
paired t-test of the data sets revealed a non-significant difference (two-tailed Pvalue: 0.394), the pairing in this test was very effective (one tailed P-value:
0.0019).
Post-exercise
Feeding
n
Pre-exercise
0 h
2 h
4 h
6 h
8h
Glucose
7
100
48±4
58±7
64±7
72±5
82±5
Fructose
7
100
43±4
52±7
54±6
56±7
63±5
Table 1.
Mean relative glycogen content pre-exercise and post-exercise. Post-exercise values are mean
relative glycogen content ± SE in %; n= no. subjects.
86
Muscle glycogen recovery monitored by
13
C MR spectroscopy
In order to estimate average muscular glycogen content in the VL from the
glycogen-to-creatine signal integral ratios, any NOE and saturation of the C-1
glycogen and C-3 creatine resonances imposed by the present experimental
conditions (decoupling and scan repetition time) were evaluated. For the C-1
resonance of glycogen in solution, no NOE and signal saturation were detected;
this is also expected to be so in vivo (15). For the C-3 resonance of creatine,
signal saturation was not significant, but an enhancement factor of 1.6 ± 0.17
(SE) was observed. If we assume the muscular creatine content to be 42.7 mM
(16) and take a correction factor of 1.6 into account, the average glycogen
content in the nondepleted state in our volunteers is estimated to be 93 ± 8.8 mM
(±SE).
time (hours)
Figure 3.
Muscular glycogen levels during fructose (■) and glucose (A ) feeding (mean and SEM). Linear
regression curves are shown with 95 % confidence intervals.
87
Chapter 5
Glycogen restoration. Table 1 shows the mean RGC values for each point in
time during GF and FF. During the time course of the CHO intake a linear
relationship between glycogen content and time was assumed. Figure 3 shows
the linear regression lines for the glucose (r2 = 0.993) and fructose (r2 = 0.946)
experiments, lines are drawn with their 95 % confidence intervals.
The intercept, representing the glycogen left after depletion, were 48 ± 1.0 (SE)
and 45 ± 1.5 % of the initial glycogen content for GF and FF, respectively, which
is not significantly different. The slope, representing GRR, was significantly
higher (p < 0.05) during GF (4.2 ± 0.2 %/h) than during FF (2.2 ± 0.3 %/h).
Discussion
Although biopsy studies have shown a faster glycogen restoration rate after 10 or
more hours with GF compared with FF, only a few studies have focused on GRR
in humans during the first hours following depletion.
Taylor et al. (7) demonstrated that in vivo
13
C-NMR measurements of muscular
glycogen levels can be performed accurately and with a higher precision than in
biopsy assessment. For the set-up in the present study the precision to measure
glycogen in the non-depleted state appears to be comparable. Employing
creatine C-3 signal as an internal reference the estimated average glycogen
content in the VL of the volunteers is 93 mM, which is sim ilar to the average
glycogen content measured in the human gastrocnemius by
13
C-NMR employing
external standardization.
All subjects refrained from exercise 48 hours prior to the experiments and
performed both experiments at the same time of the day. It is therefore
reasonable to assume that the initial glycogen content in individuals before
exercise was the same in both carbohydrate intake experiments and the GRR
could be compared based on RGC values. This assumption is supported by the
non-significant difference and the effective pairing between control spectra
88
Muscle glycogen recovery monitored by
13
C MR spectroscopy
before GF and FF for the glycogen/creatine signal ratios as well as the SNR of
the C-1 resonance of glycogen.
Because the number of intervals and the total exercise time within subjects was
about equal in both experiments, it is likely that glycogen was depleted to the
same level in both experiments. This is confirmed by the intercepts of the
restoration curves being not significantly different between the two sets of
experiments.
In this study, the first RGC value measured is high compared to values of
approximately 20% reported in other studies (2, 6). This can partly be explained
by the glycogen restoration that occurs during the ± 40 minutes between
cessation of cycling and the actual
13
C-NMR measurement.
The amount of monosaccharides administered in this study (i.e. 80 g every 2 h)
should be sufficient to achieve a maximal glycogen resynthesis rate with GF or
FF (3, 17).
Significant loss of glucose or fructose in the urine or faeces could lead to an
underestimation of the GRR. If CHO was not absorbed in the bowel, this would
lead to osmotic diarrhea, which was not observed in this study. Because glucose
was not detected in the urine of any subject and because fructose in the urine is
very rare, loss of glucose or fructose may considered to be minimal.
Price et al. (9) found a linear and single-phased relationship between glycogen
concentration and time after glycogen depletion to 50 %. Therefore, linear
regression lines were fitted to RGC versus time, to obtain GRR. The finding that
glucose results in a faster muscle glycogen recovery confirms earlier biopsy
studies by Blom et al. (6); however, the recovery rates we found were lower: i.e.,
2.2 %/h versus 3.0 %/h for fructose and 4.2 %/h versus 5.8 %/h for glucose. A
possible explanation for this difference is that glycogen depletion at the start of
our recovery experiments was less than in the experiments performed by Blom
et al. At depletion levels down to 20 %, the glycogen recovery has been reported
to be biphasic (9). A stage of fast recovery followed by a much slower recovery
rate when a level of 30 mM is reached. Another explanation for the slower
89
Chapter 5
recovery rate is the 1 hour interval between cessation of exercise and the start of
the CHO intake. The GRR is reported to be lower if CHO ingestion after exercise
is delayed (18, 19).
To our knowledge, there have been no comparable
13
C-NMR studies on
glycogen restoration with GF or FF with which to compare the results of this
study. However, it has generally been found in biopsy studies that GRR is higher
after GF compared to FF (2, 6, 16). Although fructose probably can be
transformed into glycogen in the skeletal muscle cell (17), several factors may
contribute to a slower muscle glycogen restoration with FF compared with GF. It
may be because of a slower absorption of fructose from the intestine. Because
the blood glucose level during GF is significantly higher than during FF, a higher
plasma insulin level is expected to be present and thus an increased glucose
uptake will occur (20). In addition, fructose gives rise to more liver glycogen than
glucose (4, 21, 22), thus leaving less CHO directly available for muscle glycogen
resynthesis.
Conclusion. This study demonstrates that GF restores muscle glycogen faster
than FF during the first 8 hours after depletion to a level of ±40% of the initial
glycogen content. In general, it appears that
13
C-NMR spectroscopy at 1.5 T is
suitable to monitor physiological changes in muscle glycogen levels.
Acknowledgements
The authors thank B. Ringnalda and A.C.A. Visser for valuable advises and
gratefully acknowledge the participation of the subjects, who were extremely
cooperative. AMYLUM (Belgium) kindly granted the glucose and fructose needed
for this study.
References
1.
J. Bergstrom, E. Hultman, A study of the glycogen metabolism during exercise in
man. Scand. J. Clin. Lab. Invest., 19, 218-228, (1967).
90
Muscle glycogen recovery monitored by
2.
13
C MR spectroscopy
R. K. Conlee, Muscle glycogen and exercise endurance: a twenty-year perspective.
Exerc. Sport. Sci. Rev., 15, 1-28, (1987).
3.
E. Hultman, Studies on muscle metabolism of glycogen and active phosphate in
man with special reference to exercise and diet. Scand. J. Clin. Lab. Invest. Suppl.,
94, 1-63, (1967).
4.
D. L. Costill, M. Hargreaves, Carbohydrate nutrition and fatigue. Sports. Med., 13,
86-92, (1992).
5.
J. O. Holloszy, F. W. Booth, Biochemical adaptations to endurance exercise in
muscle. Annu. Rev. Physiol., 38, 273-291, (1976).
6.
P. C. Blom, A. T. Hostmark, O. Vaage, K. R. Kardel, S. Maehlum, Effect of different
post-exercise sugar diets on the rate of muscle glycogen synthesis. Med. Sci.
Sports. Exerc., 19, 491-496, (1987).
7.
R. Taylor, T. B. Price, D. L. Rothman, R. G. Shulman, G. I. Shulman, Validation of
13C NMR measurement of human skeletal muscle glycogen by direct biochemical
assay of needle biopsy samples. Magn. Reson. Med., 27, 13-20, (1992).
8.
T. B. Price, D. L. Rothman, M. J. Avison, P. Buonamico, R. G. Shulman, 13C-NMR
measurements of muscle glycogen during low-intensity exercise. J. Appl. Physiol.,
70, 1836-1844, (1991).
9.
T. B. Price, D. L. Rothman, R. Taylor, M. J. Avison, G. I. Shulman, R. G. Shulman,
Human muscle glycogen resynthesis after exercise: insulin- dependent and independent phases. J. Appl. Physiol., 76, 104-111, (1994).
10.
K. T. Moriarty, D. G. O. McIntryre, K. Bingham, R. Coxon, P. M. Glover, P. L.
Greenhaff, I. A. Macdonald, H. S. Bachelard, P. G. Morris, Glycogen resynthesis in
liver and muscle after exercise: measurement of the rate of resynthesis by 13C
m agnetic resonance spectroscopy. Magma, 2, 429-432, (1994).
11.
N. Beckmann, J. Seelig, H. W ick, Analysis of glycogen storage disease by in vivo
13C NMR: comparison of normal volunteers with a patient. Magn. Reson. Med., 16,
150-160, (1990).
12.
A. Heerschap, P. R. Luyten, J. I. van der Heyden, L. J. Oosterwaal, J. A. den
Hollander,
Broadband
proton
decoupled
natural
abundance
13C
NMR
spectroscopy of humans at 1.5 T. NMR Biomed., 2, 124-132, (1989).
13.
H. Kuipers, H. A. Keizer, F. Brouns, W. H. Saris, Carbohydrate feeding and
glycogen synthesis during exercise in man. Pflugers Arch., 410, 652-656, (1987).
91
Chapter 5
14.
A. J. van den Bergh, H. J. van den Boogert, H. Heerschap. Spatially localized
calibration of the decoupler radio frequency field strength, in "SMR 2nd Meeting,
San Francisco, 1994," p. 760
15.
L. H. Zang, M. R. Laughlin, D. L. Rothman, R. G. Shulman, 13C NMR relaxation
times of hepatic glycogen in vitro and in vivo. Biochemistry, 29, 6815-6820, (1990).
16.
R. C. Harris, E. Hultman, L. O. Nordesjo, Glycogen, glycolytic intermediates and
high-energy phosphates determined in biopsy samples of musculus quadriceps
femoris of man at rest. Methods and variance of values. Scand. J. Clin. Lab. Invest.,
33, 109-120, (1974).
17.
J. Bergstrom, E. Hultman, Synthesis of muscle glycogen in man after glucose and
fructose infusion. Acta. Med. Scand., 182, 93-107, (1967).
18.
J. L. Ivy, M. C. Lee, J. T. Brozinick, Jr., M. J. Reed, Muscle glycogen storage after
different amounts of carbohydrate ingestion. J. Appl. Physiol., 65, 2018-2023,
(1988).
19.
J. L. Ivy, A. L. Katz, C. L. Cutler, W . M. Sherman, E. F. Coyle, Muscle glycogen
synthesis after exercise: effect of tim e of carbohydrate ingestion. J. Appl. Physiol.,
64, 1480-1485, (1988).
20.
P. Vollenweider, L. Tappy, D. Randin, P. Schneiter, E. Jequier, P. Nicod, U.
Scherrer, Differential effects of hyperinsulinemia and carbohydrate metabolism on
sym pathetic nerve activity and muscle blood flow in humans. J. Clin. Invest., 92,
147-154, (1993).
21.
C. F. Cori, The fate of sugar in the animal body. III. The rate of glycogen formation
in the liver of normal and insulinized rats during the absorption of glucose, fructose,
and galactose. J. Biol. Chem., 70, 577-585, (1926).
22.
L. H. Nilsson, E. Hultman, Liver and muscle glycogen in man after glucose and
fructose infusion. Scand. J. Clin. Lab. Invest., 33, 5-10, (1974).
92
A s s e s s m e n t o f h u m a n
6
s y n th e s is
a n d
m u s c le
to ta l g lu c o s e
v i v o 13C M R s p e c t r o s c o p y
c la m p
g ly c o g e n
c o n t e n t b y in
u n d e r e u g ly c e m ic
c o n d itio n s
1
2
A. J. v a n d e n B e r g h , C. J . J . T a c k , H. J. v a n d e n
B o o g e r t 1, G . V e r v o o r t 2 , P. S m i t s 3, A . H e e r s c h a p 1
1
2
Department of Radiology , Department of Internal Medicine ,
Department of Pharmacology , University Hospital Nijmegen,
The Netherlands
Abstract
Obesity is often accompanied by a decreased ability of insulin to stimulate
glucose uptake and glycogenesis in skeletal muscle. The aim of this study was to
investigate the rate of glycogen formation and of muscular glucose content in
relation to
insulin sensitivity under euglycemic conditions. W e applied
2
a
1
hyperinsulinemic (430 pmol^m •min ) euglycemic clamp with infusion of 20%
glucose (30 % enriched with
13
C-1-glucose) to 8 subjects with a wide range of
insulin sensitivities. Glycogen and glucose levels were monitored simultaneously
by
13
C MR spectroscopy of the calf muscle on a clinical MR system at 1.5T field
strength.
Glycogen synthesis rate showed a strong correlation with whole body glucose
uptake during the clamp (r=0.93, P<0.01). With the use of
13
C MR spectroscopy,
total muscular glucose content could be determined in vivo, and showed a
positive,
linear correlation with glycogen synthesis
rate
(r=0.85,
P<0.01).
Preliminary results indicate that the glycogen synthesis rate improves after
treatment with troglitazone.
This chapter is based on a paper submitted to European Journal of Clinical Investigations
Chapter 6
Introduction
Insulin resistance is a feature of several related disorders like non-insulin
dependent diabetes mellitus (NIDDM), hypertension, obesity and dyslipidemia (1
4). In healthy subjects most of the insulin-induced glucose uptake in muscle is
metabolized to glycogen (5, 6). The principal defect in insulin resistance appears
to be a decreased insulin-induced glucose uptake in skeletal muscle, which is
reflected in a decreased glycogen synthesis (6).
The rate of glycogen formation in response to insulin, however is difficult to
assess in humans in vivo, and requires sequential muscle biopsies. Furthermore,
the changes in glycogen concentrations maybe so small that they cannot be
detected
with
accuracy
by
current
In vivo
biopsy techniques.
13
C MR
spectroscopy of muscle, pioneered by R. Shulman and colleagues (7, 8), offers
an attractive alternative permitting non-invasive and continuous measurement of
muscle glycogen levels (9-13). Moreover, with the use of
13
C-enriched glucose
infusion, the sensitivity of the measurement can be further increased and both
the monitoring of glycogen synthesis and of total glucose content in muscle has
become possible (14-17).
By combining
13
C MR spectroscopy with a hyperglycemic-hyperinsulinemic
clamp, it was demonstrated that muscle glycogen synthesis rate is decreased in
subjects with NIDDM as compared to normal subjects (18). Similar findings were
obtained in obese subjects (19). Up to now, most
13
have used hyperglycemic conditions to measure
C MR spectroscopic studies
13
C-1-glucose and
13
C-1-
glycogen formation (14, 15, 18). Application of hyperglycemia in nondiabetic
subjects has some specific disadvantages such as the nonphysiologic glucose
concentrations, the necessity to use somatostatin to suppress endogenous
insulin secretion and the high volume load, which all may influence the outcome
of a study. Only a limited number of studies have been performed on healthy non
insulin resistant subjects under euglycemic clamp conditions (17, 20, 21), but not
yet as a function of insulin resistance. In addition, previous measurements were
94
13
C MR spectroscopy of muscle glycogen synthesis and glucose
performed at high magnetic fields ( > 2T ), not widely available in the clinical
situation.
The first aim of the present study therefore was to demonstrate that muscle
glycogen
formation
and
simultaneously by in vivo
muscle
glucose
content
can
be
monitored
13
C MR spectroscopy at the commonly available field
strength of 1.5T, under euglycemic clamp conditions. Secondly, we addressed
the question how these non-invasively measured parameters correlate with
insulin sensitivity, in a group of non-diabetic volunteers with a wide range of
insulin sensitivities.
In addition we tested if the above described measurement conditions could
detect changes in insulin sensitivity within a subject. In order to perform this
examination, three insulin resistant obese subjects (BMI > 30) were also studied
after 8 weeks of treatment with troglitazone. Troglitazone, a member of the class
of thiazolidine-diones, is capable of improving insulin sensitivity in patients with
diabetes and in obese subjects (22-26). In vitro studies have shown a beneficial
effect on glycogen synthesis in human skeletal muscle cultures obtained from
insulin resistant obese subjects (27). Troglitazone may thus improve glycogen
synthesis in vivo in humans.
Subjects, materials and methods
Eight healthy male volunteers were studied. Inclusion criteria were: age between
20-50 years, non-smoking, absence of hypertension and a normal fasting plasma
glucose concentration. Subjects varied from lean to obese. Three obese subjects
with BMI > 30 kg/m were studied twice. Subjects received either troglitazone
400 mg daily, or placebo for a period of eight weeks in a randomized, double
blind, cross over design. These subjects were selected from a larger randomized
trial (26). All subjects gave written informed consent. The protocol was approved
by the hospital ethics committee.
13
C MR spectroscopy of the calf muscle, combined with hyperinsulinemic (430
2
1
pmol^m •min ) euglycemic clamps were performed after an overnight fast. A
95
Chapter 6
catheter (Venflon® , 2 0 G , 3 2 m m ) w as inserted into a large forearm vein for the
13
infusion of insulin and glucose 2 0 % solution (30 % enriched with
C -1 glu co se)(C am p ro Scientific, V e e n e n d a a l, T h e N etherlands). Blood w as sam pled
from the collateral side with 7.5 minute intervals. P lasm a glucose levels w ere
m easured by the glucose oxidation method (B eckm an Glucose A nalyzer 2,
B eckm an Instrum ents Inc, Fullerton, C A, U S A ). W h o le body glucose uptake,
derived from glucose infusion rate, w as calculated during the last hour of the
clam p and expressed in mmol^kg'^min'1.
Blood sam ples for insulin m easu rem en ts w ere taken before and at the end of the
euglycem ic hyperinsulinem ic clam p. P lasm a insulin w as m easured with a double
antibody radioim m unoassay (interassay coefficient of variation 6 .2 % ).
13
C M R spectroscopy w as perform ed at 1.5 T using a whole body M R system
(M agn eto m S P , S iem ens, Erlangen, G erm any). Subjects w ere placed in a supine
position with the calf m uscle positioned on a double surface coil. T h e coil
13
1
configuration consisted of an 11 cm circular C surface coil and a 17 x 2 3 cm H
butterfly coil.
T h e proton coil w as used for M R im aging, m agnet field shim m ing and
H
decoupling. T h e line width at o ne-half the height of the w a te r resonance w as
shim m ed to below 2 5 Hz.
13
Proton decoupled
C M R spectra w ere collected with a tim e resolution of 15
minutes. D ata acquisition conditions w ere as follows: 2 .5 6 ms sincos excitation
pulse, pulse repetition tim e of 180 ms, 1 024 datapoints w ere collected, spectral
bandwidth of 6 kH z, the num ber of averag es w as 5 0 0 0 . Continuous w ave proton
1
decoupling w as applied at the H frequency of the glycogen C-1 proton during the
first 50 ms of the acquisition period. Continuous w ave decoupling w as sufficient
for decoupling of the glycogen C-1 and glucose C-1 signal regions. T h e specific
absorption rate (S A R ) at the body surface w as kept below F D A guidelines (28)
using an empirical procedure to predict the local S A R (29).
Spectral analysis w as
perform ed
using Luise softw are
(S iem ens,
Erlangen
G erm an y). Spectra w ere zerofilled, multiplied by a 10 H z gaussian filter, phase
96
13
C MR spectroscopy of muscle glycogen synthesis and glucose
and baseline corrected. Signals of creatine C-3, glycogen C-1 and glucose C-1 a
and C-1ß were fitted to a gaussian line shape for further analysis.
Basal glycogen concentrations (glycosyl units) were calculated using creatine as
an internal concentration standard (10, 30-32). Pulse saturation effects and
nuclear Overhauser enhancement (NOE) were measured for the glycogen and
creatine signals in separate experiments, from this a total multiplication factor of
1.17 was derived for the calculation of the basal glycogen concentration. To
obtain glycogen and glucose concentrations from the in vivo
13
C infusion
13
experiments, a correction was made for the
C fractional enrichment determined
from plasma samples obtained at corresponding MR measurement times.
Blood plasma glucose enrichment levels were measured using high resolution
proton NMR. Preparation of plasma samples prior to NMR consisted of
deproteinization by centrifugation for 1 hour at 3000 G over a 10 kD filter
(Sartorius, Göttingen, Germany) (33). From the filtrate 500 ml was taken and 20
ml of D2O with 2,2,3,3-tetradeuteropropionic acid as internal standard was added.
Proton spectra were recorded on an AMX-600 spectrometer (Bruker, Karlsruhe,
Germany). The number of averages was 64, a repetition time of 5 seconds was
used. Spectra were analyzed using WIN-NMR software (Bruker, Karlsruhe,
Germany). Fractional enrichment was calculated from the ratios of the Lorentzian
fitted signals of the proton attached to the
12
C/
13
C a-C1-glucose.
Glycogen synthesis rate was obtained by fitting MR data of glycogen increase
over a period of 75 minutes with linear regression.
Total muscle glucose levels were determined from the in vivo
13
C MR spectra at
the end of the infusion when glucose levels were in steady state. Saturation
effects and NOE are unknown for the glucose C-1 signals with respect to the C-3
creatine signal so glucose levels are expressed in arbitrary units with respect to
the creatine signal.
97
Chapter 6
t=30
t=0 (min.)
110
100
90
ppm
Figure 1
In vivo 13C MR spectra recorded of the human calf muscle at 1.5T under euglycemic
hyperinsulinemic conditions. The first spectrum at the bottom shows the natural abundance C-1
signal of glycogen. During the clamp signals from both glucose anomers are clearly visible. The
strong increasing intensity for the C-1 signal of glycogen shows the incorporation of labeled glucose.
The insert show the integral values of the fitted signals from creatine, glycogen and glucose.
98
13
C MR spectroscopy of muscle glycogen synthesis and glucose
Results
Insulin infusion increased plasma insulin concentrations from 66 ± 12 to 648 ± 47
pmol/l. Plasma glucose concentrations during the euglycemic (»5mM) clamp
were stable in all subjects (mean coefficient of variation 5.94%).
Figure 1 shows a stack plot of spectra recorded during an euglycemic
hyperinsulinemic clamp of
13
C-1-glucose infusion (enrichment 30%), obtained
from a healthy lean subject; only the region around the C-1 signal of glycogen is
presented (89-111ppm). The total
13
C MR spectrum shows resonances for
superficial lipid as well as signals for muscle creatine and other glycogen
carbons. In the first spectrum the natural abundance glycogen signal is clearly
visible, the subsequent spectra not only show an increasing signal intensity for
glycogen but also the appearance of 13C-1 signals for both the a and ß glucose
anomers. These signals represent the total muscular glucose pool: glucose-6phosphate (G6P), intracellular and extracellular glucose. After approximately 90
minutes of infusion, the signals representing glucose reach a plateau. The insert
in figure 1 shows the integral values of the analyzed signals from creatine,
glycogen and glucose against time. This graph demonstrates that the creatine
signals were stable during the clamp, indicating a good reproducibility of the
13
C
MR spectra.
Results of the measurements of the individual subjects are summarized in table
1. The insulin resistant subjects 6, 7 and 8 were measured twice; the suffix -2
indicates the measurement after troglitazone treatment. As can be derived from
the table, there was a tendency for a higher basal muscle glycogen content
measured with in vivo
13
C MR spectroscopy in subjects with a high insulin
sensitivity expressed as whole body glucose uptake (r = 0.68, p < 0.05). In
addition, glycogen synthesis rate showed a strong correlation (r = 0.93, p < 0.01)
with whole body glucose uptake as derived from the clamp (see figure 2).
Furthermore, a positive linear correlation (r = 0.85, p < 0.01) was found between
the glycogen synthesis rate and the steady state total muscular glucose content
measured in vivo by
13
C MR spectroscopy.
99
Chapter 6
Subject
age
BMI
WBGU
(years) (kg^m-2) mmol^kg"1^min"1
[INSULIN]
[glycogen] synthesis glucose
before
end
at t=0
rate
content
pmol/l
pmol/l
(mM)
(mM/h)
(a.u.)
1
28
22
90.4
29
502
77.4
18.6
6.3
2
22
24
76.2
29
402
79.8
11.1
5.5
3
23
21
60.7
43
473
92.7
11.7
4.9
4
47
27
41.9
29
796
76.1
5.3
4.5
652
52.7
6.9
4.3
*
5
45
29
43.7
6-1
28
31
35.2
72
724
64.6
6.8
3.9
6-2
28
31
56.9
79
774
62.9
9.4
5.3
7-1
40
34
29.6
108
731
52.7
4.8
4.1
7-2
40
34
30.7
108
832
45.3
6.5
4.8
*
*
51.9
5.2
3.6
100
595
44.1
8.6
4.1
8-1
32
33
31.4
8-2
32
33
43.0
Table 1.
Summarized results from the individual subjects. The suffix -2 indicates the measurement after
troglitazone treatment of these individuals. Insulin concentrations marked by an * were not
determined. Insulin concentrations were measured before and at the end of the clamp. Glucose
content is expressed in arbitrary units.
Discussion
In this study, we demonstrate the feasibility of measuring not only muscular
glycogen
synthesis
rate
but
also total
muscular glucose
content
hyperinsulinemic euglycemic clamp conditions in combination with in vivo
using
13
C MR
spectroscopy at the clinical field strength of 1.5 T.
13
C MR spectroscopy, combined with hyperinsulinemia and
13
C-enriched glucose
infusion, is uniquely suited for detection of glycogen signals in human tissue like
muscle and liver, and allows non-invasive and sequential measuring of glycogen
synthesis rates (7). To date, most studies are performed at high magnetic field
strengths using hyperglycemic clamp conditions (applying enriched
100
13
C-1-
13
C MR spectroscopy of muscle glycogen synthesis and glucose
whole body glucose uptake
(mmol ■kg-1■min-1)
total glucose content
(a.u.)
Figure 2
Figure 2A shows the correlation between glycogen synthesis and the whole body glucose uptake,
reflecting insulin sensitivity. Figure 2B shows the glycogen synthesis rate as a function of the total
muscle glucose content measured by in vivo 13C MR spectroscopy.
glucose), for optimal sensitivity in in vivo
13
C MR spectroscopy. Only a few report
on euglycemic clamp conditions in healthy non insulin resistant subjects (17, 20,
21, 34). In this study, we measured muscle glycogen synthesis rates in vivo by
13
C MR spectroscopy at 1.5T using hyperinsulinemia in combination with
euglycemia in insulin sensitive subjects and also in insulin resistant obese
subjects. The use of normal plasma glucose levels may have advantages,
especially in the study of insulin sensitivity in nondiabetic subjects.
The tendency of a lower basal muscular glycogen concentration in obese insulin
resistant subjects is in good agreement with Shulman et al. and Petersen et al.
(18, 19) who report on a lower basal muscular glycogen concentration in obesity,
and an even lower concentration in NIDDM.
The range of glycogen synthesis rates measured in this study are comparable to
the synthesis rates reported earlier during hyperglycemic clamping in normal and
obese subjects (18, 19). The higher insulin level in our study can explain the
101
Chapter 6
similarity of the glycogen synthesis rates between hyperglycemic and euglycemic
clamping. Earlier findings (14, 17, 18) that glucose disposal during the clamp is
mainly accounted for by glycogen synthesis, is reflected in the strong correlation
between glucose infusion rate and glycogen synthesis rate. Data as presented in
figure 2a are in good agreement with data obtained by Roussel et al. at different
glycemic clamp levels (17).
An exciting finding in this study is that the current set-up allows for the non
invasive determination in muscle of total glucose content simultaneously with the
content of glycogen. The relation between the steady state muscle glucose
content and the glycogen synthesis rate appears to be linear. The glucose C-1
signals arise from extracellular glucose, but intracellular glucose and G6P can
also contribute. As the C-1 signals of glucose and G6P have similar chemical
shift positions in the spectra, they can not be discriminated by
13
C MR
spectroscopy (15). It has repeatedly been reported that under euglycemic
conditions no accumulation of intracellular glucose occurs (15, 17, 35). Thus a
reduced total glucose pool as found in insulin resistant subjects can only be
explained by either a lower intracellular G6P concentration or by a reduced
extracellular glucose
pool compared
with
insulin
sensitive
subjects.
The
respective contributions of extracellular glucose and intracellular G6P to the
glucose signals can be estimated. Assuming 70 ml of extracellular water/kg, and
using plasma glucose concentrations we can calculate the extracellular glucose
content during the euglycemic clamp conditions. These conditions were similar
for the insulin resistant and insulin sensitive subjects in our study (36). Using
reported values for G6P content obtained during hyperglycemic hyperinsulinemic
clamp conditions in healthy and insulin resistant obese subjects (19), the
expected signal change due to G6P can be estimated to be 1.16. The change in
total glucose content presented here is much larger than can be attributed to a
change in G6P. A possible explanation is that insulin-mediated muscle specific
tissue recruitment as suggested by Bonadonna et al. (37), may contribute to an
increased total muscular glucose content. This is supported by the fact that
102
13
C MR spectroscopy of muscle glycogen synthesis and glucose
several
studies
have
suggested
an
important
role
for
insulin-induced
vasodilatation (38-41).
A decreased glycogen synthesis rate in insulin resistant obese subjects may thus
be due to a reduced glucose metabolic rate but also due to a defect in glucose
supply to the cell. Thus the total glucose content measured by in vivo
13
C MR
spectroscopy reflecting both defects is an important parameter representing
insulin sensitivity.
Troglitazone, a member of the thiazolidine-diones, a new class of hypoglycemic
drugs, has been shown to improve insulin sensitivity, in NIDDM as well as in
obesity (22, 42). Troglitazone presumably improves insulin action at the level of
the skeletal muscle, but the mechanism of action is com plex and only partly
revealed. In this study we were able to detect changes in glycogen formation in 3
subjects induced by troglitazone. This action of troglitazone, has only recently
been reported in muscle cultures (27). Because we studied obese, insulin
resistant, but nondiabetic subjects, the effect of troglitazone on glycogen
formation cannot be explained by changes in blood glucose concentration
(“glucose toxicity”), and probably represents a direct action of the drug on
skeletal muscle.
In summary, we demonstrated the feasibility of in vivo
1.5T
in
combination
with
an
euglycemic
13
13
C MR spectroscopy at
( C-1
enriched
glucose)
hyperinsulinemic clamp for the measurement of not only glycogen synthesis but
also total muscular glucose content. Baseline muscle glycogen content tended to
be lower in insulin resistant subjects, whereas glycogen synthesis rate and total
muscle glucose content tended to increased in insulin sensitive subjects.
Acknowledgements
The authors thank Arnoud Jansen-van Rosendaal for technical assistance during
clamping experiments. W e thank U. Engelke and R. W evers for their assistance
in analyzing the plasma samples with high resolution proton NMR spectroscopy.
103
Chapter 6
1
H - NMR spectra were recorded at the Dutch hf-NMR facility at the department
of Biophysical Chemistry (head, Prof. Dr. C.W. Hilbers). We also thank J.
Joordens for invaluable help and assistance.
We thank GlaxoWellcome for financial support and for providing Troglitazone.
References
1.
E. Ferrannini, G. Buzzigoli, R. Bonadonna, M. A. Giorico, M. Oleggini, L.
Graziadei, R. Pedrinelli, L. Brandi, S. Bevilacqua, Insulin resistance in
essential hypertension. N. Engl. J. Med., 317, 350-357, (1987).
2.
G. M. Reaven, H. Lithell, L. Landsberg, Hypertension and associated
metabolic
abnormalities--the
role
of
insulin
resistance
and
the
sympathoadrenal system. N. Engl. J. Med., 334, 374-381, (1996).
3.
B. C. Martin, J. H. W arram, A. S. Krolewski, R. N. Bergman, J. S. Soeldner,
C. R. Kahn, Role of glucose and insulin resistance in development of type 2
diabetes mellitus: results of a 25-year follow-up study. Lancet, 340, 925-929,
(1992).
4.
A.
Fontbonne,
Insulin-resistance
syndrome
and
cardiovascular
complications of non-insulin-dependent diabetes mellitus . Diabetes, Metab
22, 305-313, (1996).
5.
R. A. DeFronzo, E. Jacot, E. Jequier, E. Maeder, J. Wahren, J. P. Felber,
The effect of insulin on the disposal of intravenous glucose. Results from
indirect calorimetry and
hepatic and
femoral
venous
catheterization.
Diabetes, 30, 1000-1007, (1981).
6.
R. A. DeFronzo, Lilly lecture 1987. The triumvirate: beta-cell, muscle, liver.
A collusion responsible for NIDDM. Diabetes, 37, 667-687, (1988).
7.
R. G. Shulman, D. L. Rothman, T. B. Price, Nuclear magnetic resonance
studies of muscle and applications to exercise and diabetes. Diabetes, 45
Suppl 1, S93-98, (1996).
104
13
C MR spectroscopy of muscle glycogen synthesis and glucose
8.
R. G. Shulman, G. Bloch, D. L. Rothman, In vivo regulation of muscle
glycogen synthase and the control of glycogen synthesis. Proc. Natl. Acad.
Sci. USA, 92, 8535-8542, (1995).
9.
T. B. Price, D. L. Rothman, R. Taylor, M. J. Avison, G. I. Shulman, R. G.
Shulman, Human muscle glycogen resynthesis after exercise: insulin
dependent and -independent phases. J. Appl. Physiol., 76, 104-111, (1994).
10. A. J. van den Bergh, S. Houtman, A. Heerschap, N. J. Rehrer, H. J. van den
Boogert, B. Oeseburg, M. T. Hopman, Muscle glycogen recovery after
exercise during glucose and fructose intake monitored by 13C-NMR. J.
Appl. Physiol., 81, 1495-1500, (1996).
11. P. Jehenson, D. Duboc, G. Bloch, M. Fardeau, A. Syrota, Diagnosis of
m uscular
glycogenosis
by
in
vivo
natural
abundance
13C
NMR
spectroscopy. Neuromuscul. Disord., 1, 99-101, (1991).
12. N. Beckmann, J. Seelig, H. Wick, Analysis of glycogen storage disease by
in vivo 13C NMR: comparison of normal volunteers with a patient. Magn.
Reson. Med., 16, 150-160, (1990).
13. R. Taylor, T. B. Price, D. L. Rothman, R. G. Shulman, G. I. Shulman,
Validation of 13C NMR measurement of human skeletal muscle glycogen
by direct biochemical assay of needle biopsy samples. Magn. Reson. Med.,
27, 13-20, (1992).
14. T. Jue, D. L. Rothman, G. I. Shulman, B. A. Tavitian, R. A. DeFronzo, R. G.
Shulman, Direct observation of glycogen synthesis in human muscle with
13C NMR. Proc. Natl. Acad. Sci. USA, 86, 4489-4491, (1989).
15. R. Roussel, G. Velho, P. G. Carlier, L. Jouvensal, G. Bloch, In vivo NMR
evidence for moderate glucose accumulation in human skeletal muscle
during hyperglycemia. Am. J. Physiol., 271, E434-438, (1996).
16. R. Roussel, P. G. Carlier, C. Wary, G. Velho, G. Bloch, Evidence for 100%
13C NMR visibility of glucose in human skeletal muscle. Magn. Reson.
Med., 37, 821-824, (1997).
17. R. Roussel, P. G. Carlier, J. J. Robert, G. Velho, G. Bloch, 13C/31P NMR
105
Chapter 6
studies of glucose transport in human skeletal muscle. Proc. Natl. Acad.
Sci. USA, 95, 1313-1318, (1998).
18. G. I. Shulman, D. L. Rothman, T. Jue, P. Stein, R. A. DeFronzo, R. G.
Shulman, Quantitation of muscle glycogen synthesis in normal subjects and
subjects with non-insulin-dependent diabetes by 13C nuclear magnetic
resonance spectroscopy. N. Engl. J. Med., 322, 223-228, (1990).
19. K. F. Petersen, R. Hendler, T. Price, G. Perseghin, D. L. Rothman, N. Held,
J. M. Amatruda, G. I. Shulman, 13C/31P NMR studies on the mechanism of
insulin resistance in obesity. Diabetes, 47, 381-386, (1998).
20.
D. Laurent, K. F. Petersen, R. R. Russell, G. W. Cline, G. I. Shulman, Effect
of epinephrine on muscle glycogenolysis and insulin-stimulated muscle
glycogen synthesis in humans. Am. J. Physiol., 274, E130-138, (1998).
21.
M. Roden, T. B. Price, G. Perseghin, K. F. Petersen, D. L. Rothman, G. W.
Cline,
G.
I. Shulman,
Mechanism
of free
fatty acid-induced
insulin
resistance in humans. J. Clin. Invest., 97, 2859-2865, (1996).
22. J. J. Nolan, B. Ludvik, P. Beerdsen, M. Joyce, J. Olefsky, Improvement in
glucose tolerance and insulin resistance in obese subjects treated with
troglitazone. N. Engl. J. Med., 331, 1188-1193, (1994).
23. S. L. Suter, J. J. Nolan, P. Wallace, B. Gumbiner, J. M. Olefsky, Metabolic
effects of new oral hypoglycemic agent CS-045 in NIDDM subjects.
Diabetes Care, 15, 193-203, (1992).
24.
B. H. Wolffenbuttel, M. B. Graal, New treatments for patients with type 2
diabetes mellitus. Postgrad. Med. J., 72, 657-662, (1996).
25.
M. N. Ghazzi, J. E. Perez, T. K. Antonucci, J. H. Driscoll, S. M. Huang, B.
W. Faja, R. W. W hitcomb, Cardiac and glycemic benefits of troglitazone
treatm ent in NIDDM. The Troglitazone Study Group. Diabetes, 46, 433-439,
(1997).
26. C. J. J. Tack, M. K. E. Ong, J. A. Lutterman, P. Smits, Insulin-induced
vasodilatation and endothelial function in obesity/insulin resistance. Effects
of troglitazone. Diabetologia, 41, 569-576, (1998).
106
13
C MR spectroscopy of muscle glycogen synthesis and glucose
27.
K. S. Park, T. P. Ciaraldi, L. Abrams-Carter, S. Mudaliar, S. E. Nikoulina, R.
R. Henry, Troglitazone regulation of glucose metabolism in human skeletal
muscle cultures from obese type II diabetic subjects. J. Clin. Endocrinol.
Metab., 83, 1636-1643, (1998).
28.
F. G. Shellock, E. Kanal, "Magnetic Resonance bioeffects, safety, and
patient managment.," Raven Press, New York, 1994.
29. A. J. van den Bergh, H. J. van den Boogert, A. Heerschap, Calibration of the
1H decoupling field strength and experimental evaluation of the specific RF
absorption rate in 1H decoupled human 13C-MRS. Magn. Reson. Med., 39,
642-646, (1998).
30. A. Katz, A. D. Lee, G-1,6-P2 in human skeletal muscle after isometric
contraction. Am. J. Physiol., 255, C145-148, (1988).
31. A. Katz, G-1,6-P2, glycolysis, and energy metabolism during circulatory
occlusion in human skeletal muscle. Am. J. Physiol., 255, C140-144,
(1988).
32. S. Rotman, J. Slotboom, C. Boesch, E. Jequier. Muscle glycogen recovery
after exercise measured by 13C-NMR in humans: Effect of nutritional
solutions, in "ESMRMB, Geneva, 1998," p. 562
33. R. A. Wevers,
U.
Engelke, A.
Heerschap,
High-resolution
1H-NMR
spectroscopy of blood plasma for metabolic studies. Clin. Chem., 40, 1245
1250, (1994).
34. D. L. Rothman, I. Magnusson, G. Cline, D. Gerard, C. R. Kahn, R. G.
Shulman,
G.
I.
Shulman,
Decreased
muscle
glucose
transport/phosphorylation is an early defect in the pathogenesis of non
insulin-dependent diabetes mellitus. Proc. Natl. Acad. Sci. USA, 92, 983
987, (1995).
35. A. Katz, B. L. Nyomba, C. Bogardus, No accumulation of glucose in human
skeletal muscle during euglycemic hyperinsulinemia. Am. J. Physiol., 255,
E942-945, (1988).
36. G. Sjogaard, B. Saltin, Extra- and intracellular water spaces in muscles of
107
Chapter 6
man at rest and with dynamic exercise. Am. J. Physiol., 243, R271-280,
(1982).
37. R. C. Bonadonna, M. P. Saccomani, S. Del Prato, E. Bonora, R. A.
DeFronzo,
C. Cobelli,
Role of tissue-specific blood flow and tissue
recruitment in insulin- mediated glucose uptake of human skeletal muscle.
Circulation, 98, 234-241, (1998).
38. E. A. Anderson, R. P. Hoffman, T. W. Balon, C. A. Sinkey, A. L. Mark,
Hyperinsulinemia
produces
both
sympathetic
neural
activation
and
vasodilation in normal humans. J. Clin. Invest., 87, 2246-2252, (1991).
39. M. Laakso, S. V. Edelman, G. Brechtel, A. D. Baron, Decreased effect of
insulin to stimulate skeletal muscle blood flow in obese man. A novel
mechanism for insulin resistance. J. Clin. Invest., 85, 1844-1852, (1990).
40. C. J. Tack, A. E. Schefman, J. L. Willems, T. Thien, J. A. Lutterman, P.
Smits, Direct vasodilator effects of physiological hyperinsulin-aemia in
human skeletal muscle. Eur. J. Clin. Invest., 26, 772-778, (1996).
41.
M.
Raitakari,
P.
Nuutila,
J.
Knuuti,
O.
T.
Raitakari,
H.
Laine,
U.
Ruotsalainen, O. Kirvela, T. O. Takala, H. Iida, H. Yki-Jarvinen, Effects of
insulin on blood flow and volume in skeletal muscle of patients with IDDM:
studies using [15O]H2O, [15O]CO, and positron emission tomography.
Diabetes, 46, 2017-2021, (1997).
42.
D. G. Maggs, T. A. Buchanan, C. F. Burant, G. Cline, B. Gumbiner, W. A.
Hsueh, S. Inzucchi, D. Kelley, J. Nolan, J. M. Olefsky, K. S. Polonsky, D.
Silver, T. R. Valiquett, G. I. Shulman, Metabolic effects of troglitazone
monotherapy in type 2 diabetes mellitus. A randomized, double-blind,
placebo-controlled trial. Ann. Intern. Med., 128, 176-185, (1998).
108
Summary
In the recent decades, Magnetic Resonance Imaging (MRI) has evolved to a
routinely used technique to obtain high quality anatomical information. Magnetic
Resonance Spectroscopy (MRS) does not provide anatomical information but
chemical information of the tissue studied, in the form of a spectrum. The non
invasiveness of MRS makes it an attractive alternative for biopsy methods.
In chapter 1 the current status of human in vivo
13
C MR spectroscopy is
reviewed. Normal and pathological metabolism that can be studied using natural
abundance or labeling in in vivo
13
C MR spectroscopy is described. The
application of double resonance techniques such as decoupling and polarization
transfer
are
experiments.
discussed,
Finally,
with
current
the
required
localization
and
coil
configurations
quantification
for
methods
such
are
described.
In chapter 2 and 3 safety issues regarding RF deposition which may lead to
tissue heating are discussed. In chapter 2, an empirical procedure is described
to estimate the minimal power required to obtain adequately decoupled spectra.
This procedure also enables one to calculate the RF energy deposited in the
1
body during H decoupled
13
C MR spectroscopy. It was shown that for the human
head, liver, muscle gastrocnemius and muscle vastus lateralis decoupling could
be performed within RF deposition safety guidelines.
In chapter 3 the thermoregulatory response of the skin was investigated during
prolonged exposure to several levels of RF radiation by a surface coil.
Temperature changes induced by RF radiation were measured at the skin of the
calf muscle by a fluoroptic probe. Although the temperature increase was higher
at higher applied RF levels, these values did not exceed the recommended
temperature limit for the extremities. This implies that there is a contradiction
between the current guidelines for safe MR operation regarding RF specific
absorption rate and temperature limits for the extremities. The guidelines for
specific absorption rate may be too conservative for humans with normal
thermoregulatory function.
110
Summary
1
13
In chapter 4 the potential of heteronuclear { H- C} cross polarization was
studied for optimization
13
of the signal to noise ratio in in vivo
C MR
spectroscopy. Experiments on the human calf showed a signal gain over tenfold
by
combined
application
of
polarization
transfer
NOE
and
decoupling.
Heteronuclear polarization transfer seems most promising for the study of
dynamic processes, especially when specific
introduced. A dynamic study of inflow of
13
C labeled compounds are
13
C-1-glucose in the neonatal piglet
brain was perfumed.
In chapter 5 the muscle glycogen recovery was examined with glucose feeding in
comparison to fructose feeding during the first eight hours after partial glycogen
depletion
using
13
C
MR
spectroscopy.
After
measuring
the
glycogen
concentration of the vastus lateralis (VL) muscle, glycogen stores of the VL were
depleted by bicycle exercise. During eight hours following completion of exercise,
subjects were orally given either glucose or fructose, while the glycogen content
of the VL was monitored by
13
C-NMR spectroscopy. The glycogen recovery rate
during glucose feeding was significantly higher compared to fructose feeding.
The uptake of glucose in muscle and its metabolism to glycogen in response to
insulin is reduced in diabetes. To investigate these processes in vivo
13
C MR
spectroscopy was applied in combination with the infusion of labelled
13
C
glucose. Furthermore, the effect of troglitazone on insulin sensitivity was
assessed. The results, as described in chapter 6, showed a correlation between
the glycogen synthesis rate and the whole body glucose uptake. With the use of
13
C MR spectroscopy, in vivo muscular glucose levels could be detected, and
showed a positive, linear correlation with glycogen synthesis rate. The improved
glycogen synthesis rate after treatment with Troglitazone is a good indication for
a positive effect of this drug on insulin resistance.
111
Samenvatting
Magnetische
Resonantie
Imaging
(MRI)
wordt tegenwoordig
routinematig
toegepast voor het verkrijgen van anatomische afbeeldingen. Magnetische
Resonantie Spectroscopie (MRS) levert een spectrum op in plaats van een
anatomische afbeelding. Het spectrum bevat informatie over de chemische
samenstelling van het onderzochte weefsel. Daar MRS een noninvasieve
techniek is, is het een aantrekkelijk alternatief voor invasieve biopsiemethoden.
In hoofdstuk 1 worden de huidige ontwikkelingen in in vivo
13
C-MRS gericht op
humane fysiologie en pathologie beschreven. De toepassing en voordelen van
dubbelresonantie technieken zoals protonontkoppeling en polarisatietransfer
worden
beschreven
samen
met de
daarvoor
benodigde
speciale
Radio
Frequente (RF) spoelontwerpen. Tenslotte wordt er een overzicht gegeven van
lokalisatietechnieken en quantificatiemethoden.
In de hoofdstukken 2 en 3 wordt er aandacht besteed aan de veiligheid van
MRS. Met name de absorptie van RF-energie, die kan leiden tot lokale
opwarming van het weefsel, komt hier aan de orde. In hoofdstuk 2 wordt een
methode beschreven, die het mogelijk maakt de minimaal benodigde energie te
bepalen waarbij adequaat ontkoppelde spectra kunnen worden verkregen. Deze
methode kan bovendien gebruikt worden om te bepalen aan welke hoeveelheid
RF-straling het lichaam wordt blootgesteld. Met behulp van deze methode is
aangetoond, dat protonontkoppeling tijdens
13
C-MR spectroscopie van het hoofd,
lever of beenspieren toegepast kan worden binnen veiligheidsrichtlijnen.
In hoofdstuk 3 wordt de temperatuurstijging van de huid onderzocht als gevolg
van langdurige blootstelling aan verschillende niveaus van RF-straling. Ofschoon
er een relatie is tussen het RF-stralingsniveau en de bereikte tem peratuur wordt
bij vermogens boven de richtlijnen de temperatuurlimiet, opgesteld voor de
extremiteiten,
niet
overschreden.
De
resultaten
suggereren
dat
er
een
tegenstrijdigheid is tussen de temperatuur- en vermogenslimieten voor de
extremiteiten.
112
Samenvatting
1
13
De mogelijkheden van heteronucleaire ( H- C) polarisatie transfer technieken
ter verbetering van de gevoeligheid worden onderzocht in hoofdstuk 4. Meer dan
een tienvoudige verbetering was haalbaar voor onderhuids vetweefsel door
toepassing van zowel polarisatietransfer, “NOE” en protonontkoppeling. Deze
techniek is het meest waardevol voor de bestudering van dynamische processen
met specifiek
13
C gelabelde verbindingen zoals glucose. De toepasbaarheid
hiervan is succesvol getoetst op de hersenen van een biggetje.
In hoofdstuk 5 wordt met behulp van in vivo
13
C MRS het herstel van
spierglycogeen onderzocht tijdens voeding met glucose in vergelijking tot
voeding met fructose. Na het meten van de basale spierglycogeenconcentraties
met
13
C MRS, werd de spier uitgeput door uitvoering van een fietsprotocol.
Gedurende de eerste 8 uur in de herstelfase werden
afgewisseld
met
suikeropname
(glucose
of
13
fructose).
C MRS metingen
Glucosevoeding
resulteerde in een significant sneller spierglycogeenherstel dan fructosevoeding.
De opname in de spier van glucose en de omzetting daarvan in glycogeen onder
invloed van insuline spelen een belangrijke rol in de pathologie van diabetes. Om
deze processen te kunnen meten werd
infusie van specifiek gelabeld
13
C MRS toegepast in combinatie met
13
C-1-glucose. Daarnaast werd het effect van het
medicijn Troglitazone op insulineresistentie onderzocht. De resultaten van dit
onderzoek zoals beschreven in hoofdstuk 6, lieten een correlatie zien tussen de
insulinegevoeligheid en de glycogeensynthese-snelheid. Daarnaast was er ook
een positieve lineaire correlatie tussen het totale spierglucosegehalte en de
glycogeensynthese. De verhoging van de glycogeensynthese als gevolg van
behandeling met het middel Troglitazone in insuline resistente personen is een
goede indicatie voor de positieve werking van het medicijn.
113
De totstandkoming van dit proefschrift was geen sinecure voor de betrokken
promovendus. Zonder de invloed en betrokkenheid van vele mensen zou dit
resultaat niet voor u liggen. Het is mij dan ook een groot genoegen om iedereen
die heeft bijgedragen te kunnen bedanken. Een aantal van hen zal ik noemen, in
de hoop niemand te kort te doen.
Bedankt:
•
Prof. dr. A. Heerschap, kortweg Arend, jij zal wel verheugd zijn dat het eerste
‘klinische’ MR spectroscopische boekje voltooid is. Je hebt richting gegeven
aan het onderzoek zonder mij in mijn wetenschappelijke vrijheid te beperken.
•
Erik van den Boogert voor je praktische blik op ‘alles’ en je handigheid met de
soldeerbout. Voor die ene keer het lenen van je ATB.
•
Ad de Koster voor je introductie in de MR spectroscopie.
•
Mijn kamergenoten Marinette van der Graaf, Boudewijn van der Sanden en
René in ’t Zandt voor de vele discussies die soms ook wetenschappelijk
waren. Marinette dank ik in het bijzonder voor het ‘moederen’ tijdens de
congresbezoeken.
•
Mark Rijpkema.
•
Alle laboranten MR voor de vele gezellige uren en voor al die keren dat ik
snel even tussendoor mocht experimenteren. In het bijzonder dank ik Kevin
Pouwel, Jolanda van Nieuwkerk, Denise Janssen-Bell en Yvonne van der
Meulen voor het delen van hun kennis van imaging protocollen.
•
Sibrand Houtman, Maria Hopman, Berend Oeseburg, Cees Tack, Paul Smits,
Gerald Vervoort, Arnoud Janssen van Roosendaal voor hun expertise.
•
Yvonne Wolbert-Heidkamp voor de speciale spectroscopie software.
•
Marietta Domensino voor haar inzet.
•
Leon van Erning voor zijn kritische blik en zijn positieve opstelling.
•
Wim Guyt en Arnoud van Gemert voor de informatietechnologische
ondersteuning.
•
Theo Arts en Gerrie Grutters voor hun deskundigheid bij het uitvoeren van
experimenten met proefdieren.
•
Michel Pawlicz.
•
De technici Piet ten Bhömer en Barry van Haaren voor het ‘in shape’ houden
van de MR.
•
Marijke en Marijke, de ene voor de Afrikaanse cd’s de andere voor het
A TB ’en.
•
Udo Engelke en verder iedereen van het CKSL betrokken bij de opwerking
van plasmamonsters.
•
Alle medewerkers secretariaat Radiologie.
•
Jos Joordens en alle anderen bij de hf-NMR faciliteit voor het meten op de
600 MHz.
•
Peter van Zijl, Delphine Davis and Dimitri Artem ov at the Johns Hopkins
Medical School.
•
Joost den Otter voor zijn relativering van de wetenschap tijdens de vele
sportieve uren en daarop volgende ‘koffiesessies’.
•
Iedereen die zichzelf heeft laten verleiden tot een MR onderzoek.
•
Mijn ouders die mij de mogelijkheid hebben geboden te studeren. Zij hebben
mij geleerd af te maken w aar ik aan begonnen ben. Daarnaast dank ik hun
voor hun doorlopende interesse in de vaak moeilijke materie.
•
Tenslotte blijkt de niet wetenschappelijke steun de belangrijkste te zijn voor
de voltooiing van een proefschrift, Esther bedankt!
Curriculum vitae
Adrianus Johannes van den Bergh werd geboren op 20 oktober 1966 te Breda.
In 1984 behaalde hij zijn HAVO-diploma aan de Katholieke Scholengemeen
schap Markenhage. Datzelfde jaar begon hij aan de opleiding tot analytisch
chemicus/biochemicus aan de HLO te Breda, waarvoor in 1988 met succes het
examen werd afgelegd. Als stage binnen deze opleiding verrichtte hij bij Gist
Brocades te Delft (dr. ir. O. Misset) en Organon International b.v. te Oss (dr.
C.W. Funke) onderzoek wat zich richtte op de stabiliteit en activiteit van
biologische vlekoplossers (proteasen) en op de toepassingen van fourier
transform
infrarood spectroscopie.
In een afstudeeropdracht bij de
laatstgenoemde organisatie deed hij onder leiding van dr. J-R. Mellema structuur
analyse onderzoek naar enkele oligopeptiden met behulp van geavanceerde 2D
NMR-spectroscopie.
In aansluiting op de vervulling van de dienstplicht in 1989 te Roosendaal als
hospik, vervolgde hij zijn opleiding in de vorm van een doctoraalstudie aan de
Katholieke Universiteit Nijmegen. In de studierichting Scheikunde koos hij als
hoofdvak Farmaco-Chemie. Onder begeleiding van prof. dr. C.A.M. van
Ginneken ü-, dr. F.G.M. Russel, dr. R. de Miranda, dr. P. Cox en mevrouw dr. S.
Boom werd onderzoek verricht naar organisch aniontransport in proximale tubuluscellen uit de rattenier. In januari 1992 werd het doctoraal examen afgelegd.
Vanaf februari 1992 tot februari 1997 was hij als assistent in opleiding werkzaam
bij de afdeling Radiologie van het Academisch Ziekenhuis Nijmegen St.
Radboud. Het tijdens deze periode uitgevoerde onderzoek, begeleid door prof.
dr. A. Heerschap, staat beschreven in dit proefschrift.
De heer A.J. van den Bergh heeft in 1994 een stipendium ontvangen voor een
korte wetenschappelijk stage aan de Johns Hopkins Medical School, Department
of Radiology, in Baltimore USA. Aldaar werden diverse dubbel resonantie
technieken en protocollen voor de humane toediening van 13C gelabeled
materiaal bestudeerd.
In de periode na het AIO-schap tot oktober 1998 was A.J. van den Bergh als
onderzoeker werkzaam aan een onderzoek gesubsidieerd door Glaxo
W ellcome. Dit project is totstandgekomen in samenwerking met de vakgroep
Farmacologie (prof. dr. P. Smits), de afdeling Interne Geneeskunde (dr. C.J.J.
Tack en drs. G. Vervoort) en de afdeling Radiologie (prof. dr. A. Heerschap) van
het Academisch Ziekenhuis Nijmegen St. Radboud.
Thans is A.J. van den Bergh als onderzoeker betrokken bij een project met als
doel het meten van foetale hersenen met behulp van 1H MR spectroscopie.
List of Publications
Articles
1.
R. Masereeuw, A. J. van den Bergh, R. J. Bindels, F. G. Russel, Characterization of
fluorescein transport in isolated proximal tubular cells of the rat: evidence for
mitochondrial accumulation. J. Pharmacol. Exp. Ther., 269, 1261-1267, (1994).
2.
A. J. van den Bergh, S. Houtman, A. Heerschap, N. J. Rehrer, H. J. van den
Boogert, B. Oeseburg, M. T. Hopman, Muscle glycogen recovery after exercise
during glucose and fructose intake monitored by 13C-NMR. J. Appl. Physiol., 81,
1495-1500, (1996).
3.
A. J. van den Bergh, H. J. van den Boogert, A. Heerschap, Calibration of the 1H
decoupling field strength and experimental evaluation of the specific RF absorption
rate in 1H-decoupled human 13C- MRS. Magn. Reson. Med., 39, 642-646, (1998).
4.
A. J. van den Bergh, H. J. van den Boogert, A. Heerschap, Heteronuclear cross
polarization for enhanced sensitivity of in vivo 13C MR spectroscopy on a clinical
1.5 T MR system. J. Magn. Reson., 135, 93-98, (1998).
5.
A. Heerschap, C. Houtman, H. J. A. in 't Zandt, A. J. van den Bergh, B. W ieringa,
Introduction to in vivo 31P MR spectroscopy of (human) skeletal muscle. Proc. Nutr.
Soc., (1999). In P ress
Abstracts
1.
S. Houtman, A. J. van den Bergh, N. J. Rehrer, H. J. van den Boogert, A.
Heerschap, B. Oeseburg, M. T. E . Hopman, Muscle glycogen resynthesis using
13C-NMR spectroscopy following depletion: a comparison between glucose and
fructose feeding. Med. Sci. Sports. Exerc., 27(5), s168, (1995).
2.
A. J. van den Bergh, H. J. van den Boogert, A. Heerschap. Spatially localized
calibration of the decoupler radio frequency field strength, in "SMR 2nd Meeting,
San Francisco, 1994," p. 760.
3.
A. J. van den Bergh, H. J. van den Boogert, A. Heerschap. Natural abundance 13C
CSI of the human brain, in "SMR 2nd Meeting, San Francisco, 1994," p. 567.
4.
A. J. van den Bergh, S. Houtman, A. Heerschap, N. J. Rehrer, H. J. van den
Boogert, B. Oeseburg, M. T. Hopman. Muscle glycogen resynthesis during glucose
and fructose feeding, monitored by in vivo 13C-MR spectroscopy, in "SMR 3rd
Meeting, ESMRMB 12th Meeting, Nice, 1995," p. 423.
5.
A. J. van den Bergh, H. J. van den Boogert, A. Heerschap, Dubbelresonantie
technieken voor in vivo 13C NMR. Klinische fysica 2, 32, (1995).
6.
A. J. van den Bergh, H. J. van den Boogert, A. Heerschap, Nieuwe RF-spoel
ontwerp voor multi-nucleaire MRI/MRS. Klinische fysica 4, 31, (1995).
7.
A. J. van den Bergh, H. J. van den Boogert, A. Heerschap. Evaluation of the SAR
for broadband proton decoupled 13C MRS in humans, in "ESMRMB 13th Annual
Meeting, Prague, 1996," p. 69.
8.
A. J. van den Bergh, H. J. van den Boogert, A. Heerschap.
In vivo three
dimensional 13C chemical shift imaging of the human brain, in "ISMRM 4th Annual
Meeting, New York, 1996," p. 1215.
9.
A. J. van den Bergh, C. J. J. Tack, A. Heerschap, P. Smits. In vivo 13C-MRspectroscopische metabole flux meting bij de mens, in "Nederlandse vereniging
voor diabetes onderzoek, Breda, 1996
10.
A. J. van den
Bergh,
H. J. van
den
Boogert, A.
Heerschap.
Euglycemic-
hyperinsulinem ic clamp in healthy volunteers and insulin resistant obese subjects
monitored with in vivo 13C-MR spectroscopy, in "ISMRM 5th Annual Meeting,
Vancouver, 1997," p. 365.
11.
A. J. van den Bergh, H. J. van den Boogert, H. Heerschap. In vivo 13C-NMR
spectroscopy
of
humans:
a
comparison
between
W ALTZ-4
and
adiabatic
broadband 1H decoupling schemes, in "ISMRM 5th Annual Meeting, 1997," p.
1347.
12.
A. J. van den Bergh, C. J. J. Tack, H. J. van den Boogert, P. Smits, A. Heerschap.
Glycogen synthesis rate, as monitored by 13C MRS during an euglycem ichyperinsulinem ic clamp, reflects insulin sensitivity, in "ESMRMB
14th annual
meeting, Brussels, 1997," p. 95.
13.
A. J. van den Bergh, L. VanHamme, S. van Huffel, A. Heerschap. Improving the
SNR of glycogen detection in 13C MRS by multiexponential signal fitting using prior
knowledge, in "ESM RMB 14th annual meeting, Brussels, 1997," p. 571.
14.
A. J. van den Bergh, C. J. J. Tack, P. Smits, A. Heerschap. Glycogen synthesis rate
as monitored by 13C MR spectroscopy reflects insulin sensitivity, in "Nederlandse
vereniging voor diabetes onderzoek, Den Haag, 1997,"
15.
A. J. van den Bergh, C. J. J. Tack, P. Smits, A. Heerschap, Euglycemichyperinsulinem ic clamp in healthy volunteers and insulin resistant obese subjects
monitored with in vivo 13C-MR spectroscopy. Netherlands Journal o f Medicine 50,
a45, (1997).
16.
A. J. van den Bergh, H. J. van den Boogert, A. Heerschap. Skin tem perature in
humans remains below 40 C during local exposure of high power RF levels applied
by a surface coil as used during proton decoupled MRS, in "ESMRMB 15th Annual
Meeting, Geneva, 1998," p. 99.
17.
H. J. van den Boogert, A. J. van den Bergh, H. Heerschap. A multipurpose coil
configuration for 1H decoupled 31P or 13C MRS, in "ISMRM 4th Annual Meeting,
New York, 1996," p. 1423.
MISSIE
Glaxo Wellcome is een op wetenschappelijk onderzoek gebaseerd bedrijf
waarvan de werknemers zich inzetten voor de bestrijding van ziekten.
Zij doen dit door het ontwikkelen van innovatieve medicijnen en services,
voor patiënten en hun zorgaanbieders overal ter wereld.

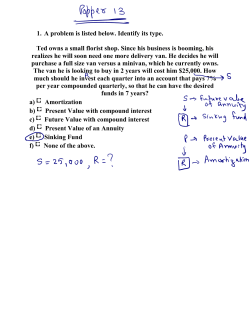


© Copyright 2026