
Effect of Strategic Plan Resource Allocation on Quality Service Delivery in the Sugar Manufacturing Companies in Western Region, Kenya.
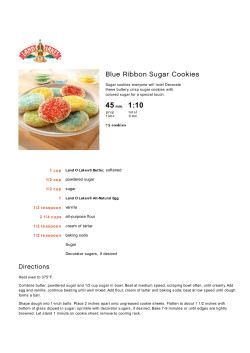
Africa International Journal of Multidisciplinary Research (AIJMR) ISSN: 25239430 (Online Publication) ISSN: 2523-9422 (Print Publication), Vol. 2 (3) 37-48, May 2018 www.oircjournals.org Effect of Strategic Plan Resource Allocation on Quality Service Delivery in the Sugar Manufacturing Companies in Western Region, Kenya. 1Josephat Kiprono Mengich & 2Geoffrey Kimutai Kiptum 1 Jomo Kenyatta University of Agriculture and Technology 2Senior Lecturer, Jomo Kenyatta University of Agriculture and Technology Type of the Paper: Research Paper. Type of Review: Peer Reviewed. Indexed in: worldwide web. Google Scholar Citation: AIJMR How to Cite this Paper: Mengich, J. K and Kimutai K. G., (2018). Effect of Strategic Plan Resource Allocation on Quality Service Delivery in the Sugar manufacturing Companies in Western Region, Kenya. Africa International Journal of Multidisciplinary Research (AIJMR), 2 (3), 37-48. Africa International Journal of Multidisciplinary Research (AIJMR) A Refereed International Journal of OIRC JOURNALS. © With Authors. This work is licensed under a Creative Commons Attribution-Non Commercial 4.0 International License subject to proper citation to the publication source of the work. Disclaimer: The scholarly papers as reviewed and published by the OIRC JOURNALS, are the views and opinions of their respective authors and are not the views or opinions of the OIRC JOURNALS. The OIRC JOURNALS disclaims of any harm or loss caused due to the published content to any party. Mengich and Kimutai (2018) www.oircjournals.org Africa International Journal of Multidisciplinary Research (AIJMR) ISSN: 25239430 (Online Publication) ISSN: 2523-9422 (Print Publication), Vol. 2 (3) 37-48, May 2018 www.oircjournals.org Effect of Strategic Plan Resource Allocation on Quality Service Delivery in the Sugar Manufacturing Companies in Western Region, Kenya. 1Josephat Kiprono Mengich & 2Geoffrey Kimutai Kiptum 1 Jomo Kenyatta University of Agriculture and Technology 2Lecturer, Jomo Kenyatta University of Agriculture and Technology ARTICLE INFO Abstract Service delivery is an essential function in the relation between companies and citizens. Over the past ten years the realization that citizens are customers has become increasingly important to the way companies think and act. The aim of this study was determine effect of strategic plan resource allocation on quality service delivery in the sugar manufacturing Keywords: Service delivery, strategic plan allocation, industry. The study was guided by the Vrooms sugar manufacturing industry, expectancy theory. Accessible population for this study was 734 respondents from Nzoia Sugar Company, Mumias Sugar Company, Chemelil Sugar Company, Kibos Sugar Company, South Nyanza Sugar Company and Soin Sugar Company. Slovin’s Formula was used to get the desired sample size which was 259 employees from the 6 selected sugar companies. The study utilized questionnaires to collect data. Reliability of the instrument was ensured through split-half method. Descriptive statistics and inferential statistics was used to analyze data. Data were presented in form of frequency tables and in written report. Study findings also rejected the null hypothesis because there was a statistical significant effect of strategic total rewards on service delivery in the sugar manufacturing industry (p=0.000). The study enabled policy makers obtain knowledge of manufacturing industry dynamics and the appropriate strategies to be applied to enhance performance and therefore obtain guidance from this study in designing appropriate policies that will regulate the industry. To the academicians the study might contribute to the existing literature in the field of strategy implementation and quality service delivery of sugar manufacturing industry. Article History: Received 2nd May, 2018 Received in Revised Form 10th April, 2018 Accepted 16th May, 2018 Published online 16th May, 2018 1.0 Background of the Study In the modern public sector across the world, the pursuit of service delivery is considered to be an essential strategy (Peppard & Ward, 2016). Many service organizations are responding to the promise of the strategic impact of delivery, treating it as a valuable tool. Delivering quality service to the citizens is critical for success and survival of any public organisation in today’s competitive business environment. Many firms subscribe to the fact that high level service delivery will lead to greater customer loyalty and future revenue. To achieve service quality, organizations consider a number of strategic issues to influence their operations and to make them remain relevant in the market. Strategic operations implemented by a firm are determined by Mengich and Kimutai (2018) factors especially in the internal environment which these organizations have control over (Kiptoo & Mwirigi, 2014). Service delivery is enhanced by strategic planning through providing consistency of actions and ensures that organizational units are functioning towards the same objectives and purpose. Successful organizations are those that can provide goods and services to the customers who want it, where they want it and in the quantity, quality and at the price they want it, thereby delighting rather than merely satisfying customers according to Oakland (2014). Customers are becoming the absolute entity for corporations as the final decision makers for business deals and purchases of products thus the 38 | P a g e www.oircjournals.org Africa International Journal of Multidisciplinary Research (AIJMR) ISSN: 25239430 (Online Publication) ISSN: 2523-9422 (Print Publication), Vol. 2 (3) 37-48, May 2018 www.oircjournals.org importance to establish competitive strategies to enhance service delivery to the customers and all stakeholders (Armstrong & Taylor, 2014). In the Asia a study found that despite the importance of public services, there are large differences in delivery across the world. On this issue, the World Development Report (World Bank, 2012) has most prominently highlighted the large variation in both quality and quantity across a wide range of developing countries, pointing to challenges policy makers and frontline providers face. The report painted a grim picture of the state of public services, stating that “social services fail for the poor. This was done paying particular attention to evidence and lessons for Asia. In the United States of America, Cunningham, Young, Ulaga, & Lee (2014) presents the results of a study that examined how US and French customers perceived and classified a set of 13 services based on multidimensional scaling. Service classifications were developed on a perceptual space where the actual services were mappedfor two countries, the USA and France. The results of the study suggest that there are two underlying dimensions that explain approximately 80 percent of the total variance in service perceptions and classifications. The dimensions and correlations for the classifications and services displayed many consistencies and some differences among American and French consumers. In Belgium, New Public Management (NPM) techniques have been adopted to restructure their public sectors. The country has been widely ‘deconcentrating’ (moving delivery away from the centre) and ‘externalizing’ (using the private sector, either totally or in part) their public services (Torres, & Pina, (2012). The authors chart the extent of this change and highlight some of the problems for example the difficulty countries are experiencing in developing value for money audits. The article questions whether current methods of delivery and audit are appropriate for 21st–century public services. According to study done by Alagaraja, & Egan (2013) on African firms are the most challenging issue in strategy implementation. It lacks commitment and focus from the top management. This is undoubtedly a prerequisite for service delivery. Therefore, the top management must demonstrate their willingness to give energy and loyalty to the implementation process. Lower level managers and supervisors are seldom involved in strategy formulation. By making sure that these managers are part of the strategy process, their Mengich and Kimutai (2018) motivation towards the strategy implementation will increase and they will see themselves as an important part in the process. The involvement of middle managers also helps build consensus for the strategy. It takes good leadership to communicate and convince all employees about the benefits of new strategy. This is a major challenge in strategy implementation. It's not just a task for a few managers; in fact it is for the whole organizational team, right from the management team to the front line employees. Service delivery in Kenya today is focused by many organizations. The focus on service delivery is becoming more competitive, by delivering quality services and launching competitive strategies that give them an edge over others. However, most sugar firms have not been able to formulate strategies required to gain competitive advantage. This calls for a strategic fit of an organization’s core competence levels, technology, leadership styles, markets, culture, people, and environmental influences, which is an emerging paradigm in the study of strategic thinking (Wandera, Imaita & K’Obonyo, 2013). 1.2 Statement of the Problem Service delivery is an essential function in the relation between companies and citizens. Over the past ten years the realization that citizens are customers has become increasingly important to the way companies think and act (Kim & Mauborgne, 2014). Customers have a right to demand services from their suppliers that meet their needs: fast, accessible, of good quality and at modest cost, and all wrapped in friendly treatment. Good quality and affordable service delivery is also a condition for the good image of companies. Service delivery is not an isolated something, but is part of a complex relation between companies, society and citizens (Fukuyama, 2013). The complexity comes in because it involves various dimensions, complex because it is dynamic and complex because the companies are itself a complex body. Services offered by the government controlled sugar companies to their small scale farmers pose specific problems on cane farming among which are low cane yields as a result of improper cane farming and husbandry (Nyaleso & Wambua, 2014). Previous studies have shown that the government controlled companies have failed to perform to the expectations of the stakeholders and among the mostly cited is lack of accountability to the stake holders' which leads to high operating costs' poor services and low profitability (Collier, 2014). Also the sugar industry is constrained by low production capacities, lack of clear harvesting 39 | P a g e www.oircjournals.org Africa International Journal of Multidisciplinary Research (AIJMR) ISSN: 25239430 (Online Publication) ISSN: 2523-9422 (Print Publication), Vol. 2 (3) 37-48, May 2018 www.oircjournals.org schedules, huge debts, managerial inefficiency, cane poaching, unreliable and fluctuating weather conditions outdate technology, equipment and machinery (Otieno, 2015). The factories continue to operate at low capacities due to low levels of technical efficiency and managerial inefficiencies (KSI, 2009 and KSB, 2010). A comparison of TC/TS ratios between private and government owned factories reveals a significant difference. In 2012, the conversion rate for Butali was 9.74 while Chemelil was 18.41 (KSB, 2013). This means Chemelil had to crush an extra 9MT of cane to produce one MT of sugar like Butali. The Kenyan sugar industry sugarcane yield stands at 65tonnes of cane per hectare, which is way below the potential yield of 100 tonnes of cane per hectare under rain-fed conditions (KESREF, 2009). In MSC, cane yield has continuously declined from the high yield of 137 tonnes of cane per ha in 1973 to the current yield of 58 tonnes of cane per hectare (MSC, 2010). A study by Kagwiria and Gichuki (2017) revealed that farmers poor attitude towards contract sugarcane farming was one of the causes of declining trend in cane production. Under contract sugarcane production, the farmer and the milling company have each management obligations of ensuring improved sugarcane productivity. MSC being a large-scale organization has most of the processes managed under bureaucratic structures. It is against the background of declined cane yields that the study sought to investigate effect of strategic implementation on quality service delivery in Kenyan sugar companies, a case of western Kenya 2.0 LITERATURE REVIEW 2.1 Theoretical Review The study was guided by the Vrooms expectancy theory, Deming Theory of profound knowledge and SERVQUAL model. 2.1.1 Vrooms Expectancy theory Vrooms expectancy theory was proposed by Vroom in 1964 (Seongsin, 2007). Expectancy theory (or expectancy theory of motivation) proposes an individual will behave or act in a certain way because they are motivated to select a specific behaviour over other behaviours due to what they expect the result of that selected behaviour will be. In essence, the motivation of the behaviour selection is determined by the desirability of the outcome. However, at the core of the theory is the cognitive process of how an individual processes the different motivational elements. This is done before making the ultimate choice. The outcome is not the sole determining factor in making the decision of how to behave. Mengich and Kimutai (2018) The expectancy theory of motivation explains the behavioural process of why individuals choose one behavioural option over the other (Reeve, 2014). This theory explains that individuals can be motivated towards goals if they believe that; there is a positive correlation between efforts and performance, the outcome of a favourable performance will result in a desirable reward, a reward from a performance will satisfy an important need, and/or the outcome satisfies their need enough to make the effort worthwhile. Vroom introduced three variables within the expectancy theory which are valence (V), expectancy (E) and instrumentality (I). The three elements are important behind choosing one element over another because they are clearly defined: effort-performance expectancy (E>P expectancy), performance-outcome expectancy (P>O expectancy). Victor Vroom's expectancy theory is one such management theory focused on motivation. According to Holdford and Lovelace-Elmore (2013), Vroom asserts, "Intensity of work effort depends on the perception that an individual's effort will result in a desired outcome". In order to enhance the performance-outcome tie, managers should use systems that tie rewards very closely to performance. Managers also need to ensure that the rewards provided are deserved and wanted by the recipients. In order to improve the effort-performance tie, managers should engage in training to improve their capabilities and improve their belief that added effort will in fact lead to better performance. The Vrooms expectancy theory is based on the assumptions that people join organizations considering about their needs, motivations and past experience which influence the way individuals react to the organization (Feather, 2012). Secondly the theory assumes that individual’s behaviour is a result of conscious choice, implying that people are free to choose those behaviours suggested by their own expectancy calculations. Thirdly the theory assumes that people want different things from the organization and lastly it assumes that people will choose among alternative so as to optimize outcomes for them personality. Parijat, &Bagga, (2014) criticism claims that the simplicity of expectancy theory is deceptive because it assumes that if an employer makes a reward, such as a financial bonus or promotion, enticing enough, employees will increase their productivity to obtain the reward. However, this only works if the employees believe the reward is beneficial to their immediate needs. Lawler's new project for expectancy theory is not against Vroom's theory. Lawler argues that since 40 | P a g e www.oircjournals.org Africa International Journal of Multidisciplinary Research (AIJMR) ISSN: 25239430 (Online Publication) ISSN: 2523-9422 (Print Publication), Vol. 2 (3) 37-48, May 2018 www.oircjournals.org there have been a variety of developments of expectancy theory since its creation in 1964; the expectancy model needs to be updated. Lawler's new model is based on four claims. First, whenever there are a number of outcomes, individuals will usually have a preference among those outcomes. Two, there is a belief on the part of that individual that their action(s) will achieve the outcome they desire. Three, any desired outcome was generated by the individual's behavior. Finally, the actions generated by the individual were generated by the preferred outcome and expectation of the individual. Strategic Plan Resource Allocation Implementing and executing strategy entails figuring out all the specific techniques, actions and behaviours that are needed for a smooth strategy supportive operation and then following through to get things done and deliver results (Thompson & Stickland, 2003). The idea is to make things happen and make them happen right. The first step in implementing strategic changes is for management to communicate the case for organizational change so clearly and persuasively to organizational members that a determined commitment takes hold throughout the ranks to find ways to put the strategy into place, make it work and meet performance targets. The ideal condition is for managers to arouse enough enthusiasm for the strategy to turn the implementation process into a companywide crusade (Thompson & Stickland, 2003). For an organization to realize successful implementation of its strategy there is need to adopt the “7 S model" framework that was developed by Mckinsey. This framework was designed to facilitate the analysis of organizations by focusing attention on seven key variables which were subdivided into two categories of hard elements and soft element. The first hard element variables are, 'Strategy' the plan or course of action for allocating scarce resources over time to achieve the organization's objectives and goals. 'Structure' the organizational structure either centralized or divisional structures that can best fit implementation of strategy. 'System' - the formal and informal means by which information is circulated within the organizational set up. The second soft elements are: 'Staff-the availability of organization's personnel in all categories including management who will spearhead the strategy implementation. 'Style'- the leadership and management style, and the organizational culture being adopted by the organization may play a pivotal point in strategy implementation. Skill is the distinctive competence of key persons and the organization as a whole. A shared value is the Representation of fundamental values or philosophies of the organizations Mengich and Kimutai (2018) commitment to its customers, quality, excellence and environment (Ferguson & Milliman, 2014). An organization's successful implementation of strategy depends on the following key supporting factors, the action plan where an organization develops detailed action plans comprising chronological lists of action steps which add the necessary detail to their strategies and assign responsibility to a specific individual for accomplishing each of the action steps. Secondly, the current organization structure must fit the strategy being implemented and the current structure should be appropriate for the intended strategy. Thirdly, organization's success at strategy implementation should consider skilled human resource factor in making strategies happen. Another factor in an organization's successful strategy implementation is the awareness of the need to fund the intended strategies through the annual business plan. Lastly, successful implementation also depends on timely monitoring and controlling which includes periodic reviews to observe if strategy is being implemented appropriately within its allocated resource and timeframe (Kerzner & Kerzner, 2017). A budget is a resource collection that helps strategic managers to coordinate operations and facilitates managerial control of performance. An institution develops a budget to cater for all the activities in the strategic plan. Effective implementation of any strategic plan depends on rational and equitable strategic plan resource allocation across the organization and investment. Strategic plan resource allocation helps strategic managers to coordinate operations and facilitates control of performance. It is important to have a budget for the whole organization or sub-unit. The financial objectives of all the departments should be indicated. The strategic plan is linked to the annual business plan i.e. the budget (Hitt, Ireland, &Hoskisson, 2012). Effective resource allocations ensure that strategies and activities are well funded and that there will be no deficit budgeting during the plan period and in future. Hybrid interventions that combine internal competencies and outsourcing may need to be considered, especially in respect of specific activities. In order to attain financial sustainability, during the planning period, it is necessary to identify alternative sources of revenue to reduce dependency on one revenue line, streamline the collection and accounting for revenue and lobby for enhanced long term funding from the GoK, partners and communities. This should be complemented by structural changes that will ensure that resources are allocated to areas and operations that generate revenue (Ward, 2012). 41 | P a g e www.oircjournals.org Africa International Journal of Multidisciplinary Research (AIJMR) ISSN: 25239430 (Online Publication) ISSN: 2523-9422 (Print Publication), Vol. 2 (3) 37-48, May 2018 www.oircjournals.org The study was based on a conceptual framework showing the relationship between the dependent and variables. Strategic Resource allocation Quality service Quality of products and services Level on product innovation Efficiency of operations Profitability level Sales growth rate Availability of financial resources Level of inventory Level of Human resource skills Level of Information technology Figure 1.1 Conceptual Framework Independent Variable Dependent Variable The dependent variable is measured by the following; the quality of products and services, the level on product innovation, the efficiency of operations, the profitability level and the sales growth rate. While the independent variables of the study include Strategic Resource allocation. Strategic Resource allocation is measured by the availability of financial resources, the level of inventory, the level of Human resource skills and the level of Information technology. Finally on Strategic total Rewards its measures are the availability of Health insurance scheme, the academic opportunity level, the compensation planning and the freedom of expression level 2004). The object of the case study method is to locate the factors that account for the behaviour patterns of the given unit as an integrated totality. The case study undertakes the context of the subject and facilitates in-depth understanding of the subject of study. The study focused on effects of strategy implementation and quality service delivery in sugar manufacturing industry a case of western Kenya sugar manufacturing industries. 3.2 Target Population The target population of this study was various stakeholders consisted of top management middle level managers and employees at six sugar milling factories including Nzoia Sugar Company, Mumias Sugar Company, Chemelil Sugar Company, Kibos Sugar Company, Soin Sugar Company and SouthNyanza Sugar Company. The target population of the study is 406 respondents. The target population is shown in Table 3.1. 3.0 RESEARCH METHODOLOGY 3.1 Research Design The research design used was a case study method. Case study is essentially an intensive investigation of a particular unit under consideration (Kothari, Table 3.1 Target Population Company Nzoia Sugar Company Total Mumias Sugar Company Management Human Resource & Administrative Managers Population 4 Other employees Procurement Officers Operational Managers Procurement Managers Internal Audit Mangers Power And Supply Managers Infrastructure and Development Manager Manager Research 4 3 3 2 2 1 19 3 Engineers Accountants Clerks Field Supervisors Marketing & Sales officers Assistants Research 3 2 Engineers Accountants Human Resource & Administrative Managers Operational Managers Procurement Managers Mengich and Kimutai (2018) Population 12 8 8 9 12 11 6 66 Procurement Officers 7 4 6 42 | P a g e www.oircjournals.org Africa International Journal of Multidisciplinary Research (AIJMR) ISSN: 25239430 (Online Publication) ISSN: 2523-9422 (Print Publication), Vol. 2 (3) 37-48, May 2018 www.oircjournals.org Internal Audit Mangers Power And Supply Managers Infrastructure and Development Manager Research Manager Total Chemelil Sugar Company Total Kibos Sugar Company Total Soin Sugar Company Human Resource & Administrative Managers Operational Managers Procurement Managers Internal Audit Mangers Power And Supply Managers Infrastructure and Development Manager Research Manager Human Resource & Administrative Managers Operational Managers Procurement Managers Internal Audit Mangers Power And Supply Managers Infrastructure and Development Manager Research Manager Human Resource & Administrative Managers Operational Managers Procurement Managers Internal Audit Mangers Power And Supply Managers Infrastructure and Development Manager Research Manager Total SouthNyanza Sugar Company Human Resource & Administrative Managers Operational Managers Procurement Managers Internal Audit Mangers Power And Supply Managers Infrastructure and Development Manager Research Manager Total 2 2 2 1 15 2 Clerks Field Supervisors Marketing & Sales officers Research Assistants 3 2 2 2 1 1 13 2 2 1 1 1 1 1 9 3 2 3 2 2 2 2 16 1 1 1 1 1 1 1 7 Engineers Accountants Clerks Field Supervisors Marketing & Sales officers Research Assistants 8 12 10 3 50 Procurement Officers Procurement Officers Engineers Accountants Clerks Field Supervisors Marketing & Sales officers Research Assistants Procurement Officers Engineers Accountants Clerks Field Supervisors Marketing & Sales officers Research Assistants Procurement Officers Engineers Accountants Clerks Field Supervisors Marketing & Sales officers Research Assistants 10 7 9 7 9 8 3 60 6 4 5 11 11 12 3 52 7 5 5 11 15 11 2 57 4 3 4 12 9 8 2 42 Source: (Kenya Sugar Board, 2018) 3.3 Sample size and Sampling Techniques Sampling means selecting a given number of subjects from a defined population as representative of that population. Any statements made about the sample should also be true of the population (Orodho, 2009). The study used both purposive Mengich and Kimutai (2018) sampling technique and simple random sampling technique. A Simple random sample is a subset of a statistical population in which each member of the subset has an equal probability of being chosen. A purposive sample is a non-probability sample that is selected based on characteristics of a population and the objective of the study. All the top managers (79) were selected purposively using purposive sampling technique while the employees (327) were selected 43 | P a g e www.oircjournals.org Africa International Journal of Multidisciplinary Research (AIJMR) ISSN: 25239430 (Online Publication) ISSN: 2523-9422 (Print Publication), Vol. 2 (3) 37-48, May 2018 www.oircjournals.org using simple random sampling technique. The researcher obtained sample size using Slovin’s Formula (Slovin, 2009). n = N / (1 + Ne2) Where n = Number of samples, N = Total population e = Error tolerance 0.05 Therefore n = 327 / (1 + 327*0.052) n = 180 employees Total sample = 180 employees + 79 managers = 259 respondents This study employed stratified random sampling method which was done according to the structure of Sugar companies (Human Resource & Administrative Managers, Operational Managers, Procurement Managers, Internal Audit Mangers, Power and Supply Managers, Infrastructure and Development Manager, Research Manager, procurement officers, engineers, accountants, clerks, field supervisors, marketing & sales officers and research assistants). 3.5 Research Instruments The study utilized questionnaires to collect data. According to Orodho (2009) each item on the Table 4.1: Questionnaire response rate Questionnaire Administered Returned The regression model: 𝑌 = 𝛽0 + 𝛽1 𝑥1 + 𝜀 Where: 𝑌= quality service delivery; 𝛽0 = the Y intercept when x is zero; 𝛽1 , 𝛽2 , and 𝛽3 , are regression weights attached to the variables; 𝑥1 = Strategic Resource allocation; 𝜀 is the error term. The results of the study were presented using tables and figures. 4.0 DATA ANALYSIS, PRESENTATION AND DISCUSSIONS 4.1 Questionnaire response rate Out of 259 questionnaires given out to respondents only 230 were returned accounting 88.8% response rate. A response rate of 70% and above is adequate according to Mugenda and Mugenda (1999) hence 88.8% response rate was satisfactory for data analysis. This response rate was good enough to make a comprehensive and in-depth analysis of the research objectives. Table 4.1 shows the response rate. Frequency Percentage 259 230 100.0 88.8 4.2 Pilot Study Results In order to ascertain validity and reliability of the research instruments, the researcher piloted the instruments by distributing 20 instruments at Kabras Sugar Company representation 10% of total sample size. The pilot tested scores were used to calculate Cronbach Alpha where a value greater than 0.7 will indicate that the instruments reliable. To test validity, the questionnaires were availed to the supervisors and other specialized lecturers in this Table 4.2 Reliability Test Cronbach's Alpha questionnaire should be developed to address a specific objective, research question. A fully structured questionnaire was developed for this study as it ensures a standardized data collection procedure so that the data obtained are internally consistent and can be analysed in a uniform and coherent manner. Questionnaires, were used since the study is concerned mainly with variables that cannot be directly observed such as views opinions, perception and feeling of the respondents. The target population is literate and given the time constraints, questionnaire is the ideal tool for data collection. field of study in the university to review the test items to ensure that they are based on the content area before commencing data collection. The study used Cronbach’s alpha method to determine the internal consistency of the Variables. The results of the reliability tests were as shown in the (Table 4.2); N of Items 0.733 0.999 4 4 0.964 4 Mengich and Kimutai (2018) 44 | P a g e www.oircjournals.org Africa International Journal of Multidisciplinary Research (AIJMR) ISSN: 25239430 (Online Publication) ISSN: 2523-9422 (Print Publication), Vol. 2 (3) 37-48, May 2018 www.oircjournals.org 0.942 4 The Cronbach’s Alpha was above 0.7 implying that the research instruments were reliable to be used to collect the information. 4.3 Demographic Data Demographic data sought by the study were; gender, marital status, age, level of education. These demographic variables were reflected to have an effect on strategic implementation factors affecting quality service delivery in Kenyan sugar companies in western Kenya region. The findings were as presented in Table 4.3. Table 4.3: Demographic Data Demographic Frequency Percent Male 147 63.9 Female 83 36.1 Total Age 18-25 years 26-35 years 36-45years 46 -above Total Education level Certificate Diploma graduate masters Total Employment period Below 1 years 1-5 years 6-10 years Total 230 100 45 164 3 18 230 19.6 71.3 1.3 7.8 100 29 100 82 19 230 12.6 43.5 35.7 8.3 100 21 169 40 230 9.1 73.5 17.4 100 Gender Table 4.3 shows that majority 147 (63.9%) were males while female were 83(36.1%). This implies both men and women were employees of sugar companies in western Kenya region and therefore both their views were considered vital in the study because they are differently exposed to factors affecting quality service delivery. The study also sought to determine the ages of the respondents in the study and hence they were requested to indicate their ages. Establishing of age groups were relevant as it could give independent and personal experiences on factors affecting quality service delivery in Kenyan sugar companies in western Kenya region. On the ages of the respondents, majority 164(71.3%) of them were of the ages 26-35 years followed by 18-25 years, 46above and 36-45 years at 45(19.6%), 18(7.8%) and 3(1.3%) respectively. This implies that majority of employees in sugar company were of age 26-35 years with energy and have information on factors Mengich and Kimutai (2018) affecting quality service delivery in Kenyan sugar companies in western Kenya region. The study also determined the level of education of the respondents. This was meant to determine whether their level of education had anything to do with quality service delivery in Kenyan sugar companies. Table 4.3 shows that 100(43.5%) of the participants had diploma level of education, 29(12.6%) had a certificate qualification, 82(35.7%) had bachelor’s degree qualification and only 19(8.3%) had achieved post graduate level. This implies that majority of the respondents were learned people hence were able to work in sugar companies and understand factors affecting quality service delivery in Kenyan sugar companies. Moreover, education level shapes an individual opinions and perceptions around service delivery in Kenyan sugar companies. The study went further to determine the years of employment of the respondents. This was meant to determine whether their years of working had 45 | P a g e www.oircjournals.org Africa International Journal of Multidisciplinary Research (AIJMR) ISSN: 25239430 (Online Publication) ISSN: 2523-9422 (Print Publication), Vol. 2 (3) 37-48, May 2018 www.oircjournals.org anything to do with service delivery. According to Table 4.3 majority 169(73.5%) of the participants had worked in sugar company for a period of 1-5 years, 21(9.1%) had had worked in sugar company for a period of less than one year and 40 (17.4%) had worked in sugar company for a period of 6-10 years. This implies that the sugar companies maintain their employees and those employees had enough experiences to give accurate information concerning service delivery. 4.4 Analysis of Strategic Plan Resource Allocation The study determined effect of strategic plan resource allocation on quality service delivery. Descriptive statistics were summarized in Table 4.4. Table 4.4: Descriptive statistics of Strategic Plan Resource Allocation N Mean Std. Dev Variance Min Max The organization allocate skilled human resources in strategy implementation The organization allocate the financial resources to intended strategies to ensure quality service delivery The organization allocate adequate inventory in strategies implementations 230 4.08 .92576 .857 1.00 5.00 230 3.92 1.08129 1.169 1.00 5.00 230 4.01 .98898 .978 1.00 5.00 The allocation Information technology in the organization is done based on level of technology needed by implemented strategy 230 3.94 1.02430 1.049 1.00 5.00 The study findings revealed that majority (mean = 4.08; std. dev = 0.925; var = 0.857) of the respondents agreed that the organization allocate skilled human resources in strategy implementation hence improving the quality of service delivery. The respondents also agreed that the organization allocate the financial resources for intended strategies to ensure quality service delivery (mean = 3.92; std. dev = 1.08; var = 1.17). Respondents also agreed that the organization allocate adequate inventory in strategies implementations (mean = 4.01; stddev = 0.989; var = 0.978). The respondents agreed that the allocation information technology in the organization is done based on level of Table 4.5 Regression Analysis Unstandardized Coefficients B Std. Error (Constant) 2.853 .244 Strategic Resource allocation .099 .016 The study findings in table 4.5 indicated that all the coefficients were significant hence acceptable to be used for multiple correlations as shown below: Quality service delivery= 2.853 + 0.330 (Strategic Resource allocation) Mengich and Kimutai (2018) technology needed by implemented strategy (mean = 3.94; std. dev = 1.02; var = 1.05). The study findings revealed that majority of the respondents agreed that strategic plan resource allocation affects the quality service delivery. By allocating skilled human resources in strategy implementation improve the quality of service delivery, the organization allocate the financial resources to intended strategies to ensure quality service delivery, by allocating adequate inventory in strategies implementations and allocation of information technology in the organization can improve the quality of service delivery. Standardized Coefficients Beta .330 t Sig. 11.707 .000 6.361 .000 The findings above give implications that strategic total rewards for employees positively contributed 65.3% to quality service delivery in sugar companies in western Kenya region, also strategic resource allocation contributed positively by 33.0% quality service delivery in sugar companies in western Kenya region. However, top management support contributed negatively to quality service delivery in 46 | P a g e www.oircjournals.org Africa International Journal of Multidisciplinary Research (AIJMR) ISSN: 25239430 (Online Publication) ISSN: 2523-9422 (Print Publication), Vol. 2 (3) 37-48, May 2018 www.oircjournals.org sugar companies in western Kenya region by 12.9%. This result implies that strategic implementation factors have both positive and negative effects on the quality of service delivery in Kenyan sugar companies. allocation on service delivery in the sugar manufacturing industry. The strategic plan resource allocation has positive contribution towards quality service delivery of sugar manufacturing industry. The study also rejected the null hypothesis because there was a statistical significant influence of strategic plan resource allocation on service delivery in the sugar manufacturing industry (p=0.000). This gives an implication that strategic plan resource allocation has positive contribution towards quality service delivery of sugar manufacturing industry. 5.2 Conclusions The study further concluded that by allocating skilled human resources in strategy implementation improve the quality of service delivery, the organization allocate the financial resources to intended strategies to ensure quality service delivery, by allocating adequate inventory in strategies implementations and allocation of information technology in the organization can improve the quality of service delivery. 5.0 SUMMARY OF FINDINGS, CONCLUSION AND RECOMMENDATIONS 5.1 Strategic Plan Resource Allocation The study findings on objective two revealed that majority respondents were of agreement that the organization allocate skilled human resources in strategy implementation hence improving the quality of service delivery. The respondents also agreed that the organization allocate the financial resources for intended strategies to ensure quality service delivery. Respondents also agreed that the organization allocate adequate inventory in strategies implementations. The respondents agreed that the allocation information technology in the organization is done based on level of technology needed by implemented strategy. In addition the study established that there was a statistical significant influence of strategic plan resource 5.3 Recommendation The researcher recommends that: Top management should have total support on service delivery. The Sugar Company’s top managers should provide employees with the required resources to do their assigned duties in order to improve quality service delivery. The management should also provide employees with the required authority to do their work well. 5.4 Suggestions for Further Research Study recommends future researchers to research on other strategies which affects quality service delivery. These studies should be carried out in other sectors apart from sugar companies which the current study research on. REFERENCES Alagaraja, M., & Egan, T. (2013).The strategic value of HRD in lean strategy implementation. Human Resource Development Quarterly, 24(1), 1-27. Armstrong, M., & Taylor, S. (2014). Armstrong's handbook of human resource management practice. Kogan Page Publishers. Armstrong, R., and Davies, C. T. (2011) "Community Action, Pressure Groups and Education. “Adult Education, 50(3), 149-154 Cater, T., & Pucko, D. (2010). Factors of effective strategy implementation: Empirical evidence from Slovenian business practice. Journal for East European Management Studies, 15(3), 207-236. Choi, K., Ng, A. H., Fobel, R., Chang-Yen, D. A., Yarnell, L. E., Pearson, E. L., ... & Audet, J. (2013). Automated digital microfluidic platform for magnetic-particle-based immunoassays with optimization by design of experiments. Analytical chemistry, 85(20), 9638-9646. Collier, P. M. (2014). Stakeholder accountability: A field study of the implementation of a governance improvement plan. Accounting, Auditing & Accountability Journal, 21(7), 933-954. Cunningham, L. F., Young, C. E., Ulaga, W., & Lee, M. (2014). Consumer views of service classifications in the USA and France. Journal of Services Marketing, 18(6), 421-432. Deming, W. Edwards (2000). The New Economics for Industry, Government, Education (2nd ed.).MIT Press.ISBN 0-262-54116-5.OCLC 44162616. Feather, N. T. (2012).Expectancy‐value theory and unemployment effects.Journal of Occupational and Organizational Psychology, 65(4), 315-330. Ferguson, J. & Milliman, J. (2008). Creating Effective Core Organizational Values: A Spiritual Leadership Approach. Intl. Journal of Public Administration, vol. 31, 4, 439-459. Mengich and Kimutai (2018) 47 | P a g e www.oircjournals.org Africa International Journal of Multidisciplinary Research (AIJMR) ISSN: 25239430 (Online Publication) ISSN: 2523-9422 (Print Publication), Vol. 2 (3) 37-48, May 2018 www.oircjournals.org Fukuyama, F. (2013). What is governance?.Governance, 26(3), 347-368. Hitt, M.A., Ireland, R.D. & Hoskisson, R.E. (2007). Strategic Management: Competitiveness and Globalization, 7th edition. Ohio: Thomson/South Western Holdford & Lovelace-Elmore (2001).Testing commitment-trust theory in relationships between pharmacy schools and students.Am J Pharm Educ; 61:249-56 Kagwiria, F. R. I. D. A. H., & Gichuki, N. (2017). Factors influencing contractual farming in Kenya: A case of Buuri Constituency, Meru County, Kenya. International Academic Journal of Information Sciences and Project Management, 2 (1), 161-178 Kenya Sugar Board (2004).Sugar Industry Strategic Plan 2004-2009.Nairobi. Kenya Sugar Board (2009).Investment Guide.Nairobi. Kenya Sugar Board (2009).Strategic plan 2009-2014.Nairobi. Kenya Sugar Board (2010).Kenya Sugar Industry Strategic Plan 2010-2014; Enhancing Industry Competitiveness. Nairobi. Kenya Sugar Research Foundation (2005).Strategic Plan 2005-2015.Nairobi. Kenya Sugar Research Foundation (2005).Strategic Plan 2009-2014.Nairobi. Kenya Sugar Board (2010). Kenya Sugar Industry strategic plan (2010- 2014) Kim, W. C., & Mauborgne, R. A. (2014).Blue ocean strategy, expanded edition: How to create uncontested market space and make the competition irrelevant. Harvard business review Press. Kiptoo, J. K., & Mwirigi, F. M. (2014).Factors that influence effective strategic planning process in organizations. Journal of Business and Management, 16(6), 188-194. Kimenyi, M.S., S. Ray, and L. Chen (2012); Tools and Techniques for Evaluating Service Delivery, in African Economic and Research Consortium, Institutions and Service Delivery; forthcoming. Kothari CR. (2004). Research Methodology,· methods and techniques. 2nd Revised Edition. New Delhi: New Age International (P) limited, Publishers. Mugenda O. & Mugenda, A. (2003).Research Methods: Quantitative and Qualitative Approaches. Nairobi: Acts press. Nyaleso, C., & Wambua, M. B. K. (2014) Privatization and its effect on service delivery to cane farmers: a case study of Mumias Sugar Company. Oakland, J. S. (2014). Total quality management and operational excellence: text with cases. Routledge. Orodho, J. A. (2009). Elements of Education and Social Science Research Methods, Second Edition. Maseno: Kanezja. Otieno, J. D. (2015). Productivity Of Sugar Factories In Kenya (Doctoral dissertation, University of Nairobi). Parijat, P., & Bagga, S. (2014). Victor Vroom’s expectancy theory of motivation–An evaluation. International Research Journal of Business and Management, 7(9), 1-8. Peppard, J., & Ward, J. (2016).The strategic management of information systems: Building a digital strategy. John Wiley & Sons. Reeve, J. (2014).Understanding motivation and emotion.John Wiley & Sons. Thompson, A.A. & Strickland, A.J. (2003a).Strategic Management- concepts and cases.13th Ed.Tata McGrawHill Publishing. Torres, L., & Pina, V. (2012). Delivering public services—mechanisms and consequences: changes in public service delivery in the EU countries. Public Money and Management, 22(4), 41-48. Wandera, R. W., Imaita, I., & K’Obonyo, P. (2013).Challenges facing the implementation of differentiation strategy in the operations of the Mumias Sugar Company Limited. World Bank, (2012a), World Development Report. Mengich and Kimutai (2018) 48 | P a g e www.oircjournals.org


© Copyright 2026