
S N A
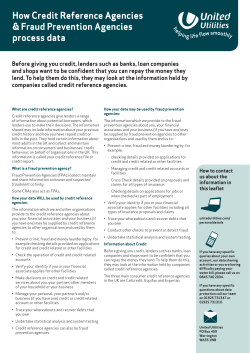
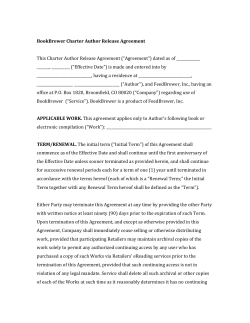
SUPPLEMENTAL NUTRITION ASSISTANCE PROGRAM DEPARTMENT OF CHILDREN AND FAMILY SERVICES PERFORMANCE AUDIT ISSUED MAY 1, 2013 LOUISIANA LEGISLATIVE AUDITOR 1600 NORTH THIRD STREET POST OFFICE BOX 94397 BATON ROUGE, LOUISIANA 70804-9397 LEGISLATIVE AUDITOR DARYL G. PURPERA, CPA, CFE FIRST ASSISTANT LEGISLATIVE AUDITOR AND STATE AUDIT SERVICES PAUL E. PENDAS, CPA DIRECTOR OF PERFORMANCE AUDIT SERVICES NICOLE B. EDMONSON, CIA, CGAP, MPA FOR QUESTIONS RELATED TO THIS PERFORMANCE AUDIT, CONTACT KAREN LEBLANC, PERFORMANCE AUDIT MANAGER, AT 225-339-3800. Under the provisions of state law, this report is a public document. A copy of this report has been submitted to the Governor, to the Attorney General, and to other public officials as required by state law. A copy of this report is available for public inspection at the Baton Rouge office of the Louisiana Legislative Auditor. This document is produced by the Louisiana Legislative Auditor, State of Louisiana, Post Office Box 94397, Baton Rouge, Louisiana 70804-9397 in accordance with Louisiana Revised Statute 24:513. Seven copies of this public document were produced at an approximate cost of $37.38. This material was produced in accordance with the standards for state agencies established pursuant to R.S. 43:31. This report is available on the Legislative Auditor’s website at www.lla.la.gov. When contacting the office, you may refer to Agency ID No. 9726 or Report ID No. 40120014 for additional information. In compliance with the Americans With Disabilities Act, if you need special assistance relative to this document, or any documents of the Legislative Auditor, please contact Kerry Fitzgerald, Chief Administrative Officer, at 225-339-3800. LOUISIANA LEGISLATIVE AUDITOR DARYL G. PURPERA, CPA, CFE May 1, 2013 The Honorable John A. Alario, Jr., President of the Senate The Honorable Charles E. “Chuck” Kleckley, Speaker of the House of Representatives Dear Senator Alario and Representative Kleckley: This report provides the results of our performance audit on the Supplemental Nutrition Assistance Program administered by the Department of Children and Family Services. The report contains our findings, conclusions and recommendations. Appendix A contains the Department of Children and Family Services’ response to this report. I hope this report will benefit you in your legislative decision-making process. We would like to express our appreciation to the management and staff of the Department of Children and Family Services for their assistance during this audit. Sincerely, Daryl G. Purpera, CPA, CFE Legislative Auditor DGP/dl SNAP 2013 1600 NORTH THIRD STREET • POST OFFICE BOX 94397 • BATON ROUGE, LOUISIANA 70804-9397 WWW.LLA.LA.GOV • PHONE: 225-339-3800 • FAX: 225-339-3870 Louisiana Legislative Auditor Daryl G. Purpera, CPA, CFE Supplemental Nutrition Assistance Program Department of Children and Family Services May 2013 Audit Control # 40120014 Introduction The purpose of this report is to provide information on the Supplemental Nutrition Assistance Program (SNAP), including the results of our analysis on SNAP data. We evaluated the Department of Children and Family Services’ (DCFS) management in the areas of participant eligibility and participant fraud and made recommendations for improvement. We also assessed possible indicators of retailer fraud. Background SNAP (previously known as the "Food Stamps" program) was authorized by the United States Congress in 1964 to alleviate hunger and malnutrition by allowing low-income households to obtain a more nutritious diet by increasing food purchasing power for eligible households.1 Nationally, total federal funding for SNAP benefits in federal fiscal year (FFY) 2011 was approximately $71.8 billion, benefiting, on average, 44.7 million participants per month. The average monthly benefit was $133.85 per person or $284.00 per household. Total federal funding for Louisiana SNAP benefits in FFY 2011 was approximately $1.4 billion with Louisiana providing approximately $55.5 million in state funds for administrative costs. In fiscal year 2012, the average SNAP benefit for a household in Louisiana was $312.32 per month and participants completed approximately 50 million SNAP transactions. Federal and State Roles SNAP is managed at the federal level by the United States Department of Agriculture’s (USDA) Food and Nutrition Service (hereinafter referred to as FNS). DCFS administers the program in Louisiana. The DCFS contractor, Xerox Business Services, LLC, provides an electronic system for the authorization and distribution of SNAP benefits.2 FNS is responsible for promulgating program rules and ensuring that states administer the program in compliance with these rules. FNS also is responsible for certifying and monitoring retailers in the program, including detection of potential fraudulent retailer practices. The states are responsible for 1 This report focuses on SNAP. We did not review the Disaster Supplemental Nutrition Assistance Program (DSNAP). 2 Contracted services required by law include an electronic reporting and inventory system, participant cards, and the provision, installation, and maintenance of SNAP machines. Alternatively, SNAP retailers may elect to use commercial terminals provided by a third party. 1 Supplemental Nutrition Assistance Program Department of Children and Family Services establishing participant eligibility and enrolling and monitoring participants. Appendix C lists major federal and state SNAP responsibilities. SNAP Participants Exhibit 1 Louisiana Purchase Card As of April 2012, there were 880,069 SNAP participants in Louisiana. To apply for SNAP benefits, candidates apply online or submit an application to a DCFS parish office. SNAP participants must meet various eligibility criteria including income, resources, and residency requirements. DCFS no longer requires that all applicants come in for a face-to-face interview to apply for SNAP benefits. Instead, applicants can interview by phone and mail in necessary documents for verification. Once Source: DCFS SNAP website approved, participants can access SNAP benefits through Electronic Benefit Transfer (EBT) using a "Louisiana Purchase" card (see Exhibit 1). This card functions like a debit card, requiring the use of a Personal Identification Number to complete each transaction. SNAP Benefits Maximum monthly benefits depend on household size and currently range from $200 for a single person to $1,202 for a household of eight. Exhibit 2 summarizes eligible and noneligible items. Exhibit 2 Eligible and Non-Eligible Items Eligible Items Breads and cereals Fruits and vegetables Meats, fish, and poultry Dairy products Seeds and plants that produce food for the household to eat Non-Eligible Items Beer, wine, liquor, cigarettes, or tobacco Nonfood items, such as pet food, soaps, paper products, and household supplies Vitamins and medicines Food to be eaten in the store Hot foods* Live animals *Participants were allowed to purchase hot foods with SNAP benefits in September 2012 because of Hurricane Isaac. Source: Prepared by legislative auditor’s staff using information provided by DCFS. In fiscal year 2012, a total of $1,371,486,441 in SNAP benefits were spent at certified Louisiana retailers as shown in Appendix D. In addition, $30,982,615 was spent in other states, 2 Supplemental Nutrition Assistance Program Department of Children and Family Services as shown in Appendix E. SNAP recipients can use their Louisiana Purchase cards anywhere in the country. SNAP Retailers FNS is solely responsible for the authorization, enrollment, and re-authorization of all retailers in SNAP every five years. As of June 2012, a total of 4,576 Louisiana retailers were authorized to participate in SNAP. To be eligible for SNAP, retailers must either offer at least three of the varieties of qualifying foods in each staple food group or more than 50% of all retail sales must be from eligible staple foods. Before authorizing retailers, the USDA or its designee may inspect each retailer location to verify the retailer is qualified. Once a retailer is authorized, either the state or a third-party processor will set up a device that accepts EBTs. EBT cards must be swiped through this machine, keyed into the register, or processed offline, and the card must be present at the time of the transaction. Benefits will be deducted from the card and transferred to the retailer’s account. FNS uses its classification system to classify retailers into different store types. According to FNS, using a classification system that differentiates between store types helps identify improper activities such as trafficking,3 with smaller stores often engaging in more trafficking than larger ones. Appendix D shows the number of stores in Louisiana and how much in benefits was redeemed at each store type for fiscal year 2012. 3 Trafficking occurs when SNAP participants sell their benefits at a discount to retailers. 3 Section 1: Participation and Expenditures From federal fiscal years 2008 to 2012, the average annual SNAP participation in the United States has increased 65% from approximately 28.2 million to 46.6 million participants and SNAP expenditures have increased 116% from approximately $34.6 billion to $74.6 billion. In Louisiana, the average monthly SNAP participation has increased 37% from 631,376 to 866,335 and SNAP annual expenditures have increased 81% from approximately $783 million to $1.4 billion. Exhibits 3 and 4 summarize SNAP participation and expenditures in Louisiana from state fiscal years 2008 to 2012. Exhibit 3: Average Monthly SNAP Participants in Louisiana State Fiscal Years 2008-2012 1,000,000 900,000 800,000 700,000 600,000 500,000 400,000 300,000 200,000 100,000 - 842,188 866,335 2011 2012 779,225 671,392 631,376 2008 2009 2010 Source: Prepared by legislative auditor's staff using information from DCFS. 1,600,000,000 Exhibit 4: Total SNAP Benefit Expenditures in Louisiana State Fiscal Years 2008-2012 $1,415,643,765 $1,360,500,199 1,400,000,000 $1,253,714,573 1,200,000,000 $988,886,568 1,000,000,000 800,000,000 600,000,000 $782,576,373 400,000,000 200,000,000 ‐ 2008 2009 2010 2011 2012 Source: Prepared by legislative auditor's staff using information from DCFS. The percentage of the Louisiana’s population receiving SNAP benefits increased from approximately 15% to approximately 19% during fiscal years 2008-2012. As shown in Exhibit 5, the percentage of Louisiana’s population receiving SNAP during fiscal year 2012 4 Supplemental Nutrition Assistance Program Department of Children and Family Services ranged from 73,897 (16%) in Region 4 (Thibodaux) to 88,291 (26%) in Region 9 (Monroe/Northeast Louisiana). Exhibit 5 SNAP Participation by Parish Fiscal Year 2012 Source: Prepared by legislative auditor’s staff using ESRI maps, DCFS data, and U.S. Census population data. The increase in SNAP participants and expenditures may be due to various economic and program changes from 2008-2012. These changes include the following: SNAP cost of living adjustments raised maximum SNAP income limits. For example, the maximum income limits for a family of four increased by approximately 12% from July 2007 through June 2012, which may have allowed households that were previously ineligible to participate in SNAP. The American Recovery and Reinvestment Act (ARRA) temporarily increased federal SNAP funding. This national economic stimulus package, signed into law in February 2009, increased funding for SNAP. According to FNS, an estimated 5 Supplemental Nutrition Assistance Program Department of Children and Family Services $45.2 billion in ARRA funds would be used to increase SNAP benefits nationwide, resulting in an average benefit increase of $80 per month for a household of four people.4 According to DCFS reports, the total monthly benefit for all recipients increased from $76.4 million in March 2009 to $94.1 million in May 2009 because of ARRA funds. However, these benefit increases are scheduled to end in October 2013. 4 Louisiana’s unemployment rate increased from 3.8% to 7.5% from July 2007 through June 2012. Thus, additional Louisiana households may have sought SNAP benefits because of economic hardship. Hurricanes Ike and Gustav increased SNAP funding. According to DCFS, September and October 2008 SNAP benefits include funding supplements and replacement benefits associated with these storms. Additional funding may have resulted in an increased number of participating households and/or increased SNAP benefits. In addition, nearly $300 million would be provided to states for SNAP administrative expenses. 6 Section 2: Eligibility Determination The federal government has established eligibility criteria that SNAP applicants must meet before they can begin receiving benefits. Louisiana’s role is to administer the program and verify that participants meet these federal eligibility requirements.5 These requirements include the following: Income. Most applicants are required to meet the federal income requirements which are based on monthly income and household. A “household” is defined as people living together who purchase and prepare meals together. Generally, an applicant’s gross monthly income may not exceed 130% of the federal poverty level and net monthly income may not exceed 100% of the federal poverty level. For example, in 2012, a family with four members (a household of four) could make no more than $2,498 (gross) and/or $1,921 (net) per month and still be eligible for SNAP. Residency. Louisiana SNAP participants must live in the state and social security numbers must be provided (or applied for) for each member in the household. Participants cannot be enrolled in multiple states. Resources.6 Households are generally allowed to own up to $2,000 in resources, such as a checking or savings account, and still receive SNAP benefits.7 In Louisiana, allowable resources include only cash on hand, checking or savings accounts, certificates of deposit, and stocks and bonds. FNS allows states to develop their own policies regarding whether vehicles are counted as a resource. In Louisiana, vehicles are not considered a resource when determining SNAP eligibility. Verification of Eligibility States follow federal requirements regarding verification of eligibility, although states have some flexibility regarding how eligibility is verified. DCFS verifies SNAP applications through the use of clearance summaries and review of documents. Clearance summaries involve checking participant information against various databases, including Louisiana Workforce Commission wage records, other DCFS program databases, and Social Security Administration records.8 The clearance summary then returns a summary of what information from these systems is found for the participant, such as dates of incarceration, income amounts, and child 5 According to federal law, these national eligibility standards are uniform and states are not allowed to impose other or stricter eligibility standards. 6 Participants who meet the broad-based categorically eligible requirement (households that receive a non-cash Temporary Assistance for Needy Families funded benefit or service) are exempt from the resource requirement. 7 Households can own $3,250 in resources if one person is 60+ years old or disabled. 8 Like other states, Louisiana uses U.S. Social Security Administration prisoner data to verify incarceration. 7 Supplemental Nutrition Assistance Program Department of Children and Family Services support payments. DCFS caseworkers will also request documents, such as pay stubs and birth certificates to verify eligibility criteria. Appendix F provides examples of the types of documents that DCFS uses to verify eligibility. Accuracy of Eligibility In addition to its verification of eligibility, FNS and DCFS have established various processes on the back-end to determine whether eligibility decisions made by caseworkers were accurate. FNS requires that states establish a quality control process to review a sample of cases to determine if the correct eligibility decision was made. During the quality control process, DCFS reviews a sample of approximately 2,000 cases per year. The results are then used to calculate an error rate based on the review and states may receive bonuses or be penalized depending on the error rate. From FFYs 2007-2011, Louisiana’s overall payment error rate was higher than the national average as shown in Exhibit 6. Because of its high error rate, Louisiana faced a federal sanction of approximately $1 million in FFY 2011 if DCFS failed to improve its overall SNAP payment error rate. In FFY 2011, Louisiana showed improvement, ranking 25th in the overall payment error rate nationwide. As of November 2012, the DCFS overall payment error rate is now ranked 4th in the nation, representing the second highest improvement among all states in this measure for the current year, which may qualify Louisiana for a bonus payment in the future.9 Exhibit 6: Louisiana's Overall Payment Error Rate Compared to National Average Error Rate Fiscal Years 2007-2011 6.94% 8% 6.71% 7% 6% 5% 4% 3% 2% 1% 0% 4.81% 5.03% 3.97% 2007 2008 LA Error Rate 2009 2010 2011 National Average Error Rate DCFS attributes this Source: Prepared by legislative auditor’s staff using data from FNS. improvement in part to its decision to contract with Julie Osnes Consulting, LLC (“Osnes”) in August 2011. Osnes has helped 22 other states significantly reduce their error rates resulting in performance bonuses for states totaling over $99 million. Osnes reviewed the DCFS quality control process and found DCFS was doing more than what federal law required and recommended various changes to its process. For example, quality control reviewers were re-verifying certain information, such as prison matches, using updated clearance summaries. However, since quality control reviewers are only required to review information at the time initial eligibility was established during application, simplified reporting, and redetermination processes, this practice was discontinued. In addition to the quality control process, DCFS uses a case review system where regional staff review 120 cases quarterly and parish supervisors review 40 cases each month to determine if the correct eligibility decision and payment amount were made. Using this system and other review processes, DCFS identified 1,157 cases involving $841,615 in over issued benefits. These cases resulted from agency errors, such as a caseworker entering incorrect 9 FNS issues bonuses for most improved payment accuracy. 8 Supplemental Nutrition Assistance Program Department of Children and Family Services income amounts or failing to remove an ineligible member from the case. Exhibit 7 summarizes the number of agency errors and amount of benefits overpaid to participants in federal fiscal years 2010 and 2011. Exhibit 7 Agency Errors Identified FFY 2010 and 2011 Total Amount of Overpayments $435,199 Average Overpayment Per Case $741 $713 FFY 2010 Number of Cases 587 FFY 2011 570 $406,416 1,157 $841,615 Total Source: Prepared by legislative auditor’s staff using data from FNS State Summary Reports. As mentioned previously, DCFS also uses its clearance summary to help verify certain eligibility criteria, including dates of incarceration and duplicate participation. However, the clearance summary did not always return accurate, timely, or complete data. As a result, the following incorrect eligibility decisions were made: We found that 84 convicted drug felons were determined eligible for SNAP and spent $107,864 in benefits in fiscal years 2011 and 2012 that they were not eligible to receive. According to DCFS policy, individuals who have been convicted of a felony drug offense shall not be considered an eligible household member or be eligible for SNAP benefits until after one year from their release date. However, these 84 drug felons received SNAP benefits before one year had passed from their date of release from prison.10 These errors occurred primarily because the prison data DCFS receives through the clearance summary from the Social Security Administration is not accurate or timely. Federal law requires that states establish a prisoner verification system to match SNAP participants against identifying information on inmates. However, we reviewed the clearance summary for these 84 felons against the data we obtained directly from the Louisiana Department of Corrections and found that only 39 (46%) of the 84 had entry and/or exit dates that matched in both our data and the clearance summary. However, of these 39, 16 (41%) took at least 12 months to show up in the clearance summary. The remaining 45 cases (54%) had no entry or exit dates or had dates that did not match our prison data. When finalizing the prisoner verification requirements in law, FNS received comments from other states that data received from the Social Security Administration is not reliable. Because of the unreliability of this data, FNS stated that it is willing to consider any alternatives that states propose to perform these prison matches. Therefore, DCFS should use a different method to verify prison information. 10 We used prison data from the Louisiana Department of Corrections and matched it with SNAP transaction data. 9 Supplemental Nutrition Assistance Program Department of Children and Family Services According to a January 2012 report,11 the USDA Office of Inspector General identified 1,573 recipients who were receiving duplicate benefits in Louisiana and other states from March 2010 to March 2011 for three consecutive months. DCFS uses the federal Public Assistance Reporting Information System (PARIS), which includes the Social Security numbers of individuals receiving public assistance, to check whether applicants are already receiving benefits in another state. However, even though FNS prohibits duplicate participation, it does not require that states participate in PARIS, nor does it require states to check for interstate participation. According to agency officials, DCFS conducted follow-up on these cases and found that they are responsible for the duplicate benefits of only 605 of these 1,573 recipients. The other states involved are responsible for the remaining cases. Factors Affecting Accuracy of Eligibility Factors that affect the accuracy of eligibility decisions include federal timeframes related to application processing and large caseloads. FNS requires that states provide benefits within seven days for applicants who have income lower than $150 per month and within 30 days for other applicants. States who meet these timeframes may receive bonuses. However, these timeframe requirements may also result in caseworkers not sufficiently or comprehensively verifying eligibility requirements. Louisiana’s timeliness rate was consistently above the national average during FFYs 2007-2009 as shown in Exhibit 8, and DCFS earned bonus payments totaling over $4 million. However, in FFY 2010, Louisiana dropped to 18th place nationwide in this measure. According to the most recent data available from FNS, Louisiana’s timeliness rate from January to June of 2012 is 87.49%, which is slightly higher than the national average of 85.56%. 11 Exhibit 8: Louisiana's Timeliness Rate Compared to National Average Timeliness Rate Federal Fiscal Years 2007-2011 98% 96% 94% 92% 90% 88% 86% 84% 82% 80% 95.44% 95.70% 95.90% 93.11% 90.87% 2007 2008 LA Timeliness Rate 2009 2010 Source: Prepared by legislative auditor’s staff using data from FNS. See www.usda.gov/oig/webdocs/27002-003-13.pdf for report. 10 2011 National Average Timeliness Rate Supplemental Nutrition Assistance Program Department of Children and Family Services In addition, high caseloads may affect a caseworker’s ability to correctly verify eligibility. SNAP caseloads have increased while the number of SNAP caseworkers has decreased. This has resulted in an approximate 76% increase in workload for DCFS SNAP staff. As shown in Exhibit 9, from 2008-2012, the number of SNAP caseworkers has decreased from 1,315 to 1,090, while the average monthly SNAP caseload has increased from 259,770 to 380,011. Exhibit 9 Caseloads and Caseworkers Fiscal Years 2008 to 2012 380,011 1315 400,000 350,000 300,000 250,000 200,000 150,000 100,000 50,000 - 1400 1200 1090 259,770 1000 800 600 400 200 0 2008 2009 2010 Avg. Monthly Caseloads 2011 2012 Caseworkers Source: Prepared by legislative auditor’s staff using DCFS staffing data. 11 Section 3: Participant Fraud Federal law requires that states establish fraud detection units to assist in the investigation and prosecution of fraud. To fulfill this requirement, DCFS has established the Fraud and Recovery Unit (FRU) required by state law to identify and investigate potential participant fraud. The DCFS FRU consists of 33 staff, including three fraud supervisors and 17 fraud investigators throughout the state. In fiscal years 2011 and 2012, DCFS investigated 938 fraud cases and 824 other cases involving inadvertent household errors and identified approximately $4.5 million in overpaid benefits. In fiscal year 2012, FRU’s expenditures totaled $2,341,307. Identification of Participant Fraud FRU identifies potential fraud and other violations through the following: Referrals from parish offices. Currently, most FRU cases are the result of referrals from caseworkers in parish offices, the fraud hotline, and other state agencies. According to DCFS, most fraud cases involve participants providing false information about income or household size. GIS data. In 2004, DCFS implemented Geographical Information System (GIS) technology to help combat fraud in SNAP. The GIS is a database with correlated participant names and addresses to specific retailer locations allowing investigators to analyze participant locations, transactions, and shopping patterns. Louisiana is one of the first to use GIS technology to detect fraud by helping to identify trends and patterns in the program, and in 2008, DCFS received the DM Review’s Innovative Solution Award in the Business Intelligence/Analytics Category. Monitoring DCFS employees who receive SNAP benefits. DCFS policy prohibits agency employees from taking action on their own case, a case involving an immediate family member, and cases of friends and/or social acquaintances. DCFS monitors these employees by independently verifying their eligibility information and preventing access to their cases by other employees. As of December 2012, 76 DCFS employees are receiving SNAP or other DCFS benefits. However, DCFS investigates allegations of improper employee conduct. Monitoring replacement cards. Because frequent requests for replacement cards could be an indicator of participants selling their cards for cash, FRU 12 Supplemental Nutrition Assistance Program Department of Children and Family Services monitors the number of replacement cards participants receive. Federal law requires state agencies to replace EBT cards within two business days after notice that the card has been lost or stolen. To determine the prevalence of replacement card requests, we reviewed replacement card data and found that 1,589 participants have requested over five replacement cards during fiscal years 2011 and 2012. Of these, 43 (2.7%) requested five or more in both fiscal years with six participants requesting 15 cards or more over the two-year period. Exhibit 10 summarizes this information. Exhibit 10 Number of Participants with Five or More Replacement Cards Fiscal Years 2011 and 2012 571 600 400 486 300 61 65 100 163 200 184 Number of Participants 500 15 16 8 6 5 9 0 5 6 7 8 Number of Replacement Cards Issued 9 10 or More 2011 # of Participants 2012 # of Participants Source: Prepared by legislative auditor’s staff using DCFS data. Investigation of Participant Fraud Once FRU identifies potential fraud or other violations, it establishes a claim. These claims are classified into different categories depending on the cause of the claim. Claims that are considered fraud are called intentional program violations. Claims that result from participant errors, but are not intentional, are called inadvertent household errors.12 The number of claims in these categories and an example of each are summarized in Exhibit 11. 12 Agency errors are another category of violations, but these are discussed on pages 8-9. 13 Supplemental Nutrition Assistance Program Department of Children and Family Services Exhibit 11 Number of Claims by Type and Examples Fiscal Years 2011 and 2012 Type Definition Example FY 2011 FY 2012 Inadvertent Household Error Cases that are not fraud but involve an over-issuance of benefits resulting from a misunderstanding or unintended error on the part of the household. A participant was not working at the time he applied for benefits. One month later he got a job and forgot to report his change in status. 399 425 Intentional Program Violation Fraud cases where the participant intentionally made a false or misleading statement, or misrepresented, concealed or withheld facts, or where the participant committed any act for the purpose of using, presenting, transferring, acquiring, receiving, possessing or trafficking coupons or authorization cards. A participant purposely did not report all of his income in order to receive more benefits at application, redetermination, or simplified reporting. 388 550 787 975 Total Source: Prepared by legislative auditor’s staff using data from DCFS. Once claims are established, DCFS is responsible for ensuring that appropriate claims are acted upon either through Administrative Disqualification Hearings (ADHs) or referral to a court of appropriate jurisdiction. Participants who are found to have intentionally violated program rules must repay the benefits they received in error and are disqualified from receiving future benefits for varying periods of time depending on the number of violations. According to DCFS, there were 855 ADHs in fiscal years 2011 and 2012. Collection of Overpaid Benefits DCFS attempts to collect all benefits found to be overpaid and returns what it collects to the federal government. However, DCFS is allowed to keep a certain percentage of the overpayments it identifies for certain cases. Specifically, DCFS is allowed to keep 35% of what is collected on Intentional Program Violation claims and 20% on Inadvertent Household Error claims. The amount collected is transferred to the Fraud and Detection Fund. Money from the fund is used for items such as computers, GIS expenses, and salaries. In fiscal year 2012, $424,769 was budgeted from the fund. As of January 2013, there is a balance of $413,521. Exhibit 12 summarizes the total amount of claims overpaid versus the amount collected for fiscal years 2011 and 2012 combined. 14 Supplemental Nutrition Assistance Program Department of Children and Family Services Exhibit 12 Total Amount of Claims Overpaid Fiscal Years 2011 and 2012 Claim Type Amount Identified Amount Collected % Collected Inadvertent Household Error $1,390,602 $343,085 24.67% Intentional Program Violation $3,107,107 $622,170 20.02% Source: Prepared by legislative auditor’s staff using data from DCFS. As shown in the exhibit, DCFS has only collected approximately 20% to 25% of what it identified. According to DCFS, collecting funds is often difficult because participants may not have the funds available to repay or may have declared bankruptcy impacting the amount they can repay. In addition, participants are often placed on lengthy repayment plans (typically 36 months) resulting in slower collections for the state. DCFS may also recoup money from state and federal tax refunds; however, several other programs are ahead of SNAP on the priority list for tax offsets. Improving Identification of Potential Participant Fraud DCFS could improve its identification of potential participant fraud by proactively conducting data matching or data analytics with existing information from its data systems. DCFS could also obtain external databases to match with SNAP participants to identify potential fraud. We performed various analyses, including evaluating where benefits were spent, determining if prisoners used benefits while incarcerated, matching employment information and wage records to SNAP data, determining if participants used all their benefits at a single retailer, and reviewing transactions made in different states. We have given the results of our analyses to DCFS for its investigation to determine if these cases are actually fraudulent. Our results are summarized below. A total of 3,060 SNAP participants spent all of their fiscal year 2012 benefits totaling $2,061,805 in another state. Although SNAP participants are allowed to spend their benefits anywhere in the United States, participants are not allowed to receive benefits in more than one state. However, we found that 3,060 participants who were certified in Louisiana spent all of their benefits in another state during fiscal year 2012 which may indicate that these individuals do not live in Louisiana and are potentially receiving benefits in another state. State law (R.S. 46:114) requires that SNAP participants immediately report any change in circumstance, including changes in residence. Failure to report changes results in participants having to pay back benefits.13 However, we found that only 547 (18%) of the 3,060 participant cases were eventually closed for not meeting the residency requirement or moving out of state. Because of the way data is captured in the system, we were not able to determine whether these individuals reported the change or DCFS discovered the change through returned mail or some other means. 13 However, federal law only requires them to report these changes every six months. 15 Supplemental Nutrition Assistance Program Department of Children and Family Services SNAP benefits totaling $1,107,740 for 1,761 SNAP incarcerated participants were used during fiscal years 2011 and 2012. We obtained data from the Louisiana Department of Corrections on prisoners incarcerated during fiscal years 2011 and 2012, including their entry and exit dates.14 We found that $1,107,740 in benefits was used by 1,761 persons who were incarcerated during fiscal years 2011 and 2012. These persons were not a part of a household and therefore should not have used benefits during this timeframe.15 According to FNS, this constitutes an intentional program violation and these individuals should repay the benefits used while incarcerated. A total of 322 SNAP participants who made over $50,000 in fiscal year 2012 also received approximately $750,000 in SNAP benefits. We used wage records from the Louisiana Workforce Commission and compared their total reported wages in fiscal year 2012 to SNAP data. We found that 322 individuals received $756,375 in SNAP benefits even though they made over $50,000 in wages in the same year. It is uncommon for a family to make over $50,000 and still be eligible for SNAP, as this would require a household composition of eight or more people.16 DCFS accesses this same wage data during the eligibility process through its clearance summary. However, since income must be verified at the time of application and Louisiana Workforce Commission wage data is always one quarter behind, DCFS only uses these wages to evaluate the validity and reasonableness of the income documentation provided by the applicant and the information reported on the application. Therefore, FRU should consider using this data to help identify potential participant fraud related to misreporting income. Approximately 9,000 SNAP participants used $4.9 million of their benefits at stores where they were employed. We obtained employment data from the Louisiana Workforce Commission for fiscal year 2012 and matched it to where SNAP transactions were used. SNAP participants are not prohibited from using their benefits at their place of employment, and doing so may allow these participants to take advantage of an employee discount program to maximize their SNAP benefits. However, there is a risk that participants could purchase things that are not allowed or obtain cash. According to both FNS and DCFS, the risk is higher at smaller stores that may not have sophisticated scanning equipment. This risk is lesser at bigger stores that have equipment which can automatically detect and separate unallowable items from allowable ones. However, even at larger stores, it is possible for individuals to manually scan items under different UPC codes and purchase items that are not allowed. There were 312 participants who spent 100% of their benefits at a single retailer. These participants made 7,322 transactions at 154 small retailers for $195,909. We used EBT transaction data obtained from DCFS for fiscal year 2012 to determine if there were any participants who spent all of their benefits at a single retailer. While it is not against program 14 Data was obtained from DOC’s data system (CAJUN) that is input by individual correctional institutions. This system includes a prisoner’s enter and exit dates, type of crime, and location. To establish the reliability of this data, all of our matches were sent to DOC for verification that enter and exit dates were accurate. 15 These prisoners were single person households. If they were part of a larger household, then the remainder of the household could use benefits while the prisoner was incarcerated. 16 For example, an individual making $50,568 per year would have to have eight people in the household to be eligible. Because of this, we excluded anyone who had over six people in the household and made between $50,000 and $60,000. 16 Supplemental Nutrition Assistance Program Department of Children and Family Services rules for a participant to spend 100% of their benefits at a single SNAP retailer, spending all benefits at a small retailer may indicate fraudulent activities such as trafficking or the purchasing of ineligible items. Trafficking occurs when SNAP recipients sell their benefits at a discount to retailers. For example, we found that one participant had 12 transactions at a small grocery store totaling $6,308 for an average transaction of $525.67. Four other participants also spent all of their benefits totaling $15,649 at this same store. We identified 154 instances where benefits from one household account were spent in Louisiana and a non-neighboring state within the same hour. According to SNAP requirements, participants cannot make a transaction unless they have their EBT card. Therefore, a card cannot be used in two different states during the same timeframe. However, we identified 154 instances where benefits from one household account were spent in Louisiana and a non-neighboring state within the same hour.17 There was $5,062 spent in Louisiana in these instances, while $4,537 was spent in other states. Exhibit 13 shows examples of these instances. Exhibit 13 Examples of Transactions Fiscal Year 2012 Transaction 1 Location Louisiana Amount 1 Date 1 Time 1 Transaction 2 Location Amount 2 Date 2 Time 2 $134.96 07/10/11 4:14 p.m. Missouri $101.06 07/10/11 4:54 p.m. $122.72 08/13/11 6:15 p.m. Tennessee $195.00 08/13/11 6:52 p.m. $248.91 08/14/11 11:51 a.m. Maryland $117.38 08/14/11 12:50 p.m. $99.50 01/13/12 2:02 p.m. Ohio $96.77 01/13/12 1:52 p.m. $76.03 04/16/12 1:13 p.m. Kentucky $114.04 04/16/12 1:05 p.m. Source: Prepared by legislative auditor’s staff using data from DCFS. 17 We did not include transactions that occurred in neighboring states (Arkansas, Mississippi, or Texas), as it is feasible to conduct transactions in Louisiana and one of these states within the same hour. 17 Section 4: Retailer Fraud FNS is responsible for monitoring and investigating retailers nationally to ensure that they follow program rules. Trafficking is a common type of fraud committed among retailers. Trafficking occurs when SNAP recipients sell their benefits at a discount to retailers. Other types of retailer fraud include allowing recipients to purchase prohibited items such as liquor or tobacco, or retailers who charge an EBT card manually without an associated purchase. According to FNS, about 8% of all authorized SNAP retailers engage in trafficking. Identification of Retailer Fraud FNS uses its Anti-Fraud Locator using EBT Retailer Transactions (ALERT) system to identify potentially fraudulent transactions. FNS officials collect and monitor EBT transaction data to detect suspicious patterns of transactions by retailers. The system monitors electronic transaction activity and identifies suspicious stores for analysis and investigation. Although DCFS FRU is not responsible for monitoring retailers, it is required to inform FNS of any suspected retailer fraud. DCFS uses its Geographical Information System (GIS) to help detect retailer fraud and then refers it to FNS. While FRU does not receive any money for helping FNS identify retailer fraud, FRU is able to collect money from any participant who is convicted of, or confesses to, an intentional program violation in connection with the retailer who committed fraudulent activities. Investigation of Retailer Fraud According to the FNS Southwest Compliance Center, as of December 2012 there are currently 169 retailer investigations open in Louisiana. Of these investigations, 97 were opened in calendar year 2012. Exhibit 14 shows that the majority of the retailer investigations are conducted by FNS Retailer Investigations Branch. According to DCFS, FNS only has 44 investigators for the entire United States. A smaller number of investigations are conducted by USDA-Office of Inspector General (OIG), state agencies, or local agencies. State and local agencies are able to conduct retailer investigations due to the State Law Enforcement Bureau (SLEB) agreement, which provides DCFS FRU with food stamp benefits to distribute to law enforcement agencies for use in undercover investigations. 18 Supplemental Nutrition Assistance Program Department of Children and Family Services Exhibit 14 Retailer Investigations in Louisiana Agency USDA-FNS Retailer Investigations Branch USDA-OIG, State Agency or Local Agencies Total Currently Open 142 Opened in 2012 87 27 10 169 97 Note: We were unable to obtain any penalty information or other outcome information from FNS on these cases because of the confidentiality requirements. Source: Prepared by legislative auditor’s staff using information from USDA-FNS staff. Fraud Indicators in Louisiana Retailer Data Using FNS indicators of fraud, such as high dollar, even dollar amounts, and rapid transaction amounts, we analyzed 50,127,676 individual SNAP transactions that occurred in fiscal year 2012 to identify potential fraud indicators and found the following: Excluding large grocery stores and superstores, such as Wal-Mart, there were 237,661 single purchases that were at least $100 in fiscal year 2012. We analyzed EBT data for large purchases over certain amounts. We attempted to find amounts by store type that were considered excessive but neither FNS nor DCFS had set target amounts. According to both, anything over $100 would be excessive at certain stores, such as convenience stores. As shown in Exhibit 15, there were 237,661 single purchases over $100 at SNAP retailers, including nearly 40,000 transactions at convenience stores alone. In addition, many stores had single purchases over $300 and $500. The highest dollar amount spent in a single transaction at each of these eight store types ranged from $700 at a bakery to nearly $1,000 at a small grocery store. Exhibit 15 Number of Single Purchases Over Certain Amounts Fiscal Year 2012 Store Type and Example Other Grocery Combination Highest Single Transaction Amount $992.38 Over $100 91,826 Over $300 2,869 Over $500 178 Medium Grocery Store 42,627 1,785 191 $850.00 Convenience Store 39,358 1,805 92 $904.00 Small Grocery Store 33,647 3,089 414 $999.64 Meat/Poultry Specialty 17,672 447 12 $754.00 Seafood Specialty 10,106 230 15 $769.38 Bakery Specialty 2,425 86 5 $700.00 Total 237,661 10,311 907 Source: Prepared by legislative auditor’s staff using fiscal year 2012 EBT transaction data. 19 Supplemental Nutrition Assistance Program Department of Children and Family Services As shown in this exhibit, some smaller stores had numerous high dollar purchases. For example, a small grocery store in Monroe had 7,787 transactions over $100 totaling $1.64 million and a donut shop in New Orleans had 754 transactions over $100 totaling over $114,000. There were 698,745 even dollar purchases in fiscal year 2012. According to FNS, certain even dollar transactions may be a potential indicator of fraud because even dollar transactions are often a sign that participants may be receiving cash instead of allowable food items. Using EBT transaction data provided by DCFS, we analyzed even dollar transactions in excess of $20, as well as multiple transactions for $100. Overall, we found that there were 698,745 even dollar transactions over $20, as well as 27,832 transactions for exactly $100 during fiscal year 2012. Exhibit 16 shows examples of establishments with multiple even dollar and $100 transactions. We did not include the names of stores because DCFS has referred some to FNS for investigation. Exhibit 16 Examples of Excessive Even Dollar and $100 Transactions Retailer Meat/Poultry Specialty 1 Even Dollar Transactions Number of Transactions 5,273 Total Amount $422,384.00 Meat/Poultry Specialty 2 1,417 $259,269.00 Small Grocery Store 1 1,728 $211,408.00 Small Grocery Store 2 1,899 $167,199.00 Bakery Specialty 2,282 $155,560.00 Retailer Small Grocery Store $100 Transactions Number of Transactions 443 Total Amount $44,300.00 Bakery Specialty 217 $21,700.00 Discount Store 110 $11,000.00 Meat/Poultry Specialty 101 $10,100.00 Convenience Store 79 $7,900.00 Note: We excluded retailers such as Wal-Mart, Sam's Club, and other large supermarket/grocery store chains (i.e., AG and IGA) from this analysis because of their large number of/variation in transactions. Also excluded were Dollar stores with items routinely priced in even dollar amounts (i.e., Dollar Tree, Dollar General, and Family Dollar), as well as inpatient treatment facilities, such as Cenikor. Source: Prepared by legislative auditor’s staff using fiscal year 2012 EBT data provided by DCFS. 20 Supplemental Nutrition Assistance Program Department of Children and Family Services We found 1,064 instances of more than four transactions conducted within a onehour timeframe by 941 SNAP participants. According to FNS, multiple transactions within a short period of time may indicate fraud. Participants and/or retailers may conduct smaller multiple transactions instead of larger single transactions that may appear suspicious. Using EBT data provided by DCFS, we analyzed transactions in excess of $10 conducted by one participant over a one-hour timeframe and found the following: One participant conducted 33 transactions (32 transactions for $11 and one transaction for $15.25) in less than one hour at a grocery store in Alexandria. We also found that this particular grocery store chain had more instances of multiple transactions within a one-hour timeframe at several of its locations than other retailers. A Monroe area participant, on several occasions, conducted multiple transactions of $100 or greater within a one-hour period at a small grocery. This amounted in over $4,160 to this retailer from this one participant. One New Orleans area participant conducted multiple, rapid transactions on the seventh of each month (with the exception of November 2011 and January 2012) at a major supercenter, spending as much as $1,316 in a one-hour period. As stated earlier, state and local agencies are able to conduct retailer investigations due to the State Law Enforcement Bureau (SLEB) agreement, which provides DCFS FRU with food stamp benefits to distribute to law enforcement agencies for use in undercover investigation. Participants who travel long distances to routinely use certain retailers may be an indicator of fraud. Using its GIS, DCFS FRU can plot participant addresses and compare these to where they redeem their benefits. According to DCFS, participants who travel long distances to certain retailers may do so because they know that certain retailers will traffic benefits. We used similar data to plot the locations of two small stores in Louisiana where large amounts of SNAP benefits were redeemed and of participants who redeemed their benefits at the stores. Exhibit 17 summarizes this information. 21 Supplemental Nutrition Assistance Program Department of Children and Family Services Exhibit 17 Map of Participants and Store Locations Note: The individual dots represent clusters of SNAP recipients from that general area. Source: Prepared by legislative auditor’s staff using SNAP data and ESRI. 22 Section 5: Recommendations Throughout this report, we have identified various issues with DCFS eligibility determination as well as ways DCFS could improve its identification of participant fraud. While some of these issues are not under DCFS control, we have developed recommendations for those that are. Our recommendations are as follows: Recommendation 1: DCFS should ensure that its process for verification of prison information is reliable, consistent, and timely. Because of the issues cited in this report with reliability of prison data from the U.S. Social Security Administration, DCFS should consider obtaining data directly from the Louisiana Department of Corrections. Recommendation 2: DCFS should continue to enhance its use of data analytics and data mining on existing SNAP data, similar to the analyses presented in this report, to identify potential fraud cases within participant and retailer data. Recommendation 3: DCFS should determine if the results of the analysis presented in this report regarding potential retailer fraud should be referred to FNS and/or other state agencies for further investigation. Recommendation 4: DCFS should determine if it can obtain and use external databases in addition to the databases it already accesses from other state and federal agencies to help identify potential participant fraud. Summary of Management’s Response: DCFS agreed with all of our recommendations. See Appendix A for management’s full response. 23 APPENDIX A: MANAGEMENT’S RESPONSE A.1 A.2 APPENDIX B: SCOPE AND METHODOLOGY This report provides the results of our review of the Supplemental Nutrition Assistance Program (SNAP) administered by the Department of Children and Family Services. We conducted this performance audit under the provisions of Title 24 of the Louisiana Revised Statutes of 1950, as amended. We conducted this audit in compliance with R.S. 24:522, which directs the legislative auditor to complete and publish at least one performance audit for each executive department agency within a seven-year period. The purpose of the audit was to provide information regarding the program’s purpose, participants, expenditures, eligibility process, and retailers. This audit also describes the Department of Children and Family Services current efforts to detect fraud and abuse and offers suggestions for improvement based on our analysis of SNAP data. Our audit generally covered the time period fiscal year 2011 and fiscal year 2012. In some cases, we extended our scope to include historical and/or current information. We conducted this performance audit in accordance with generally accepted government auditing standards issued by the Comptroller General of the United States. Those standards require that we plan and perform the audit to obtain sufficient, appropriate evidence to provide reasonable basis for our findings and conclusions based on our audit objectives. We believe the evidence obtained provides a reasonable basis for our findings and conclusions based on our audit objectives. To answer our objectives, we reviewed internal controls relevant to the audit objectives and performed the following audit procedures: Reviewed federal and state SNAP law and policy. Reviewed SNAP data published on the DCFS website and the FNS website. Reviewed U.S. Census Bureau population figures using its website. Reviewed Louisiana unemployment data from the U.S. Bureau of Labor Statistics using its website. Researched SNAP and policy information using the Internet, including other state agency websites and research/public policy organization websites. Analyzed State Fiscal Year 2011 and 2012 SNAP transaction data. Interviewed state and federal SNAP program staff. Researched SNAP retailers using the Internet. Observed daily SNAP operations and reviewed case files at the East Baton Rouge and Lafayette Parish offices. B.1 Supplemental Nutrition Assistance Program Department of Children and Family Services Observed the Quality Control review process at the DCFS state office. Mapped SNAP participation and expenditure data using GIS. Obtained SNAP fraud and recovery unit data from DCFS and FNS officials. Analyzed State Fiscal Year 2011 and 2012 Department of Corrections prisoner data and compared to SNAP data. Analyzed wage and workforce data from Louisiana Workforce Commission and compared to SNAP data. B.2 APPENDIX C: FEDERAL AND STATE SNAP RESPONSIBILITIES Major Federal and State SNAP Responsibilities Responsible Party Federal Government State Government Responsibility National program oversight Funds benefits and a portion of state administrative costs Approves state plans and authorizes waivers of specific regulations Enrolls retailers National program monitoring Conducts state program reviews Validates state error rates annually National program enforcement Sanctions states as needed, including withholding funds and/or requiring repayment Administers fraud detection activities for retailers Investigates and sanctions retailers as needed, including disqualification Statewide program administration Submits state plan to federal government for approval Establishes statewide operating procedures Monitors program operations (including a quality control review program) Offers nutrition education (optional) Administers fraud and abuse detection activities for participants Statewide participant management Certifies households for participation after determining eligibility Recertifies households annually Issues Electronic Benefit Transfer cards Corrects improper denials and benefit issues Establishes and collects claims when participant benefits are overpaid or trafficked Source: Prepared by legislative auditor’s staff using federal law. C.1 APPENDIX D: EXPENDITURES BY RETAILER TYPE Fiscal Year 2012 Expenditures, by Retailer Type Business Type Superstore Supermarket Other Grocery Combination Convenience Store Medium Grocery Store Large Grocery Store Seafood Specialty Small Grocery Store Meat/Poultry Specialty Bakery Specialty Military Commissary Fruits/Vegetable Specialty Combination Treatment Center Delivery Route Homeless Meal Provider Group Living Farmer's Market Communal Dining Facility Grand Total Number of Type 271 238 1,331 1,788 155 52 234 267 99 69 3 26 Total FY 2012 Expenditures $751,973,800 $338,099,769 $112,857,203 $67,403,900 $27,777,610 $21,288,284 $18,506,997 $18,262,674 $9,145,969 $2,553,606 $1,389,455 $962,817 5 21 7 2 6 2 4,576 $559,642 $452,030 $167,184 $41,922 $41,413 $2,165 $1,371,486,440 % of Total Dollars Spent 54.83% 24.65% 8.23% 4.91% 2.03% 1.55% 1.35% 1.33% 0.67% 0.19% 0.10% 0.07% 0.04% 0.03% 0.01% 0.00% 0.00% 0.00% 100.00% Source: Prepared by legislative auditor’s staff using EBT transaction data and information provided by DCFS staff. D.1 APPENDIX E: LOUISIANA SNAP BENEFITS REDEEMED IN OTHER STATES Source: Prepared by legislative auditor’s staff using ESRI maps and DCFS data. E.1 Total $30,982,612 APPENDIX F: DCFS ELIGIBILITY VERIFICATION Acceptable DCFS Documentation for Eligibility Verification Eligibility Criteria Income Resources Employment Citizenship and Social Security Numbers Residency Acceptable Documentation Pay stubs, W-2 forms, income tax returns, sales records, employers’ statements, award letters, and court orders. Using the best information available, preferably evidence of earnings from at least two pay periods within the last 45 days, monthly income is estimated. Deductions supported by: Medical bills and reimbursements Court or administrative orders Cancelled checks or wage withholding statements Utility and shelter expenses (only if questionable) Dependent care expenses (if greater than $500/month or if questionable) Applicant statement accepted for cash on hand and if resources total $1,500 or less (unless questionable). Participants who meet the broad-based categorically eligible requirement are exempt from the resource requirement. Check stubs Employer statements Self-reporting for occasional or “odd” jobs Birth certificate, baptismal certificate, voter registration card, passport, military service records, or United States Citizenship and Immigration Services certification of citizenship or naturalization. Applicant statement of social security number, social security card, proof of social security number application. Rent, mortgage, or utility receipts Statements from landlords, neighbors, relatives, friends, and other sources are permissible May also be verified through a scheduled home visit Source: Prepared by legislative auditor’s staff using DCFS policies and information provided by DCFS staff. F.1


© Copyright 2026