
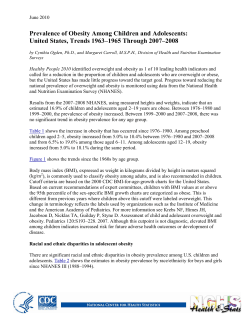
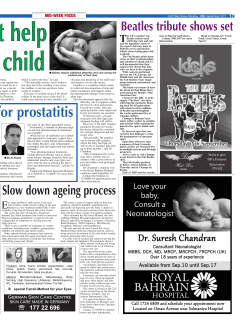
Body Fat Percentile Curves for U.S. Children and Adolescents
Body Fat Percentile Curves for
U.S. Children and Adolescents
Kelly R. Laurson, PhD, Joey C. Eisenmann, PhD, Gregory J. Welk, PhD
Background: To date, several studies have been published outlining reference percentiles for BMI
in children and adolescents. In contrast, there are limited reference data on percent body fat (%BF) in
U.S. youth.
Purpose: The purpose of this study was to derive smoothed percentile curves for %BF in a nationally
representative sample of U.S. children and adolescents.
Methods: Percent fat was derived from the skinfold thicknesses of those aged 5–18 years from three
cross-sectional waves of the National Health and Nutrition Examination Survey (NHANES) IV
(1999 –2000, 2001–2002, and 2003–2004; N⫽8269). The LMS (L⫽skewness, M⫽median, and
S⫽coeffıcient of variation) regression method was used to create age- and gender-specifıc smoothed
percentile curves of %BF.
Results: Growth curves are similar between boys and girls until age 9 years. However, whereas %BF
peaks for boys at about age 11 years, it continues to increase for girls throughout adolescence. Median
%BF at age 18 years is 17.0% and 27.8% for boys and girls, respectively.
Conclusions: Growth charts and LMS values based on a nationally representative sample of U.S.
children and adolescents are provided so that future research can identify appropriate cut-off values
based on health-related outcomes. These percentiles are based on skinfolds, which are widely
available and commonly used. Using %BF instead of BMI may offer additional information in
epidemiologic research, fıtness assessment, and clinical settings.
(Am J Prev Med 2011;41(4S2):S87–S92) © 2011 American Journal of Preventive Medicine
Introduction
T
1– 6
7
he increasing prevalence and adverse medical,
economic,8 and psychosocial9,10 consequences of
childhood obesity have been well documented.
The majority of studies that identify the magnitude and
consequences of this health problem rely on the classifıcation of overweight or obesity using age- and genderspecifıc thresholds or reference values of BMI. Several
sets of reference values for BMI in children and adolescents have been published, with the most widely recognized being the international thresholds by Cole et al.11
and the CDC thresholds.12 Although these reference values are widely used, a major limitation of BMI is its
From the School of Kinesiology and Recreation, Illinois State University
(Laurson), Normal, Illinois; the Department of Kinesiology, Michigan State
University (Eisenmann), East Lansing, Michigan; The Healthy Weight
Center at Helen DeVos Children’s Hospital (Eisenmann), Grand Rapids,
Michigan; and the Department of Kinesiology, Iowa State University
(Welk), Ames, Iowa
Address correspondence to: Kelly R. Laurson, PhD, School of Kinesiology and Recreation, Illinois State University, Campus Box 5120, 250
McCormick Hall, Normal IL 61790. E-mail: [email protected].
0749-3797/$17.00
doi: 10.1016/j.amepre.2011.06.044
inherent inability to differentiate between fat mass and
fat-free mass.13 Similar sets of reference values are needed
for body fatness to improve public health surveillance,
facilitate clinical screening, and advance obesity prevention research.
Despite the importance of body fatness to health, there
are limited reference data available on percent body fat
(%BF). Percentiles for body fat have been developed using bioelectrical impedance analysis (BIA)-derived %BF
values in British children14 and skinfold-derived %BF
values in Spanish adolescents.15 Both BIA and measuring
skinfold thickness are simple and feasible methods to
assess adiposity. In children and adolescents, skinfold
thickness values are often converted to %BF using the
Slaughter equation,16 as in the aforementioned study by
Moreno et al.15 Rodriguez et al.17 specifıcally recommended the use of the Slaughter equation for male and
female adolescents after reviewing several skinfold-to%BF prediction equations. Reference data are not currently available using skinfold-derived %BF in U.S.
youth. Therefore, this paper presents smoothed percentile curves for %BF using LMS (L⫽skewness, M⫽
median, and S⫽coeffıcient of variation) regression in a
© 2011 American Journal of Preventive Medicine • Published by Elsevier Inc.
Am J Prev Med 2011;41(4S2):S87–S92 S87
Laurson et al / Am J Prev Med 2011;41(4S2):S87–S92
S88
nationally representative sample of white, black, and
Mexican-American U.S. children and adolescents.
Methods
Subjects
The National Health and Nutrition Examination Survey
(NHANES), conducted by the National Center for Health Statistics, CDC, is a program of studies designed to assess the health and
nutritional status of adults and children in the U.S. through interviews and direct physical examinations. In this paper, anthropometric and body composition data of those aged 5–18 years from
three cross-sectional waves of NHANES IV (1999 –2000, 2001–
2002, and 2003–2004) were included. Approximately 1.85% of the
eligible sample (aged 5–18 years) had one or both skinfolds that
exceeded the range of the calipers and were excluded. In addition,
pregnant women were excluded from the analyses. Complete data
were available for 1219 non-Hispanic white male, 1169 nonHispanic white female, 1485 non-Hispanic black male, 1338 nonHispanic black female, 1569 Mexican-American male, and 1489
Mexican-American female school-aged and adolescent youths
aged 5–18 years.
Anthropometry
Stature was measured to the nearest 0.1 cm using a wall-mounted,
digital stadiometer, and body mass was measured to the nearest 0.1
kg using a digital scale. BMI was calculated by standard formula.
Skinfold thickness was measured as a double fold of skin underlying the soft tissue on the right side of the body using Holtain
calipers. All measurements were taken by trained health technicians in the NHANES Mobile Examination Center following standard procedures. Quality control checks were included throughout
the data collection procedure. The training procedures, examination protocol and procedures, and quality control protocol are
outlined in the NHANES anthropometry and body composition procedures manuals available at www.cdc.gov/nchs/nhanes.htm.
Percent body fat was calculated using the equations of Slaughter et al.16 from the triceps and subscapular sites since this
equation is widely used in pediatric research and with FITNESSGRAM . The SE of the estimate for this equation is 3.6% for
men/boys and 3.9% for women/girls. The equation for whites was
used to estimate %BF in Mexican-Americans. Previous research17
compared several skinfold equations to dual-energy x-ray absorptiometry (DXA) and found the Slaughter equation for whites to be
the best available for Spanish adolescents. Because the regression
intercepts in boys are based on biological maturity status (prepubescent, pubescent, or postpubescent), and biological maturity status was not assessed in the NHANES IV (1999 –2004) waves, the
following assumptions were made based on national estimates of
age of entry into different stages of secondary sex characteristics:18
Boys aged ⬍12.0 years were classifıed as prepubescent; boys aged
12.0 –13.99 years as pubescent; and boys aged ⬎14.0 years as
postpubescent.
®
Data Analysis
Descriptive statistics by gender were calculated using SAS v 9.1
(SAS Institute, Cary, NC). Construction of the age- and genderspecifıc percentile curves was performed using the LMS ChartMaker Pro Version 2.3 software program (The Institute of Child
Health, London, U.K.), which fıts smooth percentile curves to
reference data using the LMS method.19 In brief, the LMS
method summarizes a changing distribution with three curves,
with skewness expressed as a Box–Cox power transformation.
By using penalized likelihood, the three curves were fıt as cubic
splines by nonlinear regression, and the extent of smoothing
required is expressed in terms of smoothing parameters or
equivalent df. Initially, ethnicity-specifıc curves were created
(data not shown). However, the shapes of the curves were similar for non-Hispanic whites, non-Hispanic blacks, and MexicanAmerican boys and girls. Thus, to simplify the resulting curves
and future use, these three ethnic groups were combined to
create one set of percentiles rather than maintaining separate
percentiles based on ethnicity.
Results
Tables 1 and 2 include the %BF values across the percentiles by age and gender. The corresponding percentiles
are graphically displayed in Figures 1 and 2. In general,
%BF for boys increased throughout middle to late childhood and peaked at approximately age 11 years. During
adolescence, %BF decreased slightly or leveled off in the
mid and lower percentiles, but increased again (starting
at about age 16 –17 years) within the upper percentiles.
Median %BF for boys at age 18 years was 17.0%. Girls
displayed a similar pattern of age-related changes in %BF
compared to boys through about age 9 years. However,
through adolescence, %BF for girls increased across all
percentiles. Median %BF at age 18 years for girls was
27.8%. By age 18 years, girls had approximately 1.5 times
greater %BF than boys.
Discussion
This paper provides age- and gender-specifıc %BF reference percentiles for U.S. children and adolescents. The
skinfold-derived percentile values were derived using nationally representative data and address a well-defıned
need in pediatric obesity research.20 Currently, most of
the pediatric literature relies on BMI to identify children
as overweight and obese. Although an important epidemiologic and clinical tool,21 BMI does not distinguish
between fat mass and fat-free mass, with individuals of
the same BMI showing varying levels of fatness.22
Although there is no perfect tool for estimating %BF
in epidemiologic surveys, skinfold thicknesses provide
some advantages and have previously been recommended for identifying obesity and health risk in youth.23
Skinfold thicknesses can easily be taken in the fıeld, are
inexpensive and noninvasive, and currently are used in
school-based health-related fıtness testing programs,
such as FITNESSGRAM. A disadvantage of skinfolds is
the diffıculty in obtaining accurate measurements in
obese individuals. Nonetheless, the percentiles reported
herein provide valuable reference data since they can be
www.ajpmonline.org
Laurson et al / Am J Prev Med 2011;41(4S2):S87–S92
S89
Table 1. Smoothed LMS curves for selected percentiles of percent body fat for boys in three waves of NHANES IV
Age
(years)
2nd
5th
10th
25th
50th
75th
85th
90th
95th
98th
5
8.5
9.2
10.0
11.6
14.0
17.2
19.6
21.5
24.9
30.1
6
8.1
8.9
9.8
11.5
14.2
17.9
20.6
22.8
26.8
33.0
7
7.9
8.8
9.7
11.6
14.6
18.8
21.9
24.4
29.1
36.2
8
7.9
8.9
10.0
12.2
15.5
20.4
24.0
27.0
32.4
40.8
9
8.1
9.2
10.4
12.9
16.8
22.5
26.6
30.1
36.4
46.0
10
8.3
9.5
10.8
13.7
18.0
24.5
29.2
33.2
40.4
51.2
11
8.2
9.5
10.9
14.0
18.8
25.8
31.0
35.4
43.3
55.1
12
7.8
9.1
10.6
13.7
18.6
26.0
31.4
35.9
44.2
56.6
13
7.2
8.5
9.9
12.9
17.8
25.1
30.5
35.0
43.3
55.7
14
6.5
7.7
9.1
11.9
16.6
23.6
28.8
33.2
41.2
53.2
15
6.0
7.2
8.4
11.2
15.6
22.3
27.3
31.5
39.3
51.0
16
5.9
7.1
8.3
11.1
15.5
22.2
27.3
31.6
39.5
51.3
17
6.1
7.3
8.6
11.4
16.1
23.2
28.5
33.0
41.3
53.9
18
6.4
7.7
9.0
12.1
17.0
24.6
30.3
35.1
44.1
57.6
Note: Data are from 1999--2000, 2001--2002, and 2003–2004. Age indicates whole age group (e.g., 8.0 – 8.99 years).
LMS, L⫽skewness, M⫽median, and S⫽coefficient of variation; NHANES, National Health and Nutrition Examination Survey
used to identify differences during growth between the
genders across the school-age years.
Comparisons with other data are challenging due to
differences in samples, measurements, procedures, and
time. A set of BIA-derived %BF reference curves (based
on children in the U.K.) has been widely used, but these
were based on data from a 1985 survey.14 The shapes of
the curves are generally similar, but the use of more
Table 2. Smoothed LMS curves for selected percentiles of percent body fat for girls in three waves of NHANES IV
Age
(years)
2nd
5th
10th
25th
50th
75th
85th
90th
95th
98th
5
9.4
10.2
11.1
12.8
15.4
18.9
21.3
23.3
26.9
32.3
6
9.4
10.4
11.3
13.2
16.0
19.8
22.5
24.6
28.5
34.3
7
9.6
10.6
11.6
13.7
16.8
21.0
23.9
26.3
30.5
36.5
8
9.9
11.0
12.2
14.5
17.9
22.6
25.8
28.4
32.9
39.3
9
10.4
11.7
13.0
15.6
19.4
24.5
28.0
30.8
35.6
42.3
10
11.0
12.4
13.8
16.7
20.8
26.4
30.1
33.0
37.9
44.7
11
11.5
13.0
14.5
17.6
22.0
27.8
31.6
34.5
39.4
46.0
12
12.0
13.6
15.2
18.5
23.1
28.9
32.6
35.5
40.3
46.5
13
12.6
14.3
16.0
19.4
24.0
29.8
33.5
36.3
40.8
46.7
14
13.2
14.9
16.7
20.2
24.8
30.6
34.1
36.8
41.1
46.6
15
13.8
15.6
17.4
20.9
25.5
31.1
34.6
37.1
41.2
46.2
16
14.4
16.3
18.1
21.6
26.2
31.7
35.0
37.4
41.2
46.0
17
15.0
16.9
18.8
22.4
27.0
32.3
35.5
37.9
41.5
46.0
18
15.6
17.6
19.5
23.2
27.8
33.1
36.3
38.6
42.2
46.5
Note: Data are from 1999--2000, 2001--2002, and 2003--2004. Age indicates whole age group (e.g., 8.0 – 8.99 years).
LMS, L⫽skewness, M⫽median, and S⫽coefficient of variation; NHANES, National Health and Nutrition Examination Survey
October 2011
S90
Laurson et al / Am J Prev Med 2011;41(4S2):S87–S92
Figure 1. Smoothed LMS curves
Note: Curves are for the 2nd, 5th, 10th, 25th, 50th, 75th, 85th,
90th, 95th, and 98th percentiles of percent body fat for boys in
NHANES IV (1999 –2004).
LMS, L⫽skewness, M⫽median, and S⫽coefficient of variation;
NHANES, National Health and Nutrition Examination Survey; P,
percentile
recent, nationally representative data in the present study
provide updated information to characterize the status of
obesity in the U.S. Mueller et al.24 created BIA-derived
%BF percentiles based on Texas children ranging in age
from 8.5 to 17.5 years.
There was little difference among studies in the shape
of the curve for the median values, but some differences
were evident in the upper percentiles for boys. In the
present study, the 95th percentile declined during early to
mid adolescence and then increased into adulthood,
whereas the 95th percentile from the Mueller et al.24
study showed a sharp decrease. Although noteworthy,
these differences are likely due to variations within the
samples, methodology of %BF estimation, and the
smaller sample size (n⫽678) in the Mueller study to estimate percentiles at the extremes. Reference curves using
triceps and subscapular skinfolds have recently been created for U.S. youth.25 However, these values were not
converted to %BF, making it diffıcult to make direct comparisons to the present results.
Recently, a set of body fat reference values for U.S.
children was created using DXA.26 These percentiles
were also created using a sample of youth from NHANES
IV (1999 –2004), although results are provided using age
groups (8 –11 years, 12–15 years, and 16 –19 years) rather
than separate ages. Overall, shapes of the median curves
are similar to those shown here, with %BF in boys decreasing during adolescence whereas %BF in girls in-
creases throughout. However, the DXA-derived %BF is
consistently higher than the skinfold-derived %BF values
in the current study. The magnitude of the difference
varies depending on the percentile: approximately
5%–7% lower for boys and 7%–10% lower for girls. Differences appear to be greater at younger ages.
It is diffıcult to reconcile these differences since both
studies used the same NHANES IV (1999 –2004) sample.
Recently, there have been some questions about the DXA
model (Hologic QDR 4500A) used for determining body
composition in NHANES IV (1999 –2004). Previous research has found this model to overestimate fat-free mass
and underestimate fat mass in adults.27,28 Using pooled
data from seven studies of adults (n⫽1195, mean age⫽55
years), it was found that the Hologic QDR 4500A overestimated lean mass in each of the samples (range⫽3%–9%,
M⫽5%).27
A correction factor was applied to the NHANES IV
(1999 –2004) DXA data, where lean mass was decreased
by 5% and an equivalent weight was added to fat mass to
maintain the original total mass. The correction was applied to all DXA data, even though the pooled data from
which the correction factor was derived did not include
youth. This certainly merits examination, since it is unknown how the correction factor would perform in children, where growth and maturation influence chemical
maturity and assessment of body composition.29
Figure 2. Smoothed LMS curves
Note: Curves are for the 2nd, 5th, 10th, 25th, 50th, 75th, 85th,
90th, 95th, and 98th percentiles of percent body fat for girls in
NHANES IV (1999 –2004).
LMS, L⫽skewness, M⫽median, and S⫽coefficient of variation;
NHANES, National Health and Nutrition Examination Survey; P,
percentile
www.ajpmonline.org
Laurson et al / Am J Prev Med 2011;41(4S2):S87–S92
S91
31
Dwyer and Blizzard previously proposed thresholds
of 20% fat for boys and 30% for girls based on at-risk
groups for dyslipidemia and hypertension. Using a modifıed Slaughter equation, Williams et al.32 identifıed %BF
thresholds of 25% in boys and 30% in girls that were
indicative of an increased risk of being in the highest
quintile for blood pressure and serum lipoproteins in
adolescents. The Williams et al. thresholds have been
used within FITNESSGRAM,33 but a limitation of these
thresholds is that they present static values and hence do
not take into consideration the normal growth and maturation of adiposity. As shown here and in previous growth
studies, there are distinct age- and gender-associated variations in %BF. The lack of defınitive standards may be due, in
part, to the lack of appropriate reference data to characterize
growth and maturation.
Although there are limitations with the Williams
thresholds (25% for boys and 30% for girls), it provides a
useful way to compare the relative utility of the present
percentiles relative to the DXA-derived ones. Based on
the values from the current study, approximately 15%–
25% of American youth would be categorized as overweight, whereas 25%–75% would be categorized as overweight with the DXA values. It is not possible to
determine which set is more accurate. The results with
the present percentiles seem to be more consistent with
current prevalence of
overweight based on
BMI, but this is only one
Table 3. LMS parameters for the calculation of z-scores in boys and girls
way to evaluate the reBoys
Girls
sults. Clearly more work
is needed to evaluate this
Age
(years)
L
M
S
L
M
S
issue.
The LMS parameters
5
⫺0.688
13.977
0.290
⫺0.680
15.357
0.284
presented here (Table 3)
6
⫺0.603
14.160
0.322
⫺0.592
15.950
0.299
may help to address
7
⫺0.521
14.568
0.353
⫺0.503
16.764
0.314
the need to easily quantify and compare levels
8
⫺0.446
15.525
0.382
⫺0.415
17.931
0.326
of adiposity and ad9
⫺0.380
16.800
0.408
⫺0.328
19.392
0.335
vance research on
10
⫺0.323
18.037
0.431
⫺0.244
20.847
0.338
youth obesity. The SD
score or z-score can be
11
⫺0.277
18.756
0.454
⫺0.169
22.047
0.336
calculated from the
12
⫺0.244
18.611
0.474
⫺0.101
23.050
0.330
LMS values by using the
13
⫺0.223
17.787
0.491
⫺0.041
24.001
0.320
following
equation,
14
⫺0.211
16.580
0.503
0.013
24.839
0.308
where Y is the measurement value (%BF), and
15
⫺0.206
15.588
0.512
0.065
25.543
0.295
the age- and gender16
⫺0.205
15.488
0.517
0.117
26.233
0.282
specifıc LMS values are
17
⫺0.204
16.071
0.522
0.169
26.960
0.273
obtained from Table 3:
Further, the Hologic software version 12.1 (as used in
NHANES IV [1999 –2004]) has a substantial impact on softtissue assessment in children, and this influence is modifıed
by gender and body mass.30 Additional investigation is required to determine the validity of the Hologic QDR 4500A
model and software, and the accompanying correction factor for fat and fat-free mass estimates in children. These
factors could affect the accuracy of the DXA-derived %BF
reference values, but the discrepancies in percentile values
could also be due to limitations in the current design.
The Slaughter equation16 utilized in the current study
was developed on a group of youth that was leaner and
older than the current sample. Also, error was probably
introduced by assuming pubertal status by chronologic
age for the calculation of %BF in boys, although in an
epidemiologic design, the impact may have been minimal. In any case, the percentiles described here based on
skinfold-derived %BF may be potentially underestimating adiposity in this sample.
An additional issue hindering research on youth obesity
is the lack of defınitive cut offs based on adverse health risks.
Previous studies on pre-obesity epidemic epidemiologic
data suggest using the 85th and 95th percentiles.14 Although
these may be defensible (based on the use of similar values
for BMI), thresholds should be established based on increased health risk rather than a population distribution.
18
⫺0.202
17.022
0.526
Note: Age indicates whole age group (e.g., 8.0 – 8.99 years).
LMS, L⫽skewness, M⫽median, and S⫽coefficient of variation
October 2011
0.222
27.810
0.265
z-score ⫽ [(Y ⁄ M)L
⫺ 1] ⁄ (L ⫻ S).
S92
Laurson et al / Am J Prev Med 2011;41(4S2):S87–S92
A major strength of the current study is the use of nationally
representative data to create age- and gender-specifıc %BF percentiles. The reference percentiles and LMS parameters also
allow the opportunity to use %BF along with BMI in epidemiologic research, fıtness assessment, and clinical practice. By using recent data, these percentiles provide further information
about the magnitude of the current obesity epidemic based on
body fat rather than BMI. For this reason, it should be noted
that commonly used reference percentiles (e.g., 85th or 95th
percentile) may not be appropriate for use as an overfat threshold, since these data were collected during the obesity epidemic.
More appropriate thresholds, perhaps based on current or future health risk, are needed. Future studies should focus on
identifying health-related %BF thresholds during growth and
maturation, and investigating the discrepancies between these
percentiles and those derived from the NHANES IV (1999–
2004) DXA data.
13.
14.
15.
16.
17.
18.
19.
20.
21.
Publication of this article was supported by The Cooper Institute through a philanthropic gift from Lyda Hill.
No fınancial disclosures were reported by the authors of this
paper.
References
1. Booth ML, Chey T, Wake M, et al. Change in the prevalence of overweight and obesity among young Australians, 1969 –1997. Am J Clin
Nutr 2003;77(1):29 –36.
2. Janssen I, Katzmarzyk PT, Boyce WF, et al. Comparison of overweight
and obesity prevalence in school-aged youth from 34 countries and
their relationships with physical activity and dietary patterns. Obes Rev
2005;6(2):123–32.
3. Liu J-M, Ye R, Li S, et al. Prevalence of overweight/obesity in Chinese
children. Arch Med Res 2007;38(8):882– 6.
4. Lobstein T, Frelut ML. Prevalence of overweight among children in
Europe. Obes Rev 2003;4(4):195–200.
5. Ogden CL, Carroll MD, Curtin LR, Lamb MM, Flegal KM. Prevalence
of high body mass index in U.S. children and adolescents, 2007–2008.
JAMA 2010;303(3):242–9.
6. Willms JD, Tremblay MS, Katzmarzyk PT. Geographic and demographic variation in the prevalence of overweight Canadian children.
Obes Res 2003;11(5):668 –73.
7. Daniels SR. The consequences of childhood overweight and obesity.
Future Child 2006;16(1):47– 67.
8. Wang G, Dietz WH. Economic burden of obesity in youths aged 6 to 17
years: 1979 –1999. Pediatrics 2002;109(5):E81.
9. Schwimmer JB, Burwinkle TM, Varni JW. Health-related quality of life of
severely obese children and adolescents. JAMA 2003;289(14):1813–9.
10. Williams J, Wake M, Hesketh K, Maher E, Waters E. Health-related quality of
life of overweight and obese children. JAMA 2005;293(1):70–6.
11. Cole TJ, Bellizzi MC, Flegal KM, Dietz WH. Establishing a standard
defınition for child overweight and obesity worldwide: international
survey. BMJ 2000;320(7244):1240 –3.
12. Ogden CL, Kuczmarski RJ, Flegal KM, et al. Centers for Disease Control and Prevention 2000 growth charts for the United States: improve-
22.
23.
24.
25.
26.
27.
28.
29.
30.
31.
32.
33.
ments to the 1977 National Center for Health Statistics version.
Pediatrics 2002;109(1):45– 60.
Garn SM, Leonard WR, Hawthorne VM. Three limitations of the body
mass index. Am J Clin Nutr 1986;44(6):996 –7.
McCarthy HD, Cole TJ, Fry T, Jebb SA, Prentice AM. Body fat reference curves for children. Int J Obes (Lond) 2006;30(4):598 – 602.
Moreno LA, Mesana MI, González-Gross M, et al. Anthropometric
body fat composition reference values in Spanish adolescents. The
AVENA Study. Eur J Clin Nutr 2006;60(2):191– 6.
Slaughter MH, Lohman TG, Boileau RA, et al. Skinfold equations for
estimation of body fatness in children and youth. Hum Biol
1988;60(5):709 –23.
Rodríguez G, Moreno LA, Blay MG, et al. Body fat measurement in
adolescents: comparison of skinfold thickness equations with dualenergy x-ray absorptiometry. Eur J Clin Nutr 2005;59(10):1158 – 66.
Sun SS, Schubert CM, Chumlea WC, et al. National estimates of the
timing of sexual maturation and racial differences among U.S. children. Pediatrics 2002;110(5):911–9.
Cole TJ, Green PJ. Smoothing reference centile curves: the LMS
method and penalized likelihood. Stat Med 1992;11(10):1305–19.
Prentice AM, Jebb SA. Beyond body mass index. Obes Rev 2001;
2(3):141–7.
Reilly JJ, Dorosty AR, Emmett PM. Identifıcation of the obese child:
adequacy of the body mass index for clinical practice and epidemiology. Int J Obes Relat Metab Disord 2000;24(12):1623–7.
Malina RM, Katzmarzyk PT. Validity of the body mass index as an
indicator of the risk and presence of overweight in adolescents. Am J
Clin Nutr 1999;70(1):131S– 6S.
Himes JH, Dietz WH. Guidelines for overweight in adolescent preventive services: recommendations from an expert committee. The Expert
Committee on Clinical Guidelines for Overweight in Adolescent Preventive Services. Am J Clin Nutr 1994;59(2):307–16.
Mueller WH, Harrist RB, Doyle SR, Labarthe DR. Percentiles of body
composition from bioelectrical impedance and body measurements in
U.S. adolescents 8 –17 years old: Project HeartBeat! Am J Hum Biol
2004;16(2):135–50.
Addo OY, Himes JH. Reference curves for triceps and subscapular
skinfold thicknesses in U.S. children and adolescents. Am J Clin Nutr
2010;91(3):635– 42.
National Center for Health Statistics (U.S.); National Health and Nutrition Examination Survey (U.S.). Body composition data for individuals eight years of age and older, U.S. population, 1999 –2004. Hyattsville MD: DHHS, CDC, National Center for Health Statistics, 2010.
Schoeller DA, Tylavsky FA, Baer DJ, et al. QDR 4500A dual-energy
x-ray absorptiometer underestimates fat mass in comparison with
criterion methods in adults. Am J Clin Nutr 2005;81(5):1018 –25.
Tylavsky F, Lohman T, Blunt BA, et al. QDR 4500A DXA overestimates
fat-free mass compared with criterion methods. J Appl Physiol
2003;94(3):959 – 65.
Rolland-Cachera MF. Body composition during adolescence: methods,
limitations and determinants. Horm Res 1993;39(S3):25– 40.
Shypailo RJ, Butte NF, Ellis KJ. DXA: can it be used as a criterion
reference for body fat measurements in children? Obesity (Silver
Spring) 2008;16(2):457– 62.
Dwyer T, Blizzard CL. Defıning obesity in children by biological endpoint rather than population distribution. Int J Obes Relat Metab
Disord 1996;20(5):472– 80.
Williams DP, Going SB, Lohman TG, et al. Body fatness and risk for
elevated blood pressure, total cholesterol, and serum lipoprotein ratios
in children and adolescents. Am J Public Health 1992;82(3):358 – 63.
Going S, Lohman T, Falls H. Body composition assessment. In:
FITNESSGRAM/ACTIVITYGRAM reference guide. Dallas TX: The Cooper Institute, 2008. www.cooperinstitute.org/ourkidshealth/fıtnessgram/
references.cfm.
www.ajpmonline.org


© Copyright 2026