
Pidilite Industries Annual Report 2012-2013
fistfuls of gulaal Makarand Dave Should you chance upon what you cherish so, my friend, Don’t keep it, rather share it! Like fine Gulaal, flung fistfuls up, in Spring’s festive air! Wretched is the finger that draws up boundaries, Love, if locked up, is, verily, floundering. Puddles and pools, constrained, could be found; But the surf of the sea surging forth in waves, Could it ever be bolted and bound? This grace, my friend, that pours from the skies in torrents of His love and care; Don’t keep it, rather share it! Stockpiled treasures don’t bring Life’s bounties, Your fine-grained stashing spills out, how long would you guard it? Give it away, quick, whatever has reached you, Choosing it fast and right. Clutched in closed fist, a leaf turns to dust, Released, it spreads like perfume in the air. Don’t keep it, rather share it! What has come to me, I would offer to others, Washing it once in my tears; That which I’ve guarded, I would lose it in love, When soul is awakened, I have no fears. In tune with the Gopika who hawked Lord Krishna, I clap my hands in joy, No longer do I fear or care! Should you chance upon what you cherish so, my friend, Don’t keep it, rather share it! A JOURNEY well travelled. It is difficult to capture the essence of a man in a few words, especially if he is Shri Balvantray Kalyanji Parekh, Founder Chairman of Pidilite Industries. Fondly known to all as ‘BKP’ and ‘Balubhai’, he was a warm, loving and caring leader who inspired the lives of all those he touched. To the people who knew BKP closely, he was an exceptional human being with a multifaceted persona. He reached out to all who came in touch with him and left an indelible print on them. He has been described variously as a man with a “humane scientific temperament” and a man who was intent on creating “a legacy of knowledge and virtue.” An avid reader and a lover of books, he had a keen interest in literature, medicine, psychology, general semantics, science and law that was reflected in his personal library. He has left behind his very own collection of 12 volumes of Gamtano Kariye Gulal that comprises of quotes, articles and poems that have inspired him and shaped him as a person. A philanthropist who believed that money could enhance social values, he founded two schools, a college and a hospital in Mahuva. He established the Darshak Foundation for studies in cultural history of Gujarat and India and made a significant contribution to Bhavnagar’s science city project. He also made endowments and provided valuable guidance to the Gram Nirman Samaj, Gujarati Sahitya Parishad, the Forbes Sabha and the Parichay Trust. Staying true to his belief in sharing the best of everything with others, he established Balvant Parekh Centre for General Semantics and Other Human Sciences for a better understanding of general semantics in India. On 28th October 2011, The Institute of General Semantics in Texas conferred on BKP the prestigious J Talbot Winchell Award, making him the first Asian to receive this honour. His disarming smile and unassuming demeanour will continue to live in the memory of many people whose lives he touched and transformed. A quote by Albert Einstein that B.K.P lived by: “A hundred times every day I remind myself that my inner and outer life are based on the labours of other men, living and dead, and that I must exert myself in order to give in the same measure as I have received and am still receiving.” through their eyes Gandhiji has advised industrialists to become the trustees of their property. Balavantbhai fully tried to carry out the advice in his own life. In his behaviour, one would not find the discrimination between master and servant or poor and rich. For him, no individual is small, no work is insignificant. Usha Mehta A great and unfortunately rare human being , a humane and caring industrialist, he cared for people above profits, though his business profited greatly through his good works. He was greatly loved by all of his employees from drivers and cafeteria workers to top-level managers. May B. K. Parekh’s legacy of good works live on. Bruce I. Kodish With continued conversations, leading questions, and a bit of skillful probing I was able to get to what I believe to be the root of it all. His person knows a great deal about himself. And he keeps this knowledge this awareness, the common failings that all of us share, are not allowed to spoil or pollute the clarity of his generous actions. Balvantbhai’s whole life was a link between Science and Spirituality. Dr Kanubhai Kalsaria Balvantbhai deeply loved, keenly understood, and decisively acted for life in its physical as well as subtler expressions. He was a fearless but skilled explorer into human conditions. The gulal that he shared with so many, so long, so plentifully and in so many ways, is now a part of our lives, personal and collective, cultural and industrial, Gujarati and global. Sitanshu Yashaschandra I, at once, took to this soft-spoken man with a twinkle in his eyes to me. He is the quintessential Indian that I love. Sharp, intelligent, shrewd, and, at the same time, warm and compassionate. I encountered a man who, I felt, knows himself and life and accepts both as they are. It is said that one single leader is able to fashion an entire organisation into a cohesive mould which is perceived by all those who deal with it. With his sincerity, truthfulness, humility and decisive leadership, Balubhai has been able to impart to the Pidilite organisation a rare personality that modern day corporates do not enjoy in a very great measure. Mini Dastoor Bansi S. Mehta What a rare phenomenon it was: Highly valuable as were the donations running into crores of rupees given by him to institutions of literature, education and science, even more precious was the gift of his fatherly and caring self that Balvantbhai offered to others. He was a luminous part of the great ‘Mahajana’ tradition of India. He was born in a common merchant (vanika) family of Mahuva, studied up to B.A. only, but in common sense, modesty, generosity and gentlemanliess he would defeat all. Gieve Patel Manubhai Pancholi “Darshak” Raghuvir Chaudhari A few people have enriched my life through their integrity and strength. I don’t think I can name more than six but, of this I am certain, Balvant is one of them and I shall be grateful for his existence until the end of my life. Neville Symington Neville Symington is a senior psycho-analyst in Australia. He dedicated his book “ The Blind Man Sees” to B. K. Parekh. Who knows the truth Who knows himself And is faithful to both. contents 06 08 17 28 30 33 64 66 71 Company Information Corporate Social Responsibility Report Cash Flow Statement Management Discussion and Analysis Annexure I to the Directors’ Report Corporate Governance Report Economic Value Added (EVA) Auditor’s Report Corporate Governance Compliance Certificate Company Information Board of Directors B K Parekh Chairman (up to 25.01.2013) M B Parekh Chairman & Managing Director (wef 28.05.2013) S K Parekh Vice Chairman N K Parekh Joint Managing Director R M Gandhi Director N J Jhaveri Director Sanjeev Aga Director Bansi S Mehta Director A B Parekh Wholetime Director Ranjan Kapur Director A N Parekh Wholetime Director Yash Mahajan Director R Sreeram Wholetime Director Bharat Puri Director D Bhattacharya Director 18 20 22 36 37 38 72 74 Corporate Office Company Secretary Ramkrishna Mandir Road Off Mathuradas Vasanji Road Andheri (E), Mumbai 400 059 Savithri Parekh Balance Sheet Information for Shareholders Registered Office Regent Chambers, 7th Floor Jamnalal Bajaj Marg 208, Nariman Point Mumbai 400 021 Registrar & Transfer Agent TSR Darashaw Pvt. Limited 6-10, Haji Moosa Patrawala Ind. Estate 20, Dr. E Moses Road, Mahalaxmi Mumbai 400 011 10 Years Financial Performance Profit & Loss Account Directors’ Report Notes Consolidated Financial Statements Solicitors & Advocates Wadia Ghandy & Co Auditors Haribhakti & Co Internal Auditors Mahajan & Aibara Bankers Indian Overseas Bank Corporation Bank ICICI Bank The Royal Bank of Scotland N.V. HDFC Bank P I D I L I T E A N N UA L R E P O R T 2 01 2 -13 Financial Charts 7 Management Discussion & Analysis Standalone Financials Net sales of the Company grew by 18.3%, marginally lower than that recorded in the previous year. Sales of Consumer & Bazaar products grew by 20.7% while growth in Industrial Products was slower at 10.6%. Increase in commodity costs led by crude oil prices and a depreciating currency impacted margins in the first half of the year and price increases were implemented. With cost inflation easing in the second half, margins were better than the corresponding period of the previous year. The subsidiary in Brazil continued to incur losses. While the subsidiary has taken a series of measures to improve performance, the continued losses require the Company to review the value of its investments in that subsidiary. Accordingly, a provision for diminution in value of ` 53.1 million has been made, which is in addition to ` 96.9 million provided last year. This provision has no impact on the consolidated results of the Company. Earnings before interest, taxes, exceptional items and foreign exchange differences, increased by 28%, profit before tax (PBT) increased by 40% and profit after tax (PAT) increased by 38%. The Company’s sales have grown at a CAGR of 17.1% over the last 5 years. Consolidated Financials On a consolidated basis, net sales grew by 17.6% over last year. Earnings before interest, taxes, exceptional items and foreign exchange differences, grew by 28% over last year. Profit after tax grew by 31% over the last year. Aggregate losses in overseas subsidiaries have increased in comparison to last year mainly due to higher losses in Brazil. However, excluding Brazil, losses have halved over the previous year to ` 20 million. Losses in Brazil have been higher due to items like impairment of goodwill and provisions made for prior period tax claims and other disputed items. 20 % Performance by Industry Segment Construction/ Paint Chemicals 51 % Adhesives & Sealants 10 2012 - 2013 % Art Material & Others 6 % % 7 6 % Organic Pigments & Preparations Industrial Resins Industrial Adhesives Consumer & Bazaar Products Industrial Products Others Branded Consumer & Bazaar Products Segment contributed 81% of the total net sales of the Company and grew by 20.7%. Industrial Products contributed 19% of the total sales of the Company and grew by 10.6%. This segment largely consists of the Vinyl Acetate Monomer (VAM) manufacturing unit. Exports grew by 25.5% as compared to previous 5 years growth of 16.7%. The Company continues to import rather than operate the VAM plant, as the import price of VAM continues to be more favourable. Net sales of branded Adhesives and Sealants grew by 18% and contributed 51% of the total sales of the Company. Construction and Paint Chemicals grew by 20% and Art Materials and other products grew by 35%. Consumer & Bazaar Product sales have grown at a CAGR of 20% over the last 5 years. Profit before interest and tax for the Consumer & Bazaar segment increased by 28%. Profit before interest and tax for the segment was at the same level as last year. The Company has started manufacturing few speciality acetates at the plant. Initial market feedback is encouraging. Consequently revenue from this segment is higher than last year. P I D I L I T E A N N UA L R E P O R T 2 01 2 -13 BUSINESS SEGMENTS % 9 Advertising Campaign & Communications Dr. Fixit Raincoat television campaign was launched in March 2013. This advertisement depicted an innovative animation of a building that morphs into a Transformer wearing a raincoat. It symbolises waterproof coating for exterior walls as a guard against water leakages and seepages during the monsoons. ‘Fevicol Se’ in Dabangg 2 became a chart buster on most music channels and entered the list of top 20 most frequently played songs on radio. The song was picturised on popular bollywood actors dancing to the lyrics of the song. A new television campaign for ‘Fevicol Marine’, the waterproof adhesive was launched in September 2012 to communicate Fevicol Marine’s strong bond in water, in a humorous & entertaining way. A new television campaign of Fevikwik launched last year, revolves around the two ‘Hassi brothers’. They keep laughing even when they break something as they know they can repair anything with Fevikwik - the one drop instant adhesive. Shramdaan Divas, organised by Fevicol Champions’ Club, is an annual community outreach programme. In 2012, over 15000 woodworkers across the country came together as they refurbished and conducted repair work at institutions & organisations for under privileged and needy children in various cities. The popular Fevicol Design Ideas books are now on the web at www.fevicoldesignideas.com. Over 10,000 images of interior designs from over 150 interior designers are available on this site. P I D I L I T E A N N UA L R E P O R T 2 01 2 -13 Fevicol, had an innovative ‘spot jogging’ event at the Standard Chartered Mumbai Marathon 2012. While the marathon was in progress, the Fevicol runners were stuck to the ground as they were trying unsuccessfully to run from their positions. This event reinforced Fevicol’s brand proposition as being ‘the ultimate adhesive’. 11 Fevistik’s new campaign was launched to establish its position as the original glue stick in a market flooded with duplicates. The film features a Chulbul Pandey look-alike entering a store and asking for Fevistik ‘The original glue stick’. Fevikwik launched a new initiative to communicate to consumers, the multiple uses of the brand. Magicians performed and demonstrated product usages in a unique way during a series of van activations across markets. Fevikwik’s presence in social media is led by its Facebook page which has over 300,000 fans in addition to its presence on Twitter & YouTube. New Product Launches During the year the Company introduced a range of adhesives and sealants to cater to the expanding building construction, interior decoration market and waterproofing segment. Several varieties of speciality industrial colorants and industrial adhesives were also launched. Rangeela was relaunched with ‘Main bhi Rangraja’ Campaign targeted at school students. This helped create a buzz around the new & vibrant Rangeela range of Gouache, Water & Poster colors. Construction chemical brands Dr. Fixit & Roff participated in the ACETECH exhibition across 5 cities showcasing the latest in waterproofing and tile fixing solutions. The second successful year of the Fevicol Science Project Challenge continued to spark the curiosity of budding scientists among school kids. The number of participants tripled from 55,000 to over 180,000 students across the country. 3D models were used by the students to demonstrate solutions to everyday problems. Dr Fixit LW+ launched an innovative and distinctive on-ground activation program, “Shaadi –Ek Atoot Bandhan”. This highlighted the inseparable bond of marriage between cement and Dr.Fixit LW+, an advanced waterproofing material for concrete, mortar and plaster. Dr. Fixit Low Energy Consumption (LEC) systems for high end waterproofing coupled with insulation for terraces and walls. Fevicol Heatx is a heatproof adhesive that provides craftsmen an opportunity to work hassle-free, even on vertical applications. Fevicol PVCFIX is a specialized adhesive for PVC to wood pasting. Dr. Fixit Extensa A high end puncture-proof waterproof coating for roofs & basements. Dr. Fixit Bathseal Kit A solution for comprehensive and long lasting waterproofing for bathrooms. P I D I L IIT TEE A AN NN NUA UALL RREEPPO ORRTT 2201 0122-13 -13 The construction chemicals division introduced several innovative products under the Dr. Fixit brand during the year. 13 Awards & Achievements ◆ Fevicol was ranked as India’s 45th Most Trusted Brand in 2012 in Brand Equity’s Most Trusted brands survey. ◆ Fevicol was also ranked 3rd Most Trusted Brand in the Household Care Category. ◆ Fevicol was ranked amongst the Most Trusted Brands list for 5 consecutive years. ◆ Fevicol was a recipient of the Zee Business Brand Excellence Award. Fevicol has also been awarded Gold Effie for the Best On-Going Campaign at Effie Awards 2012 organised by the Advertising club. One of the units of the Company located at Baddi, Himachal Pradesh (Baddi – Unit II) won a silver medal in Indian Manufacturing Excellence Award. This award is given by Economic Times in partnership with Frost & Sullivan to recognize manufacturing capability in India. The Fevicol Marine advertisement has been ranked as one of the top 10 advertisements of 2012 by the Financial Express. Miscellaneous Other matters The Company’s net worth (Equity Capital + Reserves) has grown from 7336 million in 2008-09 to 17325 million at the end of 2012-13, giving a Compounded Annual Growth Rate (CAGR) of 24%. The following matters are elaborated in the Directors’ Report ◆ Financial Performance ◆ Industry Structure and Development ◆ Outlook on Opportunities, Threats, Risks and Concerns ◆ Risks and Adequacy of Internal Controls ◆ Human Resources The market capitalization of the Company on 31st March 2013 was 134876 million and has grown at a CAGR of 31.85 % since the IPO in 1993. For the year 2012, Fevicol has been named ‘Powerbrand’ - an initiative by the Planman Group. A 40 feet raincoat was installed on a building by Dr. Fixit Raincoat. This won a Gold award for Madison Media in the Exchange4media Outdoor Awards. At the Chemtech CEW Leadership and Excellence Awards, the Chemtech CEW honoured Mr. M B Parekh (MD - Pidilite Industries Ltd.) the “Business Leader of the Year” - Chemicals and Petrochemicals Industry. Statements in this Management Discussion and Analysis Report describing the Company’s objectives, projections, estimates and expectations may be ` forward looking statements’ within the meaning of applicable laws and regulations. Actual results might differ. P I D I L I T E A N N UA L R E P O R T 2 01 2 -13 Cautionary Statement 15 Book Value Per Share & EPS 32.79 27.12 8.92 22.51 18.54 6.50 6.84 5.80 14.49 2.89 08-09 09-10 10-11 11-12 12-13 Book Value per Share (`) Earning per Share (`) Book value per share & earning per share for the year 2008-09 has been restated for the 1:1 bonus issue made in the year 2009-10. EPS Excludes exceptional items. Growth in Market Capitalisation of Company and BSE sensex since 31st March 2009 Base Value: 31st March 2009 = 1 6.34 Market Capitalisation (Times) BSE Sensex (Times) 4.24 3.55 2.71 1 2.00 1.81 1.79 1.94 1 31-3-09 31-3-10 31-3-11 31-3-12 31-3-13 Economic Value Added (EVA) Computation of EVA EVA = Net operating profit after tax (NOPAT) - Weighted average cost of capital employed. NOPAT = Net profit after tax + post tax interest cost at actual. Weighted average cost of capital employed = (Cost of equity x average shareholder funds) + (cost of debt x average debt). Cost of equity = Risk-free return equivalent to yield on long term Government of India (GOI) securities (taken @ 7.5%) + market risk premium (assumed @ 7.5%) x beta variant for the Company (taken at 0.9), where the beta is a relative measure of risk associated with the Company's shares as against the stock market as a whole. Cost of debt = Effective interest applicable to Pidilite based on an appropriate mix of short, medium and long term debt, net of taxes. Economic Value Added Analysis Item 1. Risk Free Return on Long Term GOI Securities 2. Cost of Equity 3. Cost of Debt (Post Tax) 4. Effective Weighted Average Cost of Capital 2008-09 2009-10 2010-11 2011-12 2012-13 7.1% 7% 7% 8% 7.5% 13.1% 13.8% 13.8% 14.0% 13.5% 6.7% 5.9% 5.9% 5.9% 8.0% 10.30% 11.2% 11.8% 12.5% 13.0% Economic Value Added (Rupees in million) 5. Average Debt 5303 4897 3541 2754 1622 6. Average Equity (Shareholder Funds) 6866 * 8360 10390 12584 15521 7. Average Capital Employed (Debt + Equity) 12169 * 13257 13931 15338 17143 8. Profit After Tax (as per P&L account) 1464 2935 3289 # 3471 # 4548 # 9. Interest (as per P&L account, net of Income Tax) 210 189 177 143 54 10. Net Operating Profit After Tax (NOPAT) 1674 3124 3466 3614 4602 11. Weighted Average Cost of Capital (4 x 7) 1253 1489 1642 1919 2226 421 1635 1824 1695 2376 3.5% 12.3% 13.1% 11.1% 13.9% 12. Economic Value Added (10 – 11) 13. EVA as a % of Average Capital Employed (12÷7) Notes 1 Profit After Tax includes Prior Years’ Tax Provision written back. 2 Effects have been given in 10 Years’ Financial Performance for above note. 3 Figures in Financial Charts, 10 Years’ Financial Performance and EVA are as per the Annual Report of respective years, except where stated otherwise. P I D I L I T E A N N UA L R E P O R T 2 01 2 -13 * Excluding 6% Redeemable Preference Share Capital of 28.75 million issued on 31st March 2008 and redeemed on 5th September 2008. # Profit after tax excludes exceptional items. 17 Financial Charts Distribution of Revenue (2012-13) Material Cost 53.2% Operating Cost 18% Employee Cost 8.8% Interest 0.2% Depreciation 1.6% Current Tax 4.6% Deferred Tax 0.1% 4.6% Retained Earning 8.9% Dividend Current Ratio 11247 11099 8255 7130 7053 6281 6240 5321 4279 2835 2.5 1.5 08-09 09-10 1.6 10-11 1.8 11-12 Current Assets (` in million) Current Liabilities (` in million) Current Ratio Note : Current Ratios are as per old Schedule VI 1.6 12-13 PBIT & Interest Cover PBT & PBT as % on Net Sales 6216 6136 4779 4567 4494 4225 3575 3289 78.4 1950 16.8 12.5 18.0 17.0 1632 18.5 16.3 9.3 22.6 6.1 08-09 09-10 10-11 11-12 12-13 08-09 09-10 10-11 PBIT (` in million) PBT (` in million) Interest Cover (Times) PBT as % to Net Sales 11-12 * PBIT excludes exceptional items. * PBT excludes exceptional items. Debt Equity Ratio Value Addition to Business through Reserves 602 17325 12-13 16812 2641 4214 5580 2867 13265 13772 10889 11395 8880 9386 7083 7336 0.8 0.4 0.25 08-09 09-10 10-11 Total Debt (` in million) Net Worth (` in million) (Equity + Reserves) 0.19 11-12 0.03 12-13 Debt Equity Ratio 253 08-09 506 09-10 506 10-11 Share Capital (Equity) Reserves less Misc. Expenditure (` in million) 508 11-12 0.03 513 12-13 P I D I L I T E A N N UA L R E P O R T 2 01 2 -13 0.4 19 10 Years Financial Performance (Rupees in million) Highlights 2003-04 2004-05 2005-06 2006-07 2007-08 2008-09 2009-10 2010-11 2011-12 2012-13 CAGR % Operating Results Sales and Other Income 7647 8998 10617 13081 17248 19313 20512 25302 30174 36145 18.84% Manufacturing & Other Expenses 6458 7649 9005 11186 14489 16730 16380 20357 24831 29393 18.34% Operating Profit 1189 1349 1612 1895 2759 2583 4132 4945 5343 6752 21.28% Interest (Net) 18 17 15 63 161 318 286 268 212 79 17.51% Depreciation 255 270 274 302 385 472 464 444 479 532 8.51% Profit from Ordinary Activities 916 1062 1323 1530 2213 1793 3382 4233 4652 6141 23.55% - - - - - - - 250 126 (59) - - - 10 (10) (29) 161 93 8 85 5 - Profit before Tax 916 1062 1313 1540 2242 1632 3289 3974 4441 6196 23.67% Current Tax 294 345 409 309 223 150 423 941 1052 1559 20.36% 8 (13) 17 34 140 18 (25) (6) 45 29 - 614 730 887 1197 1879 1464 2891 3039 3345 4608 25.10% - 36 20 2 4 - 44 - - - - Profit after Tax 614 766 907 1199 1883 1464 2935 3039 3345 4608 25.10% Dividend on Equity Shares 228 * 288 * 360 * 1029 * 1122 * 1559 * 23.83% Exceptional Item Foreign Exchange Difference Expense/(Income) !! Deferred Tax Profit after Tax for the year Add: Prior Year's Tax Provision written back Dividend on Preference Shares 443 * 518 * 1 !! 885 * - - - - - - - - - 386 478 547 756 1365 945 2050 2010 2223 3049 25.80% 252 252 252 252 253 253 506 506 508 513 8.20% - - - - 29 - - - - - - 252 252 252 252 282 253 506 506 508 513 8.20% 2835 3315 3866 4625 6143 7083 8880 10889 13265 16812 21.87% Net Worth 3087 3567 4118 4877 6425 7336 9386 11395 13772 17325 21.12% Borrowings 562 610 553 1383 5026 5580 4214 2867 2641 602 0.76% Deferred Tax Liability (Net) 301 288 305 339 423 441 415 410 454 484 - 3950 4465 4976 6599 11874 13357 14015 14672 16868 18411 18.65% Gross Block 3541 4203 4811 5554 8444 10166 10838 12051 13437 14694 17.13% Depreciation 1373 1635 1905 2182 2973 3433 3889 4310 4764 5270 17.43% Net Block 2168 2568 2906 3372 5471 6733 6949 7741 8673 9424 17.64% 1594 # 2197 # 2446 # 2328 # 2391 # 2603 # Retained Earning - ~ 518 * Financial Position Capital-Equity Capital-Preference Reserve (Less Revaluation Reserve & Misc. Expenditure) Funds Employed Fixed Assets Investments in - Overseas Subsidiaries - Others - 30 # 225 # 753 # - 150 154 134 139 30 210 2659 1669 937 2867 38.80% Net Current Assets 1632 1713 1711 2335 4779 4217 1961 2934 4867 3517 10.83% Total Assets 3950 4465 4976 6599 11874 13357 14015 14672 16868 18411 19.07% Figures for 2011 - 12 onwards are regrouped as per previous periods for comparable purpose. * Includes Tax on Dividend # !! Included in Other Income/Expenses now reclassified/regrouped ~ Less than 1 million After deducting provision for diminution. (Rupees in million) Highlights 2003-04 2004-05 2005-06 2006-07 2007-08 2008-09 2009-10 2010-11 2011-12 2012-13 Funds Flow Sources Internal Generation 877 1023 1201 1536 2335 1949 3373 3727 - - - - 197 - - 146 47 - 830 554 Decrease in Investment - Others - - 21 - 109 Decrease in Working Capital - - 1 - - 2 2 1023 1072 1225 Increase in Capital & Reserve on Amalgamation and Conversion of FCCB Increase in Loans Decrease in Miscellaneous Expenditure Total 3995 < 5109 < - 154 504 - - - - - - 990 732 - - 563 2257 - - 1410 2 3 - - - - 2368 6287 3066 5630 4881 7023 29 - - 1366 1347 226 2039 3643 ^ 4717 Applications Decrease in Preference Capital - on redemption Repayment of Loans Capital Expenditure (Net) 413 - - - - - - - - 57 669 † 613 ! 768 2484 > 1734 680 1236 1411 1284 Investments in - Overseas Subsidiaries - 30 195 528 841 603 251 132 189 265 - Others 2 4 - 5 - 181 2448 - - 1877 Dividend* 228 288 360 443 518 519 885 1029 1122 1559 Increase in Working Capital 370 81 - 624 2444 @ - - 973 1933 - 10 - - - - - - - - - 1023 1072 1225 2368 6287 3066 5630 4717 4881 7023 21.2 23.0 23.6 26.7 33.4 @ 21.3 @ 34.6 31.7 27.6 29.3 27.6 27.6 30.0 29.3 27.1 @ 16.0 @ 27.0 32.3 31.2 36.2 0.2 0.2 0.2 0.4 1.2 2.4 1.0 0.8 0.6 0.1 15.4 14.6 11.8 22.1 43.9 43.2 31.0 20.1 16.1 3.4 3.0 2.5 2.2 2.3 3.1 2.5 1.5 1.6 1.8 1.6 1.9 2.0 2.1 2.0 1.4 1.4 1.4 1.7 1.8 1.9 Increase in Miscellaneous Expenditure Total Return on Average Net Worth % (RONW) ##(PAT divided by Average Net Worth) Return on Average Capital Employed % (ROCE) ##(PBIT divided by Average Funds Employed**) Long Term Debt/Cash Flow Gross Gearing % (Debt as a percentage of Debt plus Equity) Current Ratio (Current Assets divided by Current Liabilities) Assets Turnover (times) (Gross Sales divided by Total Assets) † > ^ @ ** < ## Includes Cost of Brand Acquired ` 133.7 million ! Includes Cost of Brands Acquired ` 17.8 million Includes Cost of Brands,Patents and trademarks Acquired ` 517.1 million @ Includes unutilised proceeds of FCCB bonds Rs 1102.4 million Includes Proceeds of FCCB bonds ` 1594.4 million Excluding 6% Redeemable Preference Share Capital of ` 28.75 million issued on 31st March 2008 and redeemed on 5th September 2008. Excluding Deferred Tax Liability (Net) Includes security premium received on FCCB conversion PAT & PBIT are excluding exceptional items P I D I L I T E A N N UA L R E P O R T 2 01 2 -13 Ratios 21 Directors’ Report To The Members Your Directors take pleasure in presenting the Forty Fourth Annual Report together with Audited Statements of Accounts for the year ended 31st March 2013. Financial Results (Rupees in million) 2012-13 2011-12 Gross Turnover 35287 29579 Turnover, Net of Excise 33118 27995 6196 4441 Profit Before Tax Current Year’s Tax 1559 1051 Profit After Current Year’s Tax 4637 3390 Deferred Tax 29 45 Profit After Tax 4608 3345 Profit Brought forward 1303 1073 Profit available for appropriation 5911 4418 1333 965* Appropriations Proposed Dividend on Equity Shares Tax on Dividend Transfer to Debenture Redemption Reserve 226 157 60 243 Transfer to General Reserve 2500 1750 Total 4119 3115 Balance Carried to Balance Sheet 1792 1303 5911 4418 *Includes dividend for the prior year paid on 3,49,388 equity shares issued on conversion of FCCBs after the balance sheet date but prior to the book closure. Financial Performance The Operating Profit and Net Profit for the year at ` 6752 million and ` 4608 million increased by 26% and 38% respectively. Income Tax for the current year at ` 1559 million is higher by 48%, due to completion of the first five year tax holiday period for one manufacturing unit located in Himachal Pradesh. With this all units have completed their first five year tax holiday period. Slow down in industrial growth in India combined with a weak global economy, impacted sales of industrial products. As a result, sales of industrial products grew by 10.6%, below the historical trends. Sales of Consumer & Bazaar products grew by 20.7%. Volume growth, however, was lower than past trends. The Indian Rupee was at ` 54.28 to a US $ as on 31st March 2013 as compared to ` 50.87 to a US $ as on 31st March 2012. Moreover the Rupee saw high volatility during the year and at times quoted above ` 57 to a US $. This made imports costlier and impacted margins. This movement adversely impacted the liability on account of outstanding Foreign Currency Convertible Bonds (FCCBs). However, this impact was partly offset by conversion of 128 FCCBs which resulted in write back of the earlier exchange fluctuations. Consequently, exchange loss for the year was only ` 5 million as compared to ` 85 million in the previous year. Gross Sales & Growth % 35,287 29,579 24,883 20,240 19,074 22.9 19.3 18.9 12.0 6.1 08-09 09-10 10-11 11-12 12-13 Growth % Gross Sales (` in million) PBT, PAT & Growth (YOY) 6,136## 4,225# 3,289** 101.6 4,548## 4,567## 3,289## 3,471## 2,935 100.5 1,464 34.3 28.5 12.1 08-09 -27.2 * 09-10 10-11 8.1 31.0 5.5 11-12 12-13 -22.3 PBT (` in million) Growth % PAT ` in million Growth % After deferred tax of ` 18 million and prior year's tax provision written back of ` nil. ** After deferred tax reversal of ` 25 million and prior year's tax provision written back of ` 44 million. # After deferred tax reversal of ` 6 million and before exceptional item of 250 million ## Excludes exceptional items. P I D I L I T E A N N UA L R E P O R T 2 01 2 -13 1,632* 23 Dividend Investment in Subsidiaries The Directors recommend a dividend of ` 2.60 per equity share of ` 1 each, out of the current year’s profit, on 512.64 million equity shares of ` 1 each (previous year @ ` 1.90 per equity share) amounting to ` 1333 million (previous year ` 965 million). Dividend for the current year will be free of tax in the hands of shareholders. The dividend payout amount has grown at a CAGR of 32% during the last 5 years. During the year, investment of ` 265.3 million was made in subsidiaries, of which ` 265 million was in overseas subsidiaries. Term Finance The Company has no outstanding term loans. Capital Expenditure The total expenditure during the year was ` 1284 million, of which approximately ` 1209.5 million was spent on fixed assets for various manufacturing units, offices, laboratories, warehouses and on information technology. The expenditure on the Synthetic Elastomer Project was approximately ` 74.5 million. 1559 1122 35.4 10-11 3.2 1.75 EMS (Environment Management System)/OHSAS (Occupational Health & Safety Assessment System) Certification has been obtained for 17 manufacturing locations and the Research & Development facility at Kondivita, Mumbai. Foreign Currency Convertible Bonds 518 09-10 3.3 1.50 Manufacturing Plants Implementation of water conservation initiatives across plants resulted in reduction of water consumption by 275kL/month. 886 08-09 2.8 1.75* The total amount spent on this project is ` 3625.9 million. The Company made an investment of ` 352.9 million and expanded capacity of various products to meet market demand. Dividend Payout (%) 30.2 With due consideration to techno-commercial factors and completion of a strategic review, the Company has decided to explore induction of a strategic partner for the project. During the year, the Company commissioned a manufacturing unit at Mahad for producing PVC film. Dividend Payout including tax on dividend (` in million) 31.3 As mentioned in last year’s report, construction work on the Synthetic Elastomer Project remained suspended as the Company was evaluating various alternatives regarding the future of the project. Implementation of these systems enables better control on safety management systems at the units and is one of the indicators of good manufacturing practices. Equity Dividend Payout & % of Net Profit (excluding exceptional items) 1029 Synthetic Elastomer Project 32.3 11-12 3.1 1.90 Dividend Cover (Times) Dividend per Share (`) * Dividend for 2008 - 09 is on pre Bonus capital. 34.3 12-13 2.9 2.60 Of the US $ 40 million raised through issue of 400 zero coupon Foreign Currency Convertible Bonds (Bonds) in 2007-2008, 333 Bonds aggregating US $ 33.3 million were outstanding as on 31st March 2012. 128 Bonds worth US $ 12.8 million were converted during the year and 4,993,704 Equity shares issued. The remaining 205 Bonds were redeemed on due date. The Company has not accepted any fixed deposit during the year 2012-13. Subsidiaries Domestic During the year, a Joint Venture Company, Building Envelope Systems India Limited was incorporated for manufacture of a select range of construction chemicals for application in waterproofing and thermal insulation. All these products will be sold through the Company. These products will address demand for high end waterproofing solutions. The Company holds 60% of the capital in the Joint Venture Company. Overseas Subsidiaries Total revenue grew by 6.6% in constant currency terms. The business in US reported sales growth of 10.2%. EBIDTA for the year declined by 21.6% due to higher material costs and item as detailed later. The subsidiary in Brazil continued to perform below expectations. Sales declined by 0.9%. However due to actions taken to improve performance, sales growth in the second half was 6.7% as compared to a decline of 7.9% in the first half. Actions taken to improve performance include strengthening the management as well as to reduce cost and improve margin. The subsidiary in Bangladesh reported sales growth of 34%. The business scope was extended to include trading operations which started in December 2012. Sales growth after including the revenue from trading operations was 42%. The manufacturing facility was expanded to produce a wider range of adhesives. Full benefit of these initiatives will be reflected in the current year. i. Provision for receivables due from a customer who has filed for bankruptcy in US ii. Provision for goodwill impairment in Brazil iii. Provision for disputed tax liabilities of previous years & other disputed items in Brazil iv. One off expenses for closure of factory in Thailand Total ` 25 million ` 94 million ` 46 million ` 12 million ` 177 million The total investment in overseas subsidiaries as on 31st March 2013 stands at ` 3032.34 million. Consolidated Accounts In accordance with the requirements of Accounting Standards AS 21 (read with AS 23), issued by the Institute of Chartered Accountants of India, the Consolidated Accounts of the Company and its subsidiaries are annexed to this Annual Report. Additionally, a statement giving prescribed particulars of information, in aggregate for each subsidiary, is attached. In terms of the General Circular No. 2/2011 dated 8th February 2011, issued by the Government of India, Ministry of Corporate Affairs, the Annual Reports of the subsidiary Companies are not annexed to this Report. Members desiring to have a copy of audited Annual Accounts and the related detailed information of the above subsidiaries may write to the Company Secretary at the Registered Office of the Company and they will be provided with the same upon such a request. Annual Accounts of these subsidiary Companies will also be kept for inspection of the Members at the Registered Office of the Company as well as at the Registered Office of the subsidiary Companies. Directors The subsidiaries in Thailand reported sales growth of 22%. The manufacturing operations in Thailand were rationalised by shutting down one manufacturing facility to reduce operating costs. Shri B K Parekh, Founder Chairman of the Company passed away on 25th January 2013. Shri B K Parekh was a visionary of unassuming quality and was a warm, loving and caring leader with strong business acumen. The subsidiary in Egypt had a sales growth of 25%. Losses were significantly reduced. The subsidiary in Dubai reported sales decline of 42%. With measures taken to reduce costs, losses were lower than last year. The tenure of Shri M B Parekh as Managing Director, Shri N K Parekh as Joint Managing Director and Shri A B Parekh as Whole-time Director will expire on 31st July 2013. The Directors at their meeting held on 10th June 2013 have re-appointed them for a period of 5 years. Due to the reasons mentioned above, the overseas operations continue to report losses. The Members’ approval is being sought at the ensuing Annual General Meeting for above re-appointments. Full year losses incurred by overseas subsidiaries were ` 440 million as compared to a loss of ` 254 million last year. This was mainly due to the following items: In accordance with the Articles of Association of the Company, the tenure of Shri R M Gandhi as a Director expires at the ensuing Annual General Meeting. P I D I L I T E A N N UA L R E P O R T 2 01 2 -13 Fixed Deposits 25 Shri R M Gandhi has expressed his unwillingness to be re-appointed as a Director. The Directors place on record their sincere appreciaton of the valuable contribution made by him during his tenure on the Board. In accordance with the Articles of Association of the Company, Shri Yash Mahajan, Shri N J Jhaveri, Shri S K Parekh and Shri A N Parekh, Directors of the Company, retire by rotation and being eligible, offer themselves for re-appointment. At the Board meeting held on 28th May 2013, Shri M B Parekh was appointed as the Chairman & Managing Director of the Company. Directors’ Responsibility Statement Your Directors confirm that: • in the preparation of the Annual Accounts, the applicable accounting standards have been followed; • theDirectorshaveselectedsuchaccountingpolicies and applied them consistently and made judgments and estimates that are reasonable and prudent so as to give a true and fair view of the state of affairs of the Company at the end of the financial year ended 31st March 2013 and of the profit of the Company for the year ended on that date; • theDirectorshavetakenproperandsufficientcare for the maintenance of adequate accounting records in accordance with the provisions of the Companies Act, 1956 for safeguarding the assets of the Company and for preventing and detecting fraud and other irregularities; and • TheDirectorshavepreparedtheAnnualAccounts on a going concern basis. Corporate Governance Reports on Corporate Governance and Management Discussion and Analysis, in accordance with Clause 49 of the Listing Agreements with Stock Exchanges, along with a certificate from M/s M M Sheth & Co. Practising Company Secretaries, are given separately in this Annual Report. Auditors M/s Haribhakti & Co. the Company’s Auditors are not seeking re-appointment at the forthcoming Annual General Meeting. The Directors place on record their appreciation of the valuable services rendered by them during their tenure as the Auditors of the Company. It is proposed to appoint M/s Deloitte Haskins & Sells, Chartered Accountants as the Statutory Auditors to hold office from the conclusion of this Annual General Meeting till the conclusion of the next Annual General Meeting. M/s Deloitte Haskins & Sells, Chartered Accountants, have consented to be the Auditors of the Company, if appointed by the members at the Annual General Meeting and have also confirmed that their appointment would be within the limits specified under Section 224(1B) of the Companies Act, 1956. Cost Auditor The Company has appointed M/s V J Talati & Co. as Cost Auditor to conduct cost audit for the financial year 2013-14, subject to the approval of the Central Government. The Cost Audit Report for the year ended March 2013 will be submitted in due course. The Company duly filed the Cost Audit Report for the year ended March 2012 with the Central Government on 30th January 2013. Conservation of Energy, Technology Absorption, etc. The particulars under Section 217(1)(e) of the Companies Act, 1956 read with the Companies (Disclosure of Particulars in the Report of the Board of Directors) Rules, 1988 are attached to this Report as Annexure I. Particulars of Employees A statement of particulars pursuant to Section 217(2A) of the Companies Act, 1956 read with the Companies (Particulars of Employees) Rules, 1975 forms part of this Report as Annexure II. As per the provisions of Section 219(1)(b)(iv) of the Companies Act, 1956, the Report, together with Accounts, is being sent to the Shareholders of the Company, excluding the statement of particulars of employees under Section 217(2A) of the Act. Members desiring to have a copy of the same may write to the Company Secretary at the Registered Office of the Company and they will be provided with the same upon such a request. Industry Structure and Development There is no material change in the industry structure as was reported last year. The Company operates under two major business segments i.e. Branded Consumer & Bazaar Products and Industrial Products. Products such as Adhesives, Sealants, Art Materials, Construction and Paint Chemicals are covered under branded Consumer & Bazaar Products segment. These products are widely used by carpenters, painters, plumbers, mechanics, households, students, offices, etc. Industrial Products segment covers products such as Industrial Adhesives, Synthetic Resins, Organic Pigments, Pigment Preparations, Surfactants, etc. and caters to various industries like packaging, textiles, paints, printing inks, paper, leather, etc. The “Other” segment largely covers manufacture and sale of VAM. As mentioned earlier, due to global demand supply situation it was viable to import VAM rather than manufacture in-house and accordingly the plant remained shut last year. Going forward, import of VAM is likely to remain more viable. As mentioned earlier, the Company has started manufacturing few speciality acetates at the plant. Market feedback, from the products manufactured and sold in the current year, has been positive. Current Year Outlook The demand for the Company’s products is linked to the market demand both in India and globally. The current year’s outlook is uncertain due to the present weakness in the underlying economic scenario. With the Indian Rupee likely to remain weak versus the US $ due to the high fiscal deficit, margins are not likely to improve as higher cost of imports could offset gains from lower commodity prices. The Audit Committee of the Board of Directors periodically reviews the audit plans, internal audit reports and adequacy of internal controls and risk management. The internal audit process of the Company detected a fraud whereby goods, described as samples were misappropriated. The total amount of misappropriation is ` 170.1 million. The Company had intimated the Stock Exchanges and initiated legal proceedings. This led to recovery of part of the amount. The nature of the misappropriation was such that its impact had already been reflected in the Company’s financial results for the earlier years. The Company has taken adequate steps to strengthen the internal control procedures to prevent such instances in future. Human Resources The Company continues to place significant importance on its Human Resources and enjoys cordial relations at all levels. The Performance Management System has undergone considerable improvement and has enabled sharpening of the process of setting Goals & Major Initiatives. During the year, the organisation structures of all key functions have been reviewed and strengthened so as to facilitate delivery of business goals. The Company’s major subsidiaries are in USA, Brazil, Thailand, Egypt and Bangladesh. The total number of employees as on 31st March 2013 was 4358. All these units are making efforts to improve performance through demand generation and cost reduction initiatives. SAP Implementation Outlook on Opportunities, Threats, Risks and Concerns The Indian economy provides a large opportunity to the Company to market its differentiated products. Recovery in select global economies could provide a boost to exports. However, slower growth of the Indian economy could impact the performance of the Company. A weak Indian currency could make imports costlier thereby putting pressure on margins. Overseas subsidiaries by virtue of their relatively smaller size remain vulnerable to the political and economic uncertainties of their respective countries. The Company has implemented SAP across all its plants, depots and Head Office effective May 2013. This will improve productivity and provide accurate real time information for improved analysis and decision support. Appreciation Your Directors wish to place on record their appreciation of the contribution made by employees at all level to the continued growth and prosperity of your Company. Your Directors also wish to place on record their appreciation to the shareholders, dealers, distributors, consumers, banks and other financial institutions for their continued support. FOR AND ON BEHALF OF THE BOARD Internal Control Systems and their Adequacy The Company has adequate internal control procedures commensurate with its size and nature of business. The Company has appointed Internal Auditors who audit the adequacy and effectiveness of internal controls laid down by the management and suggest improvements. Mumbai Date : 10th June 2013 M B Parekh Chairman & Managing Director P I D I L I T E A N N UA L R E P O R T 2 01 2 -13 In both the above business segments, there are a few medium to large companies with national presence and a large number of small size companies that are active regionally. There is growing presence of multinationals in many of the segments in which the Company operates. The share of imports is less than 10% of domestic volumes in most of the product segments. 27 Social& Community Initiatives The Company supports various bodies in carrying out activities in the areas of rural development, education, health care and general semantics. These are Gram Nirman Samaj, Hanumant Hospital (managed by Shree Hanumant Seva Medicare Trust), Mahuva Education Trust, Triveni Kalyan Education Trust and Balvant Parekh Centre for General Semantics and other Human Sciences. A literacy class in session House constructed under the Indira Awas Yojana Rural Development & Education forming child protection committees and finding village volunteers for awareness creation in their respective area. Another important aspect was to identify school dropouts and bring them back to school. The projects implemented by Gram Nirman Samaj are mainly aimed at water resource management, basic education, infrastructure development and empowering women. During the year, Gram Nirman Samaj completed 109 water conservation projects in 42 villages of Gujarat. These included setting up percolation tanks, farm ponds and check dams. Literacy classes aimed at imparting basic skills like writing benefitted 284 persons from economically weaker sections. Training was also provided through self-help groups to empower women by imparting skills like tailoring, glass painting, etc. During the year, eight self-help groups worked with 142 members. Gram Nirman Samaj also assists families of disadvantaged sections in availing of the benefits of various family welfare schemes of the Government and this year 1678 persons benefitted from these initiatives. 2,403 children were identified as “out of school”, a majority of them hailed from coastal areas and were employed as migratory workers in cotton farms. Through persuasion as well as meetings with parents and guardians, 1,833 children were brought into the mainstream. About 39,000 students from 500 schools participated in the Indian Science Olympiad. A monthly Gujarati magazine “Science Express” aimed at imparting knowledge on science and technology was launched in October, 2012. ‘Khajano’ an outlet selling science books, toys, educational projects and DVD’s was inaugurated during the year. Indira Awas Yojana aims at helping rural people below the poverty line (BPL) in construction of dwelling units. Gram Nirman Samaj provided assistance in construction of 31 houses under Indira Awas Yojana. Gram Nirman Samaj is also implementing a UNICEF sponsored project named ‘Protecting & Promoting Children Rights in Cotton Growing Area of Gujarat’ in 60 villages of Mahuva taluka. The key areas are formation and training of groups of children, adolescent girls, “Science Express” for imparting knowledge on science and technology UNICEF project Multi Speciality camp conducted at Mota asarana Health care The Centre conducted a programme for high school and higher secondary school teachers on the theme “Consciousness of Abstracting in Life and Learning: Teaching as a Time-binding Endeavour.” The hospital infrastructure was upgraded with a 4D sonography machine with electrograph facility in the Radiology department. An additional dialysis machine and an advanced ventilator machine were procured for treatment of critical patients. A new building for Hanumant Nursing School and Pharmacy is being constructed. Hanumant Hospital runs a Rubella Vaccination Centre and conducted 7 vaccination camps and awareness campaigns at different places. Over 240 girls were vaccinated. The hospital also facilitates the PNR society of Bhavnagar to run a Rehabilitation Center for physically challenged children and a workshop on repairing of mobile phones was conducted for such children. Hanumant Hospital conducts free cataract surgeries and dialysis for underprivileged patients and in the current year 280 cataract surgeries & 450 dialysis were conducted. The hospital continued to provide medical facilities to the economically weaker sections under Lok Sanjivani Scheme and Arogya Fund Scheme II & III. The hospital conducted over 30 speciality medical camps & 6 educational training programmes for the medical fraternity. Speciality health camps and public seminar on diabetes were also conducted. The Company continues to support The Lata Mangeshkar Medical Foundation, Pune to provide better health care facilities particularly in Obstetrics & Neonatal Intensive Care Units. General Semantics Several lecture sessions, workshops and discussion forums were conducted during the year by Balvant Parekh Centre for General Semantics and Other Human Sciences. A certificate course on General Semantics and its implications in pedagogy, in collaboration with S. B. Gardi Department of English, Maharaja Krishnakumarsinhji Bhavnagar University was conducted to understand how general semantics works in day to day life and in communication. The Centre organised a National Workshop on General Semantics titled ‘Radical General Semantics: The Korzybskian Approach to Applied Epistemology’ (Epistemics) jointly with the Department of English, Jaipur National University with world renowned Dr. Bruce Kodish, Ph. D. in Applied Epistemology/ General Semantics and a certified teacher for Alexander Technique of Posture movement education as the core faculty and an Advanced National Workshop in General Semantics at Baroda. The Centre facilitated other programmes conducted by Dr. Bruce Kodish in India which included a one day seminar at Chandibai Himmatmal Mansukhani College, Ulhasnagar, Mumbai and a lecture at IIT Mumbai. Anekaant: A Journal of Polysemic Thought The first issue of Anekaant: A Journal of Polysemic Thought, an annual publication by Balvant Parekh Centre for General Semantics and Other Human Sciences was released in March 2013. This issue was dedicated to the memory of Shri Balvantray K Parekh. The contributors included Fred Dallmayr, Douglas Allen, Pascal Bruckner, Bruce Kodish, Martin Levinson, Devkumar Trivedi, Lance Strate and Pravesh Golay. Other Initiatives The Company sponsored the “Cancer Patients Aid Association Fashion Show” in which style icons from film fraternity, prominent industrialists and achievers from different walks of life participated. P I D I L I T E A N N UA L R E P O R T 2 01 2 -13 During the year, Hanumant Hospital added new equipments and opened new departments. Facilities for plastic surgery were added and the year saw appointment of a full time plastic surgeon at the hospital. Beds for ICU, special & general wards were also added during the year. 29 Annexure I to the Directors’ Report Statement containing particulars pursuant to the Companies (Disclosure of particulars in the Report of the Board of Directors) Rules, 1988 forming part of the report of the Directors. A] CONSERVATION OF ENERGY a) b) Energy Conservation Measures taken 1. Use of Solar thermal system (renewable energy) to meet process heating requirements. 2. Installation of Hydrofoil type agitators, Root blowers to replace compressed air usage and Vacuum pumps to replace ejectors. 3. Use of day light harvesting and replacement of conventional lighting with LED lights. 4. Installation of high speed packaging machines. 5. Installation of condensate recovery system. Additional Investments and Proposals, if any, being implemented for reduction of Consumption of Energy 1. Evaluation of renewable energy options like Solar PV projects and accreditation of Windmills for Renewable Energy Certificate. 2. Green building initiatives to reduce air conditioning load of existing and upcoming projects. c) Impact of measures of (a) and (b) above for reduction of energy consumption and consequent impact on the cost of production of goods 14.48 lac kwh Electricity, 234 MT of Fuel Oil and 13 lac SCM Pipeline Natural Gas are expected to be saved annually by the above measures. This saving shall contribute to reduction of Electricity consumption by 8% and Fuel consumption by 23% as compared to financial year 2011-12. d) Total energy consumption and energy consumption per unit of production As per Form A FORM A Disclosure of particulars with respect to Conservation of Energy A. Power and Fuel consumption / Generation 1. Year ended 31st March 2013 Year ended 31st March 2012 ‘000 kwh 2,21,43 1,80,89 in million 146.82 108.25 6.63 5.98 ‘000 kwh 5,80 14,10 kwh 2.86 2.98 / kwh 16.66 13.31 Units ‘000 kwh 91,76 94,62 Quantity MT 2,413 1,929 Total Amount in million 14.33 10.04 Average Rate ‘000 /MT 5.94 5.20 Electricity a. Purchased Units Total amount Rate / Unit (Average) b. Own Generation (i) Through Diesel Generator Units Units per litre of diesel oil Cost / Unit (ii) Windmill Generation 2. Coal A. Power and Fuel consumption / Generation 3. Quantity ‘000 SCM 45,69 40,46 Total Amount in million 141.31 97.10 /SCM 30.93 24.00 MT 4,64 9,95 Total Amount in million 23.13 39.23 Average Rate ‘000 /MT 49.81 39.44 MT 9,13 9,56 Total Amount in million 47.82 45.10 Average Rate ‘000 /MT 5.24 4.72 Fuel Oil Quantity 5. Year ended 31st March 2012 Natural Gas Average Rate 4. Year ended 31st March 2013 Briquette Quantity Notes: • Increase in electricity consumption is mainly due to shift to purchased power from captive generation at one manufacturing location as well as trial production and production runs of a new product. However, various energy saving initiatives like energy efficient motors, higher throughput machines, process optimization and utilization of windmills have helped in controlling electricity consumption. • Coal consumption increased by 25% due to trial production at new manufacturing facility and production runs of new product. • Fuel oil consumption reduced due to migration to alternate cleaner/cheaper fuels, implementation of heat recovery and condensate recovery schemes. • Pipeline Natural Gas consumption increased due to migration from fuel oil to Pipeline Natural Gas at one unit and volume growth at other units. B. Consumption per unit of production It is not feasible to furnish information in respect of consumption per unit of production B] TECHNOLOGY ABSORPTION e) Efforts made in technology absorption (as per Form B) FORM B Disclosure of particulars with respect to Technology Absorption 1. Specific areas in which R & D is carried out by the Company R&D activities are continued for development of new products, improvement of existing products in the category of Synthetic Resins, Adhesives, Sealants, Pigments and Pigment Dispersions, Intermediates, Surfactants, Art Materials, Coatings, Fabric Care products, Construction Chemicals, Maintenance Chemicals, Emulsions Polymers etc. Products specific to the requirements of certain export market are also under development. 2. Benefits derived as a result of the above R & D Increase in sales due to product improvements and introduction of new products, reduction in cost and pollutants load due to formulation optimization, process improvements and cycle time reduction. P I D I L I T E A N N UA L R E P O R T 2 01 2 -13 RESEARCH & DEVELOPMENT (R & D) 31 3. Future Plan of Action Future R&D efforts will continue along present lines. 4. Expenditure on R & D ( in million) Year ended 31st March 2013 Year ended 31st March 2012 i) Capital 9.44 1.95 ii) Recurring 164.17 128.61 Total 173.61 130.56 0.49 0.44 iii) 5. Total R&D Expenditure as a Percentage of total turnover Technology Absorption, Adaptation and Innovation i) Technologies and processes developed by the R&D Department are being continuously absorbed and adopted on a commercial scale. Based on the patented processes acquired from Polimeri Europa Elastomers France, S.A. the Company has developed few processes in the manufacture of Poly Chloroprene Rubber and applications for patents have been filed by the Company. Technology for production of Isopropyl acetate (IPAc) is established and optimized. ii) Benefits derived as a result of the above effort: Improvements in products and processes. Existing VAM plant was adapted for production of IPAc. iii) Information regarding technology imported during the last 5 years: No technology imported during the last 5 years. C] FOREIGN EXCHANGE EARNINGS & OUTGO f) Activities relating to exports, initiatives taken to increase exports, development of new export markets for products and services and export plans. Export earnings during 2012-2013 have shown an increase of 545 million over 2011-2012. g) Total foreign exchange used and earned ( in million) Year ended 31st March 2013 Year ended 31st March 2012 Foreign exchange earned 3,207 2,662 Foreign exchanged used 5,117 4,637 Disclosure of particulars in the report of Board of Directors under Health, Safety & Environment for the year 2012-2013 1. Pidilite Safety, Health & Environment Excellence Model (PSHEM) launched to • achieve high standards in Environment, Health and Safety performance across manufacturing locations. • bring in a uniform EHS Management system across all manufacturing locations. • ensure 100% statutory compliance. 2. R & D facility and support functions certified for Environment Management System (EMS) & Occupational Health Safety Management System (OHSAS). 3. 4. One of the units of the Company located at Baddi, Himachal Pradesh (Baddi – Unit II) won a silver medal in INDIAN MANUFACTURING EXCELLENCE AWARD. This award is given by Economic Times in partnership with Frost & Sullivan to recognize manufacturing capability in India. In order to comply to the global EHS regulation products (Yellow-83 and Violet 23 pigments) are registered for export under REACH (Registration Evaluation Authorisation of Chemicals). Independent Auditors’ Report To the Members of Pidilite Industries Limited Report on the Financial Statements We have audited the accompanying financial statements of Pidilite Industries Limited (“the Company”), which comprise the Balance Sheet as at March 31, 2013, the Statement of Profit and Loss and the Cash Flow Statement for the year then ended and a Summary of Significant Accounting Policies and Other Explanatory Information. conformity with the accounting principles generally accepted in India: Management’s Responsibility for the Financial Statements Management is responsible for the preparation of these financial statements that give a true and fair view of the financial position, financial performance and cash flows of the Company in accordance with the Accounting Standards referred to in sub-section (3C) of Section 211 of the Companies Act, 1956 (“the Act”). This responsibility includes the design, implementation and maintenance of internal control relevant to the preparation and presentation of the financial statements that give a true and fair view and are free from material misstatement, whether due to fraud or error. (c) in the case of the Cash Flow Statement, of the cash flows for the year ended on that date. An audit involves performing procedures to obtain audit evidence about the amounts and disclosures in the financial statements. The procedures selected depend on the auditors’ judgment, including the assessment of the risks of material misstatement of the financial statements, whether due to fraud or error. In making those risk assessments, the auditor considers internal control relevant to the Company’s preparation and fair presentation of the financial statements in order to design audit procedures that are appropriate in the circumstances. An audit also includes evaluating the appropriateness of accounting policies used and the reasonableness of the accounting estimates made by management, as well as evaluating the overall presentation of the financial statements. We believe that the audit evidence we have obtained is sufficient and appropriate to provide a basis for our audit opinion. Opinion In our opinion and to the best of our information and according to the explanations given to us, the financial statements give the information required by the Act in the manner so required and give a true and fair view in (b) in the case of the Statement of Profit and Loss, of the profit for the year ended on that date; and Report on Other Legal and Regulatory Requirements 1. As required by the Companies (Auditors’ Report) Order, 2003 (“the Order”) issued by the Central Government of India in terms of sub-section (4A) of Section 227 of the Act, we give in the Annexure, a statement on the matters specified in paragraphs 4 and 5 of the Order. 2. As required by Section 227(3) of the Act, we report that: a. we have obtained all the information and explanations which to the best of our knowledge and belief were necessary for the purpose of our audit; b. in our opinion proper books of account as required by law have been kept by the Company so far as appears from our examination of those books; c. the Balance Sheet, Statement of Profit and Loss and Cash Flow Statement dealt with by this report are in agreement with the books of account; d. in our opinion, the Balance Sheet, Statement of Profit and Loss and Cash Flow Statement comply with the Accounting Standards referred to in subsection (3C) of Section 211 of the Companies Act, 1956; e. on the basis of written representations received from the directors as on March 31, 2013, and taken on record by the Board of Directors, none of the directors is disqualified as on March 31, 2013, from being appointed as a director in terms of clause (g) of sub-section (1) of Section 274 of the Companies Act, 1956. For Haribhakti & Co. Chartered Accountants Firm Registration No. 103523W Chetan Desai Partner Membership No. 17000 Place: Mumbai Date: 28th May 2013 P I D I L I T E A N N UA L R E P O R T 2 01 2 -13 Auditors’ Responsibility Our responsibility is to express an opinion on these financial statements based on our audit. We conducted our audit in accordance with the Standards on Auditing issued by the Institute of Chartered Accountants of India. Those Standards require that we comply with ethical requirements and plan and perform the audit to obtain reasonable assurance about whether the financial statements are free from material misstatement. (a) in the case of the Balance Sheet, of the state of affairs of the Company as at March 31, 2013; 33 Annexure to Independent Auditors’ Report [Referred to in paragraph 1 under ‘Report on Other Legal and Regulatory Requirements’ in the Independent Auditors’ Report of even date to the members of Pidilite Industries Limited on the financial statements for the year ended March 31, 2013] i. (a) The Company has maintained proper records showing full particulars, including quantitative details and situation of fixed assets. (b) All the fixed assets have not been physically verified by the management during the year, but there is a regular programme of verification which, in our opinion, is reasonable having regard to the size of the Company and the nature of its assets. As informed, no material discrepancies were noticed on such verification. (c) In our opinion and according to the information and explanations given to us, a substantial part of fixed assets has not been disposed off by the Company during the year. ii. (a) The inventory (excluding stocks with third parties) has been physically verified by the management during the year. In respect of inventory lying with third parties, these have substantially been confirmed by them. In our opinion, the frequency of verification is reasonable. (b) The procedures of physical verification of inventory followed by the management are reasonable and adequate in relation to the size of the Company and the nature of its business. (c) The Company is maintaining proper records of inventory and no material discrepancies were noticed on physical verification carried out at the end of the year. iii. (a) As informed, the Company has not granted any loans, secured or unsecured to companies, firms or other parties covered in the register maintained under Section 301 of the Companies Act, 1956. Accordingly, the provisions stated in paragraph 4 (iii) (b), (c) and (d) of the order are not applicable. (e) As informed, the Company has not taken any loans, secured or unsecured from companies, firms or other parties covered in the register maintained under Section 301 of the Companies Act, 1956. Accordingly, the provisions stated in paragraph 4 (iii) (f) and (g) of the order are not applicable. iv. In our opinion and according to the information and explanations given to us, there exists an adequate internal control system commensurate with the size of the Company and the nature of its business with regard to purchase of inventory, fixed assets and with regard to the sale of goods. During the course of our audit, we have not observed any continuing failure to correct major weaknesses in internal control system of the Company. v. (a) According to the information and explanations given to us, we are of the opinion that the particulars of contracts or arrangements referred to in Section 301 of the Companies Act, 1956 that need to be entered into the register maintained under Section 301 have been so entered. (b) In our opinion and according to the information and explanations given to us, the transactions made in pursuance of such contracts or arrangements exceeding value of Rs five lakhs have been entered into during the financial year at prices which are reasonable having regard to the prevailing market prices at the relevant time. vi. In our opinion and according to the information and explanations given to us, the Company has not accepted any deposits from the public within the meaning of Sections 58A and 58AA of the Act and the rules framed there under. vii. In our opinion, the Company has an internal audit system commensurate with the size and nature of its business. viii. We have broadly reviewed the books of account maintained by the Company in respect of products where, pursuant to the Rules made by the Central Government of India, the maintenance of cost records has been prescribed under clause (d) of sub-section (1) of Section 209 of the Act and we are of the opinion that prima facie, the prescribed accounts and records have been made and maintained. ix. (a) The Company is regular in depositing with appropriate authorities undisputed statutory dues including provident fund, investor education and protection fund, employees’ state insurance, income-tax, sales-tax, wealth-tax, service tax, customs duty, excise duty, cess and other material statutory dues applicable to it. (b) According to the information and explanations given to us, no undisputed amounts payable in respect of provident fund, investor education and protection fund, employees’ state insurance, income-tax, wealth-tax, service tax, salestax, customs duty, excise duty, cess and other undisputed statutory dues were outstanding, at the year end, for a period of more than six months from the date they became payable. (c) According to the records of the Company, the dues outstanding of income-tax, sales-tax, wealth-tax, service tax, customs duty, excise duty and cess on account of any dispute, are as follows: Nature of dues Amount ( in million) Period to which the amount relates Forum where dispute is pending Sales Tax Act Sales Tax in Various States 336.95 1994-95, 1998-99 & 2000-01 to 2011-12 Sales Tax Act Sales Tax in Various States 25.23 1995-96, 1998-99 to 2000-01 Sales Tax Act Sales Tax in Various States 3.42 2003-04 & 2005-06 High Court Central Excise Act Excise Duty in Various States 1.12 1982-83 & 1997-98 to 2010-11 CESTAT Income Tax Act Income Tax x. The Company has no accumulated losses at the end of the financial year and it has not incurred cash losses in the current and immediately preceding financial year. xi. In our opinion and according to the information and explanations given to us, the Company has not defaulted in repayment of dues to a financial institution, bank or debenture holders. xii. According to the information and explanations given to us and based on the documents and records produced to us, the Company has not granted loans & advances on the basis of security by way of pledge of shares, debentures and other securities. xiii. In our opinion, the Company is not a chit fund or a nidhi / mutual benefit fund / society. Therefore, the provisions of clause (xiii) of paragraph 4 of the Companies (Auditor’s Report) Order, 2003 (as amended) are not applicable to the Company. xiv. In our opinion, the Company is not dealing in or trading in shares, securities, debentures and other investments. Accordingly, the provisions of clause (xiv) of paragraph 4 of the Companies (Auditor’s Report) Order, 2003 (as amended) are not applicable to the Company. xv. In our opinion and according to the information and explanations given to us, the terms and conditions of the guarantees given by the Company, for loans taken by others from banks or financial institutions during the year, are not prejudicial to the interest of the Company. xvi. In our opinion, the term loans have been applied for the purpose for which the loans were raised. 12.68 2007-08 & 2009-10 Deputy/Joint Commissioner of Sales Tax Sales Tax Tribunal Commissioner (Appeals) xvii. According to the information and explanations given to us and on an overall examination of the Balance Sheet of the Company, we report that no funds raised on short-term basis have been used for long-term investment. xviii. According to the information and explanation given to us, the Company has not made any preferential allotment of shares to parties and companies covered in the Register maintained under Section 301 of the Companies Act, 1956. xix. According to the information and explanations given to us, no debentures have been issued by the Company during the year. xx. The Company has not raised money by way of public issue during the year. xxi. As per the information and explanations given to us, the Company has reported a misappropriation of finished goods of the value of 170.1 million. The cost of such goods has already been charged in concerned financial years. Except this, we have neither come across nor informed of any other instances of fraud on or by the Company during the year. For Haribhakti & Co. Chartered Accountants Firm Registration No. 103523W Chetan Desai Partner Membership No. 17000 Place: Mumbai Date: 28th May 2013 P I D I L I T E A N N UA L R E P O R T 2 01 2 -13 Name of the Statute 35 Balance Sheet As at 31st March 2013 ( in million) Notes As at 31st March 2013 As at 31st March 2012 EQUITY AND LIABILITIES Shareholders’ Funds Share Capital 2 512.64 507.65 Reserves and Surplus 3 16,811.73 13,208.99 17,324.37 13,716.64 Non-Current liabilities Long-Term Borrowings 4 - 922.97 Deferred Tax Liability (net) 5 483.62 454.27 Long-Term Provisions 6 142.87 101.38 626.49 1,478.62 Current Liabilities Trade Payables 7 2,071.37 1,702.28 Other Current Liabilities 8 3,727.73 4,928.64 Short-Term Provisions 9 1,634.30 1,179.46 7,433.40 7,810.38 25,384.26 23,005.64 TOTAL ASSETS Non Current Assets Fixed Assets Tangible Assets 10 Intangible Assets 11 Capital Work-In-Progress 4,717.13 5,119.94 217.13 242.09 4,087.09 3,713.35 9,424.16 8,672.57 Non Current Investments 12 2,623.17 2,418.83 Long-Term Loans and Advances 13 242.28 249.51 Other Non-Current Assets 14 - 1.37 12,289.61 11,342.28 Current Assets Current Investments 15 2,846.29 909.16 Inventories 16 4,511.64 3,963.04 Trade Receivables 17 3,667.63 3,261.18 Cash and Bank Balances 18 1,368.24 2,577.19 Short-Term Loans and Advances 19 594.08 859.87 Other Current Assets 20 106.77 92.92 13,094.65 11,663.36 25,384.26 23,005.64 TOTAL Summary of Significant Accounting Policies Notes on Financial Statements 1 2 to 51 The accompanying notes are an integral part of the financial statements AS PER OUR ATTACHED REPORT OF EVEN DATE For Haribhakti & Co. Chartered Accountants FRN 103523W FOR AND ON BEHALF OF THE BOARD M B PAREKH Chairman & Managing Director CHETAN DESAI S K PAREKH Vice Chairman Partner Membership No. 17000 Place: Mumbai Date: 28th May 2013 SAVITHRI PAREKH Company Secretary Statement of Profit and Loss For The Year Ended 31st March 2013 ( in million) Notes 2012-13 2011-12 35,485.99 29,746.81 2,169.08 1,583.61 33,316.91 28,163.20 658.97 427.67 33,975.88 28,590.87 16,966.67 14,637.41 INCOME Revenue from Operations (Gross) 21 Less: Excise Duty Revenue from Operations (Net) Other Income 22 Total Income EXPENSES Cost of Materials 23 Purchase of Stock in Trade Change in inventories of Finished Goods, Work-in-Progress and Stock in Trade 1,561.21 1,316.06 24 (392.45) (279.16) Employee Benefits Expense 25 3,010.29 2,611.56 Depreciation and Amortization Expense 26 532.41 479.26 Finance Cost 27 121.74 245.04 Other Expenses 28 6,039.76 5,013.24 27,839.63 24,023.41 6,136.25 4,567.46 (59.44) 126.29 6,195.69 4,441.17 1,558.75 1,051.50 29.34 44.61 Total Tax expenses 1,588.09 1,096.11 Profit for the year 4,607.60 3,345.06 9.04 6.59 Diluted ( ) 9.04 6.43 Face Value of Share ( ) 1.00 1.00 Total Expenses Profit before Exceptional Items and Tax (Add)/Less: Exceptional Items (net) 29 Profit before Tax Less: Tax Expenses Current Tax Deferred Tax Earnings Per Share: (Refer Note 40) Basic ( ) Summary of Significant Accounting Policies Notes on Financial Statements 1 2 to 51 AS PER OUR ATTACHED REPORT OF EVEN DATE For Haribhakti & Co. Chartered Accountants FRN 103523W FOR AND ON BEHALF OF THE BOARD M B PAREKH Chairman & Managing Director CHETAN DESAI S K PAREKH Vice Chairman Partner Membership No. 17000 Place: Mumbai Date: 28th May 2013 SAVITHRI PAREKH Company Secretary P I D I L I T E A N N UA L R E P O R T 2 01 2 -13 The accompanying notes are an integral part of the financial statements 37 Notes 1 Summary of Significant Accounting Policies Basis of preparation The financial statements of the company have been prepared in accordance with generally accepted accounting principles in India (Indian GAAP). The financial statements are prepared under the historical cost convention, on the basis of a going concern and as per applicable Indian Accounting Standards. The Company follows mercantile system of accounting and recognizes income and expenditure on accrual basis (except as otherwise stated). a. Presentation and disclosure of financial statements As notified by Ministry of Corporate Affairs, revised Schedule VI under the Companies Act, 1956 is applicable to the financial statements for the financial year commencing on or after 1st April 2011. Accordingly, the financial statements for the period ended 31st March 2013 are prepared in accordance with the revised Schedule VI. b. Use of Estimates The preparation of financial statements in conformity with Indian GAAP requires the management to make judgments, estimates and assumptions that affect the reported amounts of revenues, expenses, assets and liabilities and the disclosure of contingent liabilities, at the end of the reporting period. Although these estimates are based on the management’s best knowledge of current events and actions, uncertainty about these assumptions and estimates could result in the outcomes requiring a material adjustment to the carrying amount of assets or liabilities in future periods. c. Tangible Fixed Assets, Depreciation and Impairment Loss a) Fixed Assets are stated at cost of acquisition or construction as reduced by accumulated depreciation and impairment loss, if any. b) Preoperative expenditure during construction period / trial run: Direct expenses as well as clearly identifiable indirect expenses incurred on the projects during the period of construction are capitalized along with the respective assets. c) The Company provides depreciation as under: 1. On Straight Line Method (SLM) basis as per new rates prescribed under Schedule XIV to the Companies Act, 1956. 2. For assets each costing 5000 or less, depreciation is provided fully. 3. For additions made during the year, depreciation is provided on pro-rata basis. d) In case, the recoverable amount of the fixed assets is lower than its carrying amount, provision is made for the impairment loss. e) Borrowing costs, which are directly attributable to acquisition, construction or production of a qualifying asset, are capitalised as a part of the cost of the asset. Other borrowing costs are recognised as expenses in the period in which they are incurred. d. Intangible Assets, Amortization and Impairment Loss 1. The Goodwill acquired by the Company is amortized over a period of 5 years on SLM basis. 2. The Copyrights, Trademarks, Technical know-how etc. acquired by the Company are amortized over a period of 10 years on SLM basis. 3. In case, the recoverable amount of the intangible assets is lower than its carrying amount, provision is made for the impairment loss. e. Research and Development Expenditure a) Capital Expenditure is shown separately in Fixed Assets. b) Revenue expenses including depreciation are charged to respective heads of accounts. f. Investments a) Non-Current Investments are stated at cost. In case there is a diminution of permanent nature in value of Investments, the same is provided for. b) (i) Quoted current investments are stated at the lower of cost and market value. (ii) Unquoted current investments are stated at the lower of cost and fair value where available. g. Inventories a) Raw Materials and Packing Materials are valued at cost on weighted average basis. b) Finished goods, Stock in Trade and Work in Progress are valued at lower of cost and net realizable value Cost (arrived at on weighted average) for this purpose includes direct materials, direct labour, excise duty and appropriate overheads. c) Consumable stores and spares are valued at lower of cost or net realizable value, as estimated by the management. d) Obsolete, defective, unserviceable and slow/non-moving stocks are duly provided for. h. Revenue recognition i) Income from sale of goods is recognized upon transfer of significant risk and rewards of ownership of the goods to the customer which generally coincides with delivery and acceptance of the goods sold. Sales are net of Sales Tax/ VAT, returns, rebates and discounts. ii) Interest income is recognized on accrual basis. iii) Claims which are not of material nature / Insurance Claim etc. are accounted for when no significant uncertainties are attached to their eventual receipt. iv) Dividend is accounted for when right to receive dividend is established. i. Transactions in foreign currencies a) Transactions are recorded at the exchange rates prevailing on the date of transaction. b) Foreign currency designated assets and liabilities are restated at the year end rates and the resultant gain or loss is taken to Statement of Profit and Loss, except in respect of fixed Assets which is being capitalised. j. Financial Derivatives and Hedging Transactions k. Retirement and other employee benefits a) Contribution to Provident, Superannuation and Family Pension funds are funded as a percentage of salary/wages. b) Gratuity liability is funded as per group gratuity scheme of Life Insurance Corporation of India. c) Gratuity, leave encashment, anniversary award, premature death pension & total disability pension are provided for on the basis of actuarial valuation as at the year end. l. Taxes Provision for current tax is made on the basis of relevant provisions of the Income Tax Act,1961. The deferred tax for timing differences between the book and tax profits for the year is accounted for, using the tax rates and laws that have been substantively enacted as of the balance sheet date. Deferred tax assets arising from timing differences are recognized to the extent there is virtual / reasonable certainty that these would be realized in future. m. Provisions, Contingent Liabilities and Contingent Assets A provision is made based on a reliable estimate when it is probable that an outflow of resources embodying economic benefits will be required to settle an obligation. Contingent liabilities, if material are disclosed by way of notes to accounts. Contingent assets are neither recognized nor disclosed in the financial statements. n. Cash and Cash Equivalents Cash and cash equivalents for the purpose of cash flow statement comprise cash at bank, cash in hand and shortterm investments with an original maturity of three months or less. P I D I L I T E A N N UA L R E P O R T 2 01 2 -13 In respect of derivative contracts, premium paid, gains/ losses on settlement and losses on restatement are recognised in the Statement of Profit & Loss except in case where they relate to the acquisition or construction of a fixed asset, in which case, they are adjusted to the carrying cost of such assets. 39 Notes ( in million) 2 As at 31st March 2013 As at 31st March 2012 700.00 700.00 700.00 700.00 512.64 507.65 512.64 507.65 Share Capital Authorised Capital 700,000,000 (700,000,000) Equity Shares of 1 each TOTAL Issued, Subscribed and Paid up Capital 512,642,330 (507,648,626) Equity Shares of 1 each, fully paid-up TOTAL a. Reconciliation of the shares outstanding at the beginning and at the end of the reporting period As at 31st March 2013 As at 31st March 2012 No. of shares ( in million) No. of shares ( in million) Equity Shares Shares outstanding at the beginning of the year Shares issued during the year upon conversion of Foreign Currency Convertible Bonds Shares outstanding at the end of the year b. 507,648,626 507.65 506,134,612 506.13 4,993,704 4.99 1,514,014 1.52 512,642,330 512.64 507,648,626 507.65 Terms /Rights attached to Equity Shares The Company has only one class of equity shares having a par value of 1 per share. Each holder of equity shares is entitled to one vote per share. The Company declares and pays dividend in Indian rupees. The dividend proposed by the Board of Directors is subject to the approval of the shareholders in the ensuing Annual General Meeting. In the event of liquidation, the equity shareholders are eligible to receive the remaining assets of the Company after distribution of all preferential amounts, in the proportion of their shareholding. During the year ended 31st March 2013, the amount of per share dividend recognized as distributions to equity shareholders is is 2.60 ( 1.90). c. Details of shareholders holding more than 5% shares in the Company As at 31st March 2013 No. of Shares held As at 31st March 2012 % of No. of Shares Holding held % of Holding Shri Madhukar Balvantray Parekh 56,958,614 11.11 56,958,614 11.22 Shri Narendrakumar Kalyanji Parekh 54,332,178 10.59 54,332,178 10.70 Shri Ajay Balvantray Parekh 49,134,386 9.58 49,134,386 9.68 Shri Sushilkumar Kalyanji Parekh 45,969,560 8.97 45,969,560 9.06 Devkalyan Sales Pvt. Ltd. 26,074,280 5.09 26,074,280 5.14 Genesis Indian Investment Co. Ltd. - General Sub fund 40,675,686 7.93 40,888,180 8.05 d. Aggregate number of bonus shares issued, share issued for consideration other than cash and shares bought back during the period of five years, immediately preceding the reporting date: Year (Aggregate no. of shares) 2012-13 2011-12 2010-11 2009-10 2008-09 * Fully paid up pursuant to contract(s) without payment being received in cash - - - - - Alloted as fully paid bonus shares - - - 253,067,306 - 4,993,704 1,514,014 - - - Equity Shares Alloted on Conversion of FCCB * In 2008-09, company had transferred 6,000 Equity Shares from Bonus Shares Issue Suspense Account to Equity Share Capital Account on account of settlement of dispute for title of shares. However, no new shares were alloted. The Company had issued on 6th December 2007, 400 Foreign Currency Convertible Bonds (FCCB) of US$100,000 each, which were convertible into Equity shares at any time upto 1st December 2012. The due date for redemption of FCCBs was 7th December 2012. As on 7th December 2012, the balance outstanding FCCBs aggregating 205 Bonds were redeemed by the Company. P I D I L I T E A N N UA L R E P O R T 2 01 2 -13 e. 41 ( in million) 3 Reserves and Surplus As at 31st March 2013 As at 31st March 2012 3.37 3.37 Balance as per last financial statements 152.03 - Add: Credited on conversion of Foreign Currency Convertible Bonds 498.94 152.03 650.97 152.03 935.62 692.22 59.93 243.40 736.44 - 259.11 935.62 9.47 9.47 - (55.52) 10,860.58 9,110.58 2,500.00 1,750.00 736.44 - 14,097.02 10,860.58 Capital Reserve Securities Premium Account Closing Balance Debenture Redemption Reserve Balance as per last financial statements Add: Transferred from Statement of Profit and Loss Less: Transferred to General Reserve* Closing Balance Cash Subsidy Reserve Foreign Currency Monetary Item Translation Difference Account# General Reserve Balance as per last financial statements Add: Transferred from Statement of Profit and Loss Add: Transferred from Debenture Redemption Reserve * Closing Balance Surplus Balance as per last financial statements 1,303.44 1,073.49 Add: Profit for the year 4,607.60 3,345.06 1,332.87 965.14 226.45 156.57 59.93 243.40 2,500.00 1,750.00 4,119.25 3,115.11 1,791.79 1,303.44 16,811.73 13,208.99 Less: Appropriations Proposed final Equity Dividend [amount per share 2.60 (31st March 2012 1.90)] [The above includes dividend declared on conversion of Bonds Nil ( 0.61 million)] Tax on proposed equity dividend [The above includes tax on dividend declared on conversion of Bonds Nil ( 0.1 million)] Transfer to Debenture Redemption Reserve Transfer to General Reserve Total Appropriations Closing Balance TOTAL * The transfer of Debenture Redemption Reserve to General Reserve is on account of conversion/redemption of Foreign Currency Convertible Bonds. # As per ICAI announcement on ‘Presentation of FCMITDA’ dated 30th March 2013, Foreign Currency Monetary Item Translation Difference Account has been shown under Reserves & Surplus as a separate line item. (Refer Note 33) ( in million) 4 Long Term Borrowings As at 31st March 2013 As at 31st March 2012 - 600.00 Interest free Sales Tax loan from Government of Maharashtra (Refer Note b.) - 322.97 TOTAL - 922.97 Secured borrowings - 600.00 Unsecured borrowings - 322.97 - 922.97 Debentures 600 ( 600) 11.9% Redeemable Non Convertible Debentures of 1,000.000 Each (Refer Note a.) Other loans and advances The Above amount Includes a. 600 redeemable Non Convertible Debentures are secured by way of mortgage & by first pari passu charge on the immovable property in Gujarat & all movable properties of the Company. These debentures will be redeemed at par on 5th December 2013 (Refer Note 8) b. Sales Tax loan was interest free & payable in 16 yearly instalments, starting from 30th April 2007. The same has been prepaid during the year except 2.43 million (Refer Note 8) ( in million) 5 Deferred Tax Liabilities (net) As at 31st March 2013 As at 31st March 2012 588.94 539.82 588.94 539.82 Leave Encashment 46.77 34.87 Provision for doubtful debts 55.03 48.74 3.52 1.94 Gross Deferred Tax Asset 105.32 85.55 TOTAL 483.62 454.27 Deferred Tax Liability Fixed Assets: Impact of difference between tax depreciation and depreciation/ amortisation charged for financial reporting Gross Deferred Tax Liability Deferred Tax Asset Others ( in million) Long-Term Provisions As at 31st March 2013 As at 31st March 2012 134.24 101.38 Anniversary Awards 3.89 - Premature Death Pension Scheme 3.76 - Total Disability Pension Scheme 0.98 - Leave Encashment TOTAL 142.87 101.38 P I D I L I T E A N N UA L R E P O R T 2 01 2 -13 6 43 ( in million) 7 Trade Payables As at 31st March 2013 As at 31st March 2012 Trade Payables including Acceptances Micro, Small and Medium Enterprises (Refer Note 45) 155.26 115.04 Others 1,916.11 1,587.24 TOTAL 2,071.37 1,702.28 ( in million) 8 Other Current Liabilities As at 31st March 2013 As at 31st March 2012 600.00 - - 1,705.63 2.43 12.73 22.89 589.93 6.62 5.87 Other Outstanding Liabilities# 3,095.79 2,614.48 TOTAL 3,727.73 4,928.64 Current maturities of Long-Term borrowings 600 (600) 11.9% Redeemable Non Convertible Debentures of 1000000 Each Foreign Currency Convertible Bonds (US $ 33.3 million Zero Coupon Convertible Bonds) (Refer Note a) Interest free Sales Tax loan from Government of Maharashtra Other Liabilities Interest accrued but not due on borrowings Unclaimed Dividend* * These figures includes 0.29 million ( 0.23 million) due and outstanding to be credited to Investor Education and Protection Fund on account of dispute. # These figures include statutory dues, dealer deposit, creditors for capital goods and other provisions. a. All the FCCBs have been converted/ redeemed during the year. 9 ( in million) Short-term Provisions As at 31st March 2013 As at 31st March 2012 32.94 27.16 Anniversary Awards 0.61 - Premature Death Pension Scheme 0.63 - Total Disability Pension Scheme 0.14 - 40.66 31.30 1,332.87 964.53 226.45 156.47 1,634.30 1,179.46 Provision for Employee Benefits Gratuity Leave benefits Proposed Equity Dividend Tax on proposed Equity Dividend TOTAL 45 436.22 613.43 Furniture Office Equipments 3.07 - Furniture & Fixtures 1,054.14 915.76 11.76 - 0.50 - 11.26 - - 904.00 - 9.44 - 46.02 41.06 10.59 482.01 88.27 - 226.61 Additions 50.71 32.20 (46.14) - - - (46.14) - - 78.34 - - - 25.08 0.17 4.64 48.45 - - - Deductions/ Adjustments GROSS BLOCK 9,723.41 10,606.97 1,142.31 11.22 138.67 59.80 194.01 665.00 73.61 9,464.66 3.07 63.57 1.44 634.37 477.11 173.15 5,984.94 1,568.90 196.15 361.96 As at 31.3.2013 P I D I L I T E A N N UA L R E P O R T 2 01 2 -13 * Including Plant and Equipments given on lease - Gross block amounting to 1.82 million. Capital Work in Progress 8,719.98 Previous year 11.22 Non Compete Fees 9,723.41 138.17 Technical Knowhow Fees GRAND TOTAL 59.80 Copyrights 1,084.41 136.61 Computer Software TOTAL 665.00 73.61 Trademarks Goodwill 11 Intangible Assets 8,639.00 54.13 - Plant & Machinery TOTAL 1.44 - Buildings Others (Scientific Research Assets) 167.20 5,551.38 Plant & Machinery* Vehicles 1,480.63 196.15 Leasehold Land Buildings 135.35 As at 1.4.2012 Freehold Land PARTICULARS 10 Tangible Assets 4,310.28 4,764.19 842.32 8.32 80.94 26.06 86.67 568.96 71.37 3,921.87 2.53 29.24 1.10 329.09 187.83 81.92 2,902.21 378.89 9.06 - 479.26 532.41 61.65 1.12 8.44 4.99 20.69 25.69 0.72 470.76 0.19 1.71 0.05 59.61 26.58 14.54 323.89 42.21 1.98 - As at Provided 1.4.2012 during the year 25.35 26.70 (21.21) - - - (21.21) - - 47.91 - - - 22.82 0.07 2.90 22.12 - - - Deductions/ Adjustments DEPRECIATION 4,764.19 5,269.90 925.18 9.44 89.38 31.05 128.57 594.65 72.09 4,344.72 2.72 30.95 1.15 365.88 214.34 93.56 3,203.98 421.10 11.04 - As at 31.3.2013 4,087.09 4,959.22 5,337.07 217.13 1.78 49.29 28.75 65.44 70.35 1.52 5,119.94 0.35 32.62 0.29 268.49 262.77 79.59 2,780.96 1,147.80 185.11 361.96 As at 31.3.2013 3,713.35 4,409.71 4,959.22 242.09 2.90 57.23 33.74 49.94 96.04 2.24 4,717.13 0.54 24.89 0.34 284.34 248.39 85.28 2,649.17 1,101.74 187.09 135.35 As at 31.3.2012 NET BLOCK ( in million) ( in million) 12 Non-current Investments As at 31st March 2013 As at 31st March 2012 11.79 11.79 11.79 11.79 Trade: a) Investment in Associates Quoted equity Instruments (fully paid up, unless otherwise stated) 7,451,540 (7,451,540) Equity Shares of 1 each of Vinyl Chemicals (India) Ltd [Market Value 69.60 million ( 72.65 million)] TOTAL (a) b) Investment in Subsidiaries (fully paid up unless otherwise stated) Unquoted equity Instruments (fully paid up, unless otherwise stated) 50,000 (50,000) Equity Shares of 10 each of Fevicol Company Ltd 0.50 0.50 18,554,546 (17,095,589) Equity Shares of USD 1 each of Pidilite International Pte Ltd 830.44 755.88 36,202,712 ( 34,887,990) Equity Shares of AED 1 each of Pidilite Middle East Ltd 444.65 425.09 1,106.34 936.72 647.75 647.75 3.00 1.78 46,132,996 (39,957,490) Equity Shares of BRL 1 each of Pulvitec do Brasil Industria e Comercio de Colas e Adesivos Ltd 14,780,000 (14,780,000) Equity Shares of USD 1 each of Pidilite USA Inc 4,600 (4,600) Equity shares of EGP 100 each of Pidilite Industries Egypt 24,000 (24,000) Equity Shares of THB 5 each of Pidilite South East Asia Ltd 0.15 0.15 75,000 (75,000) Equity Shares of 10 each of Pagel Concrete Technologies Pvt Ltd 6.41 6.41 10,000 (10,000) Equity Shares of 10 each of Bhimad Commercial Co Pvt Ltd 0.17 0.17 10,000 (10,000) Equity Shares of 10 each of Madhumala Traders Pvt Ltd 0.17 0.17 30,000 (Nil) Equity Shares of 10 each of Building Envelope Systems India Ltd 0.30 - 3,039.88 2,774.62 Nil (3,594) Equity Shares of 10 each of Hindustan Adhesives Ltd - 0.09 Nil (14,400) Equity Shares of 10 each of Hindustan Organic Chemicals Ltd - 0.72 - 0.77 - 2.96 0.67 4.38 0.67 8.92 TOTAL (b) Non-Trade: c) Other Investments c) (i) Quoted equity Instruments (fully paid up, unless otherwise stated) Nil (1674) Equity Shares of 10 each of Reliance Industries Ltd (earlier: 4,188 Equity Shares of 10 each of Indian Petrochemicals Corporation Ltd) Nil (222,542) Equity Shares of 10 each of Indian Overseas Bank Ltd 9,426 (61,900) Equity Shares of 10 each of Menon Pistons Ltd [Market Value 0.57 million ( 28.97 million)] TOTAL (c)(i) c) (ii) Unquoted equity Instruments (fully paid up, unless otherwise stated) Nil (200,200) Equity Shares of 10 each of Enjayes Spices & Chemicals Oil Ltd - 5.29 121,300 (121,300) Equity Shares of 10 each of Pal Peugeot Ltd 1.21 1.21 628 (628) Equity Shares of 100 each of Jawahar Co-op Industrial Estate Ltd 0.06 0.06 - - - - - - 40 (40) Equity Shares of 50 each of Regent Chambers Premises Co-op Society Ltd (Cost 2,000) 25 (25) Equity Shares of 10 each of New Usha Nagar Co-op Housing Society Ltd (Cost 250) 10 (10) Equity Shares of 100 each of Taloja CETP Co-op Society Ltd (Cost 1,000) TOTAL (c)(ii) TOTAL (a+b+c) Less: Diminution in value of Investments TOTAL Aggregate amount of quoted investments Aggregate amount of unquoted investments 1.27 6.56 3,053.61 2,801.89 430.44 383.06 2,623.17 2,418.83 12.46 20.71 3,041.15 2,781.18 ( in million) 13 Long Term Loans and Advances Unsecured, unless otherwise stated Capital advances Security deposit Other loans and advances Prepaid Expenses Loans and Advances to Staff TOTAL As at 31st March 2013 As at 31st March 2012 113.03 101.98 129.44 93.83 2.89 24.38 3.64 22.60 242.28 249.51 ( in million) 14 Other Non-Current Assets Fixed Deposits against Bank Guarantees As at 31st March 2013 As at 31st March 2012 - 1.37 - 1.37 ( in million) Non- Trade Unquoted mutual funds 1,000,000 (1,000,000) Units of HDFC-Debt Fund for Cancer Cure -100% Dividend -Donation Option 3,003,690 (2,986,457) Units of Aviva Life Insurance Nil (15,000,000) Units of ICICI Prudential Series 55-1 Year G Cumm Nil (16,265,699) Units of HDFC-FMP 370 D May 2011 (1)-Growth Nil (15,651,410) Units of DSP- Black Rock FMP-12M Series 19-Growth Nil (9,296,272) Units of ICICI Prudential Quarterly Int Fund II Inst Growth 10,000,000 (10,000,000) Units of HDFC-FMP 392D March 2012(2)G -Growth Option 10,000,000 (10,000,000) Units of ICICI Prudential FMP-Series 63 - 384 Days Plan A Cumulative Nil (10,000,000) Units of ICICI Prudential FMP -Series 62-1 year Plan G 8,352,893 (Nil) Units of ICICI Prudential Long Term Plan -Premium plus -Cumulative 7,885,875 (Nil) Units of DWF -Guilt Fund -Regular -Growth 12,011,280 (Nil) Units of ICICI Prudential Blended Plan B -Regular -Growth 4,369,083 (Nil) Units of HDFC-High Interest Fund STP-Growth Option 7,223,450 (Nil) Units of IDFC -Dynamic Bond Fund-Regular Plan -Growth 10,215,460 (Nil) Units of Birla Sun Life Dynamic Bond Fund-Retail Growth 7,783,555 (Nil) Units of ICICI Prudential Dynamic Bond Fund -Regular -Growth 10,000,000 (Nil) Units of ICICI Prudential FMP Series 66 420 days Plan A -Regular -Growth 5,000,000 (Nil) Units of Reliance Fixed horizon Fund XXIII series I -.Growth 10,000,000 (Nil) Units of HDFC-FMP 371D Feb 2013(2)R -Growth Option 10,000,000 (Nil) Units of DSP- Black Rock FMP-12M Series 84-RegGrowth 15,418,720 (Nil) Units of IDFC -Ultra Short Term Fund-Regular Plan -Growth 10,000,000 (Nil) Units of ICICI Prudential FMP Series 66 407 days Plan C -Regular -Growth 10,011,163 (Nil) Units of IDFC -fixed Term Plan Series 9-Regular Plan -Growth 10,000,000 (Nil) Units of DSP- Black Rock FMP- Series 91-12M -Reg-Growth 10,000,000 (Nil) Units of ICICI Prudential FMP Series 67 371 days Plan E -Regular -Growth 5,026,464 (Nil) Units of HDFC-Floating Rate interest Fund-STP -Wholesale option -Growth Deposits HDFC Limited TOTAL As at 31st March 2013 As at 31st March 2012 10.00 30.19 100.00 100.00 100.00 100.00 205.99 100.00 100.00 200.00 100.00 100.00 50.00 100.00 100.00 250.00 100.00 100.11 100.00 100.00 100.00 10.00 29.99 150.00 162.66 156.51 100.00 100.00 100.00 100.00 - 600.00 2,846.29 909.16 P I D I L I T E A N N UA L R E P O R T 2 01 2 -13 15 Current Investments 47 ( in million) 16 Inventories (valued at lower of cost and net realizable value) (As taken, valued and certified by the management) Raw Material and Packing Material (Including Goods in Transit: 114.96 million ( 72.53 million) Work-in-Progress (Including Goods in Transit: 21.64 million ( 13.09 million) Finished Goods (Including Goods in Transit: 318.91 million ( 250.51 million) Stock in Trade (Including Goods in Transit: 30.76 million ( 19.22 million) Consumable Stores and Spares TOTAL As at 31st March 2013 As at 31st March 2012 1,439.81 1,283.78 380.81 331.51 2,412.80 2,107.05 250.58 213.07 27.64 27.63 4,511.64 3,963.04 ( in million) 17 Trade Receivables As at 31st March 2013 As at 31st March 2012 Unsecured, unless otherwise stated Outstanding for period exceeding six months from the date they are due for payment Considered good 238.16 169.33 Considered Doubtful 161.90 150.22 Less: Provision for doubtful receivables Other Trade Receivables TOTAL 400.06 319.55 161.90 150.22 3,429.47 3,091.85 3,667.63 3,261.18 ( in million) 18 Cash and Bank Balances As at 31st March 2013 As at 31st March 2012 1.37 1.61 348.52 116.42 Cash and Cash Equivalents Cash on Hand Cheques on Hand Remittances in Transit Balance in Current Accounts (Refer Note a.) Fixed Deposit with original maturity of less than 3 months 0.08 0.26 160.04 489.88 - 0.50 510.01 608.67 Other Bank Balance In Fixed Deposit Accounts with original maturity of more than 12 months (Refer Note b.) In Fixed Deposit Accounts with original maturity for more than 3 months but less than 12 months Dividend Payment Bank Account TOTAL a. Balance with banks in Current Account includes debit balance of Cash Credit Accounts amounting to 87.16 million ( 4.63 million)[Refer Note 49]. b. Balance with banks in Fixed Deposit Account includes Fixed Deposit against Bank Guarantees 46.57 million ( 7.97 million). 2.79 2.79 844.13 1,955.04 11.31 10.69 858.23 1968.52 1,368.24 2,577.19 ( in million) 19 Short Term Loans and Advances As at 31st March 2013 As at 31st March 2012 Unsecured, unless otherwise stated Security deposit 11.76 13.92 Loan and advances to related parties (Refer Note a.) 50.99 33.23 387.00 400.26 Advances recoverable in cash or in kind or for value to be received Other loans and advances MAT Credit Entitlement - 189.10 23.10 13.10 Balances with Central Excise Department 95.07 136.23 Loans and Advances to Staff 24.63 23.38 Prepaid Expenses Share Application Money TOTAL a. 1.53 50.65 594.08 859.87 Details of Loan and advances to related parties are as follows: ( in million) As at 31st March 2013 As at 31st March 2012 0.09 0.08 Vinyl Chemicals (India) Ltd 0.96 1.23 Pulvitec do Brasil Industria e Comercio de Colas e Adesivos Ltda 8.32 7.57 Jupiter Chemicals (LLC) 5.31 3.57 Name of Party Parekh Marketing Ltd Pidilite USA Inc 27.57 9.26 Pidilite Speciality Chemicals Bangladesh Pvt Ltd 2.64 1.73 Pidilite Bamco Ltd 0.57 0.20 Pidilite Innovation Centre Pte Ltd 0.49 0.05 Pidilite Industries Egypt - SAE 1.71 2.07 Pagel Concrete Technologies Pvt Ltd 3.25 3.22 Building Envelope Systems India Ltd 0.08 - 50.99 2.05 2.20 33.23 Bhimad Commercial Co Pvt Ltd Madhumala Traders Pvt Ltd TOTAL ( in million) As at 31st March 2013 As at 31st March 2012 Advance Payment of Taxes & MAT credit utilised (Net of Provisions) 32.47 43.13 Interest Receivable 38.98 26.22 Unsecured, unless otherwise stated Deferred Premium on Forward Contract Other Receivables* TOTAL * These figures include Export Benefits Receivables 4.13 - 31.19 23.57 106.77 92.92 P I D I L I T E A N N UA L R E P O R T 2 01 2 -13 20 Other Current Assets 49 ( in million) 21 Revenue From Operations (Gross) 31st March 2013 31st March 2012 33,258.16 27,698.48 2,028.62 1,880.28 117.98 71.90 Cash Discount Received 17.39 21.28 Export Incentives 63.84 74.87 Revenue From Operations Sale of Products Finished Goods Traded Goods Other Operating Revenue Scrap Sales TOTAL 35,485.99 29,746.81 ( in million) Details of Products sold 31st March 2013 31st March 2012 27,105.09 22,954.84 5,131.20 3,888.09 Finished Goods Chemicals Dyes Others 1,021.87 855.55 TOTAL 33,258.16 27,698.48 ( in million) 22 Other Income 31st March 2013 31st March 2012 211.69 75.88 10.74 15.89 0.75 10.17 Interest on: Bank Deposit Others Dividend on: Current Investments Non Current Investments 5.70 5.06 Net gain on sale of Current Investments 147.72 142.74 Other Non-Operating Income* 282.37 177.93 TOTAL 658.97 427.67 * Other non-operating income includes Windmill Income 30. 68 million ( 26.28 million). ( in million) 23 Cost of Materials 31st March 2013 Inventory at the beginning of the year Add: Purchases Less: Inventory at the end of the year TOTAL 31st March 2012 1,283.78 1,144.35 17,122.70 14,776.84 18,406.48 15,921.19 1,439.81 1,283.78 16,966.67 14,637.41 ( in million) Details of Materials Vinyl Acetate Monomer Other Raw Materials [net of resale of Raw Material 125.64 million ( 154.75 million)] Packing Material TOTAL 31st March 2013 31st March 2012 2,106.72 1,786.20 10,896.61 9,385.16 3,837.70 3,311.30 16,841.03 14,482.66 ( in million) 24 Change in Inventories of Finished Goods, Work in Progress and Stock in Trade As at 31st March 2013 As at 31st March 2012 Stock in Trade 250.58 213.07 Work-in-Progress 380.81 331.51 2,412.80 2,107.16 3,044.19 2,651.74 213.07 210.86 Inventories at end of the year Finished Goods Inventories at beginning of the year Stock in Trade Work-in-Progress Finished Goods TOTAL 331.51 327.72 2,107.16 1,834.00 2,651.74 2,372.58 (392.45) (279.16) ( in million) 25 Employee Benefits Expense Salaries, Wages, Bonus and Other Allowances Contribution to Provident and Other Funds Gratuity Expenses (Refer Note 43) Staff Welfare Expenses TOTAL 31st March 2013 31st March 2012 2,761.01 2,388.16 137.40 121.83 33.05 34.08 78.83 67.49 3,010.29 2,611.56 ( in million) Depreciation on Tangible Assets Amortization of Intangible Assets TOTAL 31st March 2013 31st March 2012 470.76 416.56 61.65 62.70 532.41 479.26 P I D I L I T E A N N UA L R E P O R T 2 01 2 -13 26 Depreciation and Amortization Expense 51 ( in million) 27 Finance Cost 31st March 2013 31st March 2012 Interest 79.30 211.81 Other Borrowing Cost 42.44 33.23 121.74 245.04 TOTAL ( in million) 28 Other Expenses 31st March 2013 31st March 2012 110.24 111.80 1,554.72 1,346.82 Power and Fuel 370.96 292.97 Water Charges 20.65 18.94 186.30 150.10 Rates and Taxes 41.64 18.03 Insurance 24.22 22.44 1.97 2.56 Consumption of Stores and Spares Clearing, Forwarding and Octroi Duty Rent License fees Repairs: Buildings 20.44 29.22 Machinery 68.81 54.26 Others 30.66 29.65 Directors' Fees Advertisement and Publicity Legal, Professional and Consultancy fees 119.91 113.13 1.11 0.50 1,315.04 955.27 227.69 200.97 Communication Expenses 58.34 56.19 Printing and Stationery 27.86 25.25 526.28 397.71 Bad Debts 13.29 9.11 Provision for Doubtful Debts 11.67 41.83 530.15 443.93 34.89 29.80 4.50 3.90 62.85 55.21 Travelling and Conveyance Expenses Processing and Packing Charges Commission and Brokerage Payment to Auditors (Refer Note 46) Donations Loss on Fixed Assets Sold / Discarded (Net) 3.71 15.96 Foreign Exchange Fluctuation (Net) 4.60 84.95 787.17 615.87 6,039.76 5,013.24 Miscellaneous expenses TOTAL ( in million) 29 Exceptional Items (net) Gain on prepayment of sales tax deferral loan Provision for Diminution in value of investment As at 31st March 2013 As at 31st March 2012 (106.82) - 47.38 126.29 (59.44) 126.29 As at 31st March 2013 As at 31st March 2012 278.52 75.79 1,004.21 899.20 iii. Unexpired Letter of Credit 212.96 - iv Disputed liabilities in respect of Income Tax, Sales Tax, Central Excise and Customs (under appeal) 399.53 363.53 v. Claims against the Company not acknowledged as debts. 5.26 62.68 374.76 662.55 4.60 84.95 TOTAL 30 Contingent Liabilities Contingent liabilities not provided for: i. Guarantees given by Banks in favour of Government and others ii. Guarantees given by Company 31 Estimated amount of contracts, net of advances, remaining to be executed on capital account and not provided for 32 The net amount of exchange differences (credited) / debited to Statement of Profit & Loss 33 Pursuant to the notification dated 29th December 2011 issued by the Ministry of Corporate Affairs amending the Accounting Standard 11, the Company has exercised the option as per Para 46A inserted in the Standard for all long term monetary assets and liabilities. Consequently, an amount of 55.52 million (without considering future tax benefit of 18.01 million) is carried forward in the Foreign Exchange Monetary Item Translation Difference Account as on 31st March 2012. This amount has been amortized over the period of the monetary liabilities i.e. up to 7th December 2012. Further it has credited the gain of 8 million to the carrying cost of the fixed assets for above referred period. ( in million) Disclosure as per clause 32 of the listing agreement Loans in the nature of Inter Corporate Deposits ( ICD’s) given to Subsidiaries: 31st March 2013 Name of the subsidiary Companies 31st March 2012 Amount Outstanding Maximum Balance Outstanding during the year Amount Outstanding Maximum Balance Outstanding during the year i) Bhimad Commercial Company Private Limited - 2.05 2.05 5.55 ii) Madhumala Traders Private Limited - 2.20 2.20 5.70 3.25 3.25 3.22 3.22 iii) Pagel Concrete Technologies Private Limited Notes: a) Loans and Advances shown above, fall under the category of ‘ Loans & Advances’ in nature of loans where there is no repayment schedule and re-payable on demand. b) Loans and Advances referred above are not bearing any interest. P I D I L I T E A N N UA L R E P O R T 2 01 2 -13 34 53 ( in million) 35 Value of Imported and Indigenous Raw Materials and Packing Materials consumed and percentage thereof: As at 31st March 2013 As at 31st March 2012 2012-13 % 2011-12 % Imported 4,576.90 3,878.68 35.20 34.72 Indigenous 8,426.43 7,292.68 64.80 65.28 13,003.33 11,171.36 100.00 100.00 18.49 11.21 0.48 0.34 Indigenous 3,819.22 3300.09 99.52 99.66 TOTAL 3,837.71 3,311.30 100.00 100.00 Raw Materials* TOTAL Packing Materials Imported *Net of Resale of Raw Materials 125.64 million ( 154.75 million) ( in million) 36 Value of imports calculated on CIF basis As at 31st March 2013 As at 31st March 2012 3,999.21 3,519.65 Capital Goods 103.71 119.34 Traded Goods 665.74 639.57 4,768.66 4,278.56 Raw Materials and Packing Materials TOTAL ( in million) 37 Expenditure in foreign currency (accrual basis) Foreign Travel Professional fees 33.45 28.74 73.13 68.67 Interest - 96.02 Royalty 19.63 16.53 Others 222.38 148.67 TOTAL 348.59 358.63 ( in million) 38 Earnings in Foreign Exchange FOB Value of Exports* 3,201.73 2,643.16 Others 5.48 18.61 TOTAL 3,207.21 2,661.77 * This does not include export sales made to Nepal in Indian currency 39 Segment information Business Segment: The Company is operating into three business segments: Consumer & Bazaar Products, Industrial Products and Others. This segmentation is based around customers. Consumer & Bazaar Products consist of mainly Adhesives, Sealants, Art Materials and Construction Chemicals. Industrial Products consists of Organic Pigments, Industrial Resins and Industrial Adhesives. Others consist of VAM manufacturing unit of Vinyl Chemicals (India) Ltd demerged into the Company wef 1st April 2007. ( in million) Business Segments Consumer & Bazaar Products Industrial Products Others Total 26,715.25 (22,132.32) 6,204.04 (5,718.07) 198.42 (144.78) (27,995.17) 27.93 (24.04) 26,743.18 (22,156.36) 6,444.94 (5,020.52) 877.85 (686.88) 7,081.89 (6,404.95) 807.09 (806.05) 0.02 198.44 (144.78) (97.00) ((107.83)) 905.80 (710.92) 34,023.51 (28,706.09) 7,155.03 (5,718.75) 1,807.35 (1,661.51) 698.42 (488.74) 6,046.11 (4,545.98) 79.30 (211.81) 228.88 (107.00) 6,195.69 (4,441.17) 1,588.09 (1,096.11) 4,607.60 (3,345.06) 8,511.01 (7,552.94) 3,341.67 (3,001.37) 451.02 (441.07) 3,731.45 (3,145.55) 1,243.85 (1,035.40) 26.32 (10.32) 502.97 (546.94) 235.92 (106.64) 47.72 (30.82) 282.94 (239.93) 95.05 (88.12) 25.56 (26.48) 12,303.70 (10,995.38) 13,236.86 (12,097.99) 25,540.56 (23,093.37) 5,001.62 (4,191.27) 3,214.57 (5,185.45) 8,216.19 (9,376.72) 17,324.38 (13,716.65) 786.61 (684.40) 502.91 (815.38) 403.55 (354.53) Revenue External Sales Inter Segment Revenue (at cost plus 10%) Total Revenue Segment Profits Unallocated Corporate Expenses Unallocated Corporate Income Operating Profit Interest Expenses Interest / Dividend Income NET PROFIT BEFORE TAX Income Tax (Provision for Taxation and Deferred taxation) Net Profit after Tax 33,117.71 Segment Assets Unallocated Corporate Assets Total assets Segment Liabilities Unallocated Corporate Liabilities Total liabilities Capital Employed Capital expenditure (including Capital Work in Progress) Unallocated Corporate Capital Expenditure Depreciation P I D I L I T E A N N UA L R E P O R T 2 01 2 -13 Other Information 55 ( in million) Information About Geographical Segments Geographical Segments Sales Revenue Carrying amount of Segment Assets Additions to fixed Assets and Intangible Assets India Other Countries TOTAL 29,676.71 3,440.99 33,117.70 (25,197.03) (2,798.14) (27,995.17) 24,775.38 765.18 25,540.56 (22,489.05) (659.84) (23,148.89) 1,289.50 0.03 1,289.53 (1,499.33) (0.45) (1,499.78) 40 Earnings Per Share (EPS) The following reflects the Profit and Share data used in the Basic and Diluted EPS computations: ( in million) 31 March 2013 31st March 2012 Profit after tax 4,607.60 3,345.06 Net profit for calculation of EPS 4,607.60 3,345.06 No. in million No. in million 509.78 507.65 - 12.93 509.78 520.58 Basic EPS 9.04 6.59 Diluted EPS 9.04 6.43 st Total Operations for the year Weighted average number of equity share in calculating basic EPS Effect of dilution: Convertible bonds Weighted average number of equity share in calculating diluted EPS 41 Particulars of Unhedged foreign currency Exposure as at Balance Sheet Date Particulars Export Debtors “ 763.79 million (USD 11.67 million, Euro 1.03 million, Zar 0.43 million) Previous Year 642.03 million (USD 11.34 million, Euro 0.40 million, SPD 0.05 million, Zar 1.11 million)” Creditors “ 4.49 million ( JPY 3.08 million, SPD 0.03 million) Previous Year 27.31 million (USD 0.69 million, JPY 1.9 million)” Loans “ Nil Previous Year 1705.62 million (USD 33.3 million)” Details of Forward Contract outstanding on account of hedging as at the end of Year. Currency No. of Contracts Euro 3 Buy Amount 20.81 million Purpose Import of Raw Materials. USD 37 565.63 million Import of Raw Materials. 42 Related Party Disclosures Related Party Disclosures as required by AS-18, “Related Party Disclosure” are given below: (i) Relationships: a. Parekh Marketing Ltd Significant Influence b. Vinyl Chemicals (India) Ltd Substantial Interest in Voting Power (Associate) c. Kalva Marketing and Services Ltd Significant Influence d. Nitin Enterprises Partnership firm of which 100% holding by wholly owned Subsidiaries e. Fevicol Company Ltd 100% Subsidiary f. Bhimad Commercial Co Pvt Ltd 100% Subsidiary g. Madhumala Traders Pvt Ltd 100% Subsidiary h. Pagel Concrete Technologies Pvt Ltd i. Pidilite International Pte Ltd 100% Subsidiary j. Pidilite Middle East Ltd 100% Subsidiary k. Pulvitec do Brasil Industria e Comercio de Colas e Adesivos Ltda 100% Subsidiary l. Pidilite USA Inc 100% Subsidiary m. Building Envelope Systems India Ltd n. Jupiter Chemicals (LLC) 100% Subsidiary of wholly owned Subsidiary o. P.T. Pidilite Indonesia 100% Subsidiary of wholly owned Subsidiaries p. Pidilite Speciality Chemicals Bangladesh Pvt Ltd 100% Subsidiary of wholly owned Subsidiaries q. Pidilite Innovation Centre Pte Ltd 100% Subsidiary of wholly owned Subsidiaries r. Pidilite Industries Egypt - SAE 100% Subsidiary of wholly owned Subsidiaries s. Pidilite Bamco Ltd 100% Subsidiary of wholly owned Subsidiaries t. Pidilite South East Asia Ltd 100% Subsidiary of wholly owned Subsidiaries u. Bamco Supply Services Ltd 49% Subsidiary of wholly owned Subsidiary and having significant influence v. PIL Trading Egypt (LLC) 100% Subsidiary of wholly owned Subsidiaries w. Pidilite Industries Trading (Shanghai) Co. Ltd 100% Subsidiary of wholly owned Subsidiaries 75% Subsidiary 60% Subsidiary (ii) Key Management Personnel: Sarva Shri M B Parekh - Chairman & Managing Director, N K Parekh - Jt Managing Director, A B Parekh and A N Parekh - Whole Time Directors, Shri R Sreeram - Whole Time Director (iii) Relatives of Key Management Personnel: P I D I L I T E A N N UA L R E P O R T 2 01 2 -13 Sarva Shri B K Parekh, S K Parekh and Smt. Mala M Parekh 57 Other Income Purchases and Other Related Services Remuneration to Directors: - Managing Director/Jt Managing Director b. c. d. Loans Given / (repayment of loan received) Purchase of Fixed Assets Sale of Fixed Assets Interest Paid / (Received) Reimbursement of expenses made Reimbursement of expenses received Provision For Doubtful Debts Made Bad Debts Written Off Diminution in value of Investment Corporate guarantee given to bank Outstanding Balances: - Debtors f. g. h. i. j. k. l. m. n. o. p. - Net Outstanding Receivable/(Payable) - Creditors Investment in Share Capital e. - Whole Time Directors Sales and Related Income 168.79 (130.68) 75.62 (59.18) 122.88 (95.13) NIL (0.06) 122.88 (95.07) NIL (NIL) NIL (NIL) NIL (NIL) NIL (NIL) NIL (NIL) 0.08 (NIL) 0.26 (0.23) 637.22 (588.49) 0.42 (0.44) NIL (0.10) RemuneParekh ration to Marketing Directors Ltd. 0.96 (1.23) 177.82 (196.18) (176.86) ((194.95)) NIL (NIL) NIL (NIL) NIL (NIL) NIL (NIL) NIL (NIL) NIL (0.75) 0.88 (NIL) NIL (NIL) NIL (1.35) 2048.14 (1775.87) NIL (NIL) 15.04 (3.80) (15.04) ((3.80)) NIL (NIL) NIL (NIL) NIL (NIL) NIL (0.03) NIL (NIL) NIL (NIL) NIL (NIL) 0.07 (0.27) NIL (NIL) 155.22 (120.71) Vinyl Nitin Chemicals Enterprises (India) Ltd. NIL (NIL) NIL (NIL) NIL (NIL) NIL (NIL) (2.05) ((3.50)) NIL (NIL) NIL (NIL) NIL (NIL) NIL (NIL) NIL (NIL) NIL (NIL) NIL (NIL) NIL (NIL) NIL (NIL) NIL (NIL) NIL (NIL) NIL (NIL) (2.20) ((3.50)) NIL (NIL) NIL (NIL) NIL (NIL) NIL (NIL) NIL (NIL) NIL (NIL) NIL (NIL) NIL (NIL) Bhimad Madhumala Commercial Traders Co Pvt Ltd. Pvt Ltd. Transactions with Related Parties for the period ended 31st March 2013 are as follows: Nature of Transaction (iv) a. 42 NIL (NIL) NIL (NIL) NIL (NIL) NIL (NIL) 0.03 (0.01) NIL (NIL) NIL (NIL) NIL (NIL) NIL (NIL) NIL (NIL) NIL (NIL) NIL (NIL) NIL (NIL) Pagel Concrete Technology Pvt Ltd. NIL (NIL) 2.54 (1.98) (2.54) ((1.98)) 25.63 (114.68) NIL (NIL) NIL (NIL) NIL (NIL) NIL (NIL) NIL (NIL) NIL (NIL) NIL (NIL) NIL (NIL) 2.25 (1.99) Pidilite International Pte Ltd. NIL (NIL) NIL (NIL) NIL (NIL) NIL (29.13 ) 39.94 (31.89) NIL (NIL) NIL (NIL) NIL (NIL) NIL (NIL) NIL (NIL) NIL (NIL) NIL (NIL) NIL (NIL) NIL (NIL) 8.32 (9.67) 0.38 (NIL) 7.94 ( 9.67 ) 53.06 (96.94) 225.00 (225.00) 149.24 (92.21) NIL (NIL) NIL (NIL) NIL (NIL) NIL (NIL) NIL (NIL) NIL (NIL) 0.47 (0.11) 1.62 (0.84) NIL (NIL) Pidilite Pulvitec do Brasil Middle Industria e ComerEast Ltd. cio de Colas e Adesivos Ltda 48.20 (26.67) 5.05 (13.91) 43.15 (12.76) 272.20 (256.10) NIL (NIL) NIL (NIL) NIL (NIL) NIL (NIL) NIL (NIL) 3.41 (3.40) 7.54 (NIL) 46.67 (30.59) 8.14 (3.56) 8.75 (19.05) Pidilite USA Inc. 59 Other Income Purchases and Other Related Services Remuneration to Directors: - Managing Director/Jt Managing Director b. c. d. Loans Given/(Taken) Purchase of Fixed Assets Sale of Fixed Assets Interest Paid / (Received) Reimbursement of expenses made Reimbursement of expenses received Provision For Doubtful Debts Made Bad Debts Written Off Diminution in value of Investment Corporate guarantee given to bank Outstanding Balances: - Debtors f. g. h. i. j. k. l. m. n. o. p. P I D I L I T E A N N UA L R E P O R T 2 01 2 -13 - Net Outstanding Receivable/(Payable) - Creditors Investment in Share Capital e. - Wholetime Directors Sales and Related Income 9.00 (3.73) 1.26 (1.08) 7.74 (2.65) 153.90 (153.90) NIL (NIL) NIL (NIL) NIL (0.05) NIL (NIL) NIL (NIL) 19.72 (10.40) 0.67 (NIL) 8.07 (0.34) 0.85 (0.46) NIL (2.46) Jupiter Chemicals (L.L.C.) 0.08 (3.81) 0.88 ((0.31)) (0.80) (3.50) 3.13 (NIL) NIL (NIL) NIL (NIL) NIL (NIL) NIL (NIL) NIL (NIL) NIL (NIL) NIL (NIL) NIL (NIL) NIL (0.03) 4.31 (3.07) PT Pidilite Indonesia 9.06 (8.84) NIL (NIL) 9.06 (8.84 ) 102.36 (26.00) NIL (NIL) NIL (NIL) NIL (NIL) NIL (NIL) NIL (NIL) NIL (NIL) 0.68 (NIL) 34.87 (22.30) 0.87 (0.15) NIL (NIL) 1.85 (1.56) 2.65 (3.68) (0.80) ((2.12)) 43.30 (43.30) NIL (NIL) NIL (NIL) NIL (0.22) 0.05 (NIL) NIL (NIL) NIL (NIL) 0.28 (NIL) 4.93 (4.84) 0.27 (0.19) 50.82 (45.17) Pidilite SpePidilite ciality Innovation Chemicals Centre Bangladesh Pte Ltd. Pvt Ltd. 31.05 (30.66) 0.79 (0.80) 30.26 (29.86) 43.55 (31.00) 1.06 (NIL) NIL (NIL) NIL (NIL) NIL (0.90) NIL (NIL) NIL (NIL) 0.22 (NIL) 45.61 (30.62) 1.64 (0.19) NIL (0.80) Pidilite Industries Egypt SAE Transactions with Related Parties for the period ended 31st March 2013 are as follows: Nature of Transaction (iv) a. 42 0.57 (0.20) 0.01 (1.61) 0.56 ((1.41)) 145.50 (145.50) NIL (NIL) NIL (NIL) 15.24 (NIL) NIL (NIL) NIL (NIL) NIL (1.87) 0.85 (NIL) NIL (0.01) 0.99 (0.70) 4.54 (4.07) Pidilite Bamco Ltd. 0.07 (NIL) NIL (NIL) 0.07 (NIL) 18.40 (18.40) NIL (NIL) NIL (NIL) NIL (NIL) NIL (NIL) NIL (NIL) NIL (NIL) 0.15 (NIL) NIL (NIL) 0.07 (NIL) NIL (NIL) Bamco Supply Services Limited NIL (NIL) 1.65 (1.09) (1.65) ((1.09)) NIL (NIL) NIL (NIL) NIL (NIL) NIL (NIL) NIL (NIL) NIL (NIL) NIL (NIL) NIL (NIL) NIL (NIL) 16.88 (13.61) Pidilite industries Trading (Shanghai) Co. Ltd. 20.81 (18.33) 1.47 (0.02) 19.34 (18.31) NIL (NIL) NIL (NIL) NIL (NIL) NIL (NIL) NIL (NIL) NIL (0.03) NIL (NIL) 29.79 (26.87) 0.12 (0.12) NIL (0.12) PIL Trading Company Egypt 0.08 (NIL) NIL (NIL) 0.08 (NIL) 0.30 (NIL) NIL (NIL) NIL (NIL) NIL (NIL) NIL (NIL) NIL (NIL) NIL (NIL) NIL (NIL) NIL (NIL) NIL (NIL) Building Envelope Systems India Ltd. NIL (NIL) NIL (NIL) (NIL) (NIL) NIL (NIL) NIL (NIL) NIL (NIL) NIL (NIL) NIL (NIL) 2.28 (NIL) NIL (NIL) NIL (NIL) NIL (NIL) NIL (NIL) Mala Parekh 252.93 (199.83) 209.54 (223.90) 43.39 ((24.69)) 168.79 (130.68) 75.62 (59.18) 216.17 (238.78) (4.22) ((6.99)) 15.24 (0.27) 0.05 (0.93) NIL (NIL) 25.49 (16.45) 11.53 (0.23) NIL (NIL) 3.13 (NIL) 53.06 (126.07) 1004.21 (899.20) 807.70 (704.44) 14.99 (8.03) 2290.91 (1987.02) Total 43 Employee Benefits The Company has classified various employee benefits as under: (A) Defined Contribution Plans (a) Provident Fund (b) Superannuation Fund (c) State Defined Contribution Plans - Employers’ Contribution to Employees’ State Insurance - Employers’ Contribution to Employees’ Pension Scheme 1995 The Provident Fund and the State Defined Contribution Plans are operated by the Regional Provident Fund Commissioner and the Superannuation Fund is administered by the LIC of India. The present value of obligation is determined based on actuarial valuation using the Projected Unit Credit Method, which recognises each period of service as giving rise to additional unit of employee benefit entitlement and measures each unit separately to build up the final obligation. Under the schemes, the Company is required to contribute a specified percentage of payroll cost to the retirement benefit schemes to fund the benefits. These funds are recognised by the Income Tax Authorities. The Company has recognised the following amounts in the Statement of Profit and Loss: ( in million) 31st March 2013 31st March 2012 82.60 72.51 (ii) Contribution to Employees' Superannuation Fund 8.11 11.14 (iii) Contribution to Employees' State Insurance Scheme 5.68 9.53 27.34 26.60 3.65 2.05 127.38 121.83 (i) Discount Rate (per annum) 8.15% 8.50% (ii) Rate of increase in Compensation levels (per annum) 6.50% 6.75% (iii) Expected Rate of Return on Assets 9.40% 8.50% (i) Contribution to Provident Fund (iv) Contribution to Employees' Pension Scheme 1995 (v) Contribution to National Pension Scheme TOTAL (B) Defined Benefit Plans (a) Gratuity (b) Leave Encashment Applicable to certain employees Valuations in respect of Gratuity and Leave Encashment have been carried out by independent actuary, as at the balance sheet date, based on the following assumptions: ( in million) 2012-13 (ii) (iii) (iv) (v) Gratuity Leave Encashment Gratuity Leave Encashment Funded Unfunded Funded Unfunded 305.62 126.04 264.11 86.72 27.76 12.08 22.79 7.36 Changes in Present value of Obligation a. Opening Present value of Obligation b. Interest Cost c. Past Service Cost d. Current Service Cost e. Contributions by Plan participants - - - - 20.94 23.26 18.96 11.74 - - - - f. Curtailment Cost/(Credit) - - - - g. Settlement Cost/(Credit) - - - - h. Benefits Paid (21.21) (14.35) (13.61) (18.52) i. Actuarial (Gains)/Loss 15.42 9.16 13.37 38.75 j. Amalagamation/ Scheme - - - - k. Closing Present value of Obligation 348.53 156.19 305.62 126.05 278.46 - 196.02 - 26.49 - 20.43 - 3.92 - - - 27.93 - 75.62 - - - - - (21.21) - (13.61) - Changes in Fair value of Plan Assets a. Opening Present value of Plan Assets b. Expected Return on Plan Assets c. Actuarial (Gain) / Loss d. Employer's Contributions e. Employees' Contributions (incl. Nil transferred from previous employers) f. Benefits Paid g. Amalgamation / Scheme h. Closing Fair value of Assets - - - - 315.59 - 278.46 - - - - - Percentage of each category of Plan Assets to total closing fair value a. Bank Deposits (Sp. Dep. Scheme, 1975) b. Debt Instruments c. Administered by Life Insurance Corporation of India d. Others - - - - 315.59 - 278.46 - - - - - Reconciliation of the Present Value of Defined Present Obligations & Fair Value of Assets a. Closing Present value of Funded Obligation 348.53 156.19 305.62 126.05 b. Closing Fair value of plan Assets 315.59 - 278.46 - c. Funded (Asset) / Liability recognised in the Balance Sheet 32.94 156.19 27.16 126.05 d. Closing Present value of Unfunded Obligation - - - - e. Unrecognized Past Service Cost - - - - f. Unrecognized Actuarial (Gain) / Loss - - - - g. Unfunded Net Liability recognized in the Balance Sheet - - - - 156.19 305.62 126.05 Amounts recognized in the Balance Sheet a. Closing Present value of Obligation 348.53 b. Closing Fair value of Plan Assets 315.59 - 278.46 - c. (Asset) / Liability recognized in the Balance Sheet 32.94 156.19 27.16 126.05 P I D I L I T E A N N UA L R E P O R T 2 01 2 -13 (i) 2011-12 61 ( in million) 2012-13 (vi) 2011-12 Gratuity Leave Encashment Gratuity Leave Encashment Funded Unfunded Funded Unfunded 20.94 23.26 18.96 11.74 - - - - 27.76 12.08 22.79 7.36 (26.49) - (20.43) - Expenses recognized in the Statement of Profit & Loss a. Current Service Cost b. Past Service Cost c. Interest Cost d. Expected Return on Plan Assets e. Curtailment cost / (Credit) - - - - f. Settlement Cost / (Credit) - - - - g. Net Actuarial (Gain) / Loss 11.50 9.16 13.37 38.75 h. Employees' Contribution - - - - i. Total Expenses recognized in the Statement of Profit & Loss 33.71 44.50 34.69 57.85 ( in million) 44 Research & Development Expenditure Capital expenditure included in fixed assets Revenue expenditure charged to Statement of Profit & Loss TOTAL 2012-13 2011-12 9.44 1.95 164.17 128.61 173.61 130.56 [Refer Note 1(e)] 45 Details of dues to micro and small enterprises as defined under the MSMED Act, 2006 ( in million) As at 31st March 2013 As at 31st March 2012 155.26 115.04 Opening Balance - - Add: Accrued Interest - - The principal amount and the interest due thereon remaining unpaid to any supplier as at the end of each accounting year Principal amount due to micro and small enterprises (Refer Note 7) Amount of Interest accrued & unpaid Less: Paid during the year - - Closing Balance - - 155.26 115.04 TOTAL The Company did not have at any time during the year amount due to small and medium enterprises (SME) which is outstanding for more than 45 days. Further no interest is paid/ payable to such SME creditors. The above information regarding small and medium enterprises has been determined to the extent such parties have been identified on the basis of information available with the Company. ( in million) 46 Details of Payment to Auditor As at 31st March 2013 As at 31st March 2012 Audit fees 2.82 2.47 Limited Review 1.01 0.99 Certification Fees 0.65 0.42 Reimbursement of expenses 0.02 0.02 TOTAL 4.50 3.90 47 Operating Lease a) Operating lease payment recognised in Statement of Profit & Loss amounting to 186.30 million ( 150.10 million) b) General description of the leasing arrangement: i) Leased Assets: Godowns, Company Flat, Office space, etc. ii) Future lease rentals are determined on the basis of agreed terms. iii) At the expiry of the lease term, the Company has an option either to return the asset or extend the term by giving notice in writing. 48 In the opinion of the Management, all assets other than Fixed Assets and Non-Current investments have a realisable value in the ordinary course of business, at least equal to the amount at which they are stated in the Balance Sheet 49 Working Capital Loan from Banks (Cash Credit Accounts) are secured by way of first charge on the stock of Raw Materials, Finished Goods, 50 Figures in bracket indicate previous year’s figures. 51 Previous year’s figures have been regrouped / rearranged wherever necessary. P I D I L I T E A N N UA L R E P O R T 2 01 2 -13 Packing Material, Stock in Process, Bills Receivable and Book Debts and by way of second charge on the entire Plant and Machinery of the Company including Stores and Spares. Further, these loans are secured by way of an Equitable Mortgage on the Land and Building of the Company’s unit at Kondivita, Mumbai. 63 Cash Flow Statement For The Year Ended 31st March 2013 ( in million) 31 March 2013 31 March 2012 6195.69 4441.17 st A st Cash Flows From Operating Activities Profit before tax Non-cash adjustment to reconcile profit before tax to net cash flows Depreciation/ amortization on continuing operation 532.41 479.26 Provision for Diminution in value of investment 47.38 126.29 Interest expense 79.30 211.81 Dividend income (6.45) (15.23) Interest income (222.43) (91.77) (Profit) / Loss on Sale of Investment (147.72) (142.74) 3.71 15.96 (11.92) 66.40 Provision for long term employee benefits 41.49 14.66 Bad debts w/off / provision for doubtful debts 24.96 50.94 (Profit) / Loss on Sale of Assets Unrealized Foreign exchange loss / ( Gain) Operating Profit before Working Capital changes 340.73 715.58 6536.42 5156.75 Movements in working capital: Increase/ (decrease) in Trade payables Increase/ (decrease) in short-term provisions Increase/ (decrease) in other current liabilities 369.09 281.68 16.52 (16.20) 548.75 304.02 Decrease/ (increase) in inventories (548.60) (418.64) Decrease/ (increase) in trade receivables (431.41) (446.21) Decrease/ (increase) in long-term loans and advances (9.18) (3.79) Decrease/ (increase) in short-term loans and advances 16.91 (158.93) (13.85) (8.99) 1.37 7.47 Decrease/ (increase) in other current assets Decrease/ (increase) in other non-current assets Cash generated from / (Used in) operations Direct taxes paid (net of refunds) Net Cash flows from/ (used in) Operating Activities (A) B (50.40) (459.59) 6486.02 4697.16 (1358.99) (989.81) 5127.03 3707.35 Cash Flows From Investing Activities Purchase of Fixed Assets including intangible assets, CWIP Proceeds from sale of Fixed Assets (Increase)/decrease in capital advances Purchase of investments (current & non-current) Proceeds from sale/ maturity of current Investments (Increase)/decrease in share application money (Increase)/decrease in bank deposits (having maturity of more than three months) Interest received Dividend received Net Cash flows from/(used in) Investing Activities (B) (1332.83) (1360.59) 1.80 10.01 16.41 (66.31) (17,346.66) (12,536.58) 15305.53 13222.44 49.12 (48.93) 1,110.29 (1,758.44) 222.43 91.77 6.45 15.23 (1967.46) (2431.40) Cash Flow Statement For The Year Ended 31st March 2013 ( in million) 31 March 2013 st C 31 March 2012 st Cash Flows From Financing Activities (Repayment) / Increase of long term borrowings (922.97) (1675.94) (Decrease) / Increase in current maturity of long term borrowings (611.99) 1477.66 - (27.70) (603.02) (124.65) (1120.25) (1030.14) (Decrease) / Increase in Short term Borrowings Interest Paid Dividend paid (Including Dividend Tax, where applicable) Net Cash Flows from/ (used in) Financing Activities (C) Net Increase in Cash and Cash Equivalents (A+B+C) (3258.23) (1380.77) (98.66) (104.82) Cash and Cash Equivalents at the beginning of the year 608.67 713.49 Cash and Cash Equivalents at the end of the year 510.01 608.67 (98.66) (104.82) 31st March 2013 31st March 2012 1.37 1.61 352.85 119.07 0.08 0.26 155.71 487.23 - 0.50 510.01 608.67 Cash and Cash Equivalents includes: Cash on Hand Cheques on Hand Remittances in Transit Bank Balances: With Scheduled Banks: In Current Accounts Fixed Deposits with original maturities of less than 3 months The accompanying notes are an integral part of the financial statements AS PER OUR ATTACHED REPORT OF EVEN DATE For Haribhakti & Co. Chartered Accountants FRN 103523W FOR AND ON BEHALF OF THE BOARD M B PAREKH Chairman & Managing Director CHETAN DESAI S K PAREKH Vice Chairman Partner Membership No. 17000 SAVITHRI PAREKH Company Secretary P I D I L I T E A N N UA L R E P O R T 2 01 2 -13 Place: Mumbai Date: 28th May 2013 65 Corporate Governance Report In compliance with Clause 49 of the Listing Agreement with Stock Exchanges, the Company submits the following report: 1. Company’s Philosophy on Code of Governance The Company is committed to good Corporate Governance and has complied in all material respects with the requirements specified in the Listing Agreement with the Stock Exchanges. 2. Board of Directors During the Financial Year 2012-13, 6 Board Meetings were held on 24th May 2012, 21st June 2012, 24th July 2012, 30th October 2012, 29th January 2013 and 29th March 2013#. Details of composition of the Board, category, attendance of Directors at the Board Meetings and last Annual General Meeting (AGM), number of other Directorships and Committee Memberships as on 31st March 2013 are given below: Sr. No. Name Category No. of Board Meetings attended Attendance at last AGM No. of Directorships held in other Companies(*) No. of Committee positions held in other Companies @ Memberships Chairmanships 1. Late Shri B K Parekh## (Chairman) NED(P) 1 No N.A. N.A. N.A. 2. Shri S K Parekh (Vice Chairman) NED(P) 3 Yes 6 - – 3. Shri M B Parekh (Managing Director) ED(P) 6 Yes 9 – – 4. Shri N K Parekh (Jt. Managing Director) ED(P) 6 Yes 8 - – 5. Shri A B Parekh (Wholetime Director) ED(P) 6 Yes 12 – – 6. Shri A N Parekh (Wholetime Director) ED(P) 6 Yes 12 – – 7. Shri R M Gandhi NED (I) 5 Yes 5 3 3 8. Shri N J Jhaveri NED (I) 5 Yes 8 3 2 9. Shri Bansi S Mehta NED (I) 5 No 16 5 4 10. Shri Ranjan Kapur NED (I) 6 Yes 11 2 1 11. Shri Yash Mahajan NED (I) 3 Yes 1 – – 12. Shri Bharat Puri NED (I) 4 Yes – - – 13. Shri D Bhattacharya NED (I) 2 No 6 _ 1 14. Shri Sanjeev Aga NED (I) 6 Yes 4 2 – 15. Shri R Sreeram (Wholetime Director) ED 5 Yes – – – * Including Directorships held in Private Limited Companies, Section 25 Companies, Alternate Directorships and Directorships in bodies incorporated outside India. @ Includes position in Audit Committee and Shareholders’ / Investors’ Grievance Committee only. # Meeting held on 29th March 2013 and continued upto 31st March 2013. ## Shri B K Parekh, Founder Chairman of the Company, passed away on 25th January 2013. ED – Executive Director, ED (P) – Executive Director, Promoter, NED (P) – Non-Executive Director, Promoter, NED (I) – Non-Executive Director, Independent. Shri S K Parekh and Shri N K Parekh are related to each other. Shri M B Parekh and Shri A B Parekh are related to each other. Shri A N Parekh is related to Shri N K Parekh. 3. Audit Committee During the financial year 2012-13, 6 meetings of the Committee were held on 24th May 2012, 19th July 2012, 24th July 2012, 29th October 2012, 28th January 2013 and 13th February 2013. Details of composition of the Committee and attendance of the members at the meetings are given below: Sr. No. Name Designation Category 1 Shri Bansi S Mehta Chairman NED (I) 6 2 Shri N J Jhaveri Member NED (I) 5 3 Late Shri B K Parekh## Member NED (P) 1 4 Shri Ranjan Kapur Member NED (I) 6 ## No. of Meetings attended Shri B K Parekh, Founder Chairman of the Company, passed away on 25th January 2013. The Managing Director is a permanent invitee to the meetings. The Company Secretary is the Secretary of the Committee. Director – Finance, Chief Finance - Domestic, Statutory Auditors and Internal Auditors are invited to attend the meetings. The Cost Auditor is invited when required. The powers and terms of reference of the Committee are as specified in Clause 49 of the Listing Agreement with the Stock Exchanges and Section 292A of the Companies Act, 1956. The remuneration of Chief Internal Auditor, is reviewed by management. 4. HR & Remuneration Committee A. During the financial year 2012-13, 3 meetings of the Committee were held on 24th May 2012, 29th October 2012 and 29th January 2013. HR & Remuneration Committee also functions as Compensation Committee as per Securities and Exchange Board of India (SEBI) guidelines on Employees Stock Option Scheme. The terms of reference of HR & Remuneration Committee consists of making recommendations on matters related to remuneration of Directors and Senior Management, review of performance-based remuneration with reference to corporate goals and objectives, frame policy and review the process of succession planning at key levels in the Company and other related matters. Remuneration policy of the Company is directed towards time commitment and responsibilities of the Directors, desirability of performance-based remuneration and salaries paid by comparable companies. Sr. No. Name Designation Category No. of meetings attended 1. Shri Bansi S Mehta Member NED (I) 3 2. Shri Ranjan Kapur Member NED (I) 3 3. Shri Bharat Puri Member NED (I) 2 The Managing Director is a permanent invitee to the meeting. The President of Business Resource Group is the Secretary of the Committee. The members elect the Chairman at each meeting. P I D I L I T E A N N UA L R E P O R T 2 01 2 -13 Details of composition of the Committee and attendance of the members at the meetings are given below: 67 B. Remuneration of Directors Executive Directors’ remuneration details for the financial year 2012-13 are given below: Sr. No. Name Salary * ( ) Commission Payable ( ) Perquisites ( ) Total ( ) Tenure (No. of years) 1 Shri M B Parekh (Managing Director) 12,887,785 108,237,098 15,046,449 136,171,332 5 years from 01/08/2008 2 Shri N K Parekh (Jt. Managing Director) 6,443,892 15,917,220 5,618,402 27,979,514 5 years from 01/08/2008 3 Shri A B Parekh (Wholetime Director) 5,523,322 22,284,108 7,175,663 34,983,093 5 years from 01/08/2008 4 Shri A N Parekh (Wholetime Director) 4,813,929 15,917,220 3,713,145 24,444,294 5 years from 01/07/2010 5 Shri R Sreeram (Wholetime Director) 9,019,200 - 5,803,664 14,822,864 3 years from 08/11/2011 * Includes House Rent Allowance The above figures are exclusive of Company’s contribution to Provident Fund, Superannuation, Gratuity and encashment of leave at the end of tenure as per the rules of the Company. Notice period for the Executive Directors is as applicable to the senior employees of the Company. No severance fee is payable to the Executive Directors on termination of employment. As on 31st March 2013, the Company is in the process of framing a scheme of stock options for the employees of the Company. The details of sitting fees paid for attending the Board/ Committee meetings and commission due to the NonExecutive Directors for the year ended 31st March 2013 are as under: Sr. No. Name 1 Sitting fees ( ) Commission Payable ( ) Total ( ) Late Shri B K Parekh## - 739,725 739,725 2 Shri S K Parekh - 900,000 900,000 3 Shri R M Gandhi 140,000 900,000 1,040,000 4 Shri N J Jhaveri 160,000 900,000 1,060,000 5 Shri Bansi S Mehta 203,000 900,000 1,103,000 6 Shri Ranjan Kapur 223,000 9,00,000 1,123,000 7 Shri Yash Mahajan 50,000 9,00,000 950,000 8 Shri Bharat Puri 110,000 9,00,000 1,010,000 9 Shri D Bhattacharya 30,000 9,00,000 930,000 10 Shri Sanjeev Aga 90,000 9,00,000 990,000 ## Shri B K Parekh, Founder Chairman of the Company, passed away on 25 January 2013. th The Non-Executive Directors did not have pecuniary relationships or transactions vis-à-vis the Company. In terms of Special Resolution passed by the Members at Annual General Meeting held on 27th August 2008, Non-Executive Directors have been paid aggregate commission at a rate not exceeding 1% per annum of the net profit of the Company computed in accordance with section 309(5) of the Companies, Act, 1956 as determined by the Board of Directors, based on consideration of time spent in attending Board meetings, Committee meetings and advice given to the Company as experienced/expert persons, whenever approached. The number of shares held by Non-Executive Directors as on 31st March 2013: Shri R M Gandhi - 65,000; Shri N J Jhaveri - 10,000; Shri Ranjan Kapur - Nil; Shri Bansi S Mehta - 24,716; Shri Yash Mahajan - 15,000; Shri S K Parekh - 4,59,69,560; Shri Bharat Puri - Nil; Shri D Bhattacharya – Nil, Shri Sanjeev Aga – Nil. 5. Shareholders’/Investors’ Grievance Committee During the year 12 meetings of the Share Transfer Committee were held and 1 meeting of Shareholders’/Investors’ Grievance Committee (SIG Committee) was held on 11th January 2013 which was attended by Shri R M Gandhi and Shri B K Parekh. Details of composition of the SIG Committee is given below: Sr. No. Name Designation Category 1 Shri R M Gandhi Chairman NED (I) 2 Late Shri B K Parekh## Member NED (P) 3 Shri S K Parekh Member NED (P) 4 Shri N. K. Parekh* Member NED(P) ## Shri B K Parekh, Founder Chairman of the Company, passed away on 25th January 2013. * At the Board meeting held on 29th March 2013, Shri N K Parekh was appointed as the member of the Shareholders’ / Investors’ Grievance Committee to fill the vacancy caused by sad demise of Shri B K Parekh, member of the Committee. The Committee has the power to look into redressal of shareholders’/investors’ grievance such as non-receipt of shares sent for transfer, non-receipt of declared dividends, non-receipt of Annual Reports, etc. Smt. Savithri Parekh, Company Secretary, is the compliance officer for complying with the requirements of the Securities Laws and the Listing Agreements with the Stock Exchanges. Barring certain cases pending in Courts/Consumer Forums, mainly relating to disputes over the title to shares, in which the Company has been made a party, the Company and TSR Darashaw Private Ltd. have attended to all the shareholders’/investors’ grievances/correspondences generally within a period of 15 days from the date of receipt. The total number of letters received from the shareholders were 899 of which only 16 were in the nature of complaints. All the complaints were resolved to the satisfaction of shareholders. 1 request for transfer of shares and 4 requests for dematerialization of shares were pending for approval as on 31st March 2013 which were dealt with by 5th April 2013 and 2nd April 2013 respectively. The Company has framed a Code of Internal Procedures and Conduct for Prevention of Insider Trading on the lines of model code specified by SEBI. Shri P. C. Patel, President is the Compliance Officer for the purpose. SEBI has recently commenced processing of investor complaints in a centralized web based complaint redress system viz. SCORES. The salient features of this system are: centralised database of all complaints; online movement of complaints to the concerned listed companies; online upload of Action Taken Reports (ATRs) by the concerned companies and online viewing by investors of actions taken on the complaint and its current status. 6. General Body Meetings Financial Year Venue Date & Time 2011-12 Rangaswar Hall, 4th floor, Y.B.Chavan Centre, Gen.Jagannath Bhosale Marg, Next to Shachivalaya Gymkhana (Opp. Mantralaya), Mumbai-400 021. 24th July 2012 at 3.00 p.m. 2010-11 Kamalnayan Bajaj Hall, Bajaj Bhavan, Jamnalal Bajaj Marg, Nariman Point, Mumbai-400 021. 26th July 2011 at 3.00 p.m. 2009-10 Kamalnayan Bajaj Hall, Bajaj Bhavan, Jamnalal Bajaj Marg, Nariman Point, Mumbai-400 021. 11th August 2010 at 11.00 a.m. P I D I L I T E A N N UA L R E P O R T 2 01 2 -13 Details of location, date and time of the Annual General Meetings held during the last three years are given below: 69 The following Special Resolutions were passed with requisite majority in the previous 3 Annual General Meetings: 2011-2012 • ApprovalforincreaseinremunerationofShriSanketSParekh,relativeofaDirectoroftheCompany,tohold Office/Place of Profit as Head-Field Marketing (ADH.I) under Section 314 of the Companies Act, 1956. • Approvalforoffer,issue&allotmentofequitysharesunderEmployeeStockOptionSchemeandundersection 81 of the Companies Act, 1956. 2010-2011 No Special Resolutions were passed. 2009-2010 No Special Resolutions were passed. No Special Resolution was passed through postal ballot during the last year. At the ensuing Annual General Meeting, there is no resolution proposed to be passed through postal ballot. 7. Disclosures • Therewerenomateriallysignificantrelatedpartytransactionswhichhavepotentialconflictwiththeinterest of the Company at large. • TheCompanyhascompliedwithallrequirementsoftheListingAgreementswiththeStockExchangesas well as the regulations and guidelines of SEBI. Consequently, no penalties were imposed or strictures passed against the Company by SEBI, Stock Exchanges or any other statutory authority on any matter relating to capital markets during the last 3 years. • TheCompanyhascompliedwithallapplicablemandatoryrequirementsofClause49oftheListing Agreement. Out of the non-mandatory requirements, the Company has adopted the following: Late Shri B. K. Parekh, Non-Executive Chairman, maintained an office at the Company, at the Company’s expense and was also allowed reimbursement of the expenses incurred in performance of his duties. The Company has constituted HR & Remuneration Committee to recommend/review remuneration of Directors and Senior Management. Please see Para 4 for details. 8. Means of Communication • ThequarterlyresultsoftheCompanyarenormallypublishedinthefollowingnewspapers: The Economic Times (English), Maharashtra Times (Marathi) and displayed on the Company’s website (www.pidilite.com). • PresentationmadetoInstitutionalInvestorsortoAnalystsandtranscriptsofmeetingwiththeAnalystsare posted on the Company’s website. 9. Information for Shareholders Detailed information in this regard is provided in the “Information for Shareholders” section, appearing in the Annual Report. 10. Information relating to Directors Information relating to Directors seeking appointment / reappointment as required under clause 49(IV)(G)(i) of the Listing Agreement is given in the Notice of the Annual General Meeting. 11. Declaration by the Managing Director under Clause 49(1)(D)(ii) Declaration by the Managing Director of the Company under Clause 49(1)(D)(ii) of the Listing Agreement with Stock Exchanges is given below: “Pursuant to Clause 49(1)(D)(ii) of the Listing Agreement with Stock Exchanges, I hereby declare that all the Board Members and Senior Management personnel of the Company have affirmed compliance with the Code of Conduct for the year ended 31st March 2013.” Corporate Governance Compliance Certificate To The Members of M/s Pidilite Industries Limited Co. Regn No: 14336 Nominal Capital: 70 Crore We have examined relevant records of M/s Pidilite Industries Ltd. (the Company) for the purpose of certifying compliance of the conditions of Corporate Governance under Clause 49 of the Listing Agreement with BSE Ltd. and National Stock Exchange of India Ltd. for the financial year ended 31st March 2013. We have obtained all the information and explanations which to the best of our knowledge and belief were necessary for the purpose of certification. The compliance of the conditions of Corporate Governance is the responsibility of the Management. Our examination was limited to the procedure and implementation thereof. This certificate is neither an assurance as to the future viability of the Company nor the efficacy or effectiveness with which the Management has conducted the affairs of the Company. On the basis of our examination of the records produced, explanations and informations furnished, we certify that the Company has complied with all the applicable mandatory conditions of the said Clause 49 of the Listing Agreement. . For M M SHETH & CO Company Secretaries M M SHETH Proprietor FCS.1455, CP.729 P I D I L I T E A N N UA L R E P O R T 2 01 2 -13 Date: 10th June 2013 Mumbai 71 Information for Shareholders Month April, 2012 May, 2012 June, 2012 July, 2012 August, 2012 September, 2012 October, 2012 November, 2012 December, 2012 January, 2013 February, 2013 March, 2013 Financial Year 1st April to 31st March. Date of Book Closure 9th July 2013 to 23rd July 2013 (both days inclusive) Dividend Payment Credit/dispatch of dividend warrants will commence from 24th July 2013 subject to the approval of the shareholders at the Annual General Meeting. Name of the Stock Exchange Stock Code 160.0 BSE 500331 150.0 NSE PIDILITIND 140.0 Listing of Secured Redeemable Non-Convertible Debentures (NCDs) The Company had issued NCDs (Series I) aggregating to 750 Million which are listed at the Wholesale Debt Market segment of National Stock Exchange of India Ltd. and the Debenture Trustees are IDBI Trusteeship Services Ltd., Asian Building, Ground Floor, 17, R Kamani Marg, Ballard Estate, Mumbai 400 001. During the year 2010-2011, the Company repurchased NCDs (Series-I) of 150 million and the outstanding amount of NCDs as on 31st March 2013 aggregates to 600 million. ISIN for NCDs (Series I) - INE318A07015 130.0 Market Price Data Share prices during the financial year 2012-13 at NSE for one equity share of 1/- each were as under: Month April, 2012 May, 2012 June, 2012 July, 2012 August, 2012 September, 2012 October, 2012 November, 2012 December, 2012 January, 2013 February, 2013 March, 2013 High 186.00 187.45 180.00 176.50 194.65 212.90 223.90 217.70 224.70 239.70 264.95 273.90 Share Price ( ) Low 163.85 158.60 158.00 153.55 166.30 189.00 189.00 188.60 205.05 211.10 232.00 238.05 120.0 110.0 100.0 Adj Pidilite Mar-13 Jan-13 Feb-13 Dec-12 Nov-12 Oct-12 Sep-12 Apr-12 90.0 Aug-12 Stock Codes Share Price ( ) Low 163.40 159.10 158.00 154.25 166.10 190.00 189.70 188.60 206.50 211.00 232.25 238.00 Stock Performance The performance of the Company’s shares in comparison to BSE sensex is given in the Chart below: Jul-12 Listing of Shares on Stock Exchanges The equity shares of the Company are listed on BSE Ltd. (BSE) and National Stock Exchange of India Ltd. (NSE). The Annual Listing fee for the financial year 2013-14 has been paid to BSE & NSE. High 185.00 187.75 179.70 176.50 194.85 211.95 224.00 217.25 224.75 240.00 278.00 273.20 Jun-12 Day, Date & Time : Tuesday 23rd July 2013 at 3.00 p.m. Venue : Kamalnayan Bajaj Hall, Bajaj Bhavan, Jamnalal Bajaj Marg, Nariman Point, Mumbai – 400 021. Share prices during the financial year 2012-13 at BSE for one equity share of 1/- each were as under: May-12 Annual General Meeting Adj Sensex Registrar & Transfer Agent TSR Darashaw Private Limited Unit: Pidilite Industries Limited 6-10, Haji Moosa Patrawala Ind. Estate, 20, Dr. E. Moses Road, Mahalaxmi, Mumbai - 400 011 Tel : 022 - 66568484 Fax : 022 - 66568494 E-mail : [email protected] Website : www.tsrdarashaw.com Share Transfer System The Company has delegated the authority to approve shares received for transfer in physical form as under: No. of shares Up to 4000 Up to 20000* Above 20000* * Authorisation given to TSR Darashaw Private Limited Any one of the Sarva Shri S K Parekh, M B Parekh, Directors or the Company Secretary. Share Transfer Committee comprising of the Directors viz, Sarva Shri S K Parekh, N K Parekh, A B Parekh and R M Gandhi. Revised w.e.f. 29th March 2013 Distribution of Shareholding as on 31 March 2013: st No. of Equity Shares held Up to 5000 No. of folios 35193 93.38 No of Shares 15336156 5001 – 10000 1792 2.99 4.76 13676446 2.67 10001– 20000 20001 – 30000 333 0.88 4971959 0.97 85 0.23 2135853 0.42 30001 – 40000 53 0.14 1902044 0.37 40001 – 50000 28 0.07 1300028 0.25 50001 – 100000 58 0.15 4345703 0.85 147 0.39 468974141 91.48 100001 and above % % Total No. of Shareholders & shares in physical mode No. of beneficial owners & shares in electronic mode 37689 100.00 512642330 100.00 Total 37689 100.00 512642330 100.00 1883 5.00 4086563 0.80 35806 95.00 508555767 99.20 Dematerialisation of shares & liquidity As on 31st March 2013, 99.20% of total equity shares of the Company were held in dematerialised form with NSDL e-Governance Infrastructure Ltd. and Central Depository Services (India) Ltd. The Company’s equity shares are required to be compulsorily traded in the dematerialised form. The shares are available for dematerialisation under ISIN INE318A01026. Requests for dematerialisation of shares are processed and generally confirmed within 15 days of receipt. Outstanding GDRs/ADRs/Warrants/Convertible instruments In December 2007, the Company raised U.S. $ 40 Million through Zero Coupon Foreign Currency Convertible Bonds(Bonds). During the year, 128 bonds were converted, into 49,93,704 equity shares of 1 each upon requests received from the bondholders. The balance outstanding 205 Bonds of face value of US $ 20.5 million were redeemed on 7th December 2012 i.e. due date of redemption. The Bonds were listed on the Singapore Exchange Securities Trading Limited. Plant Locations in India Mahad, Panvel, Taloja, (Maharashtra); Vapi, Surat (Gujarat); Daman (Union Territory of India); Kala Amb, Baddi (Himachal Pradesh), Secunderabad (Andhra Pradesh). Shareholding Pattern as on 31st March 2013: FII’s 13.61% UTI, Mutual Funds, Banks & Insurance Companies 5.64% Indian Public & Bodies Corporate 10.69% Promoters 70.06% Address for Correspondence Registered Office: Regent Chambers, 7th Floor, Jamnalal Bajaj Marg, 208, Nariman Point, Mumbai - 400 021 Tel No: 022-2282 2708 Corporate Office: Ramkrishna Mandir Road, Off. Mathuradas Vasanji Road, Andheri (E), Mumbai - 400059 Tel No : 022-67697000/7949 Fax No : 022-28216007 Email : [email protected] Website : www.pidilite.com Corporate Secretarial/Investors’ Assistance Department: The Company’s Secretarial Department headed by Smt Savithri Parekh, Company Secretary, is situated at the Corporate Office mentioned above. Shareholders/ Investors may contact Smt. Savithri Parekh or Ms. Manisha Shetty at the Corporate Office in Mumbai for any assistance they may need. Equity shares in Suspense Account under Clause 5A(II) In terms of Clause 5A(II) of the Listing Agreement, the Company has transferred and dematerialized 2,24,719 equity shares of face value of Re. 1/- each which were issued in physical form to 255 shareholders and remained unclaimed to “Pidilite Industries Limited Unclaimed Suspense Account”. No shareholder has approached the Company for transfer of shares from the Suspense Account. P I D I L I T E A N N UA L R E P O R T 2 01 2 -13 Presently the share transfers which are received in physical form are processed and the share certificates, duly transferred are returned generally within a period of 15 days from the date of receipt, subject to the documents being valid and complete in all respects. 73 Consolidated Financial Statements Independent Auditors’ Report On The Consolidated Financial Statements Of Pidilite Industries Limited To the Board of Directors of Pidilite Industries Limited Opinion We have audited the accompanying consolidated financial statements of Pidilite Industries Limited (“the Company”) its subsidiaries and an associate (the Company, its subsidiaries and an associate constitute “the Group”) which comprise the Consolidated Balance Sheet as at March 31, 2013, the Consolidated Statement of Profit and Loss and the Consolidated Cash Flow Statement for the year then ended and a Summary of Significant Accounting Policies and Other Explanatory Information. We report that the consolidated financial statements have been prepared by the Company’s Management in accordance with the requirements of Accounting Standard (AS) 21, “Consolidated Financial Statements” and Accounting Standard (AS) 23, “Accounting for Investments in Associates in Consolidated Financial Statements” as notified pursuant to the Companies (Accounting Standards) Rules, 2006 and on the basis of the separate financial statements of Pidilite Industries Limited, its subsidiaries (including subsidiaries of subsidiaries) and an associate. Management is responsible for the preparation of these consolidated financial statements on the basis of separate financial statements and other financial information regarding components that give a true and fair view of the consolidated financial position, consolidated financial performance and consolidated cash flows of the Group in accordance with accounting principles generally accepted in India; this includes the design, implementation and maintenance of internal control relevant to the preparation and presentation of the consolidated financial statements that give a true and fair view and are free from material misstatement, whether due to fraud or error. Auditors’ Responsibility Our responsibility is to express an opinion on these consolidated financial statements based on our audit. We conducted our audit in accordance with the Standards on Auditing issued by the Institute of Chartered Accountants of India. Those standards require that we comply with ethical requirements and plan and perform the audit to obtain reasonable assurance about whether the consolidated financial statements are free from material misstatement. An audit involves performing procedures to obtain audit evidence about the amounts and disclosures in the consolidated financial statements. The procedures selected depend on the auditors’ judgment, including the assessment of the risks of material misstatement of the consolidated financial statements, whether due to fraud or error. In making those risk assessments, the auditor considers internal control relevant to the Company’s preparation and presentation of the consolidated financial statements that give a true and fair view in order to design audit procedures that are appropriate in the circumstances. An audit also includes evaluating the appropriateness of accounting policies used and the reasonableness of the accounting estimates made by management, as well as evaluating the overall presentation of the consolidated financial statements. We believe that the audit evidence we have obtained is sufficient and appropriate to provide a basis for our audit opinion. In our opinion and to the best of our information and according to the explanations given to us and based on the consideration of the reports of the other auditors on the financial statements of the subsidiaries and an associate as mentioned in the ‘Other Matter’ paragraph below, the consolidated financial statements give a true and fair view in conformity with the accounting principles generally accepted in India: (a) in the case of the Consolidated Balance Sheet, of the state of affairs of the Group as at March 31, 2013; b) in the case of the Consolidated Statement of Profit and Loss, of the profit for the year ended on that date; and c) in the case of the Consolidated Cash Flow Statement, of the cash flows for the year ended on that date. Other Matter We did not audit the financial statements of Nineteen subsidiaries whose financial statements reflect total assets (net) of 3,797.41 million as at March 31, 2013, total revenues (net) of 3,838.88 million and net cash outflows amounting to 10.79 million for the year then ended. We also did not audit the financial statements of the associate, whose aggregate share of net profit amounting to 24.12 million is also included in the consolidated financial statements. These financial statements have been audited by other auditors whose reports have been furnished to us by the Management, and our opinion, in so far as it relates to the amounts included in respect of the subsidiaries and the associate, is based solely on the reports of the other auditors. Our opinion is not qualified in respect of this matter. For Haribhakti & Co. Chartered Accountants Firm Registration No. 103523W Chetan Desai Partner Membership No. 17000 Place: Mumbai Date: 28th May 2013 P I D I L I T E A N N UA L R E P O R T 2 01 2 -13 Management’s Responsibility for the Consolidated Financial Statements 75 Consolidated Balance Sheet For The Year Ended 31st March 2013 ( in million) Notes As at 31st March 2013 As at 31st March 2012 512.64 16,002.70 16,515.34 507.65 12,698.10 13,205.75 9.55 5.33 EQUITY AND LIABILITIES Shareholders’ Funds Share Capital Reserves and Surplus 2 3 Minority Interest Non-Current Liabilities Long-Term Borrowings Deferred Tax Liability (net) Long-Term Provisions 4 5 6 498.67 151.92 650.59 922.97 467.99 108.82 1,499.78 Current Liabilities Short-Term Borrowings Trade Payables Other Current Liabilities Short-Term Provisions 7 8 9 10 509.92 2,501.08 3,931.51 1,634.30 8,576.81 25,752.29 559.79 2,057.72 5,135.24 1,179.46 8,932.21 23,643.07 TOTAL ASSETS Non Current Assets Fixed Assets Tangible Assets Intangible Assets Capital Work-In-Progress 11 12 Non Current Investments Long-Term Loans and Advances Other Non-Current Assets 13 14 15 Current Assets Current Investments Inventories Trade Receivables Cash and Bank Balances Short-Term Loans and Advances Other Current Assets 16 17 18 19 20 21 TOTAL Summary of Significant Accounting Policies Notes on Financial Statements 5,190.71 985.95 3,938.19 5,655.56 811.69 4,280.15 10,747.40 84.80 249.76 0.16 11,082.12 10,114.85 73.74 258.17 9.66 10,456.42 2,846.29 5,235.71 4,304.94 1,506.15 664.43 112.65 14,670.17 25,752.29 909.16 4,541.33 3,951.86 2,731.92 953.93 98.45 13,186.65 23,643.07 1 2 to 40 The accompanying notes are an integral part of the financial statements AS PER OUR ATTACHED REPORT OF EVEN DATE For Haribhakti & Co. Chartered Accountants FRN 103523W FOR AND ON BEHALF OF THE BOARD M B PAREKH Chairman & Managing Director CHETAN DESAI S K PAREKH Vice Chairman Partner Membership No. 17000 Place: Mumbai Date: 28th May 2013 SAVITHRI PAREKH Company Secretary Consolidated Statement of Profit and Loss For The Year Ended 31st March 2013 ( in million) Notes 2012-13 2011-12 38,979.00 32,849.30 2,197.90 1,583.61 36,781.10 31,265.69 704.65 434.68 37,485.75 31,700.37 18,440.24 16,008.13 2,159.03 1,732.50 INCOME Revenue from Operations (Gross) 22 Less: Excise Duty Revenue from Operations (Net) Other Income 23 Total EXPENSES Cost of Materials 24 Purchase of Stock in Trade Change in Inventories of Finished Goods, Work-in-Progress and Stock in Trade 25 (518.16) (337.39) Employee Benefits Expense 26 3,745.79 3,262.29 Depreciation and Amortization Expense 27 685.81 637.25 Finance Cost 28 213.82 307.18 Other Expenses 29 Total Profit before Exceptional Items and Tax (Add)/Less: Exceptional Items (net) 30 Profit before tax 6,964.35 5,763.78 31,690.88 27,373.74 5,794.87 4,326.63 (18.30) - 5,813.17 4,326.63 1,564.75 1,053.95 30.36 46.32 Less: Tax Expenses Current Tax Deferred Tax Total Tax expenses 1,595.11 1,100.27 Profit for the year 4,218.06 3,226.36 2.43 3.02 24.12 20.37 4,239.75 3,243.71 Basic ( ) 8.32 6.39 Diluted ( .) 8.32 6.23 Face Value of Share ( ) 1.00 1.00 Less: Share of Profit transferred to Minority Interest Add: Share of Profit in Associate Profit for the year Earnings Per Share: (Refer Note 33) Summary of Significant Accounting Policies Notes on Financial Statements 1 2 to 40 AS PER OUR ATTACHED REPORT OF EVEN DATE For Haribhakti & Co. Chartered Accountants FRN 103523W FOR AND ON BEHALF OF THE BOARD M B PAREKH Chairman & Managing Director CHETAN DESAI S K PAREKH Vice Chairman Partner Membership No. 17000 Place: Mumbai Date: 28th May 2013 SAVITHRI PAREKH Company Secretary P I D I L I T E A N N UA L R E P O R T 2 01 2 -13 The accompanying notes are an integral part of the financial statements 77 Notes 1 Summary of Significant Accounting Policies Basis of preparation of Consolidated Financial Statements The consolidated financial statements relate to Pidilite Industries Limited (‘the Company’) and its subsidiary companies and an associate. The consolidated financial statements have been prepared on the following basis: a) The financial statements of the Company and its subsidiary companies are consolidated on a line-by-line item basis by adding together the book values of like items of assets, liabilities, income and expenses, after eliminating intra-group balances and intra-group transactions in accordance with Accounting Standard (AS) 21 - “Consolidated Financial Statements.” b) The consolidated financial statements are prepared using uniform accounting policies for like transactions and other events in similar circumstances and are presented in the same manner as holding Company’s separate financial statements, as far as possible, except as specifically mentioned in the Notes to Accounts. c) In case of financial statements of non integral foreign operations, the assets and liabilities are translated at the closing exchange rate. Income and Expense items are translated at average exchange rates and all resulting exchange differences are accumulated in foreign currency translation reserve on consolidation until the disposal of the investment. d) Minority Interest’s share of net profit of Consolidated Subsidiaries for the year is identified and adjusted against the income of the group in order to arrive at the net income attributable to shareholders of the Company. e) Minority Interest’s share of net assets of Consolidated Subsidiaries for the year is identified and presented in the consolidated financial statements separate from liabilities and the equity of the Company’s shareholders. f) The difference between the cost of investment in the subsidiaries and the Company’s share of net assets at the time of acquisition of shares in the subsidiaries is recognised in the financial statement as Goodwill or Capital Reserve as the case may be. g) Investment in Associate Company has been accounted under the equity method as per (AS 23) - “ Accounting for Investment in Associates in Consolidated Financial Statements”. h) The Company accounts for its shares in change in net assets of the associate, post acquisition, after eliminating unrealised profits and losses resulting from transactions between the Company and its associate to the extent of its share, through its statement of profit and loss to the extent such change is attributable to the associate’s profit or loss through its reserves for the balance, based on available information. i) The difference between the cost of investments in the associate and the share of net assets at the time of acquisition of shares in the associate is identified in the financial statements as Goodwill or Capital reserve as the case may be. j) The financial statements of the subsidiaries used into the consolidation are drawn upto the same reporting date as that of the company. The Consolidated Financial Statements comprises of the results of Pidilite Industries Limited (Holding Company) and Subsidiary Companies viz. Name of Subsidiary Company Country of Incorporation Proportion of Ownership Interest Fevicol Company Ltd India 100% Subsidiary Bhimad Commercial Co Pvt Ltd India 100% Subsidiary Madhumala Traders Pvt Ltd India 100% Subsidiary Pagel Concrete Technologies Ltd India 75% Nitin Enterprises India Partnership firm of which 100% holding by wholly owned Subsidiaries Building Envelope Systems India Ltd India 60% Pidilite International Pte Ltd Singapore 100% Subsidiary Pidilite Middle East Ltd Dubai 100% Subsidiary Pulvitec do Brasil Industria e Commercio de Colas e Adesivos Ltda Brazil 100% Subsidiary Pidilite USA Inc USA 100% Subsidiary Jupiter Chemicals (LLC) Dubai 100% Subsidiary of wholly owned Subsidiaries PT Pidilite Indonesia Indonesia 100% Subsidiary of wholly owned Subsidiaries Pidilite Speciality Chemicals Bangladesh Pvt Ltd Bangladesh 100% Subsidiary of wholly owned Subsidiaries Pidilite Innovation Centre Pte Ltd Singapore 100% Subsidiary of wholly owned Subsidiaries Pidilite Industries Egypt - SAE Egypt 100% Subsidiary of wholly owned Subsidiaries Pidilite Bamco Ltd Thailand 100% Subsidiary of wholly owned Subsidiaries Pidilite South East Asia Ltd* Thailand 100% Subsidiary of wholly owned Subsidiaries PIL Trading Egypt (LLC) Egypt 100% Subsidiary of wholly owned Subsidiaries Pidilite Industries Trading ( Shanghai) Co. Ltd China 100% Subsidiary of wholly owned Subsidiaries Bamco Supply Services Ltd Thailand 49% Subsidiary Subsidiary Subsidiary of wholly owned Subsidiaries & Having significant influence *Pidilite South East Asia Ltd. has not been considered for consolidation in the current year as the company is under liquidation As far as possible, the consolidated financial statements are prepared using uniform accounting policies for like transactions & other events in similar circumstances & are presented in the same manner as the holding company’s separate financial statements except as provided under para c(c)(3), c(c)(4), c(e), j(d) and k. a. Presentation and disclosure of financial statements As notified by Ministry of Corporate Affairs, revised Schedule VI under the Companies Act, 1956 is applicable to the financial statements for the financial year commencing on or after 1st April 2011. Accordingly, the financial statements for the period ended 31st March 2013 are prepared in accordance with the revised Schedule VI. Use of Estimates The preparation of financial statements in confirmity with Indian GAAP requires the management to make judgements, estimates and assumptions that affect the reported amounts of revenues, expenses, assets and liabilities and the disclosure of contingent liabilities, at the end of the reporting period. Although these estimates are based on the management’s best knowledge of current events and actions, uncertainty about these assumptions and estimates could result in the outcomes requiring a material adjustment to the carrying amount of assets or liabilities in future periods. P I D I L I T E A N N UA L R E P O R T 2 01 2 -13 b. 79 c. Tangible Assets, Intangible Assets, Depreciation, Amortisation and Impairment Loss a) Fixed Assets are stated at cost of acquisition or construction as reduced by accumulated depreciation and impairment loss, if any. b) Preoperative expenditure during construction period/trial run: Direct expenses as well as clearly identifiable indirect expenses, incurred on project during the period of construction are being capitalised alongwith the respective assets. c) The Company provides depreciation as under: 1. On straight line method (SLM) basis as per new rates prescribed under Schedule XIV to the Companies Act, 1956. 2. The Company provides pro-rata depreciation for additions made during the year except for each asset costing ` 5,000 or less, for which depreciation has been provided at hundred percent. 3. The Goodwill acquired by the Company is amortised over a period of 5 years on SLM basis. In case of Subsidiaries no goodwill is amortised, but tested for impairment. 4. The Copyrights, Trademarks, Technical Knowhow, etc. acquired by the Parent Company are amortised over a period of 10 years on SLM basis. In case of subsidiaries, it is not amortised except for Pidilite USA Inc where it is amortised over a period of 15 years. 5. d. e. Borrowing costs, which are directly attributable to acquisition, construction or production of a qualifying asset, are capitalised as a part of the cost of the asset. Other borrowing costs are recognised as expenses in the period in which they are incurred. d) In case, the recoverable amount of the tangible and intangible assets is lower than its carrying amount, provision is made for the impairment loss. e) The depreciation on fixed assets of the subsidiary companies is provided for on SLM over their estimated useful life at rates permissible under applicable local laws. Research and Development Expenditure a) Capital Expenditure is shown separately in Fixed Assets. b) Revenue expenses including depreciation are charged to respective heads of accounts. Investments a) Non- Current Investments are stated at cost. In case there is a diminution of permanent nature in value of investments, the same is provided for. b) (i) Quoted current investments are stated at the lower of cost and market value. (ii) Unquoted current investments are stated at the lower of cost and fair value where available. f. Inventories a) Raw Materials and Packing Materials are valued at cost on weighted average basis b) Finished goods, Stock in Trade and Work in Progress are valued at lower of cost and net realisable value. Cost (arrived at on weighted average) for this purpose includes direct materials, direct labour, excise duty and appropriate overheads. c) Consumable stores & spares are valued at lower of cost or net realisable value as estimated by the management d) Obsolete, defective, unserviceable and slow/non-moving stocks are duly provided for. g. Revenue Recognition i) Income from sale of goods is recognised upon transfer of significant risk and rewards of ownership of the goods to the customer which generally coincides with delivery and acceptance of the goods sold. Sales are net of Sales Tax/ VAT, returns, rebates and discounts. ii) Interest income is recognised on accrual basis. iii) Claims which are not of material nature / Insurance Claim etc. are accounted for when no significant uncertainties are attached to their eventual receipt. iv) Dividend is accounted for when right to receive dividend is established. h. i. Transactions in foreign currencies a) Transactions are recorded at the exchange rates prevailing on the date of transaction. b) In case of foreign subsidiaries, being non-integral foreign operations, revenue items are consolidated at the average rate prevailing during the year. All assets & liabilities are converted at rates prevailing at the end of the year. Any exchange difference arising out of consolidation is transferred to “ Foreign Currency Translation Reserve”. c) Foreign currency designated assets and liabilities are restated at the year end rates and the resultant gain or loss is taken to Profit and Loss Account except in respect of fixed Assets which is being capitalised Financial Derivatives and Hedging Transactions In respect of derivative contracts, premium paid, gains/ losses on settlement and losses on restatement are recognised in the Statement of Profit & Loss except in case where they relate to the acquisition or construction of a fixed asset, in which case, they are adjusted to the carrying cost of such assets. j. k. Retirement and other employee benefits a) Contribution to Provident, Superannuation and Family Pension funds are funded as a percentage of salary / wages. b) Gratuity liability is funded as per group gratuity scheme of Life Insurance Corporation of India. c) Gratuity and Leave encashment liability is provided for on the basis of acturial valuation as at the year end. d) Retirement benefits for the employees in subsidiary companies are governed under applicable local laws. Taxes Provision for current tax is made on the basis of relevant provisions of the Income Tax Act, 1961 in case of the Holding Company and Income Tax Laws of the respective country in case of the subsidiary companies. The deferred tax for timing differences between the book and tax profits for the year is accounted for, using the tax rates and laws that have been substantively enacted as of the balance sheet date. Deferred tax assets arising from timing differences are recognised to the extent there is virtual / reasonable certainty that these would be realised in future. Provisions, Contingent Liabilities and Contingent Assets A provision is made based on a reliable estimate when it is probable that an outflow of resources embodying economic benefits will be required to settle an obligation. Contingent liabilities, if material are disclosed by way of notes to accounts. Contingent assets are neither recognised nor disclosed in the financial statements. m. Cash and Cash Equivalents Cash and cash equivalents for the purpose of cash flow statement comprise cash at bank, cash in hand and short- term investments with an original maturity of three months or less. P I D I L I T E A N N UA L R E P O R T 2 01 2 -13 l. 81 Notes ( in million) 2 As at 31st March 2013 As at 31st March 2012 700.00 700.00 700.00 700.00 512.64 507.65 512.64 507.65 Share Capital Authorised 700,000,000 (70,00,00,000) Equity Shares of 1 each TOTAL Issued, Subscribed and Paid up Capital 512,642,330 (507,648,626) Equity Shares of 1 each, fully paid-up TOTAL ( in million) a. Reconciliation of the shares outstanding at the beginning and at the end of the reporting period As at 31st March 2013 As at 31st March 2012 No. of shares ( in million) No. of shares ( in million) Equity Shares Shares outstanding at the beginning of the year Shares issued during the year upon conversion of Foreign Currency Convertible Bonds Shares outstanding at the end of the year b. 507,648,626 507.65 506,134,612 506.13 4,993,704 4.99 1,514,014 1.52 512,642,330 512.64 507,648,626 507.65 Terms/Rights attached to Equity Shares The Company has only one class of equity shares having a par value of 1 per share. Each holder of equity shares is entitled to one vote per share. The Company declares and pays dividend in Indian rupees. The dividend proposed by the Board of Directors is subject to the approval of the shareholders in the ensuing Annual General Meeting. In the event of liquidation, the equity shareholders are eligible to receive the remaining assets of the Company after distribution of all preferential amounts, in the proportion of their shareholding. During the year ended 31st March, 2013, the amount of per share dividend recognized as distributions to equity shareholders is 2.60 ( 1.90). c. Details of shareholders holding more than 5% shares in the Company As at 31st March 2013 No. of Shares held As at 31st March 2012 % of No. of Shares Holding held % of Holding Shri Madhukar Balvantray Parekh 56,958,614 11.11 56,958,614 11.22 Shri Narendrakumar Kalyanji Parekh 54,332,178 10.59 54,332,178 10.70 Shri Ajay Balvantray Parekh 49,134,386 9.58 49,134,386 9.68 Shri Sushilkumar Kalyanji Parekh 45,969,560 8.97 45,969,560 9.06 Devkalyan Sales Pvt. Ltd. 26,074,280 5.09 26,074,280 5.14 Genesis Indian Investment Co. Ltd. - General Sub fund 40,675,686 7.93 40,888,180 8.05 d. Aggregate number of bonus shares issued, share issued for consideration other than cash and shares bought back during the period of five years, immediately preceding the reporting date: Year (Aggregate no. of shares) 2012-13 2011-12 2010-11 2009-10 2008-09* Fully paid up pursuant to contract(s) without payment being received in cash - - - - - Alloted as fully paid bonus shares - - - 253,067,306 - 4,993,704 1,514,014 - - - Equity Shares Alloted on Conversion of FCCB * In 2008-09, company had transferred 6,000 Equity Shares from Bonus Shares Issue Suspense Account to Equity Share Capital Account on account of settlement of dispute for title of shares. However, no new shares were alloted. The Company had issued on 6th December 2007, 400 Foreign Currency Convertible Bonds (FCCB) of US$100000 each, which were convertible into Equity shares at any time upto 1st December 2012. The due date for redemption of FCCBs was 7th December 2012. As on 7th December 2012, the balance outstanding FCCBs aggregating 205 Bonds were redeemed. P I D I L I T E A N N UA L R E P O R T 2 01 2 -13 e. 83 ( in million) 3 Reserves and Surplus As at 31st March 2013 As at 31st March 2012 5.68 5.43 Balance as per last financial statements 152.03 - Add: Credited on conversion of Foreign Currency Convertible Bonds 498.94 152.03 650.97 152.03 935.62 692.22 59.93 243.40 Capital Reserve Securities Premium Account Closing Balance Debenture Redemption Reserve Balance as per last financial statements Add: Transferred from Statement of Profit and Loss Less: Transferred to General Reserve* Closing Balance Cash Subsidy Reserve Foreign Currency Monetory Item Translation Difference Account # (736.44) - 259.11 935.62 9.47 9.47 - (55.52) General Reserve Balance as per last financial statements Add: Transferred from Statement of Profit and Loss Add: Transferred from Debenture Redemption Reserve* Closing Balance Foreign Currency Translation Reserve 10,860.58 9,110.58 2,500.00 1,750.00 736.44 - 14,097.02 10,860.58 331.84 262.38 Surplus Balance as per last financial statements Add: Profit for the year 528.11 399.51 4,239.75 3,243.71 1,332.87 965.14 226.45 156.57 59.93 243.40 2,500.00 1,750.00 4,119.25 3,115.11 648.61 528.11 16,002.70 12,698.10 Less: Appropriations Proposed final Equity Dividend (amount per share 2.60 (31st March 2012 1.90)) (The above includes tax on dividend declared on conversion of Bonds Nil ( 0.61 million) Tax on proposed equity dividend (The above includes tax on dividend declared on conversion of Bonds Nil ( 0.1 million) Transfer to Debenture Redemption Reserve Transfer to General Reserve Total Appropriations Closing Balance TOTAL * The transfer of Debenture Redemption Reserve to General Reserve is on account of conversion/redemption of Foreign Currency Convertible Bonds. # As per ICAI announcement on ‘Presentation of FCMITDA’ dated 30th March 2013, Foreign Currency Monetary Item Translation Difference Account has been shown under Reserves & Surplus as a separate line item. ( in million) 4 Long Term Borrowings As at 31st March 2013 As at 31st March 2012 600 (600) 11.9% Redeemable Non Convertible Debentures of 1,000,000 Each (Refer Note a.) - 600.00 Other loans and advances Interest free Sales Tax loan from Government of Maharashtra (Refer Note b.) - 322.97 TOTAL - 922.97 Secured borrowings - 600.00 Unsecured borrowings - 322.97 Debentures The Above amount Includes 922.97 a. 600 redeemable Non Convertible Debentures are secured by way of mortgage & by first pari passu charge on the immovable property in Gujarat & all movable properties of the Company. These debentures will be redeemed at par on 5th December 2013 (Refer Note 9) b. Sales Tax loan is interest free & payable in 16 yearly installments, starting from 30th April 2007. The same has been prepaid during the year except 2.43 million (Refer Note 9) ( in million) Deferred Tax Liabilities (net) As at 31st March 2013 As at 31st March 2012 Deferred Tax Liability 614.94 559.97 614.94 559.97 Leave Encashment 47.03 35.09 Provision for doubtful debts 55.03 48.74 Others 14.21 8.15 Gross Deferred Tax Asset 116.27 91.98 TOTAL 498.67 467.99 Fixed Assets: Impact of difference between tax depreciation and depreciation/ amortization charged for financial reporting Gross Deferred Tax Liability Deferred Tax Asset P I D I L I T E A N N UA L R E P O R T 2 01 2 -13 5 85 ( in million) 6 Long-Term Provisions As at 31st March 2013 As at 31st March 2012 143.29 108.82 Anniversary Awards 3.89 - Premature Death Pension Scheme 3.76 - Total Disability Pension Scheme 0.98 - 151.92 108.82 Leave Encashment TOTAL ( in million) 7 Short-Term Borrowings As at 31st March 2013 As at 31st March 2012 Secured Working Capital Loan from Banks 509.92 559.79 TOTAL 509.92 559.79 a. Working Capital Loan from Banks are secured by way of first charge on the stock of Raw Materials, Finished Goods, Packing Material, Stock in Process, Bills Receivable and Book Debts and by way of second charge on the entire Plant and Machinery of the Company including Stores and Spares. Further, these loans are secured by way of an Equitable Mortgage on the Land and Building of the Company’s unit at Kondivita, Mumbai. b. Pidilite Industries Limited, the Holding Company has given guarantee for loans taken by certain Subsidiaries. ( in million) 8 Trade Payables As at 31st March 2013 As at 31st March 2012 155.26 115.04 Others 2,345.82 1,942.68 TOTAL 2,501.08 2,057.72 Trade Payables including Acceptances Micro, Small and Medium Enterprises ( in million) 9 Other Current Liabilities As at 31st March 2013 As at 31st March 2012 600.00 - Foreign Currency Convertible Bonds (US $ 33.3 million Zero Coupon Convertible Bonds) (Refer Note a) - 1,705.63 Loan from bank(s) - 11.56 2.43 12.73 40.05 590.10 6.62 5.87 3,282.41 2,809.35 3,931.51 5,135.24 Current maturities of Long-Term borrowings 600 (600) 11.9% Redeemable Non Convertible Debentures of 1,000,000 Each Interest free Sales Tax loan from Government of Maharashtra Other Liabilities Interest accrued but not due on borrowings Unclaimed dividend* Other Outstanding liabilities # TOTAL * These figures include 0.29 million ( 0.23 million) due and outstanding to be credited to Investor Education and Protection Fund on account of dispute. # These figures include statutory dues, dealer deposit, creditors for capital goods and other provisions. a. All the FCCBs have been converted/ redeemed during the year. ( in million) 10 Short-term Provisions As at 31st March 2013 As at 31st March 2012 32.94 27.16 Anniversary Awards 0.61 - Premature Death Pension Scheme 0.63 - Total Disability Pension Scheme 0.14 - 40.66 31.30 1,332.87 964.53 226.45 156.47 1,634.30 1,179.46 Gratuity Leave benefits Proposed Equity Dividend Tax on proposed Equity dividend TOTAL P I D I L I T E A N N UA L R E P O R T 2 01 2 -13 Provision for Employee Benefits 87 487.18 * 643.44 Furniture & Fixtures Office Equipments 1,053.35 3.07 9,586.81 - Furniture & Fixtures 161.92 * 270.02 * 138.17 11.22 Computer Software Copyrights Technical Knowhow Fees Non Compete Fees 10,598.69 Previous Year 1,112.49 1,065.83 12.48 - 0.50 - 11.98 - - 58.30 98.29 (38.49) - - 7.31 (45.80) - - 136.78 - - - 25.86 1.57 8.31 96.98 4.06 - - 2,297.89 11.22 138.67 276.56 220.79 665.00 985.65 10,539.13 3.07 63.57 1.44 668.24 527.64 191.63 6,696.01 1,773.19 196.15 418.19 139.56 11,792.44 77.03 12,837.02 41.28 - - 13.85 1.09 26.34 35.75 - - - 2.74 (0.85) 1.65 20.54 8.95 - 2.72 Forex Gain/ As at (Loss) 31.3.2013 * Figures have been regrouped ** Pertains to impairment of goodwill (Refer Note 30) Plant and Equipments includes given on lease - Gross block amounting to 1.82 million. Capital Work in Progress 11,792.45 GRAND TOTAL 2,205.64 665.00 * Trademarks TOTAL 959.31 Goodwill 12 Intangible Assets TOTAL - 54.13 - Plant & Equipments 9.44 1.44 - 47.92 42.88 10.63 - Buildings Others (Scientific Research Assets) 187.66 6,192.97 * Vehicles 135.41 1,632.89 Buildings Plant & Equipments 579.48 - 196.15 Leasehold Land 227.59 Deductions/ Additions Adjustments 187.88 As at 1.4.2012 GROSS BLOCK Freehold Land PARTICULARS 11 Tangible Assets 4,959.96 5,615.77 1,221.58 8.32 80.94 96.05 109.36 568.96 357.95 4,394.19 2.53 29.24 1.10 351.55 212.26 96.26 3,262.74 429.45 9.06 - 637.25 685.81 135.44 1.12 8.44 15.25 21.40 25.69 63.54 550.37 0.19 1.71 0.05 63.20 30.68 16.78 384.59 51.19 1.98 - 31.36 (82.43) (65.90) - - 7.08 21.22 - (94.20) ** (16.53) - - - (22.29) 1.19 0.61 1.17 2.79 - - As at Provided Deductions / 1.4.2012 during the year Adjustments NET BLOCK 49.92 (14.24) 63.28 - - 4.57 43.39 - 15.32 (77.52) - - - (43.38) (0.43) (4.63) (32.72) 3.64 - 5,615.77 6,369.77 1,486.20 9.44 89.38 108.79 152.93 594.65 531.01 4,883.57 2.72 30.95 1.15 393.66 241.32 107.80 3,613.44 481.49 11.04 - 4,280.15 6,176.66 6,467.25 811.69 1.78 49.29 167.77 67.86 70.35 454.64 5,655.56 0.35 32.62 0.29 274.58 286.32 83.83 3,082.57 1,291.70 185.11 418.19 3,938.19 5,638.74 6,176.66 985.95 2.90 57.23 159.83 54.47 110.16 601.36 5,190.71 0.54 24.89 0.34 291.89 276.93 91.40 2,926.31 1,203.44 187.09 187.88 Forex Gain/ As at As at As at (Loss) 31.3.2013 31.3.2013 31.3.2012 ACCUMULATED DEPRECIATION ( in million) ( in million) 13 Non-Current Investments a As at 31st March 2013 As at 31st March 2012 11.79 11.79 Goodwill (Net arising at the time of acquisition of shares) (9.52) (9.52) Share of undistributed profit/ losses in previous years 57.75 42.58 Share of Profit/ Losses Current year 24.12 20.37 TOTAL (a) 84.14 65.22 Nil (3,594) Equity Shares of 10 each of Hindustan Adhesives Ltd - 0.09 Nil (14,400) Equity Shares of 10 each of Hindustan Organic Chemicals Ltd - 0.72 Nil (1,674) Equity Shares of 10 each of Reliance Industries Ltd (earlier: 4,188 Equity Shares of 10 each of Indian Petrochemicals Corporation Ltd) - 0.77 Nil (222,542) Equity Shares of 10 each of Indian Overseas Bank Ltd - 2.96 0.67 4.38 - 5.29 121,300 (121,300) Equity Shares of 10 each of Pal Peugeot Ltd 1.21 1.21 628 (628) Equity Shares of 100 each of Jawahar Co-op Industrial Estate Ltd Trade: Investment in Associates Quoted equity Instruments (fully paid up, unless otherwise stated) 7,451,540 (7,451,540) Equity Shares of 1 each of Vinyl Chemicals (India) Ltd [Market Value 69.60 million ( 72.65 million)] Non-Trade: Investment in others Quoted equity Instruments (fully paid up, unless otherwise stated) 9,426 (61,900)Equity Shares of 10 each of Menon Pistons Ltd [Market Value 0.57 million ( 28.97 million)] Unquoted equity Instruments (fully paid up, unless otherwise stated) Nil (200,200)Equity Shares of 10 each of Enjayes Spices & Chemicals Oil Ltd 0.06 0.06 40 (40) Equity Shares of 50 each of Regent Chambers Premises Co-op Society Ltd (Cost 2,000) - - 25 (25) Equity Shares of 10 each of New Usha Nagar Co-op Housing Society Ltd (Cost 250) - - 0.03 0.03 - - 1.97 15.51 86.11 80.73 1.31 6.99 TOTAL 84.80 73.74 Aggregate amount of quoted investments 84.81 74.14 1.30 6.59 2500 (2500) Equity Shares of 10 each of Saraswat Co-operative Bank Ltd 10 (10) Equity Shares of 100 each of Taloja CETP Co-op Society Ltd (Cost 1,000) TOTAL (b) TOTAL (a+b) Less: Diminution in value of Investments Aggregate amount of unquoted investments P I D I L I T E A N N UA L R E P O R T 2 01 2 -13 b 89 ( in million) 14 Long Term Loans and Advances Unsecured, unless otherwise stated Capital advances Security deposit Other loans and advances Prepaid Expenses Loans and Advances to Staff TOTAL As at 31st March 2013 As at 31st March 2012 113.03 109.46 129.44 102.48 2.89 24.38 249.76 3.65 22.60 258.17 ( in million) 15 Other Non-Current Assets Fixed Deposits against Bank Guarantees TOTAL As at 31st March 2013 0.16 0.16 As at 31st March 2012 9.66 9.66 ( in million) 16 Current Investments Non- Trade Unquoted mutual funds 1,000,000 (1,000,000) Units of HDFC-Debt Fund for Cancer Cure -100% Dividend -Donation Option 3,003,690 (2,986,457) Units of Aviva Life Insurance Nil (15,000,000) Units of ICICI Prudential Series 55-1 Year G Cumm Nil (16,265,699) Units of HDFC-FMP 370 D May 2011 (1)-Growth Nil (15,651,410) Units of DSP- Black Rock FMP-12M Series 19-Growth Nil (9,296,272) Units of ICICI Prudential Quarterly Int Fund II Inst Growth 10,000,000 (10,000,000) Units of HDFC-FMP 392D March2012(2)G -Growth Option 10,000,000 (10,000,000) Units of ICICI Prudential FMP-Series 63 - 384 Days Plan A cumulative Nil (10,000,000) Units of ICICI Prudential FMP -Series 62-1 year Plan G 8,352,893 (Nil) Units of ICICI Prudential Long Term Plan -Premium plus -Cumulative 7,885,875 (Nil) Units of DWF -Guilt Fund -Regular -Growth 12,011,280 (Nil) Units of ICICI Prudential Blended Plan B -Regular -Growth 4,369,083 (Nil) Units of HDFC-High Interest Fund STP-Growth Option 7,223,450 (Nil) Units of IDFC -Dynamic Bond Fund-Regular Plan -Growth 10,215,460 (Nil) Units of Birla Sun Life Dynamic Bond Fund-Retail Growth 7,783,555 (Nil) Units of ICICI Prudential Dynamic Bond Fund -Regular -Growth 10,000,000 (Nil) Units of ICICI Prudential FMP Series 66 420 days Plan A -Regular -Growth 5,000,000 (Nil) Units of Reliance Fixed horizon Fund XXIII series I -.Growth 10,000,000 (Nil) Units of HDFC-FMP 371D Feb2013(2)R -Growth Option 10,000,000 (Nil) Units of DSP- Black Rock FMP-12M Series 84-RegGrowth 15,418,720 (Nil) Units of IDFC -Ultra Short Term Fund-Regular Plan -Growth 10,000,000 (Nil) Units of ICICI Prudential FMP Series 66 407 days Plan C -Regular -Growth 10,011,163 (Nil) Units of IDFC -fixed Term Plan Series 9-Regular Plan -Growth 10,000,000 (Nil) Units of DSP- Black Rock FMP- Series 91-12M -Reg-Growth 10,000,000 (Nil) Units of ICICI Prudential FMP Series 67 371 days Plan E -Regular -Growth 5,026,464 (Nil) Units of HDFC-Floating Rate interest Fund-STP -Wholesale option -Growth Deposits HDFC Limited TOTAL As at 31st March 2013 As at 31st March 2012 10.00 10.00 30.19 100.00 29.99 150.00 162.66 156.51 100.00 100.00 100.00 100.00 100.00 100.00 205.99 100.00 100.00 200.00 100.00 100.00 50.00 100.00 100.00 250.00 100.00 100.11 100.00 100.00 100.00 100.00 - 600.00 2,846.29 909.16 ( in million) 17 Inventories (valued at lower of cost and net realizable value) (As taken, valued and certified by the management) Raw Materials and Packing Materials (Including Goods in Transit: 114.96 million ( 72.53 million) Work-in-Progress (Including Goods in Transit: 21.64 million ( 13.09 million) Finished Goods (Including Goods in Transit: 318.91 million ( 250.51 million) Stock in Trade (Including Goods in Transit: 30.76 million ( 19.22 million) Consumable Stores and Spares TOTAL As at 31st March 2013 As at 31st March 2012 1,663.05 1486.85 396.61 342.77 2,539.09 2,236.10 609.32 447.98 27.64 27.63 5,235.71 4,541.33 ( in million) 18 Trade Receivables As at 31st March 2013 As at 31st March 2012 Considered good 279.44 208.71 Considered Doubtful 202.12 173.37 481.56 382.08 202.12 173.37 Unsecured, unless otherwise stated Outstanding for period exceeding six months from the date they are due for payment Less: Provision for Doubtful Receivables 279.44 208.71 Other Trade Receivables 4,025.50 3,743.15 TOTAL 4,304.94 3,951.86 ( in million) 19 Cash and Bank Balances As at 31st March 2013 As at 31st March 2012 2.46 2.89 352.87 119.08 Cash and Cash Equivalents Cash on Hand Cheques on Hand Remittances in Transit Balance in Current Accounts (Refer Note a.) Fixed Deposit with original maturity of less than 3 months TOTAL 0.08 0.26 282.89 645.95 20.93 0.50 659.23 768.68 2.79 2.79 832.82 1,949.76 11.31 10.69 In Fixed Deposit Accounts with original maturity of more than 12 months (Refer Note b.) In Fixed Deposit Accounts with original maturity for more than 3 months but less than 12 months Dividend Payment Bank Account TOTAL a. Balance with banks in Current Account includes debit balance of Cash Credit Accounts amounting to 87.16 million ( 4.63 million) (Refer Note 7a.) b. Balance with banks in Fixed Deposit Account includes Fixed Deposit against Bank Guarantees 46.57 million ( 7.97 million). 846.92 1,963.24 1,506.15 2,731.92 P I D I L I T E A N N UA L R E P O R T 2 01 2 -13 Other Bank Balance 91 ( in million) 20 Short Term Loans and Advances As at 31st March 2013 As at 31st March 2012 11.86 14.02 467.57 543.23 - 189.11 Prepaid Expenses 62.21 45.84 Balances with Central Excise Department 95.06 136.23 Loans and Advances to Staff 27.73 25.50 664.43 953.93 Unsecured, unless otherwise stated Security deposit Advances recoverable in cash or in kind or for value to be received Other loans and advances MAT Credit Entitlement TOTAL ( in million) 21 Other Current Assets As at 31st March 2013 As at 31st March 2012 Advance Payment of Taxes & MAT credit utilised (Net of Provisions) 38.13 48.64 Interest Receivable 39.06 26.23 4.13 - 31.33 23.58 112.65 98.45 Unsecured, unless otherwise stated Deferred Premium on Forward Contract Other Receivables* TOTAL * These figures include Export Benefits Receivables ( in million) 22 Revenue From Operations (Gross) 31st March 2013 31st March 2012 36,748.72 30,800.68 2,028.62 1,880.28 120.37 72.20 Cash Discount Received 17.45 21.27 Export Incentives 63.84 74.87 38,979.00 32,849.30 Revenue From Operations Sale of Products Finished Goods Traded Goods Other Operating Revenue Scrap Sales TOTAL ( in million) 23 Other Income 31st March 2013 31st March 2012 211.69 75.88 12.93 18.99 Current Investments 0.75 10.17 Non Current Investments 5.72 5.08 Net gain on sale of Current Investments 152.54 142.74 Other Non-Operating Income* 321.02 181.82 TOTAL 704.65 434.68 Interest on: Bank Deposit Others Dividend on: * Other non-operating income includes Windmill Income 30. 68 million ( 26.28 million) ( in million) 24 Cost of Materials 31st March 2013 Inventory at the beginning of the year 31st March 2012 1,486.85 1,375.10 Add: Purchases 18,616.44 16,119.88 Less: Inventory at the end of the year 20,103.29 1,663.05 17,494.98 1,486.85 TOTAL 18,440.24 16,008.13 ( in million) 25 Change in Inventories of Finished Goods, Work in Progress and Stock in Trade 31st March 2013 31st March 2012 609.32 447.98 Inventories at end of the year Stock in Trade Work-in-Progress Finished Goods 397.22 342.77 2,538.47 2,236.10 3,545.01 3,026.85 447.98 396.66 Inventories at beginning of the year Stock in Trade Work-in-Progress Finished Goods TOTAL 342.77 339.28 2,236.10 1,953.52 3,026.85 2,689.46 (518.16) (337.39) Salaries, Wages, Bonus and other Allowances Contribution to Provident and Other Funds Gratuity expenses Staff welfare expenses TOTAL 31st March 2013 31st March 2012 3,431.13 2,979.68 172.00 156.69 35.30 34.08 107.36 91.84 3,745.79 3,262.29 P I D I L I T E A N N UA L R E P O R T 2 01 2 -13 ( in million) 26 Employee Benefits Expense 93 ( in million) 27 Depreciation and Amortization Expense Depreciation on Tangible Assets 31st March 2013 31st March 2012 550.37 495.23 Amortisation of Intangible Assets 135.44 142.02 TOTAL 685.81 637.25 ( in million) 28 Finance Cost Interest Other Borrowing Cost TOTAL 31st March 2013 31st March 2012 154.18 259.00 59.64 48.18 213.82 307.18 ( in million) 29 Other Expenses Consumption of Stores and Spares Clearing, Forwarding and Octroi Duty Power and Fuel Water Charges 31st March 2013 31st March 2012 120.73 121.86 1,723.56 1,492.19 398.10 318.27 25.05 22.99 259.12 218.73 Rates and Taxes 52.38 20.54 Insurance 35.36 33.14 2.71 3.09 Rent License fees Repairs: Buildings 23.39 Machinery 81.45 65.19 Others 36.70 36.26 Directors' Fees Advertisement and Publicity Legal, Professional and Consultancy fees 33.11 141.54 134.56 3.48 3.15 1,472.50 1,074.31 277.63 243.47 Communication Expenses 75.21 75.35 Printing and Stationery 49.67 42.72 591.02 457.27 Travelling and Conveyance Expenses Bad Debts 16.02 7.03 Provision for Doubtful Debts 39.53 56.69 Processing and Packing Charges 530.15 443.93 Commission and Brokerage 146.23 130.25 Payment to Auditors (Refer Note 35) 10.53 10.94 Donations 62.85 55.21 Loss on Fixed Assets Sold / Discarded (Net) Foreign Exchange Fluctuation (Net) Diminution in value of Investments Miscellaneous expenses TOTAL 3.75 15.94 15.37 89.80 - 0.22 911.86 692.13 6,964.35 5,763.78 ( in million) 30 Exceptional Items (net) As at 31st March 2013 As at 31st March 2012 (106.82) - Provision for Diminution in value of investment (5.68) - Provision for impairment of goodwill 94.20 - (18.30) - Gain on prepayment of sales tax deferral loan TOTAL ( in million) 31 Contingent Liabilities As at 31st March 2013 As at 31st March 2012 i. Guarantees given by Banks in favour of Government and others 278.52 75.79 ii. Unexpired Letter of Credit 217.44 - 399.53 363.53 5.26 62.68 - 3.29 iii. Disputed liabilities in respect of Income Tax, Sales Tax, Central Excise and Customs (under appeal) iii. Claims against the Company not acknowledged as debts. iv. Other Money for which the Company is contingently liable P I D I L I T E A N N UA L R E P O R T 2 01 2 -13 Contingent liabilities not provided for: 95 32 Segment information Business Segment: The Company is operating into three business segments: Consumer & Bazaar Products, Industrial Products and Others. This segmentation is based around customers. Consumer & Bazaar Products consist of mainly Adhesives, Sealants, Art Materials and Construction Chemicals. Industrial Products consists of Organic Pigments, Industrial Resins and Industrial Adhesives. Others consist of VAM manufacturing unit of Vinyl Chemicals (India) Ltd demerged into the Company wef 1st April 2007. ( in million) Business Segments REVENUE External Sales Inter Segment Revenue (at cost plus 10%) Total Revenue Segment Profits Consumer & Bazaar Products Industrial Products Others Total 30,176.98 (25,234.50) 27.93 (24.04) 30,204.91 (25,258.54) 6,082.04 (4,653.32) 6,204.04 (5,718.07) 877.85 (686.88) 7,081.89 (6,404.95) 807.09 (806.05) 198.42 (144.78) 0.02 198.44 (144.78) (97.00) ((107.83)) 36,579.44 (31,097.35) 905.80 (710.92) 37,485.24 (31,808.27) 6,792.13 (5,351.54) 1,754.29 (1,535.22) 698.42 (488.74) 5,736.26 (4,475.51) 154.18 (259.00) 231.09 (110.12) 5,813.17 (4,326.63) 1,595.11 (1,100.27) 4,218.06 (3,226.36) 11,396.48 (10,488.49) 3,341.67 (3,001.37) 451.03 (441.03) 6,525.37 (4,191.56) 1,021.43 (1,032.97) 10.29 (8.29) 621.24 (661.36) 235.92 (106.64) 47.72 (30.82) 659.40 (522.65) 95.05 (88.12) 25.56 (26.48) 15,189.18 (13,930.89) 10,563.11 (9,712.18) 25,752.29 (23,643.07) 7,557.09 (5,232.82) 1,670.31 (5,199.17) 9,227.40 (10,431.99) 16,524.89 (13,211.08) 904.88 (798.82) 502.91 (815.38) 780.01 (637.25) Unallocated Corporate Expenses Unallocated Corporate Income Operating Profit Interest Expenses Interest / Dividend Income Net Profit before Tax Income Tax (Provision for Taxation and Deferred taxation) Net Profit after Tax Other Information Segment Assets Unallocated Corporate Assets Total assets Segment Liabilities Unallocated Corporate Liabilities Total liabilities Capital Employed Capital expenditure (including Capital Work in Progress) Unallocated Corporate Capital Expenditure Depreciation/ Impairment of Goodwill ( in million) Geographical Segments Sales Revenue Carrying amount of Segment Assets India Other Countries TOTAL 29,676.71 6,902.73 36,579.44 (25,197.03) (5,900.32) (31,097.35) 24,775.38 976.90 25,752.28 (22,489.05) (1,154.02) (23,643.07) 1,289.50 118.30 1,407.79 (1,499.33) (114.87) (1,614.20) Additions to fixed Assets and Intangible Assets 33 Earnings per share (EPS) The following reflects the Profit and Share data used in the basic and diluted EPS computations: ( in million) 31st March 2013 31st March 2012 Profit after tax 4,239.75 3,243.71 Net profit for calculation of EPS 4,239.75 3,243.71 No. in million No. in million 509.78 507.65 - 12.93 509.78 520.58 Basic EPS 8.32 6.39 Diluted EPS 8.32 6.23 Total Operations for the year Weighted average number of equity shares in calculating basic EPS Convertible bonds Weighted average number of equity shares in calculating diluted EPS P I D I L I T E A N N UA L R E P O R T 2 01 2 -13 Effect of dilution: 97 34 Related Party Disclosures Related Party Disclosures as required by AS -18, “Related Party Disclosures”, are given below: i) ii) Relationships: a. Vinyl Chemicals (India) Ltd. Substantial Interest in Voting Power (Associate) b. Kalva Marketing and Services Ltd. Significant Influence c. Parekh Marketing Ltd. Significant Influence Key Management Personnel: Sarva Shri M B Parekh - Chairman & Managing Director, N K Parekh - Jt Managing Director, A B Parekh and A N Parekh - Whole Time Directors, Shri R Sreeram - Whole Time Director iii) Relatives of Key Management Personnel: Sarva Shri S K Parekh and Smt Mala M Parekh ( in million) Transactions with Related Parties for the period ended 31st March 2013 are as follows: Nature of Transaction a b c d Sales and Related Income Purchases and Other Related Services Remuneration to Directors: - Managing Director / Jt Managing Director f g h I j k Investment in Share Capital Loans Given / (repayment of loan received) Purchase of Fixed Assets Sale of Fixed Assets Interest Paid / (Received) Reimbursement of expenses made Reimbursement of expenses received Parekh Marketing Ltd 637.22 (588.49) 0.42 (0.44) NIL (0.10) Other Income - Whole Time Directors e Remuneration to Directors Vinyl Chemicals (India) Ltd NIL (NIL) NIL (1.35) 2048.14 (1775.87) Total 637.22 (588.49) 0.42 (1.79) 2,048.14 (1,775.97) 168.79 (130.68) 75.62 (59.18) 168.79 (130.68) 75.62 (59.18) NIL (NIL) NIL (NIL) NIL (NIL) NIL (NIL) NIL (NIL) 0.08 (NIL) 0.26 (0.23) NIL (NIL) NIL (NIL) NIL (NIL) NIL (NIL) NIL (NIL) NIL (0.75) 0.88 (NIL) 0.08 (0.75) 1.14 (0.23) l Provision For Doubtful Debts Made - m Bad Debts Written Off - n Diminution in value of Investment - o Outstanding Balances: - Debtors - Creditors - Net Outstanding Receivable/(Payable) 122.88 (95.13) NIL (0.06) 122.88 (95.07) 0.96 (1.23) 177.82 (196.18) (176.86) ((194.95)) 123.84 (96.36) 177.82 (196.24) (53.98) ((99.88)) 35 Details of Payment to Auditor ( in million) As at 31st March 2013 As at 31st March 2012 8.85 2.47 Limited Review 1.01 0.99 Certification Fees 0.65 7.46 Audit fees Reimbursement of expenses TOTAL 0.02 0.02 10.53 10.94 36 In case of Associate where the company directly or indirectly through subsidiaries holds more than 20% of the equity, investment in associate is accounted for using Equity method in accordance with Accounting Standard AS-23 -Accounting for Investment in Associates in consolidated financial statement issued by the Institute of Chartered Accountants of India. The Associate Company considered in the financial statements is Vinyl Chemicals (India) Ltd. 37 38 Country of Incorporation Proportion of Ownership Interest India 40.64% In Pulvitec do Brasil Industria e Commercio de Colas e Adesivos Ltda, the Company conducted certain investigations over the fraudulent activities, and identified transactions which were not related to the Company’s operations, amounting to 14.38 million. The Company is filing a law suit against the former employee in order to receive back the amounts deviated. In the opinion of the mangement, all assets other than fixed assets and non-current investments have a realisable value in the ordinary course of business at least equal to the amount at which they are stated in the Balance Sheet. 39 Figures in bracket indicate previous year’s figures. P I D I L I T E A N N UA L R E P O R T 2 01 2 -13 40 Previous year’s figures have been regrouped / rearranged wherever necessary. 99 Consolidated Cash Flow Statement For The Year Ended 31st March 2013 ( in million) 31 March 2013 31 March 2012 5813.17 4326.63 st A st CASH FLOW FROM OPERATING ACTIVITIES Profit before tax from continuing operations Non-cash adjustment to reconcile profit before tax to net cash flows Depreciation/ amortization on continuing operation 637.25 780.01 (Reversal)/ Additional Provision for Diminution in value of Investments (5.68) 0.22 Interest expense 154.18 259.00 Dividend income (6.47) (15.25) Interest income (224.62) (94.87) (Profit) / Loss on Sale of Investment (152.54) (142.74) 3.75 15.94 (11.92) 66.40 69.48 138.46 Provision for long term employee benefits 43.10 16.40 Bad debts w/off / provision for doubtful debts 55.55 63.72 (Profit) / Loss on Sale of Assets Unrealized Foreign exchange loss / ( Gain) Increase in foreign currency translation reserve Operating Profit before Working Capital changes 704.84 944.53 6518.01 5271.16 Movements in working capital: Increase/ (decrease) in trade payables Increase/ (decrease) in short-term provisions Increase/ (decrease) in other current liabilities 443.36 326.39 16.52 (7.26) 557.49 336.00 Decrease/ (increase) in inventories (694.38) (449.30) Decrease/ (increase) in trade receivables (408.63) (555.10) (8.00) (5.71) Decrease/ (increase) in short-term loans and advances 100.39 (305.99) Decrease/ (increase) in other current assets (24.70) (9.00) 9.49 (0.49) Decrease/ (increase) in long-term loans and advances Decrease/ (increase) in other non-current assets (670.46) (8.46) Cash generated from/ (used in) operations Direct taxes paid (net of refunds) Net Cash flows from/ (used in) Operating Activities (A) B 6509.55 4600.70 (1334.46) (930.54) 5175.09 3670.16 Cash flow from investing activities Purchase of Fixed Assets including intangible assets, CWIP (1557.93) (1563.61) Proceeds from sale of Fixed Assets 98.29 10.01 (Increase)/decrease in capital advances 16.41 (66.31) (17236.64) (12337.86) 15442.46 13222.44 1,116.32 (1,760.57) 224.62 94.87 6.47 15.25 Purchase of Investments (current & non-current) Proceeds from sale/ maturity of current Investments (Increase)/decrease in bank deposits (having maturity of more than 3 months) Interest received Dividend received Net Cash flows from/(used in) Investing Activities (B) (1890.00) (2385.78) Consolidated Cash Flow Statement For The Year Ended 31st March 2013 ( in million) 31 March 2013 st C 31 March 2012 st CASH FLOW FROM FINANCING ACTIVITIES (Repayment) / Increase of long term borrowings (922.97) (1686.22) (Decrease) / Increase in current maturity of long term borrowings (623.55) 1477.66 (49.87) 60.21 (Decrease) / Increase in Short term Borrowings Interest Paid Dividend paid (Including Dividend Tax, where applicable) (677.90) (171.67) (1120.25) (1030.13) Net Cash Flows from/ (used in) Financing Activities (C) Net Increase/(decrease) in Cash and Cash Equivalents (A+B+C) (3394.54) (1350.15) (109.45) (65.77) Cash and Cash Equivalents at the beginning of the year 768.68 834.45 Cash and Cash Equivalents at the end of the year 659.23 768.68 (109.45) (65.77) 31st March 2013 31st March 2012 2.46 2.89 352.87 119.08 0.08 0.26 282.89 645.95 Cash and cash Equivalents includes: Cash on Hand Cheques on Hand Remittances in Transit Bank Balances: With Scheduled Banks: In Current Accounts Fixed Deposits with original maturities of less than 3 months 20.93 0.50 659.23 768.68 The accompanying notes are an integral part of the financial statements AS PER OUR ATTACHED REPORT OF EVEN DATE For Haribhakti & Co. Chartered Accountants FRN 103523W FOR AND ON BEHALF OF THE BOARD M B PAREKH Chairman & Managing Director CHETAN DESAI S K PAREKH Vice Chairman Partner Membership No. 17000 SAVITHRI PAREKH Company Secretary P I D I L I T E A N N UA L R E P O R T 2 01 2 -13 Place: Mumbai Date: 28th May 2013 101 Information on Subsidiary Companies (As directed by Central Government Order under Section 212(8) of the Companies Act, 1956) 1 Currency Indian 2 Capital Foreign Currency Indian in million 3 (includes Share application Money) Reserves Foreign Currency Indian in million 4 Total Assets Total Liabilities 6 7 8 0.33 Foreign Currency Pidilite USA Inc* PT Pidilite Indonesia* Pidilite Bamco Ltd.* Pidilite Speciality Chemicals Bangladesh Pvt Ltd.* Jupiter Chemicals (L.L.C.)* AED AED Taka Baht IDR US Dollars 19,633,274 36,202,712 300,000 352,694,638 35,000,000 9,224,238,238 14,780,000 1,065.69 536.65 4.45 246.11 64.79 51.41 802.26 (2,006,019) (22,434,365) (25,429,812) 37,529,168 (868,675) (5,855,654,930) (5,564,964) (108.89) (332.55) (376.96) 26.19 (1.61) (32.63) (302.07) 17,664,993 35,837,642 16,492,779 434,807,600 79,877,942 3,804,110,973 18,463,479 958.86 531.24 244.48 303.41 147.86 21.20 1,002.20 37,739 22,069,295 41,622,590 44,583,794 45,746,617 435,527,665 9,248,444 - 2.05 327.14 616.99 31.11 84.68 2.43 502.01 Investments Foreign Currency - - - - - - - - (except in case of subsidiaries) Indian in million - - - - - - - - Turnover & Other Income Foreign Currency - 342,210 18 6,594,440 331,299,364 170,884,624 1,443,842,808 29,549,088 Indian in million 0.02 18.58 - 97.75 231.18 316.33 8.05 1,603.92 186,353 (62,192) (2,317,703) 21,294,386 5,529,309 (329,786,929) (217,026) 10.12 (0.92) (34.36) 14.86 10.24 (1.84) (11.78) 24,753 - - 2,638,643 796,685 (13,967,267) 31,034 Foreign Currency Indian in million 0.01 Provision For Tax Foreign Currency 10 US Dollars Indian in million Profit/(Loss) Before Taxation 9 (0.17) Foreign Currency Indian in million 5 0.50 Pidilite Middle East Ltd.* Fevicol Company Ltd. Pidilite International Pte Ltd.* Names of the subsidiaries (including Deffered Tax) Indian in million 1.34 - - 1.84 1.47 (0.08) 1.68 Profit/(Loss) After Taxation Foreign Currency 161,600 (62,192) (2,317,703) 18,655,743 4,732,624 (315,819,662) (248,060) 11 Proposed Dividend 12 Exchange Rate as on 31st March 2013 Indian in million 0.01 8.77 (0.92) (34.36) 13.02 8.76 (1.76) (13.46) Foreign Currency - - - - - - - - Indian in million - - - - - - - - - 54.28 14.82 14.82 0.70 1.85 0.0056 54.28 *Financial statements of these Foreign Subsidiaries have been converted in to Indian Rupees at rates prevailing as on 31st March 2013. Information on Subsidiary Companies (As directed by Central Government Order under Section 212(8) of the Companies Act, 1956) 2 Capital 3 4 5 6 7 8 9 10 11 12 Foreign Currency 995,155 (includes Share Indian application Money) in million 43.50 Reserves Foreign Currency (437,311) Indian in million (19.11) Foreign Currency 935,565 Indian in million 40.89 Foreign Currency 377,721 Indian in million 16.51 Investments Foreign Currency - (except in case of subsidiaries) Indian in million - Turnover & Other Income Foreign Currency 1,836,399 Indian in million 80.27 Foreign Currency 129,809 Indian in million 5.67 Total Assets Total Liabilities Profit/(Loss) Before Taxation 0.10 23.30 23.40 - 23.37 0.10 23.31 23.41 - 23.39 3.04 3.06 3.04 Brazilian Reais Baht EGP RMB 32,144,394 46,132,998 1,000,000 5,440,000 958,005 257.65 1,245.82 1.85 43.60 8.37 (13,498,493) (36,766,219) 8,259,976 (5,053,603) 87,668 (108.20) (992.87) 15.29 (40.51) 0.77 27,847,226 24,330,665 15,749,957 4,065,381 1,062,333 223.21 657.05 29.15 32.59 9.28 9,201,325 14,963,886 6,489,981 3,678,984 16,660 73.75 404.10 12.01 29.49 0.15 - - - - - - - - - - 46,778,841 25,581,667 6,197,933 2,238,338 146.47 1,263.26 47.35 49.68 19.55 (1,912,861) (15,396,320) 3,387,662 (289,604) 126,620 (15.33) (415.78) 6.27 (2.32) 1.11 (17,972) - 670,052 - - (0.14) - 1.24 - - (1,894,889) (15,396,320) 2,717,610 (289,604) 126,620 Building Envelope Systems India Ltd. Pagel Concrete Technologies Pvt Ltd. Pidilite Industries Trading (Shanghai) Co. Ltd.* PIL Trading (Egypt) L.L.C.* EGP 18,273,557 3.06 Bamco Supply and Services Limited* Pidilite Industries Egypt - SAE* Singapore Indian Indian Dollars Indian Indian 1.00 0.50 (4.20) (0.21) 0.05 0.38 3.26 0.09 0.03 - 0.01 - (0.02) (0.21) - - Provision For Tax Foreign Currency (including Deffered Tax) Indian in million - Profit/(Loss) After Taxation Foreign Currency 129,809 Indian in million 5.67 3.04 3.04 (15.19) (415.78) 5.03 (2.32) 1.11 (0.02) (0.21) Proposed Dividend Foreign Currency - - - - - - - - - - Indian in million - - - - - - - - - - 43.71 - - 8.02 27.00 1.85 8.02 8.74 - - Exchange Rate as on 31st March 2013 - - *Financial statements of these Foreign Subsidiaries have been converted in to Indian Rupees at rates prevailing as on 31st March 2013. P I D I L I T E A N N UA L R E P O R T 2 01 2 -13 Currency Bhimad Commercial Co Pvt Ltd. Madhumala Traders Pvt Ltd. Pidilite Innovation Centre Pte Ltd.* 1 Pulvitec do Brasil Industria e Commercio de Colas e Adesivos Ltda* Names of the subsidiaries 103 just a stroll Niranjan Bhagat But I am out here for just a stroll! Not on an errand, yours or mine, at all! Sweet is the breeze on this wide way, Lovely are faces, ever new, that flash by! To go back home now? – Not I. I am here to walk my seven steps And in streams of dreams happily to roll. I am here just for a stroll. Some magic charm if I could have, And for a little while if I could love, And just a few tunes if I could hum, I would sing a song of my sweet love For this our entire earth; – that’s all. For I am here just for a stroll. This poem refers to our life which is a transient journey through this world. It tells us in simple and sincere words of joy of ‘being here’, of living, loving and giving to others in the world.
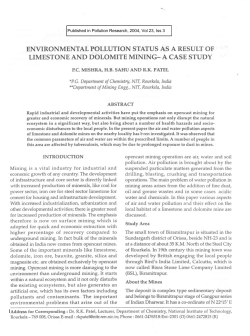


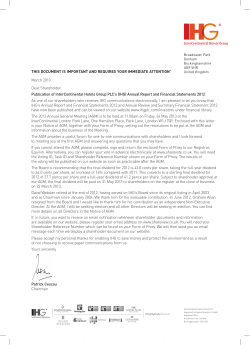


© Copyright 2026