
San Diego: Retreat from Capitation Raises Cost Concerns Health Care Almanac california
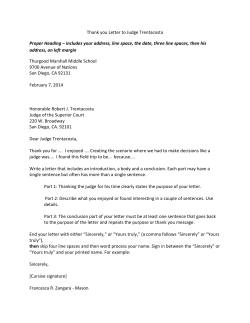
C A L I FOR N I A
H EALTH C ARE
F OU NDATION
california
Health Care Almanac
regional markets issue brief
July 2009
San Diego: Retreat from Capitation Raises Cost Concerns
San Diego Market Background
Geographically, San Diego is bordered by Mexico to the
San Diego County had a total population of approximately
south, the Pacific Ocean to the west, Marine Corps-base
3 million in 2007, or 8 percent of the state’s population (see
Camp Pendleton to the north and the desert to the east,
Table 1 on page 2). Population growth over the past ten years
which results in a relatively self-contained market area. These
has been steady but somewhat slower than for California
geographic boundaries have a significant influence on the
as a whole (9 percent versus 14 percent statewide). The
configuration of the health care system and how health care
proportion of the population in San Diego that is 65 years
providers collaborate and compete.
and older (11 percent) is consistent with the state average,
while the white, non-Latino population is higher than the
Hospitals Emphasize Distinctiveness
state average (54 versus 43 percent).
The San Diego hospital market is relatively stable after going
The percentage of San Diego households with incomes
through a tumultuous period of closure and consolidation
above $50,000 is moderately higher than the state average
in the 1990s. Sharp and Scripps are the largest hospital
(57 versus 51 percent), and the population lacking health
systems in San Diego. Each operates multiple hospitals
insurance (13 percent) is comparable to that of the state as a
and has approximately 25 percent of the inpatient market.
whole. Residents in the northern area of the county, such as
The University of California San Diego Medical Center
La Jolla, tend to have higher incomes and are more likely to
(UCSD) has two hospitals and Kaiser has one hospital, and
have health insurance, while residents in the south, such as
each system has approximately 10 percent of the market.
the Chula Vista and National City areas, are more likely to
Together, some respondents characterized these four hospital
be uninsured and have lower incomes.
systems as San Diego’s “four, 200-pound gorillas.” Other
A striking feature of San Diego is the large role that
important providers of inpatient services include Palomar
public employers play in the local economy. Seven of the
Pomerado Health (PPH), a government healthcare district
ten largest employers are public entities, including the U.S.
which operates two hospitals in North County, north of the
Navy, federal government, state government, University of
immediate San Diego metropolitan market area; and Rady
California, San Diego Unified School District, city of San
Children’s Hospital, the market’s major provider of inpatient
Diego, and county of San Diego. The large hospital systems
pediatric care.2
in San Diego, including Sharp HealthCare (Sharp), Scripps
With some exceptions, San Diego’s hospitals are not-for-
Health (Scripps), and Kaiser Permanente (Kaiser) round
profit entities. Tri-City Medical Center and Sharp Grossmont
out the remaining ten largest employers.1 In January 2009,
Hospital are government district hospitals (the Grossmont
San Diego’s unemployment rate reached 8.6 percent — lower
Healthcare District leases the hospital to Sharp). For-profit
than the state average of 10.6 percent but markedly higher
hospitals in San Diego generally are smaller and include
than San Diego’s January 2008 rate of 5.1 percent.
Alvarado Hospital Medical Center, Fallbrook Hospital, and
Paradise Valley Hospital; all three have changed
Table 1. Demographic and Health System Characteristics: San Diego County vs. California
San Diego
California
2,974,859
36,553,215
Population growth, 1997–2007
9.2%
13.6%
Population growth, 2002–2007
2.3%
4.1%
Population Statistics
ownership in the past several years. There is no
Total population
public, county-operated hospital in San Diego,
but UCSD is state-owned; its Hillcrest facility
was formerly a county-owned hospital and still
serves as a major safety-net provider.
Hospitals in San Diego both cooperate and
compete. As one hospital executive noted, “You
age of Population
Persons under 5 years old
7.4%
7.3%
Persons under 18 years old
26.7%
26.9%
Persons 18 to 64 years old
62.7%
62.5%
Persons 65 years and older
10.6%
10.6%
53.7%
43.3%
Race/Ethnicit y
White non-Latino
see more collaboration than aggressive breaking
African American non-Latino
of knees. We have learned to work together
Latino
because we are closed in [geographically].”
For instance, Sharp collaborates with UCSD
by providing some specialists with admitting
privileges at Sharp hospitals, and the two
systems have collaborated on a bone marrow
transplant program. In North County,
respondents said a dearth of inpatient capacity
prompts collaboration among hospitals rather
than aggressive competition.
Respondents characterized hospital
competition as stable overall, with hospitals
trying to distinguish themselves primarily in
terms of high quality and patient satisfaction.
As one hospital executive said, “I think we
are all working hard to differentiate in terms
Asian non-Latino
Other race non-Latino
5.3%
5.8%
29.0%
36.1%
8.7%
11.8%
3.3%
3.1%
Foreign-born
20.3%
25.7%
Limited/no English, adults
26.1%
35.2%
High school degree or higher
87.6%
82.9%
College degree or higher
40.6%
35.7%
12.3%
15.8%
Education, adults 25 and older
Health Status
Fair/poor health status
Diabetes
6.3%
7.8%
Asthma
12.8%
13.6%
6.4%
6.3%
Below 100% federal poverty level
11.0%
15.7%
Below 200% federal poverty level
26.4%
33.5%
Household income above $50,000
56.7%
51.1%
Unemployment rate, January 2009
8.6%
10.6%
63.9%
59.1%
Heart disease, adults
Economic Indicators
Health Insurance, All Ages
Private insurance
Medicare
8.8%
8.5%
Medi-Cal and other public programs
14.9%
19.3%
Uninsured
12.5%
13.2%
Supply of Health Professionals, 2008
of [patients’] service and experience.” These
Physicians per 100,000 population
187
174
strategies are manifest, for example, in Sharp’s
Primary care physicians per 100,000 population
60
59
Dentists per 100,000 population
70
69
171
182
Hospital concentration, 2006 (Herfindahl index)
1,468
1,380
Operating margin including net Disproportionate Share Hospital payments
5.3%
1.2%
67.4%
59.0%
4.4
4.5
“The Sharp Experience” slogan and UCSD’s
mission of “clinical excellence through service,
innovation and education.” Sharp’s receipt
Hospitals
Staffed community, acute care hospital beds per 100,000 population, 2006
of the prestigious national Malcolm Baldrige
Occupancy rate for licensed beds
award for quality in 2007 has helped the system
Average length of stay (days)
emphasize its distinctiveness, as has UCSD’s
designation as a National Cancer Institute
center of excellence.
Strategically, hospitals also are re-examining
service capabilities, motivated by a belief that
Paid full-time equivalents per 1000 adjusted patient days
Total operating expense per adjusted patient day
14.9
15.7
$2,182
$2,376
Notes: All estimates pertain to 2007 unless otherwise noted.
Sources: U.S. Census Bureau, Population Estimates, 2007; California Health Interview Survey, 2007; State of California Employment Development
Department, Labor Market Information Division, “Monthly Labor Force Data for Counties: January 2009 — Preliminary, March 2008 Benchmark,”
March 5, 2009; California HealthCare Foundation, “Fewer and More Specialized: A New Assessment of Physician Supply in California,” June
2009; UCLA Center for Health Policy Research, “Distribution and Characteristics of Dentists Licensed to Practice in California, 2008,” May 2009;
American Hospital Association Annual Survey Database, Fiscal Year 2006; California Office of Statewide Health Planning and Development,
Healthcare Information Division — Annual Financial Data, 2007.
they can no longer afford to be “everything
2
©2009 California HealthCare Foundation
for everyone with the latest of everything for everybody,”
replacing beds and expanding emergency department (ED)
as one respondent put it. Instead, some hospitals are trying
and operating room capacity. The Grossmont Healthcare
to identify service niches on which to focus and excel. For
District passed a $247 million bond issue to fund
instance, UCSD emphasizes its academic medical center
construction of a new patient tower and other renovations
niche of highly specialized tertiary and quaternary services.
at Sharp Grossmont Hospital. Scripps plans to spend more
Scripps focuses on cardiology and cancer care systemwide,
than $1 billion on construction projects across its hospitals,
while Scripps Mercy’s San Diego campus stresses trauma care.
including $500 million for a new cardiovascular hospital on
Sharp emphasizes the advantages of an integrated delivery
its La Jolla campus. And construction plans for UCSD total
system with a full continuum of services and views Kaiser’s
more than $500 million for expansions and other projects
integrated delivery system as its main competitor.
at its Hillcrest and La Jolla facilities. With funding raised
through a bond issue, PPH expects to spend more than
Overall, the competition spurred by Kaiser in San Diego
is somewhat nuanced. A Sharp respondent summarized
$1 billion on new construction, including the development
Kaiser’s influence by saying, “It’s what drives Sharp and
of a third hospital campus scheduled to open in 2011. Some
potentially Scripps around staying integrated. If it weren’t for
respondents suggested that the major systems have often
Kaiser, it would be one more reason why we should move to
focused expansion efforts in areas where the population is
fee for service. Keeping the full-risk contract does help keep
well insured (La Jolla, for example) to generate the revenues
the contract [costs] lower for employers.” Similar to some
needed to subsidize losses incurred by hospitals serving large
other California markets, Kaiser outsources certain services to
numbers of Medi-Cal and uninsured patients.
Some hospitals — particularly smaller hospitals in the
other hospitals. For example, Kaiser contracts with PPH to
provide services to North County members; it also uses other
market — have found it difficult to access the capital needed
hospitals throughout the market to provide certain specialty
to finance construction. Tri-City Medical Center, governed
services such as cardiac and orthopedic surgery.
by the Tri-City Healthcare District, for instance, has failed
three times to pass a bond issue to fund construction projects
Hospital Construction Abounds
to meet state seismic requirements. In April 2009, the
Respondents generally agreed that San Diego is “under-
hospital was informed by the state that it could continue
bedded” because of declining capacity over the years coupled
to operate one of its patient care towers until 2030 without
with the area’s steady population growth. The number of
seismic retrofitting, based on computer modeling that
acute care beds per 100,000 in San Diego is 171 compared
reclassified the building’s earthquake risk; the compliance
with a state average of 182. Moreover, San Diego’s 67 percent
deadline for the district’s other hospital facilities remains
occupancy rate is considerably higher than the 59 percent for
unchanged.3 Respondents noted that hospitals’ difficulty
the state overall. As described by one hospital executive, “If
accessing funds for construction has only worsened with the
someone said, ‘I’ll hand you 15 percent of our market share,’
economic downturn and may potentially delay some planned
our response operationally would be ‘Where would I put it?’”
projects.
Most hospitals are engaged in or planning new
Generally, hospitals in San Diego are profitable, but
construction projects to expand capacity and meet
some are poorer-performing than others. Hospitals in the
California’s seismic standards, a significant issue for San
southern part of the market are generally in worse financial
Diego hospitals. In January 2009, for example, a new $200
condition because they serve more Medi-Cal and uninsured
million patient tower opened at Sharp Memorial Hospital,
patients. All hospitals are concerned about a worsening
3
©2009 California HealthCare Foundation
financial outlook because of the economic downturn and
San Diego health care market, with Scripps dominant in the
are focusing on cost-saving measures. Some hospitals are
north and Sharp in the south.
eliminating certain services such as skilled-nursing facilities,
and redirecting patients presenting at emergency departments
Hospitals and Physicians Tightly Aligned
for non-urgent care to community clinics.
San Diego physicians are tightly aligned with hospitals
through the medical foundation model or professional
Perceived Shortage of Primary Care Physicians
services arrangements.4 Scripps and Sharp use the foundation
Among some respondents, there was a perception that
model to recruit physicians, offering a salaried practice
physicians — particularly primary care physicians — are
platform and lower practice overhead costs. Sharp Rees-Stealy
in short supply in San Diego, with the more rural areas of
Medical Group, one of the oldest practices in San Diego with
the county such as North County most affected. While the
more than 400 physicians, is aligned with Sharp through
number of physicians per 100,000 persons in San Diego
a foundation model. Scripps has a foundation model with
is slightly higher than the state average (187 versus 174),
Scripps Clinic, a multi-specialty group with 400 physicians,
the ratio of primary care physicians per 100,000 persons is
and Scripps Coastal Medical Group, a primary care group
comparable to the state average (60 versus 59). A respondent
with 100 physicians. Kaiser also uses a foundation model
characterized the physician supply issue in the market as
to align with its approximately 1,000 San Diego-based
being “over-specialized and under primary-cared.”
physicians, the same model that it employs throughout the
state. UCSD contracts for the services of the UCSD Medical
Respondents cited the high cost of living in San Diego,
coupled with low reimbursement for Medicare and Medi-
Group, which includes physicians on the UCSD School of
Cal patients, as key obstacles to recruiting physicians to the
Medicine faculty.
Physicians who already have strong affiliations with
market. Independent physicians reportedly are “lucky to
get 100 percent of Medicare in their PPO contracts,” and
independent practice associations (IPAs) or who are members
reimbursement in some PPO contracts was estimated to be
of independent medical groups may be less attracted to
well below Medicare payment rates. Physician payment rates
foundation participation. But even these physicians often
for Medi-Cal patients also are reportedly very low. When
align with and practice at a single hospital. As one hospital
asked if San Diego physicians provide free care, one observer
respondent said, “The doctors tend to affiliate with one main
responded, “That is called Medi-Cal.”
system. They are a Sharp or a Scripps doctor. They tend to
bring patients to one facility, not three or four, because it’s
The physician market is consolidated into large multispecialty groups, with a number of single-specialty groups
hard to manage.” For instance, Sharp Community Medical
also present. Respondents estimated that the majority of San
Group, a multi-specialty IPA with 700 to 800 physicians,
Diego physicians practice in relatively large groups with 20
is affiliated with Sharp through contract; Mercy Physicians
or more physicians. In a recent reshuffling of the physician
Medical Group and Scripps Mercy Physician Partners are
market, Scripps acquired Sharp Mission Park Medical Group,
IPAs that serve Scripps hospitals. Some hospitals that do not
a practice with about 60 physicians in the North County
use foundation models are considering developing them.
Relationships between San Diego hospitals and physicians
area, and merged it with Scripps Mercy Medical Group to
form Scripps Coastal Medical Group. The acquisition took
reportedly are relatively good. Given the consolidated nature
some respondents by surprise, and some commented that
of the physician and hospital markets, one respondent
they saw this as a significant step toward “dividing up” the
observed, “Both sides try to figure out ways to work with
4
©2009 California HealthCare Foundation
Respondents reported that large San Diego employers’
each other.” For example, emergency call coverage historically
has been a source of tension, but hospitals and physicians
health care costs increased about 6 percent last year, with
have developed physician compensation arrangements that
slightly smaller increases expected for 2009. While these
have helped alleviate the problem. The use of hospitalists,
increases are lower than in recent years, the economic
which cover the vast majority of admissions in many
downturn has intensified employer pressure on health plans
hospitals, has also helped smooth over call coverage issues.
to control costs. At the same time, health plans are facing
Additionally, San Diego hospitals often pursue joint
demands from some providers to switch from capitated
ventures with physicians to enhance particular service
payment (fixed per-patient, per-month payments) to a fee-
lines — ambulatory surgery centers, diagnostic facilities, and
for-service basis; given providers’ consolidation and capacity
oncology centers — and strengthen physician relations.
limitations, plans believe they have little leverage to resist.
This is a significant change in the market; respondents
Health Plans Face Escalating Cost Pressures
characterized San Diego as “the last bastion of capitation,”
As of 2006, commercial HMO penetration in San Diego was
and some believe that the incentive for providers to manage
45.9 percent and overall HMO penetration was 47.4 percent
resources efficiently under capitation is an important reason
(compared to commercial HMO penetration of 46 percent
that health care costs in San Diego have historically been at
and overall HMO penetration of 47 percent for California
or below costs of other metropolitan areas in California.
as a whole).5 Kaiser, UnitedHealthcare, and Anthem Blue
Scripps has been the most aggressive in jettisoning
Cross have the largest health plan enrollments, followed by
capitation contracts and reportedly is in the final stages of
Blue Shield of California, Health Net, Aetna, CIGNA, and
converting from full-capitation payments to fee-for-service
Sharp Health Plan. Kaiser’s market penetration varies; close
payment for inpatient care. Scripps’ affiliated medical groups
to downtown and near Kaiser patient care facilities, market
no longer accept financial risk for commercial patients,
penetration is higher, while it is lower in the more distant
although they continue to accept Medicare risk, which is
North County area where Kaiser provides hospital services
viewed as relatively more lucrative. UCSD has not had
through an agreement with PPH.
capitation payments for hospital services for several years,
and its physicians are currently reimbursed on a capitated
UnitedHealthcare has assumed a more prominent role
in San Diego through its acquisition of PacifiCare, a health
basis for only about a quarter of their commercial patients.
plan that had virtually all its enrollment in HMO products.
Currently, the two largest capitated care providers in San
However, one respondent noted that “The UnitedHealthcare
Diego are Kaiser and Sharp with approximately 500,000 and
acquisition of PacifiCare has not gone well…PacifiCare
150,000 capitated enrollees, respectively.
Some plans are converting to fee for service to further
was the darling of San Diego managed care,” an opinion
echoed by others. As a result, UnitedHealthcare reportedly
their own strategic interests. For instance, UnitedHealthcare
lost a significant number of PacifiCare enrollees, with some
is renegotiating capitated contracts that providers had signed
migrating to PPO products.
with PacifiCare for commercial enrollees to bring these
contracts into line with the plan’s fee-for-service contracts
The presence of Aetna and CIGNA in the San Diego
nationally.
market is mainly to meet the needs of national self-insured
While the full impact of the shift away from capitation
employers for PPO products. Recently, however, both plans
reportedly have gained membership through mid-sized, self-
will take some time to fully assess, respondents were
insured employers.
concerned the move will lead to significant cost increases.
5
©2009 California HealthCare Foundation
One benefits consultant suggested that the conversion
on a high-performance specialty physician network called
from capitation to fee-for-service payment ultimately could
Aexcel. Kaiser has attempted to increase its attractiveness to
increase costs in the market by 15 to 20 percent, depending
national employers by partnering with UnitedHealthcare
in part on the number of providers in addition to Scripps
to create a dual offering in California called Sweet Spot.
that follow suit.
Under this approach, the employer can offer Kaiser and
UnitedHealthcare side-by-side with the two plans addressing
Plans Offer Options for Employers to Buy Down Costs
any risk selection issues in a way that is seamless to
As plans with diminished negotiating leverage acquiesce to
employers. Additionally, Kaiser, long committed to HMOs,
provider demands for fee-for-service payment, options to
has recently introduced plan designs with high deductibles
control employer costs have become more limited. All plans
and is preparing to offer administrative services and other
offer disease management and wellness programs as part of
products to self-insured employers.
their insured products or as add-ons in contracts with self-
Health plans also are introducing “narrow-network”
insured employers. The larger plans use their data-mining
products throughout California — products that exclude a
capabilities to identify enrollees who might benefit from
provider system with rates that are viewed as too high — and
more intense care management, and some target specific
San Diego is no exception. In San Diego, these products
services such as imaging for more aggressive utilization
often exclude Scripps providers from the plan network and
management. However, where capitation contracts remain
are offered by employers alongside other plan products. By
in place, physician groups continue to assume the major
excluding Scripps providers, plans hope to avoid higher
responsibility for controlling utilization.
payments to Scripps because of its conversion to fee-forservice payments. While most plans have developed narrow
Given these realities, health plans are turning to benefit
redesign as a major strategy for controlling employer health
networks along these lines, these products are relatively
care costs. Until recently, large employers have tended
new in San Diego, and therefore it is difficult to assess their
to offer Kaiser as one HMO option, and then offer an
market significance. Respondents’ views varied as to what
additional HMO and PPO administered by a competing
influence, if any, these products might ultimately have on the
health plan. In the past several years, there has been a steady
market, including their impact on health care costs.
reduction in benefit levels in PPO products, as well as an
In response to employer demands, health plans in
expansion in the number of different products available to
San Diego (as in California more generally) have added
employers. Respondents reported that plans often offer a
consumer-directed health plans (CDHPs) — high-deductible
menu of products to employers, who then select a subset
plans with (or eligible for) a health savings account (HSA)
of products to offer their employees, making a fixed-dollar
or health reimbursement arrangement (HRA) — to their
contribution toward whichever option an employee chooses.
product portfolios.6 Like narrow-network products, the
Several plans have new product designs under
market significance of CDHPs is difficult to determine at this
development or in the early experimental stages. For
point. Some respondents saw them as “the coming thing,”
instance, UnitedHealthcare is contemplating offering its
and there are reports that these products are of particular
Edge product in California. Under this product, PPO
interest to small employers because of the potential cost
enrollees pay lower coinsurance rates when they choose
savings. However, other respondents believed that CDHPs
providers designated by the plan as delivering higher-quality
will have difficulty making headway in San Diego with its
care more efficiently. Likewise, Aetna offers a product based
history of strong HMOs; HMO enrollees are not used to the
6
©2009 California HealthCare Foundation
high deductibles or coinsurance that CDHPs impose. Some
San Diego has a geographic Medi-Cal managed care
respondents suggested that if PPO enrollment continues to
model in which multiple plans participate.7 The dominant
grow in the market, exposing more consumers to deductibles
plan — for both Medi-Cal and Healthy Families — is
and coinsurance, this may lead to enrollment growth in
Community Health Group (CHG), a local, non-profit
CDHPs.
HMO with 83,000 Medi-Cal enrollees and 25,000 Healthy
Families enrollees. The plan with the second highest
Limited Coverage Options for Low-Income Residents
enrollment is Molina Healthcare, a for-profit national plan
San Diego County operates the County Medical
with 50,000 local enrollees. Other participating plans include
Services program (CMSP) as part of its state-mandated
Health Net, Kaiser, and CareFirst.
Plans regard low reimbursement from the state as a
responsibilities to provide indigent care. However,
respondents described CMSP as a very limited program.
significant threat to their ability to serve Medi-Cal and
As a result of lawsuits alleging the county was not fulfilling
Healthy Families enrollees. According to one respondent,
state-mandated requirements to care for the medically
“The state’s philosophy is to pay the plans actuarially sound
indigent, the county recently increased income eligibility
rates, minus what fits into the budget. So the theory of
from 135 percent to 165 percent of the federal poverty
actuarial rates has never been the reality here in California.”
level. Individuals with incomes of up to 350 percent
And while the plans have relatively broad provider networks,
also can enroll but are required to share in the costs of
there are concerns regarding enrollee access to specialists,
their care and eventually reimburse the county for the
especially orthopedists, neurologists, neurosurgeons, and
cost of any services they use. For CMSP enrollees with
urologists. Limited access to specialists is attributed in part to
incomes above 165 percent of the federal poverty level, the
low plan payment rates.
county places a lien on their homes to ensure repayment.
An aspect of Medi-Cal managed care that makes San
Undocumented immigrants are ineligible for the program,
Diego distinct is the involvement of the Healthy San Diego
and documentation requirements to enroll in the program
collaborative, which brings together the Medi-Cal plans,
are strict. In addition, there are a limited number of
major providers, the county, and consumer advocates to
locations that accept applications. As one respondent noted,
discuss access and quality of care. Currently, Healthy San
“There are barriers set up constantly so you’ll just walk
Diego is pursuing several initiatives, including a workgroup
away in frustration or you’ll end up not having the right
aimed at increasing the use of preventive care and a quality
documentation.” CMSP participants also reportedly have
improvement task force.
Through California’s Health Coverage Initiative, a
difficulty accessing needed specialty care; the county has tried
to alleviate this situation by raising specialist reimbursement
Medicaid waiver demonstration program, San Diego County
to 140 percent of Medi-Cal payments.
was awarded a total of about $40 million for fiscal years
2007– 08 through 2009 –10 to test innovative ways of
Given the limited enrollment in CMSP, the state’s MediCal and Healthy Families programs remain the primary
providing care to the uninsured. The San Diego initiative,
sources of health care coverage for low-income San Diegans.
which is called the Safety Net Access Program, enrolls
Healthy Families is California’s State Children’s Health
uninsured diabetic or hypertensive people with incomes
Insurance Program and provides health insurance to low-
below 200 percent of poverty to more closely manage their
income children who do not qualify for Medi-Cal.
care and avoid emergency department visits. Program
7
©2009 California HealthCare Foundation
Earlier in the decade, San Diego avoided a potential crisis
enrollment is limited to 3,200 individuals to study its impact
in the availability of inpatient care for low-income residents
on public expenditures.
when UCSD cancelled plans to transfer inpatient services
Weak Safety Net Commitment of Local Government
from its Hillcrest campus to its La Jolla campus. La Jolla
Consistent with the controversy around San Diego County’s
is a relatively affluent area and is much less accessible to
participation in the CMSP, the county is widely perceived as
low-income uninsured and Medi-Cal patients. The planned
having a weak commitment to health care for low-income
move generated an outcry both from the community and
and uninsured residents. San Diego County ranks fifth from
from other hospitals, the latter of which feared a dramatic
the bottom of California counties on spending per uninsured
increase in low-income patients. The planned move also
resident.8 Respondents attributed this lack of commitment
motivated the county government to fund, in conjunction
to a fiscally conservative County Board of Supervisors and
with The California Endowment, a 20-year assessment of
to a perception that expansions in county funding for health
the county’s health care safety net. Commonly referred to
care would simply provide more services to undocumented
as the Abaris report for the organization that conducted the
immigrants. There are no county-owned hospitals or
study, the 2006 report is widely recognized by both health
primary care clinics in San Diego, an unusual situation for
care providers and local government as having focused new
a large metropolitan area in California. As one respondent
attention on the safety net. Ironically, while the Abaris report
explained, “Our safety net, while we have vibrant, well-
concluded that the impact of the UCSD move from Hillcrest
intentioned people, the connections are very fragmented.
would not be as great as had been feared, the plan to close
It exists because of the good will of individuals, rather than
all inpatient care facilities at UCSD Hillcrest has not moved
being thought-out and formalized.”
forward, although some services have shifted to the La Jolla
campus.
As a result, private health care providers carry much of
While there are no county-owned clinics in San Diego,
the financial burden of providing care to uninsured residents
and Medi-Cal patients. Respondents often described a
there is a robust network of 20 community health centers
“delicate” balance among hospitals providing safety-net
(CHCs) in the region. These CHCs operate close to 100
services, citing concerns that if one hospital were to reduce
sites, the majority of which are federally qualified health
the amount of services provided, it would disrupt this
centers (FQHCs). Family Health Centers of San Diego is
balance and jeopardize the financial well-being of the other
the largest CHC, with 18 sites, but it does not belong to the
hospitals.
Council of Community Health Clinics, a local organization
that provides coordination and support for such activities
While UCSD’s Hillcrest Hospital is a major provider of
inpatient care for the uninsured, Scripps Mercy Hospital
as funding, outreach, specialty referral, and installation of
(downtown San Diego and Chula Vista campuses) and
health care information technology. Complementing the
Sharp Grossmont and Chula Vista hospitals also were
CHCs, some hospitals, such as UCSD’s Hillcrest facility and
acknowledged as critically important safety-net providers.
Rady Children’s Hospital, have outpatient clinics that serve
Other hospitals also mentioned as important safety-net
low-income patients.
providers in the market include Sharp Mary Birch Hospital
Respondents generally reported that San Diego has
for Women, PPH, Rady Children’s Hospital, and Tri-City
adequate primary care capacity in the safety net, but that
Medical Center.
some CHCs struggle to recruit primary care physicians.
Access to specialty care for low-income residents, however, is
8
©2009 California HealthCare Foundation
difficult. A recent San Diego Medical Society survey suggests
literacy and care coordination projects and the expansion of
that specialists are increasingly unwilling to take Medi-Cal
the Safety Net Connect program.
and uninsured patients. As one physician noted, “I think, by
and large, there is not a shortage of actual specialists. I think
Issues to Track
there is a shortage of specialists that are willing to treat all
While San Diego has been called the “last bastion of
kinds of patients.” Typically, CHCs refer patients to UCSD
capitation,” this appears to be changing. The strong market
or Rady Children’s Hospital for specialty care. However,
positions of some hospital systems and affiliated physicians
the hospital specialty clinics are becoming overwhelmed
have enabled them to move from capitated to fee-for-
with patients and are concerned about accepting more
service contracts with health plans. The desire of some
uninsured patients. As a result, low-income residents in
national health plans to move away from capitated payment
San Diego frequently seek care from emergency departments,
arrangements has contributed to this change. But there is
where they can be assured of receiving a specialty consult.
concern among some purchasers that health care costs in
Emergency departments have experienced steady increases in
San Diego are likely to increase significantly as a result.
utilization and have problems providing necessary emergency
Health plans are expanding their product portfolios to
specialist call coverage.
offer plans with limited benefits in response to employer
In response to the Abaris report recommendations,
demands for lower costs, and are experimenting with narrow-
several steps have been taken to stem the increase in ED use,
network products that exclude higher-cost providers from
including expanding access to urgent care and increasing
their networks.
coordination between hospital emergency departments and
San Diego’s somewhat unique system for providing health
CHCs. For instance, the county has funded an expansion of
care for the uninsured relies heavily on private providers but
a program developed at UCSD, called Safety Net Connect,
is being challenged by low Medi-Cal payment rates. Safety-
that electronically links UCSD emergency departments
net providers are also being challenged by increasing demand
with CHCs and allows ED physicians to schedule follow-
for their services and limitations on access to specialty
up appointments for patients at local health centers. The
services, which stand to worsen with the economic decline.
expansion will eventually allow CHCs to view hospitals’
The following are among the key issues to track:
electronic health records and, ultimately, allow hospitals and
▶▶
clinics to exchange health information on shared patients.
How will the shift from capitation to fee for service
evolve in San Diego? Moving forward, what will be the
The county also encourages CHCs to expand evening and
impact on care delivery, costs, and quality?
weekend hours to better serve patients who might otherwise
▶▶
seek care at an ED.
Will large hospital systems seek to divide the health
care market in San Diego along geographic lines? Will
The Community Health Improvement Partners
consolidation of providers continue? If so, how will this
(CHIP), a nonprofit community collaborative that includes
affect costs and access?
representatives from health care providers, health plans,
universities, community organizations, and the county,
▶▶
Will narrow-network and consumer-directed health plan
serves as a catalyst for safety-net activities in the community.
products gain employer and employee acceptance and, if
CHIP conducts community-needs assessments, operates the
so, will they be effective in injecting new cost discipline
Immunize San Diego program, and is involved in health
into the San Diego market?
9
©2009 California HealthCare Foundation
▶▶
Can San Diego’s safety net be sustained in the face
of increased demands for services in a deteriorating
economy? Will the county government increase financial
support for the safety net?
Endnotes
1. San Diego SourceBook, “San Diego County’s Largest Employers,”
sourcebook.sddt.com (accessed April 15, 2009).
2. Government health care districts are governed by an elected body separate
from the local government and have the authority to impose property
taxes to pay for the operation of the hospital. Because the district board is
responsible to the community, the hospital often provides services for the
underserved.
3. Sherman, Lola, “Hospital Tower Gets Break on Quake Retrofit,” The San
Diego Union-Tribune (April 3, 2009).
4. Under a medical foundation model, the foundation is sponsored by
a hospital or hospital system, and physicians either contract with the
foundation’s IPA or are employed by the foundation through a professional
services arrangement with the medical group.
5. Cattaneo & Stroud, Inc., 2006 California Statewide HMO & Special
Programs Enrollment Study, Burlingame, CA (2008).
6. HSAs are tax-favored accounts that must be linked to health plans with
minimum deductibles of $1,100 for self-only coverage and $2,200 for
family coverage in 2008. HRAs are accounts funded and owned by the
employer; no companion health plan is required. HRA contributions
are not subject to business income tax, and unused funds revert to the
employer when the employee retires or leaves the company.
7. Under the geographic managed care model, the state contracts with
multiple private managed care plans and pays each plan on a capitated
(fixed per-enrollee, per-month payment) basis.
8. Abaris Group, San Diego County Healthcare Safety Net Study, Walnut
Creek, CA (September 18, 2006).
10
©2009 California HealthCare Foundation
Regional Markets Study: San Diego
Del
Norte
In November 2008, a team of researchers from the Center for Studying Health System Change
(HSC) visited the San Diego region to study that market’s local health care system. The San Diego
market encompasses the San Diego-Carlsbad-San Marcos, California, Metropolitan Statistical
Area and includes San Diego County. San Diego is one of six markets being studied on behalf of
the California HealthCare Foundation to gain important insights into regional characteristics in
Placer
health care affordability, access, and quality. The six markets included in the study — Fresno,
El Dorado
Yolo
Los Angeles, Oakland/San Francisco, Riverside/San Bernardino, Sacramento, and
Sacramento
Bay Area
Marin
San Francisco
Contra
Costa
Alameda
San Mateo
San Diego — reflect a range of economic, demographic, health care delivery,
Mariposa
Madera
and financing conditions in California. Fifty-one interviews of leaders in the
San Diego health care market were conducted to inform this report.
Fresno
▶▶ access the entire regional markets series here.
Tulare
Kings
San Bernardino
Los
Angeles
Riverside
San Diego
About the authors
About the Foundation
Jon B. Christianson, Debra A. Draper, Peter J. Cunningham, Nicole M.
The California HealthCare Foundation is an independent philanthropy
Kemper, Genna R. Cohen and Johanna R. Lauer, Center for Studying Health
committed to improving the way health care is delivered and financed
System Change (HSC). HSC is a nonpartisan policy research organization
in California. By promoting innovations in care and broader access to
that designs and conducts studies focused on the U.S. health care system to
information, our goal is to ensure that all Californians can get the care
inform the thinking and decisions of policy makers in government and private
they need, when they need it, at a price they can afford. For more
industry. More information is available at www.hschange.org.
information, visit www.chcf.org.
California Health Care Almanac is an online clearinghouse for key data and
analysis examining the state’s health care system. For more information, go to
www.chcf.org/topics/almanac.
©2009 California HealthCare Foundation
Table A. Demographic and Health System Characteristics: Six Selected Regions vs. California (Supplement to the California health care Almanac Regional Markets Issue Brief series)
Fresno
Los Angeles
Riverside/
San Bernardino
Sacramento
San Diego
San Francisco
Bay Area
California
1,634,325
9,878,554
4,081,371
2,091,120
2,974,859
4,203,898
36,553,215
Population growth, 1997–2007
21.6%
8.4%
33.9%
26.3%
9.2%
6.6%
13.6%
Population growth, 2002–2007
9.0%
0.7%
16.1%
8.3%
2.3%
0.6%
4.1%
Population Statistics
Total population
age of Population
Persons under 5 years old
8.7%*
7.4%
7.6%
6.8%
7.4%
6.4%
7.3%
Persons under 18 years old
30.6%*
27.8%
29.7%
26.4%
26.7%
22.2%
26.9%
Persons 18 to 64 years old
60.3%*
62.0%
60.9%
62.4%
62.7%
65.9%
62.5%
Persons 65 years and older
9.1%*
10.2%
9.4%
11.1%
10.6%
11.9%
10.6%
37.4%*
28.7%
42.0%
59.7%
53.7%
46.2%
43.3%
4.0%*
8.4%
7.1%
6.4%
5.3%
8.3%
5.8%
50.8%*
47.6%
42.9%
18.9%
29.0%
20.8%
36.1%
Asian non-Latino
5.3%*
13.1%
5.3%
10.4%
8.7%
20.4%
11.8%
Other race non-Latino
2.6%*
1.8%
2.7%
4.6%
3.3%
4.2%
3.1%
Foreign-born
20.4%*
33.8%
20.9%
15.1%
20.3%
27.5%
25.7%
Limited/no English, adults
41.3%*
38.7%
30.5%
28.5%
26.1%
27.6%
35.2%
High school degree or higher
71.9%*
78.2%
81.5%
89.9%
87.6%
89.7%
82.9%
College degree or higher
22.2%*
32.8%
24.5%
38.3%
40.6%
49.4%
35.7%
Fair/poor health status
19.8%*
18.4%
15.0%
12.3%
12.3%
12.5%
15.8%
Diabetes
10.5%*
8.8%
8.5%
6.5%
6.3%
7.0%
7.8%
Asthma
16.7%*
11.8%
13.0%
18.5%
12.8%
14.6%
13.6%
6.4%*
6.2%
6.3%
6.5%
6.4%
5.5%
6.3%
Below 100% federal poverty level
24.0%*
20.8%
14.8%
11.6%
11.0%
11.0%
15.7%
Below 200% federal poverty level
45.1%*
41.2%
35.2%
25.7%
26.4%
22.4%
33.5%
Household income above $50,000
39.7%*
44.3%
50.9%
54.9%
56.7%
61.6%
51.1%
Unemployment rate, January 2009
15.5%
10.8%
11.8%
10.4%
8.6%
8.4%
10.6%
46.8%*
52.8%
58.7%
66.8%
63.9%
69.3%
59.1%
7.0%*
7.2%
7.7%
9.4%
8.8%
9.6%
8.5%
Medi-Cal and other public programs
30.5%*
23.8%
18.5%
15.1%
14.9%
13.4%
19.3%
Uninsured
15.7%*
16.1%
15.1%
8.6%
12.5%
7.8%
13.2%
118
176
110
191
187
239
174
Primary care physicians per 100,000 population
45
58
40
63
60
79
59
Dentists per 100,000 population
43
64
47
74
70
89
69
Staffed community, acute care hospital beds per 100,000 population, 2006
173
214
142
146
171
211
182
Hospital concentration, 2006 (Herfindahl index)
702
310
542
2,178
1,468
1,176
1,380
3.0%
–5.3%
1.3%
7.1%
5.3%
3.4%
1.2%
67.9%
58.5%
64.0%
70.7%
67.4%
56.4%
59.0%
Race/Ethnicit y
White non-Latino
African American non-Latino
Latino
Education, adults 25 and older
Health Status
Heart disease, adults
Economic Indicators
Health Insurance, All Ages
Private insurance
Medicare
Supply of Health Professionals, 2008
Physicians per 100,000 population
Hospitals
Operating margin including net Disproportionate Share Hospital payments
Occupancy rate for licensed beds
Average length of stay (days)
Paid full-time equivalents per 1000 adjusted patient days
Total operating expense per adjusted patient day
4.4
4.8
4.3
4.3
4.4
4.9
4.5
15.0
16.0
15.0
17.3
14.9
15.9
15.7
$1,883
$2,245
$2,110
$2,731
$2,182
$2,934
$2,376
Notes: All estimates pertain to 2007 unless otherwise noted. Fresno region includes Fresno, Kings, Madera, Mariposa and Tulare counties. Sacramento region includes El Dorado, Placer, Sacramento, and Yolo counties. San Francisco Bay region
includes Alameda, Contra Costa, Marin, San Francisco, and San Mateo counties.
*Estimate does not include Mariposa County because the California Health Interview Survey public-use dataset does not report separate estimates for very small counties such as Mariposa.
Sources: U.S. Census Bureau, Population Estimates, 2007; California Health Interview Survey, 2007; State of California Employment Development Department, Labor Market Information Division, “Monthly Labor Force Data for Counties: January
2009 — Preliminary, March 2008 Benchmark,” March 5, 2009; California HealthCare Foundation, “Fewer and More Specialized: A New Assessment of Physician Supply in California,” June 2009; UCLA Center for Health Policy Research, “Distribution
and Characteristics of Dentists Licensed to Practice in California, 2008,” May 2009; American Hospital Association Annual Survey Database, Fiscal Year 2006; California Office of Statewide Health Planning and Development, Healthcare Information
Division — Annual Financial Data, 2007.
©2009 California HealthCare Foundation


© Copyright 2026