
IN-PHANTOM SPECTROMETRY OF MEDICAL. DIAGNOSTIC X RAYS A THESIS Presented to
IN-PHANTOM SPECTROMETRY OF MEDICAL. DIAGNOSTIC X RAYS
A THESIS
Presented to
The Faculty of the Division of Graduate
Studies and Research
By
Paul Stewart Stansbury
In Partial Fulfillment
of the Requirements for the Degree
Doctor of Philosophy
in the
School of Nuclear Engineering
Georgia Institute of Technology
June, 1977
\
n
IN-PHANTOM SPECTROMETRY OF MEDICAL DIAGNOSTIC X RAYS
/
l y Li Morgan, jetialrman
G. G. Eichholz
y^
±^^i^C
R. flT Fetner
P. H. McGinley
^2—-
. /
ynn, Postor/
Date approved by Chairman:
April 4, 1977
ACKNOWLEDGMENTS
The author expresses his gratitude to F. W. Chambers, who first
introduced him to health physics and medical physics.
Deepest gratitude
is expressed to J. W. Poston, who, as laboratory research advisor,
provided the inspiration, support, understanding and criticism needed
to bring this project to fruition.
Thanks are expressed to K. Z. Morgan,
thesis advisor, and G. G. Eichholz,
thesis committee member, for their
interest and sagacious advice. The author thanks J. A. Auxier for his
help in securing the author's appointment as an Oak Ridge Associated
Universities Graduate Laboratory Participant and for supporting this
project as part of the research of the Health Physics Division of the Oak
Ridge National Laboratory.
Thanks are expressed to J. H. Thorngate, D. J. Christian, and
G. K. Schulze for their work on the design and development of the x-ray
machine.
H. S. Roach, B. G. Foutz and R. S. Jones provided valuable
assistance in the construction of the phantom.
The author especially
thanks W. F. Bunch for his help with all of the "gadgetry" necessary
for a project of this sort.
T. D. Jones, P. T. Perdue, and V. E. Anderson are to be thanked
for their advice about dosimetry, mathematics and computer programming.
The assistance of G. G. Warner and S. K. Penny in performing some of the
computer-coded calculations needed in this study is gratefully acknowledged.
Thanks are expressed to C. H. Abner and S. R. Larkins for their
engineering efforts, to C. C. Hall for his engineering of the safety
interlocks, and to H. M. Butler and W. F. Ohnesorge for their advice
iii
iv
and assistance with the health physics matters related to the project.
C. E. Bemis provided the advice, assistance, and equipment
necessary to perform the high resolution spectrometry.
In a similar
manner, H. W. Dunn provided the use of an x-ray monochromator.
essential help is acknowledged.
Their
The author thanks the other students
who assisted him with various aspects of the project.
They include
S. M. Garry, H. N. Mei, W. L. Chen, D. P. Humer, and S. S. Jaeger.
The author expresses his appreciation to the people who, in
various capacities, helped "get things done." These people include
J. P. Hickey, E. T. Loy, J. L. Malone, T„ Neuman, F. Rau, C. E. McFarland,
G. E. Long, B. E. Thomas, C. C. Hayes, and others.
Appreciation is
expressed to the Georgia Institute of Technology for granting special
permission to use pagination which conforms to ORNL standards.
Thanks are expressed to K. M. Branam and N. L. Barringer for
their assistance in preparing drafts and the other paperwork generated in
the course of this project.
Appreciation is expressed to B. S. Varnadore
for her help in preparing this manuscript.
Finally, the author thanks
his wife and daughter for their loving patience, understanding, and
endurance.
This research was carried out at the Oak Ridge National Laboratory
which is operated by the Energy Research and Development Administration
under contract with Union Carbide Corporation.
TABLE OF CONTENTS
PAGE
iii
ACKNOWLEDGEMENTS
LIST OF TABLES
LIST OF FIGURES
SUMMARY
Chapter
I. INTRODUCTION . .
II. THEORY
vi
vii
xiv
1
11
Production of X Rays
Interaction of X Rays with Matter
Monte Carlo Calculations
Phantom Measurements
Sodium Iodide Scintillation Spectrometry
III.
APPARATUS AND PROCEDURES
35
X-Ray Facility
Spectrometer
Unfolding Procedure
MR. ADAM Phantom
IV. RESULTS AND CONCLUSIONS
Outline of Spectral Measurements
Highlights of Results
Protective Measures
Effect of Depth of Penetration, Scattering Distance and
Beam Size
Spectra Inside the Spine
Error Analysis
Comparison with BRH Calculations
V. FINAL SUMMARY
79
129
Appendices
A. MEASURED SPECTRA
B. EFFECT OF FIELD SIZE
135
192
BIBLIOGRAPHY . .
211
VITA
217
v
LIST OF TABLES
TABLE
1.
2.
PAGE
Coefficients and Parameters of Exponential Attenuation
Equations of the Form A = A e~ B x
18
Description of the Snyder-Fisher Phantom Subregions and
their MR. ADAM Phantom Equivalents
75
3.
Calculated Partial Mass Attenuation Coefficients for MR.
ADAM Phantom Materials and Comparison with the Coefficients
for Snyder-Fisher Phantom -- Soft Tissue
76
4.
Calculated Partial Mass Attenuation Coefficients for MR.
ADAM Phantom Materials and Comparison with the Coefficients
for Snyder-Fisher Phantom — Skeleton
77
5.
Calculated Partial Mass Attenuation Coefficients for MR.
ADAM Phantom Materials and Comparison with the Coefficients
for Snyder-Fisher Phantom -- Lung
78
6.
Summary of Probe Locations
7.
Summary of Spectral Data for Testes and Right Ovary
8.
Summary of Spectral Data for Heart Region, Fifth Lumbar
Vertebra, and Thoracic Spine
95
Summary of Spectral Data for Thyroid Gland and Eye Region.
96
9.
10.
11.
82
...
Comparison of Ionization Chemaber Measurements with the
Absorbed Dose Rate Determined from the Measured Spectrum
at the Testes .......
94
124
Comparison of Measured Absorbed Dose with BRH Calculations 126
vi
LIST OF FIGURES
FIGURE
1.
2.
PAGE
A Summary of BEIR Committee Estimates of Annual WholeBody Average Dose Rate in the United States in 1970
(BEIR72)
3
Mass Energy Absorption and Partial Mass Attenuation
Coefficients for Snyder-Fisher Soft Tissue (St74)
21
3.
Floor Plan for the X-Ray Facility
37
4.
X-Ray Machine Schematic
38
5.
Exposure Rate at a Target to Detector Distance of 100 cm
as a Function of Generating Potential
41
Normalized Exposure Rate as a Function of Tube Current
(Error Bars Correspond to +_ 2% Plus the Least Significant
Digit Uncertainty)
42
6.
7.
X-Ray Machine Output Spectrum Measured with a Ge(Li)
Detector — 60 kVcp
. 44
X-Ray Machine Output Spectrum Measured with a Ge(Li)
Detector — 80 kVcp
45
X-Ray Machine Output Spectrum Measured with a Ge(Li)
Detector — 100 kVcp
46
Comparison of X-Ray Machine Output Spectrum with a
Representative Diagnostic X-Ray Spectrum
49
11.
Nal(TJi) Scintillation Detector .
51
12.
Change in Mean of Pulse Height Distribution as a Function
of Declination and Energy of Incident Beam (Data are
Normalized so that Side Response Equals 100%.)
54
Mean of Pulse Height Distribution versus Energy for the
Spherical Nal(U) Detector
57
Sigma of Pulse Height Distribution versus Energy for the
Spherical Nal(Tji) Detector
58
8.
9.
10.
13.
14.
vii
vm
FIGURE
15.
PAGE
Calculated Distribution of the Energy Deposited in the
Nal Crystal of the Detector by a Uniform Parallel Beam
of 110 keV Photons
61
Calculated Response Function for 110 keV Uniformly
Incident Photons
62
Comparison of Unfolded NaI(T£) Spectrum with Spectrum
Measured with a Ge(Li) Detector -- 60 kVcp
67
Comparison of Unfolded NaI(T£) Spectrum with Spectrum
Measured with a Ge(Li) Detector — 80 kVcp
68
19.
An Example of Truncation and Extrapolation
70
20.
The MR. ADAM Phantom
73
21.
Data Acquisition and Processing Schematic
80
22.
Beam Location for Lower Spine 10 x 10 cm Field (Center
at x = 0, z = 22)
83
Beam Location for Full Spine 10 x 44 cm Field (Center
at x = 0, z = 22)
87
Beam Location for Abdominal 36 x 44 cm Field (Center at
x = 0, 2 = 22)
88
Beam Location for Shoulder 36 x 44 cm Field (Center at
x = 14.3, 2 = 61.5)
89
Beam Location for Upper Gastro-Intestinal (Upper G.I.)
36 x 22 cm Field (Center at x = 0, z = 36)
90
Beam Location for Pelvic 44 x 36 cm Field (Center at
x = z = 0)
91
16.
17.
18.
23.
24.
25.
26.
27.
28.
29.
30.
Beam Location for Chest Posterior-Anterior 36 x 44 cm
Field (Center at x = 0, z = 53)
.
92
Effect of Gonad Shield on the Spectrum at the Testes —
Pelvic Exam (Testes in the Beam)
97
Effect of Gonad Shield on the Spectrum at the Testes -Abdominal Exam (Testes Near the Beam)
98
ix
FIGURE
31.
PAGE
Effect of Gonad Shield on the Spectrum at the Testes -Upper G.I. Exam (Testes Far from the Beam)
99
Effect of Shielding with an Apron on the Spectrum at the
Right Ovary — Upper G.I. Exam — 60 and 80 kVcp . . . .
102
Effect of Shielding with an Apron on the Spectrum at the
Right Ovary -- Upper G.I. Exam — 100 kVcp
103
Effect of Shielding with an Apron on the Spectrum at the
Right Ovary — Chest PA Exam — 60 and 80 kVcp . . . . .
104
Effect of Shielding with an Apron on the Spectrum at the
Right Ovary — Chest PA Exam — 100 kVcp
105
Effect of Shielding with an Apron on the Spectrum at the
Right Ovary ~ Shoulder Exam — 60 and 80 kVcp
106
Effect of Shielding with an Apron on the Spectrum at the
Right Ovary — Shoulder Exam — 100 kVcp
107
Effect of Shielding and Field Size on the Spectrum
at the Thyroid -- Shoulder Exam — 60 kVcp
108
Effect of Shielding and Field Size on the Spectrum at
the Thyroid — Shoulder Exam — 80 kVcp
109
Effect of Shielding and Field Size on the Spectrum at
the Thyroid — Shoulder Exam -- 100 kVcp
110
41.
Spectrum as a Function of Depth — 60 kVcp
112
42.
Spectrum as a Function of Depth -- 80 kVcp
113
43.
Spectrum as a Function of Depth -- 100 kVcp
114
44.
Scattered Spectrum as a Function of Detector-FieldSeparation (DFS in Units of Centimeters) — 80 kVcp
. . 115
Scattered Spectrum as a Function of Detector-FieldSeparation (DFS in Units of Centimeters) — 80 kVcp
. . 116
32.
33.
34.
35.
36.
37.
38.
39.
40.
45.
46.
Scattered Spectrum as a Function of Detector-FieldSeparation (DFS in Units of Centimeters) — 100 kVcp . . 117
47.
Scattered Spectrum as a Function of Detector-FieldSeparation (DFS in Units of Centimeters) — 100 kVcp . . 118
i
X
FIGURE
48.
49.
50.
51.
52.
PAGE
Spectrum at the Testes without Shield for Lower Spine
Exam
136
Spectrum at the Testes with Shield for Lower Spine
Exam
137
Spectrum at the Testes without Shield for Full Spine
Exam
138
Spectrum at the Testes with Shield for Full Spine
Exam
139
Spectrum at the Testes without Shield for Abdominal
Exam
140
53.
Spectrum at the Testes with Shield for Abdominal Exam. . 141
54.
Spectrum at the Testes without Shield for Shoulder
Exam
142
55.
Spectrum at the Testes with Shield for Shoulder Exam . .
143
56.
Spectrum at the Testes without Shield for Upper G.I.
Exam
144
Spectrum at the Testes without Shield for Upper G.I.
Exam
145
57.
58.
Spectrum at the Testes without Shield for Pelvic Exam. . 146
59.
Spectrum at the Testes with Shield for Pelvic Exam . . .
60.
Spectrum at the Testes without Shield for Chest Exam . . 148
61.
Spectrum at the Right Ovary for Lower Spine Exam . . . .
149
62.
Spectrum at the Right Ovary for Full Spine Exam
150
63.
Spectrum at the Right Ovary for Abdominal Exam
151
64.
Spectrum at the Right Ovary for Shoulder Exam
152
65.
Spectrum at the Right Ovary for Upper G.I. Exam
66.
Spectrum at the Right Ovary for Pelvic Exam
154
67.
Spectrum at the Right Ovary for Chest Exam
155
....
....
147
153
XI
FIGURE
PAGE
68.
Spectrum at the Thyroid Gland for Lower Spine Exam . . . .
156
69.
Spectrum at the Thyroid Gland for Full Spine Exam
157
70.
Spectrum at the Thyroid Gland for Abdominal Exam
158
71.
Spectrum at the Thyroid Gland for Shoulder Exam
159
72.
Spectrum at the Thyroid Gland for Upper G.I. Exam
73.
Spectrum at the Thyroid Gland for Pelvic Exam
161
74.
Spectrum at the Thyroid Gland for Chest Exam
162
75.
Spectrum at the Heart Region for Lower Spine Exam
76.
Spectrum at the Heart Region for Full Spine Exam
164
77.
Spectrum at the Heart Region for Abdominal Exam
165
78.
Spectrum at the Heart Region for Shoulder Exam
166
79.
Spectrum at the Heart Region for Upper G.I. Exam
167
80.
Spectrum at the Heart Region for Pelvic Exam
168
81.
Spectrum at the Heart Region for Chest Exam
169
82.
Spectrum at the Fifth Lumbar Vertebra for Lower Spine
Exam
170
Spectrum at the Fifth Lumbar Vertebra for Full Spine
Exam
171
83.
....
....
....
160
163
84.
Spectrum at the Fifth Lumbar Vertebra for Abdominal Exam . 172
85.
Spectrum at the Fifth Lumbar Vertebra for Shoulder Exam. . 173
86.
Spectrum at the Fifth Lumbar Vertebra for Upper G.I.
Exam
174
87.
Spectrum at the Fifth Lumbar Vertebra for Pelvic Exam. . . 175
88.
Spectrum at the Fifth Lumbar Vertebra for Chest Exam . . .
176
89.
Spectrum at the Thoracic Spine for Lower Spine Exam
177
90.
Spectrum at the Thoracic Spine for Full Spine Exam . . . . 178
...
xn
FIGURE
PAGE
91.
Spectrum at the Thoracic Spine for Abdominal Exam
...
179
92.
Spectrum at the Thoracic Spine for Shoulder Exam . . . .
180
93.
Spectrum at the Thoracic spine for Upper G.I. Exam . . .
181
94.
Spectrum at the Thoracic Spine for Pelvic Exam
182
95.
Spectrum at the Thoracic Spine for Chest Exam
183
96.
Spectrum at the Eye Region for Lower Spine Exam
97.
Spectrum at the Eye Region for Full Spine Exam
185
98.
Spectrum at the Eye Region for Abdominal Exam
186
99.
Spectrum at the Eye Region for Shoulder Exam
187
Spectrum at the Eye Region for Shoulder Exam (with
28 x 44 cm Field)
188
101.
Spectrum at the Eye Region for Upper G.I. Exam
189
102.
Spectrum at the Eye Region for Pelvic Exam
190
103.
Spectrum at the Eye Region for Chest Exam
191
104.
Spectrum at the Testes as a Function of Field Size -60 kVcp
. . .
193
Spectrum at the Testes as a Function of Field Size —
80 kVcp .
194
Spectrum at the Testes as a Function of Field Size —
100 kVcp
195
Spectrum at the Right Ovary as a Function of Field
Size — 60 kVcp
196
Spectrum at the Right Ovary as a Function of Field
Size — 80 kVcp
197
Spectrum at the Right Ovary as a Function of Field
Size — 100 kVcp
198
Spectrum at the Thyroid as a Function of Field
Size — 60 kVcp
199
100.
105.
106.
107.
108.
109.
110.
....
184
Xlll
FIGURE
111.
112.
113.
114.
115.
116.
117.
118.
119.
120.
121.
PAGE
Spectrum at the Thyroid as a Function of Field
Size -- 80 kVcp
200
Spectrum at the Thyroid as a Function of Field
Size — 100 kVcp
201
Spectrum at the Fifth Lumbar Vertebra as a Function of
Field Size — 60 kVcp
202
Spectrum at the Fifth Lumbar Vertebra as a Function of
Field Size -- 80 kVcp
203
Spectrum at the Fifth Lumbar Vertebra as a Function of
Field Size — 100 kVcp
204
Spectrum at the Thoracic Spine as a Function of Field
Size — 60 kVcp
2C5
Spectrum at the Thoracic Spine as a Function of Field
Size — 80 kVcp
206
Spectrum at the Thoracic Spine as a Function of Field
Size — 100 kVcp
207
Spectrum at the Eye Region as a Function of Field
Size -- 60 kVcp
208
Spectrum at the Eye Region as a Function of Field
Size ~ 80 kVcp
209
Spectrum at the Eye Region as a Function of Field
Size -- 100 kVcp
210
SUMMARY
A program of measurements was made to determine the spectral
fluence distributions at locations of significance in a heterogeneous,
hominoid phantom exposed to x rays in a manner simulating medical
diagnostic radiology.
The measurements were made with a specially
constructed Nal(TJi) scintillation detector.
The detector had a spher-
ically shaped active volume 0.6 cm in diameter.
The resolution of this
detector was five times worse than that of a more conventional NaI(T&)
spectrometer.
Resolution broadening and other distortions were removed
from the observed pulse height spectra with a computer-coded, iterative
unfolding technique.
The performance of the spectrometer and the un-
folding scheme was assessed by comparing, in a few cases, the unfolded
NaI(T£) spectra with spectra determined with a high resolution Ge(Li)
spectrometer.
The measurements were made in a physical model of an idealized
representation of an average adult patient.
The phantom was constructed
of molded lucite shells filled with differing materials to simulate
lung, skeletal, and soft-tissue regions.
To provide count rates suitable
for scintillation spectrometry, a therapy-type x-ray machine was
modified to operate at low exposure rates.
However, because of the
inherent filtration of the therapy-type tube, the output spectra of the
x-ray machine were somewhat different than spectra typical of medical
diagnostic radiology.
How well the spectra of a particular x-ray
machine resembles the spectra of the x-ray machine used in this study
may influence the applicability of the data presented in this study.
xiv
XV
Spectral fluence distributions were determined at the testes,
ovaries, thyroid, eye, heart, and two spine regions.
X-ray beams
simulating lower spine, full spine, abdominal, shoulder, upper gastrointestinal, pelvic, and chest examinations were employed at generating
potentials of 60, 80, and 100 kVcp.
The measured spectra were unfolded,
and the results are presented graphically.
The absorbed dose in soft-
tissue was calculated from each spectrum, and these results are. presented
also.
In addition, measurements were made to determine the effect of
shielding on the spectrum and absorbed dose in regions of interest
outside the useful beam.
The absorbed doses determined from spectral measurements were
compared with a few ionization chamber measurements and with the results
of Monte Carlo calculations.
The absorbed doses determined with the
spectrometer were generally lower than those determined with the ionization chamber, but the agreement in all cases studied was +_ 16% or
better.
The absorbed doses determined at the testes, ovaries, and
thyroid were compared with analogous calculations performed by the U.S.
Bureau of Radiological Health.
The agreement between the measured and
calculated values was good when viewed in perspective with the inaccuracies in the experimental simulation, the differences between the
experiments and the calculations, and the uncertainty in the Monte Carlo
calculations due to poor statistics.
For example, the calculations did
not account for collimator scatter while the program of measurements
demonstrated that collimator scatter contributed significantly to the
absorbed dose to regions outside the useful beam.
xvi
In addition to showing the feasibility and shortcomings of
in-
phantom spectrometry, the results of this study demonstrated the
significance of collimator scatter.
It is suggested that more study
be given to this effect and to the benefit of shielding all body areas
outside the useful beam.
CHAPTER I
INTRODUCTION
In 1896 Wilhelm Conrad Roentgen made a public announcement of his
discovery of x rays.
Besides reporting many of the physical properties
of x rays, he also showed that x rays could be used to take pictures of
the bones inside a human hand. From the period immediately following
Roentgen's discovery until the present, x-ray photography or radiography
has been a wery valuable tool in the practice of medicine.
However, shortly after the announcement of the discovery of x rays,
there was evidence that x rays could be harmful also.
Grube, a man who
had been manufacturing Crookes tubes and studying the fluorescence of
chemicals before Roentgen's public announcement, developed erythema and
finally ulceration on the back of his hand.
He sought medical aid
twenty-three days after Roentgen's announcement (Mo67).
later, Dr.
J.
Three months
Daniels of Vanderbilt reported that one of his
colleagues had lost his hair following x-ray examination of his skull
(E143).
Fourteen months after Roentgen's announcement, 69 cases of skin
damage due to x rays were reported (Sc97).
Thus from its beginning, the
use of x rays on humans has had the potential to be both beneficial and
harmful to mankind.
Today in this country, the largest use of x rays or other ionizing
radiation on humans is in the practice of medical diagnostic radiology.
According to the estimates of the Advisory Committee on the Biological
Effects of Ionizing Radiations (BEIR Committee) of the National Academy
1
2
of Sciences, medical diagnostic use of x rays is by far the largest manmade source of radiation exposure to the U.S.
population.
Further it is
estimated that medical diagnostic radiology comprises 40% of the total
U.S. population's exposure to all sources of ionizing radiation.
Figure 1 shows a summary of the BEIR Committee's estimates for 1970
(BEIR72).
Although actual whole-body doses for individuals and average
whole body-doses for subsets of the population may vary greatly from the
estimates of average whole-body doses presented, clearly medical diagnostic radiology is overwhelmingly the largest source of man-made radiation
exposure and is definitely non-trivial in comparison to the U.S. population's total radiation exposure from all sources.
A major job of the health physicist is "...to prevent acute radiation
effects and to limit the risk of late effects to an acceptable level
(ICRP66)." In accomplishing this task, it is necessary that the health
physicist quantify various aspects of radiation fields and relate his
measurements to given radiation safety standards (Ri72).
Any radiation field of one type (i.e., alpha, beta, neutron, photon,
etc.) can be described by specifying its fluence distribution $(E, ft),
where $(E, ft) is the number of particles of energy E per unit energy and
with direction ft per unit solid angle.
is
If $(E, ft) for one type of radiation
known at all points of interest in a radiation field, then in principle
any quantity can be calculated.
However, the early x-ray and other
radiation researchers had neither a comprehensive knowledge of the nature
of radiation nor the electronic and solid-state technology necessary to
make spectral measurements as we know them today.
So it is not surprising
that the ability of x rays to ionize gases was the basis of the first
widely accepted standard of radiation measurement.
NATURAL
BACKGROUND
RADIATION
56%
4 % OTHER SOURCES INCLUDING
GLOBAL FALLOUT, NUCLEAR POWER,
RADIOPHARMACEUTICALS, OCCUPATIONAL AND MISCELLANEOUS SOURCES
Figure 1.
A Summary of BEIR Committee Estimates of Annual WholeBody Average Dose Rate in the United States in 1970
(BEIR72).
4
The quantity, exposure, defined as the amount of ionization produced by electromagnetic radiation in equilibrium with its secondary
radiation in a reference amount of air, was formalized by the International Commission on Radiation Units by its definition of the
roentgen ,in 1928 (ICRU28).
One of the earliest proposed radiation
protection standards related biological effect to the exposure produced
by an incident x-ray field (Mu25).
As the energy of available x-ray
beams increased and as other forms of radiation were discovered, it
became obvious that quantifying a radiation field in terms of exposure,
alone, was insufficient or inappropriate.
measurements
When reporting x-ray
exposure
it became common practice to include some information re-
lated to the energy spectrum, such as generating potential and filtration
(Ri72).
This technique of specifying the exposure together with limited
spectral information is still used today by radiotherapists in calculating the internal distribution of energy deposited by external beams of
photons (Jo69).
Today exposure is defined as
The quotient of dQ by dm where dQ is the absolute
value of the total charge of the ions of one sign
produced in air when all the electrons liberated by
photons in a volume element of air having mass dm
are completely stopped in air (ICRU71).
Although this definition is the end product of several revisions
made in order to remove ambiguities and to increase rigor, it describes
essentially the same quantity that was defined in 1928. The special
unit of exposure is the roentgen (R), where 1 R is exactly equal to 2.58
-4
x 10 coulombs per kilogram.
5
Two other quantities are commonly used in quantifying aspects of a
radiation field with respect to risk.
One is absorbed dose, which is de-
fined as
The quotient of de by dm, where de is the mean
energy imparted by ionizing radiation to the
matter in a volume element and dm is the mass
of the matter in that volume element (ICRU71).
The special unit of absorbed dose is the rad, where 1 rad equals 10
joules per kilogram (or 100 ergs per gram).
_2
The other quantity, speci-
fically designed for radiation protection applications, is the dose
equivalent, H, which is defined as,
The product of D, Q, and N, at the point of
interest in tissue, where D is the absorbed
dose, Q is the quality factor and N is the
product of any other modifying factors. The
special unit of dose equivalent is the rem.
When.D is expressed in rads, H is in rems
(ICRU71).
The quality factor is a weighting factor chosen, somewhat arbitrarily, to
indicate the biological effectiveness of a given absorbed dose of different types of radiation.
be unity.
For x-radiation the quality factor is chosen to
The factor, N, is to allow for the effects of the distribution
of absorbed dose in space and time.
For external sources this factor is
chosen to be unity. Although the concept has been criticized for its lack
of physical basis, its imprecision, and the difficulty of its determination,
the dose equivalent is used in the most general expression of risk (Ri72;
Th75).
For the purpose of having radiation protection units conform to the SI
system of units, two other units have been introduced recently.
The gray
(Gy) is a unit of absorbed dose and is equal to 100 rads. The sievert (Sv)
6
is a unit of dose equivalent and is equal to 100 rems.
However, since
there is some uncertainty regarding the general acceptance and use of
these units in the U.S., they will not be used in this text.
It might also be noted that there is a loose correspondence between
the exposure (measured in roentgens) of an x-ray field and the absorbed
dose (measured in rads) to a small mass of muscle tissue placed in that
field.
The absorbed dose to muscle equals 95% +_ 2% of the exposure.
This
numerical correspondence is due to the size of the constants used in defining the units and to the fact that the propensities of air and muscle
per unit weight to absorb energy from an x-ray beam do not vary much relative to each other over a wide range of x-ray energies.
However, the
absorbed dose in bone may be greater than four times the absorbed dose in
muscle or the exposure in air at particular energies within the range
typically used in medical diagnostic radiology (J069).
It is widely accepted,
... that in the vast majority of cases, exposure to
ionizing radiation results in an increase in the entropy or disorganization of cell guidance provided
(jy the vast library of information contained in the
nucleus of a target cell, be it a somatic or germ
cell. On this basis alone it is difficult to conceive of the existence of a threshold or safe level
of exposure to ionizing radiation (Mo71).
On the other hand, it is obvious that in many cases (but not all), the
use of medical diagnostic x rays provides great benefit to the patient.
Estimates of risk are quantified in terms of the basic quantities and
units outlined above.
From the standpoint of decision making, it is
unfortunate that there is no accepted method for quantifying estimates
of benefit.
7
In 1972 the BEIR Committee published a report on the effects of low
levels of ionizing radiation.
After a "review and re-evaluation of exist-
ing scientific knowledge concerning radiation exposure of human populations," the BEIR Committee arrived at some "best estimates" of radiation
risks (BEIR72).
Estimates of the long-term effect of exposure of the U.S.
population such that the average dose equivalent rate from all sources was
170 mrem/year included:
1.
An incidence of 0.75% (per year) of serious genetic or
partially genetic defects and
2.
An increase of 5% in the ill-health of the population
(assuming that 20% of ill-health is proportional to
mutation rate, a 20 rem doubling dose, and a 5 rem
per 30 year reproduction generation).
3. An increase of about 2% in the cancer death rate
(about 0.3% in the overall death rate from all causes)
(BEIR72).
Although the estimates of exposure from medical diagnostic x rays and
the estimates of effects of ionizing radition are filled with uncertainties,
it is apparent that the effects are non-trivial. Morgan estimates that
current medical diagnostic x-ray practice results in 4,100 to 78,000 deaths
per year (Mo71).
Unquestionably diagnostic radiology also saves many lives.
The health physicist and the medical professional, although their manner and
methods are different, are concerned with minimizing human suffering.
The
goal of reducing the adverse effects while maintaining or improving the
quality of medical radiology should be actively pursued by both.
Therefore
it is not surprising that among the BEIR Committee recommendations are the
following which concern, in whole or in part, medical diagnostic x-ray exposure:
1.
No exposure to ionizing radiation should be permitted
without the expectation of a commensurate benefit.
8
2.
The public must be protected from radiation but not to
the extent that the degree of protection provided results in the substitution of a worse hazard for the radiation avoided.
3.
Medical radiation exposure can and should be reduced
considerably by limiting its use to clinically indicated procedures utilizing efficient exposure techniques and optimal operation of radiation equipment.
Consideration should be given to the following:
1) Restriction of the use of radiation for public
health survey purposes, unless there is a reasonable probability of significant detection
of disease;
2) Inspection and licensing of radiation and ancillary equipment;
3) Appropriate training and certification of involved personnel. Gonad shielding (especially
shielding of the testes) is strongly recommended as a simple and highly efficient way to reduce the Genetically Significant Dose.
4.
Every effort should be made to assure accurate estimates and predictions of radiation equivalent dosages
from all existing and planned sources (BEIR72).
Partly due to the recent criticisms of the traditional, but accepted,
dosimetric quantities, a new approach to radiation dosimetry has been proposed (Hu74).
In this system, time-dependent probabilities for a specific
biological effect in a given species are operationally derived from basic
aspects of the radiation field.
In this formalism, the flux density,
<j>(E,ft,r,T), is the general description of a radiation field present in (or
incident upon) a biological system or subsystem.
* _).
The E, n, r, T indicate
the energy, angular, positional, and time dependence of the field.
P. .(t > T ) is the probability of observing the biological effect i_ in
species j_ at any future time t > T .
It is assumed that an operator exists
such that:
°ij * ( T )
= P
ij
(t > T )
(1_1)
-V
where the arguments E, n, r have been suppressed for convenience and where
9
0.. is the operator which links the field with effect i_ in species j_.
iJ
Assuming that 0.. exists, equation (1-1) is merely the mathematical
expression of assuming the principle of cause and effect.
In practice,
the operator 0.- might be very difficult to define accurately enough to
make the solution of equation (1-1) feasible.
A set of measurements made in a radiation field can be expressed as
R(e, ft, r, T ) where e is the energy deposited in the detector and the
other arguments are as before.
For some detectors, i.e. spectrometers, it
is possible to deduce <j>, the general description of the radiation field.
That is there is an operator, 0., characteristic of the detector, such
that:
0dR(e,ft,r,T) = <j>(E,ft,r,T)
(1-2)
is simply stating mathematically that the detector is a spectrometer.
Equation (1-2) implies that an unfolding procedure such that the spetral flux density distribution, <j>, can be deduced from the spectrometer
measurements, R. Performing this unfolding with reasonable accuracy may
be difficult or impossible.
It often requires computer-programmed, iter-
ative methods and may lead to answers with large uncertainties (He74).
Equation (1-3) can be derived from equations (1-1) and (1-2):
0 ^ 0 d R(e,ft,r,T) = Or.. R(ei,r,i) = P... (t > T ) .
(1-3)
If the operator, 0.., exists and can be adequately defined, then unfolding
to find <j>(E,ft,r, T ) is not necessary.
Further, in principle, 0j. may
be built into the electronics of a detector such that it reads probability
of biological effect directly.
Thus instead of using "rad-meters" or
10
"rem-meters", health physicists might have "cancer-meters" or "sickness
meters."
Hurst, Garrett, and Payne conclude their article by recommending
that radiobiological experiments be" conducted in such a manner that the
time-dependence of particular effects can be inferred and that radiation
protection instrumentation research should "concentrate more on those
methods which can characterize the radiation field" (Hu74).
The objective of the research presented in this dissertation was the
design, development, and application of a spectrometric dosimetry system
for use in experiments simulating medical diagnostic x-ray exposure configurations.
The applications of the system v/ere to include:
1. A demonstration of the feasibility of spectrometric
dosimetry measurements.
2.
Determination of the values of various dosimetric
parameters within an anthropomorphic phantom and comparison of these with values determined by other
methods.
CHAPTER II
THEORY
Production of X rays
Energetic electrons colliding with atoms may generate x rays in
one of two manners.
When a collision causes a vacancy to occur in an
inner shell of an atom's electronic structure and when that vacancy is
filled by an electron transition from a higher shell, an x ray may be
produced.
The energy of the emitted photon is equal to the difference
between binding energies of the initial and the final state of the
electron undergoing the transition.
Since the binding energies of the
different levels are characteristic of each element, x rays so produced
have an energy which is determined by the atomic number of the radiating
atom and the particular transition which occurred.
Such x rays are
called characteristic x rays.
An inner shell vacancy may also be filled by a nonradiative
process.
During the transition, the binding energy difference may be
imparted to an outer shell electron, and thus no x ray is produced.
ejected outer shell electron is called an Auger electron.
The
The probability
of x rays being emitted from a vacancy in a particular shell is called
the fluorescence yield (Ev 65).
Characteristic x rays are labeled according to the initial and
final states of the electron undergoing transition.
X rays originating
from vacancies in the K shell are called K x rays and are subscripted by a
and 3 to indicate that the electron undergoing transition originated in
11
12
the L or M shell respectively.
Further, numerical subscripts are used to
indicate the particular sub-shell as needed.
The energy of K x rays varies
p
roughly as (Z-l) , (where Z = atomic number) and for example, the K -,
x ray of oxygen, sodium, iodine, tungsten, and lead are 0.52, 1.04,
28.6, 59.3, and 75.0 keV respectively.
The K-shell fluorescence yield
increases as a monotonic sigmoid with increasing atomic number.
The
K-shell fluorescence yield for low Z elements, such as oxygen and
sodium, are indeterminately small. Auger electron emission is the overwhelmingly preferred process for such elements to fill an inner shell
vacancy.
On the other hand the K-shell fluorescence yield for
iodine, tungsten, and lead are 86%, 94%, and 97% respectively (Le67).
Swift electrons may also create x rays directly by inelastic
collisions with atomic nuclei. As the incident electrons are deflected
and decelerated by the Coulomb field of a nucleus, "braking radiation"
or bremsstrahlung is emitted.
For incident electrons with a given
kinetic energy, E m a v , the energy fluence, ^(E), of the emitted
max
bremsstrahlung, in any particular direction is constant for E <_ E m a v
max
and zero for E > E
.
Hence the number of photons of a given energy
(i.e., fluence, $(E)) varies inversely with that energy (Ev65).
A rigorous theoretical treatment of the production of
bremsstrahlung by electrons incident on a single atom requires theory
from quantum mechanics.
The treatment of the production of bremsstrahlung
in targets of finite thickness must include a description of the transport
of swift electrons in the target material.
Because this transport is, in
Energy fluence, ^(E), is defined as the product of the fluence, $(E),
and the energy, E.
13
general, so complex, an exact theoretical treatment of x-ray production in
"thick" targets is impossible. However, a simplified description based on
semi-empirical and numerical methods, has been developed, and produces
results which are in agreement with data determined by direct experiment
(Ev65). The energy fluence, y, as a function of photon energy, E, is
described by
dv(E) « Z(E m a x - E) dE
(2-1)
where Emax
_ is the kinetic energy
*J of the incident electrons and Z the
atomic number of the target. The shape of the energy fluence spectrum
suggested by equation (1-1) is that of the sum of "thin" targets each
being bombarded by electrons of decreasing kinetic energy (Ev65). Since,
in practice, x-ray tubes must be enclosed, useful forms of equation (1-1)
usually include a term which reflects the absorption of low energy photons by the tube housing. Then equation (1-1) becomes
dv(E) « z(E m a x - E) exp - y(E)d dE
(2-2)
where y(E) is an attenuation coefficient for the inherent filtration of
the x-ray tube envelope and d is its thickness. The y(E) for various
materials can be approximated by
v(E) = A + ^ r
E
(2-3)
where n>2 and A, C, and n are positive and are empirically determined.
Thus the exponential term in equation (2-2) is rapidly decreasing below
a particular value of E and causes the low energy end of the spectrum to
have a "cutoff" (Jo75).
14
In addition to producing x rays, swift electrons produce much heat
in an x-ray target via ionization and excitation interactions.
The
fraction, f, of total incident energy converted into bremsstrahlung in a
thick target is approximately
f = Z E(7 x 10" 7 )
where E has units of keV (Ev65).
(2-4)
Tungsten, which has a high melting
point and a large atomic number (Z = 74), is a common x-ray target material.
According to equation (2-4) only 0.5% of the kinetic energy of 100 keV
electrons incident on a tungsten target is converted into x rays. The
other 99.5% is converted into heat in the target.
Tungsten's high melting
point protects against excessive target burnout.
Interactions of X Rays with Matter
X rays with energy in the range of 10 to 150 keV interact with
matter in three major ways.
The processes are photoelectric absorption,
Compton scattering, and Rayleigh scattering.
All three are interactions
between photons and atomic electrons. Although photon interactions with
nucleons, electric fields, and meson fields of nucleons are possible in
some cases, such interactions for typical x rays are either energetically
forbidden or insignificant in comparison with the electron-photon
interactions.
Pair production is an important interaction for photons
with energies above 1.22 MeV but is energetically forbidden in the energy
range typical of diagnostic x rays.
In the photoelectric process an incident photon is completely
absorbed by interacting with and ejecting one of the atom's orbital
electrons.
The kinetic energy of the ejected electron is almost entirely
15
the energy of the photon less the binding energy of the ejected electron.
Although the rest of the atom recoils slightly in order to satisfy the
conservation of momentum requirements, it has little kinetic energy
imparted to it. The vacancy in the electronic structure of the atom is
filled by a radiative or nonradiative process as discussed in the previous
section.
Compton scattering is a process in which a photon is deflected by
an atomic electron. It can be considered to be a two-body process, since
in cases where the binding energy of the struck electron is significant,
photoelectric absorption is an overwhelmingly more probable interaction
(Ev65). In a Compton process the energy and momentum of the incident
photon are partitioned between the deflected photon and the struck electron
Using the relativistic expressions for total energy and momentum, the
following well-known equation can be derived.
hv' _
l"K>
0
1
1 + a(l
- COS
(2-5)
9)
where hv and hv' are the energies of the initial and scattered photon,
2
a = hv /m c , and e is the scattering angle of the photon. The maximum
energy transferred, T v, occurs when e = 180. The maximum fraction of
max
energy transferred can be written as
max _
1
h ^ T - 1 + (l/2a)
/« c\
(2 6)
"
Thus a 10 keV photon may lose only 4% of its energy in a Compton interaction, while a 100 keV photon may lose 28% of its energy in single
Compton scattering event.
16
Rayleigh scattering is a two-body process in which a photon is
deflected by an atom as a whole, producing neither atomic excitation nor
ionization.
Analyzing such a collision by requiring conservation of
relativistic momentum and energy, yields an equation homologous to the
Compton equations, (2-5) and (2-6), except that a = hv /M c , where M
is the rest mass of the atom.
Thus a 50 keV photon incident on a hydrogen
atom (M ^L 1837 m ) could lose at most 5 eV of its energy.
More detailed
analysis of the physics of Rayleigh scattering shows that Rayleigh
scattering must be confined to small angles.
For 100 keV photons inci-
dent on aluminum, more than half of the radiation is scattered less than
15°.
Thus Rayleigh scattering (or "coherent" scattering) removes negli-
gible amounts of energy from a photon field (Ev65).
The quantification of the interaction of photons with matter in the
simple case of a beam incident upon a slab usually leads to an exponential
type equation of the form
A = k
e" B x
•
(2-7)
o
Equations of the form of (2-7) are used to compute photon fluence and
flux density, energy fluence and flux density, and energy deposition
and interaction site distributions.
The coefficients and parameters of
equation (2-7) are adapted to the particular situation being studied
and the definitions of such parameters are given in many locations (ICRU71
Ev65; Ro68a; Jo69; Mo67).
flux density, A
Briefly, if A describes the photon fluence or
is the quantity before attenuation, B is the linear
attenuation coefficient, y, and x is the depth into the material.
Alternatively, B is y divided by p, (p = the density), is expressed in
17
terms of area per unit mass and is called a mass-attenuation coefficient.
In this case the x term is the product of the depth and the density and
has units of mass per unit area. Other common coefficients and parameters are explained in Table 1.
There are several consequences of the fact that equations of the
form of (2-7) are macroscopic descriptions of processes that occur
between photons and electrons. First is the fact that interactions at
the photon-electron level are independent (i.e., a photon may not interact
photoelectrically and Compton scatter with the same atom). Thus the
interaction coefficients can be broken down linearly, and the linear
attenuation coefficient may be expressed as
M
= T + a + n
(2-8)
where x, a, and n are the partial attenuation coefficients for photoelectric absorption, Compton scattering, and coherent scattering respectively. Similarly if an absorber is made up of a number of elements of
various atomic numbers, then the mass attenuation coefficient for the
compound or mixture can be calculated by
*
= w,
^ + 2w 9p *
] p
Material
l
2
+ 3w,p * + ...
3
(2-9)
where w-,, w2> w~, ... are the fractional amounts by weight of each
element, and the (y/p)'s are the respective attenuation coefficients of
the elements in the absorber.
A second consequence of the atomic scale of the interactions of
radiation with matter is its statistical nature. Thus equations of the
By
Table 1. Coefficients and Parameters of Exponential Attenuation Equations of the Form
A and A Quantity
Name, Symbol, Description
fluence, $, photons/unit area
B Coefficients
Name, Symbol, Description
A =A e
x-Parameters
Symbol, Description
linear attenuation coefficient, y, per unit
length
x, length
mass attenuation coefficient, y/p, area/unit mass
px, mass/unit area
Notes
p = density
n
cross-section per atom, a or a, area/atom
flux density, <f>, -rr
_ cross-section per electron, g a , area/electron
Q „ Qt ™w
u
l Mjr
"
* i, „«»„,.«»
u,
• " j -"^ v -» '»
un
energy
i t area
Am
energy flux density, i|>, -rr-
„ //A
pxv n
A , —-;atoms
o ' u n i t area
v„ 7/A electrons
aXn Z/A, —rr—
o
u n i t area
linear enerqv absorDtion coefficient, u . Der
unit length
' en ' "
x. length
en
mass energy absorption coefficient, -^-,
p
area/unit mass
px, mass/unit area
= Avogadro's
number
A = atomic
weight
Z = atomic
number
19
form of (2-7) only predict the expected values.
The actual results of
attenuation experiments will have a statistical variation which should
follow Poisson statistics.
The standard deviation of a set of measure-
ments of fluence is estimated by the square root of the mean value.
When
large numbers of photons are encountered in radiation fields (e.g., 1 mR
7
2
corresponds to a fluence of 3 x 10 photons/cm of 60 keV photons),
statistical uncertainties are small.
However, the statistical nature of
radiation interactions gives a probabilistic connotation to the coefficients in equations of the form of (2-7).
The magnitude of the cross
section, a (area/atom as given in Table 1) is the probability that a photon
incident upon a unit area containing one atom will interact with that atom.
The mean range, X, of a photon in a material can be computed by
r x e^xdx
x-'-l
r0
,
-I .
(2-10)
x
e- dx
Similarly, the thickness of an absorber necessary to reduce the incident
intensity of a beam to one half its original value (often called half
value layer, H.V.L.) is defined as
H.v.L. = M = 0J93
#
(2_11}
For the purpose of discussion in this text, the description of the
interactions of radiation with matter is limited to the photon energy
range of 10 to 150 keV.
The upper limit was chosen because common radio-
graphic techniques do not employ generating potentials above 150 kV. A
20
lower limit of 10 keV was chosen because photons of this energy or lower
have a mean free path in tissue which is very small compared with the
dimensions of the human body and the dimensions of most human organs
(x = 0.16 cm in reference man soft tissue for 10 keV photons).
However,
the low energy (< 10 keV) photon interactions in tissue would be of
interest in the study of the mechanisms of radiation effects in biological
material.
Figure 2 shows the values of the mass energy absorption co-
efficient and partial mass attenuation coefficients in tissue as a function
of photon energy.
A computer-coded formulation of equation (2-9) incor-
porating the elemental composition of reference man soft tissue (ICRP75)
and published values of the partial mass attenuation coefficients for the
elements (Mc69) was used to calculate the coefficients presented (St74).
The data presented in Figure 2 shows the relative importance of
photoelectric absorption and Compton scattering in soft tissue.
For the
purpose of discussion, the energy region from 10 to 150 keV is subdivided
into three regions. Above about 55 keV, the Compton process is the most
probable type of interaction in soft tissue and also is responsible for
50% or more of the energy absorption by soft tissue from all processes.
(For 100 keV photons Compton interactions in soft tissue are 57 times
more probable than photoelectric interactions and account for 90% of the
energy absorption.)
Just below 30 keV photoelectric absorption is the
most probable type of interaction in soft tissue and is the dominant mode
of energy absorption.
In the middle region from 30 to 55 keV, the Compton
interaction cross section in soft tissue lis the largest, but photoelectric
absorption is responsible for most of the energy absorption.
21
4.34
- i
PHOTOELECTRIC PARTIAL MASS
ATTENUATION COEFFICIENT
COMPTON PARTIAL MASS
ATTENUATION COEFFICIENT
o
0.4
COHERENT PARTIAL MASS
ATTENUATION COEFFICIENT
TOTAL MASS ENERGY
ABSORPTION COEFFICIENT
0.3
CM
e
o
0.2
0.1
10
20
30
in
60
100
150
PHOTON ENERGY (keV)
Figure 2.
Mass Energy Absorption and Partial Mass Attenuation
Coefficients for Snyder-Fisher Soft Tissue (St74).
22
Coherent scattering usually is ignored, dismissed, or discussed
yery sketchily in most treatments of the interactions of radiation with
matter (Ev65; Ev68, Fr66; Jo69, Mo67; Pr64).
However, the magnitude of
the coherent scattering cross-section in tissue is non-trivial compared
with the magnitude of the Compton interaction cross-section for photons
with energy between 10 and about 55 keV.
The fact that coherent
scattering causes negligible energy absorption in the energy range of
interest usually is given as the reason for dismissing it from dosimetric
discussions.
Nevertheless, it is not obvious to this author that co-
herent scattering has an insignificant role in radiation transport, and
the
effect of coherent scattering is considered in the section of this
text dealing with the tissue-equivalent design of the phantom.
Monte Carlo Calculations
In contrast to the simplicity of calculating the attenuation of a
monoenergetic beam incident on a slab of matter, the solution of radiation transport equations for the scattering (including multiple scattering) and absorption of photons in complex and inhomogeneous geometry
(i.e., a human body) is difficult.
impossible.
In general, closed-form solutions are
Monte Carlo calculations are one method of obtaining numeri-
cal estimates of the solutions of complex radiation transport problems.
In such calculations, which in practice are usually done using a digital
computer, a set of photon "histories" are generated one at a time, and
the results are abstracted from the data provided by generation of the
"histories ." In the simplest form of such calculations, each photon
"history" is started by assigning the photon an initial position, direction, and energy.
The distance that a single photon will travel into a
23
material before interacting is undeterminable.
However, the probability
distribution of the possible penetration distances is given by equations
of the form of (2-7) with x being the distance of penetration, A
=1,
and B being the linear attenuation coefficient (y). In a Monte Carlo
calculation, a photon can be "transported" by selecting a penetration
distance according to this probability distribution and calculating the
coordinates of the first interaction site.
Since the probability distributions for absorption, scattering,
and if applicable, scattering angle are known, the photon can be absorbed
or scattered according to random selections from the appropriate probability distributions.
Thus a photon can be followed from its source until it
either is absorbed or escapes from the region of interest (Ro68b).
As a
set of photon histories is generated, mean values of the amount of energy
deposited in various regions, the number of photons crossing a certain
boundary, or other quantities of interest can be accumulated.
accumulated mean
These
values are estimates of the true mean values.
According to sampling theory, statistical quantities such as
variance and standard deviation can be used to estimate the reliability
of their respective calculated sample means.
The data needed to
calculate the statistical quantities can be accumulated along with the
mean value data.
One statistic often calculated is called the coefficient of
variation.
This quantity is the standard deviation divided by the mean.
It is dimensionless and is usually expressed in percent.
Snyder has
suggested that estimates of absorbed dose determined by Monte Carlo calculations would be expected to vary about the true mean by as much as twice
24
the product of the coefficient of variation times the mean (Sn70).
Thus an
estimate provided by Monte Carlo calculation with a coefficient of variation in excess of 50% should be considered unreliable.
The drawback to Monte Carlo calculations is that although, in theory,
the estimate of any mean value can be determined to any desired degree of
reliability (by following a sufficient number of photons), in practice the
number of histories that can be generated (limited by the amount of computer time available) often does not determine an estimate with desired
reliability.
The generation of 200,000 histories is not uncommon.
More
sophisticated Monte Carlo calculations use variance reduction techniques
such as weighting, splitting, and Russian roulette, that, although not
directly analogous to physical processes, are statistically sound and improve the reliability of the results (Ca75).
In 1976 the U.S. Bureau of Radiological Health completed a study
of the absorbed dose to several organs from common diagnostic x-ray
exposure situations (Ro76a; Ro76b).
The basis of this study was a set
of 2,716 Monte Carlo calculations, of 30,000 photon histories each. The
calculations were performed using an idealized anthropomorphic model
described in subsequent chapters in this text,. Average absorbed doses
were calculated for the thyroid, ovaries, testes, uterus, and active bone
marrow regions.
Because of the general nature of the model and because of
the simplifying assumptions and methodology used to keep the number of
calculations manageable, the results of the study were not intended to
provide data pertaining to specific individuals.
Rather, it was intended
that the data be used "...to evaluate the effect on organ dose of changes
in technical parameters in or among facilities" (Ro76b).
25
Phantom Measurements
In addition to Monte Carlo calculations, it is possible to obtain
data on the transport and absorption of an x-ray field in a material of
complicated geometry by appropriate measurements.
Obviously to determine
the transport and absorption of radiation in humans by experiment, it is
often necessary to use a substitute structure for reasons of safety, availability, and convenience.
phantom.
Traditionally, such a substitute is called a
For satisfactory simulation it must scatter and absorb radiation
in a manner similar to the biological material it represents.
Early researchers used hollow anatomical models filled with water
as phantoms (Qu37).
Spiers, in attempting to find a dry substitute for
water, developed a method for evaluating the equivalence of one material
with another (Sp43).
He defined a quantity called effective atomic
number as
Z = 2 - 94 Vl V i 2 - 9 4
(2-12)
where A. is the fraction of electrons for element Z., and the summation is
over all elements in the compound.
The effective atomic number reflects
the change in photoelectric cross-section with Z.
Since Compton scatter-
ing cross-sections per electron change little for low Z elements,
materials with similar electron densities and with similar 1 would
interact with radiation fields in a similar manner.
In 1949, the development of a solid substitute for water was
reported (Jo49).
Using the above criteria to determine its equivalence
to water, a substance of 60.8% paraffin, 30.4% polyethylene, 6.4% MgO,
26
and ZA% Ti Op which was easy to mold and machine and remained homogeneous
was made.
The material was called "Mix D," and its water equivalence was
verified by experiment.
Rectangular and human-shaped Mix D phantoms were
used to assess the gonad dose from medical diagnostic x rays (St55; Ad57;
El61; Yo67; Ta72).
Data acquired from Mix D phantoms were used to assess
the hazards to populations from medical x rays by the British and
Japanese government commissions (Gr60; Ja61).
Other water substitute phantoms were used also.
Rectangular phan-
toms of "Pressdwood" (or Masonite) were used to estimate gonad doses (We57;
Bi57; Ja67).
Human-shaped pressdwood phantoms with a human skeleton in-
serted and with cork substituting for the lungs were used to measure bone
marrow and gonad doses (La57; Ep61).
similar measurements (Li58; Du68).
Paraffin wax phantoms were used for
All of these phantoms have the disad-
vantage that they are designed to be equivalent to water not tissue.
For
x rays with energy from 15 to 100 keV water has a 4% larger photoelectric
partial mass attenuation coefficient and an 8% larger coherent scattering
partial mass attenuation coefficient than reference man soft-tissue (St74).
Yet for higher energy photons, for which Compton scattering is the predominant interaction, water and pressdwood are adequate and, their use is
recommended (Jo69).
This suitability of water phantoms for use in experi-
ments involving photons with energy higher than that typical of diagnostic
radiology is not surprising.
In this higher energy range Compton scatter-
ing in soft tissue is overwhelmingly the most important interaction and
Compton scattering cross-sections are directly proportional to electron
density.
Excepting hydrogen, most elements found in tissue (Z < 20) have
a similar electron density since their ratio of atomic number to atomic
27
weight is approximately constant (Z/A ^ 0 . 5 ) .
Thus for energies above
approximately 150 keV, materials which have a density and hydrogen content similar to tissue will absorb and scatter radiation via the Compton
process in a manner similar to tissue.
In contrast to the simplicity of tissue-equivalence for higher energies, the propensity of a material to scatter and absorb radiation with
energy typical of diagnostic x rays is a complicated function of elemental
composition.
Further since the mean free path for photons in the diagnostic
energy range is shorter than for higher energy photons, the tissueequivalence of a substitute material is more important.
For example, a
beam of 300 keV photons passing through 20 cm of soft-tissue (y = 0.111)
would be attenuated to 11% of its original intensity.
The same beam
passing through 20 cm of a material with an attenuation coefficient 10%
larger than soft-tissue would be attenuated to 9% of its original intensity.
Thus an increase of 10% in attenuation coefficient causes a 20%
reduction in transmitted intensity for 300 keV photons incident on a 20 cm
thick slab of soft-tissue. An analogous calculation for 30 keV photons
(y = 0.316 in soft tissue) shows that an increase of 10% in attenuation
coefficient causes a reduction of almost a factor of two in transmitted
intensity.
Thus, for photons in the diagnostic energy range, a small
error in the tissue-equivalence may cause a large error in the absorbed
dose measure at a point remote from the point of incidence of the beam.
In 1966 the Alderson human-shaped inhomogeneous phantom was developed
and made commercially available (A166).
Phantoms of this type are com-
posed of a human skeleton imbedded in tissue-equivalent plastic.
density material for lung regions may be inserted optionally.
The
Lower
28
Alderson phantom is sliced horizontally in two cm thick sections and small
holes are located in each section to accommodate thermoluminescent dosimetry chips or miniature ionization chambers.
Its manufacturers claim it
is "soft-tissue equivalent," but due to the proprietary status of the
tissue-equivalent plastic used, it is difficult to obtain exact information
on its composition.
Further since each human skeleton is different, each
phantom is different and it has been observed by this author that some of
these phantoms have skeletons that are too small for the exterior contours
of the encasing plastic.
Models of this phantom have been used for dosi-
metric studies of diagnostic x rays (Ha72, Va72).
In assessing the state of the art of in-phantom dosimetry studies of
the absorbed dose to organs of radiological interest, two shortcomings
should be noted.
First, much of the research discussed in the preceding
paragraphs has little bearing on the question of somatic risk.
Five of
the eleven studies cited (St55; Aj57; Li58; Du58; El61) presented measurements of gonad doses only.
Four studies (La57, Ep61, Yo67, Ta72) pre-
sented some measurements of absorbed dose to bone marrow regions in addition to gonad doses, and one study (Ha72) presented bone marrow absorbed
doses only.
One study (Va72) employed x-ray film and thermoluminescent
dosimeters "sandwiched" in between layers of a random phantom.
However,
the results presented in this study did little more than confirm the results of Epp ejt al_ (Ep61).
Thus a vast majority of the studies cited
presented data for only a few organs.
A complete study relevant to
somatic risk would have to have data for all radiosensitive organs.
The second major criticism of previous in-phantom dosimetry concerns the methods and apparatus used.
It was not until the late 1950's
29
that the concept of absorbed dose was introduced and formalized officially.
Because definitions were in a state of flux, it is often difficult to determine exactly what quantity was measured in studies performed during
this period.
Also, some phantoms used in previous research were designed
to be water-equivalent, not tissue-equivalent.
The Rando phantoms used in
some studies had undocumented tissue equivalence and variable skeletal
geometry.
As was discussed previously, tissue equivalence may be extremely
important when one material is substituted for another.
Mismatches of 10%
(causing some absorbed dose measurements to differ by a factor of two) for
equivalent maerials for use in diagnostic radiology experiments are not
•inconceivable.
Even ICRU muscle and reference man soft-tissue have mass-
energy absorption coefficients that differ by 7% for 30 keV photons. Thus
materials equivalent to one standard composition will not be equivalent to
another.
In summary, the U.S. Bureau of Radiological Health, in looking
for data from experiments with which to verify their calculations found
that "few experimental data that have been obtained in a scientifically
controlled manner are available with which to compare ..." (Ro76).
Spectrometry studies using phantoms have been of several types.
In
1951 a study of the spectral distribution of scattered and unscattered
radiation in a paraffin block phantom was made (Gr51).
Using the data of
other researchers, the change of exposure measured with a spherical
air-equivalent ionization chamber surrounded with layers of spherical
copper shells of various thicknesses was examined.
Then the exposure rate
as a function of wavelength for unscattered and scattered radiation at the
surface and 10 cm deep in the block was computed.
work is of an approximate and preliminary nature.
Obviously, this early
30
In 1960 and 1967 similar experiments were performed in which a cylindrical tank of water was irradiated with a plane beam (Ma60; Ep67).
A
hollow lucite type was used to "extract" the spectrum of x rays from the
center of the tank and transmit it to an external Nal(Tii) scintillation
spectrometer.
In both experiments the entire apparatus could be rotated
about the axis of the cylinder so that the spectrum of x rays traveling in
any direction could be measured.
Since the tank was positioned horizon-
tally, it could be filled to any desired level and the spectrum could be
measured at various depths from the surface.
Both researchers observed
that the unscattered (or primary) and the scattered spectra became "harder"
(i.e., had a higher average energy) with depth, and as expected for incident spectra typical of medical diagnostic x rays, the scattered x-ray
spectrum was "softer" than the primary.
These experiments are the only
reported attempts to measure the spectral fluence distribution inside a
phantom exposed to medical diagnostic x rays.
Several measurements have been made of the x-ray field scattered
from a phantom exposed to x-ray beams (Tr72, Wa73, Str75).
However, the
purpose of these studies was to determine the half value layer or the
average energy of the scattered radiation in order to design secondary
shielding
optimally.
Their results are not relevant to the question of
the spectrum inside a phantom exposed to diagnostic x-ray beams.
Sodium Iodide Scintillation Spectrometry
Of the many methods for measuring the spectral fluence of an x-ray
field, sodium iodide scintillation spectrometry was chosen as the method
for use in this project.
Despite its inferior resolution, scintillation
31
spectrometry was selected because it allowed a wide latitude in choice
of detector size and shape.
Sodium iodide was chosen, in particular,
because of its high intrinsic efficiency.
The scintillation process in sodium iodide activated with thallium
can be described in three steps.
An energetic electron set in motion by
an x-ray interaction moves through the crystal until it dissipates all
of its energy by ionizing and exciting other electrons.
Some of these
electrons (and their resultant holes) migrate to the thallium impurity
centers.
Some of these excited impurity centers de-excite in a radiative
process.
Thus, if the physics is understood (or if the end result is
known as a function of the initial conditions), the light emitted from
the scintillator in a particular band of wavelengths can be related to
the kinetic energy of the energetic electron and, ultimately, the x ray
which initiated the process.
For NaI(T£) the emission band is centered
around 420 nm and the decay time for the scintillation process is about
3 x 10" sec.
Further the light production in NaI(T£) is linear with
respect to initial electron energy for the range of energies of interest
to spectrometry of x rays (Pr64).
To complete the scintillation spectrometry process it is necessary
only to collect the light produced by the scintillator, measure it, and
allow for distortions and fluctuations that may occur.
A light pipe in
optical contact with the crystal is used to bring the light (or at least
a fraction of the light) to the photocathode of a photomultiplier tube.
The light impinging on the photocathode produces a pulse of electrons.
This original pulse is amplified by an electron multiplication process in
the photomultiplier tube.
A preamplifier is used to convert the pulse of
32
charge produced by the photomultiplier tube into a voltage pulse. The
voltage pulse can be shaped and amplified by appropriate electronic
circuitry.
An analog-to-digital converter is used to digitize the magni-
tude of the voltage pulse.
Thus a spectrum of x rays incident upon the
scintillator will produce a spectrum of pulse heights.
A multi-channel
analyzer is used to display and record the pulse height spectrum.
A measured pulse height spectrum can be related to the spectrum of
incident x rays by the operator equation
R(N,6) = 0 d 4>(E,n,r,t)
(2-13)
where <j>(E,n,r,t) is the spectrum incident on the detector, R(N,6) is the
response of the detector system, and 0 . is the operator, characteristic
of the detector system, which relates the two.
R(N,5) is a collection
pulse height spectra with N being channel number, and 5 is a dummy variable
to indicate that for a given incident x-ray spectrum, a distribution of
pulse height spectra would be expected.
if
certain conditions are met.
Equation (2-13) can be simplified
If the rate at which x rays interact
with the scintillator is slow compared with the rate at which the spectrometry system can measure and catalogue the energy of the x rays, the
time dependence of equation (2-13) can be ignored, and the spectral flux
density can be replaced by the spectral fluence.
Similarly if the spatial
and angular dependence of the spectral fluence with respect to the detector
are constant or if the response of the detector is independent of the
angular and spatial distribution of the field incident upon the detector,
these variables can be ignored. In this case equation (2-13) simplifies
to
33
R(N,6) = O d cf>(E) .
(2-14)
Obviously, for an ideal detector, 0 . = 1 and the inversion of equation
(2-14) is trivial.
However, real scintillators have distortions and un-
certainties which make both 0 d and its inverse more complicated.
The operator, 0 ., must account for the difference between the
incident x-ray spectrum and the spectrum of energy deposited in the active
volume of the crystal.
Further, 0. must account for any nonlinearities
in the scintillator's conversion of ionization and excitation into
scintillated light and for any nonuniformity
light.
in the collection of such
Finally, 0., must incorporate the statistical nature of the photo-
multiplier's performance.
Typically, for an input pulse of light falling
uniformly on the photocathode, the electronic output pulse will be any
one of a distribution of output pulses.
The distribution of output
pulses is Gaussian with both the mean and the variance of the distribution
being proportional to the intensity of the light pulse.
To do spectrometry, equation (2-14) is not important but rather
its inverse
•(E) = 0"1 R(N,6)
is the equation which must be solved.
(2-15)
It is agreed (He74; Wa72) that
equation (2-15) is ill-conditioned and the direct inversion of the
operator, 0., to find 0"j is not feasible.
Further,
by a series of
measurements it is impossible to determine R(N,6), the entire distribution
of possible pulse height spectra.
Therefore, the unfolding "problem" is
to determine approximately the incident x-ray spectrum given one or a
few pulse height spectra.
34
The method used to deal with the unfolding problem in this work is
an iterative, numerical method.
As will be discussed in Chapter III, the
response of the detector was determined for uniformly incident monoenergetic beams of photons.
The response functions
Rr (N), Rr (N),
t1
t2
RF (N), ..., were determined for E, = 10, 12, 14, ..., 130 keV. Then for
b
3
'
an observed pulse height spectrum, R(N), a suitable linear combination
was found such that
|A]RE (N) + A 2 R £ (N) + A 3 R £
+ ... - R(N)| <_ G(N)
where G(N) is an acceptable error distribution.
(2-16)
A computer-coded,
iterative successive approximation technique was used to select the
appropriate linear combination (Mc72).
The details of the unfolding
process and the determination of G(N), the acceptable error distribution
are discussed in Chapter III. Obviously
•(E) = A 1 E ] + A 2 E 2 + A 3 E 3 + ...
is an approximate solution of equation (2-14).
(2-17)
CHAPTER III
APPARATUS AND PROCEDURES
An x-ray facility, a spectrometer, and a phantom were necessary
to perform the in-phantom spectrometry measurements in a manner which
simulated diagnostic medical radiology.
Also needed were the electronics
ancillary to the spectrometer and a computer-coded unfolding procedure.
X-Ray Facility
It was deemed necessary that the x-ray facility meet the following
criteria:
1•
Size.
The shielded enclosure had to be large enough so that
spectrometry measurements could be made with minimum scatter
from shielding walls.
2.
Wide range of operating capabilities.
To facilitate
collection of spectrometry data when the point of measurement
was far from the incident beam and the intensity of the x-ray
field was greatly reduced, the x-ray machine had to be capable
of sustained output over periods on the order of 1000 seconds.
To be able to collect data with the spectrometer actually in
the incident beam, the x-ray machine had to be capable of
operating at tube currents on the order of 1 yA.
3.
Simulation of diagnostic x-rays.
The x-ray machine had to
have characteristics, such as inherent filtration and range
of generating potentials, similar to those typical of
diagnostic x-ray machines.
35
36
4.
Stability and regulation.
The x-ray machine had to have good
voltage regulation for the wide variations in tube current.
It had to be a constant potential type machine with minimal
high voltage ripple to ensure that the high voltage wave form
had little variation over the wide range of tube currents.
The x-ray machine output had to be stable and reproducible.
Since an x-ray facility meeting the above criteria was not available, it was necessary to design and construct one.
Figure 3 shows the
layout of the facility, the shielding necessary, and some of the features
of the safety interlock system.
It was felt that neither a conventional
diagnostic nor a conventional therapy x-ray machine would provide adequate
stability and the wide range of operating capabilities needed.
In general
diagnostic x-ray machines are designed to operate at high tube currents
(on the order of hundreds of milliamps) for short exposure times.
Therapy
x-ray machines are designed to operate continuously but with tube currents
between 1 and 20 mA.
Therefore, a cathode-near-ground x-ray machine con-
figuration was devised (see Figure 4 ) , and a therapy-type x-ray machine
was modified extensively to conform to this design.
The cathode-near-
ground configuration is opposite from the conventional anode-grounded
scheme employed in many diagnostic x-ray machines.
The x-ray tube, tube housing, supporting stand, collimator, and oil
cooler were parts of a Siemens 250 kV therapy x-ray machine.
A therapy-
type-tube was chosen so that the x-ray machine could be operated continuously for as long as necessary to measure the spectra at locations
remote from the incident beam.
However instead of being operated in the
bi-polar mode, the anode was operated at positive voltage, and the cathode
was operated at near-ground potential.
37
LAB BENCHESv
.PRIMARY SHIELD
/ SECONDARY SHIELD,
V/////////M///////A
/
W
^
TRANSFORMER
X-RAY TUBE
SHIELD
D
^
ra
CONTROL
CABINETS
TUBE
STAND
-, v///////////////// rrrA
0
DO
A
»
7
ROTATING MAGENTA BEACON
SPEAKER
MICROSWITCHES
EMERG. "OFF" PUSHBUTTON (MUSHROOM HEAD)
KEY INTERLOCK
INTERIOR 20'x 20'
PRIMARY SHIELD 16" CONCRETE
.
. \xfl.U | r u
n,on
SECONDARY SHIELD 8" CONCRETE OR %"
'8 Pb/ °
Figure 3. Floor Plan for the X-Ray Facility.
X-RAY TUBE
lOMXlp.
V W + \
150 kV
10 mA
POWER
SUPPLY
R
2*
rVv\/
KJ
x
U1
^M
VWt-/^
IOM
^
I V
I M
TUBE
CURRENT
NTEGRATOR
Figure 4.
REFERENCE
VOLTAGE
SUPPLY
X-Ray Machine Schematic
3 * \Z
VVV L +
1/1
r^C-r V
^ —
R„
IOO Mn
+ ^ FILAMENT
POWER SUPPLY
R
^
39
The positive high voltage was provided by a vacuum-tube regulated
supply capable of 20 mA up to 75 kV and 10 mA up to 150 kV.
In this
commercially available supply, an internal resistance chain provided
feedback such that the voltage drop through the vacuum tube was
continuously adjusted to provide a constant potential output. After procurement of the voltage supply, it was tested to ensure that it met the
contracted specifications.
During this testing the high voltage com-
ponents were suspended in air, and the supply was operated at voltages
up to 40 kV.
A series of high voltage resistors were used to provide a
test load that would draw approximately 3 mA at 40 kV.
An oscilloscope
was used to observe the shape of the high voltage waveform.
The root-
mean-square value of the ripple in the high voltage waveform at 40 kV was
observed to be approximately 0.05%.
Later, the output voltage, digitally
selectable, was measured with a 1000 megohm, temperature-compensated
voltage divider in parallel with the x-ray tube.
calibrated to an accuracy of 1%.
The voltage divider was
The selected output voltage agreed with
the measured voltage within the 1% accuracy of the voltage divider.
This
agreement was checked for all operating voltages used in subsequent
experiments and for currents from full load to the current drawn by the
voltage divider (nominally 0.1 mA). An increase in output voltage of at
most 0.3% was observed when the tube current was varied from full load
(10 mA) to minimum load (1 yA).
The circuitry to control the tube current is pictured schematically
in Figure 4.
Operational amplifier Ul controls the filament current
power supply by comparing the voltage developed by the tube current
passing through Rl with the voltage provided by the reference voltage
40
supply.
Operational amplifier U2, its feedback capacitor, and input
resistors prevent the relatively fast operational amplifier circuitry
from over-regulating the slower filament,.
Typically time constants from
one to ten seconds were necessary to prevent tube current oscillations.
The integrator measures the tube current and serves as a timer via its
trip control.
The output of the x-ray machine was calibrated with a Victoreen
Radocon III ionization chamber and electrometer dosimetry system.
The
3
two chambers employed for these measurements had volumes of 32.6 cm and
3
326 cm , respectively.
The dosimetry system including probes was cali-
brated by the manufacturer with filtered x-ray beams with effective
energies of 15, 21, 32, 34.5, 42, 50, 64, 84, and 140 keV.
The measured
exposure rate as a function of generating potential is shown in Figure 5.
It is a rule of thumb that the exposure rate of a diagnostic x-ray machine
should vary proportionally with the square of the generating potential
(Ch70).
The reference line with a slope of 2.0 in Figure 5 shows that the
exposure rate of the x-ray machine follows this rule.
Also the exposure
rate was measured over the entire range of tube current (see Figure 6 ) .
At a given generating potential the variation of exposure rate per unit
tube current was generally less than the +2% accuracy claimed for the
Radocon III. The horizontal dashed lines in Figure 6 are not "best fit"
but are presented for reference only.
It was necessary to use the 32.6 cm
above 3 mA and the 326 cm
3
At 3 mA the 32.6 cm
chamber for tube currents
chamber for tube currents of 3 mA and below.
3
chamber measured 1% higher than the 326 cm
cham-
ber. Thus it is presumed that the indicated increases in exposure rate
I 20
1
I
I I I II
I
O
<D
{/)
or
^E 10
LU
I<
cr
LLI
or
cr>
o
QX
LU
Q
LU
M
REFERENCE LINE WITH
SLOPE = 2.0
or
o
10
20
50
100
200
GENERATING POTENTIAL (kVcp)
Figure 5. Exposure Rate at a Target to Detector Distance of 100 cm
as a Function of Generating Potential.
500
E
o
O
O
8
i„ M— i—-5—^
<
Z&
Ct
5_ -5--$
5-
5
^—-..
° 100 kVcp
A 80 kVcp
o 60 kVcp
HORIZONTAL LINES
FOR REFERENCE ONLY
E
o 7
<v
<
at
E
5
5—5
-I—-5-
x
ct 5
-F*
ro
Z>
CO
o
Q_
LU 4
O
LU
M
_J
;
Q_D
D—-c
O
w —-n
TT
w
„
< 3
=s-
ff—1
ct
o
10 mA
1mA
100 fi A
10/xA
TUBE CURRENT
Figure 6.
Normalized Exposure Rate as a Function of Tube Current
(Error Bars Correspond to ±2% Plus the Least Significant
nicit llnrprt.aint.vV
43
measured for tube currents from 5 to 15 mA are merely artifacts due to
the difference in sensitivity of the chambers.
It is not known whether
indicated decreases in exposure rate measured for tube currents below
10 yA are due to a change in sensitivity of the dosimetry system or are
due to an actual decrease in the output of the x-ray machine.
Neverthe-
less, since all variations are less than +_ 3%, it was decided to treat
all subsequent data as if the output of the x-ray machine as a function
of tube current was essentially constant.
The spectral output of the x-ray machine was measured using a
Ge(Li) spectrometer.
The spectrometer had an active depth of 7.1 mm and
a 0.25 mm beryllium window.
The resolution of the Ge(Li) spectrometer
was determined to be 0.9 keV full-width at half-maximum (FWHM) for a
241
60 keV photon ( Am). Since the magnitude of the resolution was small
compared with the width of the spectra to be measured, it was felt that
no corrections for the Gaussian broadening of the Ge(Li) spectrometer
data were necessary.
However it was advised that the counting rate at
which the spectrometer was used be kept less than 1,000 counts per
second to avoid degrading the resolution (Be76).
Several steps were taken
to limit the counting rate.
The spectrometer was positioned 3 m from
_3
the x-ray tube target, and a collimator with an aperture of 7.7 x 10
2
cm was placed directly in front of the spectrometer. Spectra were
measured for 60, 80, and 100 kVcp generating potential with tube currents
2
of 25, 10, and 6 yA, respectively.
These measured spectra are presented
graphically in Figures 7, 8, and 9.
The raw data spectra shown are the
2
The cp_ in kVcp denotes the constant potential nature of the generating
potential.
44
1.0
/ArfcRAW DATA
0.9
_T "BINNED" DATA
0.8
/
-£
o
o
0.7
M
"o
£
0.6
w.
O
c
>t
w.
O
0.5
-Q
k_
O
UJ
o
0.4
LU
3
0.3
0.2
0.1
10
20
30
40
50 60 70
ENERGY (keV)
80
90
100
Figure 7. X-Ray Machine Output Spectrum Measured with a Ge(Li)
Detector — 60 kVcp.
45
1.0
0.9
» R A W DATA
BINNED DATA
0.8
0.7
0.6
>»
£
0.5
0.4
0.3
0.2
0.1
0
10
20
30
40
50
60
70
80
90
100
ENERGY (keV)
Figure 8.
X-Ray Machine Output Spectrum Measured with a Ge(Li)
Detector — 80 kVcp.
46
1.0
0.9 L-
Afc RAW DATA
BINNED
DATA
0.8
|
0.7
o
N
I 0.6
k.
o
c
2
0.5
w.
O
B 0.4
UJ
U*«vJ
Z)
^
0.3
0.2
0.1
0
10
20
30
40
50
60
70
ENERGY (keV)
80
90
100
Figure 9. X-Ray Machine Output Spectrum Measured with a Ge(L1)
Detector — 100 kVcp.
47
pulse height spectra acquired with the Ge(Li) detector.
To facilitate the
comparison of these spectra with the spectra acquired with the NaI(T£)
spectrometer described in the next section, the data were grouped into
"bins" 2 keV wide as follows.
The raw data were corrected channel by
channel to account for intrinsic efficiency losses due to the finite thickness (7.1 mm) of the Ge(Li) detector.
Next, the fluence in any "bin" was
taken to be the average value of the corrected counts in the raw data
channels whose energy lay within the boundaries of the "bin."
Both the
raw data and the "binned" spectra shown in Figures 7, 8, and 9 have been
normalized so that their integrals have the arbitrary value of
1.0 photon/
cm .
The absorption edge prominent in all three spectra is centered at
37.4 keV.
This edge was caused by barium contained in the glass envelope
of the therapy-type tube, and a similar barium edge has been observed by
other researchers studying the spectrum of a similar tube of the same
brand (Gi75).
An approximate calculation showed that 0.016 gm/cnr
(+. 10%) of barium was necessary to produce an edge the size of the one
pictured in Figure 9.
If it is assumed that the glass envelope is
0.1 cm thick where the x rays exit the tube and that the glass comprising the envelope has a density of 3.0, then the barium content of
the glass is approximately 5% by weight.
Barium oxide is one of the
materials added to glass to adjust its thermal expansion coefficient.
Glass used to make x-ray tubes must have a thermal expansion coefficient
similar to the metal components which penetrate the glass envelope in
order that adequate glass-to-metal high vacuum seals can be made.
The
amount of barium added to x-ray tube glass varies from manufacturer to
48
manufacturer and from one batch of glass to another produced by the same
manufacturer (Si77).
Figure 10 shows the comparison of the 80 kVcp spectrum measured in
this study (Figure 8) with a measured spectrum reported by Atkins as
"representative of those used in diagnostic radiology" (At75).
This
reported 80 kVcp spectrum was produced with a beryllium-windowed x-ray
tube with 2 mm of aluminum added filtration.
According to some pre-
liminary and unpublished data furnished by researchers working in the
Nationwide Evaluation of X-Ray Trends (NEXT) study, almost all diagnostic
x-ray tubes have glass windows (Si77).
However, according to the results
of their unfinished study of spectra from six diagnostic x-ray tubes,
none of the six tubes contained enough barium to noticeably alter the
spectrum.
Thus, the spectrum reported by Atkins is probably "more
typical" of an 80 kVcp spectrum with 2 mm aluminum filtration than is the
spectrum measured in this study (Figure 8 ) . The effect of the difference between the spectral distribution of x rays employed in this study
and the spectral distribution of x rays more typical of diagnostic radiology is discussed in the Error Analysis section of Chapter IV of this
text.
The focal spot of the x-ray tube was determined to be 8 mm by
8 mm.
The determination was made using a 0.5 mm pinhole collimator and
photographic film.
The accuracy of the light localizer of the collimator
of the x-ray machine was checked also with photographic film.
The colli-
mator was of the variable therapy type in which a rectangular x-ray
beam is formed by the two orthogonal pairs of shutter plates. A penumbra
was observed around the edge of the x-ray beam defined by the x-ray
49
7
X\f\
0
0
—
^SPECTRUM MEASURED
WITH Ge(Li) DETECTOR
o ATKINS SPECTRUM
°
C
0
0
c
o
o
o
0
0
—
J 0
N
"5
E
k.
o
c
>»
:>
—
0
k.
o
"f °
k.
15
w.
^o
LU
O
Z
LJ
"p
o
—
L-H
>
0
0
\
0
\
1
10
i
30
i
i
i
50
i
70
0
90
ENERGY (keV)
Figure 10. Comparison of X-Ray Machine Output Spectrum with a
Representative Diagnostic X-Ray Spectrum.
50
machine collimator.
was 0.75 cm wide.
At a focal-spot-to-film distance of 1 m the penumbra
A typical diagnostic x-ray machine, having a smaller
focal spot (1 or 2 mm square), would have a correspondingly smaller
penumbra.
In summary the x-ray machine met or exceeded all of the design
criteria except that concerning the simulation of diagnostic x-rays.
The shape of the spectrum of radiation produced by the x-ray machine
only approximates the spectral shape typical of a diagnostic x-ray
machine.
Also the large focal spot and accompanying penumbra are
several times larger than those typical of diagnostic x-ray machines.
In order to be a better simulation, a tube with low barium content in
the glass and with a smaller focal spot would be needed.
Nevertheless
since a better x-ray tube was not readily available, the above x-ray
machine was used to complete the study.
It was felt that the size of
the penumbra would not affect the results of this study drastically.
On
the other hand because the spectral shape of the radiation produced by
the x-ray machine does not simulate closely diagnostic x-ray spectra, care
should be used in interpreting and applying the data presented in this
study.
Spectrometer
A spectrometer that was compact, had a uniform response over
all solid angle, and was capable of being used in a fluid-filled anthropomorphic phantom was desired.
A Nal(Tl) scintillation spectrometer
meeting or coming close to these criteria was designed and is shown in
Figure 11. The scintillation crystal was to be a sphere of 6.3 mm
diameter which was half-imbedded in a polyvinyl toluene light pipe.
1.6mm BERYLLIUM CAR
-VOLTAGE DIVIDER
/
DrA
4516
PMT
6.3 mm DIA PVT
LIGHT PIPE
28 mm DIA
6.3 mm DIA SPHERE
Nal (Tl)
T
12.7mm DIA
_
i
en
\
197 mm
Figure 11. Nal (Til) Scintillation Detector.
52
The light pipe was to be optically coupled to an RCA 4516 photomultiplier
tube.
The scintillator and light pipe were to be covered by a 1.6 mm
thick beryllium cap.
The phototube and its ancillary voltage divider
were to be covered with a magnetic shield, and the entire probe was to be
hermetically sealed.
After some difficulty and delay, two probes resembling this
design were procured.
A major deviation from design specifications was
that the detectors accepted have
slightly oblate.
scintillation crystals that were
As determined by radiographs, the diameter
of each
! crystal, parallel to the axis of the light pipe was 5.7 + 0.1 mm and the
!
!
j diameter perpendicular to the axis of the light pipe was 6.2.+, 0.1 mm.
One of the probes had a polished Nal crystal, and both the crystal
and light pipe were covered with a specularly reflecting, thin aluminum
| foil.
The other probe had a crystal with a roughened surface, and, in
i
] this case, both the crystal and light pipe were covered with a diffuse
| reflector (white paper).
The detector with the unpolished crystal and
1 diffuse reflector exhibited a slightly better resolution and was selected
| for use in this study.
I
A third probe was procured also.
This probe was similar to the
M
N others except that the Nal crystal was not included.
This probe was used
i in a preliminary set of measurements to determine the significance of
L scintillations in the polyvinyl toluene light pipe and x-ray intert
M actions in the photocathode and first dynode.
! that such interactions were insignificant.
The investigations revealed
In fact, no counts above the
i lower level discriminator were observed when the blank probe was exposed
[ in situations identical to those in which the regular probe was used to
: acquire data.
53
The magnetic shielding for the probe used in this study was found
to be inadequate early in testing of the detector.
Orientation of the
probe with respect to the earth's magnetic field influenced the gain of
the photomultiplier tube by as much as ^ 10%. This problem was alleviated
by wrapping the photomultiplier tube housing with several layers of
"mu-metal," an alloy of high magnetic permeability.
Two sets of measurements were performed to determine the uniformity
of response of the detector with respect to orientation of the beam of
impinging photons.
Three sources were used:
Am (60 keV gamma), and
Co (122 keV gamma ray),
Cd (Ag x-rays with average energy of
22 keV). The orientation of the beam of photons was defined by a
celestial coordinate system with the plane of the equator passing through
the center of the spherical crystal perpendicular to axis of the light
pipe.
In the first set of measurements data were acquired for sources
positioned at various azimuths in the plane of the equator.
For each
source no significant change in pulse height distribution was observed.
In the second set of measurements, the sources were positioned at
locations having varying declinations but a constant azimuth.
The mean
of the pulse height distribution varied as a function of declination and
energy as shown in Figure 12. This variation is believed to be a result
of changing light collection efficiency.
It should be noted that the
mean of the pulse height distribution varies less than 10% over the
large solid angle contained between declinations of j^45°.
angle is 70% of 4TT steradians.
This solid
Obviously, any photons passing through
the photomultiplier tube housing would have a high probability of being
absorbed there.
However, since the housing subtends a solid angle of
54
• 122 keV
^V
Figure 12. Change 1n Mean of Pulse Height Distribution as a Function
of Declination and Energy of Incident Beam (Data are
Normalized so that Side Response Equals 100%).
55
less than 2.5% of the total solid angle viewed by the Nal crystal,
effects of this nonunifortuity can be minimized by careful positioning of
the probe within an ambient x-ray field.
Next the resolution and linearity of the detector were determined
as a function of incident energy.
Measurements were made for side
incidence with photons from isotopic sources and with monochromatic xrays.
The mean and standard deviation of a pulse height distribution
were determined by using a computer-coded least squares algorithm to fit
a Gaussian to the multichannel analyzer data.
57
241
109
Sources of
Co and
Am were used as before and a
Cd source,
shielded with copper foil, was used to produce 88 keV photons.
Mono-
energetic sources from 15 keV to 50 keV were produced using a bent
crystal NaCl x-ray monochromator.
The NaCl crystal used had a rocking
angle of 0.1°.
Since an 0.1° collimator slit was used to enhance the production
of a highly monochromatic beam, the line source output of the monochromator was not large enough to expose the entire active volume of the
detector.
Therefore, the response of the detector was determined in the
following manner. Seven zones of a sphere were chosen so that each
zone had an equal projected area.
The detector was exposed to the mono-
chromatic source and the mean and standard deviation were determined at
seven locations along the long axis of the detector.
The seven
locations were centroids of the projected areas of the seven zones.
The
mean of the pulse height distribution for a uniform side irradiation was
taken as the average of the means measured at the seven locations.
corresponding standard deviation was computed after noting that the
The
56
variance of a sum of distributions is equal to the variance of the means
plus the mean of the variances of the distributions comprising the sum.
The results of linearity and resolution measurements are presented
graphically in Figures 13 and 14. The linearity data was analyzed in
two regions, the region above 32 keV and the region below.
The discon-
tinuity at 32 keV is believed to be due to a variation in light collection
efficiency for scintillations resulting from x-rays with energy near the
57
K-edge of iodine. The 122 keV point from the
Co source and the 35 keV
point from the x-ray monochromator were judged to be the most accurate
and were used to determine the line representing the linearity in the
upper region.
The 30 and 20 keV points were used to determine the linear-
ity in the lower region. The line in the resolution graph (Figure 14) was
determined by a "visual best fit." Again the
reliable.
57
Co point was judged highly
Note that the resolution of this detector is not as good as the
resolution of a more conventional Nal spectrometer.
The resolution of
this detector, expressed as the ratio of full-width at half-maximum (FWHM)
to the mean, was found to be 52% at 122 keV.
The corresponding resolu-
tion (FWHM) for a 7.6 cm x 7.6 cm (dia.) NaI(T£) spectrometer would be
about 12% (Is71).
The equipment ancillary to the Nal (Til) spectrometer included a
preamplifier, a linear amplifier and a multichannel analyzer.
preamplifier was designed by Thorngate (Th76).
The
The multichannel analyzer
had 1024 channels and a 100 MHz digitizing rate. To facilitate data
handling, the analyzer was interfaced with a teletype equipped with a
paper tape punch.
60
80
ENERGY (keV)
Figure 13, Mean of Pulse Height Distribution versus Energy for the
Spherical NaI(T£) Detector.
1
_
1
1
1
^w
DETECTOR RESOLUTION
•
—
—
—
—
—
y
en
00
—
•
—
i
15
I
i
30
60
ENERGY (keV)
i
120
Figure 14. Sigma of Pulse Height Distribution versus Energy for the
Spherical Nal(TJl) Detector.
59
Unfolding Procedure
The unfolding scheme outlined by Equations 2-16 and 2-17 requires
a complete set of response functions {Rr (Nk)} where E. is the energy of
j
the uniformly incident monoenergetic beam and the argument N. denotes that
each function is a distribution over channel number. To obtain a set of
response functions, the first step was the computation of the set of
deposited energy distributions {RV (Ek)} where
E. again indicates the
j
incident energy and the argument E. denotes that each function is a
distribution over energy. A photon entering the detector may (1) escape,
(2) be photoelectrically absorbed, or (3) be Compton or coherently
scattered.
Since coherent scattering does not result in any appreciable
energy absorption it was not considered in this treatment.
After a photon is photoelectrically absorbed, it may give rise to
a fluorescent x ray. The fluorescence yield of sodium is small (3%).
In addition, the low energy sodium fluorescence x-rays would have a ^jery
short mean free path in sodium iodide. Therefore, sodium fluorescence
also was not considered in this treatment.
However, the fluorescent
yield of iodine is quite high (86%) and the K and K groups of x-rays
have average energies of 28.5 and 32.5 keV, respectively.
Since the
emission of a fluorescent x ray is isotropic, the probability averaged
over all solid angle of a fluorescent x ray produced at a location r
escaping from a spherical crystal is
u(r 0 + r)
P ( r ) ^= ^ e e" y ru° sinh(yr)
sinh(yr) ++ y y(r*
( r ^ -- r')
r 2 )j j
y(rQ-r)
V ^ <*x
(3-1)
X
where y is the linear attenuation coefficient, r is the radius of the
60
sphere, r is the vector which locates the point of fluorescent x-ray
production with respect to the center of the sphere, r is the magnitude
of r, and sinh is the hyperbolic sin function.
Photons which are Compton scattered within the spherical crystal
cannot be treated so simply.
Although the energy-angle relationship for
Compton scattering is not too complex (see Equation 2-5), the
scattering is not isotropic.
The probability for scatter in a given
direction with respect to the direction of the photon before scattering
is given by the Klein-Nishina relation (Ev65)„
The Klein-Nishina relation
is exact but does not lend itself to integration in a complex calculation.,
Also, since Compton-scattered photons may be multiply scattered before
escaping or being absorbed, it was decided to calculate the deposited
energy distributions with Monte Carlo techniques.
The distributions of energy deposited in a spherical crystal of
Nal for incident monoenergetic beams of 10, 12, 14, ..., 130 keV were
calculated.
The results of the calculations for each incident energy
were grouped into energy "bins" which were 2 keV wide.
Figure 15 shows
the results of the calculations for one of the 61 incident energies.
The peak at 110 keV indicates the "full energy peak."
The peaks at 78
and 82 keV indicate events in which a K or K iodine x ray escaped
the Nal crystal. The distribution below 36 keV indicates events in
which a Compton scattered photon escaped the detector.
Next the
(E,)} were converted to {Rc (N.)} by using the resolution and
E
j k
j k
linearity data acquired as described in the previous section of this
{R*
E
chapter.
Figure 16 shows the response function for the same incident
energy used in Figure 15.
61
io v
RESULTS ARE DIGITIZED FOR 2 keV WIDE
ENERGY BINS AND ARE NORMALIZED
PER UNIT INCIDENT PHOTON
10
2 io"2
CD
0
K
5
Q:
a.
-3
10
2^-4
10
0
20
40
60
80
100
120
ENERGY (keV)
Figure 15.
Calculated Distribution of the Energy Deposited 1n the
Nal Crystal of the Detector by a Uniform Parallel Beam
of 110 keV Photons.
62
RESPONSE FUNCTION FOR 1 1 0 . KEV
,„-l
10
1
1
1
1
1
1
1
1
5
2
lO" 2
5
2
>h*—1
-1
-3
•""101 U
GQ
cr
GO
o
cn
5
—
2
lO"4
5
2
lO"5
5.0
1
1
15
1
25
1
1
1
1
35
45
55
65
CHANNEL NUMBER
1
75
1
85
Figure 16. Calculated Response Function for 110 keV Uniformly
Incident Photons.
95
63
The fluence, $(E), was computed from the observed pulse height
spectrum, R(N), with a computer-coded, iterative technique. The
technique has three basic steps:
1.
A trial pulse height spectrum R,-(N. ) was calculated with
w=£vi(Ej>xRE<Nk)
(3_2)
j
j
where the subscript i_ indicates the iteration number, *. 1
is the estimate of the fluence resulting from the
previous iteration, the subscript j_ indicates summation
over all non-zero elements of *. ,(E.), and the subi
i
j
script k_ indicates that the computation is made for each
channel number.
For the first iteration ^-itE-) is set
equal to one for all E..
J
2.
A trial fluence $.(E.) is calculated from the previous
' J
trial fluence *-_-i(E.) with
i — i
• -
•• -
j
E
l
k
R(N )(1
k
IMV^
*D
x
\
(Nk)
where the subscript k^ indicates that the summation is
computed for all non-zero elements of ^-(N^) and the
subscript j_ indicates that the computation is made for
each element in *._,(E.).
The asterisk in Rg P (N k )
J
indicates that this distribution lis normalized over
k, that is
(3-3)
64
R
R
E P < N k>
J
E.
<Nk>P
I RE.
(Nk)P
(3-4)
k
J
The superscripts £ and £ have the value of either
1 or 2. Setting either or both equal to 2 increases
the speed with which the iteration process converges.
The next step is one in which the results of the
iteration are evaluated.
The residuals, S, are com-
puted by
2
I(R 1 (N k ) - R(N k ))'
S = *
2
<
I R(Nk)'
k
Thus S is a measure of how well the trial pulse height
spectrum approximates the measured pulse height
spectrum.
In fact, the square root of S is the root-
mean-square of the difference between the trial
and observed pulse height spectrum expressed as a
fraction of the average value of the observed pulse
height spectrum.
If S is less than some pre-determined
value, the iteration process is ended, and the final
$.(E.) is taken to be an estimate of $(E), the fluence
which actually caused the observed pulse height
spectrum.
This unfolding procedure is similar
to one used to analyze electron swarm data (Mc72).
(3-5)
65
In this study S was chosen to be less than 0.0003.
Hence
the fractional-root-mean-square difference between the trial and observed pulse height spectra was less than 1.8%.
Examination of data
taken previously showed that for a given exposure situation (i.e., x-ray
beam site and location, detector position and orientation, generating
potential, tube current, etc.), slightly different pulse height spectra
would be observed.
Statistical tests showed that the variation in a
number of counts in a given channel was Poisson in nature.
The standard
deviation of the number of counts in a given channel, taken from a
number of pulse height spectra acquired under similar conditions, was
approximately equal to the square root of the mean of the number of
counts.
Most of the pulse height spectra which were unfolded in the
course of this research had a maximum number of counts per channel
between 50,000 and 100,000.
Since these spectra approached zero on each
end, there were a number of channels for which the expected standard
deviation was on the order of 1% or greater.
Thus requiring the
residuals, S, to be smaller than 0.0003 would be requiring that the
fractional root-mean-square difference between the trial and observed
pulse height spectra be smaller than the expected error for a large number
of channels in the observed spectrum.
Nevertheless the selection of 0.0003
as the maximum allowable value of the residuals is somewhat arbitrary.
The spectral output of the x-ray machine was measured with the
spherical Nal detector and with a Ge(Li) spectrometer.
The Ge(Li)
spectra were corrected for efficiency losses and were grouped into energy
"bins", 2 keV wide.
defined above.
The Nal spectra were unfolded with the procedure
The raw pulse height distributions, the unfolded Nal
66
spectra, and the corresponding Ge(Li) spectra for generating potentials of
60 and 80 kVcp are presented in Figures 17 and 18. The spectra are
normalized per unit fluence.
Also the absorbed dose in reference man
soft tissue was calculated for each unfolded spectrum with
° -
c
^ i r
E
k*<Ek>
(3-6)
where u en /p is the mass energy absorption coefficient and c is the factor
necessary to convert keV per gram to units of absorbed dose.
The correspondence of the unfolded Nal spectra and the spectra
measured with the Ge(Li) detector was taken as the best evidence that the
unfolding procedures resulted in a measured spectrum which was a realistic
estimate of the actual spectrum incident upon the spherical Nal detector.
It should be noted that the unfolded Nal spectrum does not accurately
represent the incident spectrum in a neighborhood around the barium
K-edge and around the upper energy limit of the incident spectrum.
According to Anderson this "rounding of the corners" was a natural consequence of the poor resolution of the Nal spectrometer (An76).
The inability of the spectrometer to resolve discontinuities
similar to the barium edge is judged unimportant because it is felt that
x-ray spectra present inside a phantom would not have such discontinuities
There are only trace quantities of elements present in the human body
(or in phantoms to represent the body) which have K-edges above 10 keV.
Also any discontinuities in a spectrum incident on a phantom would be
smoothed to some degree by the scattering processes within the phantom.
67
• •
'
•
•
H SPECTRUM MEASURED
WITH Ge(Li) DETECTOR
|
UNFOLDED Nal(TI) SPECTRUM
o WITH TRUNCATION
I
e WITH EXTRAPOLATION
•
0%• • \s04»
,
•
oo •
°rr
•
•
o •
Ja
• NaKTI) RAW DATA
(EXPRESSED IN COUNTS
ARBITRARILY NORMALIZED)
•
o
<1
•
0.03
o
r
•
•
9
1*
oL
[c5
0.02
•
•
|
o
0
o
•
•
o
p-J
o
e
—
•
o —1
0.01 —
o
•
•
9
o
•
•
9°
o
o_
n o-o
10
•
9
1
20
1
30
|_
40
1
50
•
°
•
•
©.
60
•
••J
70
E N E R G Y (keV)
17.
Comparison of Unfolded Nal(Ta) Spectrum with Spectrum
Measured with a Ge(L1) Detector — 60 kVcp.
80
68
0.03
-
0.02
-
0.01
30
50
ENERGY (keV)
70
Figure 18. Comparison of Unfolded NaI(TO Spectrum with Spectrum
Measured with a Ge(L1) Detector — 80 kVcp.
69
The inability of the unfolding processes to produce a spectrum
which accurately represents the spectrum incident on the detector
near the upper energy limit was judged to be a serious drawback to the
use
of this Nal detector.
This drawback was dealt with in two ways
in treating the data presented in subsequent chapters.
First a
numerical technique was used to compute the first derivative of a
second order polynomial fit via least squares to a point in the unfolded spectra and its two nearest neighbors on both sides (5 point
fit) (Sa64).
If this first derivative, computed for several points
just below the energy of the generating potential, displays a relative
minimum (i.e., largest negative slope) then the unfolded spectrum was
adjusted.
The adjustment was accomplished by replacing the data with
energy greater than the point of minimum first derivative with the
value obtained by linearly extrapolating from the point of minimum
derivative with slope equal to that derivative.
were truncated to zero.
All negative values
If the unaltered, unfolded spectrum failed to
have a minimum of its first derivative in the neighborhood just below
the generating potential, the unfolded spectrum was truncated to zero
above the generating potential.
Figure 19 shows the effect of
extrapolation and truncation on a spectrum produced at 80 kVcp.
Figure 19 presents two unfolded spectra along with the absorbed
doses for each spectrum calculated with Equation (3-6) and the centroids
for each spectrum (denoted
by the short vertical tick mark).
Both spec-
tra were unfolded from pulse height spectra collected with a generating
potential of 80 kVcp.
Extrapolation reduced the calculated centroid by
70
X 105
DETECTOR LOCATION - TESTES W/0 SHIELD
1-20
RLL CASES
TRUNCATED
D=1.40E-01
80 KVCP
36 X 44
ABDOMINAL
UOO
EXTRAP0L.
D-1.36E-01
.800
i
CO
I
cr
.600
21
C_)
\
CO
o
I—
CD
H
Q_
,400
r
.200
10
30
40
50
60
70
90
iod
ENERGY (KEV)
Figure 19. An Example of Truncation and Extrapolation. Vertical
ticks indicate mean energy. Field size is in cm. D is
the absorbed dose per unit current per unit time (mrad/mA-s)
71
approximately 1 keV with respect to the centroid calculated for the
truncated spectrum.
Also extrapolation reduced the calculated absorbed
dose by 3% with respect to the absorbed dose calculated for the truncated
spectrum.
The truncation of the unfolded spectra above the generating
potential was justified on the basis that no photons produced by an x-ray
machine can have an energy greater than the kinetic energy of the electrons
bombarding the x-ray tube target.
The extrapolation procedure was based
on the assumption that as a bremsstrahlun^ spectrum almost linearly
approaches zero near its upper energy limit, so must a scattered
bremsstrahlung spectrum.
MR. ADAM Phantom
In 1976, the ICRP published its report called Reference Man.
This
report contains a wide range of anatomical data for a model representative
of an "average" adult human (ICRP75).
Many of the data for this ICRP
report were compiled over a period of years by the staff of the Medical
Physics and Internal Dosimetry Section of the Health Physics Division of
the Oak Ridge National Laboratory.
While these data were being acquired, a
model based on the same data was developed by the same section for use in
Monte Carlo calculations (Fi67).
In the model the three major body
regions (head, trunk, and legs) and 23 major organs of interest were described by segments of general quadratic surfaces such as spheres, ellipsoids, elliptical cylinders, and flat plates. This calculational model was
used to estimate the distribution of absorbed dose among the various
organs and regions for sources of ionizing radiation both inside and outside
72
the model (Jo76, Po73, Po74a, Po74b, Sn73, Sn74).
In 1969 the Medical
Internal Radiation Dose Committee of the Society of Nuclear Medicine adapted
this model for use in estimating the absorbed dose to patients ad-
ministered radionuclides internally for medical purposes (Sn69).
In
1974 the model was modified slightly to make it more suitable for calculations of radiation dose distributions from external sources of radiation.
The revised model was used in calculations of dose distributions to assist
the U.S. Bureau of Radiological Health in assessing medical diagnostic
x-ray exposures (Po74b, Ro76a, Ro76b).
In 1974 a phantom which was a physical mock-up of the mathematical
model was built.
Subsequently the phantom was used in several programs
of measurements to provide experimental data for intercomparison with
calculated data (Ga74, Me75, Sta75).
When the mathematical model was
modified, the phantom was modified also to reflect these changes (Me75).
The MR. ADAM phantom (Mock-up of a Representative Analytical
Description of an Adult Male), built for this study, is pictured in
Figure 20. The phantom and the mathematical model which it represents
have three body regions, head, trunk, and legs.
Both phantom and model
are comprised of subregions of different materials: skeletal, lung, and
the rest (called "soft tissue").
I the Snyder-Fisher phantom,
The mathematical model, referred to as
specified the nature of each subregion by
giving the chemical composition and density.
These specifications are
the ones upon which "reference man" is based.
Note that the skeletal
region is considered to be an homogeneous mixture of hard bone, bone
marrow, connective tissue, and the amount of blood normally resident in
the bones.
Likewise the other regions have an average composition and are
completely homogeneous.
73
PHOTO 1868-74
Figure 20. The MR. ADAM Phantom.
74
The shells containing the body regions and skeletal and lung subregions of the MR. ADAM phantom were constructed of lucite or polystyrene.
The materials used to represent the elemental compositions specified in
the Snyder-Fisher phantom were formulated using a computer program.
Also
the equivalence of the materials with respect to what they represent was
assessed using the same program (St74).
The criteria used for assessing
the equivalence of the materials were to compare the partial mass
attenuation coefficients and the density.
Table 2 gives the elemental
composition and density of the Snyder-Fisher phantom and the composition,
chemical composition, and density of the substitute materials.
Tables 3-5
give the partial mass-attenuation coefficients of the substitute materials
and their comparisons with the coefficients calculated for Snyder-Fisher
phantom specifications.
Note that in most
cases the coefficients
agree within +_ 1%.
The MR. ADAM phantom was chosen for use in this study for three
reasons.
First, it resembles the Snyder-Fisher phantom, an accepted
phantom of standard geometry.
Second, since the phantom is mostly fluid-
filled, it allowed access to much of the interior with a probe the size
of the spherical Nal spectrometer.
Third, experimentally-determined data
measured in the MR. ADAM phantom have the potential for being directly
compared with corresponding data calculated in the Snyder-Fisher phantom.
Table 2. Description of Snyder-Fisher phantom subregions and their MR. ADAM phantom equivalents
Soft tissue
Snyder-Fisher
0
Equivalent
Skeleton
Snyder-Fisher
0
Lung
Equivalent
0
Snyder-Fisher 0
Equivalent
Elemental composition, %
H
C
N
0
Na
Mg
P
S
CI
K
Ca
Fe
Zn
Density, g/cm
10.474
23.020
2.339
63.206
0.128
0.016
0.236
0.221
0.141
0.208
11.26
18.36
69.38
0.393
0.607
0.006
0.005
1.0
0.99 ± 0.01
7.036
22.793
3.865
48.559
0.315
0.111
6.937
0.169
0,139
0.145
9.914
0.008
0.010
1.5
6.47
19.15
3.94
52.98
0.17
0.18
6.80
0.01
10=30
1.50 ± 0.01
10.208
10.008
2.802
75.958
0.190
0.008
0.081
0.230
0.270
0.200
0.007
0.037
0.002
0.3
9.78
11.11
77.61
0.59
0.91
0.30 ± 0.01
Composition given here is the same as given in MIRD Pamphlet No. 5 except that all elements with atomic number greater than
zinc are considered zinc.
fe
Made from 66% H 2 0, 25% isopropyl alcohol, 8% sucrose, and 1% NaCl.
c
Made from bone flour, water sucrose, and salts. (Ga74).
d
Made from 73.5% H 2 0, 25.0% cellulose (sponge), and 1.5% NaCl.
Table 3. Calculated partial mass attenuation coefficients for Snyder-Fisher
composition and comparison*1 of equivalent material used in MR. ADAM
phantom - soft tissue
Photoelectric
Energy
(keV)
10
15
20
30
40
50
60
80
100
150
200
300
400
500
600
800
1000
a
Coefficient
(cm 2 /g)
Coherent
Comparison
4.34
1.18
0.465
0.124
0.0485
0.0235
0.0130 «
5.12E-3
2.50E-3
6.96E-4
2.85E-4
8.40E-5
3.62E-5
1.92E-5
1.15E-5
5.36E-6
3.01E-6
Compton
Comparison
(%)
Coefficient
(cm 2 /g)
Comparison
(%)
Coefficient
(cm 2 /g)
1.7
1.5
1.4
1.1
1.0
0.9
0.8
0.7
0.6
0.4
0.3
0.1
0.1
0.3
0.4
0.7
0.9
0.231
0.132
0.0862
0.0513
0.0277
0.0187
0.0135
7.93E-3
5.20E-3
2.37E-3
1.34E-3
5.91E-4
3.30E-4
2.09E-4
1.44E-4
8.05E-5
5.13E-5
1.7
1.6
1.6
1.6
1.5
1.5
1.5
1.5
1.4
1.4
1.5
1.5
1.5
1.6
1.6
1.7
1.8
0.153
0.176
0.186
0.192
0.190
0.185
0.180
0.169
0.160
0.141
0.128
0.111
0.100
0.0926
0.0871
0.0798
0.0751
-0.7
-0.8
-0.9
-0.9
-0.9
-0.8
-0.8
-0.7
-0.7
-0.6
-0.6
-0.5
-0.6
-0.6
-0.6
-0.8
-0.9
Percent comparison of coefficients for equivalent material calculated as
(^equivalent
-
(^Snyder-Fisher
100 X
^/P>Snyder -Fisher
(%)
-*4
Table 4. Calculated partial mass attenuation coefficients for Snyder-Fisher
composition and comparison*3 of equivalent material used in MR. ADAM
phantom - skeleton
Photoelectric
Energy
(keV)
Coefficient
(cm 2 /g)
10
15
20
30
40
50
60
80
100
150
200
300
400
500
600
800
1000
15.4
4.62
1.93
0.554
0.267
0.113
0.0641
0.0261
0.0131
3.76E-3
1.57E-3
4.73E-4
2.06E-4
1.10E-4
6.66E-5
3.08E-5
1.73E-5
Comparison
(%)
Coherent
Compton
Coefficient
(cm 2 /g)
Coimparison
Coefficient
(cm 2 /g)
Comparison
(%)
0.327
0.192
0.126
0.0671
0.0416
0.0282
0.0204
0.0120
7.90E-3
3.61E-3
2.04E-3
9.02E-4
5.02E-4
3.18E-4
2.19E-4
1.22E-4
7.80E-5
1.5
1.4
1.4
1.4
1.4
1.4
1.3
1.3
1.3
1.3
1.3
1.3
1.4
1.4
1.4
1.4
1.5
0.143
0.164
0.174
0.181
0.179
0.176
0.172
0.162
0.154
0.138
0.126
0.109
0.0981
0.0905
0.0848
0.0768
0.0715
-1.2
-0.9
-0.8
-0.6
-0.5
-0.5
-0.5
-0.5
-0.5
-0.6
-0.6
-0.6
-0.6
-0.6
-0.5
-0.5
-0.4
-1.2
-0.9
-0.8
-0.6
-0.5
-0.5
-0.5
-0.5
-0.5
-0.6
-0.6
-0.6
-0.6
-0.6
-0.5
-0.5
-0.4
"Percent comparison of coefficients for equivalent material calculated as
0*/p)eqUivalent ~ ^^Snyder-Fisher
100 X
(Ai/p)Snyder-Fisher
(%)
-xj
Table 5. Calculated partial mass attenuation coefficients for Snyder-Fisher
composition and comparison" of equivalent material used in MR. ADAM
phantom - lung
Photoelectric
Energy
(keV)
Coefficient
(cm 2 /g)
Comparison
10
15
20
30
40
50
60
80
100
150
200
300
400
500
600
800
1000
4.85
1.33
0.524
0.140
0.0549
0.0266
0.0147
5.81E-3
2.85E-3
7.91E-4
3.25E-4
9.57E-5
4.13E-5
2.19E-5
1.32E-5
6.10E-6
3.43E-6
Coherent
Compton
Comparison
(%)
Coefficient
(cm 2 /g)
1.4
1.3
1.2
1.0
0.8
0.7
0.6
0.5
0.4
0.2
0.1
0.1
0.2
0.3
0.4
0.5
0.6
0.246
0.141
0.0918
0.0480
0.0295
0.0199
0.0143
8.43E-3
5.52E-3
2.51E-3
1.42E-3
6.29E-4
3.51E-4
2.23E-4
1.54E-4
8.60E-5
5.49E-5
Comparison
(%)
Coefficient
(cm 2 /g)
1.0
1.0
1.0
1.0
1.0
1.0
1.0
1.0
1.0
1.1
1.1
1.1
1.1
1.1
1.1
1.1
1.2
0.152
0.176
0.186
0.192
0.190
0.185
0.180
0.169
0.160
0.140
0.128
0.111
0.100
0.0926
0.0872
0.0798
0.0751
-0.8
-0.7
-0.6
-0.5
-0.5
-0.5
-0.5
-0.4
-0.4
-0.4
-0.4
-0.4
-0.4
-0.4
-0.4
-0.4
-0.4
"Percent comparison of coefficients for equivalent material calculated as
100 X
0*/p) equ ivalent ~ ^ p ) Snyder-Fisher
(M/p)Snyder-Fisher
(%)
00
CHAPTER IV
RESULTS AND CONCLUSIONS
Outline of Spectral Measurements
The data, which comprise the body of the results of this project,
were collected and processed as shown schematically in Figure 21. The
spectrum measurements presented in this chapter were performed in a
period of ten days. To ensure that long term drifts in the electronic
equipment did not bias the data, the performance of the data collection
system was checked daily.
sources ( C o and
Pulse height spectra were collected for two
Am). If necessary, adjustments were made to the
gain of the linear amplifier to ensure that the modal values of the
pulse height distributions were observed in the proper channel.
The Nal(Til) probe was positioned at seven different locations
within or on the surface of the MR. ADAM phantom.
At each probe location
pulse height spectra were acquired for twenty-one combinations of seven
beam configurations and three generating potentials (60, 80, 100 kVcp).
In each case, the x-ray machine tube current was adjusted so that the
multichannel analyzer was operating with a dead time of 10% or less.
Tube currents used ranged from 20 mA to 0.1 yA.
The analyzer was
equipped with circuitry to correct for dead time, and this feature was
used in acquiring all spectra.
For each case, data were collected long
I:
enough to provide 50,000 to 100,000 counts per channel in the modal
j
channel.
Counting times of 100 seconds live time were used most
(J
i
79
DETECTOR
PREAMPLIFIER
LINEAR
AMPLIFIER
MULTICHANNEL
ANALYZER
PAPER
TAPE
PUNCH
00
o
/
I
DISK
F J.
Q T O B A ^^ F
V"'
UNFOLDING
GRAPHICS
PROGRAM
V
Figure 21.
Data Acquisition and Processing Schematic
J
I
-j PLOTTER j
81
frequently, but occasionally counting times up to 500 seconds live time
were necessary.
Before each pulse height spectrum was punched on tape,
all important parameters such as generating potential, tube current,
detector location, etc. were punched on the tape manually to facilitate
subsequent data processing.
The seven probe locations were chosen to be at the center of or
near seven regions of interest:
the testes, the right ovary, the thyroid,
the eyes, the heart, the fifth lumbar vertebra and the thoracic region of
the spine.
Testes, ovary, thyroid and eyes were chosen because of their
radiological significance.
The location near the heart was chosen to
provide data for this organ and for other organs located nearby.
The
two locations in the spine were chosen to provide data for at least one
of the skeletal structures containing red bone marrow.
A rectilinear coordinate system whose origin is located at the
center of the base of the torso section of the phantom was used to
determine the coordinates of the probe locations and the organs. The
coordinates of the centers of the organs chosen and the coordinates and
reference numbers of the corresponding probe locations are given in
Table 6. Figure 22 shows the x-axis and z-axis of the coordinate system.
The y-axis is perpendicular to the x-z plane shown, and the positive
y-direction is toward the posterior of the phantom such that the
coordinate system is right-handed.
The triangles in Figure 22, numbered 1 through 7 for crossreference with Table 6, show the location and approximate orientation of
the probe within the phantom.
The vertex of the acute angle of each
triangle shows the position of the active volume of the detector. The
Table 6. Summary of Probe Locations
Reference
Number
Organ or Region
Coordinates of Probe
(X, Y, Z)
1
2
3
4
5
6
7
Testes
Right Ovary
Fifth Lumbar Vertebra
Heart Region
Thoracic Spine
Thyroid Gland
Eye Region
-2.0, -7.2, -3.0
- 6 . 0 , 0 , 15.0
0, center of spine, 23.0
0, 0, 44.0
0, center of spine, 47.0
0, -6.0, 72.5
0, front of head, 84.0
tAi specified in Snyder-Fisher Phantom.
*Not specifically defined in Snyder-Fisher Phantom.
Coordinates of Center
of Organ t
(X, Y, Z)
-1.3,-8.0,-2.3
-6.0, 0, 15.0
*
00
1.0,-3.0,51.0
*
0, -6.0, 72.5
0, front of head, 83.5
ro
83
SKULL
EYE REGION
THYROID GLAND
RIBS
LUNGS
HEART
ARM BONE
SPINE
ENTRANCE BEAM SIZE
EXIT BEAM (FILM) SIZE
OVARY
PELVIS
BASE PLATES
I
TESTES
. — LEG BONE
I
.
I
l_l
L
-12 - 8
-4
0
4
x (cm)
l
I
8
12
l
I
Beam Location for Lower Spine 10 x 10 cm Field (Center
at x = 0, z = 22).
84
base of each triangle indicates the direction of the photomultiplier tube
housing part of the detector.
Note that the triangles do not show the
full length of the region occupied by the probe.
20 cm long, half the width of the phantom.)
(The probe was over
The detector was oriented
parallel to the x-z plane for the eye, heart, and two spine regions.
In
the right ovary location the probe was positioned with its base toward
the posterior of the phantom (inclined approximately 30° to the x-z
plane).
In the testes location the probe was positioned with its base
toward the anterior (inclined approximately 15° to the x-z plane).
The
probe was positioned at the thyroid location by placing it parallel to the
y-z plane inclined toward the posterior approximately 60° from the z-axis.
To facilitate positioning the probe, the configuration of the
phantom was changed in some cases, and a number of methods were used to
hold the probe.
A device was built to hold the probe at the heart and
right ovary locations.
The device, built mostly of nylon and lucite,
consisted of an x-y translator that was bolted to the top of the torso and
a 1 cm square polyester rod that provided z-directi on movement.
When this
device was used, the head section of the phantom was not emplaced.
The
detector was held in the spine by means of two nylon collars that were
fastened to the photomultiplier tube housing.
not used also.
In this case the head was
The detector was positioned at the eye, thyroid and
testes with a variety of small clamps and rods. The skull was removed
when thyroid measurements were made.
Entrance to the testes region was
accomplished via a latex covered hole in the base of the male genitalia
region.
85
In all cases care was taken to minimize the "shielding" of the
Phantom or the probe with parts of the positioning apparatus.
The sizes
of the phantom and the detector prohibited placing the detector in a
desired attitude directly at the center of the heart and the testes.
The detector was not positioned at the center of the eye region because
of slight discrepancies between the shape of the heads of the SnyderFisher phantom and the MR. ADAM phantom.
Laser beams, a plumb bob, and
a meter stick were used to determine accurately the position of the
detector within the phantom.
It was estimated that the overall positioning
accuracy was + 0 . 3 cm.
Beam sizes and locations simulating x-ray examinations of the
chest, left shoulder, upper gastro-intestinal (upper G.I.), pelvic and
two spinal regions were selected.
Several factors were considered in
choosing the particular radiological examinations to be simulated.
It
was desired to choose a set of exposure configurations which would be
both representative of the most frequent medical x-ray examinations and
yet not redundant.
For example, the pelvic exam and an abdominal exam
were selected, but a pyelogram, which might be centered slightly differently but in between the two, was not. Also examinations of the head
and extremities were not chosen because of the phantom's over-simplified
geometry in these regions.
The abdominal and two spinal configurations
were chosen to have the same beam center so that the effect of field
size could be studied.
Generally anatomical landmarks such as the xiphoid process, the
bi-iliac crest, and the pubic symphysis are used in positioning x-ray
beams with respect to a human patient.
Since there was some uncertainty
86
in ascertaining the locations on the phantom that corresponded to the
landmarks, there was some difficulty in selecting the beam configurations.
However, with the help of an x-ray technologist, the seven
beam sizes and positions were defined.
All examinations were simulated with the phantom standing erect.
A simulated focal-spot-to-film distance of 120 cm was chosen because the
collimator would not open wide enough to accommodate the largest beam
size (36 x 44 cm) at the more conventional distance of 102 cm (40
inches).
For each simulated examination the collimator and the tube
height were adjusted until the beam was positioned and sized appropriately
at the plane that would be occupied by the film in a real x-ray examination.
The outline of the beam where it entered the phantom was marked
for subsequent use.
The beam sizes and locations are pictured in Figures 22-28.
Note
that the shaded area shows the outline of the beam on the anterior of the
phantom and that the dotted lines show the outline on the posterior.
Figure 28 shows the configuration for a chest x-ray which had the beam
; incident on the posterior of the phantom.
i
In addition to the 147 combinations of detector location, beam
(Configuration, and generating potential described above, several other
'[configurations were employed.
Spectra were acquired at the testes with
: the male genitalia region shielded with a 10 x 15 cm sheet of lead
0.16 cm thick.
For the shoulder exam spectra were acquired at the thyroid
with the neck shielded with a similar sheet of lead covering the front
i half of the neck region.
The locations of the testes and thyroid shield
are shown in Figure 26. Also for the shoulder exam, additional measure-
87
Figure 23. Beam Location for Full Spine 10 x 44 cm Field (Center
at x = 0, z = 22).
88
Figure 24. Beam Location for Abdominal 36 x 44 cm Field (Center at
x = 0, z = 22).
89
Figure 25.
Beam Location for Shoulder 36 x 44 cm Field (Center at
x - 14.3, z = 61.5).
90
THYROID SHIELD
/////y^//^//^//y/Z2ZZZ
TESTES
SHIELD
Figure 26.
Beam Location for Upper Gastro-Intestlnal (Upper G
36 x 22 cm Field (Center at x = 0, z = 36).
91
Figure 27. Beam Location for Pelvic 44 x 36 cm Field (Center at
x = z = 0).
92
NOTE:
BEAM INCIDENT
POSTERIOR-ANTERIOR
Figure 28. Beam Location for Chest Posterior-Anterior 36 x 44 cm
Field (Center at x = 0, z = 53).
93
ments were made at the eyes and thyroid with a beam size slightly smaller
than otherwise employed.
For the upper G.I., shoulder, and chest exams,
measurements at the right ovary were made with the phantom shielded with
an apron of 0.16 cm thick lead.
When used, the apron was placed just
below the edge of the beam and was large enough to completely cover the
lower half of the torso.
Further special measurements in and around the
heart region were made for a number of 10 x 10 cm beams incident nearby.
These special configurations will be explained in the next section.
After the program of measurements outlined above was completed,
the pulse height distributions were unfolded and graphed.
The results
were normalized per unit tube current and per unit time. (Tube current
was expressed in milliamps in this text because of its traditional acceptance in the field of diagnostic radiology).
As the data were processed
the centroid and the normalized dose rate [calculated from the unfolded
spectra with Equation (3-6)] were calculated.,
The centroid and dose
rates for all exposure configurations are summarized in Tables 7-9.
The unfolded spectra are presented graphically in Appendix A.
Highlights of Results
Protective Measures
The effect of gonad shielding on the absorbed dose rate and the
spectrum at the testes was investigated.
As was explained previously,
pairs of spectra were collected in identical manners except that in one
of each pair a testes shield was used.
The spectra and absorbed dose
rates for the pelvic, abdominal and upper G.I. exams for 60 and 80 kVcp
are given in Figures 29-31. The approximately 90% reduction in absorbed
94
Table 7. Summary of Spectral Data for Testes and Right Ovary
Detector
Location
Testes
Beam Type
Size
(cm)
Lower Spine
10 X 10
Full Spine
Abdominal
Shoulder
Upper G.I.
a
Notes
80 kVcp
D*
Centroicl
w/s
4.37E-4d
3.06E-4
w/s
c
D
Centroid
D
Centroid
38
38
1.59E-3
1.30E-3
45
45
3.88E-3
3.43E-3
51
51
1.97E-2
1.06E-2
37
38
5.53E-2
3.37E-2
44
45
1.17E-1
7.74E-2
51
51
w/s
4.35E-2
2.30E-2
37
38
1.36E-1
9.71E-2
45
45
2.99E-1
2.30E-1
51
51
w/s
3.55E-4
2.57E-4
36
37
1.03E-3
7.92E-4
44
45
2.14E-3
1.68E-3
50
51
w/s
5.93E-4
2.99E-4
37
37
1.69E-3
1.06E-3
45
45
3.98E-3
2.68E-3
51
51
2.02
2.21E-1
37
37
4.27
6.56E-1
45
44
7.70
1.38
52
50
1.03E-4
37
4.24E-4
45
1.23E-3
51
38
4.57E-2
46
1.06E-1
52
10 X 44
36 X 4 4
36 X 4 4
36 X 22
t
Chest
36X44
w/s t
PA
Lower Spine
10 X 10
1.20E-2
Full Spine
10 X 44
5.21E-2
37
2.08E-1
46
4.56E-1
52
Abdominal
3.48E-1
39
9.98E-1
48
2.29
55
Shoulder
36 X 4 4 i t
36 X 44
w/A
3.12E-4
6.11E-5
38
38
1.18E-3
3.57E-4
46
46
3.06E-3
1.15E-3
51
50
Upper G.I.
36 X 22
w/A
6.63E-3
4.08E-3
38
38
2.62E-2
1.78E-2
46
46
6.78E-2
4.77E-2
51
51
Pelvic
44 X 36
t
1.50E-1
39
6.45E-1
48
1.45
56
Chest
36 X 44
PA
1.32E-3
PA w/A 5.62E-4
39
39
5.70E-3
3.20E-3
46
46
1.54E-2
8.68E-3
52
51
w/s indicates that testes were shielded with a 10 X 15 cm piece of lead 0.16 cm thick.
w/A indicates that an apron of lead 0.16 cm thick was used to cover the lower torso. The upper edge of the apron
abutted the lower edge of the beam.
f indicates that the detector was located in the primary beam.
PA indicates that the beam was incident posterior-anterior.
D is the absorbed dose rate per unit tube current. It has units of mrad/sec-mA.
The centroid is the centroid of the fluence vs energy distribution. It has units of keV.
d
4 . 3 7 E - 4 means 4.37 X 1 0 - 4 .
c
100 kVcp
44 X 36
Pelvic
Right Ovary
60 kVcp
3
95
Table 8. Summary of Spectral Data for Heart Region, Thoracic Spine, and Fifth Lumbar Vertebra
Detector
Location
Beam Type
Size
(cm)
Heart Region
Lower Spine
10 X 10
Thoracic Spine
Fifth Lumbar
Vertebra
a
Notes"
60 kVcp
80 kVcp
100 kVcp
Db
Centroid c
D
Centroid
D
Centroid
7.61E-4
41
3.11E-3
48
8.93E-3
54
Full Spine
10 X 44
1.21E-2
37
9.31E-2
48
2.09E-1
55
Abdominal
36X44
2.64E-2
37
1.91E-1
48
4.54E-1
55
Shoulder
36X44
3.54E-2
36
1.98E-1
47
4.44E-1
53
Upper G.I.
36 X 22
1.35E-1
37
8.04E-1
49
1.73
56
Pelvic
44 X 36
2.33E-4
36
1.93E-3
47
5.08E-3
54
Chest
36X44
9.71E-2
37
6.29E-1
49
1.53
56
t
PAf
Lower Spine
10 X 10
3.14E-5
38
7.58E-4
49
2.55E-3
56
Full Spine
10 X 44
1.27E-3
38
2.17E-3
51
6.45E-2
58
Abdominal
36 X 44
3.00E-3
38
4.85E-2
50
1.34E-1
57
Shoulder
36 X 44
9.12E-2
38
7.41E-2
50
2.10E-1
57
Upper G.I.
36 X 22
1.35E-2
38
1.36E-1
51
3.90E-1
59
Pelvic
44 X 36
3.05E-5
37
6.10E-4
49
2.02E-3
55
Chest
36X44
PAf
2.39E-1
37
1.42
50
3.26
57
Lower Spine
10 X 10
39
1.10E-1
52
2.82E-1
60
Full Spine
10 X 44
t
t
t
1.13E-2
1.53E-2
38
1.64E-1
51
4.25E-1
58
2.54E-2
38
2.71E-1
50
4.48E-1
56
36
1.52E-3
47
4.42E-3
53
Abdominal
36X44
Shoulder
36X44
1.02E-4
Upper G.I.
36 X 22
2.49E-3
37
3.40E-2
48
9.01E-2
54
Pelvic
44 X 36
3.39E-3
38
4.73E-2
49
1.39E-1
55
Chest
36X44
1.66E-3
36
1.41E-2
47
3.56E-2
53
PA
w/s indicates that testes were shielded with a 10 X 15 cm piece of lead 0.16 cm thick.
t indicates that the detector was located in the primary beam.
PA indicates that the beam was incident posterior-anterior.
b
D is the absorbed dose rate per unit tube current. It has units of mrad/sec-mA.
c
The centroid is the centroid of the fluence vs energy distribution. It has units of keV.
d
7.61E-4 means 7.61 X 10" 4 .
96
Table 9. Summary of Spectral Data for Thyroid Gland and Eye Region
Detector
Location
Beam Type
Thyroid Gland
Lower Spine
Eye Region
Size
(cm)
60 kVcp
Notes*
10 X 10
80 kVcp
D*
Centroid
1.65E-5
36
c
100 kVcp
D
Centroid
D
Centroid
9.70E-5
46
2.34E-4
54
1.90E-3
52
Full Spine
10 X 44
1.37E-4
35
8.37E-4
45
Abdominal
36 X 44
5.07E-4
35
2.89E-3
45
6.60E-3
52
Shoulder
36 X 44
36 X 44
28 X 44
4.46E-1
4.56E-2
3.18E-2
36
35
35
2.00
2.61E-1
2.53E-1
48
46
44
3.79
5.61E-1
5.10E-1
57
53
51
5.34E-4
35
3.62E-3
45
8.56E-3
52
Upper G.I.
36 X 22
Pelvic
44 X 36
Chest
36 X 4 4
t .
w/sdt
Smaller
beam
PA
1.68E-4
36
8.86E-4
46
1.88E-3
53
1.60E-2
37
1.61E-1
49
3.55E-1
55
Lower Spine
10 X 10
7.16E-5
32
2.48E-4
41
4.34E-4
48
Full Spine
10 X 44
3.84E-4
32
1.21E-3
40
2.05E-3
46
Abdominal
36 X 44
1.50E-3
32
4.28E-3
40
7.03E-3
47
Shoulder
36 X 44
28 X 44
6.54E-2
3.39E-2
33
33
1.76E-1
1.04E-1
42
42
3.23E-1
1.89E-1
49
49
Smaller
beam
Upper G.I.
36 X 22
1.13E-3
32
3.25E-3
41
5.43E-3
47
Pelvic
44 X 36
8.87E-4
32
2.55E-3
41
4.43E-3
47
Chest
36 X 44
5.81E-4
36
8.12E-3
48
2.04E-2
55
PA
2
w/s indicates that testes were shielded with a 10 X 15 cm piece of lead 0.16 cm thick.
f indicates that the detector was located in the primary beam.
PA indicates that the beam was incident posterior-anterior.
D is the absorbed dose rate per unit tube current. It has units of inrad/sec-mA.
"The centroid is the centroid of the fluence vs energy distribution. It has units of keV.
Thyroid shielded by shielding front half of "neck" with lead sheet 8 cm high and 0.16 cm thick.
97
X 10P
DETECTOR LOCATION - TESTES
3.00
RLL CASES ^
44 X 36
i
PELVIC
r1
2.50
B
W/0 SHIELD
60 KVCP
D=2.02E+00
W/0 SHIELD
80 KVCP
D=4.27E+00
W SHIELD
60 KVCP
Dz2.21E-01
2.00
x:
i
10
i
W/ SHIELD
80 KVCP
D=6.56E-01
cc
i
CM
L.50
z:
(_)
\
CO
o
hCD
L.00
0_
.500
i
L,
10
40
50
60
HS
70
80
90
100
ENERGY (KEV)
Figure 29. Effect of Gonad Shield on the Spectrum at the Testes -Pelvic Exam (Testes in the Beam). Vertical ticks indicate
mean energy. Field size 1s in cm. D is the absorbed dose
per unit current per unit time (mrad/mA-s).
98
X 10 5
1.20
DETECTOR LOCATION - TESTES
ALL CASES
36 X 44
ABDOMINAL
1.00
—
!
Ln
i
i
i
CD
i
(X
21
I
Osl
A
r-1
.600
W/ SHIELD
60 KVCP
D-2.30E-02
•n - '
, ""!
- W/ SHIELD
80 KVCP
D=9.71E-02
z:
<_>
\
L
r1
to
X
I
I r
i:
I •J
r1
••> I
! L
r-?
4-
20
s
L
I f-J
i£
usL
L
.200
10
I
s
s
^
.400
T
Us
o
I—
o
Q_
SHIELD
80 KVCP
D=1-36E-01
w/0
-?
h
L,
L,
.800
W/0 SHIELD
60 KVCP
D=4.35E-02
30
40
50
1 _
60
1L1 1
70
80
90
100
ENERGY (KEVJ
Figure 30. Effect of Gonad Shield
Abdominal Exam (Testes
indicate mean energy.
absorbed dose per unit
on the Spectrum at the Testes —
Near the Beam). Vertical ticks
Field size 1s 1n cm. D 1s the
current per unit time (mrad/mA-s)
99
X 103
1.60
DETECTOR LOCATION - TESTES
RLL CASES
W/0 SHIELD
60 KVCP
D=5-93E-04
1.40 h-36 X 22
UPPER G.I
1
H1'B^
3
w/0
-a-
80 KVCP
D=l-69E-03
W / SHIELD
60 KVCP
D=2.99E-04
1.20
h
(I
>
LU
i
CD
i
CE
ZI
I
1.00
i
.
n
,
-•
h
.800
SHIELD
- W/ SHIELD
80 KVCP
D=1.06E-03
OsJ
2=
<_>
N.
CO
o
oX
.600
I—
0_
.400
.200
40
50
60
70
100
ENERGY (KEV)
Figure 31. Effect of Gonad Shield on the Spectrum at the Testes -Upper G.I. Exam (Testes Far from the Beam). Vertical
ticks indicate mean energy. Field size is in cm. D is
the absorbed dose per unit current per unit time (mrad/mA-s)
100
dose caused by the shielding in the pelvic exam (in which the testes
were in the direct beam) was not surprising.
However for the abdominal
exam, in which the testes were just out of the beam, and for the upper
G.I., in which the testes were farther from the beam, shielding reduced
the absorbed dose rates also. These reductions were surprising because
they indicate that, for the cases in which the testes are out of the beam,
a significant component of the absorbed dose comes from radiation
scattered from the collimator.
The testes data in Table 7 and in
Appendix A show the effect of shielding for all configurations in which a
shield was used.
The effect of collimator scattering has been reported previously by
Trout and Kelley (Tr65).
Because of the manner in which their data were
presented, direct comparison between their results and the collimator
scatter measured in this study was not feasible.
To ensure that collimator or tube head leaks did not contribute
to the spectra measured at the testes, the collimator was enshrouded
with additional lead shielding, and the entire collimator and tube
housing were checked for radiation leaks.. The collimator, with blades
closed, and tube housing were wrapped with x-ray film and, also, were
surveyed by hand with a Geiger counter.
No evidence of radiation above
background was found.
Shielding also reduced the absorbed dose at the right ovary.
For the cases in which the ovaries were not in the direct beam (upper
G.I., shoulder, and chest exams), spectra were collected with and without
an apron covering the lower part of the torso. The apron, comprised of
101
0.16 cm thick lead, was placed so that it was just below the lower edge
of the beam in all cases. The results are presented graphically in
Figures 32-37.
Note that the fraction that: the absorbed dose is re-
duced by shielding is largest when the beam is farthest from the right
ovary (shoulder exam), but that the amount of the absorbed dose reduction
is largest when the beam is closest (upper G.I.).
The effect of shielding on the spectrum and absorbed dose at the
thyroid from a shoulder exam was studied.
Spectra were collected with
and without a shield covering the front half of the neck (lower part of
head) of the phantom.
Also collected was a spectrum for which the beam
was 8 cm narrower (4 cm on each side).
Comparisons of the spectra and
absorbed dose rates for these three configurations are given in Figures
38-40.
The label "SSFS" stands for "slightly smaller field sizes" and
indicates a 28 x 44 cm beam rather than a 36 x 44 cm beam.
Note that
shielding the thyroid reduced teh absorbed dose rate was reduced even
further when a smaller field size was used instead of a neck shield.
The sparing effect of using a smaller shoulder beam size was studied
for the case of the eyes. A comparison of the absorbed dose and spectrum
for a 36 x 44 cm beam and a 28 x 44 cm beam can be made by scrutinizing
Figures 99 and 100 in Appendix A.
In this case the sparing is on the
order of a factor of two.
Effect of Depth of Penetration, Scattering Distance and Beam Size
A special series of measurements was conducted to observe changes in
the shape of an x-ray spectrum as a function of depth of penetration
into the phantom.
The detector was positioned in the heart region
102
X 104
DETECTOR,LOCATION - R T - OVARY
3.00
2.50
ALL CASES
36 X 2 2
UPPER G . I .
W/0 APRON
60 KVCP
D=6-33E-03
r.B
1
h
1
w
^
B
i
W/0 HPR0N
80 KVCP
D=2.62E-02
i
h
2.00
_J"
h
Ln
i
CO
CSJ
W/RPR0N
60 KVCP
D=4.09E-03
^
^
W/ APRON
80 KVCP
D=l-78E-02
h
1-50
2Z
C_)
\
CO
-Z-
o
I—
o
HI
Q_
r^r
L-00
Ll h
:
i
:h
rf"
.500
10
I I
_ i
rf
0
11
20
30
^
w I
40
EL
50
60
h
1
70
80
90
100
ENERGY ( K E V )
Figure 32. Effect of Shielding with an Apron on the Spectrum at the
Right Ovary — Upper G.I. Exam -- 60 and 80 kVcp. Vertical
ticks indicate mean energy. Field size 1s in cm. D is
the absorbed dose per unit current per unit time (mrad/mA-s)
103
X 104
DETECTOR LOCRTION - RT- OVRRY
6-00
5.00
N/0 APRON
D=6.78E-02
ALL CASES
100 KVCP
36 X 22
UPPER G.I.
W/ APRON
Dr4.77E-02
4.00
UJ
x:
i
CO
CM
3.00
2Z
CJ
\
CO
~ZCD
\—
CD
m
Q_
2.00
[.00
40
50
60
70
100
ENERGY (KEV)
Figure 33.
Effect of Shielding with an Apron on the Spectrum at the
Right Ovary -- Upper G.I. Exam — 100 kVcp. Vertical ticks
Indicate mean energy. Field size 1s 1n cm. D 1s the
absorbed dose per unit current per unit time (mrad/mA-s).
104
X 103
DETECTOR LOCATION - RT- OVARY
6.00
n
5.00
r> iB
ALL CASES
36 X 44
CHEST - PA
N/0 APRON
60 KVCP
D=1.32E-Q3
^
h
l
H
B
i
N/0 APRON
80 KVCP
Dz5.70E-03
Li
h
Ln
4-00
h
UJ
i
CO
i
-J
rib
C\J
3.00
L
zr
,_ J
CJ
\
CD
~ZL
CD
hO
in
- N/ APRON
80 KVCP
D=3.20E-03
*-i
cc
21
I
N/ APRON
60 KVCP
D=5.62E-04
Ln
r^
2.00
>n
Q_
Ln
^
L,
1.00
^ r ia
1
r
L,
•
L
•In
I
H^
0
10
^gk
20
,
I
r-'
30
40
t±L
50
60
^k
70
80
90
100
ENERGY (KEV)
Figure 34. Effect of Shielding with an Apron on the Spectrum at the
Right Ovary ~ Chest PA Exam — 60 and 80 kVcp. Vertical
ticks indicate mean energy. Field size 1s 1n cm. D 1s
the absorbed dose per unit current per unit time (mrad/mA-s)
105
X 104
DETECTOR LOCRTION - RT- OVARY
1.40
1-20
N/0 APRON
D-1.54E-02
ALL CASES
100 KVCP
36 X 44
CHEST - PA
N/ APRON
D=8-68E-03
1-00
UJ
N£
I
in
i
cr
CM
2=
(_)
\
CD
.800
.600
O
I—
o
Q_
.400
.200
0
10
40
50
60
70
ENERGY ( K E V )
Figure 35.
Effect of Shielding with an Apron on the Spectrum at the
Right Ovary — Chest PA Exam — 100 kVcp. Vertical ticks
Indicate mean energy. Field size 1s 1n cm. D 1s the
absorbed dose per unit current per unit time (mrad/mA-s).
100
106
X 10 3
DETECTOR LOCATION - RT- OVARY
L-20
L-00
nB
ALL CASES
36 X 44
SHOULDER
W/0 RPR0N
60 KVCP
D=3.12E-04
^
B
-
h
^
LU
*I
I
CO
I
(X
21
I
- - W RPR0N
60 KVCP
D=6.11E-05
h
,800
H
W/0 APRON
80 KVCP
D=1.18E-03
L^
h
b
— W/ APRON
80 KVCP
D-3.S7E-04
i
Ln
.600
C\J
21
C_>
\
CO
h
rH
-z.
o
J —
o
HI
Q_
h
,400
h
'JtTl
H
,200
h
h
1
.+
h
n
jffi
J
0
10
Figure 36.
20
L
_I
h
r-i. r
30
40
50
60
il70
80
90
100
ENERGY (KEV)
Effect of Shielding with an Apron on the Spectrum at the
Right Ovary — Shoulder Exam — 60 and 80 kVcp. Vertical
ticks Indicate mean energy. Field size is 1n cm. D 1s
the absorbed dose per unit current per unit time (mrad/mA-s)
107
X 103
DETECTOR LOCATION - RT- OVARY
2.50
2.00
LU
^L
I
CD
I
W/0 APRON
D-3.06E-03
ALL CASES
100 KVCP
36 X 44
SHOULDER
W/ APRON
D=1.15E-03
1-50
az
21
I
(M
21
CJ
\
CD
•z.
o LOO
I—
o
Q_
.500
0
10
20
30
40
50
60
70
80
90
100
ENERGY (KEV)
Figure 37.
Effect of Shielding with an Apron on the Spectrum at
the Right Ovary -- Shoulder Exam — 100 kVcp. Vertical
ticks Indicate mean energy. Field size 1s 1n cm. D is
the absorbed dose per unit current per unit time (mrad/mA-s)
108
X 105
DETECTOR LOCATION - THYROID GLRND
1
6.001
5.00
1
ALL CASES
60 KVCP
36 X 44
SHOULDER
[f.
Ajuj!
—
NO SHIELD
D=4.46E-01
-B-
W/ SHIELD
Dr4-58E-02
A
SSFS
Dr3.18E-02
w /
B
4.00
IU
PC!
3.00
L. '
2.00
I
I
Li
II
N.
• H-,
-*
X 10
i-rH-"""
Li
1-00
h
i I-,
0
^
10
20
J
30
L_ii
40
50
60
70
80
90
100
ENERGY (KEV)
Figure 38. Effect of Shielding and Field Size on the Spectrum at the
Thyroid — Shoulder Exam — 60 kVcp. Vertical ticks indicate
mean energy. Field size is in cm. D is the absorbed dose
per unit current per unit time (mrad/mA-s).
109
X 106
DETECTOR LOCATION - THYROID GLRND
2.50
W/ SHIELD
D=2.61E-01
ALL CASES
2.00
80 KVCP
36 X 44
SHOULDER
NO SHIELD
D=2.01E+00
- W/ SSFS
Dz2.54E-01
*1
I
1-50
en
i
cr
z:
i
(NJ
C_>
\
CO
1.00
o
I—
o
X
Q-
.500L_
40
50
60
70
00
ENERGY (KEV)
Figure 39. Effect of Shielding and Field Size on the Spectrum at the
Thyroid ~ Shoulder Exam -- 80 kVcp. Vertical ticks indicate
mean energy. Field size 1s 1n cm. D 1s the absorbed dose
per unit current per unit time (mrad/mA-s).
no
X 106
DETECTOR LOCATION - THYROID GLAND
4-00
3.50
ALL CASES
100 KVCP
36 X 44
SHOULDER
W/ SHIELD
D=5.61E-01
- NO SHIELD
D=3.79E+00
3.00
- W/ SSFS
D=5.10E-Q1
2.50
2.00
1.50
1-00
.500
0
10
20
30
40
50
60
70
80
__
90
100
ENERGY (KEV)
Figure 40. Effect of Shielding and Field Size on the Spectrum at the
Thyroid -- Shoulder Exam — TOO kVcp. Vertical ticks Indicate
mean energy. Field size is In cm. D 1s the absorbed dose
per unit current per unit time (mrad/mA-s).
Ill
location, and a 10 x 10 cm beam was centered directly over the active
volume of the detector.
Spectra were acquired for the detector in the
heart region location ( x = o , y = o , z = 44) and for four other positions
each 1 cm closer to the anterior of the phantom (x = o, z = 44, y = -1,
-2, -3, - 4 ) . The results for each generating potential are presented in
Figures 41-43.
The
hardening of the spectrum with depth can be ob-
served by noting the shift of the centroid.
The average energy increased
1 keV for the 60 kVcp spectra and 2 keV for the 80 and 100 kVcp spectra
over the range of 5 cm that was studied.
Another series of measurements was conducted to determine the effect
of scattering on the spectral distribution.
The detector was positioned
in the heart region location, and spectra were acquired for six, 10 x 10
cm beams incident on the anterior of the phantom.
The six beams were
centered at x = o and z = 39, 34, 29, 24, 19, 14, respectively.
Thus,
the projections in the x - z plane of the center of the detector and the
center of the x-ray fields were separated by 6, 11, 16, 21, 26, and 31
cm.
The spectra of scattered radiation for 80 and 100 kVcp cases are
presented in Figures 44-47.
The detector-field-separation is abbreviated
DFS and has units of centimeters.
It was observed for both cases that
the centroid and the shape of the unfolded spectra varied little over the
range of detector-field-separation used.
It was desired to assess the effect of beam size on the spectrum and
absorbed dose rate for a combination of beam locations and detector
locations.
Since the simulated lower spine, full spine, and abdominal
exams had the same beam center, data obtained for these cases was
amenable to such analysis. The spectra and corresponding absorbed
112
X 105
10 X 10 FIELD CENTERED ON DETECTOR
4-50
4-00
ALL CASES
60 KVCP
Y = 0
D=l-11E-01
»—_Y
= -1
D=1.52E-01
C
-
Y = -2
D=2.04E-01
-"
- Y = -3
D=2.65E-01
•-1-
- Y = -4
D=3.59E-01
3-50
3-00
1
in
i
ex
2.50
z:
i
Csl
z:
c\_>
CD
2.00
z:
CD
h-
CD
DZ
Q_
1.50
1-00
.500L_
20
30
40
50
60
70
80
90
100
ENERGY (KEV)
Figure 41. Spectrum as a Function of Depth -- 60 kVcp. Vertical ticks
Indicate mean energy. Field size 1s 1n cm. 0 1s the absorbed
dose per unit current per unit time (mrad/mA-s).
113
X 10 6
10 X 10 CENTERED ON DETECTOR
1-40
1.20
Y = 0
D=5.95E-01
ALL CRSES
80 KVCP
Y = -1
U=7.47E-01
Y = -2
D=9.68E-01
1-00
Y = -3
D=1.19E+00
^ 1
I
CO
Y = -4
D=l .91E+00
.800
I
CsJ
c_j
\
CO
-600
o
I—
o
11
0L_
.400
.200
0
10
40
50
60
70
80
90
100
ENERGY (KEV)
Figure 42.
Spectrum as a Function of Depth — 80 kVcp. Vertical ticks
indicate mean energy. Field Size is in cm. D is the absorbed
dose per unit current per unit time (mrad/mA-s).
114
DETECTOR LOCATION - HERRT REGION
50
70
ENERGY (KEV)
Figure 43.
Spectrum as a Function of Depth ~ 100 kVcp. Vertical ticks
Indicate mean energy. Field size 1s 1n cm. D 1s the absorbed
dose per unit current per unit time (mrad/mA-s).
115
X 105
00
DETECTOR LOCRTION - HEART REGION
I
L' '
I
h
I
A
1
CRSES
80 KVCP
10 X 10
-900|_RLL
—
D=1.30E-01
-B
.800
DFS = 11
D=3.19E-02
-C.700
i
CO
I
DFS = 6
DFS = 16
D=9.19E-03
.600
cc
n
i
OJ
z:
o
.500
\
CO
-z.
o
ho
n
.400
Q_
.300
r
J
.200
LOO
f
-I
r"
__r
0
10
20
30
40
50
60
70
ENERGY (KEV)
80
90
100
Figure 44. Scattered Spectrum as a Function of Detector-Fleld-Separatlon
(DFS In Units of Centimeters) — 80 kVcp. Vertical ticks
Indicate mean energy. Field size 1s 1n cm. D 1s the absorbed
dose per unit current per unit time (mrad/mA-s).
116
X 10 3
SCRLE IS 40 X SCRLE OF PREVIOUS GRRPH
2.50
DFS = 21
D=3.08E-03
RLL CRSES
80 KVCP
10 X 10
2.00
-
DFS = 26
D=1.02E-03
A
DFS = 31
D=3.48E-04
1-50
CNJ
ZI
(_)
\
CO
o
1.00
.500
0
10
Figure 45.
40
50
60
70
ENERGY (KEVJ
80
90
100
Scattered Spectrum as a Function of Detector-Field-Separation
(DFS 1n Units of Centimeters) — 80 kVcp. Vertical ticks
Indicate mean energy. Field size 1s 1n cm. D 1s the absorbed
dose per unit current per unit time (mrad/mA-s).
117
X 105
DETECTOR LOCATION - HERRT REGION
2.00
L.75
ALL CASES
100 KVCP
10 X 10
T
—
DFS = 6
D=3.08E-01
-B
DFS = 11
D-7.98E-02
A
L-50
DFS
-
16
D=2.39E-02
>
LxJ
L.25
I
CO
I
en
2=
I
CSJ
L.00
JZ
CJ
\
CO
-ZL
o
\—
CD
.750
HI
Q_
.500
.250
0
10
50
70
ENERGY (KEV)
90
no
130
Figure 46. Scattered Spectrum as a Function of Detector-Field-Separation
(DFS in Units of Centimeters) — 100 kVcp. Vertical ticks
indicate mean energy. Field size is in cm. D is the absorbed
dose per unit current per unit time (mrad/mA-s).
118
X 103
6.001
5.00
SCALE IS 33.33 X THAT OF PREVIOUS GRAPH
1
1
1
1
1
DFS = 21
D=8.04E-03
ALL CASES
100 KVCP
10 X 10
-
\l
F
DPS = 26
D=3.06E-03
• - DFS = 31
D=1.01E-03
4-00
3.00
2.00
I-00
0
10
50
70
90
110
130
ENERGY (KEV)
Figure 47.
Scattered Spectrum as a Function of Detector-Field-Separation
(DFS in Units of Centimeters) — 100 kVcp. Vertical ticks
indicate mean energy. Field size is in cm. D is the absorbed
dose per unit current per unit time (mrad/mA-s),
119
dose rates for these three beam configurations are presented in
Appendix B for all combinations of generating potential and detector
location (heart region omitted).
Except for the cases in which changing
the field size affected whether or not the detector was in the direct
beam (right ovary or heart locations), the shapes of the spectra varied
little as a function of beam size. On the other hand, the absorbed dose
rate for any particular combination of generating potential and detector
location varied greatly.
not a simple one.
A quick analysis showed that this variation was
In particular, the absorbed dose rate at a particular
organ did not vary as a linear function of beam area.
Spectra Inside the Spine
The spectra measured with the detector in the spine locations were
different in three ways from those measured in soft-tissue regions.
The
"in-bone" spectra had average energies that were generally higher than
those in soft-tissue (see Table 8 ) . The heart region data and thoracic
spine data were selected for comparison since these detector configurations had similar attitudes and locations. The 60, 80, and 100 kVcp
spectra for the thoracic spine were harder than the corresponding heart
region spectra by about 1, 2, and 3 keV, respectively.
Second, the shape of the in-bone spectra was different.
In general,
the modal energy for any spectrum was below the average energy for that
spectrum.
However, the difference between the mean energy and the modal
energy was usually smaller for the in-bone spectra than for the softtissue spectra.
See Figures 61-67 and 89-95 in Appendix A.
Third, the
magnitude (modal energy height, total fluence, or absorbed dose) was a
120
more sensitive function of generating potential for spectra acquired in
the spine than for spectra acquired in other regions.
Note that the 60
kVcp spectra for spine locations generally were graphed with a scaling
factor of 10 in order to make them comparable with their respective 80
and 100 kVcp spectra. For soft-tissue region spectra, such scaling often
was not necessary.
Error Analysis
The major sources of error in this study were judged to have arisen
from the non-uniformity of the response of the detector as a function of
angle of incidence, the inaccuracies in the response functions used to
unfold the pulse height spectra, the low resolution of the spectrometry
system in general, and the dissimilarity between the spectral output of
the x-ray machine and spectra more representative of diagnostic radiology.
It is important that the effects and limitations imposed by these sources
of error be kept in mind when the data gathered in this study are interpreted.
As is presented in Figure 12, the response of the detector was a
function of both energy and declination of a beam of incident x-rays.
Since the angular distribution of an x-ray field within the phantom was
unknown in general, it was not possible to correct for this non-uniformity of response. As was discussed previously, the detector was oriented
to minimize such uncertainty.
If it is presumed that the majority of
the photons striking the detector were incident with a declination
between +_ 45°, the uncertainty in energy would be limited.
For 50 keV
photons incident within the described solid angel, the variation in the
mean of the observed pulse height distribution would be approximately 5%.
121
Therefore, it is judged that the uncertainty in the centroids of the
unfolded spectra (all of which are near 50 keV) is ±2
keV.
The response functions used to unfold the pulse height spectra
were formulated by combining data from Monte Carlo calculations and
measured characteristics of the detector.
The Monte Carlo calcula-
tions were performed for an exactly spherical volume of Nal, whereas
the detector itself was slightly oblate.
Obviously, the probability
of Compton scattered photons and fluorescent x rays escaping the detector is dependent on the shape of the detector.
Other inaccuracies
in the response functions were deduced by examination of the unfolded
spectra.
All spectra suffered from the "rounding of the corners"
caused by the inherent poor resolution of the system.
Also each
unfolded spectrum had some inaccuracy near 32 keV, the iodine K-edge.
Initial calibration of the detector showed a change in linearity at
this energy.
Apparently this change was not represented completely
properly in the response functions because the unfolded spectra displayed an artificial "fine structure" at 32 keV.
It was not known how
to assess the overall effect of the inaccuracies described above.
It is suggested that the performance of the unfolding procedure be
gauged by the examples of the unfolding of known spectra given previously (Figures 17 and 18).
In order to have an x-ray machine with the wide dynamic range
and other characteristics essential to this project, it was
necessary to accept output spectra that were significantly different
than those typical of medical diagnostic: radiology.
The x-ray machine's
output spectra were particularly dissimilar in the region near 37 keV,
122
the barium K-edge (see Figure 10). Measured spectra which heavily depend
on the shape of the output spectra in this region should be viewed as
approximations of those spectra which would be present in actual diagnostic examinations.
For example, the spectrum at the testes due to a pel-
vic exam should be considered very approximate since the beam of x-rays;
has penetrated only a few centimeters of tissue.
However, as a beam
continues to penetrate the phantom, the photons with energy near 37 keV
would be attenuated and would be replaced by degraded photons which originally had a higher energy.
Thus spectra at locations deep in the phan-
tom or outside the primary beam would not be as strongly influenced by
the low energy components of the output spectra and should be more representative of those that are present in an actual diagnostic exam.
How
well the spectra of a particular x-ray machine resembles the spectra of
the x-ray machine used in this study may influence the applicability of
the data presented in this study.
Other sources of error include the statistical errors inherent in
x-ray detection, short-term and long-term fluctuations in the electronic
equipment including the high voltage stabilization circuitry of the
x-ray machine, the inaccuracies in the phantom and its tissue-equivalent
materials, and the positioning of the probe and the x-ray beams.
It is
estimated that the probe was positioned within the phantom with an
accuracy of +_ 0.3 cm and that the beam was aligned with a similar
uncertainty.
These uncertainties are well within the variation that
would be typical of actual diagnostic examinations.
The uncertainties
due to electronic equipment and the phantom are judged to be of much
lesser significance than the errors discussed in the preceding paragraphs.
123
A set of ionization chamber measurements were made to provide data
with which to estimate the accuracy of the absorbed dose rates calculated from the measured spectra.
For reasons of convenience and feasi-
bility, measurements were made in the testes regions with the 3 cm
probe of the Radocon III. The measured absorbed dose rates at the
testes for three beam configurations and two generating potentials are
presented in Table 10 along with the absorbed dose rates determined from
the corresponding spectral mesurements,,
The absorbed dose rates deter-
mined from the spectrum measurements vary from 16% lower to 6% higher
than the absorbed dose rates measured with the ionization chamber.
How-
ever, the difference between the two types of measurements did not
appear to be random.
Excepting one case, the absorbed dose rates deter-
mined from the spectrum measurements were smaller
indicated by the ionization chamber.
ence are given.
than the results
Two explanations for this differ-
The absorbed dose determined with the spectrometer
should be lower than the actual absorbed dose because the truncation
and extrapolation processes used to adjust the unfolded spectrum decrease the total fluence slightly.
chamber
Second, the size of the ionization
influenced its response compared with the spectrometer.
The
radius of the ionization chamber was 1.3 mm larger than the radius of
the beryllium cap of the spectrometer.
Hence, the ionization chamber
displaced more tissue fluid than the spectrometer, and, under similar
conditions, more x rays would reach the ionization chamber than would
reach the spectrometer because of absence of the displaced tissue fluid.
Nevertheless, the purpose of the ionization chamber measurements was to
check the general validity of the method of determining the absorbed
TABLE 10. Comparison of Ionization Chamber Measurements with the Absorbed Dose Rate
Determined from the Measured Spectrum at the Testes
Generating
Potential
(kVcp)
Beam Type
Absorbed Dose Rate
Measured with
Ionization Chamber
(mrad/mA-sec)
Absorbed Dose Rate
Calculated from
Measured Spectrum
(mrad/mA-sec)
80
Full Spine
2.35 x 10" 2 + 7%a
1.97 x 10"2
-16%
2
-16%
100
2
Percent Di
Abdominal
5.21 x 10" + 7%
4.35 x 10"
Pelvic
2.39 + 7%
2.02
-16%
Full Spine
0.121 + 7%
0.117
- 3%
Abdomi nal
0.283 + 7%
0.299
6%
Pelvic
8.50 + 7%
7.70
- 9%
Uncertainty includes + 4% for angular response of probe and + 3% for calibration uncertainty.
It does not include any uncertainty due to geometrical considerations.
Spectrometer Measurement - Ionization Chamber Mpa<;nrpmpnt
Ionization Chamber Measurement
125
dose from the measured spectra.
In this respect, the agreement between
the absorbed doses was adequate.
Comparison with BRH Calculations
As was discussed in Chapter III, the U. S. Bureau of Radiological
Health published the results of a Monte Carlo study of absorbed doses to
selected organs for common projections in diagnostic radiology (Ro76b).
In this study a divergent beam of x-rays was simulated with a combination
of 4 x 4 cm parallel beams.
Further instead of making calculations for
continuous spectra typical of diagnostic radiology, the absorbed doses
were calculated as a linear combination of 5 monoenergetic beams.
The
calculations were made using the mathematical model on which the MR.
ADAM phantom is based.
Absorbed doses were calculated for the testes,
ovaries, thyroid, active bone marrow region, and uterus.
Typical expo-
sure configurations were assumed and the results are presented as a
function of half-value-layer (HVL).
The results for the testes, ovaries, and thyroid for the chest PA,
pelvic, and abdominal examinations as measured in this study are compared in Table 11 with the results of the BRH calculations most similar.
In the calculated chest PA case, the focal-spot-to-film distance employed
was 183 cm; in all measurements a distance of 120 cm was used.
The hip
exam in the BRH calculations had a configuration best resembling the
pelvic exam simulated in the measurements.
studies were essentially the same.
The abdominal exams in both
Due to statistical uncertainties,
the calculated absorbed dose in some cases was presented as a small but
unestimated number (i.e., < 0.01 mrad).
TABLE 11. Comparison of Measured Absorbed Dose with BRH Calculations
Organ of Interest
Testes
Thyroid
Ovaries
Beam Type
Generating Potential (kVcp)
HVL
Chest PA
(mmAl)
Calculated Absorbed Dosea
Reference Uncertainties6
Measured Absorbed Dosea
Percent Difference0
Pelvic
80
2.6
100
3.3
60
1.8
<0.01
<0.01
(100%, NC)
<0.01
0.4
0.033
0.066
0.15
*
*
*
894
(1%, 1%)
974
122
Measured Absorbed Dosea
652
667
939
48
- 10%
- 25%
Calculated Absorbed Dosea
Reference Uncertainties^
10
18
(4%, 38%)
Measured Absorbed Doseb
14
40%
Percent Difference
0
21
17%
-
4%
0.89
-19%
128
36
38%
112
- 13%
101
- 51%
60
1.8
15
1[9%,
100
3.3
32
50%)
48
1.9
5.2
25
43
-65%
-22%
-10%
<0.01
<0.01
(NC, NC)
<0.01
177
0.054
0.14
- 35%
*
*
220
291
(5%, 14%)
<0.01
*\CC
0.16
ICC
80
2.6
-21%
208
271
1[6%, 57%)
-61%
26
100
3.3
1.1
2.4
(58%, NC)
0.15
727
0
80
2.6
-18%
Calculated Absorbed Dosea'k
Reference Uncertainties6
Percent Difference
Abdominal
60
1.8
ibu
JD3
- 29%
- 25%
*
0.23
*
<0.01
<0.01
(NC, NC)
0.45
*
•Undetermined.
a
Average absorbed dose (mrad) for exposure at surface of the phantom of 1000 mR as calculated (Ro76).
Absorbed dose determined from spectra measurements made at the center of the organ of interest. Absorbed dose is
normalized to 1000 mR incident exposure.
°measured-calculated
calculated
Absorbed dose for both hips exposure configuration.
(Coefficient of variation for 4 x 4 cm beam closest to the organ of interest, coefficient of variation for 4 x 4
beam at center of field). NC means no calculated contribution for this 4 x 4 beam.
0.81
*
127
Since the BRH publication presented no estimated error with each
calculation, Table 11 contains a pair of numbers called reference uncertainties.
monoenergetic
These numbers were abstracted from the results of the
calculations (Ro76a).
They are the coefficients of
variation for two of the 55 keV 4 x 4 cm beams used in the BRH study.
the first of the pair is the coefficient of variation for the 4 x 4 cm
(contained in the projection) which passes through or comes closest to
the organ of interest.
The second of the pair is the coefficient of
variation for the 4 x 4 cm at the center of the projection.
The label
"NC" indicates that the respective 4 x 4 cm beam did not contribute to
the absorbed dose at the organ of interest, and, therefore, the
coefficient of variation is undetermined.
The reference uncertainties
presented have no direct relation to statistical uncertainty in the
result of the Monte Carlo study.
However, since the calculated absorbed
dose estimates were based on a linear combination of the results of a
set of 4 x 4 cm beams at various monoenergies, the reference uncertainties may give the reader a feel for the accuracy of the calculated results.
There are several factors to consider when comparing the results of
the two studies.
The scheme used in the BRH calculations does not in-
clude any collimator scatter.
This scattering explains why the two
studies do not agree well when the organ of interest is far from the
beam.
Second, the absorbed dose to an organ was calculated as the
absorbed dose averaged over the entire organ.
In the experiments, the
absorbed dose was measured at the center of an organ.
Third, the
necessary simplifying assumptions in the BRH calculations were many.
Parallel beams replaced a divergent beam, the Monte Carlo radiation
128
transport methodology did not include coherent scattering, and entire
diagnostic x-ray spectra were simulated by five monoenergetic beams.
Finally the measured spectra were acquired with configurations (and
spectra) which did not always resemble the conditions simulated by the
BRH.
That the results of two, widely differing, complex studies agreed
as well as they do is surprising (and, to this author, pleasing).
CHAPTER V
FINAL SUMMARY
The objectives of this study were the development of a spectrometry
system suitable for in-phantom research, demonstration of the feasibility
of in-phantom measurements of spectra, and determination of several dosimetric parameters within an anthropomorphic phantom exposed to x rays in
a manner simulating medical diagnostic radiological examinations.
felt that these objectives were met in general.
It is
Further, data relevant
to the understanding of the transport of radiation within the human body
and to the reduction of absorbed dose to patients undergoing x-ray examinations were acquired.
In addition to the design and development of the spectrometer,
there were a few other technological problems met and overcome in the
course of this study.
The equipment needed to acquire and process the
spectral data was not insignificant.
Besides the multichannel analyzer,
the use of a large and sophisticated computer system was essential.
Second, even though a sodium iodide scintillation spectrometer can be
operated at count rates higher than can most other spectrometers, the
x-ray machine, especially developed for low current operation, was
necessary.
Without an x-ray source having a wide dynamic range (4.5
orders of magnitude), this project could not have been performed.
These two factors, extensive data handling capability and an x-ray
machine with extended tube current range, limit the widespread applicability of the spectrometry system developed.
129
130
There were three notable shortcomings of this project.
As was
discussed previously, the spectral output of the x-ray machine used was
not the best simulation of diagnostic x-ray spectra.
The use of a
x-ray tube with a low barium content would have helped significantly.
Due to budgetary and time constraints, procuring such a tube was not
possible for this project.
Second,despite the special design and con-
struction, the Nal detector used in the project did not have a completely
uniform angular response.
It seems that a better spectrometer could be
designed by optimizing the light collection parts of the detector.
It is
suggested that the Nal sphere be completely imbedded in a larger polyvinyl
toluene light pipe to provide more uniform light collection.
the poor resolution of the detector was a major drawback.
Finally,
Building a
small, submersible spectrometer with nearly uniform angular response,
good resolution, and the capability to operate at high count rates may
not be feasible with today's technology.
The absorbed dose rates, determined from the measured fluence
distributions, compared reasonably well with the few ionization chamber
measurements and with the results of Monte Carlo calculations.
The +15%
agreement with ionization chamber measurements is close to the accuracy
that is expected of many dosimetric techniques excepting those conducted
under ideal conditions.
The agreement with the results of the BRH
Monte Carlo calculations does not appear good prima facie.
However, there
are several factors that make this comparison seem much better.
The
beam configuration, spectrum, and location of measurements did not
exactly correspond to the respective quantities in the BRH calculations.
Also the BRH estimations of absorbed dose were based on Monte Carlo
131
calculations, some of which had large statistical uncertainty.
Further
the measurements conducted in this study have a nontrivial, estimated,
experimental error.
The data acquired in this study may be of use to a variety of researchers.
However, potential users are cautioned against indiscrimin-
ately applying the results of this
study before considering the suita-
bility of the MR. ADAM phantom and the degree to which the spectra used in
this study simulate the spectra in the situation being studied.
The MR.
ADAM phantom has several regions of poor simulation including the head,
the upper chest area, and the arm regions. Anyone specifically interested in these regions may find the MR. ADAM phantom and the results of this
study unsuitable. Also, the results of this study may not be suitable
to the study of a particular patient.
Obviously, there is no patient
quite like MR. ADAM, and the dissimilarity between this phantom and a
particular patient will have to be evaluated in each case. The spectra
of the x-ray machine used in this study only approximate spectra typical
of diagnostic radiology.
Further, depending on type of rectification,
actual inherent filtration, and other factors, any particular x-ray
machine may produce x rays with a spectral distribution and other
characteristics that differ from "typical".
It is suggested that at
least the half value layer of the actual x-ray machine being studied be
compared with that of the x-ray machine used in this study.
Of course,
direct determination of the output spectra of an x-ray machine would
be the test indication of the similarity and differences between its
spectra and the ones used in this study.
However, since direct
determination of the spectra of an x-ray machine by means of a high
132
resolution spectrometer is often difficult and expensive, determination
of half value layer may be the only practical means of comparison.
If
the half value layers of the x-ray beams being considered are similar
to the ones in this study, correction for exposure rate differences between the x-ray machines should lead to valid applications of the data
presented in this text.
Within the limits imposed by the accuracy of the simulations, the
resolution of the detector, and the other experimental errors, the data
acquired in this study revealed some interesting information concerning
the transport of diagnostic x-rays in the human body.
By far, the most
important factor affecting spectral shape within the phantom was the
generating potential.
The second most important factor was the medium in
which the spectrum was measured.
The spectra measured in the spine had a
higher average energy than those measured in soft-tissue.
penetration into the phantom affected spectral shape.
Depth of
Over the range of
depths for which spectra were acquired in the direct beam, the average
energy of the measured spectra increased.
dramatic.
However, the increase was not
At 100 kVcp generating potential with a 10 x 10 cm beam
centered on the detector, the average energy of the measured spectrum
increased from 54 keV to 56 keV as the detector was moved from y = 4
to y = 0 (a change of 4 cm). However, the shape of the spectrum
scattered from a 10 x 10 cm beam as a function of distance between the
beam center and center of the detector did not change significantly over
a distance of 31 cm.
Data from the exposure configurations in which shielding was used
demonstrated two effects relevant to the reduction of absorbed dose to
133
radiosensitive regions in patients undergoing x-ray examinations.
The first effect is that of collimator scatter.
Comparing the data
acquired under configurations that were identical in all manners except
shielding showed that in many cases, the effect of the shielding was
significant.
For regions of interest outside the useful beam, the
radiation scattered from the collimator was of comparable size to the
radiation scattered from the useful beam within the phantom.
It seems
that the amount of radiation scattered would depend on the design of the
collimator.
Since a therapy-type collimator was used in this study, it
is not recommended that the data acquired be applied directly to consideration of this effect.
However, it is hoped that the trends in the data
concerning collimator scatter might create some interest in this area.
Additional experimentation would better define the nature of the collimator scatter, and subsequent calculational investigations might produce
a design for collimators optimized to reduce scatter.
In addition to
reduction of absorbed dose to patients, reduction of collimator scatter
would improve the quality of radiographs.
The second effect, relating to the reduction of absorbed dose, is
merely a different view of the collimator scattering.
Since collimator
scattering was demonstrated to be significant, shielding body areas outside the useful beam would reduce the absorbed dose to radiosensitive
areas such as blood-forming organs, thyroid, lens of the eyes, and
reproductive organs.
Data acquired in this study indicated that
although the amount of absorbed dose reduction caused by shielding was
often small, the fractional dose reduction was always significant.
134
Annually, millions of people in this country alone undergo
x-ray examinations.
When one considers that all absorbed dose to regions
outside the useful beam is "wasted" and has the potential for doing only
harm, using all reasonable methods to minimize absorbed dose to such
regions in the millions of patients seems only reasonable.
The results
of this study indicate that shielding all body areas outside the area to
be examined would be an easy way to help keep the risk from medical
diagnostic x-rays "as low as practicable."
APPENDIX A
MEASURED SPECTRA
Presented in this Appendix are the unfolded spectra for 147
combinations of detector location, generating potential, and beam configuration.
A summary of beam configurations and detector locations is
given in Figures 22-28.
In addition, the spectra acquired with the
testes region shielded with 0.16 cm of lead are presented immediately
following the spectra for the corresponding unshielded case.
135
136
X 10 3
DETECTOR LOCATION - TESTES N/0 SHIELD
3.00
2.50
ALL CASES
10 X 10
L. SPINE
60 KVCP
D=4.37E-04
r i
i wi
-
80 KVCP
D=1.59E-03
- - 100 KVCP
D=3.88E-03
2.00
LU
I
CO
i
cc
21
I
CsJ
L.50
51
<_J
\
in
o
i—
o
m
Q_
L.00
.500
0
10
40
50
60
70
80
90
100
ENERGY (KEV)
Figure 48.
Spectrum at the Testes without Shield for Lower Spine. Vertical ticks indicate mean energy. Field size is in cm. D
is the absorbed dose per unit current per unit time (mrad/mA-s;)
137
X 103
DETECTOR LOCATION - TESTES H/ SHIELD
2.50
RLL CASES
10 X 10
L- SPINE
.-•
60 KVCP
D=3.06E-04
80 KVCP
D=l -30E-03
2.00
- 100 KVCP
D=3.43E-03
i
1-50
in
i
cr
z:
i
CM
5Z
<_)
\
CD
CD
hCD
1-00
IE
Q_
,500
0
10
40
50
60
70
80
90
ENERGY (KEV)
Figure 49. Spectrum at the Testes with Shield for Lower Spine Exam.
Vertical ticks indicate mean energy. Field size is in cm,
D is the absorbed dose per unit current per unit time
(mrad/mA-s).
100
138
X 104
8.oor
7.00
DETECTOR LOCATION - TESTES N/O SHIELD
RLL CASES
10 X 44
F. SPINE
60 KVCP
D=l-97E-02
80 KVCP
D=5.53E-02
6-00
100 KVCP
D=l.17E-01
5.00
4-00
3.00
2.00
1.00
0
10
40
50
60
70
80
90
ENERGY (KEV)
Figure 50.
Spectrum at the Testes without Shield for Full Spine Exam,
Vertical ticks Indicate mean energy. Field size is 1n cm.
D is the absorbed dose per unit current per unit time
(mrad/mA-s).
»
100
139
X 104
DETECTOR LOCATION - TESTES N/ SHIELD
6.00
RLL CASES
10 X 44
F. SPINE
5.00
60 KVCP
D=l-06E-02
80 KVCP
D:=3.38E-02
100 KVCP
D=7.74E-02
4.00
x:
i
to
i
<x
CsJ
3.00
JZ
<_)
\
to
-z.
o
I—
o
X
Q_
2.00L
1.001
0
10
40
50
ENERGY
60
70
80
90
(KEV)
Figure 51. Spectrum at the Testes with Shield for Full Spine Exam.
Vertical ticks indicate mean energy. Field size is in cm,
D is the absorbed dose per unit current per unit time
(mrad/mA-s).
100
140
DETECTOR LOCATION - TESTES N/0 SHIELD
X 1CP
...,. !
2.20
2 - 0 0—
_ Ql 1
1
m e r e
unoLO
HLL
1.80_
_
i
1
nn k\/rp
DU r W L r
r-1
36 X 44
ABDOMINAL
r'
• L,
! !L
—
D=4.35E-02
•j
80 KVCP
_
D=1-36E-01
L,
u
'
l-60__
L,
r'
KVCp
10Q
D=2.99E-01 ~~
i
1.40_
~i
i
i
L
l-2d
i
i
_r'
1
i
i
L
i
iL
1 r^
—
uoo_
!
i
.
s
i
i
i
-600_
h
L
•
L
,400
~
H
|
^r
r^r
r
10
t*=
20
h
h
1
-
L,
L
'
i- .
i i
0
—
.
i
• 1
1
.
i
~i
"-1
>200_
—
i
h
: iH
-800_
.
1
30
\
1
40
n
L,
50
1
60
^ Kh
1
H
70
1
80
I
90
ENERGY ( K E V )
Figure 52.
Spectrum at the Testes without Shield for Abdominal Exam.
Vertical ticks indicate mean energy. Field size is in cm.
D is the absorbed dose per unit current per unit time
(mrad/mA-s).
100
141
X 105
DETECTOR LOCATION - TESTES N/ SHIELD
1-80
1-60
RLL CASES
36 X 44
ABDOMINAL
60 KVCP
D=2-30E-02
ri_
_ i
-
1-40
80 KVCP
D=9.71E-02
- - 100 KVCP
D=2.30E-01
1-20
x:
i
CO
i
CE
Z=
I
1-00
CsJ
zz
C_)
\
CO
.800
oI —
o
nz
.600
Q_
,400
.200
0
10
40
50
60
70
80
90
ENERGY (KEV)
Figure 53. Spectrum at the Testes with Shield for Abdominal Exam.
Vertical ticks indicate mean energy. Field size is in cm.
D is the absorbed dose per unit current per unit time
(mrad/iiiA-s).
100
142
X 10 J
DETECTOR LOCATION - TESTES N/0 SHIELD
L50
1
1
1
r^,
ALL CASES
36 X 44
SHOULDER
1
!
|
1
1
1
1
Rn K \ / r p
D U r\VLr
!_
!
"
D=3.55E-04
"-i
80 KVCP
D=1.03E-03—;
0 0
1 -20
|
r
1
h
;
\
10o
KVCP
D=2.14E-03
1
1
*-!
1
1
L,
i
.900
<x
<M
21
(_)
\
CO
o
I—
o
!
rr'
: r^
C/D
I
1^ 1
r—
'
.600
i
1
i
L
•"i
L,
1
1
I r^
31
Q_
!
h
;i
L,
-,
!;
i
^
h
r'J
!!
I 1
!
"!
h
h
I 1
r J
.300 —
,
i
ri ' \
'--
i
h
^
• i
r
\
\
^
-LiT
H
! H
•• j
!_rJJ
0
10
Fn20
r
\
h
I-,
L,
1
40
L
L
L
^
\
1
30
^LL
1
1\
50
1
60
^
I i_
70
1
80
L
1
90
ENERGY ( K E V )
Figure 54.
Spectrum at the Testes without Shield for Shoulder Exam.
Vertical ticks indicate mean energy. Field size is in cm,
D is the absorbed dose per unit current per unit time
(mrad/mA-s).
100
143
X 103
DETECTOR LOCATION - TESTES W/ SHIELD
1-20
1-00
ALL CASES
36 X 44
SHOULDER
60 KVCP
D:=2.57E-04
80 KVCP
D=7.92E-04
-
100 KVCP
D=1.68E-03
.800
I
CO
i
cr
21
I
CM
.600
z:
(_>
\
in
-z.
o
ho
HI
Q_
,400
.200
0
80
10
FNFRPxY
Figure 55.
90
fKFVl
Spectrum at the Testes with Shield for Shoulder Exam.
Vertical ticks indicate mean energy. Field size is in cm,
D is the absorbed dose per unit current per unit time
(mrad/mA-s).
100
144
X 103
DETECTOR LOCATION - TESTES W/0 SHIELD
3.00
2-50
RLL CASES
36 X 22
UPPER G.I.
i
60 KVCP
D=5.93E-04
-1
80 KVCP
D=l-69E-03
100 KVCP
D=3.98E-03
2-00
LU
^L
I
en
i
ex
5=
I
1-50
(NJ
z:
\
CD
-z.
CD
I—
CD
L-00
T.
o_
.500
0
10
40
50
60
70
80
90
ENERGY ( K E V )
Figure 56.
Spectrum at the Testes without Shield for Upper 6.1. Exam,
Vertical ticks indicate mean energy. Field size is 1n cm,
D is the absorbed dose per unit current per unit time
(mrad/mA-s).
100
145
X 103
DETECTOR LOCATION - TESTES W/ SHIELD
2.00
ALL CASES
36 X 22
UPPER G-I.
1-75
60 KVCP
D=2.99E-04
80 KVCP
D=l-06E-03
1-50
- 100 KVCP
D=2.68E-03
1-25
CD
I
ex
CM
1-00
2Z
(_>
\
CD
•z.
o
I—
o .750L
x:
Q_
.500
.250
0
10
40
50
60
70
80
90
ENERGY (KEV)
Figure 57.
Spectrum at the Testes with Shield for Upper G.I. Exam.
Vertical ticks indicate mean energy. Field size is in cm,
D is the absorbed dose per unit current per unit time
(mrad/mA-s).
100
146
X 106
DETECTOR LOCATION - TESTES N/0 SHIELD
4.50
ALL CASES ; "l
AA X 36
r' L
PELVIC
4.00
3.50
60 KVCP
D=2.02E+00
-
r
80 KVCP
D=4.27E+00
-- 100 KVCP
Dz7.70E+00
i
3.00
KT
r1 h
2.50
4i
H
I I
2.00
n
•n
i I
1
rJlL
i
1.50L-
L^
i i
rH
1-00L_
h
h
•n
i . r-1
i I
Ln
-HJ
11
Ln
11
L,
.500
L,
rl-U
Ln
Ln
0
10
Figure 58.
20
30
40
50
60
70
ENERGY ( K E V )
80
90
Spectrum at the Testes without Shield for Pelvic Exam.
Vertical ticks Indicate mean energy. Field size 1s 1n cm,
D 1s the absorbed dose per unit current per unit time
(mrad/mA-s).
100
147
X 105
DETECTOR LOCATION - TESTES N/ SHIELD
10.0
9-00
RLL CASES
44 X 36
PELVIC
60 KVCP
D=2.21E-01
80 KVCP
D=6.56E-01
8-00
100 KVCP
D=l-39E+00
7.00
^
6-00
CO
5.00
4-00
3-00
2.00
L.00
0
10
40
50
60
70
ENERGY ( K E V )
80
90
Figure 59. Spectrum at the Testes with Shield for Pelvic Exam.
Vertical ticks indicate mean energy. Field size is in cm.
D is the absorbed dose per unit current per unit time
(mrad/mA-s).
148
X 102
DETECTOR LOCATION - TESTES N/0 SHIELD
LO.O
9-00
ALL CASES
36 X 44
CHEST - PA
•rL,
,-'
60 KVCP
D=1-03E-Q4
-
8-00
80 KVCP
Dz4.23E-04
— 100 KVCP
D=1.23E-03
7.00
6-00
5.00
4-00
3.00
2.00
-|
"i
"-i
-i
1-00
"n
"-i
-|
0
10
40
50
ENERGY
Jl
60
70
(KEV)
80
90
Figure 60. Spectrum at the Testes without Shield for Chest Exam.
Vertical ticks indicate mean energy. Field size is in cm,
D is the absorbed dose per unit current per unit time
(mrad/mA-s).
149
X 10 4
DETECTOR LOCRTION - RT- OVARY N/0 RPRON
8-00
7.00
ALL CASES
•10 X 10
L. SPINE
60 KVCP
D-1.20E-02 —I
- - 8 0 KVCP
D=4.58E-02
6.00
- - - 100 KVCP
D=1.06E-01
5.00
i
CO
z:
4-00
\
CO
-z.
CD
I—
3.00
o
m
Q-
2.00
1.00
0
10
20
30
80
90
100
ENERGY (KEV
Figure 61. Spectrum at the Right Ovary for Lower Spine Exam. Vertical
ticks indicate mean energy. Field size 1s in cm. D is
the absorbed dose per unit current per unit time (mrad/mA-s).
150
x id 5
DETECTOR LOCfiTION - RT. OVRRY H/0 APRON
3.50
r
L
3.00
Lu
ALL CRSES
10 X 44
F. SPINE
60 KVCP
D=5.21E-02
*" I
I
-I
2.50
80 KVCP
D=2.08E-01
- 100 KVCP
D=4.57E-01
LU
v? 2.00
S
1
r
L
,
h
1.50
\
*1
1.00
I
I
1
I
I
I
h
Li
Ln
n
.500
10
40
50
60
n
70
i
80
L
90
100
ENERGY (KEV)
Figure 62.
Spectrum at the Right Ovary for Full Spine Exam. Vertical
ticks indicate mean energy. Field size is in cm. D is
the absorbed dose per unit current per unit time (mrad/mA-s)
151
X 10 6
DETECTOR LOCRTION - RT. OVARY W/0 RPRON
1.60
--r-T
RLL CRSES
1.40 H 3 6 X 44
RBDOMINRL
1
1
w
l
1
1
1
1
1
1
1.20
60 KVCP
D=3.48E-01
-
80 KVCP
0=9.98E-01
- 100 KVCP
D=2.29E+00
i
LU
—
1.00
i
CO
I
ex
r:
I
.800
s\\
CM
21
CJ
\
CO
z
o
I—
o
.600
X
i
•-1
h
IC
Q_
Ln
,400
S
In
in
Ln
.200
10
J
60
70
Lii80
90
100
ENERGY rKEV)
Figure 63. Spectrum at the Right Ovary for Abdominal Exam. Vertical
ticks indicate mean energy. Field size is in cm. D is
the absorbed dose per unit current per unit time (mrad/mA-s)
152
X 10 3
DETECTOR LOCRTION - R T . OVRRY W/0 RPRON
2.50
fiLL CASES
36 X 44
SHOULDER
r" L
60 KVCP
Dz3.12E-04
L,
2.00
_.
-
80 KVCP
D=1.18E-03
•- 100 KVCP
Dr3.06E-03
LU
*:
i
1.50
co
i
ex
I
<NJ
(_>
\
CO
o
1.00
r^
O
.500
10
40
50
60
70
100
ENERGY ( K E V )
Figure 64.
Spectrum at the Right Ovary for Shoulder Exam. Vertical
ticks indicate mean energy. Field size is in cm. D is
the absorbed dose per unit current per unit time (mrad/mA-s).
153
X 104
DETECTOR LOCRTION - RT. OVRRY M/0 RPRON
6.00
5.00
RLL CRSES
36 X 22
UPPER &.I
i -
I
I
I
I
r
i
60 KVCP
Dr6.33E-03
L
-
80 KVCP
Dr2.62E-02
-- 100 KVCP
Dz6.78E-02
4-00
LU
i
co
i
<x
i
CO
3.00
o
\
CO
o
\—
o
°-
2.00
1.00
40
50
60
70
100
ENER&Y (KEV)
Figure 65.
Spectrum at the Right Ovary for Upper G.I. Exam. Vertical
ticks indicate mean energy. F:ield size is in cm. D is
the absorbed dose per unit current per unit time (mrad/mA-s).
154
x id 5
10.0
DETECTOR LOCRTION - RT. OVRRY W/0 RPRON
9.00_ ALL
CRSES
44 X 36
PELVIC
^-
60 KVCP
D=1.50E-01
r
i
i
-t-
8.00
80 KVCP
D-6.45E-01
100 KVCP
D=1.45E+00
7.00
6.00
5.00
4.00
3.00
2.00
1.00
10
40
50
60
70
ENERGY (KEV)
80
90
100
Figure 66. Spectrum at the Right Ovary for Pelvic Exam. Vertical ticks
indicate mean energy. Field size is in cm. D is the
absorbed dose per unit current per unit time (mrad/mA-s).
155
X 104
DETECTOR LOCRTION - RT. OVRRY N/O RPRON
L.40
1.20
RLL CRSES
36 X 44
CHEST - PR
60 KVCP
D=1.32E-03
^r
-
80 KVCP
D=5.70E-03
- - 100 KVCP
D=1.54E-02
L.00
LU
x:
i
CO
.800
i
a:
n
i
CsJ
z:
o
.600
\
CO
o
o
I—
IE
Q_
.400
.200
40
50
60
70
100
ENERGY (KEV)
Figure 67.
Spectrum at the Right Ovary for Chest Exam. Vertical ticks
indicate mean energy. Field size is in cm. D is the absorbed dose per unit current per unit time (mrad/mA-s).
156
X 102
DETECTOR LOCATION - THYROID GLAND
i-80
L.60
RLL CASES
10 X 10
L. SPINE
60 KVCP
D-1.65E-05
80 KVCP
D=9.70E-05
1.40
100 KVCP
Dz2.34E-04
1-20
LU
^1
I
CO
i
1-00
CE
I
00
CJ
\
CO
.800
o
I—
CD
z:
.600
Q_
.400
.200
40
50
60
70
ENERGY (KEV)
Figure 68. Spectrum at the Thyroid Gland for Lower Spine Exam. Vertical
ticks indicate mean energy. Field size is in cm. D is the
absorbed dose per unit current per unit time (mrad/mA-s).
157
103
DETECTOR LOCATION - THYROID GLAND
1.40
1.20
60 KVCP
D-1.37E-04
ALL CASES
10 X 44
F. SPINE
80 KVCP
D=8.37E-04
-
l.oo
100 KVCP
D-1.90E-03
LU
i
in
i
.800
<x
2Z
I
<M
2Z
CJ
\
CO
ZEL
CD
hO
31
Q_
.600
400
.200
0
80
10
90
100
ENERGY (KEV)
Figure 69.
Spectrum at the Thyroid Gland for Full Spine Exam. Vertical
ticks indicate mean energy. Field size is in cm. D is the
absorbed dose per unit current per unit time (mrad/mA-s).
58
X 103
DETECTOR LOCATION - THYROID GLAND
5.00
4.50
ALL CASES
36 X 44
ABDOMINAL
60 KVCP
Dz5.07E-04
^r<
- - 8 0 KVCP
D=2.89E-03
4-00
- 100 KVCP
D=6.60E-03
3.50
3.00
2.50
2.00
L.50
L.OOU
.500
0
10
40
50
60
70
90
ENERGY IKEV)
Figure 70.
Spectrum at the Thyroid Gland for Abdominal Exam. Vertical
ticks indicate mean energy. Field size is in cm. D is the
absorbed dose per unit current per unit time (mrad/mA-s).
100
159
X 106
DETECTOR LOCATION - THYROID GLAND
2.50
ALL CASES
36 X 44
SHOULDER
60 KVCP
D-4.46E-01
80 KVCP
D=2.01E+00-
2.00
100 KVCP
D=3.79E+00
UJ
:*:
i
CO
i
1.50
ex
3=
I
<SJ
C__)
\
CO
-ZL
o
ho
1-00
h
Q_
Li
h
h
h
h
h
h
h
h
.500
0
10
40
50
60
70
ENERGY (KEV)
80
v
90
Figure 71. Spectrum at the Thyroid Gland for Shoulder Exam. Vertical
ticks indicate mean energy. Field size is in cm. D is the
absorbed dose per unit current per unit time (mrad/mA-s).
100
160
X 103
DETECTOR LOCATION - THYROID GLRND
7.00
6-00
FILL CASES
36 X 22
UPPER G - I .
r i
I ~l
80 KVCP
D=3.62E-03
100 KVCP
D=8.58E-03
ru
5.00
i
CO
i
60 KVCP
D=5-.34E-04
4.00
ex
I
CM
z=
CJ
\
CO
.r
3.00
-z.
o
I—
o
HI
Q_
2.00
1-00
0
10
£fl20
40
50
60
70
80
90
100
ENERGY (KEV)
Figure 72. Spectrum at the Thyroid Gland for Upper G.I. Exam. Vertical
ticks indicate mean energy. Field size is in cm. D is the
absorbed dose per unit current per unit time (mrad/mA-s).
161
X 10 3
DETECTOR LOCRTION - THYROID GLRND
1-40
1-20
RLL CASES
44 X 36
PELVIC
60 KVCP
D=l-68E-04
_r
80 KVCP
D=8.86E-04
- 100 KVCP
D=1.89E-03
1-00
•
i
CO
i
.800
CO
CJ
\
CO
~2L
O
\—
-600
o
in
.400
h
h
h
h
h
h
h
h
.200
0
10
40
50
60
70
L.
—
±L
80
90
100
ENERGY (KEV)
Figure 73.
Spectrum at the Thyroid Gland for Pelvic Exam. Vertical
ticks indicate mean energy. Field size is in cm. D is the
abosrbed dose per unit current per unit time (mrad/mA-s).
162
X 105
DETECTOR LOCATION - THYROID GLAND
3.00
2.50
60 KVCP
D-1.60E-02
ALL CASES
36 X 44
CHEST - PA
80 KVCP
D=1.61E-01
L,
L
_ i
j
KVCP
D=3.55E-01
100
2.00
LU
:*:
i
CO
i
ex
(SJ
1-50
zr
cj
\
CO
o
hCD
m
1.00
"-.
•n
L,
L,
.500
Li
Ln
Ln
0
10
d£
20
30
40
50
60
70
ENERGY ( K E V )
h
80
90
Figure 74. Spectrum at the Thyroid Gland for Chest Exam. Vertical
ticks indicate mean energy. Field size is in cm. D is the
absorbed dose per unit current per unit time (mrad/mA-s).
100
163
X 10 3
6.00
DETECTOR LOCATION - HEART REGION
1
1
1
ALL CASES
1
i
io x io
4.00 _
1
en
OU
H
>
IL
l
J
'
1
i/\/rp
rxVLr
D=7.61E-04
L
i
r
1
^ _(
L,
r'
I L. SPINE
5.00L_i
1
80 KVCP —\
D=3.11E-03
1
- .
!L
100 KVCP
D=8.93E-03
.
i
i
i
i
,
i
i
LU
i
CD
I
<X
i—
i
i
i
i
i
L
i
i
i
3.00
(M
i
2Z
CJ
\
CD
rr''
O
r\
\—
o
Q_
,
<->
2.00L_
\_^
:
*-1
" L
; ;
L,
^
! _rJ
1
1
: -1
H-L
^ L
20
30
40
L
h
^-1
10
I
'-.
r '
L.OOL
0
I
60
L_2±,
50
ENERGY (KEV)
L
h
L_^J80
70
90l _ _100
Figure 75. Spectrum at the Heart Region for Lower Spine Exam. Vertica'
ticks indicate mean energy. Field size is in cm. D is the
absorbed dose per unit current per unit time (mrad/mA-s).
164
X 105
1.40
DETECTOR LOCATION - HEART REGION
1
L-20_
1
'
r - _ _
ALL CASES
10 X 44
F. SPINE
L-00_
1
1
1
Rn K \ / P P
!
DU
«-.
1
1
r\VLr
D-1-21E-02
r1
"--I
i
...|
80 KVCP
D=9.31E-02
r!
100
'-i
D=2.09E-01-
i
!
KVCP
L,
1
1
1
.800_
"1
i
CO
I
1
L
1
>
UJ
1
1
ex
1
I
CM
CJ
\
CO
.600
rr
-z.
CD
I—
r\
r- \
l
i
J
o
^.I.
n
i
4
3Z
Q_
'
1
.400_
,
S
r^
1
. 2 0 0 _—
11
r'-J
• i
rl-J
0
10
Figure 76.
\
#J
20
30
40
4
50
60
70
80
90
00
ENERGY (KEV)
Spectrum at the Heart Region for Full Spine Exam. Vertical
ticks indicate mean energy. Field size is in cm. D is the
absorbed dose per unit current per unit time (mrad/mA-s).
165
X 105
DETECTOR LOCATION - HEART REGION
3.00
r-'
2.50
ALL CASES
36 X 44
ABDOMINAL
L,_
60 KVCP
D=2.64E-02
-
80 KVCP
D-l -92E-01
- - 100 KVCP
D=4.54E-01
2.00
CD
I
ex
2Z
I
(M
2Z
L-50
<_)
\
CD
~Z.
o
o
hJZ
Q_
L-00
500
0
10
Figure 77.
40
LL
50
60
70
80
90
100
ENERGY ( K E V )
Spectrum at the Heart Region for Abdominal Exam. Vertical
ticks indicate mean energy. Field size is in cm. D is the
absorbed dose per unit current per unit time (mrad/mA-s).
166
X 105
3.501
3.00
DETECTOR LOCATION - HEART REGION
I
I
I
I
60 KVCP
D=3.54E-02
ALL CASES
36 X 44
SHOULDER
-
80 KVCP
D=1-98E-01
- - 100 KVCP
D=4.44E-01
2.50
<f 2.00
cr
OJ
(_J
\
CO
-z.
1-50
o
I—
o
JZ
Q_
1-00
.500
0
10
40
50
60
80
90
100
ENERGY (KEV)
Figure 78.
Spectrum at the Heart Region for Shoulder Exam. Vertical
ticks indicate mean energy. Field size is in cm. D is the
absorbed dose per unit current per unit time (mrad/mA-s).
167
X 106
DETECTOR LOCATION - HEART REGION
L-20
1.00
ALL CASES
36 X 22
UPPER G.I.
r U.
60 KVCP
D-1.35E-01
80 KVCP
D=8.04E-01
100 KVCP
D-1.73E+00
.800
^L
I
CD
I
Csl
.600
2=
CJ
\
CD
~z.
CD
\—
O
H
Q_
,400
.200
0
10
Figure 79.
40
50
60
70
ENERGY (KEV)
90
100
Spectrum at the Heart Region for Upper G.I. Exam. Vertical
ticks indicate mean energy. Field size is in cm. D is the
absorbed dose per unit current per unit time (mrad/mA-s).
168
X 103
3.50
DETECTOR LOCflTION -
HEART REGION
r i
3.00
60 KVCP
D=2.33E-04
RLL CASES
44 X 36
PELVIC
-
80 KVCP
D-1.93E-03
- - 100 KVCP
D=5.08E-03
2.50
ru
CD
I
CX
2.00
CSJ
z:
<_j
\
CD
1-50
o
h—
o
n
Q_
1-00
h
h
h
h
h
h
h
.500_
0
^
10
Figure 80.
20
30
40
50
ENERGY
Spectrum at the Heart Region
indicate mean energy. Field
sorbed dose per unit current
L,
—
60
70
80
90
100
(KEV)
for Pelvic Exam. Vertical ticks
size is in cm. D is the abper unit time (mrad/mA-s).
169
X 106
DETECTOR LOCATION - HEART REGION
1-20
1
QI
i
HLL
1
n
en
DU
r
r
r
-r 1
_i
i
i *
r
r -'
i
i
80 KVCP
-i
D=6.29E-01
"|
-->
"I
1-1
100 KVCP
D=1.53E+00
1
1
.800 _
i
r1
1
1
1
L
CO
CM
i
"'
.600L_
'
1
I
1
I
CL
2Z
I
1
1
CJ
\
CO
1
r"
CD
\—
CD
m
Q_
K\/PP
r\VLr
D=7.91E-02
L
«
i
\
PQ^F^
LHOLu
36 X 44
CHEST - PA
1-00
r
1
_,
: r
'
r
.200
1
ir
.r'l
-
!
r>
i
'
i
1
\
^
1
1
'
n
1
,400L
L,
L_
1
L,
h
!
^
~<
L
h
1
r^J ,__r
20
30
"L,
\1
~LL
Li
• i
10
;
^
r'—•
0
:L
^
1 1
j-jiU^j-1 1
\
L,
1
40
i-|_j
50
|
60
| L, |
70
80
|
90
100
ENERGY ( K E V )
Figure 81. Spectrum at the Heart Region for Chest Exam. Vertical ticks
indicate mean energy. Field size is in cm. D is the absorbed dose per unit current per unit time (mrad/mA-s).
170
X 105
DETECTOR LOCATION - 5TH LUMBAR VERTEBRA
2.50
ALL CASES
10 X 10
L. SPINE
60 KVCP
D-1.13E-02
r1-!
80 KVCP
D=1.10E-01
2.00
100 KVCP
D=2.82E-01
Jl
x:
1-50
i
co
i
(M
CJ
\
CO
21
o
I—
o
n
_i
X 10
I-00
rJ~
Q_
"n
h
r1
r i
1
,500
Li
r
Ln
r ^
!
Ln
i
Ln
Ln
0
10
JatEP
20
Ln
30
40
50
ENERGY
Figure 82.
60
70
80
90
100
(KEV
Spectrum at the Fifth Lumbar Vertebra for Lower Spine Exam,
Vertical ticks indicate mean energy. Field size is in cm.
D is the absorbed dose per unit current per unit time
(mrad/mA-s).
171
X 10 5
DETECTOR LOCATION - 5TH LUMBAR VERTEBRA
4.00
ALL CASES
3 . 5 0 _ 10 X 44
F. SPINE
60 KVCP
D=1.53E-02
80 KVCP
D=l.64E-01
r_ i
3.00_
I
100 KVCP
D=4.25E-01
r. I
r-»
UJ
2.50_
i
CD
I
d
CSJ
z:
o
2.00_
X 10
\
CD
-z.
o
I—
o i.50_
in
Q_
1.00_
Ln
h
h
.500
I
L>
I
1
k
%J
0
^
10
Figure 83.
20
30
40
Q
h
h
h
50
60
70
ENERGY (KEV)
±.80
90
100
Spectrum at the Fifth Lumbar Vertebra for Full Spine Exam,
Vertical ticks indicate mean energy. Field size 1s in cm.
D 1s the absorbed dose per unit current per unit time
(mrad/mA-s).
172
X 105
DETECTOR LOCATION - 5TH LUMBAR VERTEBRA
7.00
6.00
60 KVCP
D=:2.54E-02
ALL CASES
36 X 44
ABDOMINAL
,-r
i
80 KVCP
D=2.71E-01
100 KVCP
D=7.48E-01
5.00
,->
CO
4-00
i
az
2Z
I
CNJ
2Z
LJ
\
CO
3.00
o
h-
o
in
Q_
2.00
1.00
0
10
20
30
40
50
60
70
ENERGY (KEV)
80
90
101
Figure 84. Spectrum at the Fifth Lumbar Vertebra for Abdominal Exam.
Vertical ticks indicate mean energy. Field size is in cm.
D is the absorbed dose per unit current per unit time
(mrad/mA-s).
173
X 103
DETECTOR LOCRTION - 5TH LLIMBRR VERTEBRR
5.00
60 KVCP
D=1.02E-04
RLL CASES
36 X 44
SHOULDER
-
4-00
80 KVCP
D=1.52E-03
- - 100 KVCP
D=4.42E-03
3.00
co
i
ex
CNJ
2Z
CJ
\
CO
o
I—
o
2.00
Q_
l-00_
0
10
40
50
60
70
80
90
100
ENERGY (KEV)
Figure 85,
Spectrum at the Fifth Lumbar Vertebra for Shoulder Exam.
Vertical ticks indicate mean energy. Field size is in cm.
D is the absorbed dose per unit: current per unit time
(mrad/mA-s).
174
X 104
DETECTOR LOCATION - 5TH LUMBAR VERTEBRR
9-00
8.00
ALL CASES
36 X 22
UPPER G-I
-
60 KVCP
D=2.49E-03
-
80 KVCP
D=3.40E-02
-
100 KVCP
D=9.01E-02
7.00
6-00
CO
cL
5 00
-
CNJ
5=
CJ
\
4-00_
C/D
CD
I—
CD
in
Q-
3.00
2-00_
L-00_
0
10
40
50
60
70
90
100
ENERGY (KEV)
Figure 86,
Spectrum at the Fifth Lumbar Vertebra for Upper G.I. Exam.
Vertical ticks indicate mean energy. Field size is in cm.
D is the absorbed dose per unit current per unit time
(mrad/mA-s).
175
X 104
DETECTOR LOCRTION - 5TH LUMBAR VERTEBRA
12.0
LQ.O
60 KVCP
D=3.39E-03
RLL CASES
44 X 36
PELVIC
-
80 KVCP
D=4.73E-02
- - 100 KVCP
D-1.39E-01
8.00
LU
i
co
i
z:
6-00 \— \
X 10
CJ
\
CO
~ZL
o
o
I—
in
a_
4-00
2.00
0
10
40
50
60
70
80
90
100
ENERGY (KEV)
Fi gure 87.
Spectrum at the Fifth Lumbar Vertebra for Pelvic Exam.
Vertical ticks indicate mean energy. Field size is in cm.
D is the absorbed dose per unit current per unit time
(mrad/mA-s).
176
X 104
DETECTOR LOCRTION - 5TH LUMBAR VERTEBRA
3.50
3.00
60 KVCP
D=1.66E-03
ALL CASES
36 X 44
CHEST - PA
-
80 KVCP
D=1.41E-02
-
100 KVCP
D=3.57E-02
2.50
LU
i
°P 2.00
<x
CNJ
5=
CJ
LO
~Z.
O
\—
O
1-50
n
Q_
I-00
.500
0
10
20
30
40
50
60
70
80
90
100
ENERGY (KEV)
Figure 88. Spectrum at the Fifth Lumbar Vertebra for Chest Exam.
Vertical ticks indicate mean energy. Field size is in cm.
D 1s the absorbed dose per unit current per unit time
(mrad/mA-s).
177
X 103
DETECTOR LOCATION - THORACIC SPINE
2.50
ALL CASES
10 X 10
L. SPINE
60 KVCP
D-3.14E-05
80 KVCP
Dz7.59E-04
2.00
- 100 KVCP
Dz2.55E-03
*i
i
1.50
CO
i
cc
(\J
TZ
C_J
\
CO
~z.
o
1.00
I—
o
HI
Q_
.500
0
10
40
50
60
70
80
90
100
ENERGY (KEV)
Figure 89.
Spectrum at the Thoracic Spine for Lower Spine Exam.
Vertical ticks indicate mean energy. Field size is in cm.
D is the absorbed dose per unit current per unit time
(mrad/mA-s).
178
X 104
DETECTOR LOCRTION - THORACIC SPINE
6.00
5.00
60 KVCP
D=1.27E-03
RLL CASES
10 X 44
F. SPINE
80 KVCP
D=2.17E-02
^r~:
.-<
- 100 KVCP
D=6.45E-02
4-00
LO
1
cr
zz
I
3.00
(NJ
zz
LJ
\
LO
~ZL
O
I—
CD
m
2.00
Q_
1.00
0
10
40
50
60
70
80
90
100
ENERGY CKEV)
Figure 90.
Spectrum at the Thoracic Spine for Full Spine Exam.
Vertical ticks indicate mean energy. Field size is in cm.
D is the absorbed dose per unit current per unit time
(mrad/mA-s).
179
X 10 5
i-2or
l.oo
DETECTOR LOCRTION - THORACIC SPINE
60 KVCP
D=3.00E-03
ALL CASES
36 X 44
ABDOMINAL
80 KVCP
D=4.85E-02
^r
^r
-i
- 100 KVCP
D=1.34E-01
.800
CO
I
ex
2=
I
(NJ
.600
2=
CJ
\
CO
-z.
o
I—
o
n=
Q_
• 400
.200
0
10
30
40
80
90
100
ENERGY (KEV)
Figure 91.
Spectrum at the Thoracic Spine for Abdominal Exam.
Vertical ticks indicate mean energy. Field size is in cm,
D is the absorbed dose per unit current per unit time
(mrad/mA-s).
180
X 105
DETECTOR LOCATION - THORACIC SPINE
2.50
60 KVCP
D=9.12E-03
ALL CASES
36 X 44
SHOULDER
80 KVCP
D=7.41E-02
2.00
100 KVCP
D=2 10E-01
UJ
i
CO
i
_ i
1-50
ex
5Z
I
CsJ
5Z
C_J
\
CO
~ZL
o
I—
o
r-'
X 10
1.00
_I
JZ
Q_
~ \
H
.500
^
H
h
h
h
h
r-r
_ i
r'
'r^
0
10
20
30
40
50
60
h.
70
~I
80
90
100
ENERGY (KEV)
Figure 92. Spectrum at the Thoracic Spine for Shoulder Exam.
Vertical ticks indicate mean energy. Field size is in cm,
D is the absorbed dose per unit current per unit time
(mrad/mA-s).
181
X 105
DETECTOR LOCRTION - THORACIC SPINE
3.50
3.00
RLL CASES
36 X 22
UPPER G.I.
60 KVCP
Di=1.35E-02
80 KVCP
D=1.36E-01
_ 1
100 KVCP
D=3.90E-01
2.50
LU
:*:
i
CO
2.00
_ 1
i
ex
OJ
X 10
z:
CJ
\
CO
2:
1.50
o
I—
o
nz
Q_
1.00
\
r^
l
~i
^
_r
.500
Ln
h
h
h
h
h
h
h
H
r-l
F ^
^J
0
10
20
30
40
50
60
70
80
90
100
ENERGY (KEV)
Fi gure 93.
Spectrum at the Thoracic Spine for Upper G.I. Exam.
Vertical ticks indicate mean energy. Field size is in cm.
D is the absorbed dose per unit current per unit time
(mrad/mA-s).j
182
X 103
DETECTOR LOCATION - THORACIC SPINE
1.80
1-60
ALL CASES
44 X 36
PELVIC
60 KVCP
D=3.05E-05
-
80 KVCP
D=6.01E-04
1-40
- - 100 KVCP
D=2.02E-03
1-20
>
LU
^:
i
CO
i
1-00
cc
z:
i
X 10
OJ
zr
CJ
\
CD
o
ho
.800
.600
,400
.200_
0
10
L,
^L
20
30
40
i50
—
"n
60
70
80
90
100
ENERGY (KEV)
Figure 94.
Spectrum at the Thoracic Spine for Pelvic Exam. Vertical
ticks Indicate mean energy. Field size 1s 1n cm. D 1s
the absorbed dose per unit current per unit time (mrad/mA-s).
183
x ioP
DETECTOR LOCRTION - THORACIC SPINE
3.00
2.50
RLL CRSES
36 X 44
CHEST - PR
60 KVCP
D=2.39E-01
80 KVCP
D=l-42E+00
-- 100 KVCP
Dr3.26E+00
_ i
_ i
2.00
r-'
LU
^:
i
CO
CvJ
1.50
n
C_)
\
CO
-ZL
o
I—
o
1.00
in
Q_
.500
0
10
40
50
60
70
80
90
100
ENERGY ( K E V )
Figure 95.
Spectrum at the Thoracic Spine for Chest Exam. Vertical
ticks indicate mean energy. Field size is in cm. D is
the absorbed dose per unit current per unit time (mrad/mA-s).
184
X 102
DETECTOR LOCATION - EYE REGION
2.50
RLL CRSES
10 X 10
L. SPINE
ri
60 KVCP
D-7.16E-05
- - 8 0 KVCP
Dz2.48E-04
2.00
--- 100 KVCP
D=4.34E-04
IxJ
x:
i
CO
L-50
i
cr
z:
i
OJ
z:
CJ
\
CO
-z.
o
I—
o
L-00
in
Q_
.500
0
10
40
50
60
70
80
90
.00
ENERGY (KEV)
Figure 96.
Spectrum at the Eye Region for Lower Spine Exam. Vertical
ticks indicate mean energy. Field size is in cm. D is
the absorbed dose per unit current per unit time (mrad/mA-s)
185
X 10 3
1-20
DETECTOR LOCATION - EYE REGION
i
i
i
i
i
I
1
ALL CASES , r '
10 X 44
',
1.00 _ F . SPI NE_;
e n |<\/rp
DU rxVUr
L.
l
L
D=3.84E-04
j
!
r
1
1
j
J_
1 0 0 KVCP
'
Ij.
D=2.05E-03
1
1
1
i
CO
r
i
1
""I
! ^
:i ^ h
L
L
cr
0\J
1
i
1
i
.600
CJ
\
CO
-ZL
L,
h•
•u i
~~
r
1
^
1
L.
h
i
j
hJZ
»
i
z=
o
o
—
80 KVCP
D=1.21E-03
,
.800_
I
H
r-^
.400_
Q_
; i
•
1 1
J
r \
.1
i
i_
0
10
20
1
30
L
^
hL,
1_
1
1\
40
—
;L.
h
h
J^\
•-rr
trI
L,
s
i
11
.200_
"!
^
1 |
!
i
L
i
H
^s
I.!-,
h
h
50
\
60
L
hi
70
80
^
1 "
90
100
ENERGY (KEV)
Figure 97.
Spectrum at the Eye Region for Full Spine Exam. Vertical
ticks indicate mean energy. Field size is in cm. D is
the absorbed dose per unit current per unit time (mrad/mA-s).
186
DETECTOR LOCATION - EYE REGION
1CP
4-00
1
1
1
1
1
1
1
, - " • •
r
i
i
'
'
-1
RLL CRSES •
3.50 —36 X 44
!
ABDOMINAL!
en
DU
i
i
L
D=1.50E-03—|
,
i
i
80 KVCP
D=4.28E-03
i
i
i
3.00 —
r
•
1
1
1
•-I
i
-1
i
-1
1
r '
I
1
1
1
~1
1
i
•
i
1
1
1
' 1
!.
2.00 -
100 KVCP
-\
D=7.03E-03
[• 1
r - 1- i
n_J
2.50
i
i
i
i
i
T^
L
i 1
1
|1
h
h
h
h
-X
'1 1I
l
i-00
—
0
-
10
•
i i
1
i
•
.500
.
*-»
i
i
w
1
i
Yf
*-> r
H•'J
J
L
<
^
jjp
|
20
i
i
1
hi-,
hh
h
'-,
r
r
'
i
i
1
i-50
KV/PP
r\VLr
L
s
J
1
:
X
h
1
30
A
i
40
u50
i
60
U,
h
70
-\
-L
i
i
80
90
100
ENERGY (KEV)
Figure 98.
Spectrum at the Eye Region for Abdominal Exam. Vertical
ticks indicate mean energy. Field size is in cm. D is
the absorbed dose per unit current per unit time (mrad/mA-s).
187
X 105
DETECTOR LOCATION - EYE REGION
2.00
L.80
•ALL CASES
36 X 44
SHOULDER
ri
I L
60 KVCP
D=6.54E-02
80 KVCP
D=1.76E-01
L.60
100 KVCP
D=3.23E-01
1.40
i
CO
I
1-20
cc
z:
i
LOCI
Csl
z:
CJ
\
CO
~ZL
.800
o
\—
o
HI
a_
.600
h
.400
h
h
h
h
h
.200
0
L.
—
J=L
10
40
50
60
70
80
90
100
ENERGY (KEV)
Figure 99. Spectrum at the Eye Region for Shoulder Exam. Vertical
ticks indicate mean energy. Field size 1s in cm. D is
the absorbed dose per unit current per unit time (mrad/mA-s)
188
X 10 5
DETECTOR LOCRTION - EYE REGION
2.00
•ALL CASES
SLIGHTLY
SMALLER
1-60 FIELD SIZE
SHOULDER
L-80
60 KVCP
D=3.39E-02
80 KVCP
D-1.05E-01
- 100 KVCP
D=1.89E-01
1.40
LU
I
CO
1.20
I
<x
M
r i
1 -00
2Z
<_)
\
CO
o
i
i
.800
_•
i—
o
JZ
Q_
.600
.400
.200
0
10
40
50
60
70
80
90
100
ENERGY (KEV)
Figure 100.
Spectrum at the Eye Region for Shoulder Exam (with 28 x 44
cm Field). Vertical ticks indicate mean energy. Field size
is in cm. D is the absorbed dose per unit current per unit
time (mrad/mA-s).
189
X 10 3
DETECTOR LOCATION - EYE REGION
1
1
1
1
1 1
1
3.50
n
ML-L.
3.00_
36 X 22
UPPER G . I . !-<-,
i
i
80 KVCP
D=3-25E-03
"!
I
i
i
-._ i
i
—
\<\!CP
r\VLr
0=1.13E-03_
l
r
2.50
Rfl
DU
unuLU
1
*!
100 KVCP
D=5.47E-03 —
L,
1
1
L,
L.
r1
2.00 —
""
1
L,
1
*" 1
1
r""1
i
ri :i r
i
^
1
L.1
'
w 1
"1
1-50
i i
- ~
i
i
I
L,i
i
' i
•
L
L.
rp
[ i
h
!
L,
i i
1.00
—
"
i i
!»
_i
r
«
.500 _
—
10
1
-
"I
1
30
1
40
—
1
^
h
i
,
!-,
L-i
1
i l l
.HJ
20
i
h
r-r-
-IV
JJJ
H
h
!' rH
0
l
",
1,
'"I
U
50
1
60
PL, 1
70
80
1
90
100
ENERGY ( K E V )
Figure 101.
Spectrum at the Eye Region for Upper G.I. Exam. Vertical
ticks indicate mean energy. Field size is in cm. D is
the absorbed dose per unit current per unit time (mrad/mA-s).
190
X 1CP
DETECTOR LOCATION -
3.00
1
1
1
EYE REGION
1
1
1
1
1
F f l KV/PP
DU r W L r
RLL CRSES
44 X 36
2.50 _ P E L V I C
D=8.87E-04
,TL,
; '-,
•
80 KVCP —
D=2.55E-03
l
r
100 KVCP
D=4.43E-03
L
i
2.00
—
i-
L,
•-'
* 1
I
CO
U
L,
cr
CM
1.50 —
I,
• r^J
!1
!H
I i
~\
^
h
I 1
1.00
1
i
Ln
ri 1 ,'
"_"i
Q_
!
ii 1- ^
2Z
CJ
\
CO
o
J —
o
z:
|
1
i
2Z
I
—
1
~1
1
!
H
-!
h
r^
1
1
1
I
!i i
r
rrT
rHJ
!
L
h
1
^ _r
.500 <—
L
H
1
1
.
h
-,
L_
n
\
L.
^
h
i
—
'
h
^
LT
I
0
10
20
|
30
40
50
60
70
80
90
100
ENERGY ( K E V )
igure 102.
Spectrum at the Eye Region for Pelvic Exam. Vertical ticks
indicate mean energy. Field size is in cm. D is the absorbed
dose per unit current per unit time (mrad/mA-s).
APPENDIX B
EFFECT OF FIELD SIZE
Presented in this Appendix are the comparisons of the spectra
acquired for the lower spine, full spine, and abdominal examinations
for six detector locations including the testes, right ovary, thyroid,
lens of the eye, fifth lumbar vertebra, and thoracic spine regions.
These comparisons are presented to show the effect of field size on
the spectrum.
The lower spine, full spine, and abdominal exams all
have the same beam center, and their field sizes are 10 x 10 cm,
10 x 44 cm, and 36 x 44 cm, respectively (see Figures 22-24).
191
192
X 104
1.801
L-60
DETECTOR L O C A T I O N -
EYE REGION
60 KVCP
D=5.81E-04
ALL CASES
'36 X 44
CHEST - PA
^r
— 80 KVCP
D=8.12E-03
1-40
- - 100 KVCP
D=2.04E-02
1-20
1-00
.800
-600
I
h
h
Lr^
.400
r
Li
h
h
1
I
"-,
h
!i
1
.200
r
0
10
Figure 103.
20
30
X 10
40
•n
•n
b.
50
60
70
ENERGY ( K E V )
80
90
100
Spectrum at the Eye Region for Chest Exam. Vertical ticks
indicate mean energy. Field size 1s in cm. D is the absorbed dose per unit current per unit time (mrad/mA-s).
193
X 10 4
DETECTOR LOCATION - TESTES W/0 SHIELD
5.00
4-50
r"
4-00
3.50
10 X 10
D=4.37E-04
FILL CASES
60 KVCP
i
10 X 44
D=l-97E-02
L.
_
- 36 X 44
Dn4.35E-02
rL
3.00
2.50
2.00
1.50
1.00
.500
0
10
40
50
ii60
70
80
90
100
ENERGY (KEV)
gure 104. Spectrum at the Testes as a Function of Field Size ~ 60 kVcp.
Vertical ticks indicate mean energy. Field size is in cm.
D is the absorbed dose per unit current per unit time (mrad/mA-s)
194
X 105
1.201
DETECTOR LOCUTION - TESTES N/O SHIELD
1
1
1
1
r
1
ALL CRSES
80 KVCP
1
"
10 X 10
D=l-59E-03
1.00
10 X 44
D=5-53E-02
36 X 44
D=1.36E-01
.800
I
CO
I
(X
2=
I
.600
CM
2=
\
CO
CD
I—
CD
m
,400
Q_
•200_
0
10
40
50
60
70
80
90
100
ENERGY (KEV)
Figure 105.
Spectrum at the Testes as a Function of Field Size -- 80 kVcp
Vertical ticks indicate mean energy. Field size is in cm.
D is the absorbed dose per unit current per unit time
(mrad/mA-s).
195
X 105
2.00
DETECTOR L0CRTI0N - TESTES N/0 SHIELD
ft
1 rh
1
1
r
r-
10 X 10
Dr3.88E-03
1.80L-RLL CASES
100 KVCP
10 X 44
L.60
D=l -17E-01
- 36 X 44
D=2.99E-01
L-40
1
CO
1
L-20
en
z:
1
CNJ
1-00
z:
CJ
\
CO
2:
0
.800
.600L_
•400L_
• 200L
0
10
20
30
40
50
60
70
100
ENERGY (KEV)
Figure 106.
Spectrum at the Testes as a Function of Field Size —
100 kVcp. Vertical ticks Indicate mean energy. Field size
is 1n cm. D is the absorbed dose per unit current per unit
time (mrad/mA-s).
196
X lb5
DETECTOR LOCATION - RT. OVRRY W/O RPRON
4.00
3.50 I—
10 X 10
D=1.20E-02
RLL CASES
60 KVCP
10 X 44
D=5.21E-02
3.00
[2
>£
i
CO
i
36 X 44
D=3.48E-01
2.50
2.00
CsJ
c_>
\
in
o
i—
o
1.50
X
Q.
1.00
r^
,500
r^
•n
X 10
H
10
Figure 107.
J20£
30
J
40
\Lu
50
60
70
ENERGY (KEV)
80
90
100
Spectrum at the Right Ovary as a Function of Field Size —
60 kVcp. Vertical ticks indicate mean energy. Field size
is in cm. D is the absorbed close per unit current per unit
time (mrad/mA-s).
197
x id5
9.oor
8.00
DETECTOR LOCATION - RT. OVARY W/O APRON
10 X 10
D=4.57E-02
ALL CASES
80 KVCP
-
7.00
10 X 44
D=2.19E-01
- 36 X 44
Dz9.98E-01
6.00
5.00
£
4.00
o
I—
O
n:
°-
3.00
2.00__
1.00
0
10
Figure 108.
40
50
60
70
ENERGY (KEV)
Spectrum at the Right Ovary as a Function of Field Size -80 kVcp. Vertical ticks indicate mean energy. Field size
is in cm. D is the absorbed dose per unit current per unit
time (mrad/mA-s).
198
X 106
DETECTOR LOCATION' - RT. OVRRY W/O RPRON
L-60
L-40
ALL CASES
100 KVCP
10 X 10
D-1.06E-01
10 X 44
D-4.91E-01
L-20
36 X 44
D=2.29E+00
LOO
id
I
co
i
en
2=
I
CO
.800
2=
C_)
\
CO
-z:
o
»—
o
.600
in
Q_
.400
.200
0
10
40
50
60
70
100
ENERGY (KEV)
Figure 109.
Spectrum at the Right Ovary as a Function of Field Size —
100 kVcp. Vertical ticks Indicate mean energy. Field size
is in cm. D is the absorbed dose per unit current per unit
time (mrad/mA-s).
199
X 102
DETECTOR LOCATION - THYROID GLAND
6.00
10 X 10
D=1.65E-05
ALL CASES
60 KVCP
5.00
10 X 44
D=1.37E-04
36 X 44
D=5.07E-04
4.00
CO
i
cr
2Z
I
<\J
3.00
2Z
<_J
\
CO
-z.
CD
\—
o
2.00
X 10
1.00
0
10
40
50
60
70
80
90
100
ENERGY (KEV)
Figure 110.
Spectrum at the Thyroid as a Function of Field Size -60 kVcp. Vertical ticks indicate mean energy. Field size
is in cm. D is the absorbed dose per unit current per unit
time (mrad/mA-s).
200
X 103
DETECTOR LOCRTION - THYROID GLRND
2.50
10 X 10
Dr9.70E-05
ALL CASES
80 KVCP
10 X 44
D-8.37E-04
2.00
- 36 X 44
D=2.89E-03
i
CO
1.50
i
<x
I
CM
ZI
LJ
\
CO
o
\—
o
1.00
m
a_
,500
0
10
40
50
60
70
80
90
100
ENERGY (KEV)
Figure 111.
Spectrum at the Thyroid as a Function of Field Size —
80 kVcp. Vertical ticks indicate mean energy. Field size
is in cm. D is the absorbed dose per unit current per unit
time (mrad/mA-s).
201
X 103
DETECTOR LOCATION - THYROID GLAND
5.00
ALL CASES
100 KVCP
10 X 10
D=2.34E-04
10 X 44
D=1.90E-03
4.00
36 X 44
Dz6.60E-03
LU
XI
I
3.00
co
i
CE
2Z
I
<M
2Z
CJ
\
CO
o
\—
o
2.00
HI
o_
I.00_
0
10
40
50
60
70
80
90
100
ENERGY (KEV)
Figure 112.
Spectrum at the Thyroid as a Function of Field Size -100 kVcp. Vertical ticks indicate mean energy. Field size
is in cm. D is the absorbed dose per unit current per unit
time (mrad/mA-s),
202
X IO4
DETECTOR LOCATION - 5TH LUMBRR VERTEBRA
4-00
3.50
10 X 10
D=1.13E-02
ALL CASES
60 KVCP
10 X 44
D=1.53E-02
3.00
UJ
36 X 44
D=2.54E-02
2.50
r-1
rL
2.00
h
^
A
1-50
I-00
\-
rl
.500 _
i
0
10
Jj£
20
r-1
30
40
50
60
70
80
90
100
ENERGY (KEV)
Figure 113,
Spectrum at the Fifth Lumbar Vertebra as a Function of
Field Size — 60 kVcp. Vertical ticks indicate mean
energy. Field size is 1n cm. D is the absorbed dose per
unit current per unit time (mrad/mA-s).
203
X 10 5
2.5or
DETECTOR LOCRTION - 5TH LUMBAR VERTEBRA
I
RLL CASES
80 KVCP
L
L
^i
10 X 10
D=l .10E-01
•
!
2.00
10 X 44
D=1.64E-Q1
- 36 X 44
D=2.71E-01
1.50
1.00
.500
0
10
40
50
60
70
80
90
ENERGY (KEV)
Figure 114.
Spectrum at the Fifth Lumbar Vertebra as a Function of
Field Size — 80 kVcp. Vertical ticks indicate mean
energy. Field size is in cm. D is the absorbed dose
per unit current per unit time (mrad/mA-s).
100
204
X 10 5
7.oor
6.00
DETECTOR LOCRTION - 5TH LUMBRR VERTEBRR
10 X 10
D=2.82E-01
RLL CRSES
100 KVCP
10 X 44
D-4.25E-01
36 X 44
D=7.48E-01
5.00
4-00
3.00
2-00
L-OOL
0
10
40
50
60
70
100
ENERGY (KEV)
Figure 115.
Spectrum at the Fifth Lumbar Vertebra as a Function of
Field Size — 100 kVcp. Vertical ticks indicate mean
energy. Field size is in cm. D is the absorbed dose
per unit current per unit time (mrad/mA-s).
205
X 103
DETECTOR LOCATION - THORACIC SPINE
5.00
10 X 10
D=3.14E-05
ALL CASES
60 KVCP
10 X 44
4.00
D=l-27E-03
36 X 44
D=3.00E-03
i
i
i
i
L I
LU
:*:
i
CO
i
3.00
CE
21
I
l_ l
X 100
OvJ
n
CJ
\
ui
-z.
o
I—
o
m
2.00
r1
Q_
~i
h
1.00
r^
•n
"n
1
r
r
0
10
Figure 116.
IP
20
-J
1
I
30
40
50±L 60
70
ENERGY (KEV)
80
90
Spectrum at the Thoracic Spine as a Function of Field
Size -- 60 kVcp. Vertical ticks indicate mean energy,
Field size is in cm. D is the absorbed dose per unit
current per unit time (mrad/mA-s).
100
206
X 104
DETECTOR LOCATION - THORACIC SPINE
7.001
6.00
ALL CASES
80 KVCP
10 X 10
Dr7.59E-04
10 X 44
D=2.17E-02
- 36 X 44
* D=4.85E-02
5.00
4.00
X 100
3.00
2.00
1.00
0
90
10
ENERGY (KEV)
Figure 117.
Spectrum at the Thoracic: Spine as a Function of Field
Size ~ 80 kVcp. Vertical ticks indicate mean energy,
Field size is in cm. D is the absorbed dose per unit
current per unit time (mrad/mA-s).
100
207
X 105
DETECTOR LOCATION - THORRCIC SPINE
1-20
10 X 10
D-2.55E-03
RLL CRSES
100 KVCP
1.00
- -
10 X 44
D=6.45E-02
36 X 44
D=1.34E-01
.800
x:
i
CO
i
CE
2Z
I
.600
CsJ
2=
O
\
CO
o
\—
o
X
,400
cu
.200
0
10
20
30
40
50
60
70
80
90
ENERGY (KEV)
Figure 118. Spectrum at the Thoracic Spine as a Function of Field
Size — 100 kVcp. Vertical ticks Indicate mean energy.
Field size 1s in cm. D is the absorbed dose per unit
current per unit time (mrad/mA-s).
100
208
X 103
DETECTOR LOCRTION - EYE REGION
i-20
10 X 10
D-7.16E-05
ALL CASES
60 KVCP
1.00
- — 10 X 44
Dz3.84E-04
- - - 36 X 44
D=1.50E-03
.800
LU
XL
I
CO
I
cr
TZ
I
CSJ
.600
zr
CJ
\
CO
X 10
o
I—
o
IE
Q_
.400
200
0
10
40
50
60
70
80
90
100
ENERGY (KEV)
Figure 119.
Spectrum at the Eye Region as a Function of Field Size •
60 kVcp. Vertical ticks indicate mean energy. Field
size Is in cm. D is the absorbed dose per unit current
per unit time (mrad/mA-s).
209
X 103
DETECTOR LOCATION - EYE REGION
3.00
RLL CRSES
80 KVCP
10 X 10
D=2.48E-04
2.50
10 X 44
D=1.21E-Q3
36 X 44
D=4.28E-03
2.00
i
CO
i
1-50
CsJ
21
CJ
\
CO
"Z.
o
oI —
11
1.00
Q_
X 10
.500
0
10
40
50
60
70
90
100
ENERGY (KEV)
Figure 120.
Spectrum at the Eye Region as a Function of Field Size —
80 kVcp. Vertical ticks indicate mean energy. Field
size is in cm. D 1s the absorbed dose per unit current
per unit time (mrad/mA-s).
210
X 103
DETECTOR LOCATION - EYE REGION
4-50
4-00
10 X 10
D34.34E-04
ALL CASES
100 KVCP
-
3.50
10 X 44
D=2.05E-03
- 36 X 44
D=7.03E-03
3.00
2.50
2.00
o
•JZ
°-
1-50
L-00
.500
0
10
20
30
40
50
ENERGY
60
70
(KEVJ
Figure 121. Spectrum at the Eye Region as a Function of Field Size •
100 kVcp. Vertical ticks indicate mean energy. Field
size is in cm. D is the absorbed dose per unit current
per unit time (mrad/mA-s).
BIBLIOGRAPHY
A166
Alderson, S. W., 1966, "The role of Phantoms, Machlett-Alderson
Phantom," Cathode Press 23, 2.
An76
Anderson, V. E., 1976, personal communication, December 2, 1976.
Ar57
Ardran, G. M., and Crooks, H. E., 1957, "Gonad Radiation from
Diagnostic Procedures," Br. J. Radiol. 30, 295.
At75
Atkins, H. L., Fairchild, R. G., Robertson, J. S., and Greenburg,
D., 1975, "Effect of Absorption Edge Filters on Diagnostic X-Ray
Spectra," Radiol. 115, 431.
BEIR72
BEIR, 1972, National Academy of Sciences-National Research Council
Advisory Committee on the Biological Effects of Ionizing Radiations , Tjre Effects on Populations of Exposure tp_ Low Levels of
Ionizing Radiation "(Washington,, NAS-NRC).
Be76
Bemis, C. E., 1976, personal communication, June 10, 1976.
Bi57
Billings, M. S., Norman A., and Greenfield, M. A., 1957, "Gonad
Doses During Routine Roentgenography," Radiol. 69, 37.
Ca75
Carter, L. L., and Cashwell, 1975, Particle Transport Simulation
with the Monte Carlo Method, (USERDA Div. Technical Info., TID26607TT16.
Ch70
Chambers, F. W., 1970, Class notes from "Particle Accelerators,"
Nucl. Eng. 641, Ga. Inst, of Tech. Fall, 1970.
Du63
Duggan, H. E., and Olde, G. L., 1963, "Radiation Dose to the Skin
and to the Gonads from Diagnostic Procedures," Canad. Med. Assoc.
J^_, 89, 1144.
E143
Ellinger, F., 1943, "Lethal Dose Studies with X-Rays I," Medical
Times, May, 157.
E161
Ellis, R. E., 1961, "British Survey of the Radiation Dosage to the
Population from Medical Radiology, Laboratory Investigations," in
the Ninth Int'l. Congress of Radiology 1, 112.
Ep67
Epp, E. R., and Weiss, H., 1967:, "Spectral Fluence of Scattered
Radiation in a Water Medium Irradiated with Diagnostic X-Rays,"
Rad. Res. 30, 129.
Ep61
Epp, E. R., Weiss, H., and Laughlin, J. S., 1961, "Measurement
of Bone Marrow and Gonadal Dose from the Chest X-Ray Examination
as a Function of Field Size, Field Alignment, Tube Kilovoltage,
and Added Filtration," Br. J. Radiol. 34_, 85.
211
212
Ev68
Evans, R. D., 1968, "X-Ray and y-Ray Interactions," in Radiation
Dosimetry Vol. I, 2nd ed., eds. F. h. Attix and W. C. Roesch
(New York: Academic Press), 93.
Ev65
Evans, R. D., 1965, The Atomic Nucleus (New York: McGraw-Hill),
Chap. 21, 23, 24, and 25.
Fi67
Fisher, Jr., H. L., and Snyder, W. S., 1967, "Distribution of
Dose in the Body from a Source of Gamma Rays Distributed Uniformly
in an Organ," Health Phys. Pi v. Ann. Progr. Rept., ORNL-4168, 245.
Fr66
Friedlander, G., Kennedy, J. W., and Miller, J. M., 1966, Nuclear
and Radiochemistry, 2nd ed. (New York: Wiley), Chap. 4.
Ga75
Garry, S. M., Stansbury, P. S., and Poston, J. W., 1975, "Measurement of Absorbed Fractions for Photon Sources Distributed Uniformly
in Various Organs of a Heterogeneous Phantom," Health Phys. 28,, 591.
Gi75
Gibson, J. A- B., Ardran, G. M., Peaple, L. H. J., Marshall, M,,,
Crooks, H. E., and Birch, R., 1975, "Standardization of the Output
from Diagnostic X-Ray Generators," in Biomedical Dosimetry, Symp.
Proc. on Advances in Biomedical Dosimetry, held in Vienna, March,
1975, ISBN 92-0-01050575-0, pp. 509-519.
Gr60
Great Britain Committee on Radiological Hazards to Patients, 1960,
Radiological Hazards to Patients (London: Her Majesty's Stationery
Office)".
Gr51
Greening, J.R.,1951, "A Method of Determining the Wavelength
Distribution of the X-Radiation at a Point in a Scattering Medium,"
Br. J. Radiol. 24, 204.
Ha72
Hashizume, T., Kato, Y., Maruyama, T., Kumamoto, Y., Shiragai, A.,
and Nishimura, A., 1972, "Population Mean Marrow Dose and Leukemia
Significant Dose from Diagnostic Medical X-Ray Examinations in
Japan, 1969," Health Phys. 23, 845.
He74
Heath, M. T., 1974, The Numerical Solution of in-Conditioned
Systems of Linear Equations, 0RNL-4957.
Hu74
Hurst, G. S., Garrett, w. R., arid Payne, M. G., 1974, "Rationale
for Radiation Protection," Health Phys. 26, 313.
ICRP66
International Commission on Radiological Protection, 1966, ICRP
Publication No. 9, Recommendations of the International Commission
on Radiological Protection, p. 1, part 3, (Oxford: Pergamon Press).
ICRP75
International Commission on Radiological Protection, 1975, Report
of the Task Group on Reference Man, ICRP Publication 23, (Oxford:
Pergamon Press).
213
ICRU71
International Commission on Radiation Units and Measurements, 1971,
Radiation Quantities and Units, ICRU Report 19.
ICRU28
International Commission on Radiation Units and Measurements, 1928,
"International X-Ray Unit of Intensity," Br\_ vh_. Radiol. 1, 363.
Ja67
Jackson, W., 1967, "Dose Assessment in Diagnostic Radiology,"
Br. J. Radiol. 40, 301.
Ja71
Japan Research Group on the Genetically Significant Dose by Medical
Use of X-Ray in Japan, 1961, "The Genetically Significant Dose by
the X-Ray Diagnostic Examinations in Japan," Nippon Acta Radiologica
21, 567.
Jo69
Johns, H. E., and Cunningham, J. R., 1969, The Physics of Radiology,
3rd ed. (Springfield, IL: Thomas).
Jo49
Jones, D. E. A., and Raine, H. C , 1949, "Mix D," Br. J. Radiol.
22, 549.
Jo76
Jones, T. D., 1976, A CHORD Simulation for Insult Assessment to
the Red Bone Marrow, ORNL-5191.
Jo75
Joseph, P. M., 1975, "Mathematical Method for Determining kVp from
X-Ray Attenuation Measurements," Med. Phys. 2, 201.
La57
Laughlin, J. S., Meurk, M. L. Pullman, J., and Sherman, R. S.,
1957, "Bone, Skin, and Gonadal Doses in Routine Diagnostic Procedures," Am. J. Roent. 78, 961.
Le67
Lederer, M. C , Hollander, J. M., and Perlman, I., 1967, Table of
Isotopes , 6th ed. (New York: Wiley).
Li58
Lincoln, T. A., and Gupton, E. D., 1958, "Radiation Doses in Diagnostic X-ray Procedures," Radiol. 71, 208.
Ma60
Mak, S., and Cormack, D. V., 1960, "Spectral Distribution of
Scattered X Rays at Points Lying Off the Beam Axis," Br., J.
Radiol. 331, 362.
Mc72
McCorkle, D. L., Christophorou;, L. G., and Anderson, V. E., 1972,
"Low Energy (< 1 eV) Electron Attachment to Molecules at Very
High Gas Densities: 0 2 ," J. Phys. B: Molec. Phys. 5, 1211.
Mc69
McMaster, W. H., Del Grande, N.. K., Mallet, J. H., and Hubbell,
J. H., 1969, Compilation of X-Ray Cross Sections, UCRL-50174,
Sec. II, Rev. 1.
Me75
Mei, N. H., 1975, Measurement of Absorbed Fractions as a Function
of Source Organ Size for Selected Source Organs in a^ Heterogeneous
Phantom (Thesis, University of Tennessee).
214
Mo71
Morgan, K. Z., 1971, "Excessive Medical Diagnostic Exposure," 3rd
Ann. Nat. Conf. on Rad. Control, May 2-6, 1971, Scottsdale, Arizona.
Mo67
Morgan, K. Z., and Turner, 0. E., (eds.), 1967, Principles of
Radiation Protection (New York: Wiley), Chapter 1.
Mu27
Muller, H. J., 1927, "Artificial Transmutation of the Gene,"
Science 66^, 84.
Mu62
Murray, R. B., 1962, "Scintillation Counters," in Nuclear Instruments and Their Uses, 2nd ed.,, ed. A. H. Snell (New York:Wi 1 eyJT 82.
Po73
Poston, J. W., and Snyder, W. S., 1973, "A Model for Exposure to a
Semi-Infinite Cloud of a Photon Emitter," Health Phys. 26, 287.
Po74a
Poston, J. W., and Warner, G. G., 1974, "Absorbed Dose to
Selected Internal Organs from Typical Diagnostic Exposures,"
Proceedings erf th£ Third Congress ojf th£ International Radiation
Protection Association, Washington, D.C., Sept. 9-14, 1973.
Po74b
Poston, J. W., Warner, G. G., and Stansbury, P. S., 1974, Medical
X-Ray Dose Estimation Program Progress Report for Period Ending
August 31, 1974, ORNL/TM-4722.
Pr64
Price, W. J., 1964, Nuclear Radiation Detectors, 2nd ed., (New
York: McGraw-Hill), 159.
Qu37
Quimby, E. H., and Arneson, A. N., 1937, "Comparison of Paraffin
and Water Phantoms for Roentgen-Ray Depth Dose Measurements,"
Am. J. Roent. 37, 93.
Ri72
Rindi, A., and Thomas, R. H., 1972, "Povera E Nuda Vai, Dosimetria,"
Health Phys. 23, 715.
Ro68a
Roesch, W. C , and Attix, F. H., 1968, "Basic Concepts of
Dosimetry," in Radiation Dosimetry, Vol. I, 2nd ed., eds. F. H.
Attix and W. C. Roesch, (New York: Academic Press), 1.
Ro68b
Roesch, W. C , 1968, "Mathematical Theory of Radiation Fields,"
in Radiation Dosimetry Vol. I, 2nd ed., eds. F. H. Attix and
W. C. Roesch, (New York: Academic Press), 266.
Ro76a
Rosenstein, M., 1976, Organ Doses in Diagnostic Radiology,
HEW Publication (FDA) 76-8030.~
Ro76b
Rosenstein, M., 1976, Handbook of Selected Organ Doses for
Projections Common in Diagnostic Radiology, HEW Publication
(FDA) 76-8031.
Sc97
Scott, N. S., 1897, "X-Ray Injuries," Am. X-Ray J. 1, 57.
Si77
Siedban. J. M., 1977, University of Wisconsin, personal
communication, March 17, 1977.
215
Sn74
Snyder, W. S., Ford, M. R., Warner, G. G., and Watson, S. B.,
1974, A Tabulation of Dose Equivalent per Microcurie-Day for
Source and Target Organs p£ ajri Adult for Various Radionuclides,
ORNL/TM-5000.
Sn73
Snyder, W. S., 1973, "Mathematical Procedures for Estimating
Dose from an Internally Deposited Emitter," p. 33 in Health Physics
Problems of Internal Contamination, (Budapest, Hungary: Akademiai
Kiado).
Sn70
Snyder, W. S., 1970, Medical Radionuclides: Radiation Dose and
Effects (ERDA Div. Technical Info., Oak Ridge, September 197_0),
33.
Sn69
Snyder, W. S., Ford, M. R., Warner, G. G., and Fisher, H. L., Jr.,
1969, MIRD Pamphlet No. 5, J. Nucl. med. 10, Suppl. No. 3.
Sp43
Spiers, F. W., 1943, "Materials for Depth Dose Measurement," Br.
J. Radiol. 16, 90.
St55
Stanford, R. W., and Vance, J., 1955, "The Quantity of Radiation
Received by the Reproductive Organs of Patients During Routine
Diagnostic X-Ray Examinations," Br. J. Radiol. 28, 266.
Sta75
Stansbury, P. S., and Poston, J. W., 1975, "An Outline of Experimental Programs Using the MR. ADAM Phantom," p. 262 in Health
Phys. Div. Ann. Progr. Rept., ORNL-5046.
St74
Stansbury, P. S., 1974, "TECALC - A Program to Calculate Compton,
Coherent, and Photoelectric Mass Attenuation Coefficients for
Photons with Energies Less than 1 MeV and to Assist in the Formulation of Photon-Equivalent Materials," ORNL/TM-4451.
Str75
Strickert, T., and Fosmark, H., 1975, "Some Measurements of
Scattered Radiation from an Alderson Phantom for X-Ray Beams from
50 to 200 kVp," Health Phys. 28, 209.
Ta72
Takeshita, K., Antoku, S.,and Sawada, S., 1972, "Exposure
Pattern, Surface, Bone Marrow, Integral and Gonadal Doses from
Fluoroscopy," Br. J. Radiol. 45, 53.
Th75
Thorngate, J. H., 1975, "Though It's Been Said Many Times, Many
Ways ...," Health Phys. 28, 633.
Tr72
Trout, E. D., and Kelley, J. P., 1972, "Scattered Radiation from
a Tissue-Equivalent Phantom for X Rays from 50 to 300 kVp," Radiol.
104, 161.
Tr65
Trout, E. d., and Kelley, J. P., 1965, "Scattered Radiation in a
Phantom from Diagnostic Quality Radiation," Radiol. 85, 546.
216
Va72
Vacirca, S. J., Thompson, D. L,, Pasternak, B. S., and Blatz, H.,
1972, "A Film-Thermoluminescent Dosimetry Method for Predicting
Body Doses Due to Diagnostic Radiography," Phys. Med. Biol. 17a
71.
Wa73
Waggener, R. G., Levy, L. B., and Zanca, P., 1973, "Spectra of
Scattered Diagnostic X-Rays from an Alderson Phantom," Health
Phys. 24, 59.
Wa72
Waggener, R. G., Roberts, L. F., and Zanca, P,, 1972, "A Matrix
Method to Correct for Non-linear Energy Response of NaI(T£)
Spectrometer Systems," Health Phys., 22, 292.
We57
Webster, E. W., and Merrill, 0. E.,, 1957, "Measurement of Gonadal
Dose in Radiographic Examinations," New England J. of Medicine
257, 311.
Yo67
Yoshinaga, H., Takeshita, K., Sawada, S., Russell, W. J., and
Antoku, S., 1967, "Estimation of Exposure Pattern and Bone
Marrow and Gonadal Doses During Fluorscopy," Br. J. Radiol. 40,
344.
VITA
Paul Stansbury was born in St. Petersburg, Florida, on June 16,
1947.
He enrolled at the Georgia Institute of Technology in 1965.
While an undergraduate, he was elected to Sigma Pi Sigma and was designated a Dean's List student six times.
He participated in the cooperative program at Georgia Tech and
gained work experience with Martin Co., Orlando, Florida, Lockheed
Missiles and Space Co., Huntsville, Alabama, and Communications
Satellite Corp., Washington, DC.
He was initiated into the Phi Kappa
Tau Fraternity and served as pledgemaster and vice president.
ceived his BS in Physics in June of 1970.
He re-
In June of 1971, he received
an MS in Physics from the same institution.
While a graduate student Paul Stansbury served as his department's representative to the Graduate Student Senate, and later, he
served as Graduate Student Body Treasurer.
In 1972, he was awarded a
Graduate Laboratory Participation Grant by Oak Ridge Associated
Universities.
Under this grant, he performed his dissertation research
in the Medical Physics and Internal Dosimetry Section of the Health Physics
Division of the Oak Ridge National Laboratory.
He received his PhD
through the Nuclear Engineering Department of Georgia Tech in June of 1977.
217


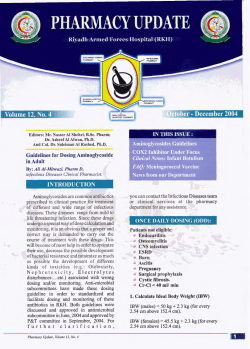


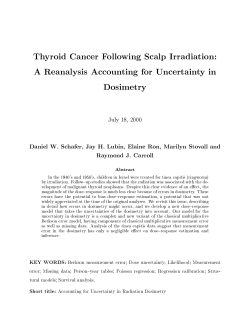

© Copyright 2026