
Commentary: Emerging Markets Debt Fund
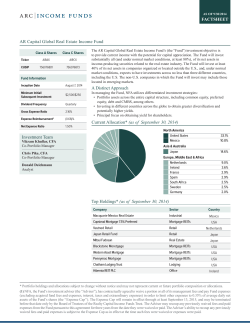
NOT FDIC INSURED | NO BANK GUARANTEE | MAY LOSE VALUE
JPMorgan
Emerging Markets Debt Fund
A Shares (JEDAX)
C Shares (JEDCX)
Select Shares (JEMDX)
Data as of October 31, 2014
Fund overview
Objective
The Fund's goal is to provide high total return from a portfolio
of fixed income securities of emerging markets issuers.
Strategy/Investment process
• Invests primarily in emerging market debt investments.
• Maintains duration similar to that of the JPMorgan Emerging
Markets Bond Index.
• May hedge its non-dollar investments back to the U.S. dollar
through the use of derivatives.
• Seeks individual fixed income investments that it believes will
perform well over market cycles.
Portfolio managers/industry experience
Pierre-Yves Bareau, 23 years
Matias Silvani, 16 years
Portfolio characteristics
Number of holdings
Fund assets (in billions)
Portfolio breakdown (%)*
Cash/Cash-Equivalent
EM Local Currency Denominated Sovereign Debt
EM USD Denominated Corporate Debt
EM USD Denominated Quasi-Sovereign Debt
EM USD Denominated Sovereign Debt
Average life (%)*
Years 1-3
Years 3-5
Years 5-7
Years 7-10
Years 10-20
Years 20+
Duration1
Average life2
285
$1.06
3.2
4.6
2.9
19.1
70.2
5.4
9.7
21.2
25.8
8.4
29.6
6.85 years
11.54 years
Quality (%)*
AAA
3.1
AA
0.4
A
0.6
BBB
55.3
BB
18.2
B
10.7
CCC & Lower/Other
11.8
*
Due to rounding, values may not total 100%.
The manager receives credit quality ratings on underlying securities
of the portfolio from the three major ratings agencies - S&P,
Moody's and Fitch. When calculating the credit quality breakdown,
the manager selects the lowest rating of the agencies when all
three agencies rate a security. The manager will use the lower of
the two ratings if only two agencies rate a security and will use one
rating if that is all that is provided. Securities that are not rated by
all three agencies are reflected as such.
Please refer to the back of the page for important disclosure
information including risks associated with investing in the
Fund.
Market review
Emerging market debt spreads tightened slightly during October. The J.P. Morgan Emerging Market Bond Index
Global spreads reached a wide of 372 basis points (bps) in mid-month before tightening to finish the month at 332
bps, 2 bps tighter than the previous month. The total return of the index was 1.65%. The U.S. 10-year Treasury
ended the month at 2.33%, 15 bps lower than the previous month, but reached lows of 2.14% in mid-month. On
the index level, local currency and corporate debt underperformed external sovereign debt. Retail flows to
emerging market bond funds remained lackluster.
Economic data continued to point to regional differentiation. The U.S. showed stronger data as Purchasing
Manager Indexes remained elevated and third-quarter gross domestic product (GDP) was above expectations at a
3.5% annualized rate, while the Eurozone outlook remained weaker. In China, the economy showed some
stabilization, with third-quarter GDP at 7.3% year over year, largely due to strong exports driven by product
launches in the technology sector, which are unlikely to persist. Chinese authorities continued to pursue targeted
easing policies in face of a slowing economy.
Commodities, particularly oil, were major drivers of price action over the month. Oil prices (West Texas
Intermediate crude oil) fell from over $90 a barrel to under $80 a barrel during the month. Oil exporters like
Venezuela, Iraq, Angola and Nigeria were among the worst performers in October. At the same time, oil importers
like Turkey, Dominican Republic, Indonesia and the Philippines were among the major outperformers this month.
While Venezuela was able to pay major bond maturities due in October, investors remained defensive given
continued economic deterioration and declining political support for the current administration, on top of
concerns about falling oil prices. African countries in general underperformed in the month as investors looked to
lighten risk mid-month. Ukraine was also a top outperformer in the month, driven by strong technicals (light
investor positioning) amid relatively positive developments - smooth parliamentary elections and reaching an
interim gas agreement with Russia and the European Union.
Brazil also held presidential elections over the month. The opposition candidate, A?cio Neves, who was favored by
markets, surprised by winning enough votes to go on to the second round - driving outperformance of Brazilian
assets early in the month. However, this outperformance wore off as expectations refocused on an incumbent
victory. Incumbent President Dilma Rousseff won by a narrow margin - just 51.6% of the vote - and investor focus
shifted back towards the tough fiscal and economic challenges ahead for Brazil.
Over the month, S&P downgraded Ghana one notch to B- and Moody's downgraded Russia to Baa2.
Portfolio review
The JPMorgan Emerging Markets Debt Fund returned 1.69% (Select Class Shares) for the month ended October 31,
2014, compared with the Fund's benchmark, the J.P. Morgan Emerging Markets Bond Index Global, which returned
1.65%.
The Fund outperformed the benchmark over the month. Key contributors included security selection in Indonesia.
The Fund's underweights in Chile and China also contributed. Key detractors included security selection in Ukraine,
as well as overweights in Iceland and Ecuador.
Over the month, we continued to add to Eastern European countries with strong and improving fundamental
stories - in particular Hungary and Romania. We reduced exposure in Latin America and more
commodity-sensitive countries. We reduced the position in Russia and added to the position in Indonesia. We also
tactically added some positions in Ukraine and Argentina, although our strategic outlook in these high-yield
countries remains cautious. The Fund's largest overweights are Hungary, Jamaica, Iceland, Dominican Republic
and Honduras.
Outlook
Our outlook for emerging market debt remains supported by relatively attractive valuations and technicals, in
particular limited sovereign issuance and still-accommodative global policies. However, we have become more
cautious on risks, including sharp turns in risk sentiment as well as a potential aggressive Treasury sell-off. We
remain very cautious in the major high-yield countries with negative fundamental developments - Argentina,
Venezuela and Ukraine. Instead, we favor investment-grade names with positive fundamental trends and investor
support, along with lower-beta idiosyncratic credits that offer diversification and a pick-up in yield. We also remain
cautious on commodity exporters and continue to favor manufacturing exporters, especially those with more
exposure to the U.S. than Europe, as growth activity continues to look stronger in the U.S.
The manager seeks to achieve the stated objectives. There is no guarantee the objectives will be met.
The securities highlighted above have been selected based on their significance and are shown for
illustrative purposes only. They are not recommendations.
NOT FDIC INSURED | NO BANK GUARANTEE | MAY LOSE VALUE
A Shares (JEDAX)
C Shares (JEDCX)
Select Shares (JEMDX)
JPMorgan Emerging Markets Debt Fund
Data as of October 31, 2014
Contact JPMorgan Distribution Services, Inc. at 1-800480-4111 for a fund prospectus. You can also visit us at
www.jpmorganfunds.com. Investors should carefully
consider the investment objectives and risks as well as
charges and expenses of the mutual fund before
investing. The prospectus contains this and other
information about the mutual fund. Read the prospectus
carefully before investing.
MORNINGSTAR DISCLOSURE:
©2014, Morningstar, Inc. All Rights Reserved. The information
contained herein: (1) is proprietary to Morningstar and/or its
providers; (2) may not be copied or distributed; (3) is not
warranted to be accurate, complete or timely. Neither
Morningstar nor its content providers are responsible for any
damage or losses arising from any use of this information. For
each fund with a three-year history, Morningstar calculates a
Morningstar Rating™ metric each month by subtracting the
return on a 90-day U.S. Treasury Bill from the fund's loadadjusted return for the same period, and then adjusting this
excess return for risk. The top 10% of funds in each broad asset
class receive 5 stars, the next 22.5% receive 4 stars, the next
35% receive 3 stars, the next 22.5% receive 2 stars and the
bottom 10% receive 1 star. The Overall Morningstar Rating for a
fund is derived from a weighted average of the performance
figures associated with its three-, five- and ten-year (if
applicable) Morningstar Rating metrics. Past performance is no
guarantee of future results. Different share classes may have
different ratings.
INDEXES DEFINED:
The J.P. Morgan Emerging Markets Bond Index Global tracks total
returns for U.S. dollar-denominated debt instruments issued by
emerging market sovereign and quasi-sovereign entities: Brady
bonds, loans, Eurobonds. The performance of the index does not
reflect the deduction of expenses associated with a fund, such as
investment management fees. By contrast, the performance of the
Fund reflects the deduction of the fund expenses, including sales
charges if applicable. An individual cannot invest directly in an
index.
The performance of the Lipper Emerging Market Hard Currency Debt
Funds Index includes expenses associated with a mutual fund, such
as investment management fees. These expenses are not identical to
the expenses charged by the Fund.
DURATION:
1
Measures price sensitivity of fixed income securities to interest rate
changes.
AVERAGE LIFE:
2The length of time the principal of a debt issue is expected to be
outstanding.
RETURNS:
3The quoted performance of the Fund includes performance of a
predecessor fund/share class prior to the Fund's commencement of
operations. Please refer to the current prospectus for further
information.
©2014, American Bankers Association, CUSIP Database provided by
the Standard & Poor's CUSIP Service Bureau, a division of The
McGraw-Hill Companies, Inc. All rights reserved.
Total return assumes reinvestment of dividends and capital gains
distributions and reflects the deduction of any sales charges, where
applicable. Performance may reflect the waiver of a portion of the
Fund's advisory or administrative fees for certain periods since the
inception date. If fees had not been waived, performance would
have been less favorable.
J.P. Morgan Funds are distributed by JPMorgan Distribution Services,
Inc., which is an affiliate of JPMorgan Chase & Co. Affiliates of
JPMorgan Chase & Co. receive fees for providing various services to
the funds. JPMorgan Distribution Services, Inc. is a member of
FINRA/SIPC.
J.P. Morgan Asset Management is the marketing name for the asset
management businesses of JPMorgan Chase & Co. Those businesses
include, but are not limited to, JPMorgan Chase Bank, N.A., J.P.
Morgan Investment Management Inc., Security Capital Research &
Management Incorporated and J.P. Morgan Alternative Asset
Management, Inc.
©JPMorgan Chase & Co., November 2014
FC-EMD-1014
Fund performance**
Month-end total returns at NAV (%) as of 10/31/2014
A Shares3
C Shares3
Select Shares
J.P. Morgan Emerging Markets Bond Index Global
Lipper Emerging Market Hard Currency Debt Funds Index
With sales charges (%)
A Shares with 3.75% max. sales charge3
C Shares with 1.00% max. CDSC3
Quarter-end total returns at NAV (%) as of 9/30/2014
A Shares3
C Shares3
Select Shares
J.P. Morgan Emerging Markets Bond Index Global
Lipper Emerging Market Hard Currency Debt Funds Index
With sales charges (%)
A Shares with 3.75% max. sales charge3
C Shares with 1.00% max. CDSC3
Yields (%) as of 10/31/2014
30-day SEC yield
30-day SEC yield (unsubsidized)
Yields (%) as of 9/30/2014
30-day SEC yield
30-day SEC yield (unsubsidized)
Calendar-year returns (%)
A Shares at NAV3
J.P. Morgan Emerging Markets Bond Index Global
Lipper Emerging Market Hard Currency Debt Funds Index
Total returns
1 month 3 month
1.65
-0.92
1.58
-1.04
1.69
-0.85
1.65
-0.15
1.14
-0.79
YTD
7.34
6.81
7.52
9.06
6.38
Average annual total returns
1 yr
3 yrs
5 yrs
10 yrs
5.35
6.21
7.93
7.34
4.85
5.66
7.39
6.91
5.57
6.44
8.18
7.57
7.20
6.70
8.27
8.39
5.17
5.57
7.13
7.82
-2.21
0.58
-4.69
-2.04
3.37
5.81
1.45
3.85
4.85
5.66
7.11
7.39
6.94
6.91
-2.90
-2.91
-2.90
-2.41
-2.22
-2.66
-2.77
-2.63
-1.65
-2.10
5.60
5.14
5.72
7.30
5.18
6.30
5.82
6.50
8.28
6.59
7.11
6.61
7.38
7.69
7.21
7.54
7.01
7.81
7.95
7.17
7.39
6.97
7.61
8.38
7.91
1.69
2.28
4.14
4.82
C Shares
3.93
3.76
5.73
6.61
-6.58
-6.34
-3.91
-3.77
A Shares
4.25
4.08
A Shares
4.52
4.43
2009
41.27
28.19
35.05
2010
13.06
12.06
13.35
C Shares
4.18
4.09
2011
5.95
8.46
2.19
6.73
6.98
7.01
6.97
Select Shares
4.68
4.58
Select Shares
4.95
4.86
2012
2013
20.10
-7.02
18.53
-6.58
19.19
-5.26
**
The performance quoted is past performance and is not a guarantee of future results. Mutual funds are subject to certain
market risks. Investment returns and principal value of an investment will fluctuate so that an investor's shares, when
redeemed, may be worth more or less than original cost. Current performance may be higher or lower than the performance
data shown. For performance current to the most recent month-end, please call 1-800-480-4111.
Morningstar ratings as of 10/31/2014
Overall
3-Year
5-Year
10-Year
Rating/number of funds in category
★★★/200
★★★/200
★★★/101
Not yet rated
A share class: Emerging Markets Bond Category
The Overall Morningstar Rating™ for a fund is derived from a weighted average of the performance figures associated with
its three-, five-, and 10-year (if applicable) Morningstar Rating metrics.
Annual operating expenses
A Shares
C Shares
Select Shares
Expense cap expiration date
11/1/2015
11/1/2015
11/1/2015
Expense cap (%)
1.25
1.75
1.00
Total annual Fund operating expenses (%)
1.45
1.97
1.14
Fee waivers and/or expense reimbursements (%)4
(0.24)
(0.26)
(0.18)
Net expenses (%)4
1.21
1.71
0.96
4
The Investment Advisor, Administrator and Distributor (the "Service Providers") have contractually agreed to waive fees and/or
reimburse expenses to the extent that Total Annual Operating Expenses (excluding Acquired Fund Fees and Expenses, dividend
expenses relating to short sales, interest, taxes, expenses related to litigation and potential litigation, extraordinary expenses and
expenses related to the Board of Trustees’ deferred compensation plan) exceed the expense cap of the average daily net assets
through the expense cap expiration date. This contract continues through that date, at which time the Service Providers will determine
whether or not to renew or revise it.
Portfolio statistics
A Shares
C Shares
Select Shares
Inception date
6/30/2006
6/30/2006
4/17/1997
Investment minimum
$1,000
$1,000
$1M
Fund number
1204
1205
1203
CUSIP
4812A3684
4812A3676
4812A0748
RISKS ASSOCIATED WITH INVESTING IN THE FUND:
The Fund's fixed income securities are subject to interest rate risk. If rates increase, the value of the Fund’s investments generally
declines.
International investing involves special risks, including economic, political, and currency instability - especially in emerging
markets. The Fund's investments in emerging markets could lead to more volatility in the value of the Fund's shares. The small size
of securities markets and the low trading volume may lead to a lack of liquidity, which leads to increased volatility. Emerging
markets may not provide adequate legal protection for private or foreign investment or private property.
The Fund will invest at least 80% of its total assets in foreign and emerging markets.
The Fund may invest in securities that are below investment grade (i.e., “high yield” or “junk bonds”) that are generally rated in the
fifth or lower rating categories of Standard & Poor's and Moody's Investors Service. Although these securities tend to provide
higher yields than higher-rated securities, there is a greater risk that the Fund's share price will decline.
The Fund may invest in futures contracts and derivatives. Many derivatives create leverage that can cause the Fund to be more
volatile than it would be if it had not used derivatives.
The Fund may engage in short sales. There is no guarantee that the use of long and short positions will succeed in limiting the
Fund's exposure to domestic stock market movements, capitalization, sector-swings or other risk factors. Investment in a portfolio
involved in long and short selling may have higher portfolio turnover rates. This will likely result in additional tax consequences.
Short selling involves certain risks, including additional costs associated with covering short positions and a possibility of unlimited
loss on certain short sale positions.
The Fund anticipates a very high degree of portfolio turnover. This will likely result in additional tax consequences.


© Copyright 2026