
Effect of multipole excitations in electron energy
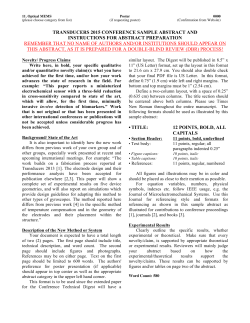
Effect of multipole excitations in electron energy-loss spectroscopy of surface plasmon
modes in silver nanowires
Xiuli Zhou, Anton Hörl, Andreas Trügler, Ulrich Hohenester, Theodore B. Norris, and Andrew A. Herzing
Citation: Journal of Applied Physics 116, 223101 (2014); doi: 10.1063/1.4903535
View online: http://dx.doi.org/10.1063/1.4903535
View Table of Contents: http://scitation.aip.org/content/aip/journal/jap/116/22?ver=pdfcov
Published by the AIP Publishing
Articles you may be interested in
Sub-10 nm patterning of gold nanostructures on silicon-nitride membranes for plasmon mapping with electron
energy-loss spectroscopy
J. Vac. Sci. Technol. B 28, C6O45 (2010); 10.1116/1.3501351
Anisotropic surface plasmon excitation in Au/silica nanowire
Appl. Phys. Lett. 96, 263106 (2010); 10.1063/1.3456529
Surface plasmon excitation of Au and Ag in scanning probe energy loss spectroscopy
Appl. Phys. Lett. 93, 213109 (2008); 10.1063/1.3006435
Optical spectroscopy and energy-filtered transmission electron microscopy of surface plasmons in core-shell
nanoparticles
J. Appl. Phys. 101, 024307 (2007); 10.1063/1.2424404
Measurement of the effective electron mass in GaInNAs by energy-loss spectroscopy
Appl. Phys. Lett. 84, 1453 (2004); 10.1063/1.1650906
[This article is copyrighted as indicated in the article. Reuse of AIP content is subject to the terms at: http://scitation.aip.org/termsconditions. Downloaded to ] IP:
143.50.77.37 On: Tue, 16 Dec 2014 06:31:37
JOURNAL OF APPLIED PHYSICS 116, 223101 (2014)
Effect of multipole excitations in electron energy-loss spectroscopy
of surface plasmon modes in silver nanowires
€rl,2 Andreas Tru
€gler,2 Ulrich Hohenester,2 Theodore B. Norris,1
Xiuli Zhou,1 Anton Ho
and Andrew A. Herzing3,a)
1
Center for Ultrafast Optical Science, University of Michigan, Ann Arbor, Michigan 48109, USA
Institut f€
ur Physk, Karl-Franzens-Universit€
at Graz, 8010 Graz, Austria
3
Material Measurement Laboratory, National Institute of Standards and Technology, Gaithersburg,
Maryland 20899, USA
2
(Received 8 October 2014; accepted 19 November 2014; published online 8 December 2014)
We have characterized the surface plasmon resonance (SPR) in silver nanowires using spatially
resolved electron energy loss spectroscopy (EELS) in the scanning transmission electron
microscope. Non-symmetric EELS spectra due to high-k SPR propagation along the nanowire and
spectral shifts due to higher-order mode excitation are observed when the beam is positioned near
the tip of the nanowire. When the beam is far from the tip region and on the side of nanowire, no
spectral shifts are observed as the beam is scanned in the radial direction of the nanowire. The
experimental spectra are compared with three different theoretical approaches: direct numerical
calculation of the energy loss, analytical models for energy loss, and numerical simulations using
an optical model. All three models reproduce the spectral shifts as the electron beam approaches
the cap of the nanowire. The analytical model reveals the origin of the shifts in high-order plasmon
C 2014 AIP Publishing LLC. [http://dx.doi.org/10.1063/1.4903535]
mode excitation. V
I. INTRODUCTION
The surface plasmon resonance (SPR) modes of metal
nanoparticles (NPs) enable the development of nano-optics
and the manipulation of light at length scales far below the
diffraction limit. In recent years, researchers have developed
an extraordinary degree of control over the propagation of
confined optical modes on the nanoscale in a variety of
metallic systems. The character of SPR modes has been studied for varieties of geometries, including cubes,1 prisms,2
rods, and wires.3–5 Metal nanowires are of particular interest
since they may serve as the building blocks of more complex
plasmonic systems or circuits. Metal nanowires exhibit an
enhanced polarizability compared to more spherical shapes,
and their resonance frequency can be tuned by changing their
length and/or diameter and the composition of the surrounding medium. Some recently published theoretical analysis
and experimental measurements have illustrated their optical
properties and potential applications.6–8
In order to determine their spectral properties or their suitability for various applications, SPR modes are typically
excited optically. In this case, it is difficult to study the spatial
modes in great detail since no optical characterization with
truly single-nanometer spatial resolution exists. However, electron energy loss spectroscopy (EELS) performed in the scanning transmission electron microscope (STEM) is capable of
such resolution. In recent years, EELS has become a powerful
tool to study optical-frequency SPR modes in individual nanostructures as a result of the improved energy resolution enabled
by electron monochromators.4,5,9 In this case, the attainable
energy resolution approaches the width of SPR excitations in
a)
Author to whom correspondence should be addressed. Electronic mail:
[email protected]
0021-8979/2014/116(22)/223101/9/$30.00
noble metals10 and the signal can be acquired with nanometerscale spatial resolution.11
Theoretical and experimental investigations of SPR excitation using EELS have been conducted on a variety of nanostructures, including single NPs of various shapes, nanoparticle
arrays, thin films, and composite metamaterials.10,12–16
Specifically for wire-type structures, Nicoletti et al.17 and
Rossouw et al.18 have both recently utilized EELS to map the
spatial extent of SPR’s in single silver nanorods. They
observed confined modes along the length of the wires as well
as anti-node bunching of high-order resonant modes at the
nanowire ends. They illustrated mode confinement effects and
interpreted their results with the aid of optical excitation calculations, which were found to be in good agreement with
experiment. Rossouw and Botton also analyzed the resonant
modes of bent and kinked silver nanowires for their potential
use in nanophotonic circuits.19 Interestingly, no interruption of
the mode propagation was observed due to the bends and
kinks, such that the optical response was similar to that of a
straight wire.
In this work, we further explore EELS of silver NWs,
presenting new data on the detailed dependence of the spectral response on the electron beam position near the nanowire
surface. We observe an asymmetrical loss spectrum and
spectral shifts in the loss peak that we attribute to high-order
mode excitation. To aid interpretation, we compare the
experimental results with previously published analytical
theories, optical excitation models, and direct calculation of
electron energy loss probability.
II. EXPERIMENTAL SETUP
Silver nanowires were synthesized through CuCl2 mediated polyol reduction.20 5 ml of ethylene glycol (EG) in a
116, 223101-1
C 2014 AIP Publishing LLC
V
[This article is copyrighted as indicated in the article. Reuse of AIP content is subject to the terms at: http://scitation.aip.org/termsconditions. Downloaded to ] IP:
143.50.77.37 On: Tue, 16 Dec 2014 06:31:37
223101-2
Zhou et al.
20 ml disposable glass vial was submerged in an oil bath and
heated to 150 C under magnetic stirring. After 1 h of heating, 40 ml of 4 mM CuCl22H2O in EG was added and the
solution was heated for an additional 15 min. 3 ml of
147 mM polyvinylpyrrolidone (PVP) and 3 ml of 94 mM
AgNO3 solutions in EG were synchronously injected into the
heated EG solution at a constant flow rate of 0.45 ml/min.
Upon the formation of long silver nanowires, an hour from
the injection of PVP and AgNO3, the solution turned opaque
and wispy gray. The silver nanowires were separated from
the EG and PVP by centrifugation at 209 rad/s (2000 RPM)
for 20 min in acetone and re-dispersed in water.
The silver nanowires were dispersed in organic solvents
by replacing the PVP with an alkanethiol.21 Specifically,
1 mg/ml of silver nanowires in ethanol were mixed with
10 mM of 1-undecanethiol (UDT) in chloroform in equal
volume and sonicated for 10 min after which the mixture
was left for 24 h. This allowed for displacement of the PVP
and formation of a UDT self-assembled monolayer on the
nanowires. The silver nanowires were further purified by
centrifugation, supernatant extraction, and re-suspension in
target organic solvents.
In preparation for STEM-EELS analysis, silver nanowires were deposited from solution by drop-casting onto a
thin lacey-carbon film supported on a standard 3 mm copper
mesh grid. EELS spectrum imaging and high-angle annular
dark-field imaging (HAADF) were carried out using an FEI
Titan 80–300 STEM equipped with a double-hexapole spherical aberration corrector on the probe-forming side of the
objective lens and a Wien-filter monochromator.31 The
instrument was operated at an accelerating voltage of 300 kV
using an accelerating gun lens resulting in a final probe current of 100 pA. While the spherical aberration corrector
permits the formation of an electron probe with a diameter
of approximately 0.1 nm, additional source magnification is
incurred due to the dispersive action of the monochromator.
The exact probe shape is difficult to measure and calculate,
but the final probe size is on the order of 0.3 nm.
Spectroscopy was carried out with a Gatan Tridiem 865
imaging energy-filter, with typical acquisition times of
100 ms per spectrum, using a convergence angle of 13 mrads
and a collection angle of 13 mrads. The energy dispersion
was set to 0.01 eV/channel. To provide a measure of the
energy-resolution of the system under these conditions, the
full-width half maximum and full-width tenth maximum of
the zero-loss peak were measured and found to be 0.2 eV and
0.5 eV, respectively. Spectra were aligned in the energy
dimension using Matlab code to set the channel with maximum intensity to zero energy-loss. While it was impossible
to analyze free-standing NWs, in order to minimize substrate
effects, care was taken to analyze only the ends of those
NWs that extended far from the underlying amorphous carbon support. STEM-HAADF images were collected both
before and after EELS acquisition. Images collected prior to
analysis showed that the nanowires exhibited clean surfaces,
with no evidence of oxide or carbonaceous surface layers
present. However, the presence of ultrathin layers of this
kind cannot be entirely ruled out. Images collected after
analysis showed that some hydrocarbon deposition did occur
J. Appl. Phys. 116, 223101 (2014)
during the analysis. No other evidence of specimen alteration
was observed.
In order to study the plasmon modes in detail, we
performed EELS of individual silver nanowires. In the first
set of experiments, we acquired EELS spectra at a series of
electron beam positions relative to the nanowire. All spectra
are presented as they were acquired, without applying background subtraction or deconvolution. We investigated the
dependence of the spectral response on the distance of the
beam from the nanowire tip and the distance from the side of
the nanowire in a region that was far from the tip. The spectral response was also measured at a fixed distance from the
side of the wire as a function of distance from the wire’s tip.
This measurement was complemented by hyperspectral
EELS imaging of the entire region of the nanowire within
several hundred nanometers of the tip.
III. RESULTS
EELS spectra collected as a function of beam distance
from the tip of the nanowire are shown in Fig. 1(a). The inset
shows the experimental setup, where spectra were acquired
every nanometer along a 50 nm line (indicated in orange).
The acquisition began with the beam positioned inside of the
wire and then moving away from it into the surrounding vacuum. A 2-D plot of the spectral response vs. beam position is
given in Fig. 1(a), with the white dashed line indicating the
interface between the tip of the nanowire and vacuum. A
similar set of data was acquired for beam positions scanned
perpendicular to the side of the nanowire, and this is shown
in Fig. 1(b). Spectra extracted at various intervals along the
line of acquisition are presented in Figs. 1(c) and 1(d). In all
cases, a strong loss peak due to SPR has been excited near
3.6 eV. The SPR excitation efficiency drops off exponentially as the beam moves away from the wire, corresponding
to the confinement of the SPR mode to the metal surface, as
has been established by a number of recent studies.4,18,22,23
When the beam is positioned near the tip of the nanowire,
the SPR peak is highly asymmetric and broad. In addition,
the peak was observed to continuously shift from 3.5 eV
when the beam was near the metal-vacuum interface to
3.3 eV when the beam was 25 nm away as indicated by the
dashed black line in Fig. 1(c). By contrast, as shown in Figs.
1(b) and 1(d), the spectral peak in the transverse case was
relatively narrow and was positioned at 3.6 eV regardless of
beam position.
SPR propagation along the side of the nanowire was
also investigated by positioning the beam at the positions
indicated in the STEM image shown in Figure 2(a). The corresponding EELS spectra for each of these positions contain
a strong peak at 3.6 eV, as well as a series of peaks at lower
energy-loss (indicated by arrows). These lower energy-loss
peaks are due to the excitation of Fabry-Perot modes along
the wire due to its finite length.17,18 Moreover, it is shown
that the strongest silver SPR peak occurs at 3.6 eV when
the beam is positioned along the side of the wire, but that the
peak shifts to 3.5 eV when the beam is moved to the tip of
the nanowire. This observed difference in the energy-loss
position is consistent with the previously presented spectra.
[This article is copyrighted as indicated in the article. Reuse of AIP content is subject to the terms at: http://scitation.aip.org/termsconditions. Downloaded to ] IP:
143.50.77.37 On: Tue, 16 Dec 2014 06:31:37
223101-3
Zhou et al.
J. Appl. Phys. 116, 223101 (2014)
FIG. 1. Experimental EELS spectra collected near the end of a 100 nm diameter silver nanowire with the beam traveling in (a) the longitudinal direction and
(b) the transverse direction. The inset STEM-HAADF images show the region analyzed. Data were collected serially in 1 nm increments in the direction indicated by the orange arrow. The white dashed line overlaid in the EELS data represents the interface between the silver nanowire and vacuum which is set as
the origin of the abscissa. Also shown are EELS spectra as a function of distance from the nanowire surface along the (c) longitudinal direction and (d) the
transverse direction.
Figs. 2(b) and 2(c) show another STEM-HAADF image
of the nanowire and the corresponding spectra obtained
along the wire surface at the indicated positions. In this case,
the Fabry-Perot modes are again observed at low energy-loss
in addition to a pair of stronger peaks positioned at 3.5 eV
and 3.75 eV. As discussed previously, the former peak is due
to the delocalized SPR at the wire-vacuum boundary, while
the latter is due to the bulk plasmon loss as the beam passes
through the wire itself.4,24,25
The spatial distribution of the low-energy modes was
observed by extracting images from an EELS spectrum
image at varying energy-loss values, and a subset of the data
is shown in Fig. 3(a). As observed in the previous studies,17–19 the propagating modes along the length of the wire
become standing waves in a finite system due to boundary
confinement resulting in the Fabry-Perot type resonances.
These images can be compared to simulated electric field
distributions obtained by finite-difference time-domain
(FDTD) simulations of the optical response of the nanowire
(Fig. 3(b)) and the results are qualitatively quite similar. By
measuring the spatial separation between the peaks of each
SPR mode in Figs. 3(a) and 3(b), the dispersion relations are
obtained and plotted in Fig. 3(c). The values of k (in nm1)
are measured from the experimental EELS series in Fig. 3(a)
and the simulated series in Fig. 3(b). k is given by
k¼
2p
;
ksp
where ksp is the wavelength between two resonance peaks.
For a given resonance mode, the spacing between adjacent
maxima of intensity varies slightly along the silver nanowire,
so that the k does not have a unique value. The theoretical dispersions from a model neglecting retardation and substrate
[This article is copyrighted as indicated in the article. Reuse of AIP content is subject to the terms at: http://scitation.aip.org/termsconditions. Downloaded to ] IP:
143.50.77.37 On: Tue, 16 Dec 2014 06:31:37
223101-4
Zhou et al.
J. Appl. Phys. 116, 223101 (2014)
FIG. 2. (a) STEM-HAADF image of 100 nm diameter silver nanowire and corresponding EELS spectra extracted from the numbered locations. The strongest
SPR peaks are at 3.5 eV to 3.6 eV, while the black arrows highlight the Fabry-Perot resonances observed at lower energy-loss, the position of which
depends strongly on distance from the nanowire tip. (b) STEM-HAADF image of a silver nanowire and a zoomed image of the region analyzed by EELS. (c)
Corresponding EELS spectra extracted from the seven numbered positions denoted in (c).
FIG. 3. (a) Images extracted from a EELS hyperspectral dataset acquired from near the end of a 100 nm diameter. The images show the spatially resolved
EELS response at various energy-loss values and depict the standing wave pattern in the nanowire resulting from surface plasmon resonances. (b) Simulated
electric field distributions resulting from optical excitation of a model silver nanowire. The intensity has been scaled independently for all of the images in. (c)
Experimental and calculated dispersion relations as a function of wavenumber k, where k ¼ 2p/ksp and ksp /2 is the half wavelength measured between two
resonance peaks. Note that the k values are not uniquely defined but have an error range, as the EELS signal is not perfectly periodic.
[This article is copyrighted as indicated in the article. Reuse of AIP content is subject to the terms at: http://scitation.aip.org/termsconditions. Downloaded to ] IP:
143.50.77.37 On: Tue, 16 Dec 2014 06:31:37
223101-5
Zhou et al.
effects are also shown; clearly, a small systematic shift is
observed between the model and experimental dispersions,
which may be due to limiting assumptions of the model as
well as effects due to shape, size, and composition.19
IV. DISCUSSION
To investigate the features observed in the collected
spectra and the relation between the optical and energy loss
responses, we first performed EELS simulations using the
MNPBEM toolbox.26 The nanowire was modeled as a 1 lm
long cylindrical wire with spherical caps at both ends; the
wire diameter was set to 100 nm. Values for the silver permittivity were extracted from optical experiments,27 and the
EELS maps and spectra were computed according to the protocol given previously.28,29
In Figure 4, the calculated EELS response is shown as
a function of distance from the nanowire when the beam is
moving in the longitudinal and transverse directions (Figs.
4(a) and 4(b), respectively). The interface between the
nanowire and vacuum is again denoted by the white dashed
lines. The corresponding spectra for selected impact parameters are also shown in Figs. 4(c) and 4(d). In both cases, a
J. Appl. Phys. 116, 223101 (2014)
number of peaks associated with Fabry-Perot resonances
are observed at lower loss energies (<3 eV), which then
merge into a continuum of states around 3.60 eV. Also, in
both sets of simulations, a peak is observed at 3.75 eV when
the beam is positioned inside the nanowire, which corresponds to excitation of the bulk plasmon for silver. If only
the asymptotic SPR peak near 3.60 eV is considered, a
higher degree of dispersion was observed in the longitudinal case than in the transversal. This can be seen in the
insets of Figs. 4(c) and 4(b), which enlarge this spectral
region near the wire surface, as well as in Fig. 4(c) where
the peak near 3.6 eV shifts to lower energies when the electron beam moves away from the nanowire. In contrast, the
asymptotic peak in the inset of Fig. 4(b) and in Fig. 4(d)
shows almost no dispersion whatsoever. Therefore, the experimental and theoretical results show very nice agreement, especially in the asymptotic regime.
However, there are some interesting differences between
the acquired spectra and the calculated EELS response. First,
in the experimental EELS data, the Fabry-Perot modes are
much less distinct than the EELS calculations suggest. This
is likely due to the finite energy resolution of the experimental data. Indeed, when the simulated spectra are convolved
FIG. 4. Simulation results for a cylindrical nanowire of 1 lm length and 100 nm diameter, using the MNPBEM toolbox.27 Density plot for electron energy loss
maps as a function of loss energy and impact parameter along the (a) longitudinal and (b) transversal directions. The insets show a magnified view of the asymptotic regime, marked by the white box. The nanowire boundary at 0 nm is shown by the dashed line. (c) and (d) Corresponding spectra for selected impact
parameters.
[This article is copyrighted as indicated in the article. Reuse of AIP content is subject to the terms at: http://scitation.aip.org/termsconditions. Downloaded to ] IP:
143.50.77.37 On: Tue, 16 Dec 2014 06:31:37
223101-6
Zhou et al.
with a Gaussian function with FWHM ¼ 0.3 eV (shown in
Fig. 5), the pronounced peak structure is almost completely
indiscernible and the simulated spectra more closely match
those acquired experimentally (Figs. 1(b) and 1(d)) quite
well. Therefore, the modeled spectra indicate that the origin
of the observed spectral asymmetry arises from the contributions of the high-k longitudinal modes on the low energy
side of the SPR peak. Another discrepancy is that the bulk
peak is less intense in the experimental data and optical excitation calculation than in the EELS simulations. A quantitative explanation of this requires further work but is possible
that this effect is due to the attenuation of the electron beam
within the metal nanowire, which is not accounted for in the
EELS calculations.
While the EELS spectra calculated using the MNPBEM
toolbox nicely replicated the spectral shift behavior observed
in our experiments, they did not indicate what the origin of
this behavior could be. In order to obtain physical insight
into the observed plasmonic modes and the relation between
the nanoscale optical and EELS responses, we then carried
out detailed simulations using energy loss theories and optical models. A theoretical description of the collective electronic excitations at metal surfaces has been presented by
Pitarke et al.,25 who predicted that a number of multipolar
modes can be excited and contribute to the energy loss of
moving electrons. To approximate the nanowires that were
examined experimentally, we have considered two distinct
geometries. First, a semi-spherical model was used to approximate the tip of the nanowire, although it is apparent
from the image in Fig. 1 that the true tip geometry deviates
from this simplified geometry. To compare the analytical
theory of energy loss with the optical response of this silver
nanosphere, we performed numerical simulations using the
FDTD Lumerical package, assuming excitation by an optical
dipole source at different positions to mimic the electron
beam positions. The frequency dependent dielectric function
of silver was taken from previously reported optical data.30
Figure 6(a) presents a schematic of the silver nanosphere model used to approximate the nanowire tip. The
J. Appl. Phys. 116, 223101 (2014)
red line in Fig. 6(a) depicts the electron beam traveling at a
particular distance, b, from the center of the silver nanosphere. Fig. 6(b) shows the calculated FDTD normalized
power flow distribution as a function of distance from a silver nanosphere with diameter of 100 nm. The origin of the
x-axis is set in the nanosphere, and the white dashed line at
x ¼ 0 denotes the interface between the sphere’s surface
and vacuum. When the beam is positioned within the
sphere, the resonance peak is observed at 3.7 eV, which
corresponds to the bulk plasmon energy. This peak is stable
as the beam moves towards the surface of the sphere.
However, when it reaches the interface and progresses
away from the sphere, the resonance peak steadily shifts
towards 3.5 eV. The inset in Fig. 6(b) presents the electric
field power flow distribution in the region near the nanowire tip. The black dashed curve with arrow indicates the
resonance peak position as the beam moves away from the
tip. The spectral shift observed in this simulation agrees
quite well with that observed in the experimental EELS
data (Figs. 1(a) and 1(c)).
To investigate the origin of this shift, the electron
energy-loss probability was also calculated analytically for
the spherical model.25 Fig. 6(c) shows the results of this
calculation for several SPR resonance modes: the dipole
mode (mode index ‘ ¼ 1), quadrupole mode (‘ ¼ 2), octupole mode (‘ ¼ 4), and hexadecapole mode (‘ ¼ 8). In this
case, the resonance peaks are seen to shift from 3.50 eV for
‘ ¼ 1 to 3.66 eV for ‘ ¼ 8. In addition, the higher order
modes are noticeably more localized at the surface of the
sphere than the lower order modes which extend much further into vacuum. Since the tip of the nanowire analyzed
using EELS can be considered pseudo-spherical, these analytical computations suggest that the spectral shift observed
in the experimental data (Figs. 1(a) and 1(c)) arises due to
the differences in energy-loss probabilities between the
lower- and higher-order modes. When the beam is positioned near the nanowire surface, the more localized,
higher-order modes contribute more significantly. As the
beam moves away from the surface, the energy-loss is
FIG. 5. Simulated spectra from the (a) longitudinal and (b) transversal directions after convolution with a Gaussian function (FWHM ¼ 0.3 eV).
[This article is copyrighted as indicated in the article. Reuse of AIP content is subject to the terms at: http://scitation.aip.org/termsconditions. Downloaded to ] IP:
143.50.77.37 On: Tue, 16 Dec 2014 06:31:37
223101-7
Zhou et al.
J. Appl. Phys. 116, 223101 (2014)
FIG. 6. Results of analytical energy loss and optical simulations for an ideal silver nanosphere. (a) Schematics of the surface charge densities induced by an
electron beam (denoted by the red line) placed (a-1) close to the surface of the sphere and (a-2) far away from the surface of the sphere. (b) FDTD simulated
power flow intensity distributions as a function of distance from the surface of an ideal silver nanosphere under optical excitation. The position of the surface
is indicated by the white dashed line at 0 nm. (c) Analytically computed electron energy loss probabilities from the silver nanosphere for various resonance
modes (mode index ‘ ¼ 1, 2, 4, and 8). Due to the strong variation in maximum energy-loss intensity and for better visibility, the color scale has been scaled independently for all of the images.
dominated by the more delocalized dipole mode resulting
in a shift of the observed resonance peak to lower energyloss. As discussed by Pitarke et al.25 and shown schematically in Fig. 6(a-1), multipolar resonances are readily
excited when the beam is near the edge of the sphere since
it effectively interacts with a nearly planar surface. In contrast, the dipole resonance will be dominant when the beam
is far from the surface of the nanosphere and the impact parameter is large (Fig. 6(b-2)).
To model the EELS response when the beam was positioned along the side of the nanowire, we have performed
similar calculations using an infinitely long cylinder geometry.25 Figure 7(a) shows a schematic of this case where the
solid red line represents the electron beam trajectory and the
dashed red line indicates its distance, b, from the center of
the cylinder. Fig. 7(b) shows the FDTD calculated normalized power flow distribution as a function of radial distance.
In contrast to the case of the spherical model, in this case,
the power flow shows a single peak at 3.6 eV that does not
shift as the beam moves away from the cylinder. The inset in
Fig. 7(b) depicts the power flow distribution from the region
near the edge of the cylinder, and the dashed black line
shows a consistent resonance peak that does not shift with
excitation position. The observed insensitivity of the peak
energy-loss with beam position differs markedly from the
calculations for the spherical model but agrees quite well
with the experimental EELS data.
Once again, to investigate the origin of these observations, the analytical energy loss probabilities for the various
modes (‘ ¼ 1–8) were calculated, and the results are presented in Figure 7(c). For all four modes, peaks are observed
at 3.65 eV and 3.3 eV, which are confined near the interface region. For the dipole mode (‘ ¼ 1) ,these two peaks exhibit very similar amplitudes. However, as ‘ increases, the
higher energy-loss peak becomes progressively more intense
relative to the lower energy-loss peak. These results fit quite
well with the peak shapes and intensities observed in the experimental EELS spectra collected along the side of the
nanowire (Figs. 1(d) and 2(c)), suggesting that the multipolar
resonances dominate the SPR response in this case. Finally,
despite the differences in amplitude, the peak positions for
all four modes do not change as a function of distance from
the nanowire surface. This is markedly different from the
calculations already discussed for the spherical model but
matches the behavior observed in the experimental EELS
spectra acquired in the transverse orientation. Therefore, the
characteristics of the SPR peak in the two experimental cases
we have investigated can be explained by the spatial dependence of the energy-loss probabilities of the various modes
excited by the electron beam.
[This article is copyrighted as indicated in the article. Reuse of AIP content is subject to the terms at: http://scitation.aip.org/termsconditions. Downloaded to ] IP:
143.50.77.37 On: Tue, 16 Dec 2014 06:31:37
223101-8
Zhou et al.
J. Appl. Phys. 116, 223101 (2014)
FIG. 7. Results of analytical energy loss and optical simulations for an ideal 100 nm diameter silver nanocylinder. (a) Schematic showing the 100 nm diameter
cylinder lying in the (x,y) plane with the electron beam (solid red line) positioned parallel to the z-axis. The dashed red line indicates the distance from the
beam to the center of the cylinder. (b) FDTD simulated power flow intensity distributions as a function of distance from surface of the silver nanocylinder
under optical excitation. The cylinder surface is indicated by the white dashed line at 0 nm. (c) Analytically computed electron energy loss probabilities from
the silver nanocylinder for various resonance modes (mode index ‘ ¼ 1, 2, 4, and 8). Due to the strong variation in maximum energy-loss intensity and for better visibility, the color scale has been scaled independently for all of the images.
V. CONCLUSIONS
ACKNOWLEDGMENTS
We have explored the detailed spatial dependence of the
electron energy loss at optical frequencies when the electron
beam is directed near the surface of silver nanowires. Due to
the pseudospherical shape of nanowire tip, the detailed loss
spectrum near this region depends strongly on the position of
the electron beam. Far from the tip, the spectral response is
dominated by the dipolar excitation, as predicted theoretically for a spherical geometry. As the beam approaches the
tip, the surface of the wire becomes effectively planar, resulting in the excitation of higher-order modes and a shift of the
resonance peak towards higher energies. The spectral
response was simulated in three ways: (1) using previously
published analytical models of energy loss for ideal spheres
and infinite wires, (2) by calculating the optical response
with dipole optical field excitation, and (3) by simulating the
EELS maps using a boundary element method. With the aid
of these calculations, it was shown that the spatial variations
of the loss peak in the experimental spectra were due to excitation of the more localized higher-order modes when the
beam is very close to the nanowire surface. For detailed calculation of the loss spectra and the spatial response profiles,
both numerical optical excitation and energy loss simulations
showed good agreement with the experimental results. These
experiments and calculations demonstrate that the energy
loss and optical spectra provide complementary insight into
the plasmonic modes of metallic nanostructures.
This work was supported by the Center for Photonic and
Multiscale Nanomaterials (C-PHOM) funded by the
National Science Foundation Materials Research Science
and Engineering Center program DMR 1120923.
This material is also based upon work partially
supported by the Center for Solar and Thermal Energy
Conversion, an Energy Frontier Research Center funded by
the U.S. Department of Energy, Office of Science, Office of
Basic Energy Sciences under Award No. #DE-SC0000957
used to purchase materials for NP and nanowire synthesis.
The portion of the work at Karl-Franzens-Universit€at
Graz has been supported by the Austrian Science Fund FWF
under Project P24511-N26 and the SFB NextLite.
1
Y. G. Sun and Y. N. Xia, Science 298(5601), 2176–2179 (2002).
I. Washio, Y. J. Xiong, Y. D. Yin, and Y. N. Xia, Adv. Mater. 18(13),
1745–1749 (2006).
3
T. K. Sau and C. J. Murphy, Langmuir 20, 6414 (2004).
4
M. N’Gom, J. Ringnalda, J. F. Mansfield, A. Agarwal, N. Kotov, N. J.
Zaluzec, and T. B. Norris, Nano Lett. 8, 3200 (2008).
5
M. N’Gom, T. B. Norris, and R. Erni, in Conference on Lasers and
Electro-Optics and 2009 Conference on Quantum Electronics and Laser
Science Conference, Baltimore, MD, USA, 31 May–5 June 2009 (IEEE,
New York, 2009), pp. 3228–3229.
6
L. Novotny, Phys. Rev. Lett. 98, 266802 (2007).
7
E. R. Encina, E. A. Perassi, and E. A. Coronado, J. Phys. Chem. A 113,
4489 (2009).
8
E. J. R. Vesseur, R. de Waele, M. Kuttge, and A. Polman, Nano Lett. 7,
2843 (2007).
2
[This article is copyrighted as indicated in the article. Reuse of AIP content is subject to the terms at: http://scitation.aip.org/termsconditions. Downloaded to ] IP:
143.50.77.37 On: Tue, 16 Dec 2014 06:31:37
223101-9
Zhou et al.
J. Appl. Phys. 116, 223101 (2014)
9
21
10
22
F. J. Garcia de Abajo and M. Kociak, Phys. Rev. Lett. 100, 106804 (2008).
J. Nelayah, M. Kociak, O. Stephan, F. J. G. de Abajo, M. Tence, L.
Henrard, D. Taverna, I. Pastoriza-Santos, L. M. Liz-Marzan, and C.
Colliex, Nat. Phys. 3, 348 (2007).
11
P. E. Batson, N. Dellby, and O. L. Krivanek, Nature 418, 617 (2002).
12
P. M. Echenique and J. B. Pendry, J. Phys. C: Solid State Phys. 11, 2065
(1978).
13
M. V. Bashevoy, F. Jonsson, A. V. Krasavin, N. I. Zheludev, Y. Chen, and
M. I. Stockman, Nano Lett. 6, 1113 (2006).
14
R. H. Ritchie, Surf. Sci. 34, 1 (1973).
15
M. Rocca, Surf. Sci. Rep. 22, 1 (1995).
16
T. L. Ferrell and P. M. Echenique, Phys. Rev. Lett. 55, 1526 (1985).
17
O. Nicoletti, M. Wubs, N. A. Mortensen, W. Sigle, P. A. van Aken, and P.
A. Midgley, Opt. Express 19, 15371 (2011).
18
D. Rossouw, M. Couillard, J. Vickery, E. Kumacheva, and G. A. Botton,
Nano Lett. 11, 1499 (2011).
19
D. Rossouw and G. A. Botton, Phys. Rev. Lett. 110, 066801 (2013).
20
K. E. Korte, S. E. Skrabalak, and Y. N. Xia, J. Mater. Chem. 18, 437
(2008).
P. Andrew and A. Ilie, J. Phys.: Conf. Ser. 61, 36 (2007).
C. J. Rossouw, L. J. Allen, S. D. Findlay, and M. P. Oxley,
Ultramicroscopy 96, 299 (2003).
23
A. L. Koh, D. W. McComb, S. A. Maier, H. Y. Low, and J. K. W. Yang,
J. Vac. Sci. Technol., B 28, C6O45 (2010).
24
R. H. Ritchie, Phys. Rev. 106, 874 (1957).
25
J. M. Pitarke, V. M. Silkin, E. V. Chulkov, and P. M. Echenique, Rep.
Prog. Phys. 70, 1 (2007).
26
U. Hohenester and A. Trugler, Comput. Phys. Commun. 183, 370 (2012).
27
E. D. Palik, Handbook of Optical Constants of Solids (Academic, Orlando,
1985).
28
U. Hohenester, Comput. Phys. Commun. 185, 1177 (2014).
29
F. J. Garcia de Abajo, Rev. Mod. Phys. 82, 209 (2010).
30
P. B. Johnson and R. W. Christy, Phys. Rev. B 6, 4370 (1972).
31
Commercial equipment, instruments, and materials or software is identified in this report to specify adequately the experimental procedure. Such
identification does not imply recommendation or endorsement of these
items by the NIST nor does it imply that they are the best available for the
purpose.
[This article is copyrighted as indicated in the article. Reuse of AIP content is subject to the terms at: http://scitation.aip.org/termsconditions. Downloaded to ] IP:
143.50.77.37 On: Tue, 16 Dec 2014 06:31:37


© Copyright 2026