
MicroStrategy Office User Guide
MicroStrategy Office User Guide Analytics Enterprise Document Number: 09290941 Fifteenth Edition, Analytics Enterprise To ensure that you are using the documentation that corresponds to the software you are licensed to use, compare this version number with the software version shown in “About MicroStrategy...” in the Help of your software. Document number: 09290941 Copyright © 2013 by MicroStrategy Incorporated. All rights reserved. If you have not executed a written or electronic agreement with MicroStrategy or any authorized MicroStrategy distributor, the following terms apply: This software and documentation are the proprietary and confidential information of MicroStrategy Incorporated and may not be provided to any other person. Copyright © 2001-2013 by MicroStrategy Incorporated. All rights reserved. THIS SOFTWARE AND DOCUMENTATION ARE PROVIDED “AS IS” AND WITHOUT EXPRESS OR LIMITED WARRANTY OF ANY KIND BY EITHER MICROSTRATEGY INCORPORATED OR ANYONE WHO HAS BEEN INVOLVED IN THE CREATION, PRODUCTION, OR DISTRIBUTION OF THE SOFTWARE OR DOCUMENTATION, INCLUDING, BUT NOT LIMITED TO, THE IMPLIED WARRANTIES OF MERCHANTABILITY AND FITNESS FOR A PARTICULAR PURPOSE, GOOD TITLE AND NONINFRINGMENT, QUALITY OR ACCURACY. THE ENTIRE RISK AS TO THE QUALITY AND PERFORMANCE OF THE SOFTWARE AND DOCUMENTATION IS WITH YOU. SHOULD THE SOFTWARE OR DOCUMENTATION PROVE DEFECTIVE, YOU (AND NOT MICROSTRATEGY, INC. OR ANYONE ELSE WHO HAS BEEN INVOLVED WITH THE CREATION, PRODUCTION, OR DISTRIBUTION OF THE SOFTWARE OR DOCUMENTATION) ASSUME THE ENTIRE COST OF ALL NECESSARY SERVICING, REPAIR, OR CORRECTION. SOME STATES DO NOT ALLOW THE EXCLUSION OF IMPLIED WARRANTIES, SO THE ABOVE EXCLUSION MAY NOT APPLY TO YOU. In no event will MicroStrategy, Inc. or any other person involved with the creation, production, or distribution of the Software be liable to you on account of any claim for damage, including any lost profits, lost savings, or other special, incidental, consequential, or exemplary damages, including but not limited to any damages assessed against or paid by you to any third party, arising from the use, inability to use, quality, or performance of such Software and Documentation, even if MicroStrategy, Inc. or any such other person or entity has been advised of the possibility of such damages, or for the claim by any other party. In addition, MicroStrategy, Inc. or any other person involved in the creation, production, or distribution of the Software shall not be liable for any claim by you or any other party for damages arising from the use, inability to use, quality, or performance of such Software and Documentation, based upon principles of contract warranty, negligence, strict liability for the negligence of indemnity or contribution, the failure of any remedy to achieve its essential purpose, or otherwise. The entire liability of MicroStrategy, Inc. and your exclusive remedy shall not exceed, at the option of MicroStrategy, Inc., either a full refund of the price paid, or replacement of the Software. No oral or written information given out expands the liability of MicroStrategy, Inc. beyond that specified in the above limitation of liability. Some states do not allow the limitation or exclusion of liability for incidental or consequential damages, so the above limitation may not apply to you. The information contained in this manual (the Documentation) and the Software are copyrighted and all rights are reserved by MicroStrategy, Inc. MicroStrategy, Inc. reserves the right to make periodic modifications to the Software or the Documentation without obligation to notify any person or entity of such revision. Copying, duplicating, selling, or otherwise distributing any part of the Software or Documentation without prior written consent of an authorized representative of MicroStrategy, Inc. are prohibited. U.S. Government Restricted Rights. It is acknowledged that the Software and Documentation were developed at private expense, that no part is public domain, and that the Software and Documentation are Commercial Computer Software provided with RESTRICTED RIGHTS under Federal Acquisition Regulations and agency supplements to them. Use, duplication, or disclosure by the U.S. Government is subject to restrictions as set forth in subparagraph (c)(1)(ii) of the Rights in Technical Data and Computer Software clause at DFAR 252.227-7013 et. seq. or subparagraphs (c)(1) and (2) of the Commercial Computer Software—Restricted Rights at FAR 52.227-19, as applicable. Contractor is MicroStrategy, Inc., 1850 Towers Crescent Plaza, Tysons Corner, VA 22182. Rights are reserved under copyright laws of the United States with respect to unpublished portions of the Software. The following are either trademarks or registered trademarks of MicroStrategy Incorporated in the United States and certain other countries: MicroStrategy, MicroStrategy 6, MicroStrategy 7, MicroStrategy 7i, MicroStrategy 7i Evaluation Edition, MicroStrategy 7i Olap Services, MicroStrategy 8, MicroStrategy 9, MicroStrategy Distribution Services, MicroStrategy MultiSource Option, MicroStrategy Command Manager, MicroStrategy Enterprise Manager, MicroStrategy Object Manager, MicroStrategy Reporting Suite, MicroStrategy Power User, MicroStrategy Analyst, MicroStrategy Consumer, MicroStrategy Email Delivery, MicroStrategy BI Author, MicroStrategy BI Modeler, MicroStrategy Evaluation Edition, MicroStrategy Administrator, MicroStrategy Agent, MicroStrategy Architect, MicroStrategy BI Developer Kit, MicroStrategy Broadcast Server, MicroStrategy Broadcaster, MicroStrategy Broadcaster Server, MicroStrategy Business Intelligence Platform, MicroStrategy Consulting, MicroStrategy CRM Applications, MicroStrategy Customer Analyzer, MicroStrategy Desktop, MicroStrategy Desktop Analyst, MicroStrategy Desktop Designer, MicroStrategy eCRM 7, MicroStrategy Education, MicroStrategy eTrainer, MicroStrategy Executive, MicroStrategy Infocenter, MicroStrategy Intelligence Server, MicroStrategy Intelligence Server Universal Edition, MicroStrategy MDX Adapter, MicroStrategy Narrowcast Server, MicroStrategy Objects, MicroStrategy OLAP Provider, MicroStrategy SDK, MicroStrategy Support, MicroStrategy Telecaster, MicroStrategy Transactor, MicroStrategy Web, MicroStrategy Web Business Analyzer, MicroStrategy World, Application Development and Sophisticated Analysis, Best In Business Intelligence, Centralized Application Management, Information Like Water, Intelligence Through Every Phone, Intelligence To Every Decision Maker, Intelligent E-Business, Personalized Intelligence Portal, Query Tone, Rapid Application Development, MicroStrategy Intelligent Cubes, The Foundation For Intelligent E-Business, The Integrated Business Intelligence Platform Built For The Enterprise, The Platform For Intelligent E-Business, The Scalable Business Intelligence Platform Built For The Internet, Office Intelligence, MicroStrategy Office, MicroStrategy Report Services, MicroStrategy Web MMT, MicroStrategy Web Services, Pixel Perfect, Pixel-Perfect, MicroStrategy Mobile, MicroStrategy Integrity Manager and MicroStrategy Data Mining Services are all registered trademarks or trademarks of MicroStrategy Incorporated. All other company and product names may be trademarks of the respective companies with which they are associated. Specifications subject to change without notice. MicroStrategy is not responsible for errors or omissions. MicroStrategy makes no warranties or commitments concerning the availability of future products or versions that may be planned or under development. Patent Information This product is patented. One or more of the following patents may apply to the product sold herein: U.S. Patent Nos. 6,154,766, 6,173,310, 6,260,050, 6,263,051, 6,269,393, 6,279,033, 6,400,265, 6,567,796, 6,587,547, 6,606,596, 6,658,093, 6,658,432, 6,661,340, 6,662,195, 6,671,715, 6,691,100, 6,694,316, 6,697,808, 6,704,723, 6,741,980, 6,765,997, 6,768,788, 6,772,137, 6,788,768, 6,798,867, 6,801,910, 6,820,073, 6,829,334, 6,836,537, 6,850,603, 6,859,798, 6,873,693, 6,885,734, 6,940,953, 6,964,012, 6,977,992, 6,996,568, 6,996,569, 7,003,512, 7,010,518, 7,016,480, 7,020,251, 7,039,165, 7,082,422, 7,113,993, 7,127,403, 7,174,349, 7,181,417, 7,194,457, 7,197,461, 7,228,303, 7,260,577, 7,266,181, 7,272,212, 7,302,639, 7,324,942, 7,330,847, 7,340,040, 7,356,758, 7,356,840, 7,415,438, 7,428,302, 7,430,562, 7,440,898, 7,486,780, 7,509,671, 7,516,181, 7,559,048, 7,574,376, 7,617,201, 7,725,811, 7,801,967, 7,836,178, 7,861,161, 7,861,253, 7,881,443, 7,925,616, 7,945,584, 7,970,782, 8,005,870, 8,051,168, 8,051,369, 8,094,788, 8,130,918, 8,296,287, 8,321,411, 8,452,755, 8,521,733, and 8,522,192. Other patent applications are pending. Various MicroStrategy products contain the copyrighted technology of third parties. This product may contain one or more of the following copyrighted technologies: Graph Generation Engine Copyright © 1998-2013. Three D Graphics, Inc. All rights reserved. Actuate® Formula One. Copyright © 1993-2013 Actuate Corporation. All rights reserved. XML parser Copyright © 2003-2013 Microsoft Corporation. All rights reserved. Xalan XSLT processor. Copyright © 1999-2013. The Apache Software Foundation. All rights reserved. Xerces XML parser. Copyright © 1999-2013. The Apache Software Foundation. All rights reserved. FOP XSL formatting objects. Copyright © 2004-2013. The Apache Software Foundation. All rights reserved. Portions of Intelligence Server memory management Copyright © 1991-2013 Compuware Corporation. All rights reserved. ASIHTTPRequest library. Copyright © 2007-2013, All-Seeing Interactive. All rights reserved. This product includes software developed by the OpenSSL Project for use in the OpenSSL Toolkit. (http://www.openssl.org/) International Components for Unicode Copyright © 1999-2013 Compaq Computer Corporation Copyright © 1999-2013 Hewlett-Packard Company Copyright © 1999-2013 IBM Corporation Copyright © 1999-2013 Hummingbird Communications Ltd. Copyright © 1999-2013 Silicon Graphics, Inc. Copyright © 1999-2013 Sun Microsystems, Inc. Copyright © 1999-2013 The Open Group All rights reserved. Real Player and RealJukebox are included under license from Real Networks, Inc. Copyright © 1999-2013. All rights reserved. CONTENTS Guide Overview and Additional Resources Description of Guide ................................................................ xiii About this book .............................................................................xv Additional formats .................................................................. xvi How to find business scenarios and examples ...................... xvi What’s new in this guide ....................................................... xvii Prerequisites ......................................................................... xvii Who should use this guide................................................... xviii Resources.................................................................................... xix Documentation....................................................................... xix Education ............................................................................xxviii Consulting ...........................................................................xxviii International support ...........................................................xxviii Technical Support ................................................................ xxix Feedback ................................................................................. xxxiv 1. Getting Started with MicroStrategy Office Introduction.................................................................................. 1 Prerequisites.................................................................................. 2 About MicroStrategy Office............................................................ 2 How MicroStrategy Office provides access to business data .......................................................................................... 3 Examples of tasks performed with MicroStrategy Office ......... 4 Before you use MicroStrategy Office ............................................. 6 Confirming installation or installing MicroStrategy Office......... 6 Logging in and accessing reports in a project ............................. 11 Logging in and accessing reports in a project........................ 13 Accessing reports in multiple projects.................................... 17 © 2013 MicroStrategy, Inc. v Contents MicroStrategy Office User Guide Disconnecting from projects................................................... 18 Changing your password ....................................................... 19 Exploring MicroStrategy Office .................................................... 20 Modifying the behavior and layout of MicroStrategy Office.... 21 Searching for MicroStrategy objects ...................................... 23 Running reports and viewing details............................................ 25 Determining how reports are run: Preferences ...................... 25 Running a report or document in a Microsoft product............ 26 Answering prompted reports/documents ............................... 28 Storing reports and viewing stored reports: History List ........ 31 Publishing Intelligent Cubes using MicroStrategy Office ....... 34 Viewing details about reports after they have been executed ................................................................................ 35 Refreshing reports to retrieve the latest data............................... 37 Refreshing all reports and documents ................................... 39 Refreshing specific reports and documents........................... 39 Refreshing large reports with layouts, page-bys, or group-bys ............................................................................... 40 Determining when reports and documents are refreshed...... 43 Determining the order in which reports are refreshed............ 44 Deleting reports from workbooks, presentations, and Word documents ................................................................................... 45 2. Formatting and Displaying Reports and Documents Introduction................................................................................ 47 Formatting reports and documents added to Microsoft ............... 48 Specifying formatting for reports/documents before they are run ................................................................................... 48 Formatting individual reports/documents after they are run... 54 Determining report and document display in Microsoft................ 58 Determining location and size before running the report/document..................................................................... 59 Specifying a display type in which to view reports ................. 63 Displaying multi-layout documents ........................................ 70 Adding reports as static images or embedded Excel workbooks.............................................................................. 71 Controlling how much data is retrieved and displayed........... 72 Determining what report data is displayed on its own page... 73 Choosing a display style for prompts ..................................... 79 Resizing reports or documents .............................................. 80 Moving reports and documents.............................................. 83 Clearing data or information in a report/document................. 86 Displaying last update, filter, and other details next to the vi © 2013 MicroStrategy, Inc. MicroStrategy Office User Guide Contents report ..................................................................................... 86 Using notes in reports and documents ........................................ 91 Providing default answers for diagnostic messages.................... 92 3. Using MicroStrategy Office in Excel Building and analyzing workbooks that contain business data Introduction................................................................................ 95 Creating report-filled Excel workbooks ........................................ 96 Adding reports and documents to a workbook....................... 97 Creating and editing reports and documents in a workbook ............................................................................. 102 Placing, resizing, scaling, and naming reports in a workbook ............................................................................. 102 Placing multiple outline reports on one worksheet............... 106 Using Microsoft Smart Tags in a spreadsheet ..................... 108 Example: A dashboard-style Excel workbook...................... 109 Saving and securing a report-filled workbook ...................... 113 Analyzing business data and working with Excel workbooks .... 114 Refreshing and reformatting data in a workbook ................. 115 Examples using Excel features to analyze MicroStrategy report data ........................................................................... 116 4. Using MicroStrategy Office in PowerPoint Creating and working with presentations that contain business data Introduction.............................................................................. 125 Creating report-filled PowerPoint presentations ........................ 126 Adding reports and documents to a presentation ................ 127 Creating and editing reports and documents in a presentation ......................................................................... 132 Placing, resizing, scaling, positioning, and securing reports in a presentation .................................................................. 132 Using Microsoft Smart Tags in a presentation ..................... 137 Example: A presentation with multiple reports..................... 138 Example: Creating a personalized, auto-generated presentation ......................................................................... 139 Saving and securing a report-filled presentation.................. 143 Analyzing business data and working with PowerPoint presentations ............................................................................. 144 Refreshing and formatting data in a presentation ................ 144 © 2013 MicroStrategy, Inc. vii Contents 5. Using MicroStrategy Office in Word Designing and working with rich Word documents that contain business data MicroStrategy Office User Guide Introduction.............................................................................. 147 Creating report-filled Word documents ...................................... 148 Adding reports and documents to a Word document........... 148 Creating and editing reports and documents in a Word document ............................................................................. 153 Sizing, scaling, and securing reports in a Word document ............................................................................. 153 Using Microsoft Smart Tags in a Word document ............... 156 Example: A sample report-filled Word document................. 158 Example: Creating a report-filled Word document ............... 159 Saving and securing a report-filled document...................... 163 Working with Word documents that contain business data ....... 163 Refreshing and reformatting data in a Word document ....... 163 6. Creating and Editing Reports and Objects Introduction.............................................................................. 167 Creating and editing reports and documents............................. 167 Creating a new report .......................................................... 169 Editing a report .................................................................... 169 Creating a new Report Services document ......................... 170 Editing a Report Services document.................................... 171 Creating and editing prompts..................................................... 171 Accessing the MicroStrategy Office Prompt Editor .............. 172 Creating and editing filters ......................................................... 173 Accessing the MicroStrategy Office Filter Editor.................. 173 7. Securing and Distributing Data Data security and Smart Tags Introduction.............................................................................. 175 Securely distributing business data ........................................... 176 Excluding MicroStrategy Office login information when saving Microsoft files............................................................ 176 Clearing report and document data to control user access.................................................................................. 178 Determining if and how report data is refreshed .................. 179 Controlling whether report data can be modified ................. 182 Sending Microsoft files that include Flash-enabled documents ........................................................................... 185 Using Microsoft Smart Tags as links to projects and reports..... 191 Using Smart Tags as report/document placeholders........... 195 viii © 2013 MicroStrategy, Inc. MicroStrategy Office User Guide Contents Using Smart Tags as project name placeholders ................ 196 Viewing a list of enabled Smart Tags and editing a Smart Tag....................................................................................... 198 Requiring login when a Smart Tag is clicked ....................... 199 Removing Smart Tags ......................................................... 199 Enabling reports/documents exported from Web to be refreshed.................................................................................... 201 8. Installing and Administering MicroStrategy Office Introduction.............................................................................. 203 Installing MicroStrategy Office ................................................... 204 Installing MicroStrategy Office with the rest of the MicroStrategy platform......................................................... 204 Installing MicroStrategy Office without installing other MicroStrategy components .................................................. 204 Allowing users to install MicroStrategy Office from a common location.................................................................. 205 Installing and deploying MicroStrategy Web Services............... 205 Locating the Web Services installation ................................ 206 Deploying with IIS (Windows) .............................................. 206 General steps to deploy MicroStrategy Web Services J2EE .................................................................................... 208 Deploying with Oracle WebLogic ......................................... 209 Deploying with WebSphere and IBM HTTP Server ............. 216 Deploying with Tomcat......................................................... 222 Deploying with SAP NetWeaver .......................................... 225 Deploying with Oracle 10g ................................................... 227 Completing your MicroStrategy Web Services J2EE deployment .......................................................................... 230 Verifying your Web Services installation in ASP.net............ 231 Verifying your Web Services installation in J2EE ................ 231 Adding or modifying project sources for MicroStrategy Web Services and MicroStrategy Office .............................. 232 Establishing connectivity to MicroStrategy applications ............ 234 Connecting MicroStrategy Office to MicroStrategy Web Services ............................................................................... 234 Connecting MicroStrategy Office and MicroStrategy Web... 236 Using the project source name to connect to an Intelligence Server ............................................................... 238 User authentication and security overview ................................ 240 Security workflows ............................................................... 240 Controlling user access to functionality: Privileges .............. 243 Determining how users log in to MicroStrategy Office............... 244 © 2013 MicroStrategy, Inc. ix Contents MicroStrategy Office User Guide Enabling authentication modes in MicroStrategy Office ...... 246 Allowing users to log in without a password ........................ 249 Allowing Windows NT users to automatically connect to projects ................................................................................ 250 Allowing users to log in to MicroStrategy Office with Tivoli or SiteMinder credentials ..................................................... 251 Displaying all projects in a project source or from multiple Intelligence Servers before login.......................................... 252 Using MicroStrategy Office in a multilingual environment ......... 253 A. Customizing MicroStrategy Office Introduction.............................................................................. 255 Customizing the MicroStrategy Office menu, toolbar or tab ...... 255 Customizing the MicroStrategy Office menu and toolbar..... 256 Changing buttons on the MicroStrategy tab......................... 257 Replacing MicroStrategy Office icons, strings, and documentation ........................................................................... 259 Storing customizations......................................................... 260 Customizing images in MicroStrategy Office ....................... 261 Customizing text strings in MicroStrategy Office ................. 263 Customizing documentation in MicroStrategy Office ........... 267 Customizing MicroStrategy Office when running Microsoft Office 2007 or later .............................................................. 267 B. Server-based Configuration Introduction.............................................................................. 269 C. Security and Scalability for MicroStrategy Web Services Introduction.............................................................................. 277 D. Troubleshooting MicroStrategy Office Introduction.............................................................................. 281 Using server-based configuration in MicroStrategy Office......... 270 Exporting existing settings ................................................... 270 Modifying the configuration file ............................................ 271 Importing the configuration file............................................. 274 Setting up SSL for encryption .................................................... 277 Setting up Web Services on a web farm.................................... 278 Installing and configuring MicroStrategy Web Services....... 278 Configuring the cluster and servers for network load balancing ............................................................................. 279 Enabling logging and running diagnostics ................................. 281 MicroStrategy Office issues ....................................................... 283 x © 2013 MicroStrategy, Inc. MicroStrategy Office User Guide Contents MicroStrategy Office toolbar is not appearing in Microsoft Excel, PowerPoint, or Word ................................................. 283 Smart Tags are not displayed or are working incorrectly..... 285 MicroStrategy dashboards are not displayed in Microsoft ... 285 Prompt dialogs are not displaying correctly ......................... 285 Glossary................................................................................................................................... 287 Index......................................................................................................................................... 293 © 2013 MicroStrategy, Inc. xi Contents xii MicroStrategy Office User Guide © 2013 MicroStrategy, Inc. GUIDE OVERVIEW AND ADDITIONAL RESOURCES Description of Guide The MicroStrategy Office User Guide provides information on how to use MicroStrategy Office to add, organize, format, and perform other tasks with MicroStrategy reports and documents in Microsoft® Excel workbooks, PowerPoint presentations, and Word documents. This guide is intended for several different types of users, including business users who will use MicroStrategy Office to design Excel workbooks, PowerPoint presentations, and so on that include MicroStrategy reports and documents. It also addresses business users who intend to use Microsoft Excel, PowerPoint, or Word to analyze, work with, present, or distribute the data within those reports and documents, even if they do not have MicroStrategy Office installed. The MicroStrategy Office User Guide walks you through examples of the kinds of business tasks you can perform using MicroStrategy Office with Microsoft Excel, PowerPoint, and Word. © 2013 MicroStrategy, Inc. xiii Guide Overview and Additional Resources MicroStrategy Office User Guide Specifically, this guide includes the following: xiv • Getting Started with MicroStrategy Office, page 1, provides an overview of MicroStrategy Office and examples of tasks you can perform with it. This section also discusses how MicroStrategy Office works with Microsoft products and the rest of the MicroStrategy platform. In addition, it outlines the essential and highest-level tasks you perform with MicroStrategy Office, regardless of the Microsoft product with which you use it. This section is directed at first-time MicroStrategy Office users, as well as users who need a refresher on how to access MicroStrategy reports, add them to their Microsoft products, and refresh data. • Formatting and Displaying Reports and Documents, page 47, builds on a portion of the content in the previous section by discussing the ways in which you can add reports and documents to Excel workbooks, PowerPoint presentations, and Word documents. It also explains how to run prompted reports and reports with page-by elements, and create ad-hoc reports. • Using MicroStrategy Office in Excel, page 95, discusses how to add MicroStrategy reports and documents to Excel workbooks and provides examples of how to create report-filled dashboards and scorecards. It also provides examples of how to analyze and work with report data in Excel and retrieve the latest data from the data warehouse or other data sources. • Using MicroStrategy Office in PowerPoint, page 125, discusses how to add MicroStrategy reports and documents to PowerPoint presentations and provides an example of how to create a prompted presentation that addresses multiple audiences. It also highlights different ways in which you can work with report-filled PowerPoint presentations and retrieve the latest data from the warehouse or other data sources. • Using MicroStrategy Office in Word, page 147, discusses how to add MicroStrategy reports and documents to Word documents and provides an example of how to create a rich, report-filled Word document. It also highlights different ways in which you can work with the Word documents and retrieve the latest data from the warehouse or other data sources. • Creating and Editing Reports and Objects, page 167, provides steps to create new reports and documents from within your Microsoft product using MicroStrategy Office. It also contains directions to create and edit prompts and filters. © 2013 MicroStrategy, Inc. MicroStrategy Office User Guide Guide Overview and Additional Resources • Securing and Distributing Data, page 175, provides information about how security is applied to the business data in your Excel workbooks, PowerPoint presentations, and Word documents. It also discusses how to modify how those files are opened, refreshed, and formatted by other users, and more. • Installing and Administering MicroStrategy Office, page 203, discusses administrative tasks such as configuring connectivity, user permissions, authentication options, and use in a multilingual environment. • Customizing MicroStrategy Office, page 255, explains how you can modify the MicroStrategy Office toolbar, menu, or tab options. It also provides information on where you can learn how to use the MicroStrategy Office API to create custom workbooks, presentations, and other business applications. • Server-based Configuration, page 269, explains how server-based configuration allows an administrator to control MicroStrategy Office settings on multiple users’ computers. It also shows you how to create a central configuration file and how to deploy it to MicroStrategy Web Services to distribute it to all MicroStrategy Office users. • Security and Scalability for MicroStrategy Web Services, page 277, discusses security models that can be applied to MicroStrategy Web Services. It shows you how to configure SSL for encryption and how to run MicroStrategy Web Services on a web farm. • Troubleshooting MicroStrategy Office, page 281, shows you how to run diagnostics to troubleshoot MicroStrategy Office issues and provides steps to solve possible MicroStrategy Office issues. Information about the MicroStrategy Office API is available in the MicroStrategy Developer Library (MSDL), which is part of the MicroStrategy SDK. About this book The following sections provide the location of examples, list prerequisites for using this guide, and describe the user roles the information in this guide was designed for. This guide assumes you are using Microsoft Office 2007 and later, and refers to login steps and default settings that apply to Microsoft Office 2007 and later. © 2013 MicroStrategy, Inc. About this book xv Guide Overview and Additional Resources MicroStrategy Office User Guide Dates in the MicroStrategy Tutorial project are updated to reflect the current year. Sample reports, documents, and images in this guide were created with dates that may no longer be available in the Tutorial project. Replace them with the first year of data in your Tutorial project. Additional formats This guide is also available as an electronic publication in the Apple iBookstore, and can be read on an iPhone or iPad with the iBooks app installed. To download this guide, search for the guide’s title in the iBookstore search bar, or scan the QR code below using your device's camera. How to find business scenarios and examples Within this guide, many of the concepts discussed are accompanied by business scenarios or other descriptive examples. Many of the examples use the MicroStrategy Tutorial, which is MicroStrategy’s sample warehouse and project. Information about the MicroStrategy Tutorial, which is included as part of the MicroStrategy Analytics Modules, can be found in the MicroStrategy Basic Reporting Guide. Other examples in this guide use the Analytics Modules projects, which include a set of sample reports, each from a different business area. Sample reports present data for analysis in such business areas as financial reporting, human resources, and customer analysis. Detailed examples of advanced reporting functionality can be found in the MicroStrategy Advanced Reporting Guide. xvi About this book © 2013 MicroStrategy, Inc. MicroStrategy Office User Guide Guide Overview and Additional Resources What’s new in this guide Analytics Enterprise • The name of MicroStrategy Desktop has been changed to MicroStrategy Developer. MicroStrategy 9.4 • You can display live charts for single-axis Combination chart types. • Many locales no longer require the Microsoft Office Multi-Lingual User Interface (MUI) pack to display numeric and date values formatted according to the client operating system regional settings. Some locales still require the appropriate MUI to correctly display values in prompt dialogs. See To edit language settings, page 253. • You can add multiple outline reports with dynamic grouping to one Excel worksheet. See To place multiple outline reports on one worksheet, page 107 • You can use new overloaded API methods to specify cache and prompt options during initial execution. See the MicroStrategy Developer Library (MSDL). Prerequisites Before working with this guide, you should: • Know how to use Microsoft Excel, PowerPoint, and Word, depending on the Microsoft product with which you are using MicroStrategy Office. • Know how to use Microsoft Excel PivotTables and PivotCharts to resize, format, and analyze data, if you intend to use these Excel features. The prerequisites listed below apply only to users who have access to MicroStrategy Office and intend to use it to add MicroStrategy reports to workbooks, presentations, or Word documents. You should: © 2013 MicroStrategy, Inc. About this book xvii Guide Overview and Additional Resources • MicroStrategy Office User Guide Have MicroStrategy Office and MicroStrategy Web Services installed and configured. See Chapter 1, Getting Started with MicroStrategy Office for more information. Web Services is typically installed on a separate MicroStrategy computer from MicroStrategy Office. For more information, contact your Web administrator. • Have access to at least one MicroStrategy project. • Be familiar with your MicroStrategy project folder structure and the location of reports and documents. • Understand what MicroStrategy prompts are and how to answer them. See the MicroStrategy Basic Reporting Guide for an introduction to prompts. • Understand basic MicroStrategy terminology such as Intelligence Servers, project sources, Report Services documents, and so on. See the MicroStrategy Basic Reporting Guide for an introduction to the MicroStrategy environment. Who should use this guide This document is designed for all users who require an understanding of how to use MicroStrategy Office with Microsoft Excel, PowerPoint, and Word. It also addresses users who intend to work with MicroStrategy report data from their Microsoft products, but who may not have access to MicroStrategy Office. Specifically, the following users should read this guide: • Business users who intend to create, analyze, present, refresh, or distribute Excel workbooks, PowerPoint presentations, and Word documents that contain MicroStrategy reports or documents. guide assumes these users have MicroStrategy Office installed This and configured on their computers and can therefore access MicroStrategy projects and run reports and documents from their Microsoft products. • Business users who intend to analyze, format, and present Excel workbooks, PowerPoint presentations, and Word documents that contain MicroStrategy reports or documents. xviii About this book © 2013 MicroStrategy, Inc. MicroStrategy Office User Guide • Guide Overview and Additional Resources This guide assumes that these users have access to Microsoft Office products such as Excel, but do not necessarily have access to other MicroStrategy Office products and therefore may not be able to add MicroStrategy reports to workbooks, presentations, or Word documents. Resources Documentation MicroStrategy provides both manuals and online help; these two information sources provide different types of information, as described below: • Manuals: In general, MicroStrategy manuals provide: Introductory information and concepts Examples and images Checklists and high-level procedures to get started The steps to access the manuals are described in Accessing manuals and other documentation sources, page xxv. Most of these manuals are also available printed in a bound, soft cover format. To purchase printed manuals, contact your MicroStrategy Account Executive with a purchase order number. • Help: In general, MicroStrategy help provides: Detailed steps to perform procedures Descriptions of each option on every software screen Translations For the most up-to-date translations of MicroStrategy documentation, refer to the MicroStrategy Knowledge Base. Due to translation time, manuals in languages other than English may contain information that is one or more releases behind. You can see the version number on the title page of each manual. © 2013 MicroStrategy, Inc. Resources xix Guide Overview and Additional Resources MicroStrategy Office User Guide Finding information You can search all MicroStrategy books and Help for a word or phrase, with a simple Google™ search at www.google.com. For example, type “MicroStrategy derived metric” or “MicroStrategy logical table” into a Google search. As described above, books typically describe general concepts and examples; Help typically provides detailed steps and screen options. To limit your search to MicroStrategy books, on Google’s main page you can click More, then select Books. Manuals for MicroStrategy overview and evaluation • Introduction to MicroStrategy: Evaluation Guide Instructions for installing, configuring, and using the MicroStrategy Evaluation Edition of the software. This guide also includes a detailed, step-by-step evaluation process of MicroStrategy features, where you perform reporting with the MicroStrategy Tutorial project and its sample business data. • MicroStrategy Evaluation Edition Quick Start Guide Overview of the installation and evaluation process, and additional resources. • MicroStrategy Suite: Quick Start Guide Evaluate MicroStrategy as a departmental solution. Provides detailed information to download, install, configure, and use the MicroStrategy Suite. Resources for Identity and Loyalty • Alert Commerce Management System (CMS) Guide and Alert API Reference Content resources providing steps to deliver and manage marketing and commerce content through the Alert mobile applications. • Usher Administration Guide Steps to perform mobile identity validation using the Usher mobile identity network to issue electronic badges for identifying users. xx Resources © 2013 MicroStrategy, Inc. MicroStrategy Office User Guide Guide Overview and Additional Resources Manuals for query, reporting, and analysis • MicroStrategy Installation and Configuration Guide Information to install and configure MicroStrategy products on Windows, UNIX, Linux, and HP platforms, as well as basic maintenance guidelines. • MicroStrategy Upgrade Guide Instructions to upgrade existing MicroStrategy products. • MicroStrategy Project Design Guide Information to create and modify MicroStrategy projects, and understand facts, attributes, hierarchies, transformations, advanced schemas, and project optimization. • MicroStrategy Basic Reporting Guide Instructions to get started with MicroStrategy Developer and MicroStrategy Web, and how to analyze data in a report. Includes the basics for creating reports, metrics, filters, and prompts. • MicroStrategy Advanced Reporting Guide: Enhancing Your Business Intelligence Application Instructions for advanced topics in the MicroStrategy system, building on information in the Basic Reporting Guide. Topics include reports, Freeform SQL reports, Query Builder reports, filters, metrics, Data Mining Services, custom groups, consolidations, and prompts. • Document and Dashboard Analysis Guide Instructions for a business analyst to execute and analyze a document in MicroStrategy Developer and MicroStrategy Web, building on basic concepts about projects and reports presented in the MicroStrategy Basic Reporting Guide. • MicroStrategy Report Services Document Creation Guide: Creating Boardroom Quality Documents Instructions to design and create Report Services documents, building on information in the Document and Dashboard Analysis Guide. It is organized to help guide you through creating a new document, from creating the document itself, to adding objects to the new document, and formatting the document and its objects. © 2013 MicroStrategy, Inc. Resources xxi Guide Overview and Additional Resources • MicroStrategy Office User Guide MicroStrategy Dashboards and Widgets Creation Guide: Creating Interactive Dashboards for your Data Instructions for designing and creating MicroStrategy Report Services dashboards, a type of document that is optimized for viewing online and for user interactivity. It builds on the basic concepts about documents presented in the MicroStrategy Report Services Document Creation Guide. • MicroStrategy OLAP Services Guide Information on MicroStrategy OLAP Services, which is an extension of MicroStrategy Intelligence Server. OLAP Services features include Intelligent Cubes, derived metrics, derived elements, dynamic aggregation, view filters, and dynamic sourcing. • MicroStrategy Office User Guide Instructions for using MicroStrategy Office to work with MicroStrategy reports and documents in Microsoft® Excel, PowerPoint, and Word, to analyze, format, and distribute business data. • MicroStrategy Mobile Analysis Guide: Analyzing Data with MicroStrategy Mobile Information and instructions for using MicroStrategy Mobile to view and analyze data, and perform other business tasks with MicroStrategy reports and documents on a mobile device. • MicroStrategy Mobile Design and Administration Guide: A Platform for Mobile Intelligence Information and instructions to install and configure MicroStrategy Mobile, as well as instructions for a designer working in MicroStrategy Developer or MicroStrategy Web to create effective reports and documents for use with MicroStrategy Mobile. • MicroStrategy System Administration Guide: Tuning, Monitoring, and Troubleshooting your MicroStrategy Business Intelligence System Concepts and high-level steps to implement, deploy, maintain, tune, and troubleshoot a MicroStrategy business intelligence system. • MicroStrategy Supplemental Reference for System Administration: VLDB Properties, Internationalization, User Privileges, and other Supplemental Information for Administrators Information and instructions for MicroStrategy administrative tasks such as configuring VLDB properties and defining data and metadata xxii Resources © 2013 MicroStrategy, Inc. MicroStrategy Office User Guide Guide Overview and Additional Resources internationalization, and reference material for other administrative tasks. • MicroStrategy Functions Reference Function syntax and formula components; instructions to use functions in metrics, filters, attribute forms; examples of functions in business scenarios. • MicroStrategy MDX Cube Reporting Guide Information to integrate MicroStrategy with MDX cube sources. You can integrate data from MDX cube sources into your MicroStrategy projects and applications. Manuals for Analytics Modules • Analytics Modules Installation and Porting Guide • Customer Analysis Module Reference • Sales Force Analysis Module Reference • Financial Reporting Analysis Module Reference • Sales and Distribution Analysis Module Reference • Human Resources Analysis Module Reference Manuals for Narrowcast Services products • MicroStrategy Narrowcast Server Getting Started Guide Instructions to work with the tutorial to learn Narrowcast Server interfaces and features. • MicroStrategy Narrowcast Server Installation and Configuration Guide Information to install and configure Narrowcast Server. • MicroStrategy Narrowcast Server Application Designer Guide Fundamentals of designing Narrowcast Server applications. • MicroStrategy Narrowcast Server System Administrator Guide Concepts and high-level steps to implement, maintain, tune, and troubleshoot Narrowcast Server. © 2013 MicroStrategy, Inc. Resources xxiii Guide Overview and Additional Resources • MicroStrategy Office User Guide MicroStrategy Narrowcast Server Upgrade Guide Instructions to upgrade an existing Narrowcast Server. Software Development Kits • MicroStrategy Developer Library (MSDL) Information to understand the MicroStrategy SDK, including details about architecture, object models, customization scenarios, code samples, and so on. • MicroStrategy Web SDK Web SDK is available in the MicroStrategy Developer Library, The which is part of the MicroStrategy SDK. • Narrowcast Server SDK Guide Instructions to customize Narrowcast Server functionality, integrate Narrowcast Server with other systems, and embed Narrowcast Server functionality within other applications. Documents the Narrowcast Server Delivery Engine and Subscription Portal APIs, and the Narrowcast Server SPI. Documentation for MicroStrategy Portlets • Enterprise Portal Integration Help Information to help you implement and deploy MicroStrategy BI within your enterprise portal, including instructions for installing and configuring out-of-the-box MicroStrategy Portlets for several major enterprise portal servers. This resource can be accessed from the MicroStrategy Product Manuals page, as described in Accessing manuals and other documentation sources, page xxv. Documentation for MicroStrategy GIS Connectors • GIS Integration Help Information to help you integrate MicroStrategy with Geospatial Information Systems (GIS), including specific examples for integrating with various third-party mapping services. xxiv Resources © 2013 MicroStrategy, Inc. MicroStrategy Office User Guide Guide Overview and Additional Resources This resource can be accessed from the MicroStrategy Product Manuals page, as described in Accessing manuals and other documentation sources, page xxv. Help Each MicroStrategy product includes an integrated help system to complement the various interfaces of the product as well as the tasks that can be accomplished using the product. Some of the MicroStrategy help systems require a web browser to be viewed. For supported web browsers, see the MicroStrategy Readme. MicroStrategy provides several ways to access help: • Help button: Use the Help button or ? (question mark) icon on most software windows to see help for that window. • Help menu: From the Help menu or link at the top of any screen, select MicroStrategy Help to see the table of contents, the Search field, and the index for the help system. • F1 key: Press F1 to see context-sensitive help that describes each option in the software window you are currently viewing. MicroStrategy Web, MicroStrategy Web Administrator, and For MicroStrategy Mobile Server, pressing the F1 key opens the context-sensitive help for the web browser you are using to access these MicroStrategy interfaces. Use the Help menu or ? (question mark) icon to access help for these MicroStrategy interfaces. Accessing manuals and other documentation sources The manuals are available from http://www.microstrategy.com/producthelp, as well as from your MicroStrategy disk or the machine where MicroStrategy was installed. Acrobat Reader is required to view these manuals. If you do not Adobe have Acrobat Reader installed on your computer, you can download it from http://get.adobe.com/reader/. The best place for all users to begin is with the MicroStrategy Basic Reporting Guide. © 2013 MicroStrategy, Inc. Resources xxv Guide Overview and Additional Resources MicroStrategy Office User Guide To access the installed manuals and other documentation sources, see the following procedures: • To access documentation resources from any location, page xxvi • To access documentation resources on Windows, page xxvi • To access documentation resources on UNIX and Linux, page xxvi To access documentation resources from any location 1 Visit http://www.microstrategy.com/producthelp. To access documentation resources on Windows 1 From the Windows Start menu, choose Programs (or All Programs), MicroStrategy Documentation, then Product Manuals. A page opens in your browser showing a list of available manuals in PDF format and other documentation sources. 2 Click the link for the desired manual or other documentation source. 3 If you click the link for the Narrowcast Services SDK Guide, a File Download dialog box opens. This documentation resource must be downloaded. Select Open this file from its current location, and click OK. bookmarks are not visible on the left side of an Acrobat (PDF) Ifmanual, from the View menu click Bookmarks and Page. This step varies slightly depending on your version of Adobe Acrobat Reader. To access documentation resources on UNIX and Linux 1 Within your UNIX or Linux machine, navigate to the directory where you installed MicroStrategy. The default location is /opt/MicroStrategy, or $HOME/MicroStrategy/install if you do not have write access to /opt/MicroStrategy. 2 From the MicroStrategy installation directory, open the Help folder. xxvi Resources © 2013 MicroStrategy, Inc. MicroStrategy Office User Guide Guide Overview and Additional Resources 3 Open the Product_Manuals.htm file in a web browser. A page opens in your browser showing a list of available manuals in PDF format and other documentation sources. 4 Click the link for the desired manual or other documentation source. 5 If you click the link for the Narrowcast Services SDK Guide, a File Download dialog box opens. This documentation resource must be downloaded. Select Open this file from its current location, and click OK. bookmarks are not visible on the left side of an Acrobat (PDF) Ifmanual, from the View menu click Bookmarks and Page. This step varies slightly depending on your version of Adobe Acrobat Reader. Documentation standards MicroStrategy online help and PDF manuals (available both online and in printed format) use standards to help you identify certain types of content. The following table lists these standards. standards may differ depending on the language of this manual; These some languages have rules that supersede the table below. Type Indicates bold • Button names, check boxes, options, lists, and menus that are the focus of actions or part of a list of such GUI elements and their definitions Example: Click Select Warehouse. italic • Names of other product manuals and documentation resources • When part of a command syntax, indicates variable information to be replaced by the user Example: The aggregation level is the level of calculation for the metric. Example: Type copy c:\filename d:\foldername\filename Courier font • • • • • • • Calculations Code samples Registry keys Path and file names URLs Messages displayed in the screen Text to be entered by the user Example: Sum(revenue)/number of months. Example: Type cmdmgr -f scriptfile.scp and press Enter. + A keyboard command that calls for the use of more than one key (for example, SHIFT+F1). © 2013 MicroStrategy, Inc. Resources xxvii Guide Overview and Additional Resources MicroStrategy Office User Guide Type Indicates A note icon indicates helpful information for specific situations. A warning icon alerts you to important information such as potential security risks; these should be read before continuing. Education MicroStrategy Education Services provides a comprehensive curriculum and highly skilled education consultants. Many customers and partners from over 800 different organizations have benefited from MicroStrategy instruction. Courses that can help you prepare for using this manual or that address some of the information in this manual include: • MicroStrategy Developer: Reporting Essentials • MicroStrategy Web: Report Analysis • MicroStrategy Web: Report Design For a detailed description of education offerings and course curriculums, visit www.microstrategy.com/Education. Consulting MicroStrategy Consulting Services provides proven methods for delivering leading-edge technology solutions. Offerings include complex security architecture designs, performance and tuning, project and testing strategies and recommendations, strategic planning, and more. For a detailed description of consulting offerings, visit http://www.microstrategy.com/Services. International support MicroStrategy supports several locales. Support for a locale typically includes native database and operating system support, support for date formats, numeric formats, currency symbols, and availability of translated interfaces and certain documentation. xxviii Resources © 2013 MicroStrategy, Inc. MicroStrategy Office User Guide Guide Overview and Additional Resources MicroStrategy is certified in homogeneous configurations (where all the components lie in the same locale) in the following languages—English (US), French, German, Italian, Japanese, Korean, Portuguese (Brazilian), Spanish, Chinese (Simplified), Chinese (Traditional), Danish, and Swedish. A translated user interface is available in each of the above languages. For information on specific languages supported by individual MicroStrategy system components, see the MicroStrategy readme. MicroStrategy also provides limited support for heterogeneous configurations (where some of the components may lie in different locales). Please contact MicroStrategy Technical Support for more details. Technical Support If you have questions about a specific MicroStrategy product, you should: 1 Consult the product guides, Help, and readme files. Locations to access each are described above. 2 Consult the MicroStrategy Knowledge Base online at https://resource.microstrategy.com/support. administrator in your organization may be able to help Ayoutechnical resolve your issues immediately. 3 If the resources listed in the steps above do not provide a solution, contact MicroStrategy Technical Support directly. To ensure the most productive relationship with MicroStrategy Technical Support, review the Policies and Procedures document in your language, posted at http://www.microstrategy.com/Support/Policies. Refer to the terms of your purchase agreement to determine the type of support available to you. MicroStrategy Technical Support can be contacted by your company’s Support Liaison. A Support Liaison is a person whom your company has designated as a point-of-contact with MicroStrategy’s support personnel. All customer inquiries and case communications must come through these named individuals. Your company may designate two employees to serve as their Support Liaisons, and can request to change their Support Liaisons two times per year with prior written notice to MicroStrategy Technical Support. It is recommended that you designate Support Liaisons who have MicroStrategy Administrator privileges. This can eliminate security conflicts and improve case resolution time. When troubleshooting and researching © 2013 MicroStrategy, Inc. Resources xxix Guide Overview and Additional Resources MicroStrategy Office User Guide issues, MicroStrategy Technical Support personnel may make recommendations that require administrative privileges within MicroStrategy, or that assume that the designated Support Liaison has a security level that permits them to fully manipulate the MicroStrategy projects and has access to potentially sensitive project data such as security filter definitions. Ensure issues are resolved quickly Before logging a case with MicroStrategy Technical Support, the Support Liaison may follow the steps below to ensure that issues are resolved quickly: 1 Verify that the issue is with MicroStrategy software and not a third party software. 2 Verify that the system is using a currently supported version of MicroStrategy software by checking the Product Support Expiration Schedule at http://www.microstrategy.com/Support/Expiration.asp. 3 Attempt to reproduce the issue and determine whether it occurs consistently. 4 Minimize the complexity of the system or project object definition to isolate the cause. 5 Determine whether the issue occurs on a local machine or on multiple machines in the customer environment. 6 Discuss the issue with other users by posting a question about the issue on the MicroStrategy Customer Forum at https://resource.microstrategy.com/forum/. The following table shows where, when, and how to contact MicroStrategy Technical Support. If your Support Liaison is unable to reach MicroStrategy Technical Support by phone during the hours of operation, they can leave a voicemail message, send email or fax, or log a case using the Online Support xxx Resources © 2013 MicroStrategy, Inc. MicroStrategy Office User Guide Guide Overview and Additional Resources Interface. The individual Technical Support Centers are closed on certain public holidays. North America Email: [email protected] Web: https://resource.microstrategy.com/support Fax: (703) 842–8709 Phone: (703) 848–8700 Hours: 9:00 A.M.–7:00 P.M. Eastern Time, Monday–Friday except holidays EMEA: Europe The Middle East Africa Email: [email protected] Web: https://resource.microstrategy.com/support Fax: +44 (0) 208 711 2525 The European Technical Support Centre is closed on national public holidays in each country. Phone: • Belgium: + 32 2792 0436 • France: +33 17 099 4737 • Germany: +49 22 16501 0609 • Ireland: +353 1436 0916 • Italy: +39 023626 9668 • Poland: +48 22 459 52 52 • Scandinavia & Finland: +46 8505 20421 • Spain: +34 91788 9852 • The Netherlands: +31 20 794 8425 • UK: +44 (0) 208 080 2182 • International distributors: +44 (0) 208 080 2183 Hours: • United Kingdom: 9:00 A.M.–6:00 P.M. GMT, Monday-Friday except holidays • EMEA (except UK): 9:00 A.M.–6:00 P.M. CET, Monday-Friday except holidays Asia Pacific Email: [email protected] Web: https://resource.microstrategy.com/support Phone: • Australia: +61 2 9333 6499 • Korea: +82 2 560 6565 Fax: +82 2 560 6555 • Japan: +81 3 3511 6720 Fax: +81 3 3511 6740 • Singapore: +65 6303 8969 Fax: +65 6303 8999 • Asia Pacific (except Australia, Japan, Korea, and Singapore): +86 571 8526 8067 Fax: +86 571 8848 0977 Hours: • Japan and Korea: 9:00 A.M.–6:00 P.M. JST (Tokyo), Monday-Friday except holidays • Asia Pacific (except Japan and Korea): 7 A.M.-6 P.M. (Singapore) Monday-Friday except holidays Latin America Email: [email protected] Web: https://resource.microstrategy.com/support Phone: • LATAM (except Brazil and Argentina): +54 11 5222 9360 Fax: +54 11 5222 9355 • Argentina: 0 800 444 MSTR Fax: +54 11 5222 9355 • Brazil: +55 11 3054 1010 Fax: +55 11 3044 4088 Hours: • Latin America (except Brazil): 9:00 A.M.–7:00 P.M. (Buenos Aires), Monday-Friday except holidays • Brazil: 9 A.M. - 6 P.M. (São Paulo), Monday–Friday except holidays © 2013 MicroStrategy, Inc. Resources xxxi Guide Overview and Additional Resources MicroStrategy Office User Guide Support Liaisons should contact the Technical Support Center from which they obtained their MicroStrategy software licenses or the Technical Support Center to which they have been designated. Required information when calling When contacting MicroStrategy Technical Support, please provide the following information: • • Personal information: Name (first and last) Company and customer site (if different from company) Contact information (phone and fax numbers, e-mail addresses) Case details: • Configuration information, including MicroStrategy software product(s) and versions Full description of the case including symptoms, error messages(s), and steps taken to troubleshoot the case thus far Business/system impact If this is the Support Liaison’s first call, they should also be prepared to provide the following: • Street address • Phone number • Fax number • Email address To help the Technical Support representative resolve the problem promptly and effectively, be prepared to provide the following additional information: • Case number: Please keep a record of the number assigned to each case logged with MicroStrategy Technical Support, and be ready to provide it when inquiring about an existing case • Software version and product registration numbers of the MicroStrategy software products you are using xxxii Resources © 2013 MicroStrategy, Inc. MicroStrategy Office User Guide • Case description: What causes the condition to occur? Does the condition occur sporadically or each time a certain action is performed? Does the condition occur on all machines or just on one? When did the condition first occur? • Guide Overview and Additional Resources What events took place immediately prior to the first occurrence of the condition (for example, a major database load, a database move, or a software upgrade)? If there was an error message, what was its exact wording? What steps have you taken to isolate and resolve the issue? What were the results? System configuration (the information needed depends on the nature of the problem; not all items listed below may be necessary): Computer hardware specifications (processor speed, RAM, disk space, and so on) Network protocol used ODBC driver manufacturer and version Database gateway software version (For MicroStrategy Web-related problems) browser manufacturer and version (For MicroStrategy Web-related problems) Web server manufacturer and version If the issue requires additional investigation or testing, the Support Liaison and the MicroStrategy Technical Support representative should agree on certain action items to be performed. The Support Liaison should perform any agreed-upon actions before contacting MicroStrategy Technical Support again regarding the issue. If the Technical Support representative is responsible for an action item, the Support Liaison may call MicroStrategy Technical Support at any time to inquire about the status of the issue. © 2013 MicroStrategy, Inc. Resources xxxiii Guide Overview and Additional Resources MicroStrategy Office User Guide Feedback Please send any comments or suggestions about user documentation for MicroStrategy products to: [email protected] Send suggestions for product enhancements to: [email protected] When you provide feedback to us, please include the name and version of the products you are currently using. Your feedback is important to us as we prepare for future releases. xxxiv Feedback © 2013 MicroStrategy, Inc. 1 1. GETTING STARTED WITH MICROSTRATEGY OFFICE Introduction This section provides an overview of MicroStrategy Office and how it works with the MicroStrategy platform to provide Office Intelligence™ from within Microsoft Excel, PowerPoint, and Word in the form of MicroStrategy reports and documents. It also describes the most common MicroStrategy Office tasks. This section includes the following information: • How MicroStrategy Office provides access to business data, page 3 • Examples of tasks performed with MicroStrategy Office, page 4 • Before you use MicroStrategy Office, page 6 • Logging in and accessing reports in a project, page 11 • Running reports and viewing details, page 25 • Refreshing reports to retrieve the latest data, page 37 • Deleting reports from workbooks, presentations, and Word documents, page 45 © 2013 MicroStrategy, Inc. 1 1 Getting Started with MicroStrategy Office MicroStrategy Office User Guide Prerequisites • You must have MicroStrategy Office installed and configured on your computer to perform the tasks in this guide. Steps to confirm installation or install MicroStrategy Office are in Confirming installation or installing MicroStrategy Office, page 6. If you do not have MicroStrategy Office but intend to analyze reports in workbooks, presentations, and so on, use the Microsoft product-specific sections in this guide for information on how to analyze and use files that contain MicroStrategy report data. • You must have access to at least one MicroStrategy project and know your login ID and password. • You must have the MicroStrategy privilege named Use Office. The Use Office privilege allows you to access MicroStrategy projects from MicroStrategy Office. For more information, contact your administrator. About MicroStrategy Office MicroStrategy Office is a product that allows you to run, edit, and format MicroStrategy reports and documents in Microsoft Excel, PowerPoint, and Word, so that you can easily analyze, explore, and present business data. You can install MicroStrategy Office along with other MicroStrategy products, or you can install MicroStrategy Office as a stand-alone product. You can connect to and browse through MicroStrategy projects from these Microsoft Office products, and then run MicroStrategy reports, Report Services documents, or HTML documents into your workbook, presentation, or Word document. (The projects, reports, and documents that you can run and view depend on your user privileges in MicroStrategy.) A MicroStrategy Office menu and toolbar or tab appear in Microsoft Excel, PowerPoint, and Word after MicroStrategy Office is installed on a computer. The MicroStrategy Office toolbar, menu, or tab (the toolbar is shown below 2 Prerequisites © 2013 MicroStrategy, Inc. MicroStrategy Office User Guide Getting Started with MicroStrategy Office 1 in Excel) allow you to access the MicroStrategy platform from your Microsoft Office product. Once you log in to one or more MicroStrategy projects using MicroStrategy Office, you can add any report or document to your Excel workbooks, PowerPoint presentations, or Word documents. You can then organize, present, and refresh report data, and perform other tasks with the reports and documents. Any MicroStrategy report or document that you add to your workbooks, presentations, and so on becomes linked to the data sources that store the data which is displayed on the reports. This means that when you or your colleague open the workbook or presentation that includes the MicroStrategy reports, you can refresh the reports and documents to ensure that they contain the most updated information from data sources. information about refreshing workbooks, presentations, and so For on using MicroStrategy Office, see Refreshing reports to retrieve the latest data, page 37. If your colleague only has privileges to access data related to your company’s Northeast region, for example, he or she will only see Northeast region data on the report, regardless of any other data that may exist in the report. This occurs because MicroStrategy security at the folder, object, and data level are enforced. more information about security in workbooks, presentations, For and Word documents that contain MicroStrategy reports, see Securely distributing business data, page 176. How MicroStrategy Office provides access to business data This section presents a general overview of how MicroStrategy Office provides secure access to MicroStrategy reports and documents, even when MicroStrategy Office is the only MicroStrategy product on your computer. © 2013 MicroStrategy, Inc. About MicroStrategy Office 3 1 Getting Started with MicroStrategy Office MicroStrategy Office User Guide After MicroStrategy Office is installed, a MicroStrategy Office menu and toolbar or tab appear in your Microsoft products. You use the MicroStrategy Office menu, toolbar, or tab to log in to one or more MicroStrategy project sources that are connected to MicroStrategy Intelligence Server. When you log in to a MicroStrategy project source, the MicroStrategy projects are displayed. After you access a project, you can view and work with the folders, reports, and documents to which you have access. When you view reports and documents in workbooks, presentations, or Word documents, you can only see data that your MicroStrategy privileges allow. This restricted access is possible because MicroStrategy Office is connected to Intelligence Server, which secures data by enforcing each user’s MicroStrategy privileges. For example, you create an Excel workbook that contains monthly shipping reports for every region in the United States. You decide to share the workbook on a file server so that your colleague can access it. However, he only has privileges to view the shipping data for the Northeast region that he manages. Although your reports contain shipping data for every region, once he opens and refreshes your Excel workbook, he only sees data for the Northeast region. This occurs because all folder, object, and data security and access privileges configured in MicroStrategy are applied when you use MicroStrategy Office. Securing and distributing workbooks, presentations, and Word documents that contain business data is discussed in detail in Securing and Distributing Data. connection between MicroStrategy Office and Intelligence Server The is established through MicroStrategy Web Services, which must be installed by your Web administrator in either a Windows .NET or J2EE environment. Specific information about how MicroStrategy Web Services interacts with MicroStrategy Office in .NET and J2EE environments is available in Installing and Administering MicroStrategy Office. Examples of tasks performed with MicroStrategy Office You can perform a variety of business tasks using MicroStrategy Office from within your Microsoft Office products. The following scenario presents a typical workflow of how you might use MicroStrategy Office with Microsoft Excel. It is intended to give you a general idea of how MicroStrategy Office is commonly used. 4 About MicroStrategy Office © 2013 MicroStrategy, Inc. MicroStrategy Office User Guide Getting Started with MicroStrategy Office 1 Details about how to perform the following tasks are provided in this guide. 1 A manager creates a new workbook in Microsoft Excel. She then uses the MicroStrategy Office toolbar or tab to log in to her MicroStrategy project and finds the reports she wants to add to the workbook. She decides that each report should be placed on its own worksheet and adjusts the MicroStrategy Office preferences accordingly. 2 When she runs the MicroStrategy reports in the workbook, they remain connected to the data warehouse. This ensures that she and other MicroStrategy users can later open the workbook, log in to MicroStrategy Office, and refresh the reports in the workbook to retrieve the latest business data from the data warehouse. 3 The manager formats the colors and fonts of each worksheet and adds a title and her company logo to the workbook, and saves her work, thus creating a professional, report-filled workbook. 4 To secure the workbook, the manager clears the data from the reports in it using MicroStrategy Office. Although the data in the reports is no longer displayed in the workbook, a connection remains between the workbook and the report data in the data warehouse. These links are saved for future use, and allow the information to be restored by a user who has access to the appropriate data in the data warehouse. 5 The manager sends the blank workbook to a sales executive. After the sales executive receives the blank workbook, logs in to MicroStrategy Office, and refreshes the data, the reports are displayed with the latest data from the warehouse. 6 The sales executive uses Excel's functionality to analyze, sort, and format the reports. He analyzes the data using Excel Pivot Tables, PivotCharts, and other Microsoft features such as sorting and filtering. For more details about tasks you can perform in Microsoft Excel, see Using MicroStrategy Office in Excel. The following sections provide walkthroughs and examples of business scenarios in which MicroStrategy Office is commonly used: • Using MicroStrategy Office in Excel • Using MicroStrategy Office in PowerPoint • Using MicroStrategy Office in Word • Securing and Distributing Data © 2013 MicroStrategy, Inc. About MicroStrategy Office 5 1 Getting Started with MicroStrategy Office MicroStrategy Office User Guide Before you use MicroStrategy Office Both MicroStrategy Office and MicroStrategy Web Services must be successfully installed and configured before you can access MicroStrategy Office from within Microsoft Excel, PowerPoint, or Word. Connectivity must also be established between MicroStrategy Office and various MicroStrategy components. A connection between MicroStrategy Office and MicroStrategy Web is required to allow MicroStrategy Office users to create and edit reports and documents using MicroStrategy Office. For information about configuring connectivity in MicroStrategy Office, see Establishing connectivity to MicroStrategy applications, page 234. An administrator can complete these installation and configuration tasks, as described in Chapter 8, Installing and deploying MicroStrategy Web Services. Note the following: • MicroStrategy Web Services is usually installed and maintained by your Web administrator, and is generally not installed on the computer on which you are using MicroStrategy Office. An administrator must install and deploy MicroStrategy Web Services to support your MicroStrategy Office installation, which is described in Installing and deploying MicroStrategy Web Services, page 205. • You may be prompted to upgrade MicroStrategy Office after you log in to a MicroStrategy project from Excel, PowerPoint, or Word. For more information on upgrading MicroStrategy Office, refer to the MicroStrategy Upgrade Guide. Confirming installation or installing MicroStrategy Office Your Web administrator may have already installed and configured MicroStrategy Web Services, and may have also already installed and configured MicroStrategy Office on your computer. If you need to confirm that MicroStrategy Office is installed on your computer, use the following steps. 6 Before you use MicroStrategy Office © 2013 MicroStrategy, Inc. MicroStrategy Office User Guide Getting Started with MicroStrategy Office 1 To confirm whether MicroStrategy Office is installed on your computer 1 Open the Control Panel. Use the applicable steps below depending on your version of Windows: • From the Windows Start menu, select Settings, and then Control Panel. Then double-click the Add/Remove Programs icon. • From the Windows Start menu, select Control Panel. Then select Programs and Features. 2 Do one of the following: • If MicroStrategy Office is listed in the list of installed programs, MicroStrategy Office is installed on your computer. For information on accessing MicroStrategy Office from your computer, see Logging in and accessing reports in a project, page 11. • If MicroStrategy Office is not listed, use the steps below to install MicroStrategy Office. Installing MicroStrategy Office You can install MicroStrategy Office along with other MicroStrategy products, or you can install MicroStrategy Office as a stand-alone product. You can install MicroStrategy Office on your computer by doing one of the following, depending on your environment and requirements: • Installing MicroStrategy Office with the rest of the MicroStrategy platform, page 7 • Installing only MicroStrategy Office from a network location or disk, page 8 • Installing MicroStrategy Office from MicroStrategy Web, page 10 Installing MicroStrategy Office with the rest of the MicroStrategy platform If you intend to install several MicroStrategy products on your computer at the same time, including MicroStrategy Office, install MicroStrategy Office with the rest of the MicroStrategy platform. © 2013 MicroStrategy, Inc. Before you use MicroStrategy Office 7 1 Getting Started with MicroStrategy Office MicroStrategy Office User Guide For specific information about installing the MicroStrategy platform, see the MicroStrategy Installation and Configuration Guide. For details on space and size requirements, certified and supported versions of third-party software, and other important information, see the MicroStrategy Readme. Installing only MicroStrategy Office from a network location or disk If MicroStrategy Office is the only MicroStrategy product you intend to install on your computer, you can install a stand-alone version of MicroStrategy Office using one of the methods below: • Your administrator may have provided you with a network location from which you can install MicroStrategy Office. For more information, contact your administrator. • If you have access to the MicroStrategy installation disk, you can install MicroStrategy Office directly from it, as described in the steps below. are not required to have a MicroStrategy license key to install the You stand-alone version of MicroStrategy Office using the installation process described below. To install MicroStrategy Office from the MicroStrategy installation disk Prerequisites • To install MicroStrategy Office, you must have administrative privileges on the computer on which you are installing the product. • .NET Framework 4.0 must be manually installed prior to installing MicroStrategy Office. 1 On the computer where you are installing MicroStrategy Office, exit all Windows and Microsoft Office applications before beginning the installation process. 2 Insert the MicroStrategy installation disk into the disk drive and close the MicroStrategy Main Menu dialog box that opens automatically. 3 Browse to the Installations\Office folder on the MicroStrategy installation disk. 8 Before you use MicroStrategy Office © 2013 MicroStrategy, Inc. MicroStrategy Office User Guide Getting Started with MicroStrategy Office 1 4 By default, the MicroStrategy Office installation is in English. To load the installation wizard in a different language, from the Windows command line, run the following command: • If you are using 32-bit Microsoft Office: msiexec.exe /i MicroStrategyOffice.msi TRANSFORMS= :LLanguageCode • If you are using 64-bit Microsoft Office: msiexec.exe /i MicroStrategyOffice64.msi TRANSFORMS=:LLanguageCode Where LanguageCode can be one of the following languages available for the MicroStrategy Office installation Wizard: Language Value Danish 1030 Dutch 1043 English 1033 French 1036 German 1031 Italian 1040 Japanese 1041 Korean 1042 Portuguese 2070 Simplified Chinese 2052 Spanish 1034 Swedish 1053 Traditional Chinese 1028 5 Do one of the following: • If you are using 32-bit Microsoft Office, run MicroStrategyOffice.msi. • If you are using 64-bit Microsoft Office, run MicroStrategyOffice64.msi. © 2013 MicroStrategy, Inc. Before you use MicroStrategy Office 9 1 Getting Started with MicroStrategy Office MicroStrategy Office User Guide The MicroStrategy Office installation wizard opens. Services Enhancements (WSE) 3.0 is not already installed IfonWeb your computer, it is installed automatically with MicroStrategy Office during the installation procedure. 6 Follow the instructions in the MicroStrategy Office wizard to install MicroStrategy Office on your computer. Installing MicroStrategy Office from MicroStrategy Web If MicroStrategy Office is not already installed on your computer, you can install it from MicroStrategy Web if you have access to MicroStrategy Web and your MicroStrategy Web administrator has made the Install MicroStrategy Office link available in MicroStrategy Web. you are a Web administrator and want to allow Web users to install IfMicroStrategy Office, see the MicroStrategy Installation and Configuration Guide for the necessary steps. When you install MicroStrategy Office from the Install MicroStrategy Office link in Web, MicroStrategy Office is installed as a stand-alone product on your computer. You can install MicroStrategy Office on your computer even if no other MicroStrategy products are installed on your computer. Prerequisites • You must have .NET Framework 4.0 installed on your computer to use MicroStrategy Office, and it must be installed before MicroStrategy Office is installed. • You must have Web Services Enhancements (WSE) 3.0 or higher installed on your computer to use MicroStrategy Office. If you do not have WSE on your computer, it is installed automatically when you install MicroStrategy Office from MicroStrategy Web. To install MicroStrategy Office from MicroStrategy Web 1 Open MicroStrategy Web. 2 Navigate to the Login page or the Projects page. 10 Before you use MicroStrategy Office © 2013 MicroStrategy, Inc. MicroStrategy Office User Guide Getting Started with MicroStrategy Office 1 3 Click the Install MicroStrategy Office link at the top right of the page. • If the link is not available, your Web administrator has not enabled MicroStrategy Office installation from Web. To gain access to MicroStrategy Office, contact your Web administrator. 4 On the MicroStrategy Office installation page, click Install. The MicroStrategy Office installation wizard opens. 5 Follow the instructions in the MicroStrategy Office installation wizard to install MicroStrategy Office on your computer. Logging in and accessing reports in a project You can access MicroStrategy Office from Microsoft Excel, PowerPoint, and Word after MicroStrategy Office is installed on your computer. (For steps to confirm that MicroStrategy Office is installed on your computer, see Confirming installation or installing MicroStrategy Office, page 6.) You can access MicroStrategy Office from different locations depending on your version of Microsoft Office. Microsoft Office 2007 and later: MicroStrategy tab If you are using Microsoft Office 2007 and later, the MicroStrategy tab (called a ribbon in Microsoft) is displayed. The MicroStrategy tab in Excel is shown below. position of the controls and whether or not the controls appear on The the MicroStrategy tab can be customized as described in Changing buttons on the MicroStrategy tab, page 257. © 2013 MicroStrategy, Inc. Logging in and accessing reports in a project 11 1 Getting Started with MicroStrategy Office MicroStrategy Office User Guide Microsoft Office 2003 and earlier: MicroStrategy menu and toolbar If you are using Microsoft Office versions earlier than 2007, the MicroStrategy menu and a MicroStrategy toolbar are displayed in Excel, PowerPoint, and Word. The MicroStrategy menu in Excel is shown below. The MicroStrategy Office toolbar is shown below: of the option names on the toolbar and menu can be Some customized, as described in Customizing the MicroStrategy Office menu and toolbar, page 256. This guide refers to the buttons and options as they are displayed by default, without customization. The MicroStrategy Office toolbar is enabled by default in your Microsoft products after MicroStrategy Office is installed. Use the following steps to display the toolbar if it is not already displayed in your Microsoft product. 12 Logging in and accessing reports in a project © 2013 MicroStrategy, Inc. MicroStrategy Office User Guide Getting Started with MicroStrategy Office 1 To enable the MicroStrategy Office toolbar in your Microsoft products 1 Open Microsoft Excel, PowerPoint, or Word. 2 From the View menu, point to Toolbars, and then select MicroStrategy Office. The MicroStrategy Office toolbar is displayed. Office is not displayed in the list of toolbars, from IftheMicroStrategy Start menu, select Programs (or All Programs), MicroStrategy Tools, then select Office Configuration. In the Load area of the General folder, ensure that the check box for your specific Microsoft product is selected. For example, ensure that the Load in PowerPoint check box is selected if the MicroStrategy Office toolbar is not displayed in PowerPoint. Click OK. After you close and reopen your Microsoft product, the MicroStrategy Office toolbar is displayed. Logging in and accessing reports in a project Once you have access to the MicroStrategy Office toolbar, menu, or tab from your Microsoft product, you are ready to log in to a MicroStrategy project in MicroStrategy Office. You must log in to a MicroStrategy project to gain access to any MicroStrategy reports or documents that you intend to display in your Microsoft product. steps below show how to access features using both the The MicroStrategy tab (Microsoft Office 2007 and later) and the MicroStrategy menu and toolbar (Microsoft Office 2003 and earlier). The rest of this guide assumes you are using Microsoft Office 2007 and later, and refers to the tab. You can always refer to the step below if you need information to access features using the menu or toolbar. © 2013 MicroStrategy, Inc. Logging in and accessing reports in a project 13 1 Getting Started with MicroStrategy Office MicroStrategy Office User Guide To log in to a MicroStrategy project in MicroStrategy Office 1 Use the appropriate steps below to access MicroStrategy Office, depending on which version of Microsoft Office you are using: • If you have Microsoft Office 2007 or later, the MicroStrategy tab (ribbon) is displayed. Click the Office icon on the left. • If you have Microsoft Office 2003 or earlier, the MicroStrategy menu and toolbar are displayed. To use the menu, point to MicroStrategy and select MicroStrategy Office. To use the toolbar, click the MicroStrategy icon, shown below: If the toolbar is not displayed, see To enable the MicroStrategy Office toolbar in your Microsoft products, page 13 to enable it. 2 Depending on how your administrator has configured authentication in MicroStrategy Office, you may be required to provide any of the following information: • Your username and password for the MicroStrategy project that you are accessing. To avoid being required to enter your project password each time you connect to a MicroStrategy project, see To save your project or Web Services password, automatically connect to a project, or show projects from all servers, page 16. • Your Tivoli or SiteMinder username and password. • Your MicroStrategy Web Services username and password. To avoid being required to enter your MicroStrategy Web Services password each time you log in to MicroStrategy Office, see To save your project or Web Services password, automatically connect to a project, or show projects from all servers, page 16. The Connect to Project dialog box opens. Any available MicroStrategy project sources to which you are connected are listed on the left. 14 Logging in and accessing reports in a project © 2013 MicroStrategy, Inc. MicroStrategy Office User Guide 1 Getting Started with MicroStrategy Office 3 From the project source list on the left, select the MicroStrategy project source to connect to. list is stored in the file projectsources.xml in the This MicroStrategy Web Services installation folder on the Web Services computer. The project source list is populated once, when MicroStrategy Office is initialized. 4 If required, type your Login ID and Password in the Authentication area and click Get Projects. A list of every project in the project source to which you have access is displayed, as shown below. 5 From the project list, select the project that contains the reports or documents you want to display in your Microsoft product, and click OK. The MicroStrategy Office dialog box opens. The Shared Reports list is open by default. may be prompted to upgrade MicroStrategy Office after you You log in to a MicroStrategy project. For more information on upgrading MicroStrategy Office, contact your administrator. 6 Navigate through the folders to browse reports and documents. Or, from the View menu, you can select the MicroStrategy folder that holds the report you want to work with. • To view your list of folders in a folder tree format, from the View menu, select Show Folder Tree. © 2013 MicroStrategy, Inc. Logging in and accessing reports in a project 15 1 Getting Started with MicroStrategy Office • MicroStrategy Office User Guide To display hidden reports and documents, from the Tools menu, select Options. In the Options dialog box that opens, under the General folder, click the View folder, select the Show hidden objects check box, then click OK. For details about the folders and shortcuts available in MicroStrategy Office, see Exploring MicroStrategy Office, page 20. Saving passwords and automatic connection You can configure MicroStrategy Office to save your project password or your Web Services password. You can also configure MicroStrategy Office to automatically connect to the last project that you visited, thus skipping the Connect to Project dialog box. MicroStrategy Office can also be configured to show projects from all servers to which you have permissions, if you work in a multi-server, multi-project environment. To save your project or Web Services password, automatically connect to a project, or show projects from all servers 1 In Microsoft Excel, PowerPoint, or Word, select the MicroStrategy tab. 2 Click Options. The Options dialog box opens. 3 Under the General folder, expand Security. 4 Select Login. 5 Select from the following: • In the Project area, select Remember my project password. If selected, project passwords are saved between user sessions so they do not need to be reentered for future connections. Cleared by default. • In the Web Services area, select Remember my Web Services password. If selected, Web Services passwords are saved between user sessions so they do not need to be reentered for future connections. Cleared by default. • In the Project area, select Automatically connect to my last visited project. If selected, the first time during a session that a connection is attempted, the last project that was successfully connected to is used, 16 Logging in and accessing reports in a project © 2013 MicroStrategy, Inc. MicroStrategy Office User Guide Getting Started with MicroStrategy Office 1 skipping the Connect To Project dialog box. If the project is not available, the Connect to Project dialog box is displayed. Cleared by default. • In the Project area, select Show projects from all servers to display projects from across several MicroStrategy Intelligence Servers when you log in. Cleared by default. 6 Click OK. Accessing reports in multiple projects Excel workbooks, PowerPoint presentations, and Word documents can contain report data from multiple MicroStrategy projects. For example, you can use MicroStrategy Office to log in to a human resources project, run reports in a workbook, and then log in to a supply chain project and run reports from that project. Reports from each project are placed within the same workbook. When you or other users refresh the workbook to retrieve the latest data from the data warehouse, the reports are updated regardless of whether they came from the same project. You can be connected to multiple projects at the same time, but only connected to one project source at a time. Use the following steps to log in to multiple MicroStrategy projects at the same time. To log in to multiple projects 1 On the MicroStrategy tab, click Office. 2 From the File menu, select Connect to New Project. The Connect to Project dialog box opens. 3 From the left, select the MicroStrategy project source to which to connect. 4 From the project list on the right, select the name of a new project to which to connect and click OK. You are logged in to the new project. your login ID and password for the new project differ from the Ifproject which you are currently logged in to, enter your login ID and password and click OK to log in to the new project. © 2013 MicroStrategy, Inc. Logging in and accessing reports in a project 17 1 Getting Started with MicroStrategy Office MicroStrategy Office User Guide Switching between projects You can remain logged into multiple projects at one time and switch from one to the other as you design your workbook, presentation, or Word document. For example, you can log in to a project, run reports in a presentation, and then log in to another project to access a different set of reports. Unless you disconnect from the first project, you remain logged into it. To switch from the current project to another project 1 When logged in to multiple MicroStrategy projects, from the View menu in MicroStrategy Office, select Projects. A list of available projects opens. projects with a True listed in the Connected column are Any projects you are currently connected to. 2 Double-click the project that you want to switch to. MicroStrategy Office opens, displaying the project’s folders, reports, and documents. Disconnecting from projects You can disconnect from the MicroStrategy project in which you are working. You can also disconnect from the MicroStrategy project source. When you disconnect from a MicroStrategy project source, you close all connections to MicroStrategy projects within that project source. This allows you to log in to another project source to access additional MicroStrategy projects. These steps assume you are logged into one or more projects. To disconnect from a MicroStrategy project 1 On the MicroStrategy tab, click Office and log into a project. 2 From the View menu, select Projects, then, from the Projects List, select one or more projects that you are connected to. To select multiple projects, press CTRL. 18 Logging in and accessing reports in a project © 2013 MicroStrategy, Inc. MicroStrategy Office User Guide Getting Started with MicroStrategy Office 1 3 From the File menu, select Disconnect from Project. You are disconnected from the project and the Connect To Project dialog box opens. The Connected column in the Connect To Project dialog box shows whether you are connected to a project. If you are connected, True is displayed, and if you are not, False is displayed. To disconnect from a MicroStrategy project source 1 On the MicroStrategy tab, click Office and log into a project. 2 From the File menu, select Disconnect from Project Source. The Connect To Project dialog box opens. For information on logging into another project source and project, see Logging in and accessing reports in a project, page 13. Changing your password You can change your standard authentication password using MicroStrategy Office. Periodically changing your password helps to keep your access to MicroStrategy Office secure. To change the password in MicroStrategy Office 1 On the MicroStrategy tab, click Office and log into a project. 2 Select Tools and then Change Password. 3 The Login ID displays the MicroStrategy standard authentication login ID of the currently connected user. Type your old password in the Old Password field and then type a new password in the New Password and Confirm Password fields. 4 Click OK to save your changes. You will be prompted to enter your new password the next time you log in to a MicroStrategy project. © 2013 MicroStrategy, Inc. Logging in and accessing reports in a project 19 1 Getting Started with MicroStrategy Office MicroStrategy Office User Guide Exploring MicroStrategy Office After you log in to a MicroStrategy project, MicroStrategy Office opens, as shown below. MicroStrategy Office consists of the following: • The Shortcut Bar on the left, which includes the following shortcuts: the Shortcut Bar is not displayed, from the View menu, select IfShow Shortcut Bar. My Reports: This folder lists the folders, shortcuts, reports, and documents that can be viewed only by you. These are the objects that reside within the My Personal Objects\My Reports folder. Shared Reports: This folder lists the folders, shortcuts, reports, and documents to which you and other users have access. These are the objects that reside within the Public Objects\Reports folder. (Excel/Word/PowerPoint) Reports: This folder displays a list of the reports and documents in your current Excel workbook, PowerPoint presentation, or Word document. This list is blank if you have not run any reports or documents from within your Microsoft product. History List: This folder displays a list of all the reports and documents in your MicroStrategy History List. Running reports to the History List is convenient because the reports are run in the 20 Exploring MicroStrategy Office © 2013 MicroStrategy, Inc. MicroStrategy Office User Guide Getting Started with MicroStrategy Office 1 background as you perform other tasks. Report and document results are stored as messages in your History List. This is also where you retrieve any scheduled reports. For information about using History Lists in MicroStrategy, see Storing reports and viewing stored reports: History List, page 31. Projects: This folder displays all available projects for the connected project source. Search Results: This area displays the results of the last search run in MicroStrategy Office. Smart Tags: This folder displays the list of reports and projects that have been defined as Smart Tags. This shortcut is visible if the Show Smart Tag menus check box is selected; access this check box from Tools, then Options, then General, then View. For details on Smart Tags, see Using Microsoft Smart Tags as links to projects and reports, page 191. • The folder area on the right, which is where you browse for and run reports and documents. To display the folder area, select View, then Show Folder Tree. • The status bar at the bottom, which provides the following information: The project source to which you are currently connected. For example, the image above shows MicroStrategy Tutorial, MicroStrategy’s sample project source. The project to which you are currently connected. For example, the image above shows MicroStrategy Tutorial, MicroStrategy’s sample project. Your user name. In the example image above, the user is named OfficeDesigner. The folder you are currently browsing. The example image above shows that the user is currently viewing the objects within the Shared Reports folder. Modifying the behavior and layout of MicroStrategy Office You can determine which folder opens by default and whether or not folders are displayed in a folder tree format, among other options to change the behavior and layout of MicroStrategy Office. © 2013 MicroStrategy, Inc. Exploring MicroStrategy Office 21 1 Getting Started with MicroStrategy Office MicroStrategy Office User Guide To modify the overall layout of MicroStrategy Office 1 On the MicroStrategy tab, click Options. The Options dialog box opens. 2 Under the General folder, click the View folder. 3 Make selections from the Dialog View and Folder Display areas. For example, you can control the following: • Determine whether folders, reports, and objects are displayed with folder trees and details by selecting from the following: Full View: This view provides the maximum amount of information, including the shortcut bar, folder tree, description, and all details views. Developer View: A view similar to MicroStrategy Developer. Displays the shortcut bar, folder tree, and all details views. Web View: A view similar to MicroStrategy Web. Displays shortcut bar and all details views. Compact View: Displays details views, which is useful if you only want a list of reports to browse and run. Custom View: You can choose a combination of views. This is the default option. • Show Smart Tags menus • Show compact folder tree: Only My Reports, Shared Reports, and their subfolders are displayed in the folder tree. If cleared, all folders for the project are displayed. Selected by default. • Show hidden objects: Hidden objects are displayed when you browse folders, if you have Browse access to view hidden objects. After changing this option, refresh the folder for changes to be applied. Cleared by default. For details to specify object fetching, see Controlling how much data is retrieved and displayed, page 72. For details to specify search results, see Searching for MicroStrategy objects, page 23. 22 Exploring MicroStrategy Office © 2013 MicroStrategy, Inc. MicroStrategy Office User Guide 1 Getting Started with MicroStrategy Office Searching for MicroStrategy objects To locate a specific MicroStrategy report, document, or other object, you can run a search for it. You can search for folders, reports, Report Services documents, filters, prompts, and HTML documents. You can limit search results to a specific number of objects before you perform the search. From the MicroStrategy tab, select Options. Under the General folder, select the View folder. In the Folder Display area, type the number of objects to display in Limit search results to. The possible range is 10-500 objects, and the option is set to 100 objects by default. This setting can be overridden by your settings in the Search dialog box, below. To search for objects 1 On the MicroStrategy tab, click Office and log into a project. 2 From the Tools menu, select Search. The Search for Objects dialog box opens. 3 Type search criteria to search by name, description, and location, using the following options depending on the type of search: only one term may impact performance, depending on the Typing size of your system, because the search can be extensive. • Name: Type a full or partial name. • Description: Type a full or partial object description. • Location: Type a folder location in which to search. Include subfolders: If selected, all sub-folders are also searched. 4 Select modifiers as necessary to restrict your search: • Contains: Finds objects whose name or description contains the specified text. • Ends with: Finds objects whose name or description ends with the specified text. • Is exactly: Finds objects whose name or description matches the specified text exactly. © 2013 MicroStrategy, Inc. Exploring MicroStrategy Office 23 1 Getting Started with MicroStrategy Office • MicroStrategy Office User Guide Starts with: Finds objects whose name or description begins with the specified text. 5 To search for objects based on object type or owner, click Advanced: • Object Types displays a list of all existing objects types supported by MicroStrategy Office. • Owner lets you search objects based on a particular owner. Created by any user: Displays all objects in the project. Selected by default. Created only by me: Displays only objects created by the currently connected user. Created by: Displays objects created by the specified owner. 6 Once you are finished creating your search, click Find Now. (If the Location field is empty, Find Now is not available.) MicroStrategy Office runs the search and returns a list of objects that match your search criteria. The search results appear in the background, showing the following details: • Name: Name of the object. • Folder: Path of the folder that contains the object. • Type: Type of object. • Modification Time: Last day and time the object was modified. • Owner: User name of the object’s owner. • Access: Access rights for the object. • Description: Object’s description. To navigate to the folder containing the search result item 1 Run a search as described above. 2 Right-click the result item and select Go to Folder. The contents of the folder that contains the selected result items are displayed. 24 Exploring MicroStrategy Office © 2013 MicroStrategy, Inc. MicroStrategy Office User Guide Getting Started with MicroStrategy Office 1 Running reports and viewing details Once you log in to a MicroStrategy project and access MicroStrategy Office, you can run reports and documents in your Excel workbook, PowerPoint presentation, or Word document. You can also execute a report or document in PDF format for easy distribution to other users. Reports/documents can be run to your History List, a folder where executed reports/documents are stored by the system and where you can view them later. This can be a convenient location to run large reports/documents to, for later viewing. You can display the results of a MicroStrategy Intelligent Cube (called publishing an Intelligent Cube). When an Intelligent Cube has been published using MicroStrategy Office, it is displayed in your list of MicroStrategy Office reports and documents. From there, it can be refreshed in the same way as a report or document. You can also view details about MicroStrategy Office and the MicroStrategy objects in a workbook, presentation, or document using Microsoft Office Backstage view. Details are below. Determining how reports are run: Preferences You can save time by setting the following preferences before you run reports or documents. • In Excel, should each report be placed on its own worksheet or in a specific cell? • In PowerPoint, should each report be placed on the current slide, on previous slides, or on the next slides? • Should the details of each report be displayed alongside each report? Details include such information as the report’s description as defined by the report’s creator, the definition of any filter applied to the report, and so on. • Will reports with multiple pages (with objects in their page-by field) display each page-by element on its own page? • Do I want to manually control when and how reports are run? © 2013 MicroStrategy, Inc. Running reports and viewing details 25 1 Getting Started with MicroStrategy Office MicroStrategy Office User Guide Steps to change these preferences are in Formatting and Displaying Reports and Documents. MicroStrategy Office preferences are applied to every report These and document you run in your workbook, presentation, or Word document. Running a report or document in a Microsoft product You can run all of the following MicroStrategy objects into Microsoft Excel, PowerPoint, or Word: a report, Report Services document (referred to as a document), data mart report, or HTML document. You can determine how many reports can be run at once by adjusting the Maximum Concurrent Reports setting in the General folder of the MicroStrategy Office Options dialog box. To run a report or document in your Microsoft product 1 On the MicroStrategy tab, click Office and log into a project. 2 Navigate to the report or document to add to your Microsoft product, and double-click the report or document to run it. • For reports, you can determine which display type to execute it in. To choose a specific display type, right-click the report (or press CTRL to select several reports) and select the display type. For example, you can run a report as a Grid and Chart, or as a PivotTable. See Examples of report display types, page 64 to view examples of each display type. • You can send reports and documents directly to the History List. The History List is a folder location where executed reports/documents are stored and can be viewed later. This can be convenient if the report/document you are running is very large. To send a report/ document to the History List, right-click the report/document and select Run report to History List. For details, see Storing reports and viewing stored reports: History List, page 31. 3 If the report/document contains prompts, you provide answers to the prompts before the report/document is run. For steps to answer prompts, see Answering prompted reports/documents, page 28. 26 Running reports and viewing details © 2013 MicroStrategy, Inc. MicroStrategy Office User Guide Getting Started with MicroStrategy Office 1 4 A progress dialog box opens, showing you which reports and documents are being run, when they are run, their report format, ID, and other details, as shown in the example below: The Fetch Progress bars at the bottom show what percentage of each page in the report is displayed. (If the Fetch Progress bars are not displayed, click Fetch Details to show them.) 5 Once they are all run, the reports and documents are placed in your worksheet, presentation, or Word document. Depending on your preferences, the reports and documents may be placed in separate Excel worksheets or PowerPoint presentation slides. For steps to select a display type in which to run reports, control when and which pages of a report are run, create on-the-fly ad-hoc reports, and so on, see Formatting and Displaying Reports and Documents. You can view details about the reports contained in the workbook, presentation, or Word document. For steps, see Viewing details about reports after they have been executed, page 35. Executing a report/document as a PDF You can run a report/document and display it as an Adobe PDF. This provides a report/document in a format that makes it ideal for distributing to customers or other end users who do not need to interact with the data. © 2013 MicroStrategy, Inc. Running reports and viewing details 27 1 Getting Started with MicroStrategy Office MicroStrategy Office User Guide If a report or document is run as a PDF, the data in the PDF does not allow interaction, and the data in the PDF cannot be refreshed. PDFs are not displayed in your MicroStrategy Office report list. To run a report or document and view it as a PDF 1 On the MicroStrategy tab, click Office and log into a project. 2 Navigate to the report you want to run, right-click, and select Run report to PDF. A progress dialog box tracks the progress of the execution of the report or document. • If the report or document was designed to contain prompts, you may be required to provide answers to questions before the report/ document is run. For details on answering prompts, see Answering prompted reports/documents, page 28. 3 The report or document opens in a PDF reader. The report or document can now be saved or distributed. Answering prompted reports/documents Some of the reports and documents you add into your Microsoft products may require you to answer prompts before they are run. A prompt is a question presented to the user who runs the report/document. Depending on the answers that you provide, the report/document returns and displays different data from the data source. For detailed descriptions, images, and examples of the different types of prompts, see the MicroStrategy Basic Reporting Guide. You answer prompts in different ways depending on the specific type of prompt within the report or document. For example, you run a report called Departures by Region - Monthly Trend, into a PowerPoint presentation. The 28 Running reports and viewing details © 2013 MicroStrategy, Inc. MicroStrategy Office User Guide Getting Started with MicroStrategy Office 1 report was designed to contain a prompt, which requires you to select the year for which you want to see report data, as shown in the image below. For steps to answer each type of prompt, see the MicroStrategy Basic Reporting Guide. For steps to change a prompt’s appearance, see Choosing a display style for prompts, page 79. Reusing and sharing prompt answers If you intend to analyze the same sets of data in prompted reports every time you refresh them, you can have the system automatically reuse your prompt answers during the refresh. For example, you add several prompted reports to an Excel workbook. After you answer each report’s prompts, the reports are displayed in the workbook. In an hour, you want to refresh the reports in the workbook so that you are presented with the most updated data from the warehouse. Before you refresh the reports, you can choose to save your prompt answers so that you do not have to answer the prompts for each report again. You can also share prompt answers among the different reports in your workbook, presentation, or Word document. When you share prompt answers, prompt answers are automatically provided for common prompts © 2013 MicroStrategy, Inc. Running reports and viewing details 29 1 Getting Started with MicroStrategy Office MicroStrategy Office User Guide among reports executed at the same time. The answers you select for the first report are applied to any remaining prompted reports when you are running multiple reports. For example, you run three prompted reports in a PowerPoint presentation. If you have not specified to reuse or share prompt answers, each report prompts you to select a month and region to determine which data is displayed on the report. Since the reports contain prompts that have common questions, the prompt answers from the first report can be applied to the other reports the next time you refresh them. You answer the prompts for the first report, but are not prompted for the other reports. answers are only reused while the Microsoft product remains Prompt open. If you close the Microsoft Office product in which you are working, then reopen it later and refresh a prompted report, you are required to answer prompts before the report is refreshed. To re-use or share prompt answers 1 On the MicroStrategy tab, click Options. The Options dialog box opens. 2 Under the General folder, expand the Prompt folder. 3 Do one of the following: • To re-use prompt answers, select the Reuse prompt answers check box. You are only prompted for the reports once during the session when executing and later refreshing multiple reports. • To share prompt answers, clear the Reuse prompt answers check box. Then, select the Share prompt answers check box. Prompt answers are automatically provided for prompts that are common across multiple reports and documents and which are executed or refreshed at the same time. 4 You can ensure that each prompted report is answered with the default prompt answers provided by the report’s designer, by selecting the Always use default answer check box. Not all prompts are designed to have a default answer. 5 Click OK. 30 Running reports and viewing details © 2013 MicroStrategy, Inc. MicroStrategy Office User Guide Getting Started with MicroStrategy Office 1 Clearing saved prompt answers After you have reused prompt answers in reports, you can clear these prompt answers from MicroStrategy Office. When you clear a prompt answer, it is no longer applied to prompted reports in MicroStrategy Office. For example, you select Reuse prompt answers from the MicroStrategy Office Options dialog box, run a prompted report, and provide the Year 2005 as one prompt answer and the Northeast region as another prompt answer. MicroStrategy Office keeps track of these prompt answers and displays them. The prompt answers you delete will not be reused in any prompted reports you run in the future. To clear saved prompt answers 1 On the MicroStrategy tab, click Office and log into a project. 2 From the Workbook, Presentation, or Document menu (depending on your Microsoft Office product), select Clear Saved Prompt Answers. The Clear Saved Prompt Answers dialog box opens. 3 From the list of saved prompt answers, select the check boxes of the prompt answers you want to delete, and click Clear Selected. • To delete all prompt answers from the list, select Clear All. 4 Click Close. Storing reports and viewing stored reports: History List The History List is a folder where the system stores report and document results for future reference. Each user has their own History List. The History List folder is on the left when you open MicroStrategy Office. (To display the History List folder, from MicroStrategy Office select View, then History List.) You can send individual reports/documents to the History List when they are executed. This can be a convenient way to execute large reports/documents, allowing the system to complete the execution and store the report while you move on to other tasks and view the report/document later. For steps, see To send an individual report or document to the History List, page 32. © 2013 MicroStrategy, Inc. Running reports and viewing details 31 1 Getting Started with MicroStrategy Office MicroStrategy Office User Guide MicroStrategy Office can automatically send all reports/documents to the History List. For steps, see To automatically send all reports/documents to the History List or display unread messages, page 32. Once a report or document has been sent to the History List, it is stored as a message. You can rename, delete, and mark History List messages as read or unread. You can configure your History List to only display unread History List messages. This can be useful if your History List becomes filled with old messages that you no longer need. To send an individual report or document to the History List 1 On the MicroStrategy tab, click Office and log into a project. 2 Right-click the report or document and select Run report to History List. A dialog box opens that displays the progress of the report as it is being executed. When the report or document has executed, the progress dialog box closes. The report or document is now stored in your History List folder. To automatically send all reports/documents to the History List or display unread messages 1 On the MicroStrategy tab, click Options. The Options dialog box opens. 2 Under the General folder, select History List. 3 Select from the following: • Select Automatically send reports and documents to History List during execution. • Select Show only unread History List items. 4 Click OK. 32 Running reports and viewing details © 2013 MicroStrategy, Inc. MicroStrategy Office User Guide Getting Started with MicroStrategy Office 1 Renaming History List messages for prompted reports/ documents If you are sending a prompted report or document to your History List folder, the report can be renamed at the same time that you answer the prompt. When you run a prompted report/document and you have allowed History List message renaming, the prompt includes a Report Message Name field at the bottom of the prompt screen: You can type a new name for the report/document in the Report Message Name field, and that name is used when the report is displayed in your History List. Use the steps below to make the Report Message Name field available in prompts, for prompted reports and documents. You can also rename a non-prompted report or document. You do this within the History List after the report/document is executed. © 2013 MicroStrategy, Inc. Running reports and viewing details 33 1 Getting Started with MicroStrategy Office MicroStrategy Office User Guide To enable renaming of History List messages in a prompted report/document 1 On the MicroStrategy tab, click Options. The Options dialog box opens. 2 Under General, select Prompt. 3 Select Allow renaming of the report/message from the prompt. Selected by default. 4 Click OK. Publishing Intelligent Cubes using MicroStrategy Office A MicroStrategy Intelligent Cube is a collection of metrics, attributes, and other data that can be accessed when a report/document is executed, and the data can be shared across multiple reports. If an Intelligent Cube contains all of the information required for a report, the report executes against the Intelligent Cube instead of executing against your data warehouse. For more information about Intelligent Cubes, see the MicroStrategy OLAP Services Guide. When you publish an Intelligent Cube with MicroStrategy Office, you make the Intelligent Cube available for use as a data source by reports/documents. Once an Intelligent Cube has been published using MicroStrategy Office, it is displayed in your list of MicroStrategy Office reports and documents. From there, it can be refreshed in the same way as a report or document. Prerequisite • To publish an Intelligent Cube, you must have the Web Execute Cube Report privilege in MicroStrategy. To publish an Intelligent Cube in MicroStrategy Office 1 On the MicroStrategy tab, click Office and log into the project that contains the Intelligent Cube that you want to publish. 2 From the View menu, select My Reports, Shared Reports, or Current Folder. 34 Running reports and viewing details © 2013 MicroStrategy, Inc. MicroStrategy Office User Guide Getting Started with MicroStrategy Office 1 3 Select one or more Intelligent Cubes from the reports list. 4 From the Reports menu, select Run Report. A progress dialog box opens, showing you which Intelligent Cube is being published, when it is run, and other details. 5 When the Intelligent Cube has been published, the progress dialog box closes. The Intelligent Cube can now be found in the MicroStrategy Office reports folder. Viewing details about reports after they have been executed You can see information about reports and documents that have been executed in MicroStrategy Office. For example, you can see the last time a report was updated by MicroStrategy Office; the specific slide number where a document is displayed in PowerPoint; whether a report will be displayed as a grid, a chart, or a PivotTable; details about the cell in which a report is displayed in Excel; and so on. For steps, see Viewing details about reports and documents, page 35. If you are running Microsoft Office 2010 or later, you can view various details about MicroStrategy Office and the MicroStrategy objects in a workbook, presentation, or document using Microsoft Office Backstage view. Microsoft Office Backstage view displays the version of MicroStrategy Office that is currently installed; the number of reports in the workbook, presentation, or document; when the workbook, presentation, or document was last updated; and other details. For information, see Viewing details in Microsoft Office 2010 and later: Backstage view, page 37. Viewing details about reports and documents You can see information about reports and documents that have been executed in MicroStrategy Office. To have these details displayed alongside reports/documents after they are run, see Displaying last update, filter, and other details next to the report, page 86. © 2013 MicroStrategy, Inc. Running reports and viewing details 35 1 Getting Started with MicroStrategy Office MicroStrategy Office User Guide To view details about reports and documents 1 From the MicroStrategy tab, click Reports. The MicroStrategy Office Reports dialog box opens. The following information is displayed, depending on the Microsoft Office product you access it from: • Displayed in Microsoft Word, Excel, and PowerPoint: Page/Layout: For reports that use the page-by feature, displays the current page-by attribute. For documents that use multiple layouts, displays the current layout. Rows: Number of rows displayed in the report. Columns: The number of columns displayed in the report. • Report Name: Name of the MicroStrategy report/document. Display Type: Display type of the report (for example, grid, chart, or PivotTable). Formatted: Whether formatting from the MicroStrategy report definition was applied. Last Updated: Date and time the report was last updated by MicroStrategy Office. Project Source: Project source used when the report/document was last executed. Project: MicroStrategy project that contains the report/document. Server: Intelligence Server used when the report/document was last executed. Login ID: Login ID used to connect to the project when the report was last executed. This is blank if the Persist Login ID option is not enabled. Authentication Mode: Authentication mode that was used to connect to the project when the report was last executed. Displayed in Excel only: Cell: Upper left cell where the report is displayed (A1 format). 36 Running reports and viewing details © 2013 MicroStrategy, Inc. MicroStrategy Office User Guide • 1 Worksheet: Name of the Excel worksheet where the report is displayed. Displayed in PowerPoint only: • Getting Started with MicroStrategy Office Slide ID: PowerPoint slide ID of the slide where the report is displayed. Displayed in Word only: Block Viewing details in Microsoft Office 2010 and later: Backstage view If you are running Microsoft Office 2010 or later, you can view various details about MicroStrategy Office and the MicroStrategy objects in a workbook, presentation, or document using Microsoft Office Backstage view. Microsoft Office Backstage view displays the version of MicroStrategy Office that is currently installed, the number of reports in the workbook, presentation, or document, when the workbook, presentation, or document was last updated, and many other details. For information about accessing Backstage view or modifying Backstage view settings, see your Microsoft Office documentation. Backstage view also allows you to access information about the reports and documents in the current workbook, presentation, or document if the current workbook, presentation, or document contains any MicroStrategy reports or documents. To do this, click Reports. For details about the information contained in the MicroStrategy Office Reports dialog box, see Viewing details about reports after they have been executed, page 35. Refreshing reports to retrieve the latest data You can refresh the reports and documents in your workbooks, presentations, or Word documents to retrieve the most updated data available from your data warehouse or other data sources. For example, you can email a presentation to colleagues so they can review it. If they have MicroStrategy Office installed on their computer, they can also refresh the report to see the latest data. The refresh functionality can be used by business analysts who receive an Excel workbook, PowerPoint © 2013 MicroStrategy, Inc. Refreshing reports to retrieve the latest data 37 1 Getting Started with MicroStrategy Office MicroStrategy Office User Guide presentation, or Word document, as well as designers who create the workbooks, presentations, and Word documents. When you work with MicroStrategy reports and documents within your Microsoft products, you are connected to the MicroStrategy platform through MicroStrategy Office. Reports and documents added to a Microsoft product remain linked to the data sources that contain their related business data. In MicroStrategy Office, this link is called persistence. Persistence ensures that the reports and documents maintain a link to the data warehouse; this, in turn, allows you to refresh the data in workbooks, presentations, and Word documents. persistence is not enabled, you and other users cannot refresh Ifreports within the workbook, presentation, or Word document. To set refresh options, see Determining if and how report data is refreshed, page 179. For example, you run several reports into a Microsoft PowerPoint presentation. In a few months, you open the presentation, log in to MicroStrategy using MicroStrategy Office, and refresh the data within the reports. The most current report data is gathered from data sources and updated in your reports in the PowerPoint presentation. Data is refreshed because a link from your data sources is persisted in your PowerPoint presentation. MicroStrategy offers a feature that allows you to clear data from a report so that you can safely share the report with other users; the data in the report is re-populated when other users log in, thus ensuring that those other users only see data they are allowed to see. If you clear the data from a report and save it, the next time you log in and open the workbook or presentation, the reports are automatically refreshed with the most updated business data. To clear data, see Clearing report and document data to control user access, page 178. Information related to each report in the workbook, presentation, or Word document is also persisted so that the report or document retains its original formatting and behavior after it is refreshed. Persisted report options include the project source name, project name, and authentication mode used when the report or document was initially run. A report or document’s display options are saved on the MicroStrategy Intelligence Server. For more information about persisted report options, see Determining if and how report data is refreshed, page 179. • For steps to refresh all the reports/documents in your workbook, presentation, or Word document, see Refreshing all reports and documents, page 39. 38 Refreshing reports to retrieve the latest data © 2013 MicroStrategy, Inc. MicroStrategy Office User Guide 1 Getting Started with MicroStrategy Office • To refresh specific reports and documents in your workbook, presentation, or Word document, see Refreshing specific reports and documents, page 39. • For options to refresh large reports and documents that contain multiple layouts, page-bys, or group-bys, see Refreshing large reports with layouts, page-bys, or group-bys, page 40. • To determine when reports/documents are refreshed, see Determining when reports and documents are refreshed, page 43. • To determine the order in which reports/documents are refreshed, see Determining the order in which reports are refreshed, page 44. Refreshing all reports and documents Use the following steps to refresh the business data in all the reports and documents in your Microsoft product. To refresh all reports and documents in a workbook, presentation, or Word document 1 Open the workbook, presentation, or Word document that contains the reports and documents you want to refresh. 2 On the MicroStrategy tab, click the top of the Refresh icon. A progress dialog box is displayed, showing you which reports are being refreshed. The reports and documents are refreshed with the latest data from the data warehouse or other data sources. 3 If the report or document contains prompts, you are prompted to answer them. For details to answer prompts, see the Basic Reporting Guide. Refreshing specific reports and documents You can select specific reports to refresh, to update the data of those reports. © 2013 MicroStrategy, Inc. Refreshing reports to retrieve the latest data 39 1 Getting Started with MicroStrategy Office MicroStrategy Office User Guide To refresh specific reports and documents in a workbook, presentation, or Word document 1 Open the workbook, presentation, or Word document that contains the reports and documents you want to refresh. 2 On the MicroStrategy tab, click Reports. The Reports dialog box opens. 3 Right-click the report to refresh. To refresh multiple reports, press CTRL to select them and then right-click. 4 Select Refresh Report. A progress dialog box is displayed, showing you which reports are being refreshed. The reports and documents are refreshed with the latest data from the data warehouse or other data sources. 5 If the report or document contains prompts, you are prompted to answer them. For details to answer prompts, see the Basic Reporting Guide. You can modify how and when individual reports are refreshed, as described in Determining if and how report data is refreshed, page 179. Refreshing large reports with layouts, page-bys, or group-bys Refreshing large reports or documents takes longer than refreshing reports that contain less data, because the data must be returned from the data warehouse before it is updated in the report or document. To help reduce the amount of time required to refresh a report or document, you can control what data is refreshed. Many large reports/documents are designed with separate layouts, page-bys, or group-bys to chunk the data into manageable pieces. Separate steps are below depending on whether you are refreshing a report/document containing layouts, page-bys, group-bys, or you want to refresh using incremental fetch features for any large reports/documents. Determining which layouts to refresh If a Report Services document is designed with multiple layouts, you can control which layouts are refreshed. You can refresh only the currently 40 Refreshing reports to retrieve the latest data © 2013 MicroStrategy, Inc. MicroStrategy Office User Guide Getting Started with MicroStrategy Office 1 displayed layouts, refresh all layouts, or prompt the user to select the layouts that will be refreshed. By default, only the currently displayed layouts are refreshed. To determine which layouts to refresh 1 On the MicroStrategy tab, click Options. The Options dialog box opens. 2 Under General, expand Document and select Layout. 3 Select one of the following options: • Select Refresh currently displayed layouts to only refresh the layouts that are currently displayed. • Select Refresh all layouts to refresh all layouts in the document. • Select Prompt to select layouts to ask the user which layouts to refresh. 4 Click OK. Determining which group-bys to refresh If a Report Services document is designed to separate groups of data using group-bys, you can control which group-bys are refreshed. You can refresh the currently displayed group, or refresh all groups. By default, only the currently displayed group is refreshed. To determine which group-bys to refresh 1 On the MicroStrategy tab, click Options. The Options dialog box opens. 2 Under General, select Document. 3 In the Group-by Refresh area, select one of the following options: • Select Refresh current groups to refresh only the currently displayed groups. • Select Refresh all groups to refresh all groups. 4 Click OK. © 2013 MicroStrategy, Inc. Refreshing reports to retrieve the latest data 41 1 Getting Started with MicroStrategy Office MicroStrategy Office User Guide Determining which pages in a page-by to refresh If a Report Services document is designed to separate data into pages using the page-by feature, you can control how data contained in page-bys is refreshed. You can refresh the page that is currently displayed, refresh all pages, or prompt users to select the pages to refresh. To determine which page-bys to refresh 1 On the MicroStrategy tab, click Options. The Options dialog box opens. 2 Under General, select Page-by. 3 In the Page Refresh area, select one of the following options: • Select Refresh currently displayed pages to refresh the data on the pages that are currently displayed. • Select Refresh all pages to refresh all pages in the report or document. • Select Prompt to select pages to ask the user to select the pages to refresh. 4 Click OK. Refreshing other large reports You can use incremental fetch options to refresh any reports. For an introduction to incremental fetch, see Controlling how much data is retrieved and displayed, page 72. To configure how large amounts of data are returned when refreshing 1 On the MicroStrategy tab, click Options. The Options dialog box opens. 2 Under the General folder, select Incremental Fetch. 42 Refreshing reports to retrieve the latest data © 2013 MicroStrategy, Inc. MicroStrategy Office User Guide Getting Started with MicroStrategy Office 1 3 In the Incremental Fetch Refresh area, select the type of incremental fetch to use when refreshing reports/documents: • Smart fetch: Fetching automatically continues until the complete result has been retrieved or the user cancels fetching. Selected by default. • Manual fetch: Following each successful fetch, the user manually confirms that he wants to fetch the next incremental result or stop fetching data. 4 Click OK. Determining when reports and documents are refreshed You can enable MicroStrategy Office to automatically refresh all reports/ documents when the workbook, presentation or Word document is opened. Alternatively, you can manually refresh them. If MicroStrategy Office is configured to automatically refresh reports/ documents, you can also configure Office to prompt the user before refreshing the report/document. This allows the user to cancel the refresh for any report/document that would otherwise be refreshed automatically. To configure automatic report/document refresh 1 On the MicroStrategy tab, click Options. The Options dialog box opens. 2 Under the General folder, in the Refresh area, select one or both of the following: • To automatically refresh reports and documents with a workbook, presentation, or Word document open, select the Refresh reports when documents are opened check box. Cleared by default. • To ask users to confirm that they want to refresh a report/document before it is refreshed automatically, select the Ask before refreshing check box. Selected by default. 3 Click OK. © 2013 MicroStrategy, Inc. Refreshing reports to retrieve the latest data 43 1 Getting Started with MicroStrategy Office MicroStrategy Office User Guide Determining the order in which reports are refreshed Once reports are run in a workbook, presentation, or Word document, you can determine the order in which those reports are refreshed. This is convenient if you want certain prompted reports to be presented to users before others. You determine the order of how reports are refreshed by assigning a rank to each report. You can rank reports with positive values, negative values, or a value of zero. The following list describes the behavior for the different values you can use to rank a report. • Rank 0 is an unordered report. This is the default rank for a report. Reports that are not assigned a rank are run in the order in which they appear in the workbook, presentation, or Word document. • Ranks greater than 0 are executed before unordered reports. Reports are executed in ascending order. For example, a report ranked 1 is executed before a report ranked 3. • Ranks less than 0 are executed after unordered reports. Lower (absolute value) ranks are executed before higher (absolute value) ranks. For example, a report ranked -1 (absolute value 1) is executed before a report ranked -4 (absolute value 4). • If multiple reports have the same rank, they are executed in the order of their respective last update time. Reports with the most recent update times are executed last; reports with the oldest update times are executed first. For example, the following ranked reports are listed in order from first refreshed to last refreshed: Rank 1, Rank 17, Rank 0 (Last Update 8:30AM), Rank 0 (Last Update 10:15 AM), Rank -12, Rank -83. To determine the order in which reports are refreshed 1 Open a workbook, presentation, or Word document that contains at least one report. 2 On the MicroStrategy tab, click Reports. The Reports dialog box opens. 3 Right-click the report to be refreshed before all others and select Properties. The Report Properties dialog box opens. 44 Refreshing reports to retrieve the latest data © 2013 MicroStrategy, Inc. MicroStrategy Office User Guide Getting Started with MicroStrategy Office 1 4 In the Report Settings area, in the Rank field, enter the number 1 to specify that the report is the first report that should be refreshed. 5 If desired, rank the other reports in the workbook, presentation, or Word document by repeating the step above. See the description above for the ranks you can enter, and how they will affect when reports are refreshed. 6 Click OK. Deleting reports from workbooks, presentations, and Word documents Once reports/documents are run in your Excel workbook, PowerPoint presentation, or Word document, you can delete them individually or all at once. In Microsoft PowerPoint and Word you can permanently delete a report or document, as well as the connection, by selecting and deleting it. In Microsoft Excel, because of the connection to the data source, you cannot permanently delete a report by simply deleting it. The reports reappear when they are refreshed. Use the steps below to permanently delete a report or document from Excel, and remove the connection that exists between the report and MicroStrategy. The steps below can also be used to delete a report from PowerPoint and Word. Alternatively, you can clear report data from your workbooks, presentations, and Word documents without permanently deleting the connection between the report and MicroStrategy. Clearing data allows you to distribute the file to others as a blank workbook, presentation, or Word document. When other users open the file, they must log in to MicroStrategy before they can see any data. For details, see Clearing report and document data to control user access, page 178. To delete reports from workbooks, presentations, and Word documents 1 Open the workbook, presentation, or Word document that contains the report(s) you want to delete. © 2013 MicroStrategy, Inc. Deleting reports from workbooks, presentations, and Word documents 45 1 Getting Started with MicroStrategy Office MicroStrategy Office User Guide 2 On the MicroStrategy tab, click Reports. The Reports dialog box opens, displaying a list of all the reports currently in your workbook, presentation, or Word document. 3 Select the report to delete. Press CTRL and click to select multiple reports. 4 Right-click the report(s) and select Delete. The report(s) are permanently deleted from the workbook, presentation, or Word document. worksheets, slides, or Word document pages that contained Any the reports are not deleted automatically; if you want to delete a worksheet, slide, or Word document, you must manually delete these from your Microsoft product. 46 Deleting reports from workbooks, presentations, and Word documents © 2013 MicroStrategy, Inc. 2 2. FORMATTING AND DISPLAYING REPORTS AND DOCUMENTS Introduction This section provides information on different ways in which you can run reports and documents in your Microsoft Excel workbooks, PowerPoint presentations, and Word documents, such as placing certain data on separate pages, hiding document sections, displaying report details alongside the report, and so on. It also provides steps to format reports and documents, and to determine which formatting will be displayed. Steps are also provided to assign default responses to a variety of messages that may be displayed in MicroStrategy Office. This section includes the following information: • Formatting reports and documents added to Microsoft, page 48 to determine formatting such as colors and style. • Determining report and document display in Microsoft, page 58 to determine report and document location and size. © 2013 MicroStrategy, Inc. 47 2 Formatting and Displaying Reports and Documents MicroStrategy Office User Guide Formatting reports and documents added to Microsoft You can format reports and documents in the process of building an Excel workbook, PowerPoint presentation, or Word document. Formatting includes determining colors, styles, and so on. For example, if you are creating a dashboard or scorecard-style workbook to distribute to others, you may want to format the colors and design of grid reports so the reports present a consistent look and feel. Use the steps below to specify how all reports/documents will be displayed when they first appear in your Microsoft product. After reports and documents are run in the workbook, presentation, or Word document, you can select specific reports/documents to format, and apply a wide range of formatting options. For steps, see Formatting individual reports/documents after they are run, page 54. Specifying formatting for reports/documents before they are run You can specify certain aspects of how reports are formatted in your Excel workbook, PowerPoint presentation, or Word document before you run them. For example, you can ensure that a border is added around the results of every grid report. Formatting settings applied before reports are run, are applied to all reports that you run after you modify the settings. Use the steps below to format reports before they are run in your workbook, presentation, or Word document. These settings apply to grid reports, graph reports, and grid or graph reports within HTML documents. They do not apply to Report Services documents. To format reports and documents before they are run 1 On the MicroStrategy tab, click Options. The Options dialog box opens. 48 Formatting reports and documents added to Microsoft © 2013 MicroStrategy, Inc. MicroStrategy Office User Guide 2 Formatting and Displaying Reports and Documents To format grid reports a Under the General folder, expand the Grid folder. b To determine where totals are displayed on outline-style reports, select Layout. In the Outline area, select from the following: c Office Style displays totals in a separate row (selected by default). Web Style displays totals with the first subtotal combined with the first row of each group. If the first subtotal is not Sum, the subtotal name is displayed in parenthesis. This option is not available in Office 2000. Auto Outline reports with subtotals: If selected, Auto Outline is applied to grid reports that contain subtotals. Auto Outline allows dynamic expansion and contraction of rows. Cleared by default. To define how row and column headings are laid out, in the Report Headers area, select from the following: Office Style: If selected, an extra row is inserted to accommodate overlapping header titles. Selected by default. Web Style: If selected, an extra column is inserted to accommodate overlapping header titles. Developer Style: If selected, an extra row and an extra column are inserted to accommodate overlapping header titles. Compact: If selected, overlapping header titles are eliminated from the grid. If an overlapping title is Metrics, it is removed. If Metrics is not one of the overlapping titles, the row title is eliminated. d To determine column/row sizing, in the Column/Row Size folder, in the Column Width area, select from the following: For reports that contain column width information: – Apply column widths: Column widths from the report’s definition are applied. Selected by default. – AutoFit columns: Column widths from the report’s definition are ignored and columns are automatically sized to fit their contents. Text wrap settings are ignored. – Default: Results are displayed in columns without modifying width. © 2013 MicroStrategy, Inc. Formatting reports and documents added to Microsoft 49 2 Formatting and Displaying Reports and Documents MicroStrategy Office User Guide For reports that do not contain column width information: – AutoFit columns: Column widths are automatically sized to fit their contents. Text wrap settings are ignored. Selected by default. For reports that contain row height information, in the Row Height area select from the following: – Apply row heights: Row heights from the report’s definition are applied. Selected by default. – AutoFit rows: Row heights from the report’s definition are ignored and rows are automatically sized to fit their contents. – Default: Results are displayed in rows without modifying height. For reports that do not contain row height information: – AutoFit rows: Row heights from the report’s definition are ignored and rows are automatically sized to fit their contents. Selected by default. e For PowerPoint and Word: In the Scale folder for each product, you can select Don’t exceed slide (or page) dimensions n%, which determines the maximum size of reports as a percentage of their size. By default, set to 100%; range 10-500%. f By default, the formatting from the MicroStrategy report definition is applied to the report. To determine whether the report’s original formatting is used, in the Grid folder, select Formatting, then select or clear the Apply formatting from report definition check box. If you clear this check box, reports are displayed in a plain text format when they are executed. Selected by default. Apply formatting from report definition on refresh: If selected, default report formatting is not applied when reports are refreshed, allowing any modifications made in Microsoft Office to remain. Selected by default. g In the Formats to Apply area, enable or disable specific aspects of MicroStrategy formatting. For example, you can ensure that MicroStrategy currency formats in the reports are displayed, but not colors and fonts. All of these options are selected by default. h If you are running grid reports into Excel workbooks and you want to perform calculations on that data using Excel functionality, you must 50 Formatting reports and documents added to Microsoft © 2013 MicroStrategy, Inc. MicroStrategy Office User Guide Formatting and Displaying Reports and Documents 2 properly format the information. Select Apply date/time cell formatting semantics to date/time values. Cleared by default. i You can determine whether styles are shared across reports in your Microsoft Office product. In the Grid folder, select Styles, then select from the following: Share all styles: Excel styles are shared by all reports in the workbook. Minimizes the number of styles used, thus potentially allowing more reports to be displayed. Selected by default. Share styles per report: Excel styles are shared only by pages and fetches of a single report in a workbook. Share styles by group: Excel styles are shared by all reports in the workbook using the same group name. To format graph (chart) reports a Under the General folder, expand the Chart folder. b In the Default Chart Type area, you can select from the drop-down menu to set the default chart type. This is useful when a report definition does not contain a chart type or if there is no equivalent Microsoft chart type. c In the Chart Refresh area, to use chart options from the report’s definition to format the chart when refreshed, select Apply formatting from report definition on refresh. If cleared, refreshing updates the source data but retains any changes applied to the chart in Microsoft. Cleared by default. In the Chart Display area: d To display charts as static images rather than live charts, select Display charts as images. This is useful for charts not supported by Microsoft; to restrict user ability to modify a chart; or to match a chart exactly. Cleared by default. For details about adding charts as static images, see Adding graph reports as static images, page 183. e Create 2D chart if chart contains a secondary axis: 3D charts defined with primary and secondary axes are displayed as 2D so both axes can be shown. (Microsoft does not support secondary axes in 2D charts.) If cleared, the chart is displayed as 2D but the secondary axis is removed. Selected by default. f Display footnotes in graph title: Shows any footnotes within the graph title. © 2013 MicroStrategy, Inc. Formatting reports and documents added to Microsoft 51 2 Formatting and Displaying Reports and Documents MicroStrategy Office User Guide In the Data Table area: g Show data table: Values for each data series are displayed below the chart. Not applied to pie, xy (scatter), doughnut, bubble, radar, or surface charts. Cleared by default. Show legend key: If Show data table is selected, this option is available. If selected, legend keys are displayed next to the series label in the data table. Selected by default. h To determine scaling in PowerPoint, Word, and Excel, select the appropriate Microsoft product folder, expand the Scale folder, and in the Chart Scale area, select one of the following: i Percentage of original width x height: Scale non-chart reports by a percentage of their original size as displayed in your Microsoft product. By default, this is selected and set to 100 x 100 pixels; range 0 - 300. Lock aspect ratio: The aspect ratio of non-chart reports is preserved. Selected by default. Fixed width x height: Define explicit width and height for non-chart reports in specified units. By default, set to 400 x 300 pixels; range 0 - 10,000. Recalculate scale on refresh: This option is below the Chart Scale area. Chart sizes are recalculated when refreshing. If cleared, the current size is preserved when refreshing. Selected by default. To set AutoScale options, under the General folder, expand the Chart folder and select Scale: Use the chart definition to define AutoScale: The chart AutoScale in Excel is determined by the setting stored in the report’s definition. Selected by default. Always false: The chart AutoScale is not set. Always true: The chart AutoScale is set. To format Quick Grids A Quick Grid is a report display type in which the report is run as a CSV and imported into Microsoft Excel. a Under the General folder, expand the Quick Grid folder. 52 Formatting reports and documents added to Microsoft © 2013 MicroStrategy, Inc. MicroStrategy Office User Guide 2 Formatting and Displaying Reports and Documents b In the Formatting area, from the drop-down list, select the type of formatting that you want to apply to the Quick Grids. A preview of the formatting appears on the right. c To select which elements of the Quick Grid to apply the formatting to, choose from the following: Select Number to apply the formatting to numbers. Select Font to apply font formatting. Select Alignment to apply alignment formatting. Select Border to apply border formatting. Select Patterns to apply cell pattern formatting. Select Width/Height to apply width and height formatting. d To re-apply formatting automatically to a Quick Grid when the report is refreshed, select Apply formatting on refresh. e To flatten Quick Grid reports, in the Layout area select Flatten Quick Grid reports. When a report is flattened, the results are displayed with all attributes and metrics side-by-side on one axis. f To remove the column in the grid that displays the word “Metrics,” select Remove extra column. To format PivotTables a Under the General folder, select PivotTable. b To configure which columns and rows attributes and metrics appear on, in the Initial Layout area, select one of the following: c Empty: Place no attributes or metrics on any axis. Compact: Place one attribute in a row and all metrics in different columns. Selected by default. Report: Place attributes and metrics in the same position they are in on the report used to create the PivotTable. In the Formatting area, from the drop-down list, select the type of formatting to apply to the PivotTable. Pivot Table Classic is selected by default. A preview of the formatting is displayed. d To display elements that have no data after a refresh, in the Refresh area select the Show items with no data check box. When cleared, elements with no data are hidden. Selected by default. © 2013 MicroStrategy, Inc. Formatting reports and documents added to Microsoft 53 2 Formatting and Displaying Reports and Documents MicroStrategy Office User Guide 2 Click OK. Formatting individual reports/documents after they are run You may want to format one or more specific reports/documents in your workbook, presentation, or Word document. For example, you may want to apply a border to only one of the five reports in your workbook. Formatting applied to reports from within Microsoft Excel, PowerPoint, and Word is saved to the local workbook, presentation, or Word document. The formatting changes are not saved to the original report definitions within MicroStrategy. To save formatting changes to original report definitions, you must make the formatting changes in MicroStrategy Web or Developer. For more information, contact your administrator. To format a grid report, you can use standard Microsoft functionality to format report items to make it easier for users to analyze the data. For example, you might provide a background color to every other row of data, to make a longer report easier to read. To use Microsoft formatting features in Microsoft Excel, PowerPoint, or Word, see your Microsoft documentation. If a report was added as a static image, the report data cannot be formatted. For details, see Checking whether a report is embedded or a static image, page 56. To format specific reports/documents after they are run 1 On the MicroStrategy tab, click Reports to see a list of executed reports. 2 Right-click a report and select Properties. The Report Properties dialog box opens. 3 To see a description of each option, in the Display Settings list, select the name of an option. The description is displayed at the bottom of the dialog box. Certain options are described more fully below: • Apply Border: If True, a border surrounds the entire report. • AutoFit Rows/AutoFit Columns: AutoFit Rows: If True, then if row heights have not been defined for the report, each row is automatically sized to the height of the 54 Formatting reports and documents added to Microsoft © 2013 MicroStrategy, Inc. MicroStrategy Office User Guide Formatting and Displaying Reports and Documents 2 largest item in the row. If False, then if row heights have not been defined for the report, each row uses a default height. • Defined Columns Widths: Specify how to apply the column widths that have been defined for a report. • Apply defined columns widths: Use the defined width for each column. AutoFit columns: Automatically size each column to the width of the largest item in the column. Default: Use the default Excel column widths. Defined Row Heights: • AutoFit Columns: If True, then if column widths have not been defined for the report, each column is automatically sized to the width of the largest item in the column. If False, then if column widths have not been defined for the report, each column uses a default width. For more information about how to modify column sizes, see Resizing grid reports with long column or row names, page 81. Apply defined row heights: Use the defined heights for each row. AutoFit rows: Automatically size each row to the height of the largest item in the row. Default: Use the default Excel row heights. Grid Report Header Option: Specify how the headers for a grid report are displayed. © 2013 MicroStrategy, Inc. Compact: Row and column headers are in the same row. The column headers are in the same column as the row headers, so that there are no empty columns between the row headers and the data. Office: Row and column headers are in separate rows. The column headers are in the same column as the row headers, so that there are no empty columns between the row headers and the data. Web: Row and column headers are in the same row. The column headers are in separate columns from the row headers. Developer: Row and column headers are in separate rows. The column headers are in separate columns from the row headers. Formatting reports and documents added to Microsoft 55 2 Formatting and Displaying Reports and Documents MicroStrategy Office User Guide • Show Attribute Forms: Determines whether attribute forms are displayed on the report. Attribute forms are additional descriptive information about a business attribute. For example, the Customer attribute may have the forms First Name, Last Name, Address, Email Address, and so on. A form is a descriptive category for any data that your organization saves about any of its attributes. • Trim White Space: If True, extra spaces at the beginning and end of the elements are removed. If False, any extra spaces are displayed. 4 To ensure that your formatting changes will not be lost after refreshing a report: • Under the General folder, in the Chart folder, in the Chart Refresh area, clear the Apply formatting from report definition on refresh check box. • Under the General folder, in the Quick Grid folder, in the Quick Grid Options area, select the Apply formatting on refresh check box. 5 On the MicroStrategy tab, click Refresh to apply the changes to the selected report. report options changes require that reports be cleared and Some re-executed to allow the changes to be applied to the report(s). In such cases, a message informs you that the results must be cleared and prompts you to re-execute the reports. Keep this in mind if you are making formatting changes to a workbook, presentation, or Word document that contains many reports, as re-executing multiple large reports may take time. For information on how reports are cleared from workbooks, presentations, and Word documents, see Clearing report and document data to control user access, page 178. The report is cleared, which means it is not displayed, but remains linked to the data warehouse. Checking whether a report is embedded or a static image Reports can be added to Microsoft PowerPoint and Word as static images or embedded Excel workbooks, as explained in Adding reports as static images or embedded Excel workbooks, page 71. If a report was added as a static image, the report data cannot be formatted. The image itself can be formatted using standard Microsoft image formatting features. You can check to see whether a report was added into a PowerPoint presentation or Word document as a static image or an embedded Excel workbook with the following steps. 56 Formatting reports and documents added to Microsoft © 2013 MicroStrategy, Inc. MicroStrategy Office User Guide Formatting and Displaying Reports and Documents 2 To check whether a report is an embedded workbook or static image 1 Open a PowerPoint presentation or Word document that contains the report. 2 Double-click the report: • If nothing happens, the report is a static image. You are automatically redirected to the Microsoft formatting tab for images. You can format the image using standard Microsoft image formatting. You cannot modify individual parts of the report or the data. • If the report changes into an Excel workbook, you can format different cells, modify data, change the name of the report, and so on, using standard Excel features. The image below shows an example of a report added to a PowerPoint presentation as an embedded Excel workbook. Notice that individual cells and rows can be formatted to highlight data, and so on. © 2013 MicroStrategy, Inc. Formatting reports and documents added to Microsoft 57 2 Formatting and Displaying Reports and Documents MicroStrategy Office User Guide When you click outside of the embedded workbook, the report maintains the formatting, but loses the look and feel of an Excel workbook, as shown below. For steps to format objects in Microsoft Word or PowerPoint, see your Microsoft documentation. Determining report and document display in Microsoft You can define several display settings before you execute reports and documents into your Microsoft product. You can determine where reports and documents will appear in your Microsoft product. You can also define what default sizes the reports and documents will be. For details, see Determining location and size before running the report/document, page 59. You can select from several display types to determine what your report looks like and how it functions in your Excel workbook, PowerPoint presentation, or Word document. For steps, see Specifying a display type in which to view reports, page 63. You can also define various display settings after reports and documents are run in your Microsoft product. You can resize reports and documents from within Excel, PowerPoint, or Word, and also relocate reports/documents by moving them. 58 Determining report and document display in Microsoft © 2013 MicroStrategy, Inc. MicroStrategy Office User Guide Formatting and Displaying Reports and Documents 2 Determining location and size before running the report/ document Before you run a report or document, you can decide where the report will be placed in Microsoft Excel or PowerPoint. For example, you can determine whether every report runs on its own worksheet or in a worksheet cell that you select. This option does not apply to Word documents. You can also configure the maximum size of the reports and documents, which determines how many pages of a report’s result set are displayed in your workbook, presentation, or Word document. Configuring the maximum size of reports and documents is useful if you want to ensure all of the rows of a large report are displayed. It is also convenient if you only want to see certain columns and rows of a large report. Some size settings involve determining the size of each fetch of data from your data source. For an introduction to fetching incremental blocks of data, see Controlling how much data is retrieved and displayed, page 72. To determine the placement and size of reports and documents 1 On the MicroStrategy tab, click Options. The Options dialog box opens. 2 Expand the folder of the Microsoft product in which you are working. 3 Select Placement to define how the report or document is placed in the Excel workbook or PowerPoint presentation: • Excel placement settings: In the Single Report Placement area: Place report at selected cell: When executing a single report (or the first report in a group), the result is displayed at the currently selected cell. Place report on a new sheet: The result is placed at cell A1 on a new worksheet. The new worksheet name is based on the Excel name setting. Selected by default. Prompt for placement of report: The user is asked to identify the location worksheet and cell to place the report. In the Multiple Report Placement area: © 2013 MicroStrategy, Inc. Determining report and document display in Microsoft 59 2 Formatting and Displaying Reports and Documents MicroStrategy Office User Guide Place next report below previous n rows: The second and subsequent reports are displayed below a specified number of rows from the previous result. Default is 1 row; range 0-100 rows. Place next report to right of previous n columns: The second and subsequent reports are placed a specified number of columns to the right of the previous result. Default is 1 column; range 0-100 columns. Place next report on a new sheet: Displays second and subsequent reports on a new worksheet. Selected by default. Prompt for placement of next report: The user is asked to identify the location worksheet and cell to place the second and subsequent reports. In the Page-by Placement area: • Place each page as a separate sheet: Each page of a page-by report is placed on a separate worksheet. The worksheet name is based on the Excel name setting. Selected by default. Place each page below previous n rows: Each page of a page-by report is placed on the same worksheet, separated by the specified number of empty rows. Default is 1 row; range 0-100 rows. Prompt for placement of pages: The user is asked to identify the location worksheet and cell to place each page. PowerPoint placement settings: In the Single Report Placement area: Place report on current slide: When executing a single report (or the first report in a group), the result is placed on the currently selected slide. Place report following current slide: When executing a single report (or the first report in a group), the result is placed following the currently selected slide. Selected by default. Place report before current slide: When executing a single report (or the first report in a group), the result is placed before the currently selected slide. Place report at start of presentation: When executing a single report (or the first report in a group), the result is placed at the beginning of the presentation. 60 Determining report and document display in Microsoft © 2013 MicroStrategy, Inc. MicroStrategy Office User Guide Formatting and Displaying Reports and Documents 2 Place report at end of presentation: When executing a single report (or the first report in a group), the result is placed at the end of the presentation. In the Multiple Report Placement area: Place next report on same slide as previous: Displays the second and subsequent reports on the same slide as the previous report. Place next report on a new slide: Displays the second and subsequent reports on a new slide following the previous report. Selected by default. 4 For PowerPoint, select Position, then select from the following: Horizontal: Determines the horizontal position of reports on the slide as an offset from a reference location, in the specified units. Default is 20 points from the top left corner. Vertical: Determines the vertical position of reports on the slide as an offset from a reference location in the specified units. Default is 20 points from the top left corner. Center on slide: Reports are centered on the slide. Cleared by default. Recalculate position on refresh: Reports positions are recalculated when refreshing, based on the report’s properties. If cleared, the report’s current position is preserved. Selected by default. 5 Select Size to define how the report or document is sized in the workbook, presentation, or Word document: In the Result Size Limits area: © 2013 MicroStrategy, Inc. Maximum rows: Specifies the maximum number of rows to display in a report. If the maximum is exceeded, the display can be canceled or allowed to continue. Default: Word and PowerPoint, 50 rows, range 1-65,536 rows; Excel, 1,048,576 rows, range 0-1,048,576 rows. Maximum columns: Specifies the maximum number of columns to display in a report. If the maximum is exceeded, the display can be canceled or allowed to continue. Default: Word and PowerPoint, 15 columns, range 1-256 columns; Excel, 16,384 columns, range 0-16,384 columns. Determining report and document display in Microsoft 61 2 Formatting and Displaying Reports and Documents MicroStrategy Office User Guide Maximum pages: Specifies the maximum number of pages to display in a report. If the maximum is exceeded, the display can be canceled or allowed to continue. Default: Excel and PowerPoint: 256 pages, Word: 100 pages; range 1-1,000 pages. In the Display Size area: Rows (Word and PowerPoint): Specifies the number of rows fetched and displayed in a single block. Default is 50 rows; range 1-1,000 rows. Columns (Word and PowerPoint): Specifies the number of columns fetched and displayed in a single block. Default is 15 columns; range: PowerPoint: 1-256 columns, Word: 1-16,384 columns. In the Flash Size area: Width: Specifies the width in pixels of the Flash Player used to display Flash-enabled MicroStrategy documents. Default: Excel and PowerPoint: 933 pixels, Word: 733 pixels; range: Excel: 100-9,999 pixels, Word and PowerPoint: 100-1,000 pixels. Height: Specifies the height in pixels of the Flash Player used to display Flash-enabled MicroStrategy documents. Default: 667 pixels; range: Excel: 100-9,999 pixels, Word and PowerPoint: 100-1,000 pixels. Fetch results cell size (Excel only): Specifies maximum number of cells of data to be retrieved in the second and subsequent fetches. Default is 30,000 cells; range 1,000-100,000 cells. can specify a default size for MicroStrategy reports run as You charts. To do so, under the General folder, expand the Chart folder and expand the Scale folder. In the Default Chart Scale area, select your Microsoft product and then specify the size of the chart. You can also use the AutoScale option to automatically size the fonts in the charts. For more information, see Creating and Editing Reports and Objects. 6 Click OK. 62 Determining report and document display in Microsoft © 2013 MicroStrategy, Inc. MicroStrategy Office User Guide Formatting and Displaying Reports and Documents 2 Specifying a display type in which to view reports Before you run MicroStrategy reports, you can select from several display types to determine what your report looks like and how it functions in your Excel workbook, PowerPoint presentation, or Word document. For example, you can run a report as a Microsoft Excel PivotTable, which lets you work with the individual rows and data of that table from Excel, PowerPoint, or Word. Or, you can run a report as a Grid and Chart to view both the grid and graph of a report side-by-side, which allows you to change the graph type (to a pie chart, for example) using your Microsoft Office product. In Microsoft, graphs are often referred to as charts. You cannot specify a display type for Report Services documents. When documents are run, they are displayed as they appear in MicroStrategy Developer or MicroStrategy Web. Specifying a display type in which to run specific reports To specify a display type in which to run specific reports 1 On the MicroStrategy tab, click Office, and log into a MicroStrategy project. 2 Navigate to the reports to run in your Microsoft product. 3 Right-click one or more reports and specify a display type in which to run them by selecting Run report to (display type name). The report is run in the selected display type. to Examples of report display types, page 64 for examples Refer of each of these formats and information on how to configure each to accommodate your reporting requirements. You can also change the display type of reports after they are run. For more information, see Formatting individual reports/documents after they are run, page 54. © 2013 MicroStrategy, Inc. Determining report and document display in Microsoft 63 2 Formatting and Displaying Reports and Documents MicroStrategy Office User Guide Setting a default report display type for all reports When you double-click a report, or right-click and select Run Report, the report is run in a default display type. You can specify what this default display type is for all reports that you run. To specify a default report display type 1 On the MicroStrategy tab, click Options. The Options dialog box opens. 2 Expand the General folder. 3 In the Defaults area, to define the default display type for grid reports, from the Default display type drop-down list, select a default report display type. • If you want to ensure that the report display type matches the format in the report definition, select Implicit from the drop-down list. 4 To define the default display type for graph reports, expand the Chart folder. From the Default Chart Type area, select a chart type from the drop-down list. 5 Select the Always apply default chart type check box. 6 Click OK. The change is applied to any reports you run. Examples of report display types You can run a report in several different display types. The display type you select determines how the report looks and the extent to which the report can be formatted, sized, moved, and so on in your Microsoft product. To specify a display type in which to run specific reports, see Specifying a display type in which to view reports, page 63. To specify a default display type for all reports, see Setting a default report display type for all reports, page 64. The following examples show the same report run in different display types. 64 Determining report and document display in Microsoft © 2013 MicroStrategy, Inc. MicroStrategy Office User Guide Formatting and Displaying Reports and Documents 2 • Grid: Report results are displayed in a grid format. This is the same format as grid reports appear in MicroStrategy. • Chart: Report results are displayed as Microsoft Office charts. Select this display type if you are running a MicroStrategy graph report into your workbook, presentation, or Word document. When you run a report in a Chart display type, you can use your Microsoft products to change the © 2013 MicroStrategy, Inc. Determining report and document display in Microsoft 65 2 Formatting and Displaying Reports and Documents MicroStrategy Office User Guide chart type, format the chart’s colors, and change other aspects of the chart. • Grid and Chart: Report results are displayed as both grids and charts on the same page, sheet, or slide. • Implicit: Report results are displayed based on the formatting applied to the report with it was created. Selected by default. • Outline: Report results are displayed with outline options available. This display type is the same as outline mode in MicroStrategy. In the Outline display type, you can show and hide data using the expand and collapse 66 Determining report and document display in Microsoft © 2013 MicroStrategy, Inc. MicroStrategy Office User Guide Formatting and Displaying Reports and Documents 2 buttons on the left. For more information about MicroStrategy outline mode, see the MicroStrategy Basic Reporting Guide. • PivotChart: Report results are displayed in Excel PivotCharts. PivotCharts allow you to change the chart type, format various aspects of © 2013 MicroStrategy, Inc. Determining report and document display in Microsoft 67 2 Formatting and Displaying Reports and Documents MicroStrategy Office User Guide the chart, display and hide data, and so on. For more information about PivotCharts, see your Microsoft documentation. • PivotTable: Report results are displayed in Excel PivotTables. PivotTables are interactive tables that allow you to rotate rows and columns, filter data by displaying different pages, summarize data and totals, and so on. To work with PivotTables, see your Microsoft documentation. 68 Determining report and document display in Microsoft © 2013 MicroStrategy, Inc. MicroStrategy Office User Guide Formatting and Displaying Reports and Documents 2 • PivotTable PivotChart: Report results are displayed in both Excel PivotTables and PivotCharts. For more information about PivotTables and PivotCharts, see your Microsoft documentation. • Flattened: Report results are displayed with all attributes and metrics side-by-side on one axis. Any subtotals within the report are not displayed. Run your report in this display type if you intend to use Excel’s drop-down lists to filter data, hide or show data, and so on. For more information about filtering in Excel, see your Microsoft documentation. • Quick Grid: Report results are displayed in a CSV format. The report is bulk-loaded into Excel, which results in the report being executed quickly. Formatting from the report definition, such as fonts, colors, and thresholds, is not applied. You can format Quick Grids using Microsoft Excel’s AutoFormats. You can also use Excel to analyze, sort, and work with data in the grid. For more information about sorting, filtering, and subtotaling data in Excel, see your Microsoft documentation. For © 2013 MicroStrategy, Inc. Determining report and document display in Microsoft 69 2 Formatting and Displaying Reports and Documents MicroStrategy Office User Guide examples of ways to use Excel to analyze reports, see Example: A dashboard-style Excel workbook, page 109. Displaying multi-layout documents Report Services documents can be designed in MicroStrategy to contain multiple layouts, each layout showing a different set of data. You can determine how multi-layout documents are displayed by MicroStrategy Office. To determine how multi-layout documents are displayed 1 On the MicroStrategy tab, click Options. The Options dialog box opens. 2 Under the General folder, expand Document, and select Layout. 3 Select from the following: • To display documents in the layout that they were created in, select Display default layout. • To display all layouts, select Display all layouts. • To choose, at the time the document executes, what layouts to display, select Prompt to select layouts. 70 Determining report and document display in Microsoft © 2013 MicroStrategy, Inc. MicroStrategy Office User Guide 2 Formatting and Displaying Reports and Documents Adding reports as static images or embedded Excel workbooks You can run reports into your Word documents and PowerPoint presentations as embedded, interactive Excel workbooks. Users can modify the report data and format the report, such as choosing a new graph style or layout of data. When graphs are included as embedded workbooks, users can use Excel to change the graph type, layout, formatting, and so on. This ensures that the graphs are live. Graphs are live by default. You must have Microsoft Excel installed to be able to view and work with report data as embedded workbooks in Word and PowerPoint. You can also run reports into Word and PowerPoint as static images. This is useful if you do not want others to modify data in the report, or convert the report’s data into a PivotChart. For details to run a report into Word or PowerPoint as a static image, see Controlling whether report data can be modified, page 182. Be aware of the following: • Due to Microsoft restrictions when using embedded workbooks, MicroStrategy recommends adding reports as static images. If you use embedded workbooks, it is recommended that you use Microsoft Word or PowerPoint 2000. • You can secure an Excel workbook using standard Microsoft security features. Protecting worksheets using Excel may prevent MicroStrategy Office from refreshing reports within the workbook. To add reports as embedded Excel workbooks in Word or PowerPoint 1 On the MicroStrategy tab, click Options. The Options dialog box opens. 2 Under the General folder, expand the Chart folder. 3 In the Chart Display area, clear the Display charts as images check box. 4 Click OK. Double-click the report in Word or PowerPoint to display the report as an Excel workbook. © 2013 MicroStrategy, Inc. Determining report and document display in Microsoft 71 2 Formatting and Displaying Reports and Documents MicroStrategy Office User Guide Controlling how much data is retrieved and displayed Data can be retrieved from your data warehouse either manually or automatically. By default, MicroStrategy Office automatically fetches the next groups of data (or blocks) without waiting for your input. Automatically fetching data is called smart fetch. Enabling manual fetch is useful if you are executing a large report and want to control when groups of data are retrieved. Large reports can affect the performance of Intelligence Server and Web Services if they are not divided into smaller groups of data before they are displayed. Manual fetch prompts you before each block of data is retrieved. Maximum fetch size is controlled by an Intelligence Server setting. As each report is run, the Execution Status dialog box (shown below) keeps track of what percentage of each report has been run and other details such as when report execution began and ended. data retrieval does not apply to Report Services Incremental documents, data mart reports, or reports executed as Quick Grids, PivotTables, or PivotCharts. For Excel, you can define the number of rows of data to return with each fetch. The number of rows returned in Word and PowerPoint is determined by the display size setting for these products, as described in To determine the placement and size of reports and documents, page 59. If you are using MicroStrategy Office in Excel or Word, you can also determine when the reports are displayed in your workbook or document. By 72 Determining report and document display in Microsoft © 2013 MicroStrategy, Inc. MicroStrategy Office User Guide Formatting and Displaying Reports and Documents 2 default, each report is displayed after it has been executed. You can choose to display all reports in a workbook only after all reports have finished executing. If you are refreshing a report and want to determine how much data is refreshed in large reports, see Refreshing large reports with layouts, page-bys, or group-bys, page 40. To control how much data is retrieved and displayed 1 On the MicroStrategy tab, click Options. The Options dialog box opens. 2 Under the General folder, expand the Incremental fetch folder and choose the type of incremental fetch to use: • Smart fetch: All data is fetched automatically. Selected by default. • Manual fetch: The user is prompted before each block of data is retrieved. • Preview: You can see a preview of report data as it is executing. In the Rows field, specify how many rows of the report you want to preview. Fetching automatically stops after one fetch is retrieved. 3 To define the number of rows returned with each fetch, type a number from 50 to 10,000 in the Rows field. Default is 1,000. 4 To control the number of objects returned when browsing or searching, type the number of objects to be returned in the Fetch objects in groups of n field, in the Folder Display area. This setting can impact performance. Default is 100 objects; range is 10 - 500 objects. Determining what report data is displayed on its own page When MicroStrategy reports are created, report designers often place report objects such as attributes in the page-by fields of the report/document. A report analyst can select objects from the page-by field and display subsets of report results as separate pages. When you run a report/document that contains data in its page-by field into your Microsoft product, by default, MicroStrategy Office prompts you to determine what subsets of the report results should be displayed on separate worksheets, slides, or pages. © 2013 MicroStrategy, Inc. Determining report and document display in Microsoft 73 2 Formatting and Displaying Reports and Documents MicroStrategy Office User Guide In the following example, a Supplier Sell Through Analysis report contains two attributes, Year and Category, within its page-by field. Since the Category attribute is on the page-by field, you can select a different category, such as Electronics, to display data that corresponds to that category. 74 Determining report and document display in Microsoft © 2013 MicroStrategy, Inc. MicroStrategy Office User Guide Formatting and Displaying Reports and Documents 2 When you run this report, the following dialog box is displayed, where you select which data to display on its own worksheet, slide, or Word document page: When you add a subset of data, a check mark is automatically displayed next to it, as shown above. The check mark signifies that the data will be shown on its own worksheet, slide, or page. The following image shows the report above displayed in Excel. The electronics data for 2009 is displayed on one worksheet (shown on the left) © 2013 MicroStrategy, Inc. Determining report and document display in Microsoft 75 2 Formatting and Displaying Reports and Documents MicroStrategy Office User Guide and the electronics data for 2010 is displayed on a separate worksheet (shown on the right). Steps are below to enable the ability to choose which pages/slides/ worksheets to place page-by data on, and to designate which data to display on separate pages/slides/worksheets when you run a report with objects in its page-by field. To enable the ability to choose how page-by data is displayed 1 On the MicroStrategy tab, click Options. The Options dialog box opens. 2 Under the General folder, expand the Page-by folder and select from the following: • Display default page: Only the default page of the report, defined by the report’s designer, is displayed. • Display all pages: All pages of the report are displayed. 76 Determining report and document display in Microsoft © 2013 MicroStrategy, Inc. MicroStrategy Office User Guide • Formatting and Displaying Reports and Documents 2 Prompt to select pages: Before the report is displayed, the user is asked to select which pages of the report to display. Selected by default. 3 Click OK. To determine which page-by data is displayed on its own page/slide/ worksheet 1 On the MicroStrategy tab, click Office and log into a project. 2 Navigate to a MicroStrategy report that contains objects within its page-by field. 3 Determine where each page of the report will be placed within the workbook or presentation by doing one of the following: • To specify page-by placement options for Excel, expand the Excel folder, and then the Placement folder. Select from the Page-by Placement options. For details on each option, see To determine the placement and size of reports and documents, page 59. • To specify page-by placement options for PowerPoint, expand the PowerPoint folder, and then the Placement folder. Select from the Multiple Report Placement options. For details on each option, see To determine the placement and size of reports and documents, page 59. • In Word, each report page is placed within its own document page, by default. 4 Double-click the report to add it to your Microsoft product. The Select Pages for (report name) dialog box opens. 5 From each drop-down list, select the subset data to display on its own page/slide/worksheet. For example, you can select 2004 from the Year drop-down list and Electronics from the Category drop-down list to designate that you want to see 2004 electronics data displayed on its own page. To specify that the data is not shown in your Microsoft product, clear the check box. 6 Once you make your selections, click Add. The subset of data you chose is added to the Select Pages dialog box. If subtotals and totals are available to choose from, you can designate separate pages for those subtotals and totals as well. © 2013 MicroStrategy, Inc. Determining report and document display in Microsoft 77 2 Formatting and Displaying Reports and Documents MicroStrategy Office User Guide 7 If you add more than one subset of data, you can determine whether one set of data is displayed before or after another set. To specify the order of the sets of data, select a set of data and use the up and down arrows appropriately. 8 Once you are finished, click OK to run the report into your workbook, presentation, or Word document. you clear a page-by report from your workbook, presentation, or IfWord document, a placeholder marks the location of the report. This placeholder lists the name of the page-by report so that you know where the report was located before you cleared it. If you do not want placeholders displayed in your file, on the MicroStrategy tab, click Options. Under the General folder, expand the Page-by folder. Clear the Keep placeholder for cleared pages check box. Displaying a page-by header as a title You can display the name of a page-by field above its related report data, as a title. This option applies to all reports and documents with page-bys. To display a page-by header as a title 1 On the MicroStrategy tab, click Options. The Options dialog box opens. 2 Under the General folder, expand Report Detail. 3 In the Page-by Details area, select from the following: • A page-by header displays each attribute of the page-by axis on its own row. To display a page-by header as a title, select the Display page-by header check box. • A compact page-by header displays all page-by header information on a single row. To display a compact page-by header, select both the Display page-by header and Display compact page-by header check boxes. 4 Click OK. 78 Determining report and document display in Microsoft © 2013 MicroStrategy, Inc. MicroStrategy Office User Guide Formatting and Displaying Reports and Documents 2 Choosing a display style for prompts There are two different styles in which prompts can be displayed in MicroStrategy Office. The image of the prompted report in Answering prompted reports/documents, page 28 shows an example of a MicroStrategy Office style of prompt. You can also display prompts in the same style used in MicroStrategy Web, as shown below. To choose a display style for prompts 1 On the MicroStrategy tab, click Options. The Options dialog box opens. 2 Under the General folder, select the Prompt folder, and then choose a style of prompt from the Prompt Style area: • Office style prompts are similar to the prompts used in MicroStrategy Developer. The prompt name and title are displayed, and the prompts are displayed in the order in which they appear in the report definition. Selected by default. • Web style prompts are similar to the prompts used in MicroStrategy Web. Only the prompt titles are displayed, and the prompts are displayed with the required prompts first. © 2013 MicroStrategy, Inc. Determining report and document display in Microsoft 79 2 Formatting and Displaying Reports and Documents MicroStrategy Office User Guide 3 If you want the prompts that require an answer for the report or document to be displayed before prompts that are not required, select Always display required prompts first. Selected by default. 4 Click OK. Resizing reports or documents When a report is run in an Excel workbook, PowerPoint presentation, or Word document, MicroStrategy Office sizes the report/document according to one of the following: • By default, MicroStrategy Office applies the column and row sizes of the MicroStrategy report or document to the executed report. This ensures that the report’s columns and rows match how the report looks in MicroStrategy Developer and Web. In general, this allows reports and documents to be displayed as clearly and effectively as possible. • If MicroStrategy Office size settings were selected, the report or document is displayed according to those settings. For steps to define sizing before a report or document is added to a Microsoft product, see Determining location and size before running the report/document, page 59. You can resize reports and documents after they are added to your workbook, presentation, or Word document. You resize the reports and documents in different ways depending on whether you use Excel, PowerPoint, or Word. See the following sections for steps. Resizing reports and documents in Excel To resize a MicroStrategy report or document within an Excel workbook, use standard Excel functionality to resize columns, rows, or cells. width of columns in an Excel workbook can be affected by the The AutoFit Columns settings in MicroStrategy Office, as explained in Resizing grid reports with long column or row names, page 81. For details to resize and work with worksheet cells in Microsoft Excel, refer to your Microsoft Excel documentation. 80 Determining report and document display in Microsoft © 2013 MicroStrategy, Inc. MicroStrategy Office User Guide Formatting and Displaying Reports and Documents 2 Resizing reports and HTML documents in PowerPoint and Word You can manually resize reports and HTML documents you run in a PowerPoint presentation or Word document using PowerPoint or Word’s resize handles. You can also resize the columns and rows within a report if the report was run as an embedded Excel workbook. To check whether the report was run as an embedded Excel workbook, see Checking whether a report is embedded or a static image, page 56. For steps to resize and work with objects in Microsoft PowerPoint and Word, refer to your Microsoft Office documentation. Resizing grid reports with long column or row names If any of the columns or rows within the grid reports you run are not wide enough or tall enough to fit all of the text or data within the cell, you can resize the columns and rows either manually, or by enabling AutoFit Columns and AutoFit Rows. These options ensure that columns and rows are automatically sized to fit their contents. When a report is run in a workbook, presentation, or Word document, by default MicroStrategy Office applies the column and row sizes of the MicroStrategy report or document. This may result in reports with columns that are too narrow or rows that are too short to fit all of their contents. For example, notice in the image below that some of the column heading names in the report are not fully displayed. © 2013 MicroStrategy, Inc. Determining report and document display in Microsoft 81 2 Formatting and Displaying Reports and Documents MicroStrategy Office User Guide After you enable the AutoFit Columns setting and refresh the report, the columns are automatically resized to fit their contents, as shown in the image below. To ensure that all report columns and/or rows are sized automatically to fit their contents 1 On the MicroStrategy tab, click Options. The Options dialog box opens. 2 Under the General folder, expand Grid, and then expand Column/Row Size. 3 Select any of the following: In the Column Width area: • To automatically size the columns of reports that were defined to have a specific column width, select AutoFit Columns under Reports containing column width information. • To automatically size the columns of reports that were not defined to have a specific column width, select AutoFit Columns under Reports not containing column width information. In the Row Height area: • To automatically size the rows of reports that were defined to have a specific row height, select AutoFit Rows under Reports containing row height information. • To automatically size the rows of reports that were not defined to have a specific row height, select AutoFit Rows under Reports not containing row height information. 4 Click OK. 82 Determining report and document display in Microsoft © 2013 MicroStrategy, Inc. MicroStrategy Office User Guide Formatting and Displaying Reports and Documents 2 Resizing graph fonts automatically If a graph’s font is displayed in an incorrect size, you can have it resized automatically. AutoScale may cause problems in Office documents with Enabling many graphs. When each graph is automatically resized, the font is also automatically resized. If many graphs are used, it is possible to cause an error in your Microsoft application. To automatically resize graph fonts 1 On the MicroStrategy tab, click Options. The Options dialog box opens. 2 Under the General folder, expand Chart. Select Scale. 3 In the AutoScale area, select one of the following: • To use the graph’s AutoScale definition that was defined when the report was created in MicroStrategy Developer or Web, select Use the chart definition to define AutoScale. • To always automatically resize graph fonts, select Always True. • To never adjust font sizes in graphs, and always use the graph font definitions from the report, select Always False. 4 Click OK. Moving reports and documents You can relocate reports and documents in your workbooks, presentations, and Word documents. To relocate reports/documents in Word or PowerPoint, simply cut-paste the report/document to its new location, then refresh the Word document or PowerPoint presentation. © 2013 MicroStrategy, Inc. Determining report and document display in Microsoft 83 2 Formatting and Displaying Reports and Documents MicroStrategy Office User Guide Moving reports and documents in Excel As you design your workbook, you may decide to shift some of the reports and documents to other locations within the workbook. Do not use cut-paste to move reports or documents in Excel. Every report/document you add to your workbook remains linked to your data sources, allowing you to refresh the report and retrieve the latest data. This link exists in the location in which the report/document is executed. If you cut-paste a report/document to a new location and refresh the data, the report/document is run in the original location. Use the following steps to move reports/documents successfully within a workbook. If you have a combination of several reports alongside several graphics in your workbook, see Repositioning reports around graphics in an Excel workbook, page 85 for steps to reposition a report without disturbing the surrounding graphics. To move reports/documents in an Excel workbook 1 On the MicroStrategy tab, click Reports. A list of the reports in the workbook is displayed. 2 Right-click the report you want to move to another location in the workbook, and select Properties. The Report Properties dialog box opens. 3 Navigate to the Excel Placement Settings area and select the Cell preference. 4 In the Cell field, specify the exact cell location to which to move the report/document. Click OK. 5 A message informs you that saving the new location properties requires that the report be cleared from the workbook. The report’s link to its data sources is cleared from the original location. This ensures that the report is not refreshed in both the original and new locations. Click Yes. 6 On the MicroStrategy tab, click Reports. 84 Determining report and document display in Microsoft © 2013 MicroStrategy, Inc. MicroStrategy Office User Guide Formatting and Displaying Reports and Documents 2 7 Right-click the report you want to move to another location in the workbook, and select Refresh Report. The report is refreshed and placed in the new location. Repositioning reports around graphics in an Excel workbook If your Excel workbook contains a combination of graphics and reports, you may need to reposition reports to accommodate the surrounding graphics and vice versa. When you reposition reports, you must first delete the report from the workbook, and then run it in the new location. To reposition a report around graphics in a workbook 1 On the MicroStrategy tab, click Reports. A list of all of the reports in the workbook is displayed. 2 Right-click the report to reposition and select Delete. A message states that you are about to permanently delete the data from the workbook. Click Yes. report is completely deleted from the workbook, which means The it is no longer linked to the data warehouse or other data sources. 3 On the MicroStrategy tab, click Options. The Options dialog box opens. 4 Under the General folder, expand the Excel folder, and then the Placement folder. 5 Ensure that the Place report at selected cell check box is selected, so that you can specify the exact cell in which to place the report. Click OK. 6 In the Excel worksheet, click the cell in which to place the report. 7 On the MicroStrategy tab, click Office. 8 Locate the report to place in the cell and run it. The report is placed within the selected cell. © 2013 MicroStrategy, Inc. Determining report and document display in Microsoft 85 2 Formatting and Displaying Reports and Documents MicroStrategy Office User Guide Clearing data or information in a report/document When you have a report or document in Microsoft Excel, PowerPoint, or Word, you can clear the information from the whole report/document, including data and the information displayed in column and row headers. You can also just clear the data from the report/document. Clearing a report or its data is useful if you run a report/document that contains sensitive or privileged information. You can clear the report or the data before you close the report/document so that no other users can view the information. The report’s information and data are visible again when you, or another user with the right permissions, log back in and refresh the report/document. For steps to clear report column and row header information and to clear metric data, see Clearing report and document data to control user access, page 178. Displaying last update, filter, and other details next to the report Before you run reports and documents in your Excel workbook, PowerPoint presentation, or Word document, you can ensure that each report’s details are displayed alongside the reports. You can display and determine an order for the following report details. An example showing many of these details is displayed below. • Project Header: The heading defined for all reports in the current project. • Export Header: The heading of the current report. Can be displayed simultaneously with the Project Header. • Report Title: The title of the report. • Report Description: The short description of the report. • Report Filter: Any filters used in the report. • Report Limits: Any limits on metrics used in the report. • Fetch Details: Reports that are incrementally fetched may only display partial results. Fetch Details shows the percentage of the report results that are displayed. For details on incrementally fetching data, see Controlling how much data is retrieved and displayed, page 72. 86 Determining report and document display in Microsoft © 2013 MicroStrategy, Inc. MicroStrategy Office User Guide Formatting and Displaying Reports and Documents 2 • Last Update Time: The date the report was last run. • Export Footer: The footer of the current report. Can be displayed simultaneously with the Project Footer. • Project Footer: The footer defined for all reports in the current project. MicroStrategy Office supports auto-text in report details and replaces them with pertinent information when they are displayed in headers and footers. For details about auto-text, see the MicroStrategy Web Help. HTML and images are not supported, and any HTML tags in a header or footer are removed. When enabled, the report details that you select appear next to each report or document in the order that you specify, as shown in the example below: To display last update, filter, and other details next to a report or document 1 On the MicroStrategy tab, click Options. The Options dialog box opens. 2 Under the General folder, expand Report Detail. © 2013 MicroStrategy, Inc. Determining report and document display in Microsoft 87 2 Formatting and Displaying Reports and Documents MicroStrategy Office User Guide 3 Select the Display report details check box. 4 To display the details as a comment in the upper-left hand cell in Excel, select the Display as comments check box. If the check box is cleared, report details are displayed as rows in the resulting grid. you select the Display as comments check box, the report Ifdetails are not displayed in Word or PowerPoint. 5 Enable or disable different types of report details by selecting the check boxes next to the corresponding details. 6 To change the order that details will be displayed, highlight a report detail and use the up and down arrows to change the order. 7 Click OK. Displaying additional grid and column details You can display additional details about each grid report’s grid and column headers. For example, you can specify that any attribute forms and descriptions of attributes and metrics are displayed at the top of each grid report. Displaying attribute forms, and attribute and metric descriptions Attributes are the business concepts reflected in your stored business data in your data source. Attributes provide a context in which to report and analyze business data. Metrics are MicroStrategy objects that represent business measures. Metrics are the calculations performed on data stored in your database, the results of which are displayed on a report. You can display the descriptions of attributes and metrics in grid reports in your Excel workbooks. The attribute and metric descriptions are displayed as comments in the report header cells in the workbook. can also display the attribute and metric descriptions of specific You grid reports after they are run. For more information, see Formatting individual reports/documents after they are run, page 54. Attribute forms are additional descriptive information about a business attribute. For example, the Customer attribute may have the forms First Name, Last Name, Address, Email Address, and so on. A form is a descriptive category for any data that your organization saves about any of its attributes. 88 Determining report and document display in Microsoft © 2013 MicroStrategy, Inc. MicroStrategy Office User Guide Formatting and Displaying Reports and Documents 2 You can specify that attribute forms are displayed at the top of each of the grid reports in your workbook, presentation, or Word document. The attribute forms are displayed in the same way as they are in MicroStrategy Developer and MicroStrategy Web. can also display or hide the attribute forms of specific grid reports You after they are run. For more information, see Formatting individual reports/documents after they are run, page 54. To display attribute forms, attribute descriptions, and metric descriptions 1 On the MicroStrategy tab, click Options. The Options dialog box opens. 2 Under the General folder, expand the Grid folder. 3 To show attribute form names, select the Show attribute form headers check box. Attribute forms are labeled in report grid row and column headers. Cleared by default. 4 To show attribute and metric descriptions, select the Show header descriptions check box. Attribute and metric descriptions are displayed as cell comments in Excel grids. Cleared by default. 5 Click OK. © 2013 MicroStrategy, Inc. Determining report and document display in Microsoft 89 2 Formatting and Displaying Reports and Documents MicroStrategy Office User Guide To see your changes, locate a report and click Execute Report. The report is run in your Microsoft product. In the example below, since the Age Range and City attributes were selected in the prompt, they appear on the report. Displaying metric data only You can display only the metric data contained in a MicroStrategy grid report. This is helpful if you plan to create a new workbook and then export the data contained in the workbook to a spreadsheet that already contains the column and row names for the data. This feature can also be useful for security purposes. To display only the metric values of a grid report 1 On the MicroStrategy tab, click Options. The Options dialog box opens. 2 Under the General folder, select Grid. 90 Determining report and document display in Microsoft © 2013 MicroStrategy, Inc. MicroStrategy Office User Guide 2 Formatting and Displaying Reports and Documents 3 On the right, select Show metric values only. Only metric values are displayed in report results; row and column headers are not displayed. Cleared by default. 4 Click Apply, then click OK. Using notes in reports and documents A note is text that a user types in a report or document to provide comments for later use or other users. Notes are commonly used to track changes to a report or document. Multiple users can work on the same report or document and use notes to communicate with each other. Notes are displayed with the user’s login name as well as the time and date that the note was added. When a note is added to a report or document, it is stored in the metadata. Because the notes that are associated with reports or documents are stored in a central location, they can be shared between MicroStrategy Web, Developer, and Office. Prerequisites • The View Notes, Add Notes, or Edit Notes privileges are required for users to view, add, or edit notes. To view, edit, or add a note to a report/document 1 Open the report or document that you want to view, edit or add notes to. © 2013 MicroStrategy, Inc. Using notes in reports and documents 91 2 Formatting and Displaying Reports and Documents MicroStrategy Office User Guide 2 Select the report or document from the list of reports in the MicroStrategy Office dialog box, and, from the View menu, select Notes. The Notes dialog box opens, as shown in the example below: 3 Add a new note or edit existing notes by doing the following: • To add a new note, type in the blank text field at the bottom of the dialog box and click Submit. The note is displayed in the Notes area at the top of the dialog box. • To edit an existing note, click Edit. When you update a note, the old note is overwritten. 4 Click OK, then click Close. Providing default answers for diagnostic messages A variety of diagnostic messages is displayed in MicroStrategy Office when certain conditions are met. For example, if you run a report named Quarterly Sales that returns no data, you are presented with a message 92 Providing default answers for diagnostic messages © 2013 MicroStrategy, Inc. MicroStrategy Office User Guide Formatting and Displaying Reports and Documents 2 that states, “Report “Quarterly Sales” returned no data. Do you want to display the result?” You can provide default answers for each of these messages so that you do not have to click a response every time you see each message. To change the default answer to a diagnostic message 1 On the MicroStrategy tab, select Options. The Options dialog box opens. 2 Under the General folder, select Messages. The following messages can have default answers defined: • Display reports with no data: Defines how to answer the message about whether to display reports that return no data. Example: Report “Quarterly Sales” returned no data. Do you want to display the result? • Persist partially displayed reports: Defines how to answer the message about whether to display partial results. Example: “Quarterly Sales” partially displayed its results. Do you want to continue persistence of the report? • Display results that exceed row or column limits: Defines how to answer the message about whether to display results that exceed row and/or column limits. Example: Size of report “Quarterly Sales” (525 rows, 63 columns) exceeds the limit for this Microsoft Office application. Do you want to display the results? • Display report when pages exceed limit: Defines how to answer the message about whether to display reports that return more pages than the configured limit. Example: The number of selected pages (313) exceeds the configuration limit. Do you want to process the first 64 pages? • Cancel all reports when cancelling a prompt: Defines how to answer the message about whether to cancel all executing reports when a prompted report is canceled. Example: There are other reports executing. Do you want to cancel all reports? • Recreate missing Excel worksheets when refreshing: Defines how to answer the message about whether to recreate missing Excel worksheets when refreshing reports to a worksheet that has been removed from the workbook. Example: “Quarterly Sales Worksheet” was not found in the active Excel workbook. Do you want to create the sheet and keep persistence? • Continue deleting Word and PowerPoint reports: Defines how to answer the message about whether to continue deleting reports in © 2013 MicroStrategy, Inc. Providing default answers for diagnostic messages 93 2 Formatting and Displaying Reports and Documents MicroStrategy Office User Guide Word or PowerPoint when one deletion fails. Example: “Quarterly Sales” could not be deleted. Do you want to continue deleting? • Refresh Flash documents if data files are not found: Defines how to answer the message about whether to refresh Flash-enabled documents when data files are missing. Example: Documents displayed in Flash mode are missing files that are necessary for display. Do you want to refresh the documents? • Close the current document when launching the Package Utility: Defines how to answer the message about whether to close the open Excel workbook, PowerPoint presentation, or Word document when launching the Package Utility or Package Wizard. Example: If you want to include the current workbook in the package, the workbook must be closed. Do you want to close the workbook now? • Confirm before deleting items: Defines how to answer the message about whether to delete the selected items. Example: Do you want to delete the selected items? 3 From the drop-down next to the message which you want to change the default answer for, do one of the following: • Select Yes to always provide the answer Yes to the message and not be prompted for an answer. • Select No to always provide the answer No to the message and not be prompted for an answer. • Select Ask to always be prompted to answer the message. This option is selected for all messages by default. 94 Providing default answers for diagnostic messages © 2013 MicroStrategy, Inc. 3Y 3. USING MICROSTRATEGY OFFICE IN EXCEL Building and analyzing workbooks that contain business data Introduction You can create a Microsoft Excel workbook that contains MicroStrategy reports and documents, and then organize, analyze, and work with the business data within those reports. This section provides steps to use MicroStrategy Office to create Microsoft Excel workbooks that contain MicroStrategy reports and documents. It also provides steps to analyze and work with the business data within those reports and documents in the Excel workbook. This section is useful for the following types of users: • MicroStrategy Office users who log into MicroStrategy projects to run reports within Excel workbooks, and want to be able to create reports within workbooks. Start with Creating report-filled Excel workbooks, page 96 to create effective workbooks in Excel and see examples of common workbook creation ideas you can take advantage of using MicroStrategy Office in Excel. Then see Analyzing business data and working with Excel workbooks, page 114 to use Excel to analyze and work with MicroStrategy reports contained in workbooks. © 2013 MicroStrategy, Inc. 95 3 Using MicroStrategy Office in Excel • MicroStrategy Office User Guide Business analysts who do not have access to MicroStrategy Office, but analyze and format report data within Excel workbooks. See Analyzing business data and working with Excel workbooks, page 114 to use Excel to analyze and work with MicroStrategy reports contained in workbooks. Creating report-filled Excel workbooks This section shows you how to add MicroStrategy reports and documents to Excel workbooks. Microsoft Excel workbooks that contain MicroStrategy reports and documents can be used for a variety of purposes. For example, you are creating an Excel workbook for other regional sales managers. The managers are interested in viewing yearly sales data from a variety of perspectives, and therefore require that the Excel workbook contains several reports and documents. To build the workbook, you open Excel, create a new workbook, open MicroStrategy Office, and run MicroStrategy reports and documents into the workbook. In Microsoft Excel, you can add graphics, a header and footer, and other elements to give the workbook a consistent, professional look and feel. You can also create a new report or document from within MicroStrategy Office if you identify the need for one in your workbook that does not already exist in a MicroStrategy project. Once the reports and documents are added to Excel, you and the other sales managers can use Microsoft Excel’s functionality to filter, sort, use PivotTables, and perform other analysis on the data in the reports and documents that are part of the workbook. For example, if you added a MicroStrategy graph report to the workbook, you can use Excel to change the chart type from a bar graph to a pie chart, format colors, and so on. You can also use Excel’s PivotTable functionality to add and remove data from grid reports, show and hide columns of data, adjust the display of the grids, and so on. Examples of how to analyze and work with Excel workbooks are provided in Analyzing business data and working with Excel workbooks, page 114. Prerequisites • You must have the appropriate MicroStrategy permissions to run your chosen reports and documents. 96 Creating report-filled Excel workbooks © 2013 MicroStrategy, Inc. MicroStrategy Office User Guide Using MicroStrategy Office in Excel 3 • You can add any type of Report Services document to an Excel workbook, as long as the document includes reports from the same project. For example, you can add one document that contains three different reports from your human resources project. However, you cannot add a document that contains reports from both your human resources and marketing projects. • To add a non-Flash document to a workbook, you must be using Microsoft Office 2007 or higher, and MicroStrategy Web Services and Intelligence Server 9.2 or higher. For the latest requirements, see the MicroStrategy Readme. Adding reports and documents to a workbook You can use MicroStrategy Office to add reports, Report Services documents, and HTML documents to a Microsoft Excel workbook. Some Report Services documents have Flash Mode enabled, which allows users to view the document in Flash Mode in MicroStrategy Web. See the appropriate section below, depending on what type of report or document you want to add to Excel: • Adding reports and HTML documents to a workbook, page 97 • Adding non-Flash, Report Services documents to a workbook, page 99 • Adding a Flash view of a Report Services document to a workbook, page 101 Adding reports and HTML documents to a workbook The steps below describe how to add MicroStrategy reports and HTML documents to an Excel workbook. To add reports and HTML documents to a workbook 1 Open Microsoft Excel and create a blank workbook. 2 On the MicroStrategy tab, click Office and log into a project. 3 Locate the report or HTML document to add to the Excel workbook. © 2013 MicroStrategy, Inc. Creating report-filled Excel workbooks 97 3 Using MicroStrategy Office in Excel MicroStrategy Office User Guide 4 Run the report or HTML document by doing one of the following: • Double-click a report or HTML document to add it to your Excel workbook. This runs the report in a default display type, which is determined by the format of the report in MicroStrategy. • To choose a specific display type in which to add them to your workbook, right-click the report or HTML document (or multi-select several reports and documents), and select a display type. By default, all reports are placed on their own worksheets within the Excel workbook. For example, a MicroStrategy grid report may appear on one worksheet as an Excel PivotTable and a graph report may be placed on another worksheet as a Chart, as shown in the following images. 98 Creating report-filled Excel workbooks © 2013 MicroStrategy, Inc. MicroStrategy Office User Guide Using MicroStrategy Office in Excel 3 Adding non-Flash, Report Services documents to a workbook You can add a Report Services document to an Excel workbook. Some Report Services documents have Flash enabled (for display in Flash mode in MicroStrategy Web), and others do not. Before adding a non-Flash document, you configure it to display using Open Office XML. Steps to do this are included below. When a non-Flash document is added to an Excel workbook, graphs can be displayed as images, as live charts (which can be altered), or they can inherit the default from the document definition. Optional steps are below to format graphs before you add the document to your workbook. To add a non-Flash document to a workbook 1 On the MicroStrategy tab, click Options. The Options dialog box opens. 2 Under the General folder, select Document. © 2013 MicroStrategy, Inc. Creating report-filled Excel workbooks 99 3 Using MicroStrategy Office in Excel MicroStrategy Office User Guide 3 At the bottom of the pane, select the Use Open Office XML for view mode rendering check box. 4 Click OK. The Options dialog box closes. 5 Open the Excel workbook you want to add the non-Flash document to. 6 On the MicroStrategy tab, click Office and log into a project. 7 Locate the document to add to the workbook, then right-click the document and select Run Document to View Mode. • If any reports within the document contain prompts, you must answer them before the reports are executed. For steps to answer prompted reports and documents, see Answering prompted reports/ documents, page 28. Formatting graph images in non-Flash documents When a non-Flash document is added to an Excel workbook, graphs contained within the document can be configured to be either images or live graphs. A live graph can be formatted and changed. Prerequisites • Microsoft Office 2003, or Microsoft Office 2007 Service Pack 1 or higher To configure charts in non-Flash documents so that they can be formatted in the workbook, from the MicroStrategy tab click Options. Under the General folder, select Document. In the Chart Display area, the following options are available: • Display chart as image: This option displays an image of the graph that was created when the document was designed. This option is useful because it allows graph types that are not supported in Microsoft Office to appear exactly as they do in MicroStrategy Web or Developer. • Display live charts: This option allows graphs to be formatted and changed after they are displayed in MicroStrategy Office. Not all graph types are supported as live charts in MicroStrategy Office. • Use default from document definition: This option inherits the graph settings from the document definition, including whether the graph is displayed as an image or as a live chart. 100 Creating report-filled Excel workbooks © 2013 MicroStrategy, Inc. MicroStrategy Office User Guide 3 Using MicroStrategy Office in Excel Adding a Flash view of a Report Services document to a workbook Some Report Services documents have Flash Mode enabled. This allows users to view the document in Flash Mode in MicroStrategy Web. You can add these Flash-enabled documents to an Excel workbook. Users can do the following in Flash Mode: • Pivot row or column position in a grid or cross tabular grid of data. • Sort grid data. • Quickly switch between a grid and graph view. • Change the Group-by selection. too many Flash-enabled documents in an Excel workbook Including can cause the Flash-enabled documents to fail to execute or refresh. The number of Flash-enabled documents that can be included in an Excel workbook is limited by several factors, including the size of each Flash-enabled document, the number of widgets in each Flash-enabled document, and so on. Use the steps below to add Flash-enabled documents to an Excel workbook. For steps to add a non-Flash document, see Adding non-Flash, Report Services documents to a workbook, page 99. Prerequisites • To add and view Flash-enabled documents, you must have Adobe® Flash Player installed on your computer. If Flash Player is not installed, when you run a Flash-enabled document a link to the Adobe download web site is displayed, from which you can install Flash Player. For information on certified and supported versions of Adobe Flash Player, see the MicroStrategy Readme. To add a Flash-enabled document to a workbook 1 In Microsoft Excel, open the workbook you want to add the Flash-enabled document to. 2 On the MicroStrategy tab, click Office and log into a project. © 2013 MicroStrategy, Inc. Creating report-filled Excel workbooks 101 3 Using MicroStrategy Office in Excel MicroStrategy Office User Guide 3 Locate the Flash-enabled document to add to the Excel workbook. In the folder lists, Flash documents are displayed with the following icon. 4 Double-click the document to add it to your Excel workbook. The document is run in Flash Mode, by default. • If the designer has enabled, it, you can also run the document in a Grid display type by right-clicking it and selecting Run Report to Grid. This displays the document in a static view mode, similar to a document exported from MicroStrategy Web. To send the workbook to other users, see Sending Microsoft files that include Flash-enabled documents, page 185 for information on ensuring that the recipients can view Flash-enabled documents in the workbook. Creating and editing reports and documents in a workbook You can create reports and documents from within an Excel workbook by launching MicroStrategy Web within MicroStrategy Office. MicroStrategy Web opens in Office so that you can create reports and documents in the same way that you do in Web. If you save the report or document in the Shared Reports folder, it saves in MicroStrategy Office, Web, and Developer. This way, you can access these reports in any environment in which you are working. For steps to create a new report or document using MicroStrategy Office, see Creating and editing reports and documents, page 167. Placing, resizing, scaling, and naming reports in a workbook Once reports and documents are placed within your Excel spreadsheet, you can resize them, add titles and other text around data, and format other aspects of the Excel spreadsheet, using a combination of Microsoft and MicroStrategy Office functionality. 102 Creating report-filled Excel workbooks © 2013 MicroStrategy, Inc. MicroStrategy Office User Guide 3 Using MicroStrategy Office in Excel For example, you can set charts to either retain their current size in Excel when reports are refreshed, or revert to the size saved in the report properties. These options are shown below: Steps are below to change placement, size, scale, and report naming using MicroStrategy Office. For steps to move reports in a spreadsheet, see Moving reports and documents in Excel, page 84. For information on modifying display properties such as whether the report is displayed as an image, applying borders, or applying AutoFit to rows and columns, see Formatting individual reports/documents after they are run, page 54. To change report placement, size, scale, and naming 1 On the MicroStrategy tab, click Options. The Options dialog box opens. 2 Expand the Excel folder and select Placement: In the Single report placement area: • Place report at selected cell: If selected, when executing a single MicroStrategy report or the first report in a group of reports, the © 2013 MicroStrategy, Inc. Creating report-filled Excel workbooks 103 3 Using MicroStrategy Office in Excel MicroStrategy Office User Guide result is displayed at the currently selected cell in the Microsoft Excel workbook. • Place report on a new sheet: If selected, places report result at cell A1 on a new worksheet in the current Excel workbook. The new worksheet name is based on the Excel name setting. Selected by default. • Prompt for placement of report: If selected, a dialog box displays after report execution, letting the user type the location worksheet and cell where the report result will be placed. In the Multiple report placement area: • Place next report below previous n rows: When executing multiple reports as a group, the second and subsequent report results are displayed below a specified number of rows of the previous result. Default is 1 row; range 0 - 100 rows. • Place next report to right of previous n columns: If selected, displays the second and subsequent report results in the specified number of columns to the right of the previous result. Default is 1 column; range 0 - 100 columns. • Place next report on a new sheet: If selected, displays the second and subsequent report results on a new worksheet. Selected by default. • Prompt for placement of next report: If selected, a dialog box displays after executing the second and subsequent reports, letting the user type the location worksheet and cell where the report results will be placed. In the Page-by placement area: • Place each page as a separate sheet: If selected, each page of a page-by report is placed on a separate worksheet. The new worksheet name is based on the Excel name setting. Selected by default. • Place each page below previous n rows: If selected, each page of a page-by report is placed on the same worksheet, separated by the specified number of blank rows. Default is 1 row; range 0 - 100 rows. • Prompt for placement of pages: If selected, a dialog box displays after report execution, letting the user type the location worksheet and cell where each page will be placed. 104 Creating report-filled Excel workbooks © 2013 MicroStrategy, Inc. MicroStrategy Office User Guide 3 Using MicroStrategy Office in Excel 3 In the Excel folder, select Size: In the Result size limits area: • Maximum rows: Specifies the maximum number of rows that may be displayed in a report result. If the maximum is exceeded, the report display may be canceled or allowed to continue. Default is 1,048,576 rows; range 0 - 1,048,576 rows. • Maximum columns: Specifies the maximum number of columns that may be displayed in a report result. If the maximum is exceeded, the report display may be canceled or allowed to continue. Default is 256 columns; range 0 - 16,384 columns. • Maximum pages: Specifies the maximum number of pages that may be displayed in a report result. If the maximum is exceeded, the report display may be canceled or allowed to continue. Default is 256 pages; range 0 - 1,000 pages. In the Flash size area: • Width: Specifies the default width in pixels of the Flash Player control used to display Flash-enabled documents in Excel. Default is 933 pixels; range 100 - 9,999 pixels. • Height: Specifies the default height in pixels of the Flash Player control used to display Flash-enabled documents in Excel. Default is 667 pixels; range 100 - 9,999 pixels. • Fetch results cell size: Specifies the maximum number of cells of data to be retrieved in the second and subsequent incremental fetches. (The initial incremental fetch is determined by the fetch setting; see Controlling how much data is retrieved and displayed, page 72.) Default is 30,000 cells; range 1,000 - 100,000 cells. 4 In the Excel folder, select Scale: In the Chart scale area: • Percentage of original width x height: Select this to scale charts by a percentage of their original size as stored in their report definition. Selected by default. Default is 100% x 100%; range 1 - 300%. • Lock aspect ratio: When selected, the aspect ratio of charts is preserved. Selected by default. • Fixed width x height: Select this to define explicit width and height for charts in the specified units. Default is 400 x 300 pixels; range 10 2,112. © 2013 MicroStrategy, Inc. Creating report-filled Excel workbooks 105 3 Using MicroStrategy Office in Excel MicroStrategy Office User Guide In the Excel scale options area: • Recalculate scale on refresh: When selected, chart sizes are recalculated when refreshing, using the settings in the report properties. If cleared, the current size of the object is preserved when refreshing. Selected by default. 5 In the Excel folder, select Name: In the Worksheet name area: • Use report name: If selected, the report name is used to generate worksheet names. Selected by default. • Use page, layout, or group name: If selected, the page, layout, or group name is used to generate worksheet names. • Use report name and page, layout, or group name: If selected, the report name followed by the page, layout, or group name is used to generate worksheet names. • Use page, layout, or group name and report name: If selected, the page, layout, or group name followed by the report name is used to generate worksheet names. 6 Click OK to save your changes. To ensure that your formatting changes will not be lost after refreshing a report, clear the following check boxes: • Apply formatting from report definition on refresh check box in the Formatting folder under the Grid folder. • Apply formatting from report definition on refresh check box in the Chart Refresh area of the Chart folder. Placing multiple outline reports on one worksheet A MicroStrategy outline report is a Grid report that allows the collapse and expansion of related groups of data. The outline report below has three levels of grouping: Region on level 1, Category on level 2, and Subcategory on level 106 Creating report-filled Excel workbooks © 2013 MicroStrategy, Inc. MicroStrategy Office User Guide 3 Using MicroStrategy Office in Excel 3. Levels are indicated by indentation, with level 1 on the group furthest to the left. You can expand or collapse any group by clicking on the plus or minus sign next to the group’s name, or by clicking the buttons in the top left corner, which collapse all groups on the chosen level. For more information on outline reports and how to create them, see the MicroStrategy Basic Reporting Guide. Prerequisite • To preserve grouping structure, place outline reports vertically by selecting Place next report below previous. See To change report placement, size, scale, and naming, page 103. To place multiple outline reports on one worksheet Allow multiple outline reports per worksheet 1 On the MicroStrategy tab, click the Options icon. The Options dialog box is displayed. 2 Expand General, then select Grid. 3 Select Allow multiple outline reports per worksheet. If this option is cleared, the last outline report added has outline expand/ collapse functionality. All other reports are fully expanded and added to Excel as normal Grid reports. © 2013 MicroStrategy, Inc. Creating report-filled Excel workbooks 107 3 Using MicroStrategy Office in Excel MicroStrategy Office User Guide 4 Click OK to close the dialog box and return to Excel. Add multiple reports to Excel 5 On the MicroStrategy tab, click Office and log into a project. 6 Locate the outline reports to add to the Excel workbook. 7 Select the reports you want to add by pressing CTRL and clicking on each report. 8 Right-click the reports and select Run Report. The outline reports are added to your Excel workbook. Expand or collapse groups by clicking on the plus or minus signs to the left of the row numbers, respectively. Using Microsoft Smart Tags in a spreadsheet You can have words and phrases in your spreadsheet link directly to specific MicroStrategy reports and projects. Smart Tags allow you to associate MicroStrategy reports with specific phrases. A Smart Tag appears as a link in the workbook. When the user clicks the link and expands the icon, various 108 Creating report-filled Excel workbooks © 2013 MicroStrategy, Inc. MicroStrategy Office User Guide Using MicroStrategy Office in Excel 3 options appear. A Smart Tag is shown expanded in the sample workbook below: For information on including Smart Tags in your workbook to provide users with links to reports and projects, see Using Microsoft Smart Tags as links to projects and reports, page 191. Example: A dashboard-style Excel workbook You can design in-depth, report-filled Excel workbooks as scorecards and dashboards. These scorecards and dashboards can include your company’s logo, headers, footers, and any other graphics to produce a consistent report book. You use MicroStrategy Office to include multiple reports in a workbook and Microsoft Excel to format each worksheet, giving the workbook a consistent look and feel. The following procedure walks you through an example of how to create an Excel workbook that contains multiple reports and presents a dashboard view of your data. © 2013 MicroStrategy, Inc. Creating report-filled Excel workbooks 109 3 Using MicroStrategy Office in Excel MicroStrategy Office User Guide High-level steps to create a scorecard or dashboard using MicroStrategy Office in Excel 1 Open Microsoft Excel and create a new workbook. 2 When creating scorecards and dashboards, it is recommended that all reports have the same look and feel. To make sure all the reports have the same formatting applied to them, on the MicroStrategy tab, click Options. The Options dialog box opens. Under the General folder, select the Grid folder, then select the Formatting folder. 3 Do one of the following: • Select the Apply formatting from report definition check box and select the check boxes of the MicroStrategy formatting to maintain in the reports. For example, you can ensure that each report’s MicroStrategy currency formatting is applied, but not its font styles. you select the Apply formatting from report definition When check box, you can also select the Apply formatting from report definition on refresh check box to ensure that MicroStrategy report formats are reapplied to reports after a refresh, overriding any of your existing changes. • Clear the Apply formatting from report definition check box to ensure that all of the reports that you run in the workbook have the same plain formatting applied to them. 4 Use Microsoft Excel to add worksheets, headers, footers, and to format other elements of the workbook. Refer to the following image as an example of different ways in which you can format an Excel dashboard. This worksheet represents the cover page 110 Creating report-filled Excel workbooks © 2013 MicroStrategy, Inc. MicroStrategy Office User Guide Using MicroStrategy Office in Excel 3 of the workbook and provides links to other worksheets in the workbook and additional information. 5 Log in to the MicroStrategy project that contains the reports or documents to add to the workbook, and run them in the workbook. The following images show examples of ways in which you can present report data. you design your scorecard or dashboard, you may find it more Asconvenient to specify with your cursor the location in which reports should be executed in Excel. © 2013 MicroStrategy, Inc. Creating report-filled Excel workbooks 111 3 Using MicroStrategy Office in Excel MicroStrategy Office User Guide This sample worksheet contains reports that were added, resized, and reformatted using Excel. For example, notice that the two graphs at the top of the worksheet are Excel bar graphs. 112 Creating report-filled Excel workbooks © 2013 MicroStrategy, Inc. MicroStrategy Office User Guide Using MicroStrategy Office in Excel 3 This worksheet presents additional grid reports. You can use the MicroStrategy Office API to create interactive, custom products to accommodate your reporting requirements. For more information about the MicroStrategy Office API, refer to Customizing MicroStrategy Office. Saving and securing a report-filled workbook You can save your report-filled workbook at any time using Microsoft Excel. When you save the workbook, all formatting is saved, as is the position of your reports and documents. The properties of each report in the workbook are also saved. These properties determine how the report is accessed and how it can be modified. © 2013 MicroStrategy, Inc. Creating report-filled Excel workbooks 113 3 Using MicroStrategy Office in Excel MicroStrategy Office User Guide You can secure the data within your Excel workbook in several ways once you save it and are ready to distribute it to others. For more information, refer to Securing and Distributing Data. Analyzing business data and working with Excel workbooks This section provides examples of how to sort and filter data and perform other analytical tasks using Microsoft Excel with MicroStrategy report data. This section applies to the following types of business users: • MicroStrategy Office users who create Excel workbooks for personal use or to distribute to others. These users log in to MicroStrategy projects and run reports and documents in Excel workbooks. During the process of creating a report-filled workbook, these users may also decide to use Excel to add metrics, sort data, format PivotTables, and perform other analysis. • Users who do not have access to MicroStrategy Office, but intend to use, sort, and perform other tasks with Excel workbooks that contain report data from MicroStrategy. These users can perform these tasks using Microsoft functionality. on how the Excel workbook was designed, you may not Depending be able to format, edit, or resize the workbook. Some designers lock these capabilities before distributing business data. In this case, you can only view, but not edit, the report data within the Excel workbook. MicroStrategy Office also supports Microsoft Named Ranges. Named Ranges can be used for a variety of Excel-based tasks, such as running macros and Power Pivot models. Each time a report is run in Microsoft Excel, an Excel Named Range is automatically created for each report result. The Named Ranges are updated to reflect changes in result size or location each time a report is refreshed. For more information about using Named Ranges in Microsoft Excel, refer to your Microsoft Office documentation. 114 Analyzing business data and working with Excel workbooks © 2013 MicroStrategy, Inc. MicroStrategy Office User Guide Using MicroStrategy Office in Excel 3 Refreshing and reformatting data in a workbook When you view an Excel workbook that contains MicroStrategy report data, you may be able to refresh and reformat the layout of the report within it. Refer to the table below to determine whether or not you can refresh and reformat the MicroStrategy reports and documents in your Excel workbooks. MicroStrategy Office user? Able to Refresh Reports and Documents? Able to Format Reports and Documents? Yes Yes. Yes. If you have MicroStrategy Office, you can refresh the reports and documents contained in the Excel workbook. For information on formatting all reports and documents, see Specifying formatting for reports/documents before they are run, page 48. For information on formatting specific reports and documents, see Formatting individual reports/documents after they are run, page 54. No No. Depends on the following: If you do not have MicroStrategy Office, you cannot refresh the reports and documents within the Excel workbook. This means you cannot obtain the most current data from the data warehouse or other data sources. If you do not have MicroStrategy Office, any Flash-enabled documents included in the workbook are not displayed. You may be able to format certain aspects of the reports in the Excel workbook, depending on how the workbook creator secured the file. For steps to format reports and documents, see Formatting and Displaying Reports and Documents. The report data within the workbook is intended for analytical use only. Refreshing reports and documents in a workbook You can refresh the business data in the reports and documents in your Excel workbook. You can refresh all reports in the workbook, or specific reports. Use the appropriate steps below. For an introduction to refreshing reports, see Refreshing reports to retrieve the latest data, page 37. © 2013 MicroStrategy, Inc. Analyzing business data and working with Excel workbooks 115 3 Using MicroStrategy Office in Excel MicroStrategy Office User Guide To refresh all the reports and documents in an Excel workbook 1 After running one or more reports in MicroStrategy Office, on the MicroStrategy tab, click Refresh. A progress dialog box is displayed, showing you which reports are being refreshed. The reports and documents are refreshed with the latest data from the data warehouse or other data sources. To refresh specific reports and documents in an Excel workbook 1 After running one or more reports in MicroStrategy Office, on the MicroStrategy tab, click Reports. The Reports dialog box opens. A list of the reports that currently reside in your Excel workbook is displayed. 2 Right-click the report or multi-select and right-click the reports to refresh. 3 Select Refresh Report. A progress dialog box is displayed, showing you which reports are being refreshed. The reports and documents are refreshed with the latest data from the data warehouse or other data sources. Examples using Excel features to analyze MicroStrategy report data Effective data analysis involves manipulating report data so that you can see patterns in the broader data or subsets of data that are meaningful to answering your business questions. You can filter, sort, and rank data in a MicroStrategy report in Excel using Excel’s features. Several examples are provided below using sample report data to show you Excel features that can be useful when analyzing data in a MicroStrategy report in Excel. The Microsoft Excel examples in this section may not reflect the functionality of the most current release of Microsoft Excel. For detailed steps to use Excel features, see your Microsoft Excel documentation. 116 Analyzing business data and working with Excel workbooks © 2013 MicroStrategy, Inc. MicroStrategy Office User Guide Using MicroStrategy Office in Excel 3 Example: Creating reports and slicing-and-dicing using Excel PivotTables and PivotCharts Excel PivotTables and PivotCharts let you perform a wide variety of analytical tasks such as sorting and filtering data. You can slice-and-dice the reports and data to uncover and highlight specific report data. You can take advantage of Excel’s PivotTable and PivotChart functionality to create your own custom reports from the MicroStrategy data in the workbook. A MicroStrategy report must be executed as a PivotTable or PivotChart before you can analyze and work with the PivotTable or PivotChart in Excel. For steps to run MicroStrategy reports in different formats, see Specifying a display type in which to view reports, page 63. © 2013 MicroStrategy, Inc. Analyzing business data and working with Excel workbooks 117 3 Using MicroStrategy Office in Excel MicroStrategy Office User Guide For example, the Customer Sales by Age report below was run in an Excel workbook as a PivotTable. Notice that the column headings have drop-down lists and the PivotTable menu opens by default once the report is executed. 118 Analyzing business data and working with Excel workbooks © 2013 MicroStrategy, Inc. MicroStrategy Office User Guide Using MicroStrategy Office in Excel 3 In the PivotTable, you can add individual elements to the table. The Quarter and Age 40-59 columns were dragged from the PivotTable menu to the PivotTable, adding data to the report. © 2013 MicroStrategy, Inc. Analyzing business data and working with Excel workbooks 119 3 Using MicroStrategy Office in Excel MicroStrategy Office User Guide You can format the look of your report data by selecting a new Excel report format, as shown in the image below. You can also create a PivotChart from the PivotTable. The PivotChart is placed on a separate sheet in the workbook, as shown in the image below. 120 Analyzing business data and working with Excel workbooks © 2013 MicroStrategy, Inc. MicroStrategy Office User Guide 3 Using MicroStrategy Office in Excel Suppose you want to see only bar graph data for Sum of Age 19 and Under and Sum of Age 20-39. You can hide specific data from view, as shown in the following image. In the image below, the bar graph PivotChart displays only the data specified. Example: Ranking and reducing result sets using Excel’s auto-filtering functionality You can filter and rank your report data in a number of ways using Excel’s auto-filtering. This is particularly beneficial with large datasets. Use the following steps to auto-filter and analyze MicroStrategy report data. © 2013 MicroStrategy, Inc. Analyzing business data and working with Excel workbooks 121 3 Using MicroStrategy Office in Excel MicroStrategy Office User Guide To rank and reduce result sets using Excel’s auto-filtering with MicroStrategy report data 1 Open a Microsoft Excel workbook containing a MicroStrategy report. The New Hires by Division human resources report is used in these steps as an example. 2 Highlight the entire report result set. Then, from the Data menu, select Filter. Drop-down list arrows appear next to each column in the report, as shown below. Click a drop-down arrow to filter and rank that column’s data. 3 Choose the filtering criteria. You can filter data based on specific elements, rank data, or use filtering comparisons such as greater than, 122 Analyzing business data and working with Excel workbooks © 2013 MicroStrategy, Inc. MicroStrategy Office User Guide 3 Using MicroStrategy Office in Excel less than, and between. In this example, the Employee column is ranked so that only the top five values are visible, as shown below. The resulting report shows a concise subset of data that can provide a more meaningful picture of your department or organization than the full report showed. You can ensure that the AutoFilter dialog box opens automatically when reports are executed in a Flattened display. To do so, on the MicroStrategy tab, click Options. Under the General folder, expand the Grid folder, and select the AutoFilter flattened reports check box. Example: Adding new metrics and calculations to report data While analyzing report data, you may wish to add new metrics, calculations, and data based on the existing MicroStrategy report in the workbook. You can use Microsoft Excel to add new metrics and calculations to existing MicroStrategy reports in Excel. © 2013 MicroStrategy, Inc. Analyzing business data and working with Excel workbooks 123 3 Using MicroStrategy Office in Excel MicroStrategy Office User Guide For example, based on the data in the report, you may wish to add a standard deviation calculation to gain further insight into the data. Or, you may be interested in seeing a Percent to Total calculation. After adding new calculations and metrics, you can save the workbook, refresh it to see the latest data from your data source, and the additional calculations outside of the report cells are retained. calculations you add to MicroStrategy reports using Excel are not Any saved in MicroStrategy. They are saved on your hard drive, within the workbook itself. Refer to your Microsoft Excel documentation to add new calculations to workbooks and the proper formulas to use for each. 124 Analyzing business data and working with Excel workbooks © 2013 MicroStrategy, Inc. 4 4. USING MICROSTRATEGY OFFICE IN POWERPOINT Creating and working with presentations that contain business data Introduction You can create a PowerPoint presentation that contains MicroStrategy reports and documents and then present the business data in those reports to your colleagues and other users. This section provides steps to use MicroStrategy Office to create Microsoft PowerPoint presentations that contain MicroStrategy reports and documents. It also provides steps to refresh different sets of data to accommodate multiple audiences. This section is useful for the following types of users: • MicroStrategy Office users who log in to MicroStrategy projects, run reports in presentations, and design other aspects of the presentations. These users may present the data themselves or send the presentation to other users. Start with Creating report-filled PowerPoint presentations, page 126 to create effective presentations in PowerPoint and see examples of common presentation creation ideas you can take advantage of using MicroStrategy Office in PowerPoint. Then see Analyzing business data and working with PowerPoint presentations, page 144 to use © 2013 MicroStrategy, Inc. 125 4 Using MicroStrategy Office in PowerPoint MicroStrategy Office User Guide PowerPoint to present MicroStrategy reports contained in the presentation and make analysis of that data possible. • Users who do not have access to MicroStrategy Office, but present PowerPoint presentations that contain business data. See Analyzing business data and working with PowerPoint presentations, page 144 to use PowerPoint presentations that contain business data. When you share or send a PowerPoint presentation to users who do not have access to MicroStrategy Office, the presentation they receive is static. This means the users cannot refresh the data within the presentation to retrieve updated data from the data warehouse or other sources. Creating report-filled PowerPoint presentations This section shows you how to add MicroStrategy reports to a PowerPoint presentation. This section also provides examples of different ways in which presentations are commonly used. For example, you can create an auto-generated presentation. To do this, you add prompted reports to a presentation to ensure that every time you and other users refresh the presentation, your prompt answers control what data is displayed on the presentation. This allows you to use one presentation instead of several presentations to present data to different audiences. An example of how to create a personalized, auto-generated presentation is provided in Example: Creating a personalized, auto-generated presentation, page 139. You can also set up the reports in the presentation so that the data in them changes based on who refreshes the report. For example, you create a presentation that includes the same MicroStrategy reports for 10 different managers. Each manager needs to present inventory data to their regions’ employees. Before delivering the presentation, each manager opens the presentation, logs into MicroStrategy Office, and is prompted to make selections for each report. Each manager can only select data that is relevant to their intended audience, for example, Southwest inventory data. The reports are executed with the selected data and the manager can present the information. The presentation looks like it was tailored just for that audience although it consists of the same reports as every other manager’s presentation. 126 Creating report-filled PowerPoint presentations © 2013 MicroStrategy, Inc. MicroStrategy Office User Guide 4 Using MicroStrategy Office in PowerPoint Adding reports and documents to a presentation You can use MicroStrategy Office to add reports, Report Services documents, and HTML documents to a Microsoft PowerPoint presentation. Some Report Services documents have Flash Mode enabled, which allows users to view the document in Flash Mode in MicroStrategy Web. See the appropriate section below, depending on what type of report or document you want to add to PowerPoint: • Adding reports and HTML documents to a presentation, page 127 • Adding a Flash view of a Report Services document to a presentation, page 128 • Adding non-Flash Report Services documents to a presentation, page 130 Adding reports and HTML documents to a presentation The steps below describe how to add reports and HTML documents to a PowerPoint presentation. Best Practices • If any of the columns within the grid reports you run are not wide enough to fit all of the text or data within the cell, re-execute the report and select the AutoFit Columns check box. For more information about using the AutoFit option, see Resizing grid reports with long column or row names, page 81. • If you are executing a graph report into your presentation in a Chart display type, it is recommended you select the Display Charts as images check box. This ensures that the graph report is displayed more clearly and at a higher resolution, in JPEG format. To do this, on the MicroStrategy tab, select Options. Under the General folder, expand the Chart folder and select this option in the Chart Display area. • It is recommended that you insert all reports in PowerPoint as static bitmaps. To do so, before running the reports, on the MicroStrategy tab select Options. Under the General folder, in the PowerPoint folder, select the Security folder. Select Static picture and, from the drop-down list, select Bitmap. © 2013 MicroStrategy, Inc. Creating report-filled PowerPoint presentations 127 4 Using MicroStrategy Office in PowerPoint • MicroStrategy Office User Guide If you are running an HTML document, each graph and grid report within the HTML document is displayed on its own slide, by default. To modify where the reports are placed, on the MicroStrategy tab select Options. Under the General folder, select the PowerPoint folder, select the Placement folder, and make the appropriate selection from the Multiple Report Placement options. To add MicroStrategy reports or HTML documents to a presentation 1 Open the PowerPoint presentation you want to add the report or HTML document to. 2 On the MicroStrategy tab, click Office and log in to a project. 3 Locate the report or HTML document to add to the PowerPoint presentation. 4 Run the report or HTML document by doing one of the following: • Double-click a report or document to add it to your PowerPoint presentation. The report is run in a default display type, which is determined by the format of the report in MicroStrategy. • To choose a specific display type in which to add them to the presentation, right-click the report or HTML document (or multi-select reports) and select a display type. By default, all reports are placed on the next slides, with one report or document per slide. Adding a Flash view of a Report Services document to a presentation Some Report Services documents have Flash Mode enabled. This allows users to view the document in Flash Mode in MicroStrategy Web. You can add these Flash-enabled documents to a PowerPoint presentation. Users can do the following in Flash Mode: • Pivot row or column position in a grid or cross tabular grid of data. • Sort grid data. • Quickly switch between a grid and graph view. 128 Creating report-filled PowerPoint presentations © 2013 MicroStrategy, Inc. MicroStrategy Office User Guide • 4 Using MicroStrategy Office in PowerPoint Change the Group-by selection. too many Flash-enabled documents in a PowerPoint Including presentation can cause the Flash-enabled documents to fail to execute or refresh. The number of Flash-enabled documents that can be included in a PowerPoint presentation is limited by several factors, including the size of each Flash-enabled document, the number of widgets in each Flash-enabled document, and so on. Use the steps below to add Flash-enabled documents to a PowerPoint presentation. For steps to add a non-Flash document, see To add a non-Flash document to a presentation, page 130. Prerequisites • To add and view Flash-enabled documents, you must have Adobe® Flash Player installed on your computer. If Flash Player is not installed, when you run a Flash-enabled document a link to the Adobe download web site is displayed, from which you can install Flash Player. For information on MicroStrategy-certified and -supported versions of Adobe Flash Player, see the MicroStrategy Readme. To add a Flash-enabled document to a presentation 1 In Microsoft PowerPoint, open the presentation you want to add the Flash-enabled document to. 2 On the MicroStrategy tab, click Office and log in to a project. 3 Locate the Flash-enabled document to add to the PowerPoint presentation. In the folder lists, Flash documents are displayed with the following icon: 4 Double-click the document to add it to your PowerPoint presentation. The document is run in Flash Mode by default. © 2013 MicroStrategy, Inc. Creating report-filled PowerPoint presentations 129 4 Using MicroStrategy Office in PowerPoint MicroStrategy Office User Guide 5 In PowerPoint, click the Slide Show tab and play the slideshow to view the Flash-enabled document. In Slide Show mode, Flash documents become interactive and animated. To send the presentation to other users, see Sending Microsoft files that include Flash-enabled documents, page 185 for information about ensuring that the recipients can view the Flash-enabled documents in the presentation. Adding non-Flash Report Services documents to a presentation You can add a Report Services document to a PowerPoint presentation. Some Report Services documents have Flash enabled (for display in Flash mode in MicroStrategy Web), and others do not. Before adding a non-Flash document, you configure it to display using Open Office XML. Steps to do this are included below. When a non-Flash document is added to a PowerPoint presentation, graphs can be displayed as images, as live charts (which can be altered), or they can inherit the default from the document definition. Optional steps are below to format graphs before you add the document to your presentation. Prerequisite • To add a non-Flash document to a presentation, you must be using Microsoft Office 2007 or higher, and MicroStrategy Web Services and Intelligence Server 9.2 or higher. For the latest requirements, see the MicroStrategy Readme. To add a non-Flash document to a presentation 1 On the MicroStrategy tab, click Options. The Options dialog box opens. 2 Under the General folder, select Document. 3 At the bottom of the pane, select the Use Open Office XML for view mode rendering check box. Selected by default. 4 Click OK. The Options dialog box closes. 130 Creating report-filled PowerPoint presentations © 2013 MicroStrategy, Inc. MicroStrategy Office User Guide 4 Using MicroStrategy Office in PowerPoint 5 Open the PowerPoint presentation you want to add the non-Flash document to. 6 On the MicroStrategy tab, click Office and log into a project. 7 Locate the document to add to the PowerPoint presentation, then right-click the document and select Run Document to View Mode. The document is displayed in the Microsoft PowerPoint presentation. • If any reports within the document contain prompts, you must answer them before the reports are executed. For steps to answer prompted reports and documents, see Answering prompted reports/ documents, page 28. Formatting graph images in non-Flash documents When a non-Flash document is added to a PowerPoint presentation, graphs contained within the document can be configured to be either images or live graphs. A live graph can be formatted and changed. Prerequisites • Microsoft Office 2003, or Microsoft Office 2007 Service Pack 1 or higher To configure charts in non-Flash documents so that they can be formatted in the presentation, from the MicroStrategy tab click Options. Under the General folder, select Document. In the Chart Display area, the following options are available: • Display chart as image: This option displays an image of the graph that was created when the document was designed. This option is useful because it allows graph types that are not supported in Microsoft Office to appear exactly as they do in MicroStrategy Web or Developer. • Display live charts: This option allows graphs to be formatted and changed after they are displayed in MicroStrategy Office. Not all graph types are supported as live charts in MicroStrategy Office. • Use default from document definition: This option inherits the graph settings from the document definition, including whether the graph is displayed as an image or as a live chart. © 2013 MicroStrategy, Inc. Creating report-filled PowerPoint presentations 131 4 Using MicroStrategy Office in PowerPoint MicroStrategy Office User Guide Creating and editing reports and documents in a presentation You can create reports and documents from within a PowerPoint presentation by launching MicroStrategy Web within MicroStrategy Office. MicroStrategy Web opens in Office so that you can create reports and documents in the same way that you do in Web. If you save the report or document in the Shared Reports folder, it saves in MicroStrategy Office, Web, and Developer. This way, you can access these reports in any environment in which you are working. For steps to create a new report or document using MicroStrategy Office, see Creating and editing reports and documents, page 167. Placing, resizing, scaling, positioning, and securing reports in a presentation Once reports and documents are placed within your PowerPoint presentation, you can resize them, add titles and other text around data, and format other aspects of the PowerPoint presentation, using a combination of Microsoft and MicroStrategy Office functionality. Steps are below to change placement, size, scale, position, and security using MicroStrategy Office. 132 Creating report-filled PowerPoint presentations © 2013 MicroStrategy, Inc. MicroStrategy Office User Guide 4 Using MicroStrategy Office in PowerPoint For example, you can set reports to retain their current size in PowerPoint when reports are refreshed, or revert to the size saved in the report properties. These options are shown below: For example, by default, reports too large to be displayed on a single slide will run off the edge. You can scale your reports to ensure they always fit within the dimensions of the slide. To change placement, size, scale, position, and security 1 On the MicroStrategy tab, click Options. The Options dialog box opens. 2 Expand the PowerPoint folder and select Placement. Select from the following: In the Single report placement area: • Place report on current slide: If selected, when executing a single report or the first report in a group of reports, the result is placed on the currently selected slide in the presentation. • Place report following current slide: If selected, when executing a single report or the first report in a group of reports, the result is placed following the currently selected slide in the presentation. Selected by default. • Place report before current slide: If selected, when executing a single report or the first report in a group of reports, the result is placed before the currently selected slide. © 2013 MicroStrategy, Inc. Creating report-filled PowerPoint presentations 133 4 Using MicroStrategy Office in PowerPoint MicroStrategy Office User Guide • Place report at start of presentation: If selected, when executing a single report or the first report in a group of reports, the result is placed at the beginning of the current presentation. • Place report at end of presentation: If selected, when executing a single report or the first report in a group of reports, the result is placed at the end of the current presentation. In the Multiple report placement area: • Place next report on same slide as previous: If selected, displays the second and subsequent report results on the same slide as the previous report result in the presentation. • Place next report on a new slide: If selected, displays the second and subsequent report results on a new slide following the previous report result in the presentation. Selected by default. 3 In the PowerPoint folder, select Size: In the Result size limits area: • Maximum rows: Specifies the maximum number of rows that may be displayed in a report result. If the maximum is exceeded, the report display may be canceled or allowed to continue. Default setting is 50 rows; range 1 - 65,536 rows. • Maximum columns: Specifies the maximum number of columns that may be displayed in a report result. If the maximum is exceeded, the report display may be canceled or allowed to continue. Default setting is 15 columns; range 1 - 16,384 columns. • Maximum pages: Specifies the maximum number of pages that may be displayed in a report result. If the maximum is exceeded, the report display may be canceled or allowed to continue. Default setting is 256 pages; range 1 - 1,000 pages. In the Display size area: • Rows: Specifies the number of rows that are fetched and displayed in a single block. Default setting is 50 rows; range 1 - 1,000 rows. • Columns: Specifies the number of columns that are fetched and displayed in a single block. Default setting is 15 columns; range 1 - 256 columns. 134 Creating report-filled PowerPoint presentations © 2013 MicroStrategy, Inc. MicroStrategy Office User Guide 4 Using MicroStrategy Office in PowerPoint In the Flash size area: • Width: Specifies the default width in pixels of the Flash Player control used to display Flash-enabled documents in PowerPoint. Default setting is 500 pixels; range 100 - 1,000 pixels. • Height: Specifies the default height in pixels of the Flash Player control used to display Flash-enabled documents in PowerPoint. Default setting is 700 pixels; range 100 - 1,000 pixels. 4 In the PowerPoint folder, select Scale: In the Chart scale area: • Percentage of original width x height: Select to scale charts by a percentage of their original size as stored in their report definition. Default setting is selected, 100% x 100%; range 10 - 100%. • Lock aspect ratio: Select to preserve the aspect ratio of charts. Selected by default. • Fixed width x height: Select to define explicit width and height for charts in the specified units. Default setting is 400 x 300 pixels; range 0 - 2,112. In the Non-chart scale area: • Percentage of original width x height: Select to scale non-chart reports by a percentage of their original size as displayed in MicroStrategy. Range is 1 - 300 pixels. • Lock aspect ratio: Select to preserve the aspect ratio of non-charts. Selected by default. • Fixed width x height: Select to define explicit width and height for non-chart reports in the specified units. Default setting is 400 x 300 pixels; range 10 - 2,112. At the bottom of the PowerPoint scale options area: • Don’t exceed slide dimensions: Specifies a maximum size for reports as a percentage of the size of the slide in which they are displayed. Default setting is selected, 100%; range 10 - 500%. • Recalculate scale on refresh: Select to recalculate object sizes when refreshing, using the settings in the report’s properties. If cleared, the current size of the object is preserved when refreshing. Selected by default. 5 In the PowerPoint folder, select Position: © 2013 MicroStrategy, Inc. Creating report-filled PowerPoint presentations 135 4 Using MicroStrategy Office in PowerPoint MicroStrategy Office User Guide In the Position on slide area: • Horizontal: Determines the horizontal position of reports on the slide as an offset from a reference location in the specified units. Default setting is 20 points from the top left corner. • Vertical: Determines the vertical position of reports on the slide as an offset from a reference location in the specified units. Default setting is 20 points from the top left corner. • Center on slide: Select to center reports on the slide. Cleared by default. Below the PowerPoint position options area: • Recalculate position on refresh: Select to recalculate the position of objects when refreshing, using the settings in the report’s properties. If cleared, the current position of the object is preserved when refreshing. Selected by default. 6 In the PowerPoint folder, select Security. It is recommended to include reports in your Microsoft product as static images unless there is a requirement to modify the results. Select from the following: Include reports in PowerPoint as: • Interactive embedded Excel workbook: If selected, reports in PowerPoint are represented as a modifiable embedded Excel workbook. • Static picture: If selected, reports in PowerPoint are represented as a static image that cannot be modified. Selected by default. In the Static picture drop-down list, choose the image type from the list of supported types. Default setting is Bitmap. 7 Click OK to save your changes. The following contains additional information on formatting reports in PowerPoint: • Reports placed into a PowerPoint presentation as static pictures can be formatted using standard image formatting. For steps to test whether a report is displayed in PowerPoint as a static picture or an embedded Excel workbook, see Checking whether a report is embedded or a static image, page 56. • For information on modifying display properties such as whether the report is displayed as an image, applying borders, or applying AutoFit to 136 Creating report-filled PowerPoint presentations © 2013 MicroStrategy, Inc. MicroStrategy Office User Guide Using MicroStrategy Office in PowerPoint 4 rows and columns, see Formatting individual reports/documents after they are run, page 54. Using Microsoft Smart Tags in a presentation You can have words and phrases in your spreadsheet link directly to specific MicroStrategy reports and projects. Smart Tags allow you to associate MicroStrategy reports with specific phrases. A Smart Tag appears as a link in the presentation. When the user clicks the link and expands the icon, various options appear. A Smart Tag is shown expanded in the sample presentation below: For information on including Smart Tags in your presentation to provide users with links to reports and projects, see Using Microsoft Smart Tags as links to projects and reports, page 191. © 2013 MicroStrategy, Inc. Creating report-filled PowerPoint presentations 137 4 Using MicroStrategy Office in PowerPoint MicroStrategy Office User Guide Example: A presentation with multiple reports The following sample presentation contains multiple MicroStrategy reports that provide a variety of business data related to Phoebe’s bookstore. At first glance, the presentation is simple, containing static images, text, and report data. However, since the reports are connected to MicroStrategy functionality and your data source through MicroStrategy Office, when the manager needs to present this data in a meeting, she can refresh the data within the presentation, retrieving the most current business data from the data warehouse and other sources. This ensures that the presentation contains the most updated information available at the time. The manager can save the report and email it to her team. If her team members have access to MicroStrategy Office, they can view the presentation and refresh the data themselves. 138 Creating report-filled PowerPoint presentations © 2013 MicroStrategy, Inc. MicroStrategy Office User Guide 4 Using MicroStrategy Office in PowerPoint Example: Creating a personalized, auto-generated presentation You can design report-filled PowerPoint presentations for yourself or other users, who can then refresh the report data and present the latest information. Consider a manager who has several meetings this week: one with customers from the Northeast region, one with customers from the Southeast region, and one with customers from the Northwest region. She wants to present information about each region’s performance to its respective customers. In this situation, one might create three separate PowerPoint presentations to present to the customers from each region. Using MicroStrategy Office, you can create one presentation that contains prompted MicroStrategy reports, and then answer the prompts to filter the report data so that it displays what is of interest to a specific audience. The single presentation contains one set of reports, but depending on your prompt answers, you dynamically choose which data is displayed at a given time. The following procedure walks you through an example of how to create a PowerPoint presentation that contains multiple reports that can be reprompted to address different audiences. To create a personalized, auto-generated presentation 1 Open Microsoft PowerPoint and create a new presentation. © 2013 MicroStrategy, Inc. Creating report-filled PowerPoint presentations 139 4 Using MicroStrategy Office in PowerPoint MicroStrategy Office User Guide 2 Design the overall look and feel of each slide by applying PowerPoint templates, adding background colors, your company logo, and other elements to the presentation, as shown in the sample presentation below. To answer prompts each time the presentation is refreshed For this presentation, the manager plans to select different prompt answers based on the information she wishes to present to the different groups of customers. Therefore, she should specify that her prompt answers are not reused every time the presentation is refreshed. This ensures that she is prompted each time she refreshes the presentation, at which point she can choose to display new sets of data for each customer group. 3 On the MicroStrategy tab, click Options. The Options dialog box opens. 4 Under the General folder, expand the Prompt folder. 5 Select the Reuse Prompt Answers check box to ensure that you are not reprompted after refreshing reports. For more information about reusing prompt answers, see Reusing and sharing prompt answers, page 29. To reformat a report or document Some reports in the manager’s project use different colors and autostyles, but she wants each report in the presentation to look the same, so that the 140 Creating report-filled PowerPoint presentations © 2013 MicroStrategy, Inc. MicroStrategy Office User Guide 4 Using MicroStrategy Office in PowerPoint presentation has a professional and consistent look and feel. She can specify which MicroStrategy report formatting is displayed when the report is run in her presentation; this ensures that all reports have the same formatting. 6 To specify which MicroStrategy report formatting is applied to reports, under the General folder, expand the Grid folder and select the Formatting folder. Adjust the settings in the Formatting options area. For example, you can ensure that MicroStrategy currency formatting remains, but not color formatting. For formatting details, see Formatting reports and documents added to Microsoft, page 48. 7 Click OK. 8 Run the prompted reports in the PowerPoint presentation. For steps to run reports in PowerPoint presentations, see Adding reports and documents to a presentation, page 127. 9 Answer the prompt(s) to determine what data is displayed on the report. For example, in the following images, the Sales By Region report prompts the user to select a geographic region, so you can determine the region for which data is displayed. In this case, the manager wants to display the Northeast region only; therefore, she selects the appropriate prompt answer as shown below. © 2013 MicroStrategy, Inc. Creating report-filled PowerPoint presentations 141 4 Using MicroStrategy Office in PowerPoint MicroStrategy Office User Guide When the report runs, data from the Northeast region only is displayed, as shown below. 10 Resize, reposition, and reformat the grid and graph reports as desired. In this example, the manager might want to place additional reports on this slide that show related Northwest sales data. 11 Save the presentation once you finish designing it and adding reports. To refresh prompted reports In this example, the manager uses this presentation during her meeting with customers from the Northeast region. Tomorrow, she must present sales data to a group of customers from the Southeast region. She can refresh the presentation and enter a new prompt answer to ensure that the Southeast data is displayed on the presentation. 12 To refresh prompted reports, do one of the following: • Refresh and reprompt all of the reports in the presentation by clicking Refresh on the MicroStrategy tab. • Refresh and reprompt specific reports by clicking Reports on the MicroStrategy tab, right-clicking the reports to refresh, and selecting Refresh Report. 142 Creating report-filled PowerPoint presentations © 2013 MicroStrategy, Inc. MicroStrategy Office User Guide 4 Using MicroStrategy Office in PowerPoint 13 You are prompted to make selections for each report. For example, you can select the Southeast region in the Sales By Region report prompt. When the report runs, data for the Southeast region only is displayed, as shown below. Saving and securing a report-filled presentation You can save your report-filled presentation at any time using Microsoft PowerPoint. © 2013 MicroStrategy, Inc. Creating report-filled PowerPoint presentations 143 4 Using MicroStrategy Office in PowerPoint MicroStrategy Office User Guide When you save the presentation, all formatting is saved, as is the position of your reports and documents. The properties of each report in the presentation are also saved. These properties determine how the report is accessed and how it can be modified. You can secure the data within your presentation in several ways once you save it and are ready to distribute it to others. For more information, refer to Securely distributing business data, page 176. Analyzing business data and working with PowerPoint presentations This section provides steps to refresh and format MicroStrategy report data contained in a PowerPoint presentation. This section applies to the following types of business users: • MicroStrategy Office users who create PowerPoint presentations for personal use or to distribute to others. These users log in to MicroStrategy projects, run reports and documents into PowerPoint presentations, and refresh the report data within the reports. • Users who do not have access to MicroStrategy Office, but intend to present the report data within PowerPoint presentations. These users can perform these tasks using Microsoft functionality. on how the PowerPoint presentation was designed, you Depending may not be able to format or edit the presentation. Some designers lock these capabilities before distributing business data. In this case, you can view, but not edit, the report data within the presentation. Refreshing and formatting data in a presentation When you view a PowerPoint presentation that contains MicroStrategy report data, you may be able to refresh and reformat the data within it. 144 Analyzing business data and working with PowerPoint presentations © 2013 MicroStrategy, Inc. MicroStrategy Office User Guide 4 Using MicroStrategy Office in PowerPoint Refer to the table below to determine whether or not you can refresh and reformat the MicroStrategy reports and documents in your PowerPoint presentation. MicroStrategy Office user? Able to Refresh Reports and Documents? Able to Format Reports and Documents? Yes Yes. Yes. If you have MicroStrategy Office, you can refresh the reports and documents contained in the presentation. For information on formatting all reports and documents, see Formatting reports and documents added to Microsoft, page 48. No. Depends on the following: If you do not have MicroStrategy Office, you cannot refresh the reports and documents within the presentation. This means you cannot obtain the most current data from the data warehouse or other data sources. If you do not have MicroStrategy Office, any Flash-enabled documents included in the presentation are not displayed. You may be able to format certain aspects of the reports in the presentation, depending on how the presentation creator secured the file. For steps to format reports and documents, see Formatting reports and documents added to Microsoft, page 48. No For information on formatting specific reports and documents, see Formatting individual reports/documents after they are run, page 54. The report data in the presentation is intended for analytical use only. Refreshing reports and documents in a presentation Use the steps below to refresh the business data in the reports and documents in your PowerPoint presentation. You can refresh all reports in the presentation, or specific reports. Use the appropriate steps below. For an introduction to refreshing reports, see Refreshing reports to retrieve the latest data, page 37. © 2013 MicroStrategy, Inc. Analyzing business data and working with PowerPoint presentations 145 4 Using MicroStrategy Office in PowerPoint MicroStrategy Office User Guide To refresh all the reports and documents in a PowerPoint presentation 1 After running one or more reports in MicroStrategy Office, on the MicroStrategy tab, click Refresh. A progress dialog box is displayed, showing you which reports are being refreshed. The reports and documents are refreshed with the latest data from the data warehouse or other data sources. To refresh specific reports and documents in a PowerPoint presentation 1 After running one or more reports in MicroStrategy Office, on the MicroStrategy tab, click Reports. The Reports dialog box opens. A list of the reports that currently reside in your PowerPoint presentation is displayed. 2 Right-click the report or multi-select and right-click the reports to refresh. 3 Select Refresh Report. A progress dialog box is displayed, showing you which reports are being refreshed. The reports and documents are refreshed with the latest data from the data warehouse or other data sources. 146 Analyzing business data and working with PowerPoint presentations © 2013 MicroStrategy, Inc. 5 5. USING MICROSTRATEGY OFFICE IN WORD Designing and working with rich Word documents that contain business data Introduction You can add MicroStrategy reports to Word documents to produce a professional business analysis document that combines report data with supporting text. For example, you can create strategy or planning documents, annotated business reports, or regulatory forms that contain data in both graph and grid formats. You can then add text next to each graph or grid to explain the data to users or provide background information. This section provides steps to use MicroStrategy Office to create rich Microsoft Word documents that contain MicroStrategy reports and documents. It provides examples to create report-filled Word documents. This section is useful for the following types of users: • MicroStrategy Office users who log in to MicroStrategy projects, run reports in Word documents, and design other aspects of the Word documents. These users may use the document themselves or send the document to other users. Start with Creating report-filled Word documents, page 148 to design effective documents in Word and see examples of common report-filled Word documents and ideas you can take advantage of using © 2013 MicroStrategy, Inc. 147 5 Using MicroStrategy Office in Word MicroStrategy Office User Guide MicroStrategy Office in Word. Then see Working with Word documents that contain business data, page 163. • Business analysts who do not have access to MicroStrategy Office, but intend to analyze data within the Word documents. See Working with Word documents that contain business data, page 163 to analyze data in Word documents that contain MicroStrategy reports. Creating report-filled Word documents This section shows you how to add MicroStrategy reports to a Word document. This section also provides examples of different ways in which these report-filled Word documents are commonly used. For example, you can design a Word document that includes your company logo and other images, add reports to the document using MicroStrategy Office, and then distribute the document to others. Adding reports and documents to a Word document You can use MicroStrategy Office to add reports, Report Services documents, and HTML documents to a Microsoft Word document. Some Report Services documents have Flash Mode enabled, which allows users to view the document in Flash Mode in MicroStrategy Web. See the appropriate section below, depending on what type of report or document you want to add to Word: • Adding reports and HTML documents to a Word document, page 149 • Adding a Flash view of a Report Services document to a Word document, page 150 • Adding non-Flash, Report Services documents to a Word document, page 151 148 Creating report-filled Word documents © 2013 MicroStrategy, Inc. MicroStrategy Office User Guide 5 Using MicroStrategy Office in Word Adding reports and HTML documents to a Word document The steps below describe how to add reports and HTML documents to a Word document. Best Practices • It is recommended that you insert all reports in Word as static bitmaps. To do so, in Word, from the MicroStrategy tab, select Options. In the Word folder, select the Security folder. Select Static picture and, from the drop-down list, select Bitmap. • It is recommended that you include graphs as static images unless you need to modify the graphs in Word. Graphs as images will display more quickly and more closely match the appearance of the graphs in MicroStrategy Developer and Web. To do so, on the MicroStrategy tab, select Options. Under the General folder, select the Charts folder and select the Display Charts as images check box. To add MicroStrategy reports or HTML documents to a Word document 1 Open the Word document you want to add the report or HTML document to. 2 On the MicroStrategy tab, click Office and log into a project. 3 Locate the report or document to add to the Word document. 4 Click a location in the Word document to specify where the first report should be placed. add text around your report, create a table and place your Tocursor in it to ensure that the report is placed in the desired location within the table. Tables provide a structure in which you can place reports, text, and other graphics. You can use other sections of the table to add text, and so on, as shown in Example: Creating a report-filled Word document, page 159. 5 Run the report or HTML document by doing one of the following: • Double-click a report or document to add it to your Word document. The report is run in a default display type, which is determined by the format of the report in MicroStrategy. © 2013 MicroStrategy, Inc. Creating report-filled Word documents 149 5 Using MicroStrategy Office in Word • MicroStrategy Office User Guide To choose a specific display type in which to add them to the Word document, right-click the report or document (or multi-select several reports and documents). By default, the first report or document is placed in the location in which you placed your cursor. All other reports and documents are placed on subsequent pages. Adding a Flash view of a Report Services document to a Word document Some Report Services documents have Flash Mode enabled. This allows users to view the document in Flash Mode in MicroStrategy Web. You can add these Flash-enabled documents to a Word document. Users can do the following in Flash Mode: • Pivot row or column position in a grid or cross tabular grid of data. • Sort grid data. • Quickly switch between a grid and graph view. • Change the Group-by selection. too many Flash-enabled documents in a Word document Including can cause the Flash-enabled documents to fail to execute or refresh. The number of Flash-enabled documents that can be included in an Word document is limited by several factors, including the size of each Flash-enabled document, the number of widgets in each Flash-enabled document, and so on. Use the steps below to add a Flash-enabled document to a Word document. For steps to add a non-Flash document, see Adding non-Flash, Report Services documents to a Word document, page 151. Prerequisites • To add and view Flash-enabled documents, you must have Adobe® Flash Player installed on your computer. If Flash Player is not installed, when you run a Flash-enabled document a link to the Adobe download web site is displayed, from which you can install Flash Player. For information on certified and supported versions of Adobe Flash Player, see the MicroStrategy Readme. 150 Creating report-filled Word documents © 2013 MicroStrategy, Inc. MicroStrategy Office User Guide 5 Using MicroStrategy Office in Word To add a Flash-enabled Report Services document to a Word document 1 In Microsoft Word, open the Word document you want to add the Flash-enabled document to. 2 On the MicroStrategy tab, click Office and log into a project. 3 Locate the Flash-enabled document to add to the Word document. In the folder lists, Flash documents are displayed with the following icon. 4 Right-click the document and select Run Document to Flash Mode. The document is added to the Microsoft Word document. To send the Word document to other users, see Sending Microsoft files that include Flash-enabled documents, page 185 for information about ensuring that the recipients can view the Flash-enabled documents in the Word document. Adding non-Flash, Report Services documents to a Word document You can add a Report Services document to a Word document. Some Report Services documents have Flash enabled (for display in Flash mode in MicroStrategy Web), and others do not. You can add these non-Flash-enabled documents to a Word document. If the document you add contains items in the group-by field, each group-by element is displayed on its own page. Before adding a non-Flash document, you configure it to display using Open Office XML. Steps to do this are included below. Prerequisites • To add a non-Flash document to a Word document, you must be using Microsoft Office 2007 or higher, and MicroStrategy Web Services and Intelligence Server 9.2 or higher. For the latest requirements, see the MicroStrategy Readme. © 2013 MicroStrategy, Inc. Creating report-filled Word documents 151 5 Using MicroStrategy Office in Word MicroStrategy Office User Guide To add a non-Flash document to a Word document 1 On the MicroStrategy tab, click Options. The Options dialog box opens. 2 Under the General folder, select Document. 3 At the bottom of the pane, select the Use Open Office XML for view mode rendering check box. Selected by default. 4 Click OK. The Options dialog box closes. 5 Open the Word document you want to add the non-Flash document to. 6 On the MicroStrategy tab, click Office and log into a project. 7 Locate the non-Flash document to add to the Word document, then right-click the non-Flash document and select Run Document to View Mode. The document is displayed in Microsoft Word. • If any reports within the document contain prompts, you must answer them before the reports are executed. For steps to answer prompted reports and documents, see Answering prompted reports/ documents, page 28. Formatting graph images in non-Flash documents When a non-Flash document is added to a Word document, graphs contained within the non-Flash document can be configured to be either images or live graphs. A live graph can be formatted and changed. Prerequisites • Microsoft Office 2003, or Microsoft Office 2007 Service Pack 1 or higher To configure charts in non-Flash documents so that they can be formatted in the Word document 1 From the MicroStrategy tab click Options. 152 Creating report-filled Word documents © 2013 MicroStrategy, Inc. MicroStrategy Office User Guide 5 Using MicroStrategy Office in Word 2 Under the General folder, select Document. In the Chart Display area, the following options are available: • Display chart as image: This option displays an image of the graph that was created when the document was designed. This option is useful because it allows graph types that are not supported in Microsoft Office to appear exactly as they do in MicroStrategy Web or Developer. Selected by default. • Display live charts: This option allows graphs to be formatted and changed after they are displayed in MicroStrategy Office. Not all graph types are supported as live charts in MicroStrategy Office. • Use default from document definition: This option inherits the graph settings from the document definition, including whether the graph is displayed as an image or as a live chart. Creating and editing reports and documents in a Word document You can create reports and documents from within a Word document by launching MicroStrategy Web within MicroStrategy Office. MicroStrategy Web opens in Office so that you can create reports and documents in the same way that you do in Web. If you save the report or document in the Shared Reports folder, it saves in MicroStrategy Office, Web, and Developer. This way, you can access these reports in any environment in which you are working. For steps to create a new report or document using MicroStrategy Office, see Creating and editing reports and documents, page 167. Sizing, scaling, and securing reports in a Word document Once reports and documents are placed within your Word document, you can resize them, add titles and other text around data, and format other aspects of the Word document, using a combination of Microsoft and MicroStrategy Office functionality. © 2013 MicroStrategy, Inc. Creating report-filled Word documents 153 5 Using MicroStrategy Office in Word MicroStrategy Office User Guide For example, by default, reports too large to be displayed on a single page will run off the edge. You can scale your reports to ensure they always fit within the dimensions of the page. These options are shown below. Steps are below to change size, scale, and security using MicroStrategy Office. To change size, scale, and security 1 On the MicroStrategy tab, click Options. The Options dialog box opens. 2 Expand the Word folder and select Size. Select from the following: In the Result size limits area: • Maximum rows: Specifies the maximum number of rows that may be displayed in a report result. If the maximum is exceeded, the report display may be canceled or allowed to continue. Default setting is 50 rows; range 1 - 1,048,576 rows. • Maximum columns: Specifies the maximum number of columns that may be displayed in a report result. If the maximum is exceeded, the report display may be canceled or allowed to continue. Default setting is 15 columns; range 1 - 16,384 columns. • Maximum pages: Specifies the maximum number of pages that may be displayed in a report result. If the maximum is exceeded, the report 154 Creating report-filled Word documents © 2013 MicroStrategy, Inc. MicroStrategy Office User Guide 5 Using MicroStrategy Office in Word display may be canceled or allowed to continue. Default setting is 100 pages; range 1 - 1,000 pages. In the Display size area: • Rows: Specifies the number of rows that are fetched and displayed in a single block. Default setting is 50 rows; range 1 - 1,000 rows. • Columns: Specifies the number of columns that are fetched and displayed in a single block. Default setting is 15 columns; range 1 16,384 columns. In the Flash size area: • Height: Specifies the default height in pixels of the Flash Player control used to display Flash-enabled documents in Word. Default setting is 667 pixels; range 100 - 1,000 pixels. • Width: Specifies the default width in pixels of the Flash Player control used to display Flash-enabled documents in Word. Default setting is 733 pixels; range 100 - 1,000 pixels. 3 In the Word folder, select Scale. Select from the following: In the Chart scale area: • Percentage of original width x height: Select to scale charts by a percentage of their original size as stored in their report definition. Default setting is selected, 100% x 100%; range 1 - 300%. • Lock aspect ratio: Select to preserve the aspect ratio of charts. Selected by default. • Fixed width x height: Select to define width and height for charts in the specified units. Default setting is 400 x 300 pixels; range 10 2,112. In the Non-chart scale area: • Percentage of original width x height: Select to scale non-chart reports by a percentage of their original size. Default setting is selected, 100% x 100%; range 1 - 300%. • Lock aspect ratio: Select to preserve the aspect ratio of non-chart reports. Selected by default. • Fixed width x height: Select to define width and height for non-chart reports in the specified units. Default setting is 400 x 300 pixels; range 10 - 2,112. © 2013 MicroStrategy, Inc. Creating report-filled Word documents 155 5 Using MicroStrategy Office in Word MicroStrategy Office User Guide • Do not exceed page dimensions n%: Specifies the maximum size of reports as a percentage of the size of the Word document page in which they are displayed. Default setting is selected, 100%; range 10 500%. • Recalculate scale on refresh: Select to recalculate object sizes when refreshing using the settings in the report properties. If cleared, the current object size is preserved when refreshing. Selected by default. 4 In the Word folder, select Security. It is recommended to include reports in your Microsoft product as static images unless there is a requirement to modify the results. Select from the following: Include reports in Word as: • Interactive embedded Excel workbook: If selected, reports in Word are represented as a modifiable embedded Excel workbook. • Static picture: If selected, reports in Word are represented as a static image that cannot be modified. Selected by default. In the Static picture drop-down list, choose the image type from the list of supported types. Default setting is Bitmap. 5 Click OK to save your changes. The following contains additional information on formatting reports in Word: • Reports placed into a Word document as static pictures can only have basic image formatting. For steps to test whether a report is displayed in Word as a static picture or an embedded Excel workbook, see Checking whether a report is embedded or a static image, page 56. • For information on modifying display properties such as whether the report is displayed as an image, applying borders, or applying AutoFit to rows and columns, see Formatting individual reports/documents after they are run, page 54. Using Microsoft Smart Tags in a Word document You can have words and phrases in your spreadsheet link directly to specific MicroStrategy reports and projects. Smart Tags allow you to associate MicroStrategy reports with specific phrases. A Smart Tag appears as a link in the Word document. When the user clicks the link and expands the icon, 156 Creating report-filled Word documents © 2013 MicroStrategy, Inc. MicroStrategy Office User Guide Using MicroStrategy Office in Word 5 various options appear. A Smart Tag is shown expanded in the sample Word document below: For information on including Smart Tags in your Word document to provide users with links to reports and projects, see Using Microsoft Smart Tags as links to projects and reports, page 191. © 2013 MicroStrategy, Inc. Creating report-filled Word documents 157 5 Using MicroStrategy Office in Word MicroStrategy Office User Guide Example: A sample report-filled Word document The following example highlights the type of Word documents you can create using MicroStrategy Office with Microsoft Word. 158 Creating report-filled Word documents © 2013 MicroStrategy, Inc. MicroStrategy Office User Guide 5 Using MicroStrategy Office in Word Example: Creating a report-filled Word document The following procedure walks you through an example of how to create a Word document that contains multiple reports, text, a header, and other graphics. To create and refresh a richly-formatted, report-filled Word document 1 Open Microsoft Word and create a new document. © 2013 MicroStrategy, Inc. Creating report-filled Word documents 159 5 Using MicroStrategy Office in Word MicroStrategy Office User Guide 2 Access the Header/Footer options in Microsoft Word and insert your company’s logo or another graphic into the document’s header, as shown in the example below. You can also add page numbers, the name of the document, and other content to the document’s footer (not shown). 3 Create Word tables to define the overall structure of the current page in your Word document. Tables allow you to better position text around your reports and other graphics. You can also type some initial text into the tables, as shown below. 4 Place your cursor into the table cell in which you want to place a report. 5 On the MicroStrategy tab, click Office and log into the project that contains the reports or documents that you want to display in your Word document. 160 Creating report-filled Word documents © 2013 MicroStrategy, Inc. MicroStrategy Office User Guide 5 Using MicroStrategy Office in Word 6 Locate and run the reports in the Word document. 7 The reports are placed in your cursor’s location. Repeat these steps for each table cell in which you want to place a report, then resize and reposition as necessary. 8 Add any supporting text or graphics to the Word document and modify the chart type of any graphs as desired. © 2013 MicroStrategy, Inc. Creating report-filled Word documents 161 5 Using MicroStrategy Office in Word MicroStrategy Office User Guide 9 Create additional pages within the Word document using the steps above. Pages of a sample document are shown below. 10 To refresh the reports in the document so that they contain the latest data from your data source, on the MicroStrategy tab, click Refresh. Each report is refreshed. 11 Once you are finished designing and refreshing your Word document, save it. You can print or distribute the Word document to your colleagues. If your colleagues have access to MicroStrategy Office, they can refresh the data in the reports and view data to which they have access, as explained in Securely distributing business data, page 176. 162 Creating report-filled Word documents © 2013 MicroStrategy, Inc. MicroStrategy Office User Guide 5 Using MicroStrategy Office in Word Saving and securing a report-filled document You can save your report-filled Word document at any time using Microsoft Word. When you save the Word document, all formatting is saved, as is the position of your reports and documents. The properties of each report in the document are also saved. These properties determine how the report is accessed and how it can be modified. You can secure the data within your Word document in several ways once you save it and are ready to distribute it to others. For more information, refer to Securely distributing business data, page 176. Working with Word documents that contain business data This section provides steps to refresh and format MicroStrategy report data contained in a Word document. This section applies to the following types of business users: • MicroStrategy Office users who create Word documents for personal use or to distribute to others. These users log in to MicroStrategy projects, refresh the report data within the Word document, and analyze the report data. • Users who do not have access to MicroStrategy Office, but intend to analyze the report data within the document. These users can perform these tasks using Microsoft functionality. on how the Word document was designed, you may not Depending be able to format or edit the document. Some designers lock these capabilities before distributing business data. In this case, you can view, but not edit, the report data within the Word document. Refreshing and reformatting data in a Word document When you view a Word document that contains MicroStrategy report data, you may be able to refresh and reformat the data within it. © 2013 MicroStrategy, Inc. Working with Word documents that contain business data 163 5 Using MicroStrategy Office in Word MicroStrategy Office User Guide Refer to the table below to determine whether or not you can refresh and reformat the MicroStrategy reports and documents in your Word document. MicroStrategy Office user? Able to Refresh Reports and Documents? Able to Format Reports and Documents? Yes Yes. Yes. If you have MicroStrategy Office, you can refresh the reports and documents contained in the Word document. For information on formatting all reports and documents, see Formatting reports and documents added to Microsoft, page 48. For information on formatting specific reports and documents, see Formatting individual reports/documents after they are run, page 54. No No. Depends on the following: If you do not have MicroStrategy Office, you cannot refresh the reports and documents within the Word document. This means you cannot obtain the most current data from the data warehouse or other data sources. If you do not have MicroStrategy Office, any Flash-enabled documents included in the Word document are not displayed. You may be able to format certain aspects of the reports in the Word document, depending on how the document creator secured the file. For steps to format reports and documents, see Formatting reports and documents added to Microsoft, page 48. The report data in the Word document is intended for analytical use only. Refreshing reports and documents in a Word document Use the steps below to refresh the business data in the reports and documents in your Word document. You can refresh all reports in the Word document, or specific reports. Use the appropriate steps below. For an introduction to refreshing reports, see Refreshing reports to retrieve the latest data, page 37. To refresh all of the reports and documents in a Word document 1 After running one or more reports in MicroStrategy Office, on the MicroStrategy tab, click Refresh. 164 Working with Word documents that contain business data © 2013 MicroStrategy, Inc. MicroStrategy Office User Guide Using MicroStrategy Office in Word 5 A progress dialog box is displayed, showing you which reports are being refreshed. The reports and documents are refreshed with the latest data from your data sources. To refresh specific reports and documents in a Word document 1 After running one or more reports in MicroStrategy Office, on the MicroStrategy tab, click Reports. The Reports dialog box opens. A list of the reports that currently reside in your Word document is displayed. 2 Right-click the report or multi-select and right-click the reports to refresh. 3 Select Refresh Report. A progress dialog box is displayed, showing you which reports are being refreshed. The reports and documents are refreshed with the latest data from your data sources. © 2013 MicroStrategy, Inc. Working with Word documents that contain business data 165 5 Using MicroStrategy Office in Word 166 Working with Word documents that contain business data MicroStrategy Office User Guide © 2013 MicroStrategy, Inc. 6 6. CREATING AND EDITING REPORTS AND OBJECTS Introduction This section provides steps to create new reports and documents from within your Microsoft product using MicroStrategy Office. This section also contains directions to create and edit prompts and filters. You can also create MicroStrategy folders and shortcuts, as well as rename, copy, move, or delete MicroStrategy objects. This section includes the following: • Creating and editing reports and documents, page 167 • Creating and editing prompts, page 171 • Creating and editing filters, page 173 Creating and editing reports and documents You can create and edit MicroStrategy reports and documents from within your Microsoft product, using MicroStrategy Office. You can create reports © 2013 MicroStrategy, Inc. Creating and editing reports and documents 167 6 Creating and Editing Reports and Objects MicroStrategy Office User Guide and documents from scratch and from templates, and edit existing reports and documents. This allows you to create your workbook, presentation, or Word document and add reports, organize the workbook, presentation, or Word document, recognize that you need a new report, and then create the necessary report without needing to open MicroStrategy Web or Developer. To create a new report, see Creating a new report, page 169. To create a new document, see Creating a new Report Services document, page 170. Prerequisites • You should be familiar with report and/or document creation. Details to create basic reports are in the MicroStrategy Basic Reporting Guide. Details to create basic documents are in the MicroStrategy Report Services Document Creation Guide. • Connectivity must be established between MicroStrategy Office and MicroStrategy Web. If this connectivity is not established, the MicroStrategy Office Report Editor and the MicroStrategy Office Document Editor will not open. See Establishing connectivity to MicroStrategy applications, page 234. • Several privileges are required in MicroStrategy to create and edit reports or documents using MicroStrategy Office: Task Required Web Privileges Create a report • Web User • Web Create New Report • Web Use Design Mode Edit a report • Web User • Web Use Design Mode Create or edit a document • Web User • Web Document Design • Web Execute Document 168 Creating and editing reports and documents © 2013 MicroStrategy, Inc. MicroStrategy Office User Guide 6 Creating and Editing Reports and Objects Creating a new report You can create a report from scratch by adding each object required for the report, or you can create a report using a template which already contains standard objects for commonly used types of reports. Steps to create a report and to edit a report from MicroStrategy Office are below. To create a new report 1 On the MicroStrategy tab, click Office and log into a project. 2 From the File menu, point to New. 3 Choose one of the following options, depending on whether you want to create a report from scratch or based on a template: • To create a report from scratch by adding all objects required for the report, select Report. The MicroStrategy Office Report Editor opens. • To create a report from a template which already contains standard objects for commonly used types of reports, select Report from template. The MicroStrategy Office Report Editor opens, displaying a list of available report templates. Choose a template from the list. The template is displayed in the MicroStrategy Office Report Editor. 4 Create and save your new report. For details, see the MicroStrategy Basic Reporting Guide. If you save your report in a folder other than the current folder, you may need to refresh the folder to see your new report. Editing a report Details to edit a report are in the Basic Reporting Guide. The steps below show you how to access the Report Editor through MicroStrategy Office. To move a report to a new location, see Moving reports and documents, page 83. © 2013 MicroStrategy, Inc. Creating and editing reports and documents 169 6 Creating and Editing Reports and Objects MicroStrategy Office User Guide To edit a report 1 On the MicroStrategy tab, click Office and log into a project. 2 Browse to the report in MicroStrategy Office and select it. 3 From the Reports menu, select Edit. The MicroStrategy Office Report Editor opens. 4 Edit the report. For details, see the MicroStrategy Basic Reporting Guide. Creating a new Report Services document You can create a new document from scratch, or you can create a new document using a template. Steps to create a new document and to edit a document using MicroStrategy Office are below. To create a new document 1 On the MicroStrategy tab, click Office and log into a project. 2 From the File menu, point to New. 3 Choose one of the following options, depending on whether you want to create a document from scratch or based on a template: • To create a document from scratch by adding all the objects required for the document, select Document. The MicroStrategy Office Document Editor opens. • To create a document from a template which already contains standard objects for commonly used types of documents, select Document from template. Choose a template from the list. The template is displayed in the MicroStrategy Office Document Editor. 4 Create and save your new document. For details, see the MicroStrategy Document Creation Guide or the MicroStrategy Web Help. If you save your document in a folder other than the current folder, you may need to refresh the folder to see your new document. 170 Creating and editing reports and documents © 2013 MicroStrategy, Inc. MicroStrategy Office User Guide Creating and Editing Reports and Objects 6 Editing a Report Services document Details to edit a Report Services document are in the MicroStrategy Document Creation Guide. The steps below show you how to access the Document Editor through MicroStrategy Office. To move a document to a new location, see Moving reports and documents, page 83. To edit a document 1 On the MicroStrategy tab, click Office and log into a project. 2 Browse to the document in MicroStrategy Office and select it. 3 From the Reports menu, select Edit. The MicroStrategy Office Document Editor opens. 4 Edit the document. For details, see the MicroStrategy Document Creation Guide or the MicroStrategy Web Help. Creating and editing prompts A prompt is a question the system presents to a user when a report is executed. How the user answers the question determines what data is displayed on the report when it is returned from your data source. For an introduction to prompts, how prompts save the report designer time, and how prompts work with MicroStrategy security filters, see the MicroStrategy Basic Reporting Guide. You can create and edit prompts using MicroStrategy Office. Multiple pieces make up a prompt, and these pieces control how a prompt is displayed and how it functions. These components include the following: • Answer requirement: This component lets you determine whether users are required to answer the prompt or an answer is optional. If an answer is required, a report cannot be executed until an answer is provided. © 2013 MicroStrategy, Inc. Creating and editing prompts 171 6 Creating and Editing Reports and Objects MicroStrategy Office User Guide • Default prompt answers: This component lets you include a pre-selected answer for the prompt, which the user can then accept, replace with a different answer, or accept and add more answers. • Title and description: This component lets you provide a useful name and description for the prompt, which can significantly impact whether a user finds prompts to be simple or complex. • Style: This component determines the appearance of the prompt and the layout of how users select answers for the prompt. Consider your users' needs and the purpose of the report and the objects on it when you decide on these prompt components. If you plan to apply a schedule to a prompted report, the decisions you make about answer requirements and default answers will affect how the report is filtered when it is automatically executed on schedule. For details and examples of each of these components and how they work together, see the MicroStrategy Basic Reporting Guide. Steps to access the Prompt Editor in MicroStrategy Office are below. See the Basic Reporting Guide for details to create and edit each type of prompt. Accessing the MicroStrategy Office Prompt Editor Use the steps below to open the Prompt Editor in MicroStrategy Office, and then use the detailed steps in the Basic Reporting Guide to create or edit all types of prompts. To access the Prompt Editor in MicroStrategy Office 1 On the MicroStrategy tab, click Office and log into a project. 2 Perform one of the following depending on whether you want to create a new prompt or edit an existing prompt: • To create a new prompt, from the File menu, point to New, and select Prompt. • To edit an existing prompt, navigate to the prompt that you want to edit, right-click, and select Edit. The MicroStrategy Office Prompt Editor opens. 172 Creating and editing prompts © 2013 MicroStrategy, Inc. MicroStrategy Office User Guide 6 Creating and Editing Reports and Objects 3 Create a new prompt or make the appropriate changes to an existing prompt. For detailed steps, see the MicroStrategy Basic Reporting Guide. 4 Click Save to save the prompt. Creating and editing filters An important step in designing a report is ensuring that the correct data is returned from your data sources to be displayed on the report. To do this, you can add a filter to the report. A filter screens data in your data source to determine whether the data should be included in or excluded from the calculations of the report results. A filter is not required in a report, although reports without filters may return too much data to be displayed effectively. For an introduction to filters, images of the various types of filters, and diagrams and examples to show how to join filter qualifications with operators such as AND and OR, see the MicroStrategy Basic Reporting Guide. Steps to access the Filter Editor in MicroStrategy Office are below. See the Basic Reporting Guide for details to create and edit each type of filter. Accessing the MicroStrategy Office Filter Editor Use the steps below to open the Filter Editor in MicroStrategy Office, and then use the detailed steps in the Basic Reporting Guide to create or edit all types of filters. To access the Filter Editor in MicroStrategy Office 1 Open MicroStrategy Office and log in to the project you want to create the filter in. © 2013 MicroStrategy, Inc. Creating and editing filters 173 6 Creating and Editing Reports and Objects MicroStrategy Office User Guide 2 Perform one of the following depending on whether you want to create a new filter or edit an existing filter: • To create a new filter, from the File menu, point to New, and select Filter. • To edit an existing filter, browse to the location of the filter, right-click, and select Edit. The MicroStrategy Office Filter Editor opens. 3 Create a new filter or make the appropriate changes to an existing filter. For detailed steps, see the MicroStrategy Basic Reporting Guide. 4 Click Save to save the filter. 174 Creating and editing filters © 2013 MicroStrategy, Inc. 7 7. SECURING AND DISTRIBUTING DATA Data security and Smart Tags Introduction You can distribute Excel workbooks, PowerPoint presentations, or Word documents to other users. You do this by either emailing the files or placing them on a secure file server. In either case, you will want to ensure that only authorized users are able to view the data within the workbooks, presentations, or Word documents. You may also want to control if, and how, the report data can be modified in any way. You can also associate reports, Report Services documents, and projects with Microsoft Smart Tags inside your Microsoft product. Smart Tags act as placeholders for and links to certain data. This section includes the following information: • Set up security in MicroStrategy Office. See Securely distributing business data, page 176. • Use Microsoft Smart Tags. See Using Microsoft Smart Tags as links to projects and reports, page 191 © 2013 MicroStrategy, Inc. 175 7 Securing and Distributing Data • MicroStrategy Office User Guide Determine which elements within Microsoft Office files can be refreshed or modified by their recipients. See Enabling reports/documents exported from Web to be refreshed, page 201 Securely distributing business data Before you distribute sensitive business data to others, you should consider the different ways in which you can secure the data within an Excel workbook, PowerPoint presentation, or Word document. Each of the sections below describes specific methods to secure data. • Excluding MicroStrategy Office login information when saving Microsoft files, page 176 • Clearing report and document data to control user access, page 178 • Determining if and how report data is refreshed, page 179 • Controlling whether report data can be modified, page 182 • Sending Microsoft files that include Flash-enabled documents, page 185 Excluding MicroStrategy Office login information when saving Microsoft files MicroStrategy Office saves the following login connection information for each report in a workbook, presentation, or Word document by default: • Authentication mode (for example, Standard, Windows NT, LDAP, and so on) • Login ID • MicroStrategy project source used to run the specific report • MicroStrategy Intelligence Server name • MicroStrategy project and project ID in which the report exists 176 Securely distributing business data © 2013 MicroStrategy, Inc. MicroStrategy Office User Guide 7 Securing and Distributing Data This information reflects the connection details used to connect to and refresh the report or document. can view this information by clicking Reports on the You MicroStrategy tab, then right-click a report, select Properties, and expand Connection Settings. For example, you log in to MicroStrategy Office as WJackson, run reports in an Excel workbook, and save and close the workbook. When you reopen and refresh the workbook, the Connect to Project dialog box opens with WJackson already entered in the Login ID field. When you log in, MicroStrategy Office attempts to connect you to the same Intelligence Server and project used to run the reports. This occurs because your login information was saved when you originally ran the reports. This is convenient if you are the only person working in a workbook, presentation, or Word document. However, if other users will open and refresh the file, you may want to ensure that your login information is not saved in the file. Use the following steps to determine whether your login ID name is saved in your Microsoft file. For steps to require login when a Smart Tag is selected, see Requiring login when a Smart Tag is clicked, page 199. To specify whether your login ID is saved in your Microsoft file 1 On a computer with MicroStrategy Office installed, open Microsoft Excel, PowerPoint, or Word. 2 On the MicroStrategy tab, click Options. The Options dialog box opens. 3 Under the General folder, select the Security folder. 4 Select from the following: • If you created the workbook, presentation, or Word document and will be the only user refreshing it, select the Persist report properties check box, then select the Persist login ID check box. This allows your login ID to be saved in the file. Both options are selected by default. © 2013 MicroStrategy, Inc. Securely distributing business data 177 7 Securing and Distributing Data • MicroStrategy Office User Guide If other users will refresh the workbook, presentation, or Word document, clear the Persist login ID check box. Your login ID is not saved in the file. 5 To ensure that only the owner of the Microsoft file can change who can refresh data on the report, select Lock persistence. Cleared by default. 6 Click OK. Clearing report and document data to control user access Clearing data from workbooks, presentations, and Word documents before distributing the files to other users is a secure and convenient way to ensure that only MicroStrategy Office users can view the data and other information in the reports/documents within those files. Clearing the data from the reports and documents in your workbook, presentation, or Word document is not the same as deleting the actual reports and documents. When you clear reports and documents, the metric data within the reports and documents, and optionally the information displayed in column and row headers, are hidden from view. However, the reports and documents themselves are not removed permanently. A link between the reports/documents and MicroStrategy Intelligence Server remains in the locations of the reports/documents. When a user opens the files, logs in, and refreshes reports, he can only view the reports, documents, and data to which his login gives him access. For example, you create a workbook that contains multiple reports. Each report corresponds to one of your employees’ accounts. You may be hesitant to email this workbook out to all of the employees since it contains specific information about other employees in it. By clearing the data for the reports in this workbook, you ensure that each employee only sees data that he has permission to view. scenario assumes that your users have MicroStrategy Office This installed and configured to connect to Web Services, allowing them to log in to MicroStrategy Office and refresh report data. Use the following steps to clear MicroStrategy data and/or column and row header information from a workbook, presentation, or Word document. 178 Securely distributing business data © 2013 MicroStrategy, Inc. MicroStrategy Office User Guide 7 Securing and Distributing Data For steps to delete a report or document completely from a Microsoft product, see Deleting reports from workbooks, presentations, and Word documents, page 45. To clear data from a workbook, presentation, or Word document 1 On a computer with MicroStrategy Office installed, open Microsoft Excel, PowerPoint, or Word. 2 On the MicroStrategy tab, click Reports. The Reports dialog box opens showing all of the reports and documents in your workbook, presentation, or Word document. 3 Do one of the following: • To clear the data from a report or document, right-click the report or document and select Clear Report Data. • To clear the data as well as the column and row headers, right-click the report or document and select Clear Report. clear the data and/or the column and row headers from Tomultiple reports or documents, hold CTRL and select the reports and documents. The report(s) and document(s) are no longer visible in your workbook, presentation, or Word document, but a link still exists between MicroStrategy and the location in which the reports and documents reside. 4 Save and close the workbook, presentation, or Word document. The data and/or column and row header information is blank until the report or document is refreshed. When a user refreshes the workbook, presentation, or Word document, the reports/documents are retrieved, placed in their original location, and the data and/or report information is visible. Determining if and how report data is refreshed When you send workbooks, presentations, or Word documents to others, you can determine whether or not the recipient is or should be able to obtain the most current data from your data source by refreshing the data. © 2013 MicroStrategy, Inc. Securely distributing business data 179 7 Securing and Distributing Data MicroStrategy Office User Guide • If the recipients do not have MicroStrategy Office installed and configured on their computers, they cannot refresh workbooks, presentations, or Word documents to see the latest data from MicroStrategy. When these users receive the files, they are opening static files that contain reports. Although they can perform a variety of data manipulations using Microsoft functionality, they cannot access MicroStrategy to retrieve the most current information from your data source. • If the recipients have MicroStrategy Office, you can control the following: • Ensure that the report data included in the file is the only data the recipient sees. The recipient is unable to obtain updated data from data sources. For steps, see Disabling the ability to refresh or reprompt data, page 180. • Ensure that data is refreshed automatically when a file is opened. If you allow users to access the latest data from your data source, this option causes the data refresh to occur automatically and the user does not need to manually refresh. For steps, see Ensuring that data is refreshed automatically, page 181. Disabling the ability to refresh or reprompt data You can ensure that users cannot refresh or reprompt reports and documents. This means that users cannot refresh reports and documents with the latest data from your data source. To ensure users cannot refresh or reprompt reports and documents 1 On a computer with MicroStrategy Office installed, open Microsoft Excel, PowerPoint, or Word. 2 On the MicroStrategy tab, click Options. The Options dialog box opens. 3 Under the General folder, select the Security folder. 4 Clear the Persist report properties check box. Selected by default. 180 Securely distributing business data © 2013 MicroStrategy, Inc. MicroStrategy Office User Guide 7 Securing and Distributing Data 5 Click OK. Any reports you run in your Microsoft product from this point forward cannot be refreshed or reprompted, and are not available in the Reports list. Note the following: – Any reports or documents you add after you clear the Persist report properties check box and click OK cannot be refreshed. To ensure that reports and documents already in the file cannot be refreshed, you must delete the report, clear the Persist report properties check box, and then re-execute the report. To delete a report, see Deleting reports from workbooks, presentations, and Word documents, page 45. – If you manually delete any report data before closing the file, that data does not appear when you or another user reopens the workbook, presentation, or Word document. Ensuring that data is refreshed automatically When a user first opens a workbook, presentation, or Word document that contains MicroStrategy reports, by default he is notified that the file contains reports that can be refreshed. You can specify that all the MicroStrategy reports and documents are automatically refreshed when the file is opened. To ensure that report data is automatically refreshed when a file is opened 1 On a computer with MicroStrategy Office installed, open Microsoft Excel, PowerPoint, or Word. 2 On the MicroStrategy tab, click Options. The Options dialog box opens. 3 Under the General folder, select the Refresh reports when documents are opened check box. you select the option above, you can also select the Ask before Ifrefreshing check box to ensure that you are asked whether or not reports should be refreshed before the reports are displayed. 4 Click OK. © 2013 MicroStrategy, Inc. Securely distributing business data 181 7 Securing and Distributing Data MicroStrategy Office User Guide Controlling whether report data can be modified If you do not intend to modify report data and do not want others to modify data, you can add reports to Word documents and PowerPoint presentations as static images. For example, converting report data to a static image restricts other users from converting data to a PivotChart. A static image also improves report execution performance, so this can be a good option for some large reports. Graphs added as static images appear exactly as they do in Developer or Web. You can resize, reposition, and format a static image of a report using standard Word or PowerPoint image formatting, but you cannot manually edit the data in the report. Reports added as static images can still be refreshed to retrieve the most current data from your data source. You can choose to have only graph reports added as static images; for steps, see Adding graph reports as static images, page 183. You can also restrict users from modifying report and document properties. For steps, see Ensuring recipients cannot modify individual report properties, page 184. As an alternative to adding a report as a static image, you can add reports to Word and PowerPoint as embedded Excel workbooks. When a report is placed into a document or presentation as an embedded workbook, you can work with the report as if it were an Excel workbook, for example, working within the individual cells of data using Excel functionality. You can secure an Excel workbook using standard Microsoft security features. To embed reports as Excel workbooks, see Adding reports as static images or embedded Excel workbooks, page 71. Adding reports as static images Use the appropriate steps below depending on whether you want to add all reports as static images, or you want to add individual reports as static images. To add all reports as static images by default 1 On a computer with MicroStrategy Office installed, open Microsoft PowerPoint or Word. 182 Securely distributing business data © 2013 MicroStrategy, Inc. MicroStrategy Office User Guide 7 Securing and Distributing Data 2 On the MicroStrategy tab, click Options. The Options dialog box opens. 3 In the Word folder and the PowerPoint folder, select the Security folder. 4 In the Report Modification area, select Static picture. 5 You can select the type of image using the Static Picture drop-down list. Bitmap is selected by default. 6 Click OK. To add individual reports as static images 1 On a computer with MicroStrategy Office installed, open Microsoft PowerPoint or Word. 2 On the MicroStrategy tab, click Reports. A list of the reports in your presentation or Word document is displayed. 3 Right-click the report and select Properties. The Report Properties dialog box opens. 4 From the Paste Type drop-down list in the Word Placement or PowerPoint Placement settings, select a format in which to add the report. 5 Click OK. Adding graph reports as static images You can choose to have only graph reports added as static images. Include graphs as static images if you want to ensure that the type of graph you include in the Microsoft Office file cannot be modified by others. To add graph reports as static images 1 On a computer with MicroStrategy Office installed, open Microsoft PowerPoint or Word. 2 On the MicroStrategy tab, click Options. The Options dialog box opens. © 2013 MicroStrategy, Inc. Securely distributing business data 183 7 Securing and Distributing Data MicroStrategy Office User Guide 3 Under the General folder, select the Chart folder. 4 In the Chart Display area, select the Display charts as images check box. 5 Click OK. Ensuring recipients cannot modify individual report properties You can ensure that recipients of your workbooks, presentations, and Word documents cannot modify the individual properties of reports. Each report you place within a workbook, presentation, or Word document has its own properties that determine how the report is executed, how users are authenticated to see the report’s data, and how users can work with the data in the report. These properties are important because they determine how the data within the files is viewed by others and how users can move or format the data within the files. These properties are applied when the report is refreshed within a Microsoft product. These properties are referred to as persisted properties because they remain in workbooks, presentations, and Word documents even after you close the files, and they are used to connect to the MicroStrategy platform and refresh data. Report properties are displayed in the Report Properties dialog box for each report. For a list of report properties and steps to view and modify the properties of specific reports, see Formatting individual reports/documents after they are run, page 54. Use the appropriate steps below to limit users’ modification abilities for all reports, or for a specific report. To ensure other users cannot modify persisted report properties for all reports 1 On a computer with MicroStrategy Office installed, open Microsoft Excel, PowerPoint, or Word. 2 On the MicroStrategy tab, click Options. The Options dialog box opens. 3 Under the General folder, expand the Security folder. 184 Securely distributing business data © 2013 MicroStrategy, Inc. MicroStrategy Office User Guide 7 Securing and Distributing Data 4 In the Persistence area, make sure Persist report properties is selected, and then select the Lock persistence check box. 5 Click OK. 6 Run reports and documents. Other users will be able to view, but not modify the properties of each report. To ensure other users cannot modify persisted properties for a specific report 1 On a computer with MicroStrategy Office installed, open Microsoft Excel, PowerPoint, or Word. 2 On the MicroStrategy tab, click Reports. The Reports dialog box opens. 3 Right-click the report whose persisted settings you want to lock and select Properties. The Report Properties dialog box opens. 4 In the Report Settings area, from the Lock drop-down list, select True to ensure that you are the only user that can modify the report’s persisted settings. No other users can edit the settings within the Report Properties dialog box for the report. 5 Click OK. 6 Save the workbook, presentation, or Word document. When another user logs in and refreshes the report or document, he can view, but not modify, the list of properties in the Report Properties dialog box. Sending Microsoft files that include Flash-enabled documents Some of the workbooks, presentations, or Word documents that you send to your colleagues may contain Flash-enabled documents. For steps to send Microsoft files that contain a Flash-enabled Report Services document, see Packaging MicroStrategy Flash dashboards, page 186. © 2013 MicroStrategy, Inc. Securely distributing business data 185 7 Securing and Distributing Data MicroStrategy Office User Guide Whether or not your colleagues can view the Flash-enabled documents depends on several factors. • If the person receiving the workbook, presentation, or Word document does not have MicroStrategy Office, he cannot view any included Flash-enabled documents. • If the person receiving the workbook, presentation, or Word document has MicroStrategy Office, he can view the Flash-enabled documents if either of the following is configured: If the Flash .SWF files, images, and data files exist in the same folder on the recipient’s computer as they do on the sender’s computer. When the recipient opens the Microsoft file, the Flash-enabled documents are displayed. The recipient is not required to connect to a MicroStrategy project to view the documents. If the Flash .SWF files, images, and data files do not exist in the same folder on the recipient’s computer as they do on the sender’s computer, the recipient must refresh the Microsoft file. After the workbook, presentation, or Word document is refreshed, the Flash-enabled documents are displayed. You can define the following for how MicroStrategy Office handles Flash files: • When a user runs a Flash-enabled Report Services document in a workbook, presentation, or Word document, Flash .SWF files, images, and other Flash data files are downloaded. These files allow users to view and interact with the Flash-enabled documents in a Microsoft product. For steps to allow Flash files to be downloaded, see Allowing Flash data and third-party files to be downloaded, page 188. • You can define where Flash files are stored; see Determining where Flash files are stored, page 190. • You can determine whether Flash files are downloaded on a user’s computer; see Determining whether Flash files are downloaded on a user’s computer, page 189. • You can determine how Flash-enabled files are refreshed; see Determining how Flash-enabled documents are refreshed, page 191. Packaging MicroStrategy Flash dashboards When a MicroStrategy Flash dashboard is created, several files are created for the dashboard to work properly. These files include Microsoft Office files, 186 Securely distributing business data © 2013 MicroStrategy, Inc. MicroStrategy Office User Guide 7 Securing and Distributing Data Flash files, and all supporting data, resources, and image files necessary to display the dashboard. Since searching for the necessary files to distribute a dashboard can sometimes be time-consuming and challenging, MicroStrategy Office includes the Office Package Wizard. The Office Package Wizard walks you through steps to package all of the necessary files to copy a Microsoft file containing a Flash document to a .zip file, and to extract these files. For steps to package a file containing a Flash dashboard, see To package a Flash dashboard using the Office Package Wizard, page 187. For steps to extract a file containing a Flash dashboard from a package, see To extract a Flash dashboard using the Package Wizard, page 187. To package a Flash dashboard using the Office Package Wizard 1 Make sure the Microsoft file you want to package is closed. 2 On the MicroStrategy tab, select Package Wizard. The Package Utility Wizard opens. 3 Read the introductory information and click Next. 4 Select Package and click Next. 5 Click Add. Locate the Excel, Word, or PowerPoint file(s) that you want to package and click Open. 6 Click Next. 7 Review the summary screen and click Finish. The files are packaged into a .zip file in the specified folder. To extract a Flash dashboard using the Package Wizard 1 On the MicroStrategy tab, select Package Wizard. The Package Utility Wizard opens. 2 Read the introductory information and click Next. 3 Select Extract and click Next. © 2013 MicroStrategy, Inc. Securely distributing business data 187 7 Securing and Distributing Data MicroStrategy Office User Guide 4 Click Add. The Choose Package File dialog box opens. 5 Locate the destination folder that contains the packaged files that you want to extract. Select the file, then click Open. 6 Click Next. 7 Type a destination folder for the extracted files and click Next. 8 Review the summary screen and click Finish. The files are extracted to the specified destination folder. Allowing Flash data and third-party files to be downloaded You can deploy third-party Flash controls from the Web Services computer so that they are made available to MicroStrategy Office users. For details to use Web Services with MicroStrategy Office, see Installing and deploying MicroStrategy Web Services, page 205. When you deploy third-party Flash controls, the main MicroStrategy .SWF (DashboardViewer_Version Number.swf) may need to access files on the network. Therefore, you may need to ensure that the MicroStrategy .SWF file is granted access to files on your network; by default, it is not. Use the appropriate steps below depending on whether you want to allow entire folders to be trusted by Adobe Flash Player, or only individual Flash controls. To set the Flash controls, images, and Flash data folders to trust network resources 1 On a computer with MicroStrategy Office installed, open Microsoft Excel, PowerPoint, or Word. 2 On the MicroStrategy tab, click Options. The Options dialog box opens. 3 Under the General folder, expand Flash, and then select File Locations. 4 Select the Trust files in path check boxes for the Flash controls, images, and Flash data folders. The Flash file locations cannot contain any non-ASCII characters. 188 Securely distributing business data © 2013 MicroStrategy, Inc. MicroStrategy Office User Guide 7 Securing and Distributing Data 5 Click OK to apply the changes. To set individual Flash controls to trust network resources 1 On a computer with MicroStrategy Office installed, open Microsoft Excel, PowerPoint, or Word. 2 On the MicroStrategy tab, click Options. The Options dialog box opens. 3 Under the General folder, select Flash. 4 In the Flash Player Settings area, select Global Security Settings from the drop-down list, and click Change. The Adobe Flash Player Settings Manager web site is launched. 5 On the Adobe site, from the Edit Locations drop-down list, select Add location. 6 Specify the Flash control files you want the Adobe Flash Player to trust. 7 Click Confirm. The files are added to the field below the drop-down list. Determining whether Flash files are downloaded on a user’s computer If you do not allow Flash files to be downloaded to a user’s computer and the user does not already have the files on his computer, he will not be able to view a Flash-enabled document. To determine whether Flash files are downloaded on a user’s computer 1 On a computer with MicroStrategy Office installed, open Microsoft Excel, PowerPoint, or Word. 2 On the MicroStrategy tab, click Options. The Options dialog box opens. 3 Under the General folder, select the Flash folder. 4 From the Other Flash control files drop-down list, select one of the following options to determine whether Flash control files are © 2013 MicroStrategy, Inc. Securely distributing business data 189 7 Securing and Distributing Data MicroStrategy Office User Guide downloaded to a user’s computer automatically when he or she runs a Flash-enabled document. • Yes, to ensure that files are downloaded to the MicroStrategy Office user’s computer automatically when the user runs a Flash-enabled document. The files are downloaded regardless of whether they are already on the computer. • No, to ensure that files are not downloaded to the MicroStrategy Office user’s computer automatically when the user runs a Flash-enabled document. select No and the user does not already have the files on Ifhisyoucomputer, he will not be able to view the document. 5 Click OK to apply the changes. Determining where Flash files are stored Flash .SWF and related data files are located in your temp directory, by default. However, you can store these files in a shared network folder instead to allow all users to access the same files from one location. To specify where Flash files are stored 1 On a computer with MicroStrategy Office installed, open Microsoft Excel, PowerPoint, or Word. 2 On the MicroStrategy tab, click Options. The Options dialog box opens. 3 Under the General folder, expand the Flash folder, then select File Locations. 4 Type the path to the network folder location where you want to store Flash files. Flash file locations cannot contain non-ASCII characters. 5 Click OK. 190 Securely distributing business data © 2013 MicroStrategy, Inc. MicroStrategy Office User Guide Securing and Distributing Data 7 Determining how Flash-enabled documents are refreshed You can determine how Flash-enabled documents are refreshed when Flash .SWF files, images, or data files are missing on your computer. To determine how Flash-enabled documents are refreshed 1 On the MicroStrategy tab, click Options. The MicroStrategy Office Options dialog box opens. 2 Under the General folder, select the Messages folder. 3 Select an appropriate option from the Refresh Flash documents if data files are not found drop-down list. Using Microsoft Smart Tags as links to projects and reports You can associate reports, Report Services documents, and projects in MicroStrategy Office with Microsoft Smart Tags inside your Microsoft product. Smart Tags act as placeholders for and links to certain data. For an introduction to Microsoft Smart Tags, see your Microsoft documentation. For example, you can associate a MicroStrategy report with a specific word or phrase, such as 2013 shipping data. When this text is written in a workbook, presentation, or Word document, it is recognized as a Smart Tag and underlined. When a MicroStrategy Office user receives the file and right-clicks the highlighted text, he can execute the linked report. When you use a Smart Tag for a project name, the Smart Tag link provides you with instant access to various connection options. For example, as shown in the image below, you can log into the Human Resources Analysis Module © 2013 MicroStrategy, Inc. Using Microsoft Smart Tags as links to projects and reports 191 7 Securing and Distributing Data MicroStrategy Office User Guide project, disconnect from the Human Resources Analysis Module project, and so on. A Smart Tag link does not need to display the name of a report or project; you can change the text for a Smart Tag by providing an alias for the report 192 Using Microsoft Smart Tags as links to projects and reports © 2013 MicroStrategy, Inc. MicroStrategy Office User Guide Securing and Distributing Data 7 or project name. In the example below, a report is selected to be linked to a Smart Tag, and an alias is provided for the report’s name. In the example below, a Human Resources project is selected and aliased as a Smart Tag. Since the project is associated with an HR Reports Smart Tag, whenever “HR Reports” appears in the text, you can log directly into or disconnect from the Human Resources Analysis Module project, or display © 2013 MicroStrategy, Inc. Using Microsoft Smart Tags as links to projects and reports 193 7 Securing and Distributing Data MicroStrategy Office User Guide the Connect To Project dialog box to see the projects to which you are connected. • To associate a MicroStrategy report or document with a Smart Tag, see Using Smart Tags as report/document placeholders, page 195. • To associate MicroStrategy projects with Smart Tags, see Using Smart Tags as project name placeholders, page 196. • To view a list of enabled Smart Tags and edit a Smart Tag, see Viewing a list of enabled Smart Tags and editing a Smart Tag, page 198. • To require login when a Smart Tag is selected, see Requiring login when a Smart Tag is clicked, page 199. • To remove Smart Tags, see Removing Smart Tags, page 199. you create a Smart Tag in MicroStrategy Office, it is stored with When Microsoft Office on your local computer. Workbooks, presentations, and Word documents that contain Smart Tags are scanned by Microsoft Office using the MicroStrategy Office Smart Tags definitions. Prerequisites • Smart Tags are available in the following Microsoft Office products: Microsoft Excel (Office 2000 or later) Microsoft PowerPoint (Office 2003 or later) 194 Using Microsoft Smart Tags as links to projects and reports © 2013 MicroStrategy, Inc. MicroStrategy Office User Guide 7 Securing and Distributing Data Microsoft Word (Office 2000 or later) • Enable smart Tags in MicroStrategy Office. To do this, on the MicroStrategy tab, click Options. Under the General folder, select View, then select the Show Smart Tag menus check box and click OK. • Enable Smart Tags in Microsoft Office. To do this, from the File menu, select Options, select Proofing, then select AutoCorrect Options. On the Actions tab, select the appropriate MicroStrategy Office Smart Tags. Using Smart Tags as report/document placeholders Use the following steps to create a Smart Tag by associating a report or document with the Smart Tag, and then use the Smart Tag to execute the report. To associate a report/document with a Smart Tag and execute the report/ document 1 From the MicroStrategy tab, click Office and log in to a project. 2 On the MicroStrategy tab, click Reports. 3 Right-click the report/document to associate with a Smart Tag and select either Smart Tag Report or Smart Tag Alias Report: • If you select Smart Tag Report, the Smart Tag displays the full report/document name. Whenever the report/document name is typed, that text becomes a link that provides options to execute the report/document. • If you select Smart Tag Alias Report, you can specify the Smart Tag name. Whenever the name you specify is typed (called the Smart Tag Alias), that text becomes a link that provides options to execute the report/document. Click OK after you specify the name. 4 Close MicroStrategy Office. 5 In your Microsoft product, type the name of the report or the aliased name you specified. © 2013 MicroStrategy, Inc. Using Microsoft Smart Tags as links to projects and reports 195 7 Securing and Distributing Data MicroStrategy Office User Guide To execute the report/document from a Smart Tag 6 Right-click the text that contains the Smart Tag, and select Additional options to see options for the report. 7 Select an option from the Smart Tag’s list. The report/document is executed. In Excel, the report/document is executed based on the placement options defined for Excel. To define placement location, see Specifying formatting for reports/documents before they are run, page 48. In Word, the report/document is executed at the current cursor position. you plan to send the Excel, PowerPoint, or Word file to another Ifuser, you must provide the recipient with a copy of your Smarttag.xml file. This file is located in your MicroStrategy\ Office folder and must be placed in the MicroStrategy\Office folder on the recipient’s computer. This ensures that he can view the Smart Tags within his Microsoft product. Using Smart Tags as project name placeholders You can use Smart Tags to create links to MicroStrategy projects. For example, you can specify that every time the words “Shipping Project” appear in a workbook, Word document, or presentation, users can click on the text to log in to, or disconnect from, that MicroStrategy project. Use the steps below to create a Smart Tag by associating a MicroStrategy project with a Smart Tag, and then use the Smart Tag to connect to or disconnect from the project. To associate a project name with a Smart Tag and connect to/disconnect from the project 1 From the MicroStrategy tab, click Office and log in to a project. 2 From the View menu, select Projects. The Projects dialog box opens. 196 Using Microsoft Smart Tags as links to projects and reports © 2013 MicroStrategy, Inc. MicroStrategy Office User Guide Securing and Distributing Data 7 3 Right-click the project to associate with a Smart Tag and select either Smart Tag Project or Smart Tag Alias Project: • If you select Smart Tag Project, the Smart Tag becomes the full project name. When the full project name is typed, the text becomes a link that provides connection options for the project. • If you select Smart Tag Alias Project, you can specify the Smart Tag name for the project. When the name you specify is typed, the text becomes a Smart Tag that provides connection options for the project. Click OK after you specify the name. 4 In the Microsoft product, type the name of the project or the aliased name you specified. To connect to or disconnect from a project from a Smart Tag 5 Right-click the text that contains the Smart Tag to display the Smart Tag list. Select Additional Options and select from the following options: • Select Connect to Project to log in to the project associated with the Smart Tag, if you are not already logged into it. • Select Disconnect from Project to disconnect from the project associated with the Smart Tag. • Select Open Connect Dialog to see the available project sources and projects, as well as which projects you are currently connected to. © 2013 MicroStrategy, Inc. Using Microsoft Smart Tags as links to projects and reports 197 7 Securing and Distributing Data MicroStrategy Office User Guide Viewing a list of enabled Smart Tags and editing a Smart Tag After you create Smart Tags, they are added to the Smart Tags dialog box in MicroStrategy Office, as shown below: The Smart Tags dialog box lists every Smart Tag associated with a report in the current project. In this example, the Distribution Order and Revenue Smart Tag is associated with a report, so it is displayed in the Smart Tags dialog box. You can also change the text that is associated with the Smart Tag. To view a list of Smart Tags in a project and edit a Smart Tag 1 Open the Microsoft product in which a Smart Tag appears. 2 On the MicroStrategy tab, click Office. 3 From the View menu, select Smart Tags. The Smart Tags dialog box is displayed, listing all the Smart Tags in the project. 4 To edit the text for a Smart Tag, in the Smart Tags list, right-click one or more Smart Tags and select Properties. 5 In the Object Settings, you can change the Smart Tag text. Then select OK to save changes to the settings. 198 Using Microsoft Smart Tags as links to projects and reports © 2013 MicroStrategy, Inc. MicroStrategy Office User Guide 7 Securing and Distributing Data Requiring login when a Smart Tag is clicked By default, users are not required to log in when a Smart Tag is clicked. The login ID of the currently connected user is used to open the Smart Tag link, because that login ID is saved with the Smart Tag definitions. You can require users to log in when they click a Smart Tag. To require users to log in when a Smart Tag is clicked 1 In your Microsoft product, on the MicroStrategy tab, click Options. The Options dialog box opens. 2 Under the General folder, select Security. 3 Clear the Persist Smart Tag login ID option. Selected by default. 4 Click OK. Users are now required to supply a login ID when executing reports or documents using a Smart Tag. Removing Smart Tags When you associate a report or project with a Smart Tag in MicroStrategy Office, that Smart Tag is recognized in every Microsoft product in which you work. For example, if you specify “Q3 Shipping Report” as a Smart Tag that opens a shipping analysis report, every Microsoft Office product in which you type “Q3 Shipping Report” recognizes the Smart Tag and creates an active link from the text, which provides options to run the report and perform other tasks. To disassociate the report or project from its Smart Tag, you must remove the Smart Tag. You can either: • Remove a Smart Tag from the current workbook, presentation, or Word document. To do so, see Removing a Smart Tag from the current workbook, presentation, or Word document, page 200. • Remove a Smart Tag from MicroStrategy Office so it is no longer recognized in any Microsoft Office products. To do so, see Removing a Smart Tag entirely from MicroStrategy Office, page 200. © 2013 MicroStrategy, Inc. Using Microsoft Smart Tags as links to projects and reports 199 7 Securing and Distributing Data MicroStrategy Office User Guide Removing a Smart Tag from the current workbook, presentation, or Word document You can ensure that a Smart Tag is no longer recognized in a specific Microsoft product. After you remove a Smart Tag, the text associated with the removed Smart Tag will not be underlined or provide a list of Smart Tag options. you remove the Smart Tag from the current workbook, Ifpresentation, or Word document, the Smart Tag is still recognized in all other Microsoft Office products. To ensure that the Smart Tag is no longer recognized by any Microsoft Office products, see Removing a Smart Tag entirely from MicroStrategy Office, page 200. To remove a Smart Tag from the current workbook, presentation, or Word document 1 Open the Microsoft product in which a Smart Tag appears. 2 Right-click the Smart Tag and select Additional Options, then select Options. 3 Clear the appropriate check box for the Smart Tag you want to remove. This ensures that the Microsoft Office product no longer recognizes the Smart Tag in the current workbook, presentation, or Word document. 4 Click OK. Removing a Smart Tag entirely from MicroStrategy Office You can ensure that a Smart Tag is no longer recognized in any Microsoft Office products. To remove a Smart Tag from all Microsoft Office products 1 Open the Microsoft product in which a Smart Tag appears. 2 On the MicroStrategy tab, click Office. 3 From the View menu, select Smart Tags. The Smart Tags dialog box is displayed, listing all the Smart Tags in the project. 200 Using Microsoft Smart Tags as links to projects and reports © 2013 MicroStrategy, Inc. MicroStrategy Office User Guide 7 Securing and Distributing Data 4 Right-click the Smart Tag and select Delete to remove it entirely from the project. This ensures that no Microsoft Office products recognize the Smart Tag. Enabling reports/documents exported from Web to be refreshed You can enable MicroStrategy Web reports and documents to be refreshed by MicroStrategy Office, when those reports/documents are exported to Excel from MicroStrategy Web. To enable MicroStrategy Office to refresh exported Web reports and documents 1 In MicroStrategy Web, login to a project. The Home page is displayed. 2 Click the MicroStrategy icon and select Preferences. The User Preferences page is displayed. 3 Click Office in the Preferences (or Project Defaults if you are an administrator) and select from the following: • Select the Allow MicroStrategy Office to refresh documents after exporting to Excel check box to ensure that documents exported to Excel can be refreshed by MicroStrategy Office. For details, see the MicroStrategy Web Help. • Select the Allow MicroStrategy Office to refresh reports after exporting check box to ensure that reports exported to Excel can be refreshed by MicroStrategy Office. For details, see the MicroStrategy Web Help. 4 Click Apply to save your changes. The next time you export a report or document to Excel, you can refresh it using MicroStrategy Office. © 2013 MicroStrategy, Inc. Enabling reports/documents exported from Web to be refreshed 201 7 Securing and Distributing Data MicroStrategy Office User Guide For information on exporting reports from MicroStrategy Web, see the Using the Export Options dialog box topic of the MicroStrategy Web Help. Note the following: • When you export a report from MicroStrategy Web, you must save it as an Excel file, then re-open it from your computer. This ensures that the MicroStrategy tab is available in the Excel workbook. Internet Explorer must be configured to open Excel files in the browser. • For MicroStrategy Office to recognize a document that is exported to Excel from MicroStrategy Web, Excel must be configured to open the file in a separate dialog box. For more information, see MicroStrategy Technical Note TN6900-800-0050. 202 Enabling reports/documents exported from Web to be refreshed © 2013 MicroStrategy, Inc. 8 8. INSTALLING AND ADMINISTERING MICROSTRATEGY OFFICE Introduction This section is intended for MicroStrategy administrators. It explains how to install and configure MicroStrategy Office, install and deploy Web Services, and lists required privileges. It explains how security works in MicroStrategy Office, describes types of authentication, and explains how to use MicroStrategy Office in a multilingual environment. Specifically, this section discusses the following: • Installing MicroStrategy Office, page 204 • Installing and deploying MicroStrategy Web Services, page 205 • Establishing connectivity to MicroStrategy applications, page 234 • User authentication and security overview, page 240 • Determining how users log in to MicroStrategy Office, page 244 • Using MicroStrategy Office in a multilingual environment, page 253 © 2013 MicroStrategy, Inc. 203 8 Installing and Administering MicroStrategy Office MicroStrategy Office User Guide Installing MicroStrategy Office You can install MicroStrategy Office on users’ computers along with the rest of the platform, you can install only the MicroStrategy Office application, or you can allow users to install MicroStrategy Office themselves from a network location, from a disk, or from MicroStrategy Web. MicroStrategy Office, you must also install MicroStrategy ToWebsupport Services as part of your master MicroStrategy installation. For more information on installing MicroStrategy Web Services, see Installing and deploying MicroStrategy Web Services, page 205. This section describes the different installation methods available. For full details about installing MicroStrategy products, including MicroStrategy Office, see the MicroStrategy Installation and Configuration Guide. For system hardware and software requirements, see the MicroStrategy Readmes. Installing MicroStrategy Office with the rest of the MicroStrategy platform If you intend to install several MicroStrategy products on a single computer at the same time, including MicroStrategy Office, install MicroStrategy Office with the rest of the MicroStrategy platform. This allows you to configure all of the MicroStrategy products on a computer at one time. For detailed information about planning for and performing your MicroStrategy installation, see the MicroStrategy Installation and Configuration Guide. Installing MicroStrategy Office without installing other MicroStrategy components To avoid installing all MicroStrategy common files on computers that will only be running MicroStrategy Office you can install a stand-alone version of the MicroStrategy Office application. To install only MicroStrategy Office, from the installation DVD-ROM, browse to Installations\Office, and run MicrostrategyOffice.msi if you are using 32-bit Microsoft Office, or run MicroStrategyOffice64.msi if you are using 64-bit Microsoft Office. 204 Installing MicroStrategy Office © 2013 MicroStrategy, Inc. MicroStrategy Office User Guide 8 Installing and Administering MicroStrategy Office For detailed information about planning for and performing your MicroStrategy installation, see the MicroStrategy Installation and Configuration Guide. Allowing users to install MicroStrategy Office from a common location There are several ways that users can install MicroStrategy Office from common locations. Users can install MicroStrategy Office from a network location, from a disk, or from MicroStrategy Web. By allowing users to install MicroStrategy Office on their own, you can save time by not having to perform the installation on each individual user’s computer. For steps to make the installation files available to MicroStrategy Office users, see the MicroStrategy Installation and Configuration Guide. Installing and deploying MicroStrategy Web Services MicroStrategy Web Services must be installed and deployed for MicroStrategy Office to function. See the Installation and Configuration Guide for details on how to use the Web Services installation utility. This section provides information to deploy MicroStrategy Web Services for ASP.NET (see Deploying with IIS (Windows), page 206) and J2EE (see General steps to deploy MicroStrategy Web Services J2EE, page 208) platforms. Steps to deploy MicroStrategy Web Services in a UNIX/Linux or Windows environment with selected web and application servers is explained in detail. MicroStrategy Web Services J2EE is platform-independent and can be deployed using different combinations of operating systems, web servers, and application servers. application servers are not MicroStrategy products, so detailed Web steps cannot be provided for every combination of application server and operating system. This section provides steps for common combinations. The steps for different operating systems and web application server configurations are similar, but you should refer to the vendor-provided documentation for details specific to your configuration. © 2013 MicroStrategy, Inc. Installing and deploying MicroStrategy Web Services 205 8 Installing and Administering MicroStrategy Office MicroStrategy Office User Guide For information on setting up security and scalability for Web Services, see Security and Scalability for MicroStrategy Web Services. Locating the Web Services installation • By default, MicroStrategy Web Services for ASP.NET is installed in the following directory and virtual directory during a Windows platform installation: Directory: – 32-bit Windows environments: C:\Program Files\ MicroStrategy\Web Services – 64-bit Windows environments: C:\Program Files (x86)\ MicroStrategy\Web Services • Virtual directory: MicroStrategyWS For MicroStrategy Web Services J2EE, the WAR file used for deployment is installed during platform installation. By default, MicroStrategyWS.war is installed in the following directory: Directory: – 32-bit Windows environments: C:\Program Files\ MicroStrategy\Web Services J2EE – 64-bit Windows environments: C:\Program Files (x86)\ MicroStrategy\Web Services J2EE – UNIX and Linux environments: INSTALL_PATH/WebUniversal where INSTALL_PATH is the location that you specified during a MicroStrategy installation as the install directory. Deploying with IIS (Windows) MicroStrategy Web Services ASP.NET can be deployed with IIS only on Windows. This is handled automatically when you choose to install MicroStrategy Web Services ASP.NET during the installation process. See the Installation and Configuration Guide for steps to install MicroStrategy Web Services ASP.NET on Windows. 206 Installing and deploying MicroStrategy Web Services © 2013 MicroStrategy, Inc. MicroStrategy Office User Guide Installing and Administering MicroStrategy Office 8 Configurations specific to the version of Microsoft IIS you are using to deploy MicroStrategy Web Services include the following: • Supporting IIS 7.0.x or IIS 7.5.x as a web server for MicroStrategy Web Services, page 207 • Supporting MicroStrategy Web Services with IIS 6.x on 64-bit Windows operating systems, page 208 When installation is finished, verify your installation by visiting the Web Services URL. For steps, see Verifying your Web Services installation in ASP.net, page 231. Supporting IIS 7.0.x or IIS 7.5.x as a web server for MicroStrategy Web Services If you plan to use IIS 7.0.x or IIS 7.5.x as the web server for MicroStrategy Web Services, you must ensure that some IIS options are enabled. The procedure below describes how to enable the options that are required to support IIS 7.0.x or IIS 7.5.x as a web server for MicroStrategy Web Services. To support IIS 7.0.x or 7.5.x as a web server for MicroStrategy Web Services third-party products discussed below are manufactured by The vendors independent of MicroStrategy, and the steps to configure these products is subject to change. Refer to the appropriate Microsoft documentation for steps to configure IIS 7.0.x or IIS 7.5.x. 1 On a Windows machine, open the Control Panel. 2 Double-click Programs and Features. 3 Click the Turn Windows features on or off task. The Windows Features dialog box opens. 4 Expand Internet Information Services, and select the following options: a Expand Web Management Tools and select: • IIS Management Console • IIS Management Scripts and Tools • IIS Management Service © 2013 MicroStrategy, Inc. Installing and deploying MicroStrategy Web Services 207 8 Installing and Administering MicroStrategy Office MicroStrategy Office User Guide b Expand World Wide Web Services, then expand Application Development Features, and select: c • .NET Extensibility • ASP.NET • ISAPI Extensions • ISAPI Filters Within World Wide Web Services, expand Common Http Features, and select: • Default Document • Static Content d Expand Security, and select: • Request Filtering • Windows Authentication 5 Click OK to save your changes. Supporting MicroStrategy Web Services with IIS 6.x on 64-bit Windows operating systems If you plan to use IIS 6.x on 64-bit Windows operating systems, MicroStrategy Web Services must be configured as a 64-bit applications. To configure MicroStrategy Web Services as a 64-bit application, you must define the IIS parameter Enable32BitAppOnWin64 as False (0). See your Microsoft documentation for steps to define the Enable32BitAppOnWin64 parameter. Information on defining this parameter is available at http:// support.microsoft.com/kb/894435. General steps to deploy MicroStrategy Web Services J2EE After you have installed MicroStrategy Web Services J2EE, you deploy and configure it for your environment. For a list of application servers that are certified to work with MicroStrategy Web Services J2EE, see the MicroStrategy Readme. 208 Installing and deploying MicroStrategy Web Services © 2013 MicroStrategy, Inc. MicroStrategy Office User Guide 8 Installing and Administering MicroStrategy Office Configuration and deployment steps are provided for specific web server and application server combinations in this section. The table below lists the general steps for all environments. High-Level Deployment Steps 1 Log on to the application server by using the proper user name and password. 2 Locate the MicroStrategyWS.war file in the MicroStrategy Web Services J2EE Deployment Directory you specified during installation (see Locating the Web Services installation, page 206). 3 To increase performance, see Performance-based setup information in this guide, if available for your environment, and configure as necessary. 4 Choose the desired deployment method and follow the deployment procedure. 5 Validate access to runtime files, edit your project sources file, and test your Web Services deployment. Deploying MicroStrategy Web Services J2EE on various web and application servers is explained in: • Deploying with Oracle WebLogic, page 209 • Deploying with WebSphere and IBM HTTP Server, page 216 • Deploying with Tomcat, page 222 • Deploying with SAP NetWeaver, page 225 • Deploying with Oracle 10g, page 227 Deploying with Oracle WebLogic Use these steps to deploy and configure MicroStrategy Web Services J2EE using Oracle WebLogic Server 10.3 as the application server. These steps assume that your application server is installed and operational. This section includes the following information: • Paths and folder locations for WebLogic, page 210: Default folder structure. • Preconfiguration steps, page 210: Configuration required before you begin deploying MicroStrategy Web Services J2EE. • Deploying MicroStrategy Web Services J2EE, page 211: Instructions for deploying the application. • Redeploying the application, page 215: Instructions for re-deploying the application. © 2013 MicroStrategy, Inc. Installing and deploying MicroStrategy Web Services 209 8 Installing and Administering MicroStrategy Office MicroStrategy Office User Guide Paths and folder locations for WebLogic This section provides the default folder structure for WebLogic and the variables used to represent the WebLogic mydomain folder path. Each version of WebLogic is installed with a different default path to the WebLogic mydomain folder. When deploying MicroStrategy Web Services J2EE, you must make changes in the WebLogic folders. Thus, it is important to understand the WebLogic folder structure for the version of WebLogic you are using. The default folder structure for WebLogic 10.3 is: WEBLOGIC_HOME/ user_projects/domains/mydomain/ Note the following: • WEBLOGIC_HOME is the WebLogic Server home path. • The folder structures are configurable and your organization may have changed the default names or path. Throughout this chapter, the WebLogic mydomain folder is referred to as WEBLOGIC_MYDOMAIN_FOLDER. This variable refers to the WebLogic mydomain folder in whatever location it resides on your system. The location of this variable is based on the version of WebLogic and whether your organization has changed the version’s default name or path. Preconfiguration steps This section provides preconfiguration steps to deploy MicroStrategy Web Services J2EE on your computer: • To support the deployment of Web Services J2EE, you must install an appropriate JDK or JVM. For information on the version numbers of application servers, operating systems, JDKs, and JVMs supported or certified by MicroStrategy, see the MicroStrategy Readme. • For information on installing WebLogic products, see http:// www.oracle.com/technology/products/WebLogic/ integration/index.html. • Before you start the deployment process, locate the computer name and IP address. 210 Installing and deploying MicroStrategy Web Services © 2013 MicroStrategy, Inc. MicroStrategy Office User Guide 8 Installing and Administering MicroStrategy Office Locating the WAR file The MicroStrategy Web Services J2EE application is packaged within a single WAR (Web ARchive) file. You deploy the WAR file to run the application in your application server environment, using the steps in this section. The WAR file is placed in the folder you specified when installing MicroStrategy Web Services J2EE (see Locating the Web Services installation, page 206 for the default installation location). Copy the MicroStrategyWS.war file to the WEBLOGIC_MYDOMAIN_FOLDER. See Paths and folder locations for WebLogic, page 210 for information on the default folder structure. Deploying MicroStrategy Web Services J2EE After your computer has been preconfigured, you can deploy MicroStrategy Web Services J2EE with WebLogic. This involves the following high-level steps. Details for each step are below: 1 Deploying automatically or manually: With both the automatic and manual deployments listed below, you can deploy MicroStrategy Web Services J2EE from an exploded directory, where all the files contained in the WAR file are extracted. When you deploy from an exploded directory, all of the files and folders within the WAR file are exposed to WebLogic. This allows WebLogic to access the required folders to perform any necessary configurations to files in the exploded directory. • Deploying automatically (development mode) for testing, page 212: The automatic deployment (development mode) feature is the fastest. However, be aware that development mode does not have the same security capabilities available in production mode and therefore should be used only for testing purposes. • Deploying manually (production mode) for production environments, page 213: The manual deployment feature can be used for environments where the server is running in production mode and automatic deployment is disabled. 2 Viewing the MicroStrategy Web Services home page, page 215 3 Redeploying the application, page 215 © 2013 MicroStrategy, Inc. Installing and deploying MicroStrategy Web Services 211 8 Installing and Administering MicroStrategy Office MicroStrategy Office User Guide Deploying automatically (development mode) for testing Automatic deployment is the fastest and easiest deployment method. When deployment is set to development mode, the application is automatically deployed as soon as you place the WAR file or the exploded directory in the WEBLOGIC_MYDOMAIN_FOLDER/autodeploy folder. aware that development mode does not have the same security Becapabilities available in production mode and therefore should be used only for testing purposes. Prerequisites: • The WebLogic application server must be started. For steps on how to start your WebLogic application server, refer to your third-party WebLogic documentation. • The WebLogic domain must be configured to use development mode, which is the default setting. To ensure that your domain is using development mode or to review the steps to configure a WebLogic domain to use development mode, refer to your third-party WebLogic documentation. To automatically deploy MicroStrategy Web Services J2EE 1 Locate the MicroStrategyWS.war file located in the MicroStrategy Web Services J2EE deployment directory you specified during installation. For more information on locating the WAR file, see Locating the WAR file, page 211. 2 Create the following new folder: /home/username/context_folder where username is your account name used to access the Web Services server, and context_folder is the name of the new folder. can create the new folder anywhere except in the following You location: /WEBLOGIC_MYDOMAIN_FOLDER/autodeploy 3 Copy the WAR file to the new folder. 212 Installing and deploying MicroStrategy Web Services © 2013 MicroStrategy, Inc. MicroStrategy Office User Guide 8 Installing and Administering MicroStrategy Office 4 Explode the WAR file in the folder you created: • For UNIX/Linux, run the following command from the command line: jar -xvf MicroStrategyWS.war • For Windows, rename the MicroStrategyWS.war to MicroStrategyWS.zip and then unzip the file. 5 Delete the MicroStrategyWS.war file from the new folder, if it exists in the folder. 6 Move the new folder to the WEBLOGIC_MYDOMAIN_FOLDER/ autodeploy folder. The application is automatically deployed. After deploying the MicroStrategyWS.war file, you can view the WEB-INF folder, which contains the deployed files and folders. To view your Web Services home page, see Viewing the MicroStrategy Web Services home page, page 215. Deploying manually (production mode) for production environments Use manual deployment in environments where the server is running in production mode and automatic deployment is disabled. Prerequisites: • The WebLogic application server must be started. For steps on how to start your WebLogic application server, refer to your third-party WebLogic documentation. • The WebLogic domain must be configured to use production mode. For steps on how to configure a WebLogic domain to use production mode, refer to your third-party WebLogic documentation. To manually deploy MicroStrategy Web Services J2EE 1 Locate the MicroStrategyWS.war file located in the MicroStrategy Web Services J2EE deployment directory you specified during installation. For more information on locating the WAR file, see Locating the WAR file, page 211. 2 Create a new folder in the WEBLOGIC_MYDOMAIN_FOLDER/ autodeploy directory and transfer the WAR file to this directory. © 2013 MicroStrategy, Inc. Installing and deploying MicroStrategy Web Services 213 8 Installing and Administering MicroStrategy Office MicroStrategy Office User Guide 3 Explode the WAR file in the folder you created: • For UNIX/Linux, run the following command from the command line: jar -xvf MicroStrategyWS.war • For Windows, rename the MicroStrategyWS.war to MicroStrategyWS.zip and then unzip the file. 4 Delete the MicroStrategyWS.war file from the new folder. To configure from the WebLogic Server Admin Console 5 Open the WebLogic Server Admin Console by accessing the following address: http://IP address:port/console/ where IP address is the IP address of the computer on which you installed the WebLogic application server and port is the port number for the WebLogic application server. 6 Type a valid user ID and password at the prompt. The user ID and password are the ones you specified when installing the WebLogic application server on your computer. 7 Select mydomain, point to Deployments, and then choose Web Application Modules. The Web Application table opens. you used a different domain name other than the default Ifmydomain, select the applicable domain. 8 Select Deploy a New Web Application Module. 9 Locate and select the root folder of the exploded directory. 10 Click Target Module. 11 Click Deploy, then wait for the application to activate. After deploying the MicroStrategyWS.war file, you can view the WEB-INF folder, which contains the deployed files and folders. To view your Web Services home page, see Viewing the MicroStrategy Web Services home page, page 215. 214 Installing and deploying MicroStrategy Web Services © 2013 MicroStrategy, Inc. MicroStrategy Office User Guide 8 Installing and Administering MicroStrategy Office Viewing the MicroStrategy Web Services home page Viewing the home page offers a first level of validation of MicroStrategy Web Services J2EE. To view the MicroStrategy Web Services home page 1 The address to launch MicroStrategy Web Services home page is different for each deployment method. The following table lists the various URLs to access MicroStrategy Web Services using a WAR file or an exploded directory. are case-sensitive. If the application server is enabled with Names security, a dialog box related to administrator authentication opens. Deployment Method Address When deployed from an exploded directory Access the home page from a browser at this address: http://IPaddress:Port/context_folder/ where context_folder is the name of the folder where the application was exploded to and IPaddress is the IP address of your machine. To validate access to the required runtime files, edit your project sources file, and test your MicroStrategy Web Services J2EE installation, see Completing your MicroStrategy Web Services J2EE deployment, page 230. Redeploying the application If you have already deployed MicroStrategy Web Services J2EE with WebLogic and you change parameters in the web.xml file, you must re-deploy the application. This allows the changes to take effect in the deployed application. To redeploy the application 1 Open the WebLogic Server Admin Console by accessing the following address: http://IP address:Port/console/ © 2013 MicroStrategy, Inc. Installing and deploying MicroStrategy Web Services 215 8 Installing and Administering MicroStrategy Office MicroStrategy Office User Guide where IP address is the IP address of the computer on which you installed the WebLogic application server and Port is the port number for the WebLogic application server. 2 Type a valid user ID and password at the prompt. The user ID and password were specified when installing the WebLogic application server. 3 On the left, select mydomain, point to Deployments, then choose Web Application Modules. The Web Application table opens. you used a different domain name other than the default Ifmydomain, select the applicable domain. 4 Click the application that you want to re-deploy, such as MicroStrategyWS. The information for the application is displayed. 5 On the right, select the Deploy tab, then click Redeploy. The application is redeployed. Deploying with WebSphere and IBM HTTP Server Use these steps to deploy and configure MicroStrategy Web Services J2EE using IBM WebSphere Server and IBM HTTP Web Server. This section includes the following information: • Preconfiguration information, page 216: Configuration that must occur before deploying MicroStrategy Web Services J2EE. • Deploying MicroStrategy Web Services J2EE, page 217: Instructions for deploying the application. Preconfiguration information This section provides preconfiguration steps to deploy MicroStrategy Web Services J2EE on your computer: • To support the deployment of Web Services J2EE, you must install an appropriate JDK or JVM. For information on the version numbers of application servers, operating systems, JDKs, and JVMs supported or certified by MicroStrategy, see the MicroStrategy Readme. • Before you start the deployment process, locate the computer name and IP address. 216 Installing and deploying MicroStrategy Web Services © 2013 MicroStrategy, Inc. MicroStrategy Office User Guide 8 Installing and Administering MicroStrategy Office Locating the WAR file The MicroStrategy Web Services J2EE application is packaged within a single WAR (Web ARchive) file. You deploy the WAR file to run the application in your application server environment, using the steps in this section. The WAR file is placed in the folder you specified when installing MicroStrategy Web Services J2EE (see Locating the Web Services installation, page 206 for the default installation location). Copy the WAR file to the WAS_HOME/installableApps directory, where WAS_HOME is the home path of the WebSphere application server. Deploying MicroStrategy Web Services J2EE After your computer has been preconfigured, you can deploy MicroStrategy Web Services J2EE. This involves the following high-level steps: 1 Launching the WebSphere Administrative Console, page 217 2 Starting the WebSphere default application server, page 218 3 Installing the Enterprise Application, page 218 4 Preparing for the application installation, page 219 5 Starting the web module, page 221 6 Starting the web module, page 221 7 Viewing the MicroStrategy Web Services home page, page 221 Launching the WebSphere Administrative Console The WebSphere Administrative Console can be accessed only if the WebSphere server is started on the machine. Refer to your third-party WebSphere documentation for the steps to start the WebSphere Administrative Console. © 2013 MicroStrategy, Inc. Installing and deploying MicroStrategy Web Services 217 8 Installing and Administering MicroStrategy Office MicroStrategy Office User Guide To launch the WebSphere Administrative Console 1 In a browser, type the URL for the administrative console. The URL is of the following form: http://IP Address:Port/ibm/console where IP Address is the IP address of the computer on which you installed the WebSphere application server and Port is the port number for the WebSphere Administrative Console. Refer to your third-party WebSphere documentation to confirm the default port number for the administrative console. 2 Type the value for the user ID parameter. For example, admin. Starting the WebSphere default application server After you launch the WebSphere Administrative Console, you can deploy MicroStrategy Web Services J2EE by starting the default application server. To start the default application server 1 In the WebSphere Administrative Console, on the left, expand Servers. 2 Click the Applications Servers link. A table listing the application servers is displayed on the right. 3 Select the check box next to the application server to be started. 4 Click Start above the table. Installing the Enterprise Application To install the Enterprise Application 1 Expand Applications, and then Enterprise Applications to display a list of installed applications. 2 Click Install. 218 Installing and deploying MicroStrategy Web Services © 2013 MicroStrategy, Inc. MicroStrategy Office User Guide Installing and Administering MicroStrategy Office 8 Preparing for the application installation The following settings must be specified for the installation. To specify settings for the installation 1 To begin the installation for IBM WebSphere, expand Applications, then expand Application Types, and then select WebSphere enterprise applications. A list of enterprise applications is displayed. 2 Click Install. Options to specify the path to the new application are displayed. 3 You must specify the path to the WAR file by selecting either the local file system or remote file system option. For local file systems, you can click browse to navigate to the location of the MicroStrategyWS.war file. For remote file systems, type in the full path for the location of the MicroStrategyWS.war file. 4 Click Next to continue the installation. 5 Select to perform either a Fast Path or Detailed installation. Either type of installation can support the deployment of MicroStrategy Web Services. 6 Select the Generate Default Binding check box, and ensure that the Override existing bindings check box is cleared. 7 Click Next. The Select installation options page opens. In the screens that follow, you are selecting settings that are used during the installation. 8 Perform the following configuration steps: • Select the Precompile Java Server Pages files check box. • Specify the value for the Directory to install application as ${APP_INSTALL_ROOT}/DefaultNode. • Specify an Application name of your choice. • Select the Override class reloading settings for Web and EJB modules check box. • Enter a valid interval in the Reload interval in seconds field. 9 Click Next. The Map Modules to servers page opens. © 2013 MicroStrategy, Inc. Installing and deploying MicroStrategy Web Services 219 8 Installing and Administering MicroStrategy Office MicroStrategy Office User Guide 10 Select the check box for MicroStrategy Web Services J2EE module, ensure that the correct clusters and servers are defined, and then click Apply. 11 Click Next. The Map context roots for web modules page opens. 12 Type a suitable name for ContextRoot, which is case-sensitive. Do not include .war in the name for ContextRoot as this can cause errors when attempting to start the application. URL to access MicroStrategy Web Services J2EE (http:// The machine-name/ContextRoot/) contains the ContextRoot, that you define. For example, you can use the default name of the WAR file, which is MicroStrategyWS. 13 Click Next. The Summary Page opens. 14 Review the summary and click Finish. 15 A message is displayed stating that the installation was successful. Click Save to Master Configuration to save the changes to the master repository. 16 Click Save. To configure class loading 17 Expand Applications, then expand Application Types, and click WebSphere enterprise applications to display a list of installed applications. 18 Click the application name just installed, for example, MicroStrategyWS_war. 19 In the Detail Properties list, click Class loading and update detection. 20 For the Class loader order, select Classes loaded with local class loader first (parent last). 21 Click Apply, and then click OK. 22 Under Modules, click Manage Modules. 23 Click the MicroStrategy Web Services J2EE link. 220 Installing and deploying MicroStrategy Web Services © 2013 MicroStrategy, Inc. MicroStrategy Office User Guide 8 Installing and Administering MicroStrategy Office 24 From the Class loader order drop-down list, select Classes loaded with local class loader first (parent last). 25 Click Apply. 26 In the Message field at the top of the page, click Save. 27 Click Save again. Starting the web module To start the Web module 1 Expand Applications, then expand Application Types, and click WebSphere enterprise applications to display a list of installed applications. 2 Select the check box next to the web application for your Web Services deployment, and click Start. After deploying MicroStrategyWS.war, you can view the WEB-INF folder, which contains the deployed files and folders. Logs are created and maintained in the application server root folder. Viewing the MicroStrategy Web Services home page Viewing the MicroStrategy Web Services J2EE home page is the first level validation of your installation. The home page is accessible only to users with an admin role. To create users and passwords that are authorized to access the home page, first create the necessary role mapping between these users to the admin role for the MicroStrategy Web Services J2EE application. The steps to perform this setup are in Preparing for the application installation, page 219. To access the MicroStrategy Web Services home page 1 Access the home page by typing the following URL in a web browser: http://WebServerName:Port/ContextRoot/ © 2013 MicroStrategy, Inc. Installing and deploying MicroStrategy Web Services 221 8 Installing and Administering MicroStrategy Office MicroStrategy Office User Guide where Port is the HTTP port of your application (default port is 9080), and ContextRoot is the name you provided for the ContextRoot. For example, the default name of the WAR file, which is MicroStrategyWS. and JSP names are case-sensitive. If the application server Servlet is enabled with security, a dialog box for administrator authentication opens. 2 Type the user ID and password assigned with an admin role. After you are authenticated, the MicroStrategy Web Services J2EE home page opens. Use it to explore Web Services, validate your installation, and test Web Services. To validate access to the required runtime files, edit your project sources file, and test your MicroStrategy Web Services J2EE installation, see Completing your MicroStrategy Web Services J2EE deployment, page 230. Uninstalling MicroStrategy Web Services J2EE You can uninstall MicroStrategy Web Services J2EE through the WebSphere Administrative console. To uninstall MicroStrategy Web Services J2EE 3 Expand Applications, then expand Application Types, and click WebSphere enterprise applications to display a list of installed applications. 4 Select the check box of the desired MicroStrategy Web Services J2EE application. 5 Click Uninstall. 6 Save the configuration in the master repository. Deploying with Tomcat Use these steps to deploy and configure MicroStrategy Web Services J2EE in a Tomcat-only environment. It assumes that you have Tomcat deployed and 222 Installing and deploying MicroStrategy Web Services © 2013 MicroStrategy, Inc. MicroStrategy Office User Guide 8 Installing and Administering MicroStrategy Office operational. For information on how to configure Tomcat to work with IIS, refer to your Tomcat documentation. Deploying using Tomcat as a stand-alone Web container The procedure below assumes you are deploying MicroStrategy Web Services J2EE with Tomcat for the first time. If you are redeploying Web Services, you must first delete the MicroStrategyWS directory within the webapps Tomcat directory. To deploy MicroStrategy Web Services J2EE using Tomcat as a stand-alone Web container 1 Copy the MicroStrategyWS.war file to the TomcatDirectory\ webapps directory. The MicroStrategyWS.war file can be found in the folder you specified when installing MicroStrategy Web Services J2EE (see Locating the Web Services installation, page 206). 2 Start Tomcat. You can start Tomcat either from the system tray, or from a command line: • To start Tomcat from the system tray, right-click the Tomcat icon in the system tray and select Start service. • To start Tomcat from the command line: steps to start Tomcat may not work for your version and The configuration of Tomcat. If the following steps do not work, see your vendor documentation on how to start Tomcat. a From the Start menu, select Run. The Run dialog box opens. b Type cmd in the Open drop-down list and click OK. The command prompt opens. c Browse to the TomcatDirectory\bin directory, where TomcatDirectory is the folder in which you installed Tomcat. For example, in the command prompt, type: cd C:\Tomcat\bin where C:\Tomcat is the folder where you installed Tomcat. Press ENTER. you installed Tomcat under the Program Files folder, type IfProgra~1 when you change folders in the command prompt, © 2013 MicroStrategy, Inc. Installing and deploying MicroStrategy Web Services 223 8 Installing and Administering MicroStrategy Office MicroStrategy Office User Guide for example, C:\Progra~1\Tomcat\bin. Otherwise, the system does not recognize the folder. d Type startup to start Tomcat. MicroStrategy Web Services J2EE is deployed automatically, based on the following: • If you have configured Tomcat to deploy an exploded WAR file, which is often the default behavior, a MicroStrategyWS folder is created within the TomcatDirectory\webapps folder. • If you have configured Tomcat to deploy an unexploded WAR file, the configuration files are created within the system’s default temporary file directory. For Windows systems, the temporary file directory is commonly defined by the TMP environment variable: When deploying MicroStrategy Web Services, a /microstrategy/ mws-Version/ folder is created within the temporary file directory, where Version is the version number for the MicroStrategy Web Services product. Within this folder location, various configuration files can be found within the WEB-INF folder and its subfolders. Viewing the MicroStrategy Web Services home page After deploying MicroStrategy Web Services with Tomcat, you can access the MicroStrategy Web Services home page. To configure the MicroStrategy Web Services home page 1 In a web browser, access the MicroStrategy Web Services home page by specifying the following URL: http://localhost:port/MicroStrategyWS/ • The names are case-sensitive. If the application server is enabled with security, a dialog box related to administrator authentication opens. • If you are using Tomcat integrated with IIS, you do not need to specify the port number in the URL. However, when using Tomcat as a stand-alone web container, you must specify the port number. The default port for Tomcat is 8080. 2 When prompted for a user name and password, use the same values you specified in the tomcat-users.xml file. 224 Installing and deploying MicroStrategy Web Services © 2013 MicroStrategy, Inc. MicroStrategy Office User Guide 8 Installing and Administering MicroStrategy Office 3 Once you log in, the MicroStrategy Web Services home page is displayed. To validate access to the required runtime files, edit your project sources file, and test your MicroStrategy Web Services J2EE installation, see Completing your MicroStrategy Web Services J2EE deployment, page 230. Deploying with SAP NetWeaver Use these steps to deploy and configure MicroStrategy Web Services J2EE using the SAP NetWeaver Application Server. This section includes the following information: • Preconfiguration information, page 225: Configuration that must occur before you begin deploying MicroStrategy Web Services J2EE. • Deploying MicroStrategy Web Services J2EE with SAP NetWeaver Application Server, page 226: Instructions for deploying the application. Preconfiguration information This section provides the preconfiguration information necessary to deploy MicroStrategy Web Services J2EE on your computer. It provides setup information for the computer where the application server and web server are already installed. • To support the deployment of Web Services J2EE, you must install an appropriate JDK or JVM. For information on the version numbers of application servers, operating systems, JDKs, and JVMs supported or certified by MicroStrategy, see the MicroStrategy Readme. • Before you start the deployment process, locate the computer name and IP address. Locating the WAR file The MicroStrategy Web Services J2EE application is packaged within a single WAR (Web ARchive) file. You deploy the WAR file to run the application in your application server environment, using the steps in this section. © 2013 MicroStrategy, Inc. Installing and deploying MicroStrategy Web Services 225 8 Installing and Administering MicroStrategy Office MicroStrategy Office User Guide The WAR file is placed in the folder you specified when installing MicroStrategy Web Services J2EE (see Locating the Web Services installation, page 206 for the default installation location). Deploying MicroStrategy Web Services J2EE with SAP NetWeaver Application Server Follow the steps below to deploy MicroStrategy Web Services J2EE as a WAR file. To deploy MicroStrategy Web Services J2EE as a WAR file 1 Copy the MicroStrategyWS.war file to the Windows computer hosting your application server. The location in which you store the file is used later and referred to as path_to_war_file. 2 From the Windows Start menu, select Run. 3 In the Open field, type cmd, and click OK. A command prompt opens. 4 Browse to the following directory within the SAP Application Server installation directory: /usr/sap/SID/Instance_Number/j2ee/deployment/scripts/ The SID and Instance_Number parameters are defined during installation and configuration of the SAP Application Server. The port number above refers to the P4 port number. The default port number is 50004. 5 Type the following command and press ENTER to deploy the MicroStrategyWS.war file: Deploy.bat user_name:password@localhost:port_number path_to_war_file The user name and password must have administrative access. The port number above refers to the P4 port number. The default port number is 50004. 6 Access the NetWeaver web admin console using the following URL: 226 Installing and deploying MicroStrategy Web Services © 2013 MicroStrategy, Inc. MicroStrategy Office User Guide Installing and Administering MicroStrategy Office 8 http://localhost:port_number/nwa The port number above is the J2EE engine port number. The default port number is 50000. 7 Log in as an administrative user. 8 From the Operation Management tab, select the Systems tab, and then click Start & Stop. 9 Select Java EE Applications. A list of applications deployed on the application server are displayed. 10 Select the MicroStrategyWS application just deployed from the list. 11 From the Application Details section, select the Status tab, and then click Start. 12 Select On all instances and Set "Started" as Initial State. When the application is started, the status is displayed as Started. After deploying the MicroStrategyWS.war file, you can view the directory contents including WEB-INF folder. Viewing the MicroStrategy Web Services home page To view the MicroStrategy Web Services home page 1 Access the MicroStrategy Web Services home page by specifying the following URL in a web browser: http://machinename:portnumber/MicroStrategyWS/ The login dialog box opens. 2 Type a user name and password. Deploying with Oracle 10g Use these steps to deploy and configure MicroStrategy Web Services J2EE with Apache as the web server and Oracle 10g R3 as the application server. © 2013 MicroStrategy, Inc. Installing and deploying MicroStrategy Web Services 227 8 Installing and Administering MicroStrategy Office MicroStrategy Office User Guide Deploying MicroStrategy Web Services J2EE The following steps show you how to deploy MicroStrategy Web Services J2EE with Oracle 10g. Deploying using the Oracle Enterprise Manager You can access Oracle Enterprise Manager from the following URL: http://MachineName:PortNumber/em where MachineName is the machine name or IP address of the Oracle machine, and PortNumber is the port number of Oracle Enterprise Manager. To deploy with the Oracle Enterprise Manager 1 Start the Apache Web Server. From the Start menu, point to OracleAS 10g - DEFAULT_HOME1, and then choose Start ApplicationServerName.MachineName.Domain. 2 To verify that the Apache Web Server has started, open Oracle Enterprise Manager, select HTTP Server, and then click Start. 3 Select the OC4J instance where you want to deploy MicroStrategy Web Services J2EE. This procedure assumes you are using the default instance name home. Click home. The OC4J: home page opens. 4 Select the Applications tab. 5 Click Deploy. The Deploy: Select Archive page opens. 6 In the Archive area, select Archive is present on local host. 7 Click Browse to navigate to and select the MicroStrategyWS.war file. This file is located in the path you specified when installing MicroStrategy Web Services (see Locating the Web Services installation, page 206). 8 In the Deployment Plan area, select Automatically create a new deployment plan and click Next. The Deploy: Application Attributes page opens. 228 Installing and deploying MicroStrategy Web Services © 2013 MicroStrategy, Inc. MicroStrategy Office User Guide 8 Installing and Administering MicroStrategy Office 9 Enter the Application Name and Context Root. This procedure uses MicroStrategyWS as the Application Name and /MicroStrategyWS as the Context Root. 10 Click Next. The Deploy: Deployment Settings page opens. To configure class loading 11 In the Configure Class Loading task name, click the Go To Task (pencil) icon. 12 Enable Search Local Classes First for MicroStrategy Web Services J2EE. 13 Click OK. You are returned to the Deploy: Deployment Settings page. To map a user to the admin security role The MicroStrategy Web Services home page is accessible only to users with an admin security role. To control access to it, map the admin security role to only those users for whom you want to grant permission to work in the MicroStrategy Web Services home page. In Oracle 10g, the security users and groups are defined in the Oracle Enterprise Manager. 14 In the Map Security Roles task name, click the Go To Task (pencil) icon. The Deployment Settings: Map Security Roles page opens. 15 For the admin security role, select the Map Role (pencil) icon. The Deployment Settings: Map Security Role: admin page opens. 16 Select Map selected users and groups to this role. 17 In the Map Role to Users area, in the User field, type the user name to map to the admin security role. Click Add. Repeat this step to add all users for whom you want to grant permission to work in the MicroStrategy Web Services home page. 18 Click Continue, and then click OK. You are returned to the Deploy: Deployment Settings page. 19 Click Deploy to deploy the MicroStrategy Web Services application. 20 Stop and restart the Apache Web Server. Any users mapped to the admin security role can now access MicroStrategy Web Services home page. © 2013 MicroStrategy, Inc. Installing and deploying MicroStrategy Web Services 229 8 Installing and Administering MicroStrategy Office MicroStrategy Office User Guide After deploying the MicroStrategyWS.war file, you can view the WEB-INF folder, which contains the deployed files and folders. The log files are created and maintained in the application server root folder. Accessing the MicroStrategy Web Services home page To access the MicroStrategy Web Services home page 1 In a Web browser, access the MicroStrategy Web Services home page by specifying the following URL: http://IP_address/MicroStrategyWS/ where IP_address is the IP address of the Oracle 10g machine. Names are case-sensitive. 2 When prompted for a user name and password, type the values you used earlier when creating the user mapped to the security role. After you log in, the MicroStrategy Web Services home page is displayed. To validate access to the required runtime files, edit your project sources file, and test your MicroStrategy Web Services J2EE installation, see Completing your MicroStrategy Web Services J2EE deployment below. Completing your MicroStrategy Web Services J2EE deployment You must complete the following steps before using your MicroStrategy Web Services J2EE deployment: • Verifying your Web Services installation in ASP.net, page 231 • Verifying your Web Services installation in J2EE, page 231 • Adding or modifying project sources for MicroStrategy Web Services and MicroStrategy Office, page 232 230 Installing and deploying MicroStrategy Web Services © 2013 MicroStrategy, Inc. MicroStrategy Office User Guide 8 Installing and Administering MicroStrategy Office Verifying your Web Services installation in ASP.net Once you have installed Web Services, you can verify your installation by visiting the Web Services URL in your browser using the steps below. The following procedure assumes that you accepted the default configuration while installing MicroStrategy Web Services. To verify the Web Services installation in ASP.net 1 On the computer on which you installed MicroStrategy Web Services, type http://localhost/MicroStrategyWS/MSTRWS.asmx in your browser. The MicroStrategy Web Services ASP.net page opens. 2 Scroll to the end of the page and click the TestService link. The TestService page opens. 3 Under Test, in the Server field, type the host name of the computer where you have installed Intelligence Server. 4 In the ProjectName field, type the name of a project you want MicroStrategy Office users to connect to. If you are testing a new installation of MicroStrategy with no projects created yet, use the MicroStrategy Tutorial sample project. 5 In the Login and Password fields, type the credentials to connect to the project. If you are connecting to the Tutorial sample project, type administrator as the user name and leave the password blank. 6 Click Invoke. If the test succeeds, an XML file with the TestService results is displayed, indicating that a valid session was returned. If the test fails, the TestService page indicates that an error occurred. To ensure that you deployed Web Services correctly, refer to the MicroStrategy Installation and Configuration Guide. For steps to set up security and scalability for Web Services, see Security and Scalability for MicroStrategy Web Services. Verifying your Web Services installation in J2EE The following procedure assumes that you accepted the default configuration while installing MicroStrategy Web Services. © 2013 MicroStrategy, Inc. Installing and deploying MicroStrategy Web Services 231 8 Installing and Administering MicroStrategy Office MicroStrategy Office User Guide To verify the Web Services installation in J2EE 1 On the computer on which you installed MicroStrategy Web Services, type http://localhost:8080/MicroStrategyWS/ in your browser. The MicroStrategy Web Services J2EE home page opens. 2 In the Web Service URL field, type http://localhost:8080/ MicroStrategyWS/services/MSTRWSJ. 3 In the Intelligence Server field, type the host name of the computer where Intelligence Server is installed. 4 In the ProjectName field, type the name of a project you want MicroStrategy Office users to connect to. If you are testing a new installation of MicroStrategy, use the MicroStrategy Tutorial sample project. 5 In the Login and Password fields, type the credentials to connect to the project. If you are connecting to the Tutorial sample project, type administrator as the user name and leave the password blank. 6 Click Run. If the test succeeds, an XML file with the TestService results is displayed, indicating that a valid session was returned. If the test fails, the TestService results indicate that an error occurred. To ensure that you deployed Web Services correctly, refer to the MicroStrategy Installation and Configuration Guide. For steps to set up security and scalability for Web Services, see Security and Scalability for MicroStrategy Web Services. Adding or modifying project sources for MicroStrategy Web Services and MicroStrategy Office The project sources for MicroStrategy Web Services are defined in the projectsources.xml file. The project sources defined here also define which project sources MicroStrategy Office users can connect to. This file can be located in the following locations: • Web Services ASP.NET: By default, the projectsources.xml file is installed in the following directory: 232 Installing and deploying MicroStrategy Web Services © 2013 MicroStrategy, Inc. MicroStrategy Office User Guide • 8 Installing and Administering MicroStrategy Office 32-bit Windows environments: C:\Program Files\ MicroStrategy\Web Services 64-bit Windows environments: C:\Program Files (x86)\ MicroStrategy\Web Services Web Services J2EE: The projectsources.xml file is located within the WAR file used for deployment. Once you deploy Web Services J2EE, you can access this XML file from the top level folder of the deployed application. To add project sources for MicroStrategy Web Services and MicroStrategy Office 1 Locate and open the projectsources.xml file in a text editor such as Windows Notepad. By default, the file contains the definition of the MicroStrategy Tutorial project, as shown below: <ProjectSource> <ProjectSourceName>MicroStrategy Tutorial</ ProjectSourceName> <ServerName>localhost</ServerName> <AuthMode>MWSStandard</AuthMode> <PortNumber>0</PortNumber> <MaxPooledConnections>100</MaxPooledConnections> </ProjectSource> 2 To add the definition of a new project source, duplicate the above format with the following parameters: • ProjectSourceName: The name of the project source. • ServerName: The computer name of the server that hosts Intelligence Server. • AuthMode: The authentication mode to use for the project source. For information on available authentication modes, see Enabling authentication modes in MicroStrategy Office. • PortNumber: The port through which Intelligence Server is accessed. By default, this value is 0. • MaxPooledConnections: The number of connections that Intelligence Server makes available to users at one time. © 2013 MicroStrategy, Inc. Installing and deploying MicroStrategy Web Services 233 8 Installing and Administering MicroStrategy Office MicroStrategy Office User Guide 3 Save the changes to the projectsources.xml file and close it. The new project sources are displayed to MicroStrategy Office users when they open MicroStrategy Office. Establishing connectivity to MicroStrategy applications Before MicroStrategy Office can be used, it must be connected to other MicroStrategy applications. Depending on the desired functionality and architecture, there are multiple connections that may need to be defined in MicroStrategy Office: • The minimum connection required to run MicroStrategy Office is between MicroStrategy Office and MicroStrategy Web Services. This connection can also incorporate a proxy server. For more information, see Connecting MicroStrategy Office to MicroStrategy Web Services. • To allow MicroStrategy Office users to create and edit reports and documents in MicroStrategy Office, you must connect MicroStrategy Office to MicroStrategy Web. For more information, see Connecting MicroStrategy Office and MicroStrategy Web. • If users frequently switch between working on a development server and a production server, it can be helpful to configure MicroStrategy Office to search for and connect to an Intelligence Server in MicroStrategy Web Services that contains a specific project source name. For more information, see Using the project source name to connect to an Intelligence Server. Connecting MicroStrategy Office to MicroStrategy Web Services The connection between MicroStrategy Office and MicroStrategy Web Services is essential for MicroStrategy Office to function. You can either connect them directly, or through a proxy server. Both sets of steps are below. The following steps assume that you have installed MicroStrategy Web Services. 234 Establishing connectivity to MicroStrategy applications © 2013 MicroStrategy, Inc. MicroStrategy Office User Guide 8 Installing and Administering MicroStrategy Office To connect MicroStrategy Office to MicroStrategy Web Services directly 1 In any Microsoft product, from the MicroStrategy tab, select Options. The Options dialog box opens. 2 Under the General folder, select Server. 3 In the Web Services URL field, type the URL that points to Web Services: • For Windows Web Services, the URL is http://server/ virtual-directory/mstrws.asmx Where server is the web server where MicroStrategy Web Services is installed, and virtual-directory is the virtual directory on the web server (the default value is MicroStrategy WS). • For Web Services J2EE (non-Windows), the case-sensitive URL varies depending on the web server. 4 Click View to open the specified Web Services URL in Internet Explorer. If the URL is valid, the Web Services description page is displayed. 5 Click Test to test the connection. A dialog box opens stating whether or not the test was successful. Click OK to close the message. 6 Click OK. 7 Restart Microsoft Office to have your changes take effect. To connect MicroStrategy Office to Web Services using a proxy server 1 In any Microsoft product, from the MicroStrategy tab, select Options. The Options dialog box opens. 2 Under the General folder, select Server. 3 Next to the Proxy URL field, click Configure. The Proxy Settings dialog box opens. © 2013 MicroStrategy, Inc. Establishing connectivity to MicroStrategy applications 235 8 Installing and Administering MicroStrategy Office MicroStrategy Office User Guide 4 Select Use a Proxy Server (selected by default), and select one of the following: • If you want to use a default proxy server that is already defined in your Internet browser, select Default Proxy Server. Selected by default. • If you want to use a proxy server that is not configured to be the default for your Internet browser, select Explicit proxy server, then type the URL for the proxy server in the Address field and type a port number in the Port field. The default proxy setting is default proxy. you are using an explicit proxy server, you can choose to Ifbypass the proxy server if the Web Services URL is local by selecting the Bypass proxy server for local addresses check box. 5 Type the proxy server machine name or IP address in the Address field. 6 Type the port number of the proxy server in the Port field. 7 If you do not want the proxy server to be used when connecting to local servers, select Bypass proxy server for local addresses. 8 Click OK. The Proxy Settings dialog box closes. 9 Click OK. 10 Restart Microsoft Office to have your changes take effect. Connecting MicroStrategy Office and MicroStrategy Web For users to be able to create and edit MicroStrategy reports, documents, prompts, or filters in MicroStrategy Office, you must establish connectivity between MicroStrategy Office and MicroStrategy Web. If this connectivity is not established, the MicroStrategy Office Report Editor and the MicroStrategy Office Document Editor will not be available. Any time a user attempts to create or edit a report, document, prompt, or filter, the session is passed from MicroStrategy Office to MicroStrategy Web. Steps to establish connectivity between the two products are provided below. You can also configure other settings related to report and browsing execution times between MicroStrategy Office and MicroStrategy Web; see Setting report and browsing execution times. 236 Establishing connectivity to MicroStrategy applications © 2013 MicroStrategy, Inc. MicroStrategy Office User Guide 8 Installing and Administering MicroStrategy Office To establish connectivity between MicroStrategy Office and Web 1 In any Microsoft product, from the MicroStrategy tab, select Options. The Options dialog box opens. 2 Under the General folder, select Server. 3 Type the MicroStrategy Web URL in the Web URL field, for example, http://localhost/microstrategy/asp. You must configure a MicroStrategy Web URL to enable report, document, prompt, and filter creation and editing in Office. 4 Click Test. If the Web URL is correct, the MicroStrategy Web Home page opens in Internet Explorer. 5 Click OK. Setting report and browsing execution times 1 In any Microsoft product, from the MicroStrategy tab, select Options. The Options dialog box opens. 2 Under the General folder, select Server. In the Web Services area: • Report execution times out after n minutes: Determines how long a report execution may take between MicroStrategy Office and Web Services. Report executions that exceed this limit fail. Default is 30 minutes; range 1 minute - 24 hours. timeout settings of a shorter duration may also cause a Other report execution to fail, for example, a network timeout, MicroStrategy governors, and so on. • Browsing times out after n minutes: Determines how long requests (other than report execution) between MicroStrategy Office and Web Services may take before failing with a time-out error. Other timeout settings may also cause requests to fail. Default is 1 minute; range 1-10 minutes. • Poll for execution results every n milliseconds: Determines how often MicroStrategy Office checks for execution status from Web © 2013 MicroStrategy, Inc. Establishing connectivity to MicroStrategy applications 237 8 Installing and Administering MicroStrategy Office MicroStrategy Office User Guide Services during report execution. Default is 500 milliseconds; range 0-5,000 milliseconds. In the Web area: • Report execution times out after n minutes: Determines how long a report execution may take between MicroStrategy Office and Web Services. Report executions that exceed this limit fail. Default is 30 minutes; range 1 minute - 24 hours. 3 Click OK. Trusting the relationship between Web Services and Intelligence Server You can create or delete trust relationships between the currently connected Web Services and Intelligence Server. 1 In any Microsoft product, from the MicroStrategy tab, select Options. The Options dialog box opens. 2 Under the General folder, select Server. 3 In the Web area, click Create or Delete to create or delete a trust relationship. 4 Click OK. Using the project source name to connect to an Intelligence Server You can configure MicroStrategy Office to use the saved project source name to connect to the Intelligence Server. This is useful, for example, when users frequently change from working in a development server to working in a production server. When you configure MicroStrategy Office to connect to the Intelligence Server using the saved project source name, MicroStrategy Office finds a project source name in Web Services that matches the saved project source name. If a match is found, Office connects to the Intelligence Server associated with the project source name. If this configuration is not in place or Web Services does not have a matching project source name, Office 238 Establishing connectivity to MicroStrategy applications © 2013 MicroStrategy, Inc. MicroStrategy Office User Guide 8 Installing and Administering MicroStrategy Office attempts to find a server name in Web Services that matches the saved server name. The MicroStrategy Office user provides the project source name and the Intelligence Server to connect to when they log in to MicroStrategy Office. For steps to provide this information on login, see Logging in and accessing reports in a project, page 13. To use the project source name to connect to an Intelligence Server 1 On the MicroStrategy tab, click Options. The Options dialog box opens. 2 Under the General folder, expand the Security folder. 3 Select the Use the persisted project source name to connect check box. Cleared by default. 4 Click OK. Allowing blank passwords Another useful feature for users who frequently log in is to allow the ability to connect with a blank password before displaying the login dialog. Use this option if you frequently connect with a blank password and do not want to be prompted for a password when connecting. To allow blank passwords 1 On the MicroStrategy tab, click Options. The Options dialog box opens. 2 Under the General folder, expand the Security folder, and click Login. 3 Select Allow blank passwords. If selected, the system attempts to connect using a blank password before displaying the login dialog box. Cleared by default. 4 Click OK. © 2013 MicroStrategy, Inc. Establishing connectivity to MicroStrategy applications 239 8 Installing and Administering MicroStrategy Office MicroStrategy Office User Guide User authentication and security overview Users are authenticated by default upon login by entering their credentials, consisting of a MicroStrategy user name and password. When they log in, their MicroStrategy access privileges determine the MicroStrategy projects they can log in to, the data they can see in reports, and so on. This section describes authentication options and the impact of each type, and provides details on MicroStrategy privileges to use MicroStrategy Office functionality. Users are also prompted to authenticate themselves when they refresh an Excel workbook, PowerPoint presentation, or Word document that contains MicroStrategy report data. a user refreshes a file that contains reports and documents, he When must enter the type of authentication credentials specified in the properties of each report and document. For information on authentication types when refreshing a file, see Determining how a user is authenticated to view reports, page 248. The following MicroStrategy security is applied when MicroStrategy Office is used to access workbooks, presentations, or Word documents that contain data: • Object security: Defines which folders, reports, and documents are available to the user in the Folder List in the MicroStrategy Office Options dialog box. • Security filters: Defines what data the user sees on each report or document. This security is applied in several ways, depending on who is accessing the workbook, presentation, or Word document, as explained below. Security workflows The following security workflows describe the security applied to users when they access and work with MicroStrategy reports and documents in workbooks, presentations, or Word documents. Each scenario describes a user accessing MicroStrategy Office from Excel, PowerPoint, or Word: • MicroStrategy Office user creates a report-filled file, page 241 240 User authentication and security overview © 2013 MicroStrategy, Inc. MicroStrategy Office User Guide 8 Installing and Administering MicroStrategy Office • MicroStrategy Office user receives a report-filled file, page 242 • Non-MicroStrategy Office users receive a report-filled file, page 243 MicroStrategy Office user creates a report-filled file If a user creates a new Excel workbook, PowerPoint presentation, or Word document and intends to add a MicroStrategy report or Report Services document to it, the following takes place, by default: 1 In the Excel workbook, PowerPoint presentation, or Word document, the user clicks MicroStrategy on the MicroStrategy tab. 2 The Connect To Project dialog box opens, prompting the user to select a MicroStrategy project source. After the user selects a project source and enters his user name and password, a list of the projects available to the user is displayed. on the type of authentication that is implemented, the Depending user may be required to provide login credentials other than their MicroStrategy user name and password. For steps to enable different types of authentication, see Enabling authentication modes in MicroStrategy Office, page 246. 3 The user selects a project to connect to. A MicroStrategy session is created. 4 MicroStrategy Office opens, displaying a list of the folders, reports, and documents to which the user has access. The folders, reports, and documents the user can see depend on his object security privileges. security permissions are assigned by an administrator in Object MicroStrategy. For information about object security, see the MicroStrategy System Administration Guide. 5 When the user runs a report or document in the workbook, presentation, or Word document, the report/document only includes data the user is allowed to see, based on his security filter. filters are created and assigned in MicroStrategy. For Security information about security filters, see the MicroStrategy System Administration Guide. © 2013 MicroStrategy, Inc. User authentication and security overview 241 8 Installing and Administering MicroStrategy Office MicroStrategy Office User Guide MicroStrategy Office user receives a report-filled file If a MicroStrategy Office user receives an Excel workbook, PowerPoint presentation, or Word document containing a report or document with data from MicroStrategy, the following takes place, by default: 1 A user opens the workbook, presentation, or Word document that contains MicroStrategy reports and/or documents. A message may notify him that there are reports within the file and asks him to log in to refresh and view the reports. Note the following: – Depending on the type of authentication that is implemented, the user may be required to provide login credentials other than their MicroStrategy user name and password. For steps to enable different types of authentication, see Enabling authentication modes in MicroStrategy Office, page 246. – Users may have to log in multiple times if any reports or documents are persisted from multiple servers. – The user is asked to refresh the reports if the Refresh reports when documents are opened check box in the General folder is selected when the workbook, presentation, or Word document is created. 2 The user enters his user name and password. A MicroStrategy session is established. Any reports and documents in the Microsoft file are displayed. 3 Each report contains data the user is allowed to see based on his MicroStrategy object security and associated security filter. For example, two regional managers have two different security filters for their regions—one in the Northeast and the other in the Southwest. If these two regional managers run the same report, they see different results. Note the following: – Object security privileges are assigned by an administrator in MicroStrategy. For information about object security, see the MicroStrategy System Administration Guide. – Security filters are created and assigned by an administrator in MicroStrategy. For information about security filters, see the MicroStrategy System Administration Guide. 242 User authentication and security overview © 2013 MicroStrategy, Inc. MicroStrategy Office User Guide Installing and Administering MicroStrategy Office 8 For example, a manager receives a Word document that contains MicroStrategy reports. When she refreshes the document, she is prompted to enter her MicroStrategy credentials. These credentials ensure that when the reports are refreshed, the manager can only view data to which she has access. For example, she may have access to shipping data for only California, since that is the state branch with which she works. In this case, a security filter for California prevents the user from seeing data unrelated to California shipping. The user can only view the reports, attributes, and metrics to which she has access. Non-MicroStrategy Office users receive a report-filled file If users without MicroStrategy Office receive an Excel workbook, PowerPoint presentation, or Word document that contains MicroStrategy data, they can view any data that resides in that Microsoft Office file and has not been removed before the file is sent. Although the reports are static and cannot be refreshed, these users can still analyze and work with the reports. Controlling user access to functionality: Privileges After MicroStrategy Office is connected to Web Services and MicroStrategy Web, users must be granted privileges to allow them to create or edit reports or documents. Privileges are assigned in MicroStrategy. When a user accesses the MicroStrategy Report Editor or Document Editor, the session is passed from MicroStrategy Office to MicroStrategy Web. Because of this architecture, some Web privileges are required to use the report and document creation features in MicroStrategy. The privileges © 2013 MicroStrategy, Inc. User authentication and security overview 243 8 Installing and Administering MicroStrategy Office MicroStrategy Office User Guide required depend on the tasks that the user wishes to accomplish. Refer to the table below for a list of the privileges required for each task. details on the privileges available in MicroStrategy and steps to For grant privileges to users and groups, see the MicroStrategy System Administration Guide. Task Required Web Privileges Create a report • Web User • Web Create New Report • Web Use Design Mode Edit a report • Web User • Web Use Design Mode Create or edit a document • Web User • Web Document Design • Web Execute Document Determining how users log in to MicroStrategy Office There are multiple ways that you can allow users to log in to MicroStrategy Office. You can require them to provide a username and password using one of several types of authentication, you can allow them to log in without a password, you can allow Windows NT users to automatically connect to projects without having to log in a second time, or you can set up a single-sign on environment using Tivoli or SiteMinder. You can also determine at what point in the login process a user connects to a project. By default, a user opens a Microsoft product and launches MicroStrategy Office. The user enters their MicroStrategy username and password, and clicks a button to display a list of projects. The user then selects a project to connect to from that list. You can configure MicroStrategy Office to display a list of projects that are loaded on a project source before the user logs in. The user selects a project to connect to, then enters their login credentials. This login workflow is similar to the default login workflow to MicroStrategy Web, and it may be useful to implement this login workflow for MicroStrategy Office users that are familiar with MicroStrategy Web. For details about configuring this type of login workflow, see Displaying all projects in a project source or from multiple Intelligence Servers before login, page 252. 244 Determining how users log in to MicroStrategy Office © 2013 MicroStrategy, Inc. MicroStrategy Office User Guide Installing and Administering MicroStrategy Office 8 The following table provides high-level steps to determine how a user logs in to MicroStrategy Office, and when they select a project to connect to. For more information about authentication in MicroStrategy, as well as details about authentication types, see the MicroStrategy System Administration Guide. How the user logs in High-level steps to configure The user enters LDAP, MicroStrategy, or database username and password. Enable the appropriate authentication type in projectsources.xml. See Enabling authentication modes in MicroStrategy Office, page 246 for details and steps. The user logs in without a password. Only a username is required. 1 Enable the appropriate authentication type in projectsources.xml. See Enabling authentication modes in MicroStrategy Office, page 246 for details and steps. 2 Allow users to log in without a password in MicroStrategy Office. See Allowing users to log in without a password, page 249 for details and steps. The user logs in to their computer with Tivoli or SiteMinder credentials. These credentials are automatically passed to MicroStrategy Office, and the user is logged in automatically. See Allowing users to log in to MicroStrategy Office with Tivoli or SiteMinder credentials, page 251 for steps. MicroStrategy Office automatically connects the user to a project when they log in to their computer with their Windows NT credentials. 1 Enable Windows NT authentication in projectsources.xml. See Enabling authentication modes in MicroStrategy Office, page 246 for details and steps. 2 Enable automatic Windows NT authentication in MicroStrategy Office. See Allowing Windows NT users to automatically connect to projects, page 250 for details and steps. This section includes information about the following: • Enabling authentication modes in MicroStrategy Office, page 246 • Allowing users to log in without a password, page 249 • Allowing Windows NT users to automatically connect to projects, page 250 • Allowing users to log in to MicroStrategy Office with Tivoli or SiteMinder credentials, page 251 • Displaying all projects in a project source or from multiple Intelligence Servers before login, page 252 © 2013 MicroStrategy, Inc. Determining how users log in to MicroStrategy Office 245 8 Installing and Administering MicroStrategy Office MicroStrategy Office User Guide Enabling authentication modes in MicroStrategy Office You can define how users log in to their MicroStrategy projects by configuring different forms of authentication for MicroStrategy Office. Authentication in MicroStrategy Office is handled by MicroStrategy Web Services. When users connect to a MicroStrategy project in MicroStrategy Office, they select from a list of MicroStrategy project sources in the Connect To Project dialog box. You may want users to have access to a project source that uses LDAP authentication as well as one that uses standard authentication. To enable multiple authentication modes in MicroStrategy Office, you must create separate project sources in MicroStrategy Developer for each authentication mode. Once a separate project source is created for each authentication mode, you then configure the projectsources.xml file on the Web Services computer to enable the correct form of authentication in MicroStrategy Office. Follow the procedure below to configure authentication modes for MicroStrategy Office. Prerequisites • A project source must already be configured to use LDAP, Windows NT, integrated, warehouse passthrough, or anonymous authentication. For steps, see the MicroStrategy System Administration Guide. • The application server hosting Web Services, and Intelligence Server must both be configured to use the appropriate authentication, as described above. • You must have administrator privileges in MicroStrategy Developer to configure authentication modes for project sources. • You must have access to the MicroStrategy Web Services computer. To enable authentication modes for MicroStrategy Office 1 On the computer where Web Services is installed, navigate to and open the projectsources.xml file. By default, this file is located in C:\ Program Files\MicroStrategy\Web Services. 246 Determining how users log in to MicroStrategy Office © 2013 MicroStrategy, Inc. MicroStrategy Office User Guide 8 Installing and Administering MicroStrategy Office The projectsources.xml file contains a list of project sources supported by MicroStrategy Web Services. It also provides instructions on enabling and configuring authentication for those project sources. Before a project source is available to users in MicroStrategy Office, it must first be added to projectsources.xml. 2 To specify the type of authentication to use, change the value between the <AuthMode> and </AuthMode> tags in projectsources.xml. The <AuthMode> tag specifies the type of authentication used for the project source. For an example of how this tag should be edited, see Example: Specifying authentication types for multiple project sources in projectsources.xml. You can use the following values in the AuthMode tags: • MWSStandard: Use standard authentication. • MWSNTCredential: Use the user’s Windows NT credentials. • MWSPassThru: Use passthrough authentication for both the metadata and data warehouse. • MWSAnonymous: Use anonymous authentication. • MWSLDAP: Use LDAP authentication. • MWSWarehousePassThru: Use passthrough authentication for the data warehouse only. • MWSSimpleSecurityPlugIn: Use a third-party authentication provider, such as Tivoli or SiteMinder. • MWSIntegrated: Use integrated authentication with Kerberos. Example: Specifying authentication types for multiple project sources in projectsources.xml The projectsources.xml sample below shows different authentication types specified for two different projects. In this example, a MicroStrategy Tutorial project source is configured to use standard authentication and a Shipping Analysis project source is configured to use LDAP authentication. © 2013 MicroStrategy, Inc. Determining how users log in to MicroStrategy Office 247 8 Installing and Administering MicroStrategy Office MicroStrategy Office User Guide <ProjectSources> <ProjectSource> <ProjectSourceName>MicroStrategy Tutorial</ProjectSourceName> <ServerName>localhost</ServerName> <AuthMode>MWSStandard</AuthMode> <PortNumber>0</PortNumber> <MaxPooledConnections>100</MaxPooledConnections> </ProjectSource> <ProjectSource> <ProjectSourceName>Shipping Analysis</ProjectSourceName> <ServerName>localhost</ServerName> <AuthMode>MWSLDAP</AuthMode> <MaxPooledConnections>150</MaxPooledConnections> </ProjectSource> </ProjectSources> Determining how a user is authenticated to view reports You can define how users are authenticated to view a specific report’s data by modifying that report’s connection and authentication properties. For example, in your development environment, users log in to MicroStrategy Office using standard MicroStrategy authentication. Designers create and test workbooks, presentations, and Word documents on the development system and then distribute them to users who run them in the production system. However, your production system uses Windows NT authentication. Prior to distributing the Microsoft files, you must change the authentication mode and server name for each report to match the production system authentication mode and server name. In the example above, you change the authentication mode for each report to Windows NT since that is the authentication mode used in the production system. You also change the server name so that it matches the production server name. This ensures that users are logging into the production environment and not the development environment when they access and refresh reports and documents. 248 Determining how users log in to MicroStrategy Office © 2013 MicroStrategy, Inc. MicroStrategy Office User Guide Installing and Administering MicroStrategy Office 8 Prerequisite • You must configure Windows NT, LDAP, integrated, anonymous, or warehouse passthrough authentication in MicroStrategy Office before individual report authentication modes can take effect. To configure these authentication modes in MicroStrategy Office, see Determining how users log in to MicroStrategy Office, page 244. To modify how users are authenticated to view reports 1 In a workbook, presentation, or Word document that contains reports, on the MicroStrategy tab, click Reports. A list of the reports currently in the file is displayed. 2 Right-click one or more reports whose authentication modes you want to modify and select Properties. The Report Properties dialog box is displayed. 3 In the MicroStrategy Connection Settings area, select an authentication mode from the Authentication Mode drop-down list. For example, select Windows NT if users must log in to the report using their Windows NT login information. This means that when users refresh that specific report, they are prompted to log in using their Windows NT credentials. 4 Click OK. Allowing users to log in without a password You can specify that when users log in, they do not have to enter a password when they refresh and view reports and documents. Users can only log in without a password if their login ID is set up by an administrator to allow them to enter blank passwords. To allow users to log in without specifying a password 1 On a computer with MicroStrategy Office installed, open Microsoft Excel, PowerPoint, or Word. 2 On the MicroStrategy tab, click Options. The Options dialog box opens. © 2013 MicroStrategy, Inc. Determining how users log in to MicroStrategy Office 249 8 Installing and Administering MicroStrategy Office MicroStrategy Office User Guide 3 Under the General folder, expand the Security folder. 4 Select the Allow blank passwords check box. 5 Click OK to save your changes. When a user refreshes reports, MicroStrategy Office attempts to refresh the reports without prompting him for a password. Allowing Windows NT users to automatically connect to projects Administrators can allow Windows NT-authenticated users to automatically connect to a project. Once an administrator has enabled automatic Windows NT authentication, a user selects a MicroStrategy project to automatically connect to using his or her Windows NT credentials. This occurs because they have already logged in to the Windows NT operating system with a login ID and password, and these credentials are automatically used by MicroStrategy Office to connect to MicroStrategy Intelligence Server. Windows NT authentication is possible only when a user’s Automatic login ID is not persisted and Windows NT authentication is specified in the Report Properties dialog box for the specific report(s). For more information on persisting login IDs, see Excluding MicroStrategy Office login information when saving Microsoft files, page 176. For information on selecting an authentication type for a report, see Determining how a user is authenticated to view reports, page 248. To ensure that Windows NT users are automatically connected to projects 1 On the MicroStrategy tab, click Options. The Options dialog box opens. 2 Under the General folder, expand the Security folder. 3 Ensure the Automatic Windows NT authentication check box is selected. Cleared by default. 4 Click OK to save your changes. 250 Determining how users log in to MicroStrategy Office © 2013 MicroStrategy, Inc. MicroStrategy Office User Guide 8 Installing and Administering MicroStrategy Office Allowing users to log in to MicroStrategy Office with Tivoli or SiteMinder credentials MicroStrategy Office can use IBM Tivoli Access Manager or CA SiteMinder to authenticate users. This type of authentication allows users to use a single username and password for multiple programs. When this type of authentication is enabled in MicroStrategy Office, users are prompted to log in with their Tivoli or SiteMinder credentials. For more details about the types of authentication available in MicroStrategy products, and for detailed information about configuring authentication using Tivoli or SiteMinder credentials in MicroStrategy Office, see the MicroStrategy System Administration Guide. The following high-level steps explain how enable authentication using Tivoli or SiteMinder in MicroStrategy Office. High-level steps to enable authentication using Tivoli or SiteMinder in MicroStrategy Office 1 Depending on whether you will be using Tivoli or SiteMinder, do one of the following: • For Tivoli: create a junction for MicroStrategy Web Services in Tivoli. For detailed instructions, see your Tivoli documentation. • For SiteMinder: configure a SiteMinder Web Agent for MicroStrategy Web Services. For detailed instructions, see your SiteMinder documentation. 2 Use the Tivoli junction or SiteMinder Web Agent URL as your Web Services URL in MicroStrategy Office. For more information about connectivity in MicroStrategy Office, see Establishing connectivity to MicroStrategy applications, page 234. 3 Enable anonymous authentication in the Web Services virtual directory. For detailed instructions, see the MicroStrategy System Administration Guide. © 2013 MicroStrategy, Inc. Determining how users log in to MicroStrategy Office 251 8 Installing and Administering MicroStrategy Office MicroStrategy Office User Guide Displaying all projects in a project source or from multiple Intelligence Servers before login You can configure MicroStrategy Office to display all projects for a selected project source before a user logs in, or all projects from all configured Intelligence Servers. The user selects a project from the list, and can then enter their login credentials or have access without logging in. If login is required, the login credentials are associated with a MicroStrategy user that has access to the selected project and MicroStrategy Office connects to the project. This option may be helpful for users that are accustomed to the login procedure for MicroStrategy Web. Users are only able to connect to a project that they have access to. It is possible that some projects will be listed despite being inaccessible to the user. If a user attempts to log in to a project that they do not have access to, the login fails. To display projects from a project source or from all configured Intelligence Servers 1 On the MicroStrategy tab, click Options. The Options dialog box opens. 2 Under the General folder, expand the Security folder. 3 Select Login. 4 In the Project area: • To show projects from a single server and require login, clear Show projects from all servers and clear Show loaded projects before login. This is the default setting; both are cleared by default. • To show projects from a single server without requiring login, clear Show projects from all servers and select Show loaded projects before login. • To show projects from all Intelligence Servers and require login, select Show projects from all servers and clear Show loaded projects before login. • To show projects from all Intelligence Servers without requiring login, select Show projects from all servers and select Show loaded projects before login. 252 Determining how users log in to MicroStrategy Office © 2013 MicroStrategy, Inc. MicroStrategy Office User Guide 8 Installing and Administering MicroStrategy Office 5 Click OK to save your changes. Using MicroStrategy Office in a multilingual environment MicroStrategy supports a large number of language configurations for a wide range of objects and interfaces. This allows data to be delivered to a wide audience. The language that each user sees depends on a variety of language preferences that can be set at multiple levels, and in different MicroStrategy applications. If your MicroStrategy platform is installed with MicroStrategy Office, the initial default language is set to the platform user interface language. Because MicroStrategy Office uses MicroStrategy Web to execute, edit, and create reports and documents, the language that is displayed in reports and documents matches the language preference set for the user in MicroStrategy Web and Developer. This language is used to display translated versions of data, metric names, and other MicroStrategy objects, depending on what terms your organization provides translations for. If the MicroStrategy platform is not installed, the default language is determined by the operating system locale. For information about setting up internationalization in the MicroStrategy environment, see the MicroStrategy System Administration Guide. Numeric formatting is determined by Microsoft locale settings. For steps to set the locale in Microsoft Office, refer to your Microsoft Office documentation. You can change several language options from the defaults listed above. To provide translated strings for customization, see an example and details in Customizing text strings in MicroStrategy Office, page 263. To edit language settings 1 On the MicroStrategy tab, click Options. The Options dialog box opens. 2 On the left, select International. © 2013 MicroStrategy, Inc. Using MicroStrategy Office in a multilingual environment 253 8 Installing and Administering MicroStrategy Office MicroStrategy Office User Guide 3 Select from the following options: In the User interface language area: • Match Microsoft Office settings: If selected, the user interface language is set to match the Microsoft Office user interface language (if available). • Choose an explicit language: If selected, the language for the user’s interface can be selected from a list of available languages. Selected by default. Languages in the drop-down list reflect installed languages. In the Excel format language area: • Set language automatically: If selected, MicroStrategy Office automatically determines language settings used to translate color codes for Excel numeric formats. Selected by default. setting should not be changed unless there are problems This with the display of localized numbers or dates. In some locales, MicroStrategy Office requires the Microsoft Office Multi-lingual User Interface (MUI) pack to display numeric and date values in prompt dialogs. If prompt data values display incorrectly and the installation language of Microsoft Office is different than the operating system regional settings, install the appropriate MUI and select Office multi-lingual user interface pack is installed. This option is cleared by default. • Choose an explicit language: If selected, the language used to translate color codes in Excel numeric formats can be selected from a list of languages. Not all languages have color code translations provided by MicroStrategy. • Languages in the drop-down list reflect installed languages. Display date/time using server time zone: If selected, dates and times in MicroStrategy Office dialog boxes are displayed in the time zone of the connected Intelligence Server machine. If cleared, dates and times are displayed in the time zone of the client machine. Selected by default. 4 Restart MicroStrategy Office for changes to language settings to take effect. 254 Using MicroStrategy Office in a multilingual environment © 2013 MicroStrategy, Inc. A CUSTOMIZING MICROSTRATEGY OFFICE A. Introduction You can customize MicroStrategy Office to accommodate your business and reporting requirements and create custom business intelligence applications. This appendix discusses how you can perform simple customizations such as changing the names of the options in the MicroStrategy Office toolbar, tab, and menu. It also explains how MicroStrategy Office can be customized with various graphics, text strings and links to better match your business applications. You can also customize many of the strings in the Office interface and messages. Customizing the MicroStrategy Office menu, toolbar or tab Depending on the version of Microsoft Office you are using, you can customize the way the MicroStrategy Office menu, toolbar, or tab is © 2013 MicroStrategy, Inc. Customizing the MicroStrategy Office menu, toolbar or tab 255 A Customizing MicroStrategy Office MicroStrategy Office User Guide displayed. For example, you can move the MicroStrategy buttons from the MicroStrategy tab to another tab, or you can change the button type that is displayed on the toolbar. See the appropriate steps below depending on which version of Microsoft Office you are using: • If you are using Microsoft Office 2007 or later, see Changing buttons on the MicroStrategy tab, page 257 for details about what you can customize. • If you are using a version of Microsoft Office that is earlier than Microsoft Office 2007, see Customizing the MicroStrategy Office menu and toolbar, page 256 for details about what you can customize. Customizing the MicroStrategy Office menu and toolbar If you are using a version of Microsoft Office that is earlier than 2007, you can use the steps below to change the button types and hide or show the MicroStrategy menu. Any changes you make to the MicroStrategy Office toolbar are applied only to the MicroStrategy Office installation on your computer and are displayed in all your Microsoft Office products. guide refers to the default MicroStrategy Office toolbar or tab This option names and assumes all buttons are visible on the toolbar or tab. To customize the MicroStrategy Office toolbar and menu 1 On the MicroStrategy Office toolbar or menu, click Options. The Options dialog box opens. 2 Under the General folder, expand the Customization folder. 3 Choose from the following options to customize the MicroStrategy Office toolbar: • Show toolbar: If selected, the MicroStrategy Office toolbar is displayed. Selected by default. Show Main dialog button as: Choose how the Main dialog button will be displayed on the toolbar. Default is Icon and Caption. 256 Customizing the MicroStrategy Office menu, toolbar or tab © 2013 MicroStrategy, Inc. MicroStrategy Office User Guide • Customizing MicroStrategy Office A Show Refresh button as: Choose how the Refresh button will be displayed on the toolbar. Default is Icon and Caption. Show Reports button as: Choose how the Reports button will be displayed on the toolbar. Default is Icon and Caption. Show Options button as: Choose how the Options button will be displayed on the toolbar. Default is Icon and Caption. For buttons and icons on the toolbar, select the type to display: – Icon: Displays the specified toolbar button with an icon. – Caption: Displays the specified toolbar button with a text caption. – Icon and Caption: Displays the specified toolbar button with an icon and a text caption. 4 To display the MicroStrategy Office menu, select Show menu. Cleared by default. 5 Click OK. Changing buttons on the MicroStrategy tab If you are using MicroStrategy Office in Microsoft Office 2007 or later, you can hide groups of buttons or change their order in a tab. The image below shows the default groups of buttons. By default, the following groups of buttons are displayed on the MicroStrategy tab: • The MicroStrategy Office group, including the Office, Refresh, Reports, and Options buttons. • The Package group, including the Package, Extract, and Package Wizard buttons. • The Help group, including the help button. © 2013 MicroStrategy, Inc. Customizing the MicroStrategy Office menu, toolbar or tab 257 A Customizing MicroStrategy Office MicroStrategy Office User Guide The changes you make apply only to the product you make the changes in, and are only displayed on your computer. For information about further customizing the MicroStrategy tab by editing the Ribbon XML in certain files, see Customizing MicroStrategy Office when running Microsoft Office 2007 or later, page 267. third-party products discussed below are manufactured by The vendors independent of MicroStrategy, and the information provided is subject to change. For detailed instructions to perform the following task, see your Microsoft Office documentation. To customize the MicroStrategy tab 1 Open the Microsoft product in which you want to customize the MicroStrategy tab. 2 Click the File tab and select Options. The Options dialog box opens. 3 On the left, select Customize Ribbon. 4 On the right, expand MicroStrategy. The names of the groups of buttons that appear on the MicroStrategy tab are displayed, as shown below. 258 Customizing the MicroStrategy Office menu, toolbar or tab © 2013 MicroStrategy, Inc. MicroStrategy Office User Guide A Customizing MicroStrategy Office 5 Customize the appearance of the MicroStrategy tab by doing one or more of the following: • To remove a group of buttons, select the name of the group that you want to remove and click Remove. • To move a group of buttons, select the name of the group that you want to move, and move them using the up and down arrows on the right. Groups of buttons at the top of the list appear on the left side of the tab. 6 Click OK. Replacing MicroStrategy Office icons, strings, and documentation MicroStrategy Office can be customized with your own graphics, text, and documentation. You can replace the splash screen image, the images used as buttons, prompt images, the text that is displayed in various captions, readme and release notes, and even the MicroStrategy Office User Guide. Customizations in MicroStrategy Office are made in files that are stored in specific locations to change different aspects of the MicroStrategy Office interface. These files are either image files, which are used to change the images that are displayed in MicroStrategy Office, an XML file that specifies changes to text strings and hyperlinks, or documentation files used to provide customized user documentation. All of these files can be stored in a customization folder in the MicroStrategy Office configuration folder. Alternatively, they can be stored in a customization folder on the Web Services server, which allows you to distribute customized strings through the enterprise. The location of the customization folder determines which users have the customizations applied to them. For more information, see Storing customizations, page 260. After the customization file has been created, you can change the images, strings, and documentation used in the MicroStrategy Office interface: • For steps to replace images, see Customizing images in MicroStrategy Office, page 261. © 2013 MicroStrategy, Inc. Replacing MicroStrategy Office icons, strings, and documentation 259 A Customizing MicroStrategy Office MicroStrategy Office User Guide • For steps to change text strings, see Customizing text strings in MicroStrategy Office, page 263. • For steps to replace the documentation, see Customizing documentation in MicroStrategy Office, page 267. If you are running Microsoft Office 2007 or later, you can perform various customizations using Ribbon XML. Depending on the version of Microsoft Office you are running, you can change icons, remove or reorder items, change tooltips, and so on. For information about the customizations available and the files to modify, see Customizing MicroStrategy Office when running Microsoft Office 2007 or later, page 267. Storing customizations Whether or not customizations are applied to all MicroStrategy Office users depends on where they are stored. This allows you to customize MicroStrategy Office for specific users, or to apply the changes across all users and across the enterprise. The appropriate customization file is located by the system in one of the following ways: • Deployed per client for a single user: This is the default method. Each user has a configuration folder that contains a customization file on their computer by default. When MicroStrategy Office loads configuration settings, it checks the customization folder and applies customizations to its interface. Since the customization is stored under the user’s profile folder, customizations stored in this location only apply to a particular user. For example, the default location of this folder for a Microsoft Windows 7 user is C:\Users\username\AppData\Roaming\ MicroStrategy\Office\Customization, where username is the user’s login to the computer. If there are multiple users on a single client machine, the customization must be deployed in each user’s profile folder. • Deployed for multiple users: To apply the customizations in a single customization file to multiple users, you should modify the MicroStrategy Office configuration file (C:\Users\username\AppData\Roaming\ MicroStrategy\Office\moimain.dll.config) in each user’s profile folder, and specify a shared customization folder. To do this, open the configuration file and add <add key="Customization Folder Path" value="customization_folder_path" enable="1" override="0" /> where customization_folder_path is the shared location of the customization folder. 260 Replacing MicroStrategy Office icons, strings, and documentation © 2013 MicroStrategy, Inc. MicroStrategy Office User Guide • Customizing MicroStrategy Office A Deployed for all users in an enterprise: To apply customizations to multiple users using your Web Services server to provide centralized distribution across the enterprise, see Customizing text strings in MicroStrategy Office, page 263. Customized settings are applied in the following order: they are first loaded from the client machine; they are then merged with any server settings based on any override settings. If customizations are stored in multiple locations on the client machine, the location that is specified in the MicroStrategy Office configuration file is the one that is used. Customizing images in MicroStrategy Office You can customize some images and icons that are used in the MicroStrategy Office interface. Customizing images in MicroStrategy Office consists of placing images with specific file names in the customization folder. For example, to change the main MicroStrategy Office toolbar button image in Microsoft Office 2003 or earlier, create the image that you would like to use for this button, name it office.bmp, and store it in the MicroStrategy customization folder. The new image is used in place of the original MicroStrategy Office button. Customizing button and menu images Button images and image masks are used for the images displayed in the Microsoft Office toolbar and menu. Icon files are used for the images displayed in the MicroStrategy Office interface. masks are optional, two-color 16x16 pixel bitmap files that Image define the transparent regions of the picture bitmap. Define all transparent pixels with white color and all pixels to display from the image bitmap with black color. To change any images that are used as buttons or menu icons, create a 16x16 pixel bitmap, and save it in the customization folder with a file name that depends on the button that you want the image to replace. © 2013 MicroStrategy, Inc. Replacing MicroStrategy Office icons, strings, and documentation 261 A Customizing MicroStrategy Office MicroStrategy Office User Guide The following table describes the buttons and icons and their related file names. Button or Icon File Name Main Office button office.bmp Main Office mask office_mask.bmp Main Office icon office.ico Refresh button refresh.bmp Refresh mask refresh_mask.bmp Refresh icon refresh.ico Reports button reports.bmp Reports mask reports_mask.bmp Reports icon reports.ico Options button options.bmp Options mask options_mask.bmp Options icon options.ico Customizing prompt images Prompt images and backgrounds can also be customized. For the prompt image, store the image as prompt.bmp, prompt.jpg, or prompt.gif in the customization folder. For the prompt background (the prompt image background is used to fill the prompt area when the prompt dialog box is resized), store the image as prompt_background.bmp, prompt_background.bmp, or prompt_background.gif in the customization folder. The optimal size for the prompt and prompt background images is 568 x 80 pixels. Other image sizes will be scaled to fit. Customizing splash screen images You can also change the main screen that is displayed when MicroStrategy Office opens (the splash image) by saving an image as splash.bmp, splash.jpg, or splash.gif in the customization folder. The optimal size for the splash image is 450 x 260 pixels. 262 Replacing MicroStrategy Office icons, strings, and documentation © 2013 MicroStrategy, Inc. MicroStrategy Office User Guide A Customizing MicroStrategy Office Customizing text strings in MicroStrategy Office You can customize over 1,600 strings in MicroStrategy Office. Common customizations include strings shown in the interface, as well as various messages that MicroStrategy Office displays. For example, you can change the word "Refresh" on the refresh button so that the button displays "Update" instead. Customized text strings are stored in a file you create, called settings.xml, that you store in the customization folder. The default customization folder (%APPDATA%\MicroStrategy\Office\ Customization) is created by MicroStrategy Office dynamically on first execution. The settings.xml file should match the following form: <?xml version="1.0"?> <customization> <office_button_caption value="custom text" /> <refresh_button_caption value="custom text" /> <reports_button_caption value="custom text" /> <splash_text value="" /> <options_button_caption value="custom text" /> <about_text value="custom text" /> <client_name value="custom text" /> <server_name value="custom text" /> <web_link_url value="custom text" /> <web_link_text value="custom text" /> <string_id value="custom string" /> <string_id2 value="custom string2" /> <string_idN value="custom stringN" /> </customization> Following is an example of the settings.xml file, where Project is replaced with Unit: <?xml version="1.0"?> <customization> <MOZ_CONNECT_DIALOG_CAPTION value="Select Unit" /> <MOZ_CONNECT_DIALOG_PROJECT_COLUMN_HEADER value="Units" /> © 2013 MicroStrategy, Inc. Replacing MicroStrategy Office icons, strings, and documentation 263 A Customizing MicroStrategy Office MicroStrategy Office User Guide <MOZ_CONNECT_DIALOG_GET_PROJECTS_BUTTON value="&Get Units" /> <MOZ_WAIT_LOADING_PROJECTS value="Retrieving units from server" /> <MOZ_WAIT_LOADING_PROJECTS value="Abrufen Einheiten vom Server {1}" locale="de" /> <MOZ_STATUS_PANEL_PROJECT value="Unit: {0}" /> </customization> To alter the text displayed for a string, type the desired string in between the quotation marks. If you want to use the MicroStrategy Office default string for any of the strings, do not include that XML node in the settings.xml file. Strings that can be changed are described in the following table: XML node Where the text is displayed in the interface office_button_caption Main MicroStrategy Office button. refresh_button_caption Refresh button. reports_button_caption Reports button. splash_text Main MicroStrategy Office screen when the application starts. options_button_caption Options button. about_text Dialog that is displayed when a user selects About from the MicroStrategy Office Help menu. client_name The name of the client application (replaces MicroStrategy Office). server_name The name of the server application (replaces MicroStrategy Web Services). web_link_url Target URL of the Web link in the Help menu. web_link_text Web link added to the MicroStrategy Office Help menu. string_ID The string ID from the MicroStrategy Office resource file. For a list of string IDs for MicroStrategy Office, see the MicroStrategy Knowledge Base. To add line breaks to any of the strings except the string_ID strings, type <nl> where you want the line breaks to occur. 264 Replacing MicroStrategy Office icons, strings, and documentation © 2013 MicroStrategy, Inc. MicroStrategy Office User Guide A Customizing MicroStrategy Office Implementing server-based customization across the enterprise You can apply customizations to multiple users using your Web Services server to provide centralized distribution across the enterprise. To do this, you store the settings.xml file in the Office sub-folder of the Web Services virtual directory, for example, C:\Program Files\ MicroStrategy\Web Services\Office. A sample settings.xml file is shown below: <?xml version="1.0"?> <customization> <MOZ_DEFAULT_VIEW_SHARED_REPORTS value="Global Reports" /> <MOZ_SHORTCUT_SHARED_REPORTS value="Global Reports" /> <MOZ_SHARED_REPORTS_FOLDER value="Global Reports" /> <MOZ_SEARCH_LOCATION_SHARED_REPORTS value="Global Reports" /> <MOZ_DEFAULT_VIEW_MY_REPORTS value="Jim’s Reports" /> <MOZ_SHORTCUT_MY_REPORTS value="Jim’s Reports" /> <MOZ_MY_REPORTS_FOLDER value="Jim’s Reports" /> <MOZ_SEARCH_LOCATION_MY_REPORTS value="Jim’s Reports" /> <MOZ_MAIN_DIALOG_VIEW_MENU_MY_REPORTS value="Jim’s Reports" /> <MOZ_MAIN_DIALOG_VIEW_MENU_SHARED_REPORTS value= "&Global Reports" /> </customization> In this example, the settings.xml file will replace the term Shared Reports with Global Reports, and My Reports with Jim’s Reports in the Office dialog boxes and menus. You can include an override attribute in the settings.xml file. This override attribute determines whether the server setting overrides the client setting if one exists. The default is for the server setting to override. If the override attribute is missing or set to 1, the server overrides the client. If the override attribute is set to 0, the server does not override the client. Sample syntax is below; the override setting of 0 means that the client setting will take precedence over the server setting: <MOZ_SEARCH_LOCATION_MY_REPORTS value="Jim’s Reports" override="0"/> © 2013 MicroStrategy, Inc. Replacing MicroStrategy Office icons, strings, and documentation 265 A Customizing MicroStrategy Office MicroStrategy Office User Guide Supporting multiple languages in custom strings You can display different strings for users based on their locales. For information about locales in MicroStrategy Office, see Using MicroStrategy Office in a multilingual environment, page 253. By adding locale=”language” where language is a locale attribute to any of the XML tags in your custom strings in the settings.xml file, you can configure certain strings to be displayed only for users with MicroStrategy Office interface locales that match the language that is specified. If no string with a locale attribute matching a user's MicroStrategy Office locale is specified, then the string with no locale attribute (the default string) is used. If there is no default string, then no customization is applied. The following locale attributes can be used: Locale Attribute German de English en Spanish es Italian it French fr Japanese ja Korean ko Portuguese pt Swedish sv Simplified Chinese zh-chs Traditional Chinese zh-cht For example, you have a settings.xml file that contains the following lines: <refresh_button_caption value="Update" /> <refresh_button_caption value="Actualización" locale= "es" /> 266 Replacing MicroStrategy Office icons, strings, and documentation © 2013 MicroStrategy, Inc. MicroStrategy Office User Guide A Customizing MicroStrategy Office If a user with a Spanish locale logs in to MicroStrategy Office, the refresh button will display “Actualización,” but if a user with an English locale logs in to MicroStrategy Office, the refresh button will display “Update.” Customizing documentation in MicroStrategy Office You can provide your own targeted, customized documentation with MicroStrategy Office that either replaces or enhances the existing documentation. For example, to supply a customized readme file with information about a particular environment, store the readme HTML file in the MicroStrategy Office customization folder. The following table describes documentation files that can be customized, and gives their related file names. Documentation File Name Online help help.chm Readme readme.htm Release notes relnotes.htm User Guide guide.pdf Customizing MicroStrategy Office when running Microsoft Office 2007 or later If you are using Microsoft Office 2007 or later, simple customizations can be made to tab buttons; see Changing buttons on the MicroStrategy tab, page 257. Additional customizations can be performed by moving and editing certain .xml files. Depending on the version of Microsoft Office you are running, you can use Ribbon XML to change icons, remove or reorder items, change tooltips, and so on. This allows a great degree of customization of MicroStrategy Office. If you are running Microsoft Office 2010 or later, you can also customize the Microsoft Office Backstage view and the context menus for MicroStrategy Office. © 2013 MicroStrategy, Inc. Replacing MicroStrategy Office icons, strings, and documentation 267 A Customizing MicroStrategy Office MicroStrategy Office User Guide The high-level steps explain how to customize various aspects of MicroStrategy Office when running Microsoft Office 2007 or later. To customize MicroStrategy Office for use with Microsoft Office 2007 or later 1 Browse to your MicroStrategy Office installation folder. The default location is C:\Program Files\MicroStrategy\Office. 2 Depending on the aspects of MicroStrategy Office you want to modify, and the version of Microsoft Office you are running, do one or more of the following: • To modify the MicroStrategy tab in Microsoft Office 2007, copy RibbonUI_2007.xml. • To modify the MicroStrategy tab and/or Microsoft Office Backstage view in MicroStrategy Office 2010, copy RibbonUI_2010.xml. • To modify the context menus in Microsoft Office 2010, copy ContextMenu_2010.xml. 3 Move the files to the MicroStrategy Office customization folder. The default location for this folder is C:\Users\username\AppData\ Roaming\MicroStrategy\Office\Customization, where username is the user’s login to the computer. the files in this location makes the customizations Storing available on the computer in which they are stored. For information about making customizations available to multiple users, see Storing customizations, page 260. 4 Modify the files using Ribbon XML, as described in your Microsoft Office documentation. 5 To change a Ribbon icon, store a new icon file in the Customizations folder. The custom icon must be an.ico file. 268 Replacing MicroStrategy Office icons, strings, and documentation © 2013 MicroStrategy, Inc. B SERVER-BASED CONFIGURATION B. Introduction This appendix explains how server-based configuration allows an administrator to easily control MicroStrategy Office settings on multiple users’ computers. It shows you how to create a central configuration file, how to modify the settings within the file, and how to deploy it to MicroStrategy Web Services to distribute it to all MicroStrategy Office users. Each MicroStrategy Office client stores MicroStrategy Office option settings in a local configuration file. These options can also be stored in a centralized configuration file, which is distributed using MicroStrategy Web Services. Options from the server-based configuration file may be merged with the client settings, or they can override the client settings. The configuration file that is distributed using Web Services defines which options are enabled in the MicroStrategy Office interface, and defines which options may be modified by the users. © 2013 MicroStrategy, Inc. 269 B Server-based Configuration MicroStrategy Office User Guide Using server-based configuration in MicroStrategy Office Server-based configuration allows an administrator to control how certain settings are applied to certain MicroStrategy Office users. It creates a central configuration file that is distributed to the client computers using MicroStrategy Web Services, and is merged with users’ personal MicroStrategy Office settings. The following high-level steps show how server-based configuration is implemented. High-level steps to use server-based configuration 1 Export the existing MicroStrategy Office settings to an XML file. For steps, see Exporting existing settings, page 270. 2 Modify the XML file to specify which settings you want to apply to which users, which settings will override user settings, which settings will replace user settings, and which settings users will be allowed to modify. For details, see Modifying the configuration file, page 271. 3 Import the modified XML file into the Web Services server. For steps, see Importing the configuration file, page 274. Exporting existing settings The first step in using server-based configuration to control the MicroStrategy Office settings for multiple users is to export the existing MicroStrategy Office settings to a file. This file serves as the framework for specifying what settings you want to apply to different MicroStrategy Office users. To export existing settings to a configuration file 1 In your Microsoft product, on the MicroStrategy tab, click Options. The Options dialog box opens. 270 Using server-based configuration in MicroStrategy Office © 2013 MicroStrategy, Inc. MicroStrategy Office User Guide B Server-based Configuration 2 Modify existing MicroStrategy Office settings to match your requirements. Details for each setting are described in earlier sections of this guide. 3 In the bottom left corner of the Options dialog box, click Export. The Export MicroStrategy Office Configuration Options dialog box opens. 4 From the Save as type drop-down list, select Configuration Files. 5 Name the file moimain.dll.config. 6 Save the file to a location where you can edit it. Modifying the configuration file After you have exported the configuration file, you can make changes to its XML definition to control which settings should be applied to which MicroStrategy Office users. By default, all settings in the configuration file are applied to all users, and all settings are contained within a single <appSettings> node. Each setting is defined within the <add> node. Steps are below to define specific settings for specific users. To define different settings for different users 1 Specify separate user groups. To do this, create a separate <restrictions> node that contains a collection of settings. 2 Assign which settings should apply to which user group by adding the id of the desired restrictions node to the appropriate <appSettings> node. Details and variations, with an example, are described below. The configuration file is processed from top to bottom. The first matching setting overrides any subsequent section. This allows for an unrestricted default set of configuration settings to be applied when no more restrictive settings are found. Any time the attribute override=”1” appears in an <add> node in the configuration file, the setting that it is associated with overrides the user’s local settings. Overriding local settings based on the restrictions that you define is how server-based configuration allows you to control the settings © 2013 MicroStrategy, Inc. Using server-based configuration in MicroStrategy Office 271 B Server-based Configuration MicroStrategy Office User Guide for all users that connect to MicroStrategy Office, while maintaining only a single configuration file. The following are extensions to the Microsoft .NET app.config XML file schema: • <restrictions> sub-node of the <configuration> node • <ip>, <host>, <machine>, <user>, <restrictions> sub-nodes of the <restrictions> node • enable and override attributes of the <add> node • Restriction ID attribute added to the <appSettings> node The following restrictions can be used in the configuration file: XML node Description ip IP address of the client computer host Host name of the client computer machine Computer name of the client user Windows login ID of the connected user restriction Another restriction node may contain Microsoft .NET Framework regular Restrictions expressions to match multiple items. If multiple restrictions are defined in a <restrictions> node, then a user must match at least one of each type to have the settings applied to them. Consider the following example: <?xml version="1.0"?> <configuration> <restrictions id="Office" > <ip>111\.11\.[0-9]{1,3}\.[0-9]{1,3}</ip> <ip>11\.11\.[0-9]{1,3}\.[0-9]{1,3}</ip> <host>.*\.(users|admin)\.domain\.com</hostx> <user>users\steve</user> <restriction>hannah</restriction> <restriction>phoebe</restriction> </restrictions> <restrictions id="randy" > <user>users\randy</user> <machine>windows-randy</machine> 272 Using server-based configuration in MicroStrategy Office © 2013 MicroStrategy, Inc. MicroStrategy Office User Guide Server-based Configuration B </restrictions> <restrictions id="hannah" > <user>users\hannah</user> </restrictions> <restrictions id="phoebe" > <user>users\phoebe</user> </restrictions> <appSettings id="Office" > <add key="Web Prompt Style" value="1" enable="0" override="1" /> <add key=”List Required Prompts First” value=”1” enable=”0” override=”1” /> <add key=”Search Objects Limit” value=”50” enable=”0” override=”1” /> </appSettings> <appSettings> <add key=”Web Prompt Style” value=”0” enable=”1” override=”1” /> <add key=”List Required Prompts First” value=”0” enable=”1” override=”1” /> <add key=”Search Objects Limit” value=”100” enable=”0” override=”1” /> <add key=”CSV AutoFormat” value=”2” enable=”0”/> <add key=”Show Hidden Objects” value=”0” enable=”1”/> <add key=”Show Smart Tags Menus” value=”1” enable=”1”/ <add key=”Show Folder Tree” value=”0” enable=”1” override=”0”/> </appSettings> </configuration> In the above example, any computer with an IP address that starts with 111.11 or 11.11 that has a host name in the users.domain.com or admin.website.com domain, and where the authenticated NT user is users\steve, users\hannah, or users\phoebe, matches the Office restrictions. Therefore, that client would have its MicroStrategy Office prompt style set to Web style, would show required prompts first, and would have its maximum number of items returned from a search limited to 50. Any client computer and user that matches the Office restrictions will not be able to change their prompt style or search result limit since the enable= ”0” attribute is defined for those settings. © 2013 MicroStrategy, Inc. Using server-based configuration in MicroStrategy Office 273 B Server-based Configuration MicroStrategy Office User Guide Other computers that do not match the Office restrictions will use the Office prompt style, show prompts in a user-defined order, and be allowed to have up to 100 items returned from a search. No user will be able to modify the setting for CSV AutoFormat, since the enable attribute is set to “0”. To hide the Options menu and prevent users from modifying any settings in MicroStrategy Office, add the following node under the <appsettings> node: <add key=”Show Options” value=”0” enable=”1” override= ”1”/> Importing the configuration file After you have created the configuration file and specified the settings that you want to control based on the restrictions you have defined, you can import the file into MicroStrategy Web Services. Every time a user logs in to MicroStrategy Office, the login process connects them to MicroStrategy Web Services. By importing the configuration file to Web Services, you ensure that all users access the same configuration file. The steps below show you how to import a configuration file. Prerequisites • To import a configuration file into Web Services, you must first export a configuration file. For steps, see Exporting existing settings, page 270. To import the configuration file 1 In your Microsoft product, on the MicroStrategy tab, click Options. The Options dialog box opens. 2 At the bottom left, click Import. The Import Configuration Options dialog box opens. 274 Using server-based configuration in MicroStrategy Office © 2013 MicroStrategy, Inc. MicroStrategy Office User Guide Server-based Configuration B 3 Browse to the configuration file and click Open. The configuration file is imported. 4 Restart MicroStrategy Office to apply the imported options. © 2013 MicroStrategy, Inc. Using server-based configuration in MicroStrategy Office 275 B Server-based Configuration 276 Using server-based configuration in MicroStrategy Office MicroStrategy Office User Guide © 2013 MicroStrategy, Inc. C SECURITY AND SCALABILITY FOR MICROSTRATEGY WEB SERVICES C. Introduction To support MicroStrategy Office, MicroStrategy Web Services must be installed as part of your master MicroStrategy installation. For more information on installing MicroStrategy Web Services, see Installing and deploying MicroStrategy Web Services, page 205. MicroStrategy Web Services (MWS) supports advanced features for security and scalability, such as encrypting communications with MicroStrategy Office using Secure Socket Layer (SSL). For better performance and stability, you can also set up Web Services in web farms, which are multiple web servers running MWS, but configured to appear as a single web service and provide fault tolerance capabilities. Setting up SSL for encryption MicroStrategy Web Services (MWS) can be configured to use Secure Socket Layer (SSL) connection to create an encrypted channel between Office and Web Services. This ensures private communications between the two. © 2013 MicroStrategy, Inc. Setting up SSL for encryption 277 C Security and Scalability for MicroStrategy Web Services MicroStrategy Office User Guide For information on setting up SSL between Web Services and Office, refer to the MicroStrategy System Administration Guide. Setting up Web Services on a web farm A web farm consists of several web server computers configured together to act as a single server with a single IP address. MWS can be configured to run in a web farm to provide better performance, scalability, and reliability. This section outlines the steps to set up a web farm using the Windows Server 2003 Network Load Balancing Service. Other software and hardware load balancers or switches can also be used to set up a web farm. Each web server in the cluster must be configured to be fully operational. For MWS, this means it is fully installed and configured, including having all required project sources in its projectsources.xml file. Windows XP, 2003, and 2008 servers can be balanced in the same “cluster”. The following steps use the Windows 2003 Network Load Balancing Manager to set up the cluster. Make sure you have administrative access to each of the servers that will be added to the cluster. The following list summarizes the work involved in setting up a web farm: • Install and configure MWS on each web server that will be network load-balanced. • Configure the cluster and each server for network load balancing. Installing and configuring MicroStrategy Web Services Perform the following steps to install and configure MicroStrategy Web Services on the cluster servers. To install and configure MWS 1 For each computer that will be part of the set of load balanced servers, install MicroStrategy Web Services (see Installing and deploying MicroStrategy Web Services, page 205). 2 Ensure that all computers have the same project sources in the corresponding projectsources.xml. For instructions on adding or 278 Setting up Web Services on a web farm © 2013 MicroStrategy, Inc. MicroStrategy Office User Guide C Security and Scalability for MicroStrategy Web Services editing project sources, see Adding or modifying project sources for MicroStrategy Web Services and MicroStrategy Office, page 232. Configuring the cluster and servers for network load balancing Perform the following steps to configure the cluster and each server for network load balancing (NLB). can only use the Windows 2003/2008 NLB Manager to configure You all hosts if they are all on Windows 2003 and 2008. Otherwise, you must use the local manager on each Windows XP computer. Be aware of the following: • A production installation requires more considerations during cluster configuration than this procedure presents. These considerations include security and performance issues. See your Microsoft documentation for a full evaluation and analysis of the applicable issues. • If you decide to combine a web farm with SSL, additional concerns exist and are reviewed in the Microsoft documentation. To configure the cluster and servers for load balancing 1 From the Windows Start menu, select Settings, select Control Panel, and open Administrative Tools. Open the Network Load Balancing tool. 2 To create a new cluster, right-click Network Load Balancing Clusters and select New Cluster. The Cluster Parameters dialog box opens. 3 In the Cluster IP Configuration panel, enter an IP address, Subnet mask, and full Internet name. • Leave the IGMP Multicast option disabled. However, if the cluster does not operate, you may need to return to this screen and enable this option. Consult the Network Load Balancing Service documentation for more advanced setup details. • Leave the Allow Remote Control option disabled. Click Next. The Cluster IP Addresses dialog box opens. © 2013 MicroStrategy, Inc. Setting up Web Services on a web farm 279 C Security and Scalability for MicroStrategy Web Services MicroStrategy Office User Guide 4 Click Next. The Port Rules dialog box opens. 5 The default port rule is too broad for production, but works for evaluation purposes. Consult your Microsoft documentation for various scenarios for port rules. Note the following: – Two key ports are port 80 for standard HTTP traffic, and port 443 for SSL traffic. – For SSL, there are numerous issues to insure proper operation of NLB and SSL together. Consult your Microsoft documentation for information on resolving these issues. 6 Click Next. The Connect dialog box opens. entering host information, ensure that all servers in the Before cluster have fixed IP addresses. 7 Enter a hostname or an IP address in the Host box and click Connect. The Interfaces Available list automatically populates with interface information. 8 Select an interface to be included in the cluster and click Next. The Host Parameters dialog box opens. 9 The Host Priority box displays a unique ID that identifies each node in the cluster and represents the priority given to each node. The lower the ID, the higher the priority. Node 1 is the master node and will receive requests and act as a routing manager in most cases. When the work load is too high, other servers perform this function. Set the priority, and click Finish to complete host definition and close all dialogs. 10 The manager configures the first host and logs results in the bottom pane. The final message should be “End Configuration Change”. 11 To add an additional host, right-click the cluster you just added and click Add Host to Cluster. The Connect dialog box opens. Repeat the appropriate steps above for the additional host. 12 Reconfigure MicroStrategy Office to use the cluster’s virtual IP address. 280 Setting up Web Services on a web farm © 2013 MicroStrategy, Inc. D TROUBLESHOOTING MICROSTRATEGY OFFICE D. Introduction This appendix provides steps to log diagnostics information for MicroStrategy Office and MicroStrategy Web Services. This appendix also provides details on how to troubleshoot common issues, and information on where to find additional troubleshooting resources. Enabling logging and running diagnostics You can configure MicroStrategy Office to log a variety of diagnostic information, including the following: • Web Services errors • Report results • Prompt results © 2013 MicroStrategy, Inc. Enabling logging and running diagnostics 281 D Troubleshooting MicroStrategy Office MicroStrategy Office User Guide To enable logging in MicroStrategy Office 1 On the MicroStrategy tab, click Options. The Options dialog box opens. 2 Under the General folder, expand the Diagnostics folder. 3 Select which logs to enable and locations in which to save them: • Full Web Services errors: MicroStrategy Web Services error details are displayed, including inner, outer, and SOAP error detail. Cleared by default. • Save results: MicroStrategy report XML, document HTML, or report CSV are saved in the specified directory after report execution. Prompt XML, prompt answer XML, and chart images are also saved. Click Delete to delete all saved files. Cleared by default. • Enable logging: Diagnostic log messages are written to a file in the specified directory. Click Delete to delete all saved files. Cleared by default. • Log to screen: Each message written to the log file is also displayed on the screen as a message. Cleared by default. 4 Click OK. To view the MicroStrategy Office log 1 On the MicroStrategy tab, click Options. The Options dialog box opens. 2 Under the General folder, expand the Diagnostics folder. 3 Click View. The Choose MicroStrategy Office Result Files page opens. 4 Navigate to the log file, select it, and click Open. The log file is displayed with the following information: • Event: The type of logged event. • Time: Date and time the event was logged to the file. • Component: MicroStrategy Office component that logged the message. • Method: Method in MicroStrategy Office where the event occurred. 282 Enabling logging and running diagnostics © 2013 MicroStrategy, Inc. MicroStrategy Office User Guide Troubleshooting MicroStrategy Office • ID: Unique identifier for a report execution instance. • Text: The diagnostic message. D 5 To filter the log view for a particular report execution instance ID, select a log entry that contains that ID and press CTRL+F5. To refresh the log view or remove the instance ID filter, press SHIFT+F5. 6 Click OK. MicroStrategy Office issues The following MicroStrategy Office issues are described with potential solutions. If you encounter issues with MicroStrategy Office that are not discussed below or elsewhere in this guide, refer to the MicroStrategy Knowledge Base. MicroStrategy Office toolbar is not appearing in Microsoft Excel, PowerPoint, or Word There are several items to check if the MicroStrategy Office toolbar does not appear in Microsoft Excel, Word, or PowerPoint. Verify that MicroStrategy Office has been enabled for your Microsoft product The MicroStrategy Office toolbar must be enabled for your specific Microsoft Office product. Follow the steps below to ensure that the toolbar is enabled in your Microsoft product(s). To verify that MicroStrategy Office has been enabled 1 From the Windows Start menu, point to Programs, then MicroStrategy Tools, then select Office Configuration. The Options dialog box opens. © 2013 MicroStrategy, Inc. MicroStrategy Office issues 283 D Troubleshooting MicroStrategy Office MicroStrategy Office User Guide 2 Under the General folder, in the Load area, select the check boxes next to the Microsoft Office applications in which you want to load the MicroStrategy Office toolbar. 3 Click OK. 4 Open the Microsoft Office product to see whether the MicroStrategy Office toolbar is displayed. Verify that MicroStrategy Office has not been disabled by Microsoft Office Microsoft Office may have disabled the MicroStrategy Office toolbar. To ensure that the toolbar is not disabled by Microsoft, follow the steps below. To verify that MicroStrategy Office has not been disabled by Microsoft Office 1 Open the Microsoft Office product in which the MicroStrategy Office toolbar is missing. 2 From the File tab, select Add-ins. 3 From the Manage drop-down list, select Disabled Items. 4 If MicroStrategy Office is on the list of disabled items, select it and then select Enable. 5 Click Go. 6 Close and then reopen the Microsoft Office product to see if the MicroStrategy Office toolbar is displayed. Verify that the Microsoft product’s security is set to trust installed add-ins The macro security settings within your Microsoft Office product may be preventing the MicroStrategy Office toolbar from being displayed. To adjust your macro security settings to accept the MicroStrategy Office toolbar, perform the following steps. 284 MicroStrategy Office issues © 2013 MicroStrategy, Inc. MicroStrategy Office User Guide Troubleshooting MicroStrategy Office D To verify that Microsoft security is set to trust installed add-ins 1 Open the Microsoft Office product in which the MicroStrategy Office toolbar is missing. 2 From the Tools menu, select Macros and then Security. 3 Select the Trusted Sources tab. 4 Select the Trust all installed add-in and templates check box. 5 Click OK. 6 Close and re-open the Microsoft Office product to see if the MicroStrategy Office toolbar is displayed. Smart Tags are not displayed or are working incorrectly If Smart Tags that you assign to MicroStrategy reports and projects are not displayed in your Microsoft product, confirm that you have fulfilled all of the prerequisites listed in Using Microsoft Smart Tags as links to projects and reports, page 191. MicroStrategy dashboards are not displayed in Microsoft When opening a Microsoft product, you may notice that one or more MicroStrategy dashboards are not displayed. This issue occurs if you do not have MicroStrategy Office installed on your computer. You must have MicroStrategy Office installed to view your dashboard documents. To view Flash-enabled documents, you must also have Adobe Flash Player installed. For steps, see Confirming installation or installing MicroStrategy Office, page 6. Prompt dialogs are not displaying correctly If your prompt dialogs in Excel are incorrectly displayed in US English and you have the Microsoft Office Multi-lingual User Interface (MUI) pack © 2013 MicroStrategy, Inc. MicroStrategy Office issues 285 D Troubleshooting MicroStrategy Office MicroStrategy Office User Guide installed, click Options in the MicroStrategy tab. In the Excel format language area, select Office multi-lingual user interface pack is installed. MicroStrategy Office supports internationalization without MUI, but in some locales, MicroStrategy Office requires MUI to be installed to display prompt dialogs correctly. 286 MicroStrategy Office issues © 2013 MicroStrategy, Inc. GLOSSARY attribute A data level defined by the system architect and associated with one or more columns in a data warehouse lookup table. Attributes include data classifications like Region, Order, Customer, Age, Item, City, and Year. They provide a means for aggregating and filtering at a given level. attribute element A value of any of the attribute forms of an attribute. For example, New York and Dallas are elements of the attribute City; January, February, and March are elements of the attribute Month. attribute form One of several columns associated with an attribute that are different aspects of the same thing. ID, Name, Last Name, Long Description, and Abbreviation could be forms of the attribute Customer. Every attribute supports its own collection of forms. block A logical display element used to control the display of large reports in the limited page and slide dimensions of Microsoft Word and PowerPoint. A block may consist of multiple fetches. Blocks are defined by Microsoft Office product-specific configuration settings. custom group An object that can be placed on a template and is made up of an ordered collection of elements called custom group elements. Each element contains its own set of filtering qualifications. © 2013 MicroStrategy, Inc. Glossary: attribute 287 Glossary MicroStrategy Office User Guide dimensionality See level. fact 1) A measurement value, often numeric and typically aggregatable, stored in a data warehouse. 2) A schema object representing a column in a data warehouse table and containing basic or aggregated numbers—usually prices, or sales in dollars, or inventory quantities in counts. See also metric. fetch The amount of report data retrieved from one call to MicroStrategy Web Services. Fetches are used to control the amount of network traffic between MicroStrategy Office and MicroStrategy Web Services and the amount of memory used by MicroStrategy Intelligence Server. When you execute a report or document into a Microsoft product, the Execution Status dialog box displays the progress of each fetch. Fetch size is controlled by Microsoft Office product-specific configuration settings. Maximum fetch size is governed by an Intelligence Server setting in MicroStrategy Developer. filter A MicroStrategy object that specifies the conditions that the data must meet to be included in the report results. Using a filter on a report narrows the data to consider only the information that is relevant to answer your business question, since a report queries the database against all the data stored in the data warehouse. A filter is composed of at least one qualification, which is the actual condition that must be met for the data to be included on a report. Multiple qualifications in a single filter are combined using logical operators. Examples include “Region = Northeast” or “Revenue > $1 million”. A filter is normally implemented in the SQL WHERE clause. Flash-enabled A Report Services document in which Flash Mode is selected document as an available display mode in the Document Properties dialog box. 288 Glossary: dimensionality © 2013 MicroStrategy, Inc. MicroStrategy Office User Guide Glossary flattened A report display type in which the results of a report are displayed with all attributes and metrics flattened side-by-side on one axis. Also, any subtotals within the report are not displayed. It is convenient to execute your report or HTML document in this display type if you intend to use Excel’s drop-down lists to filter, hide/show data, and more. hierarchy A set of attributes defining a meaningful path for element browsing or drilling. The order of the attributes is typically—though not always—defined such that a higher attribute has a one-to-many relationship with its child attributes. Intelligent Cube A copy of the report data saved in memory and used for manipulation of the view definition. This division allows multiple reports with different views to share a common data definition. level 1) In a data warehouse, facts are said to be stored at a particular level defined by the attribute IDs present in the fact table. For example, if a fact table has a Date column, an Item_ID column, and a fact column, that fact is stored at the Date/Item level. 2) With regard to metric calculation, the level is the level of calculation for the metric. For example, a metric on a report with Year and Store attributes would be calculated at the Year/Store level. manual fetch A type of incremental report result fetching in which you are asked to confirm each fetch. For example, when you execute a report, you are prompted to confirm that each fetch, or section of report results, is displayed. metric 1) A business calculation defined by an expression built with functions, facts, attributes, or other metrics. For example: Sum(dollar_sales) or [Sales] - [Cost]. 2) The MicroStrategy object that contains the metric definition. It represents a business measure or key performance indicator. © 2013 MicroStrategy, Inc. Glossary: flattened 289 Glossary MicroStrategy Office User Guide See also fact. page An amount of data that is analogous to a page in a page-by report. Each page of a page-by report represents one combination of elements from each attribute on the page-by axis. For example, one page may contain data related to 2006 as well as the Southeast region. A report with no attributes on the page-by axis is considered to have one page. When you execute a report or document into a Microsoft product, the Execution Status dialog box displays the progress of each page. page-by Segmenting data in a grid report by placing available attributes, consolidations, and metrics on a third axis called the Page axis. Since a grid is two-dimensional, only a slice of the cube can be seen at any one time. The slice is characterized by the choice of elements on the Page axis. By varying the selection of elements, the user can page through the cube. persistence A default behavior in MicroStrategy Office ensuring that every report and document you run in an Excel workbook, PowerPoint presentation, or Word document retains a link to MicroStrategy Intelligence Server. This ensures that you and other users can refresh the reports and documents to retrieve the latest data from the data warehouse or other data sources. Every report or document executed also contains properties that are persisted; these properties determine how the report or document is displayed and can be modified by users once it is refreshed. preview fetch A type of incremental report result fetching in which you can see a preview of the report data as it runs. You specify how many rows of the report you want to preview at a time, and fetching automatically stops after one fetch. prompt 1) MicroStrategy object in the report definition that is incomplete by design. The user is asked during the resolution phase of report execution to provide an answer that completes the information. A typical example with a filter is choosing a specific attribute on which to qualify. 290 Glossary: page © 2013 MicroStrategy, Inc. MicroStrategy Office User Guide Glossary 2) In general, a dialog box requesting user input, as in “type login ID and password at the prompt.” qualification The actual condition that must be met for data to be included on a report. Examples include “Region = Northeast” or “Revenue > $1 million”. Qualifications are used in filters and custom groups. You can create multiple qualifications for a single filter or custom group, and then set how to combine the qualifications using the logical operators AND, AND NOT, OR, and OR NOT. Quick Grid A report display type in MicroStrategy Office in which the report is run as a CSV and bulk-loaded into Excel in one fetch. Although this results in a fast report execution time, formatting from the report definition, such as fonts, colors, and thresholds is not applied. You can apply formatting to Quick Grids using Microsoft Excel’s AutoFormats. report The central focus of any decision support investigation, a report allows users to query for data, analyze that data, and then present it in a visually pleasing manner. smart fetch A type of report result fetching in which fetching continues until completion or you cancel the operation. This is the default fetch method used in MicroStrategy Office. smart tag alias A smart tag name that you can specify for a report or project. When Microsoft Office recognizes this name, the MicroStrategy Office Smart Tag actions menu is displayed. This means that when the name you specify is typed, it becomes a smart tag that provides several options to execute the report. © 2013 MicroStrategy, Inc. Glossary: qualification 291 Glossary 292 Glossary: smart tag alias MicroStrategy Office User Guide © 2013 MicroStrategy, Inc. INDEX A B accessing MicroStrategy Office from a Microsoft product 11 MicroStrategy Office menu 12 MicroStrategy Office toolbar 12 admin role, assigning to a user Oracle 10g - Web Services 229 WebSphere - Web Services 221 analyzing data using Excel auto-filtering 121 data using PivotTables and PivotTables 117 attribute forms in a report 56, 88 authentication logging in to a MicroStrategy project 240 auto-filtering in a workbook 121 AutoFit Columns 54 AutoFit Rows 54 automatic deployment Web Services J2EE 211 automatic refreshing of a report 181 border adding around a report 54 browsing documents 15 projects 15 reports 15 business case, example of working with MicroStrategy Office 4 © 2013 MicroStrategy, Inc. C chart report display 65 clearing data from a report 178 cluster configuring 279 Web Farms and 278 communications privacy 277 configuring a cluster 279 D dashboard documents, troubleshooting 285 dashboard, creating in a workbook 109 data security 241, 242 293 Index data source, retrieving latest data from 38 data warehouse, retrieving latest data from 38 deleting document 45 report 45 deploying MicroStrategy Web Services J2EE automatically 211 automatically deploying with WebLogic 211 manually deploying with WebLogic 211 Oracle 10g 228 WebLogic and Apache 211 WebSphere 217, 226 WebSphere and IBM HTTP Server 216 details including for a report 86 Developer prompt style 79 diagnostics, running in MicroStrategy Office 281 disconnecting from a project 18 from a project source 18 display type assigning default 64 modifying for reports and documents 27, 63 document adding to a presentation 127 adding to a Word document 148 adding to a workbook 97 answering a prompt in 28 browsing 20 controlling access to data in 182 controlling execution of 72 deleting 45 determining placement of 59 294 MicroStrategy Office User Guide determining size of 59 display type example 64 executing 26, 27 executing prompted 28 fetch progress 27 Flash Player version for Flash-enabled 101, 129, 150 including details of 86 location in presentation 59 modifying display type of 27, 63, 64 moving in a workbook 84 refreshing 37 refreshing all at once 39 refreshing specific 39 searching for 23 sending Flash-enabled document to other users 185 sharing a prompt answer in 29 third-party data file and Flash-enabled 188 E embedded Excel workbook, adding a report as 71 enabling MicroStrategy Office toolbar 13 errors tracking for MicroStrategy Web Services 281 tracking for prompt results 281 tracking for report results 281 example of working with MicroStrategy Office 4 report display type 64 Excel using MicroStrategy Office in 95 Excel Reports folder, purpose of 20 Excel workbook. See workbook. executing © 2013 MicroStrategy, Inc. MicroStrategy Office User Guide document 26 prompted reports and documents 28 report 26 reports and documents 27 viewing progress of reports and documents 27 exporting a report in MicroStrategy Web 201 F fetching data 72 Flash .SWF and data files 186 Flash Player, required version 101, 129, 150 Flash-enabled document adding to a workbook 101, 128, 150 required Flash Player version 101, 129, 150 sending to other users 185 using a third-party data file 188 Flash-enabled documents troubleshooting 285 folder browsing 20 searching for 23 folder tree, viewing 15 formatting individual report properties 184 report in a presentation 145 report in a workbook 115 G graphic, positioning a report around 85 Grid and Chart report display 66 Grid report display 65 modifying options for 65 © 2013 MicroStrategy, Inc. Index H hidden reports and documents 16 History List, purpose of 20 HTML document adding to a presentation 127 adding to a Word document 148 I installation 205 Web Services, advanced 278 Web Services, basic 205 installing MicroStrategy Office 6 MicroStrategy Web Services 6 international support xxviii L launching WebSphere Administrative Console MicroStrategy Web Services 217 layout, modifying for MicroStrategy Office 21 live chart, inserting a graph report as 183 location of reports and documents in presentations 59 locking persistence 185 log creating 281 viewing 282 logging in to a project 13 to multiple projects 18 M manual deployment Web Services J2EE 211 295 Index menu, MicroStrategy Office 12 Microsoft IIS 208 supporting IIS 7 or 7.5 207 MicroStrategy Office accessing from Microsoft products 11 browsing a project in 15 business case 4 configuring report execution 25 confirming installation of 6 connection with MicroStrategy Intelligence Server 4 connection with MicroStrategy Web Services 4 default display type 64 deleting reports and documents 45 disconnecting from a project 18 example 4 executing page-by report 73 executing reports and documents 26, 27 folder tree 15 hidden reports and documents 16 installing 6, 7 installing from MicroStrategy CD-ROM 8 installing from MicroStrategy Web 10 installing from network location 8 logging in to a project 13 modifying layout of 21 preferences 25 product overview 2 refreshing 37 report display types 27, 63 sample workflow 4 searching for an object in 23 tasks performed with 4 toolbar not displayed in 283 troubleshooting Smart Tag issues 285 upgrading through Web Services 6 296 MicroStrategy Office User Guide using in Excel 95 using in PowerPoint 125 using in Word 147 MicroStrategy Office API 113 MicroStrategy Office menu, accessing from a Microsoft product 12 MicroStrategy Office toolbar accessing from a Microsoft product 12 enabling 13 MicroStrategy report formatting applying to a report 54 clearing and modifying 110 modifying 54 MicroStrategy Web exporting a report from 201 MicroStrategy Web Services installing 6 overview 4 supporting on IIS 7 or 7.5 207 tracking errors for 281 MicroStrategy Web Services home page accessing (Oracle) 230 accessing (Tomcat) 224 MicroStrategy Web Services J2EE manual deployment 211 modifying data in reports and documents 182 graph options 183 Grid report display options 65 Quick Grid options 70 moving report in a workbook 84 My Reports folder, purpose of 20 N network load balancing 279 Network Load Balancing Manager 278 © 2013 MicroStrategy, Inc. MicroStrategy Office User Guide O Oracle 10g deploying MicroStrategy Web Services J2EE 228 deploying Web Services with the Oracle Enterprise Manager 228 outline mode, enabling in a report 56 outline report display 66 P page-by clearing a report with objects in 78 determining location of data 73 executing a report with objects in 73 placeholder 78 password, logging in without 249 performance Web Farms and 278 persistence 38 locking 185 properties in a report 184 PivotChart analyzing data in a workbook using 117 report display 69 PivotTable analyzing data in a workbook using 117 modifying report display options for 69 report display 67 placement accessing options for 59 of reports and documents 59 positioning a report around a graphic 85 PowerPoint using MicroStrategy Office in 125 PowerPoint presentation. See presenta© 2013 MicroStrategy, Inc. Index tion. PowerPoint Reports folder, purpose of 20 preconfiguration information WebLogic (Web Services) 210 WebSphere (Web Services) 216 presentation adding a document to adding a report to creating for a non-MicroStrategy Office user 126 creating prompted 139 formatting a report in 145 refreshing 144 resizing a report in 145 saving 143 securing data in 144 static 126 privacy of communications 277 project disconnecting from 18 linking to a Smart Tag 191 logging in to 13 project source Web Farms and 278 projectsources.xml 247 prompt answering in reports and documents 28 choosing the style of 79 reusing an answer 29 sharing an answer 29 style 79 using in a presentation 139 properties persisted in a report 184 Q Quick Grid report display 297 Index modifying options for 70 R ranking data in a workbook 121 re-deploying Web Services with WebLogic 215 refreshing all reports and documents 39 automatically 181 controlling in a report 179 disabling 180 document 37 presentation 144 report 37 report exported from MicroStrategy Web 201 specific reports and documents 39 specific reports and documents in Excel 116 Word document 163 workbook 115 report adding a calculation 123 adding to a presentation 127 adding to a Word document 148 adding to a workbook 97 answering a prompt in 28 browsing 20 controlling access to data in 182 controlling execution of 72 controlling refresh ability in 179 deleting 45 determining placement of 59 determining size of 59 display type example 64 enabling outline mode 56 executing 26, 27 executing prompted 28 298 MicroStrategy Office User Guide fetch progress 27 fetching 72 including details of 86 linking to a Smart Tag 191 linking to a Smart Tag in Excel 99 location of in presentation 59 modifying display type of 27, 63, 64 modifying how users log in to 248 moving in a workbook 84 positioning in a workbook 85 refreshing 37 refreshing all at once 39 refreshing specific 39 searching for 23 sharing a prompt answer in 29 showing attribute forms in 56 showing header description 88 report display type assigning default 64 modifying 27, 63 Report Properties modifying for a report 184 Report Services document. See document. reprompting, disabling 180 resizing report in a presentation 145 report in a workbook 115 S saving presentation 143 Word document 163 workbook 113 scalability and Web Farms 278 scorecard, creating in a workbook 109 searching advanced 24 © 2013 MicroStrategy, Inc. MicroStrategy Office User Guide for folders, reports, and documents 23 securing data by clearing it 178 data to distribute to others 176 security applied when designing with MicroStrategy Office 241 applied when receiving a report-filled file 242, 243 example 240 filter 241, 242 in a Word document 163 in a workbook 114 overview 240 presentation and 144 workflow 240 Shared Reports folder, purpose of 20 size of reports and documents 59 sizing rows and columns in a report 54 slicing and dicing data in a workbook 117 Smart Tag alias 195, 197 associating with a project name 196 associating with a report 195 in Excel 99 using as links to projects and reports 191 viewing a list of 198 Smart Tag Alias, associating with a report 195, 197 SSL about 277 Web Farms and 279 standard authentication 240 starting Web module for WebSphere 221 WebSphere Administrative Console 218 WebSphere default application © 2013 MicroStrategy, Inc. Index server 218 static image adding a report as 71 inserting a graph report as 183 static presentation 126 support international xxviii support. See technical support. supporting IIS 6 208 T table, using for a report in Word 149 technical support xxix toolbar enabling in a Microsoft product 13 MicroStrategy Office 12 troubleshooting common MicroStrategy Office issues 283 MicroStrategy Office toolbar not displayed 283 running diagnostics 281 Smart Tags 285 U Use Office privilege 2 user assigned to admin role Oracle 10g (Web Services) 229 WebSphere (Web Services) 221 V viewing hidden reports and documents 16 list of Smart Tags 198 virtual directory, default 206 299 Index MicroStrategy Office User Guide W Windows supporting IIS 6 208 Windows NT automatic project connection 250 Word using a table for a report 149 using MicroStrategy Office in 147 Word document adding a document to 148 adding a report to 148 example 158, 159 refreshing 163 saving 163 securing data in 163 Word Reports folder, purpose of 20 workbook adding a calculation 123 adding a document to adding a report to 97 auto-filtering data in 121 customizing using MicroStrategy Office API 113 formatting a report in 115 moving reports and documents in 84 refreshing 115 resizing a report in 115 saving 113 securing data in 114 WAR file (Web Services) exploding for WebLogic 213 locating for WebLogic 211, 217, 225 unzipping for WebLogic and Apache 214 Web Farms about 278 project source and 278 SSL and 279 Web module for WebSphere, starting 221 Web prompt style 79 Web Services installation 205 installation, advanced 278 web.xml re-deploying the application 215 WebLogic (Web Services) deploying MicroStrategy Web Services J2EE 211 exploding the WAR file 213 preconfiguration information 210 production mode 211 WebLogic and Apache (Web Services) locating the WAR file 211, 217, 225 WAR file 214 WebSphere deploying MicroStrategy Web Services J2EE 217 WebSphere (Web Services) 216 application installation 219 deploying MicroStrategy Web Services J2EE 226 launching Administrative Console 217 preconfiguration 216 starting default application server 218 WebSphere and IBM HTTP Server, deploying MicroStrategy Web Services J2EE 216 300 © 2013 MicroStrategy, Inc.


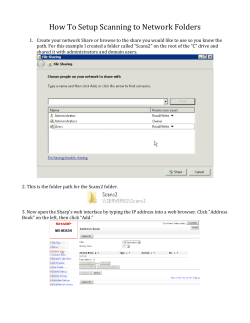
© Copyright 2026