
E-book
International Journal of Physical Sciences Volume 9 Number 24 30 December, 2014 ISSN 1992-1950 ABOUT IJPS The International Journal of Physical Sciences (IJPS) is published weekly (one volume per year) by Academic Journals. International Journal of Physical Sciences (IJPS) is an open access journal that publishes high-quality solicited and unsolicited articles, in English, in all Physics and chemistry including artificial intelligence, neural processing, nuclear and particle physics, geophysics, physics in medicine and biology, plasma physics, semiconductor science and technology, wireless and optical communications, materials science, energy and fuels, environmental science and technology, combinatorial chemistry, natural products, molecular therapeutics, geochemistry, cement and concrete research, metallurgy, crystallography and computer-aided materials design. All articles published in IJPS are peer-reviewed. Contact Us Editorial Office: [email protected] Help Desk: [email protected] Website: http://www.academicjournals.org/journal/IJPS Submit manuscript online http://ms.academicjournals.me/ Editors Prof. Sanjay Misra Department of Computer Engineering, School of Information and Communication Technology Federal University of Technology, Minna, Nigeria. Prof. Songjun Li School of Materials Science and Engineering, Jiangsu University, Zhenjiang, China Dr. G. Suresh Kumar Senior Scientist and Head Biophysical Chemistry Division Indian Institute of Chemical Biology (IICB)(CSIR, Govt. of India), Kolkata 700 032, INDIA. Dr. 'Remi Adewumi Oluyinka Senior Lecturer, School of Computer Science Westville Campus University of KwaZulu-Natal Private Bag X54001 Durban 4000 South Africa. Prof. Hyo Choi Graduate School Gangneung-Wonju National University Gangneung, Gangwondo 210-702, Korea Prof. Kui Yu Zhang Laboratoire de Microscopies et d'Etude de Nanostructures (LMEN) Département de Physique, Université de Reims, B.P. 1039. 51687, Reims cedex, France. Prof. R. Vittal Research Professor, Department of Chemistry and Molecular Engineering Korea University, Seoul 136-701, Korea. Prof Mohamed Bououdina Director of the Nanotechnology Centre University of Bahrain PO Box 32038, Kingdom of Bahrain Prof. Geoffrey Mitchell School of Mathematics, Meteorology and Physics Centre for Advanced Microscopy University of Reading Whiteknights, Reading RG6 6AF United Kingdom. Prof. Xiao-Li Yang School of Civil Engineering, Central South University, Hunan 410075, China Dr. Sushil Kumar Geophysics Group, Wadia Institute of Himalayan Geology, P.B. No. 74 Dehra Dun - 248001(UC) India. Prof. Suleyman KORKUT Duzce University Faculty of Forestry Department of Forest Industrial Engineeering Beciyorukler Campus 81620 Duzce-Turkey Prof. Nazmul Islam Department of Basic Sciences & Humanities/Chemistry, Techno Global-Balurghat, Mangalpur, Near District Jail P.O: Beltalapark, P.S: Balurghat, Dist.: South Dinajpur, Pin: 733103,India. Prof. Dr. Ismail Musirin Centre for Electrical Power Engineering Studies (CEPES), Faculty of Electrical Engineering, Universiti Teknologi Mara, 40450 Shah Alam, Selangor, Malaysia Prof. Mohamed A. Amr Nuclear Physic Department, Atomic Energy Authority Cairo 13759, Egypt. Dr. Armin Shams Artificial Intelligence Group, Computer Science Department, The University of Manchester. Editorial Board Prof. Salah M. El-Sayed Mathematics. Department of Scientific Computing. Faculty of Computers and Informatics, Benha University. Benha , Egypt. Prof. Mohammed H. T. Qari Department of Structural geology and remote sensing Faculty of Earth Sciences King Abdulaziz UniversityJeddah, Saudi Arabia Dr. Rowdra Ghatak Associate Professor Electronics and Communication Engineering Dept., National Institute of Technology Durgapur Durgapur West Bengal Dr. Jyhwen Wang, Department of Engineering Technology and Industrial Distribution Department of Mechanical Engineering Texas A&M University College Station, Prof. Fong-Gong Wu College of Planning and Design, National Cheng Kung University Taiwan Dr. Abha Mishra. Senior Research Specialist & Affiliated Faculty. Thailand Dr. Madad Khan Head Department of Mathematics COMSATS University of Science and Technology Abbottabad, Pakistan Prof. Yuan-Shyi Peter Chiu Department of Industrial Engineering & Management Chaoyang University of Technology Taichung, Taiwan Dr. M. R. Pahlavani, Head, Department of Nuclear physics, Mazandaran University, Babolsar-Iran Dr. Subir Das, Department of Applied Mathematics, Institute of Technology, Banaras Hindu University, Varanasi Dr. Anna Oleksy Department of Chemistry University of Gothenburg Gothenburg, Sweden Prof. Gin-Rong Liu, Center for Space and Remote Sensing Research National Central University, Chung-Li, Taiwan 32001 Prof. N. V. Sastry Department of Chemistry Sardar Patel University Vallabh Vidyanagar Gujarat, India Dr. Edilson Ferneda Graduate Program on Knowledge Management and IT, Catholic University of Brasilia, Brazil Dr. F. H. Chang Department of Leisure, Recreation and Tourism Management, Tzu Hui Institute of Technology, Pingtung 926, Taiwan (R.O.C.) Prof. Annapurna P.Patil, Department of Computer Science and Engineering, M.S. Ramaiah Institute of Technology, Bangalore-54, India. Dr. Ricardo Martinho Department of Informatics Engineering, School of Technology and Management, Polytechnic Institute of Leiria, Rua General Norton de Matos, Apartado 4133, 2411901 Leiria, Portugal. Dr Driss Miloud University of mascara / Algeria Laboratory of Sciences and Technology of Water Faculty of Sciences and the Technology Department of Science and Technology Algeria International Journal of Physical Sciences Table of Contents: Volume 9 Number 24, 30 December, 2014 ARTICLES Application of soft computing techniques for multi source deregulated power system S. Baghya Shree and N. Kamaraj 525 Computational calculation of the electronic and magnetic properties of 1x1-MN/GaN (M = V, Cr and Mn) multilayers Miguel J. E. R., Gladys C. J. and César O. L. 538 UV Absorption and dynamic mechanical analysis of polyethylene films P. Kuria Kamweru, F. Gichuki Ndiritu, T. Kinyanjui, Z. Wanjiku Muthui, R. Gichuki Ngumbu and P. Migunde Odhiambo 545 Vol. 9(24), pp. 525-537, 30 December, 2014 DOI: 10.5897/IJPS2014.4227 Article Number:80E7F2349168 ISSN 1992 - 1950 Copyright © 2014 Author(s) retain the copyright of this article http://www.academicjournals.org/IJPS International Journal of Physical Sciences Full Length Research Paper Application of soft computing techniques for multi source deregulated power system S. Baghya Shree1* and N. Kamaraj2 1 Department of Electrical and Electronics Engineering, Anna University, Dindigul Campus, India. Department of Electrical and Electronics Engineering Thiagarajar College of Engineering, Madurai, India. 2 Received 28 October, 2014; Accepted 13 November, 2014 In this paper, an interconnected power system is proposed for Automatic Generation Control (AGC) in restructured power environment. The customized AGC scheme is projected in deregulated environment for multi-source combination of hydro, reheat thermal and gas generating units in entire area. Proportional integral derivative controller is offered for AGC scheme and the gains are optimised through soft computing techniques such as Hybrid Chaotic Particle Swarm Optimization (HCPSO) algorithm, Real Coded Genetic Algorithm (RCGA) and also with Artificial Neural Network (ANN). The PSO chosen here carves out the AGC problem through the addition of adaptive inertia weight factor and adaptive constriction factors. The intense trend in deregulated system leads to the aggressiveness in frequency and tie line power deviations. It is observed that the chaos mapping of PSO enhance the rate of convergence using logistics map sequence. The proposed algorithms are tested on three area power system for different electricity contracted scenarios under various operating conditions with Generation Rate Constraint (GRC). Analysis reveals that proposed HCPSO improves significantly the dynamical performances of system such as settling time and overshoot. The comparative results show the robust performance of HCPSO against parametric uncertainties for a wide range of load demands and disturbances. Key words: Automatic generation control (AGC), hybrid chaotic particle swarm optimisation (HCPSO), proportional integral derivative (PID), restructured power system. INTRODUCTION In restructured situation, Automatic generation control (AGC) is one of the essential subsidiary services to be maintained for diminishing frequency deviations (Abraham et al., 2011; Tan, 2011; Shayeghi, 2008). The requirement for improving the efficiency of power production and delivery with intense participation of independent power producers stimulates restructuring of the power sector. The demand being fluctuating and increasing one, it is necessary to maintain the same constraint with the combination of various sources of generation and hence an attempt on research is made on the three area power system with various combinations of hydro, thermal and gas generation. Many researchers have been made their contribution in analyzing the restructured system (Ibrabeem and Kothari, 2005; Bevrani et al., 2005; Shayeghi and Shayanfar, 2005; *Corresponding author. E-mail: [email protected], Tel: +91 0451 2554066. Fax: +91 0451 2554066. Author(s) agree that this article remain permanently open access under the terms of the Creative Commons Attribution License 4.0 International License 526 Int. J. Phys. Sci. Figure 1. Three area restructured power system. Menniti et al., 2004; Bevrani et al., 2004). Various control strategies have been opted for the better performance of the open market system (Demiroren and Zeynelgil, 2007; Shayeghi et al., 2006). The restructured three area power system is shown in Figure 1. Now-a-days the electric power industry has been transformed from Vertically Integrated Utilities (VIU) providing power at regulated rates to an industry that will incorporate competitive companies selling unbundled power at lower rates (Shayeghi et al., 2009). In the new power system structure, Load Frequency Control (LFC) acquires a fundamental role to enable power exchanges and to provide better conditions for electricity trading (Sedghisigarchi et al., 2002; Bevrani, 2002; Donde et al., 2001). Since to maintain the area control error to be zero so as to assure the generation and demand to be same, LFC are required for the power system (Christie and Bose, 1996; Lim et al., 1996). To keep the dynamic response of the power system to be stable, a controller like HCPSO (Cheshta and Verma, 2011) is required so as to perform the LFC of system shown in Figure 1. Under open market system (deregulation) the power system structure changed in such a way that would allow the evolving of more specialized industries for Generation (GENCOs), Transmission (TRANSCOs) and Distribution (DISCOs) (Tan, 2010). The concept of Independent System Operator (ISO) is an unbiased coordinator who has to balance the consumer and power generators reliably and economically (Bhatt et al., 2010; Rakhshani and Sadeh, 2010; Tan, 2009). The AGC task is done through the error signal produced during generation and net interchange between the areas, that error is known as Area Control Error (ACE) (Liu et al., 2003). Where area, area, be the frequency bias coefficient of the ith be the frequency error of the ith be the tie line power flow error between ith area and jth area. The DISCO Participation Matrix (DPM) is proposed here to carry out the electricity contracts, the conventional control uses the integral of ACE as the control signal (Abraham et al., 2011; Tan, 2010, 2011; Shayeghi, 2008) and it has been found that the ACE which is used as a control signal results in reduction in frequency and tie line power error to zero in steady state (Tan, 2011). From the literature it is pointed out that very few of them concentrates on AGC problem in restructured environment. Since Proportional Integral Derivative (PID) holds the better results and hence, RCGA and HCPSO (Shayeghi et al., 2006), Artificial Neural Network (ANN) algorithm are introduced to independently determine optimal gain parameters of three area multi source AGC problem. In all PSO algorithms, inertial, cognitive and communal behaviour governs the movement of a particle. In HCPSO, an extra feature is introduced to ensure that the particle would have a predefined probability to maintain the diversity of the particles. The HCPSO algorithm converges to the best optimization results consistently and moderately rapid for all the test cases. The proposed work compares the performances for scenarios with ANN algorithm and RCGA-PID, while comparing the algorithms, the optimizing performance of HCPSO algorithm has been established to be the best for all the test cases with the controllers. SYSTEM ANALYZED (1) The three area multi source generating system is considered here, Shree and Kamaraj in which each area has different combinations of GENCOs and DISCOs. Area 1 comprises of two DISCOs and three GENCOs with thermal reheat turbine, mechanical hydraulic turbine and gas turbine, Area 2 includes one DISCO and two GENCOs with hydro and thermal turbines and Area 3 consists of two GENCOs with thermal and Gas turbines combination with two DISCOs as shown in Figure 3. In this restructured environment, any GENCO in one area may supply DISCOs in the same area as well as DISCOs in other areas. In other words, for restructured system having several GENCOs and DISCOs, any DISCO may contract with any GENCO in another control area independently. This is termed as bilateral transaction. The transactions have to be carried out through an Independent System Operator (ISO). The main purpose of ISO is to control many ancillary services, one of which is AGC. In open access scenario, any DISCO has the freedom to purchase MW power at competitive price from different GENCOs, which may or may not have contract with the same area as the DISCO (Shayeghi et al., 2009). The contracts of GENCOs and DISCOs described by ‘DISCO participation matrix’ (DPM). In DPM, the number of rows is equal to the number of GENCOs and the number of columns is equal to the number of DISCOs in the system. Any entry of this matrix is a fraction of total load power contracted by a DISCO towards a GENCO. The sum of total entries in a column corresponds to one DISCO be equal to one. The DPM for the nth area power system is as follows: (2) (4) Where, , , (5) , (6) (7) (8) (9) (10) Where k=1,2.....ni In a power system having steam plants, power generation can change only at a specified maximum rate. The structure for ith area in the presence of GRC is shown in Figure 2. A typical value of the GRC for thermal unit is 3%/min, that is, GRC for the thermal system be PGt (t ) 0.0005 p.u.MW (3) 527 / s .Two limiters, bounded by±0.0005 are employed within the AGC of the thermal and gas system to prevent the excessive control action. Likewise, for hydro plant GRC of 270%/min. for raising generation and 360%/min. for lowering generation has been deemed. HCPSO-PID controller strategy The Proportional-Integral-Derivative (PID) controller is intended for this multi area multi source generation system. Since this controller provides zero steady state deviation with good dynamic response of frequency and tie-line power in a multi area power system. The control vector is given by: Where, For i,j=1,2,....N, and ; (11) ; In the above, ni and mj are the number of GENCOs and DISCOs in area i and gpfij refer to ‘generation participation factor’ and shows the participation factor GENCOi in total load following the requirement of DISCOj based on the possible contract. The Equation (3) shows the Augmented Generation Participation Matrix (AGPM), which depicts the effective participation of DISCO with various GENCOs in all the areas with Generation Rate Constraint (GRC). The sum of all entries in each column of AGPM is unity. To demonstrate the effectiveness of the modeling strategy and proposed control design, a three control area power system is considered as a test system with GRC. As there are many GENCOs in each area, the ACE signal has to be distributed among them due to their ACE participation factor in the AGC task. The scheduled contracted power exchange is given by (Shayeghi et al., 2009): = (Demand of DISCOs in area j from GENCOs in area i) - (Demand of DISCOs in area i from GENCOs in area j) Where Kpi, Kdi, Kii are the proportional, derivative and integral gains of PID controller. In PID controller, the tie line power deviation and frequency deviation are weighted together as a linear combination to a single variable called ACE, which is given as control signal to governor set point in each area. Here, ITAE is used as a performance criterion. To achieve a preeminent performance and to improve the dynamics of LFC in a deregulated power system, Hybrid Chaotic Particle Swarm Optimization Algorithm is used to optimize the gains of PID controller. The evaluation of proposed controller has been made by simulating the same structure using RCGA optimization (Demiroren and Zeynelgil, 2007) and ANN has been trained through Back Propagation Algorithm (Demiroren, 2001) for ACE and Differentiation of ACE. Hybrid chaotic particle swarm optimisation In conventional approach, it involves more number of iterations to 528 Int. J. Phys. Sci. Figure 2. Control structure with GRC for ith area. Figure 3. Three area restructured control area. Shree and Kamaraj 529 Table 1. Fitness value (ITAE) comparison. Scenario HCPSO-PID 4.5236 8.3976 8.111 1 2 3 optimize the objective function and hence it is a time consumable one (Cheshta and Verma, 2011; Shayeghi and Shayanfar, 2006; Barjeev and Srivastava, 2003; Rerkpreedapong and Feliache, 2002). To conquer this intricacy, Hybrid Chaotic Particle Swarm Optimization is proposed to optimise the gains of PID Controller. In general PSO depends on its parameter and after certain iterations, the parameter sets are approximately identical (Cheshta and Verma, 2011). To enhance the performance of particle swarm optimization algorithm the application of adaptive inertia weight factor and adaptive constriction factors is proposed. The extreme trend in deregulated power system leads to the aggressiveness in frequency and tie line power deviations. It is observed that the chaos mapping upgrade the rate of convergence using logistics map sequence and Chaotic based optimisation offers diversity in population. A chaotic sequence for inertia weight and constriction factor for optimization is as follows: Fitness function RCGA-PID ANN 4.5099 4.8932 9.0656 9.8035 9.4837 10.1235 Where, be the velocity of the ith population at kth iteration, be Chaotic sequence based on logistic map for ith population at kth th iteration, be position of particle of ith at k iteration. The position of each particle is updated using the velocity vector that is: (16) Fitness-objective function The focal intention of this effort is to reduce the frequency deviation and tie line power flow deviations and these parameters are weighted together as ACE. The fitness function is taken along with an optional penalty factor to take care of transient responses; the fitness function is given by: Adaptive inertia weight factor (AIWF) ITAE= The rate of inertia weight is set for the entire particles be similar for all iteration (Cheshta et al., 2011). Therefore difference among particles is omitted. This adaptive method declares that the better particle should have a tendency to utilize its neighbour particles. This strategy provides the huge selection pressure. The AIWF is obtained as (Cheshta et al., 2011): = (12) th Where th be inertia weight of i population at k iteration, be minimum inertia weight, be fitness function of pbest th th solution at k iteration, th (17) Where e(t) be error considered. The fitness function to be minimized is given by: (18) Where, FD=α1OS+α2 ST ; Where Overshoot (OS) and settling time (ST) for 2% band of frequency deviation in all three areas are considered for evaluation of the Frequency Discrimination (FD), by adjusting the values of α1 and α2 the frequency discrimination can be obtained. The fitness value for all the three scenarios are listed Table 1. be fitness function of i population at k th iteration and iteration. be fitness function of gbest solution at k Adaptive constriction factors Constriction factor are extremely depend on fitness function of current iteration (that is) pbest and gbest solution and c1 and c2 controls the utmost step size. This factor can be determined as: Pseudo code Step 1: Choose the population size and number of iteration. Step 2: Generate randomly ‘n’ particles for gains and frequency biases with uniform probability over the optimized parameter search space [x , x ], similarly generate initial velocities of all particles , min max which is given by: ) Step 3: Run AGC model and calculate the fitness function for each th = (13) = (14) The velocity up gradation of particle modified as: (15) particle (Equation18) at k iteration. Step 4: Calculate gbest value and pbest value. Step 5: Calculate fitness function at gbest and pbest solution. Step 6: Calculate AIWF (Equation 12), constriction factor (Equations 13-14) and z1, z2 (Equation 10). Step 7: Update velocity of each particle (Equation 15). Step 8: Based on updated velocities, each particle changes its position according to Equation (16). If particle infringes the position limit in any dimension, set its position at the proper limit. Step 9: If the last change of the best solution is greater than a pre 530 Int. J. Phys. Sci. Figure 4. Simulink model. specified number or the number of iteration reaches the maximum iteration, stop the process, otherwise go to Step 3. RESULTS AND DISCUSSION The three area control structure with GRC considering multi source generation has been simulated for restructured structure as shown in Figure 4. To demonstrate the robustness of proposed control strategy against parametric suspicions and contract variations, simulations are carried out for three scenarios of possible contracts under various operating conditions and large load demands. The plant parameters for three area deregulated power system is presented in Table 2. Performance of the proposed controller is compared with RCGA-PID (Demiroren and Zeynelgil, 2007) and ANN (Demiroren, 2001) controller. The parameters of the controllers are given in appendix (Table 3). Scenario1 poolco based transactions In this scenario, GENCOs participate only in the load following control of their areas. It is assumed that a large step load 0.1 pu is demanded by each DISCOs in areas 1, 2 and 3 with GRC. The poolco based contracts between DISCOs and available GENCOs is simulated based on the following AGPM. The variations in tie line power flows and frequency is shown in Figures 5 and 6 and the values are depicted in Tables 4 and 5. Scenario 2 combination of poolco and bilateral based transactions In this case, DISCOs have the freedom to contract with any of the GENCOs within or with other areas. All the GENCOS are participating in the AGC task as per the following AGPM. The discrepancies based on this Shree and Kamaraj 531 Table 2. Power system plant and control parameters. Area 1 Area 2 Area 3 Thermal-Hydro-GAs Hydro-Thermal Thermal-Hydro GENCO-1 GENCO-2 GENCO-3 GENCO-1 GENCO-2 GENCO-1 GENCO-2 Thermal Tg=0.06s Hydro Tg=0.2s Gas Tg=0.049s Thermal T1=0.06s Hydro Tg=0.2s Thermal Tg=0.06s Gas T1=0.049s Tt=0.3s Tt=0.55s Tt=0.2s T3=10.2s Tt=28.149s Tt=10.2s T3=1.1s R=0.3333Hz/p.u.MW Tr=10.2s Kr =0.3113 Tr=10.6 s Kr =0.5 Tr=1.1s T2=0.3s Tw =1s R=.29633Hz/p.u.MW Kg=1 Kr =0.33 Tr=10s T2=0.2s Tw =1.5s R=0.32Hz/p.u.MW R=.33Hz/p.u.MW R=0.32Hz/p.u.MW Kt=1 Kg=1 Kg=1 Kg=1 Kg=1 R=0.2899Hz/p.u. MW Kg=1 R=0.3077Hz/p.u .MW Kg=1 Kt=1 Kt=1 Kt=1 Kt=1 Kt=1 Kt=1 Kp=20 Hz/ p.u. MW Tp=120s B=0.495p.u. MW/Hz Prated=2000 MW (NominalLoad) Po= 1000 MW f=60Hz Kp=20 Hz/ p.u. MW Tp=120s B=0.542 p.u.MW/Hz Prated=2000 MW (Nominal Load) Po= 1000 MW f=60Hz Kp=20 Hz/ p.u. MW Tp=120s B=0.532p.u. MW/Hz Prated=2000 MW (Nominal Load) Po= 1000 MW f=60Hz T12=T13=T23= 0.543 p.u/Hz Table 3. Controller parameter. Parameter Number of population Number of Generation RCGA 20 200 Probability crossover -0.8 Mutation function taken as Gaussian Fitness scaling function is Rank transaction are shown in Figures 7 and 8 prevailing to frequency and tie line power deviations. HCPSO 20 200 Wmax-0.6 Wmin0.1 C1=C2=1.5 ANN Number of hidden layers 10 1000 Sampling interval-0.05s Number of delayed inputs-2 Number of delayed output-1 through simulation depicts that the proposed HCPSOPID controller holds good performance as compared to RCGA-PID and ANN controller for all possible contracts and for wide range of load disturbances. Scenario 3 contract violation In this scenario, the DISCOs may violate the contracts by demanding more power than that specified in the contract. This excessive power is reflected as a located load of that area (un contracted demand).The AGPM of this case follows the scenario 2 and the un contracted loads for DISCO 1 in area1 is 0.018 p.u, DISCO 2 in area1 is 0.0230 p.u, DISCO1 in area is 0.3800 p.u, DISCO 1 in area 3 is 0.0125 p.u, DISCO 2 in area3 0.0125 p.u. The purpose of this scenario is to test the effectiveness of the proposed controller against the uncertainties and sudden large load disturbances in the presence of GRC (Figures 9 and 10). The Table 6 demonstrates the comparison of GENCO power deviation for the three scenarios with theoretical and the simulated values by Equation (10). The deviation in tie line power flows for these possible contracts are presented in appendix. The results thus obtained Conclusions Multi source generation is universal for any real time grid in function. It is incredibly hard to synchronize the various areas in a deregulated environment by means of frequency and tie line power flows. However, the conventional PID controller can be able to coordinate but with large overshoots and settling time. Hence soft computing techniques proposed for this AGC problem. The HCPSO-PID controller is proposed here for multi source generation system for a deregulated environment. This controller accomplishes consistency over tracking frequency and tie line power deviations for a wide range of load disturbances and system uncertainties. To prove its robustness the performance has been compared with RCGA-PID and ANN controller. The simulated result shows that the proposed controller is 532 Int. J. Phys. Sci. AGPM= 0.3 0.4 0.3 0 0 0 0 0.25 0.35 0.4 0 0 0 0 0 0 0 0.5 0.5 0 0 0 0 0 0 0 0.45 0.55 0 0 0 0 0 0.6 0.4 Fig.5. Frequency Deviation for scenario1 Figure 5. Frequency deviation for scenario 1. line power deviations.of poolco and bilateral based transactions 4.2. Scenario 2 Combination AGPM= 0.2 0.25 0.1 0.3 0 0.15 0 0.15 0.2 0 0.15 0.2 0.2 0.1 Figure 6. Tie line power deviation for scenario 1. 0.1 0 0.3 0.3 0 0.15 0.15 0 0.1 0.25 0.25 0.15 0.15 0.1 0.2 0.15 0.15 0.2 0.2 0 0.1 Shree and Kamaraj 533 Table 4. Tie line power deviations. Controller Area Peak overshoots (MW) Scenario 1 Scenario 2 Scenario 3 0.120428 0.118588 0.141012 0.094645 0.139323 0.19326 0.000912 0.03702 0.052313 Peak Undershoot(MW) Scenario 1 Scenario 2 Scenario 3 -0.00813 -0.05842 -0.10009 -0.00436 -0.00656 -0.02693 -0.21249 -0.25369 -0.30557 Settling time(secs) Scenario 1 Scenario 2 Scenario 3 7 6 4 8 6 5 4 8 6 Computational time (secs) HCPSO-PID 1 2 2 RCGA-PID 1 2 3 0.165357 0.093712 0.098728 0.126169 0.111066 0 0.160866 0.11627 0 -0.03485 -0.07594 -0.24801 -0.00822 0 -0.23711 -0.00821 0 -0.27666 14 15 11 20 21 19 18 18 19 0.85 ANN 1 2 3 0.164209 0.093889 0.000762 0.172452 0.093077 0 0.208209 0.090079 0 -0.01273 -0.0001 -0.19951 -0.01034 0 -0.22226 -0.01637 0 -0.24809 34 36 36 38 41 28 19 20 25 0.23 0.45 Table 5. Frequency deviations. Controller HCPSO-PID RCGA-PID ANN Peak overshoots (Hz) Area Peak Undershoot (Hz) Settling time (secs) Computational time (secs) Scenario 1 Scenario 2 Scenario 3 Scenario 1 Scenario 2 Scenario 3 Scenario 1 Scenario 2 Scenario 3 1 0.03352 0.083241 0.128561 -0.31716 -0.286 -0.34254 7 6 4 2 0.06948 0.148039 0.221594 -0.35658 -0.28115 -0.37978 8 6 5 2 0.12463 0.168112 0.228224 -0.57114 -0.56928 -0.70162 4 8 6 1 0.16183 0.193253 0.365623 -0.28816 -0.30916 -0.39173 14 20 18 2 0.19515 0.296932 0.480645 -0.30682 -0.23067 -0.36772 15 21 18 3 0.40514 0.341415 0.572651 -0.56879 -0.56651 -0.71862 11 19 19 1 0.16420 0.000799 0.017762 -0.01273 -0.47493 -0.63228 34 38 19 2 0.09388 0.00333 0.018313 -0.00023 -0.58227 -0.75234 36 41 20 3 0.00091 0.002363 0.028305 -0.19951 -0.67788 -0.85948 36 28 25 most excellent for real time application. In future, alI techniques like ANFIS can be incorporated to get 0.45 0.85 0.23 online coordination for the deregulated environment. 534 Int. J. Phys. Sci. Figure 7. Frequency deviation for scenario 2. Figure 8. Tie line power deviation for scenario 2. Figure 9. Frequency deviation for scenario 3. Figure 10. Tie line power deviation for scenario 3. Shree and Kamaraj 535 Table 6. Genco power deviations for 0.1 p.u. load disturbance. Genco power deviation Scenario Theoretica l value 1 2 3 1 2 3 1 2 3 0.055 0.065 0.085 0.075 0.07 0.085 0.07 0.08 0.095 GENCO 1 – Thermal GENCO Hydro 2 GENCO 3 Gas GENCO Thermal 1 GENCO Hydro 2 GENCO Thermal 1 GENCO Gas 2 Value obtained through Simulation RCGA HCPSO ANN Area 1 0.055006 0.055005 0.055006 0.065005 0.065005 0.065005 0.085025 0.085008 0.085025 0.074982 0.074983 0.074982 0.079996 0.079999 0.079996 0.084994 0.084992 0.084994 0.070013 0.070014 0.070013 0.079996 0.079999 0.079996 0.095008 0.095001 0.095008 RCGA -6x10⁻⁶ -6 -4.9 x10 -2.5 x10-5 -6 0.18 x10 -6 -4.3 x10 -6 6.1 x10 -5 -1.3 x10 -4.3 x10-6 -4 0.49 x10 1 2 3 1 2 3 0.055 0.12 0.144 0.05 0.055 0.071 0.049999 0.119999 0.143862 0.050001 0.054998 0.071028 Area 2 0.049999 0.119998 0.143998 0.049994 0.055 0.071006 0.049999 0.119999 0.143862 0.050001 0.054998 0.071028 0.1 x10 -6 1.1 x10 -6 0.138 x10 -1 x10-6 1.7 x10⁻⁶ -2.8 x10⁻⁵ 1 2 3 1 2 3 0.105 0.065 0.144 0.095 0.045 0.06 0.104981 0.064978 0.079403 0.095012 0.045028 0.061845 Area 3 0.105 0.06497 0.079976 0.095002 0.045039 0.06002 0.104981 0.064978 0.079403 0.095012 0.045028 0.061845 0.19 x10 2.19 x10⁻⁵ 0.597 x10⁻⁶ 0.12 x10⁻⁶ -2.8 x10⁻⁵ -0.184 x10⁻⁵ Conflict of Interest The authors have not declared any conflict of interest. ACKNOWLEDGEMENT The authors acknowledges the Regional Director, Dean, Head of the Department, Faculty Members of University College of Engineering Dindigul and Management, Principal and Faculty Members of Thiagarajar college of Engineering, Madurai who cooperated to work on this article. REFERENCES Abraham RJ, Das D, Patra A (2011). Load following in a bilateral market with local controllers. Int. J. Electr. Power Energy Syst. 33(10):1648– 1657. http://dx.doi.org/10.1016/j.ijepes.2011.06.033 Barjeev T, Srivastava SC (2003). A fuzzy logic based load frequency controller in a competitive electricity environment. IEEE Power Engineering Society General Meeting. 2003. Bevrani H (2002). A novel approach for power system load frequency -6 -6 Error Value HCPSO -5 x10⁻⁶ -6 -4.6 x10 -5 -8 x10 -6 0.17 x10 -6 -1 x10 -6 7.8 x10 -5 -1.4 x10 -6 -1 x10 -6 -1.3 x10 ANN -6x10⁻⁶ -6 -4.9 x10 -2.5 x10-5 -6 0.18 x10 -6 -4.3 x10 -6 6.1 x10 -5 -1.3 x10 -4.3 x10-6 -4 0.49 x10 -6 0.1 x10 -6 1.1 x10 -6 0.13x10 -1 x10-6 1.7 x10⁻⁶ -2.8 x10⁻⁵ -1 x10 0.3 x10⁻⁵ 2.42 x10⁻⁵ 0.2 x10⁻⁶ -3.8 x10⁻⁵ -2 x10⁻⁵ 0.19 x10 2.19 x10⁻⁵ 0.59x10⁻⁶ 0.12 x10⁻⁶ -2.8 x10⁻⁵ -0.18 x10⁻⁵ 0.1 x10 -6 2.3 x10 -6 2.3 x10 0.6 x10⁻⁶ 2.5 x10⁻⁶ -6.2 x10⁻⁶ -7 -6 -6 controller design. IEEE/PES Transmission and Distribution Conference Exhibition. pp. 184–189. http://dx.doi.org/10.1109/TDC.2002.1178281 Bevrani H, Mitani Y, Tsuji K (2004). Robust decentralized AGC in a restructured power system. Energy Conver. Manage. 45:2297–2312. http://dx.doi.org/10.1016/j.enconman.2003.11.018 Bevrani H, Mitani Y, Tsuji K, Bevrani H (2005). Bilateral based robust load frequency control. Energy Conver. Manage. 46(7–8):1129–1146. http://dx.doi.org/10.1016/j.enconman.2004.06.024 Bhatt P, Roy R, Ghoshal S (2010). Optimized multi area AGC simulation in restructured power systems. Int. J. Electr. Power Energy Syst. 32(4):311–322. http://dx.doi.org/10.1016/j.ijepes.2009.09.002 Cheshta J, Verma HK (2011). Hybrid Choatic Particle Swarm Optimisation based gains for deregulated automatic generation control. Int. J. Electronics Commun. Comput. Eng. 2(2):1-9 Christie RD, Bose A (1996). Load frequency control issues in power system operations after deregulation. IEEE Trans. Power Syst. 11(3):1191–1200. http://dx.doi.org/10.1109/59.535590 Demiroren A (2001). Automatic generation control by using ANN technique. Electrical Power Components and systems (Electric Machines and Power systems). 29(10):883-896. http://dx.doi.org/10.1080/15325000152646505 Demiroren A, Zeynelgil HL (2007). GA application to optimization of AGC in three area power system after deregulation. Int. J. Electr. Power Energy Syst. 29:230–240. http://dx.doi.org/10.1016/j.ijepes.2006.07.005 Donde V, Pai A, Hiskens IA (2001). Simulation and optimization in an AGC system after deregulation. IEEE Trans. Power Syst. 16(3):481– 536 Int. J. Phys. Sci. 489. http://dx.doi.org/10.1109/59.932285 Ibrabeem PK, Kothari DP (2005). Recent philosophies of automatic generation control strategies in power systems. IEEE Trans. Power Syst. 20(1):346–357. http://dx.doi.org/10.1109/TPWRS.2004.840438 Lim KY, Wang Y, Zhou R (1996). Robust decentralized load-frequency control of multi-area power systems. IEEE Proceedings Part C. 143:377–386. Liu F, Song YH, Ma J, Mei S, Lu Q (2003). Optimal load-frequency control in restructured power systems. IEEE Proceedings on Generation Transmission Distribution. 150(1):87–95. Menniti D, Pinnarelli A, Scordino N (2004). Using a FACTS device controlled by a decentralized control law to damp the transient frequency deviation in a deregulated electric power system. Electr. Power Syst. Res. 72(3):289–298. http://dx.doi.org/10.1016/j.epsr.2004.04.013 Rakhshani E, Sadeh J (2010). Practical viewpoints on load frequency control problem in a deregulated power system. Energy Conver. Manage. 51(6):1148–1156. http://dx.doi.org/10.1016/j.enconman.2009.12.024 Rerkpreedapong D, Feliache A (2002). Decentralized load frequency control for load following services. IEEE Proceeedings on Power Engineering Society Winter Meeting. pp. 1252–1257. Sedghisigarchi K, Feliache A, Davari A (2002). Decentralized load frequency control in a deregulated environment using disturbance accommodation control theory. Proceedings on 34th South eastern Symposium on System Theory. pp. 302–306. Shayeghi H (2008). A robust decentralized power system load frequency control. J. Electr. Eng. 59(6):281–293. Shayeghi H, Shayanfar HA (2005). Design of decentralized robust LFC in a competitive electricity environment. J. Electr. Eng. 56(9–10):225–236. Shayeghi H, Shayanfar HA (2006). Decentralized robust AGC based on structured singular values. J. Electr. Eng. 57:305–317. Shayeghi H, Shayanfar HA, Jalili A (2006). Multi-stage fuzzy PID power system automatic generation controller in deregulated environments. Energy Conver. Manage. 47:2829–2845. http://dx.doi.org/10.1016/j.enconman.2006.03.031 Shayeghi H, Shayanfar HA, Jalili A (2009). Load frequency control strategies: a state of-the-art survey for the researcher. Energy Conver. Manage. 50(2):344–353. http://dx.doi.org/10.1016/j.enconman.2008.09.014 Tan W (2009). Tuning of PID load frequency controller for power systems. Energy Conver. Manage. 50(6):1465–1472. http://dx.doi.org/10.1016/j.enconman.2009.02.024 Tan W (2010). Unified tuning of PID load frequency controller for power systems via IMC. IEEE Trans. Power Syst. 25(1):341–350. http://dx.doi.org/10.1109/TPWRS.2009.2036463 Tan W (2011). Decentralized load frequency controller analysis and tuning for multi-area power systems. Energy Conver. Manage. 52(5):2015– 2023. http://dx.doi.org/10.1016/j.enconman.2010.12.011 Shree and Kamaraj Appendix Nomenclature i: Subscript referred to area, F: Area frequency, Ptie: Tie line power flow, PT : Turbine power, PV: Governor valve position, PC: Governor set point, ACE: Area control error, AGC: Automatic generation control, GRC: Generator rate constraint, DPM: DISCO participation matrix, AGPM: Augmented generation participation matrix, cpf: Contract participation factor, gpf: Generation participation factor, KP: Subsystem equivalent gain constant, T P: Subsystem equivalent time constant, TT: Turbine time constant, T G: Governor time constant, R: Droop characteristic, 537 B: Frequency bias, FD: Frequency Deviation, ITAE: Integral time multiplied absolute error, Tij: Tie line synchronizing coefficient between areas i and j, Pd: Area load disturbance, PLji: Contracted demand of DISCO j in area I, PULji: Un-contracted demand of DISCO j in area I, PM,ji: Power generation of GENCO j in area I, PLoc: Total local demand, : Area interface, : Scheduled power tie line power flow deviation. Vol. 9(24), pp. 538-544, 30 December, 2014 DOI: 10.5897/IJPS2014.4228 Article Number: 49580D449173 ISSN 1992 - 1950 Copyright © 2014 Author(s) retain the copyright of this article http://www.academicjournals.org/IJPS International Journal of Physical Sciences Full Length Research Paper Computational calculation of the electronic and magnetic properties of 1x1-MN/GaN (M = V, Cr and Mn) multilayers Miguel J. E. R.1*, Gladys C. J.2 and César O. L.2 1 GEFEM Group, Distrital University Francisco José de Caldas, Bogotá, Colombia. Grupo Avanzado de Materiales y Sistemas Complejos GAMASCO, Departamento de Física, Universidad de Córdoba, Montería Colombia. 2 Received 30 October, 2014; Accepted 3 December, 2014 We employed density functional theory (DFT) in order to study the electronic and magnetic properties of 1x1-MN/GaN (M = V, Cr, and Mn) multilayers, in the wurtzite-type hexagonal structure. The calculations were carried out using a method based on full-potential linearized augmented plane waves (FP-LAPW), employed exactly as implemented in Wien2k code. For the description of the electronelectron interaction, generalized gradient approximation (GGA) was used. We found that the VN/GaN multilayers exhibited a half-metallic ferromagnetic behavior and all 1x1-MN/GaN (M = V, Cr and Mn) multilayers have magnetic properties with a magnetic moment of 2, 3 and 4 µβ per cell, respectively. Additionally, we found that the magnetic moment/cell multilayers increase linearly with an increase in the atomic number Z of the transition metal. Analysis of the density of states reveals that ferromagnetic behavior of the multilayers can be explained by the strong hybridization between states (V, Cr and Mn)d and N-pcrossing of the Fermi level. The magnetism in the multilayers essentially comes from the d orbitals of the atoms of V, Cr and Mn. Key words: DFT, 1x1-MN/GaN (M = V, Cr, and Mn) multilayers, structural and electronic properties. INTRODUCTION Gallium nitride, GaN, a semiconductor that crystallizes as wurtzite (Koide et al., 2005), is a material of great interest because of its wide potential application in technology, in light-emitting devices in the blue and near-ultraviolet ranges, diodes based on Schottky contact, and laser diodes (Nakamura, 1997; Morkoc et al., 1994). Its efficiency in blue, green, and yellow light-emitting emitting diodes, laser injection, and ultraviolet detectors is truly extraordinary (Steckl and Birkahn, 1998). The high value of the dielectric constant, high thermal conductivity, and favorable transport properties make it a good candidate for new applications in devices that must operate at high temperatures and in high-power electronic devices (Nakamura et al., 1994). In recent years, there has been great interest in the GaN compound, its alloys, and when doped with transition metal, due to their potential *Corresponding author. E-mail: [email protected] Author(s) agree that this article remain permanently open access under the terms of the Creative Commons Attribution License 4.0 International License Miguel et al. applications in diluted magnetic semiconductors (Dietl et al., 2000), as spin injectors, in magnetic memories, and in other spintronics applications (Zhang and Kuech, 1998; Dietl, 2002). At the same time, recent advances in techniques of the growth of materials and the ability to control the growth of semiconductor materials have opened the door to the manufacture of high-quality multilayers in different geometries and for different kinds of semiconductors. Rawat et al. (2009) demonstrated that it is possible to grow a multilayer of transition metal nitrides and GaN, despite the difference in the crystalline structures of NaCl, titanium nitride TiN, and GaN wurtzite. They grew a TiN/GaN multilayer using the reactive pulsed laser deposition technique (PLD), while Birch et al. (2006) grew a ScN/CrN multilayer epitaxially, using the magnetron sputerring technique. This fact shows that it is worthwhile to carry out theoretical studies of 1x1MN/GaN (M = V, Cr, and Mn) multilayers that will provide information on the structural, electronic, and magnetic properties of these multilayers and enable the design of new devices that will contribute to the development of current semiconductor technology. 539 Where B0 is the bulk modulus, its first derivative is B' 0, V0 is the equilibrium volume of the cell, and E0 represents the cohesive energy. In other to study the relative stability of 1x1-MN/GaN (M = V, Cr, and Mn) multilayers in a 50-50 concentration, namely, x = 50% GaN molecules and x = 50% MN (M = V, Cr, and Mn) molecules, the energy of formation was calculated. For the ternary compound, the formation energy is defined as the difference between the total energy of the ternary phase M1-xGaxN and the total energy of the binary compounds in their ground state (more stable phase: fme) MN and GaN wurtzite, namely, wurtzita fme EMN and EGaN , respectively. Therefore, the formation energy is given by Equation (2)(Zhang and Veprek, 2007; Sheng et al., 2008). fme wurtzita E f EMfme 1 x EMN xEGaN 1 x Gax N (2) The 1x1-MN/GaN multilayer were modeled according to special quasirandom structures approach (Zunger et al., 1990) and the disorder aspects were ignored. The 1x1-MN/GaN multilayer an hexagonal unit cell with alternating [0001] layers of MN (V, Cr and Mn) and GaN in conventional wurtzite structure was employed, as show in Figure 1. Where a and c are the lattice constants, u denotes the dimensionless parameter of the internal structure and the positions of the atoms are: for Ga or M (0,0,0), (1/3,2/3,1/2) and N (0,0,u), (1/3,2/3,u+1/2). COMPUTATIONAL METHODS The calculations were carried out within the framework of density functional theory (DFT), and full potential augmented plane wave (FP-LAPW) was used as implemented in the Wien2k software package (Schwarz et al., 2010). The exchange and correlation effects of the electrons were dealt with using the generalized gradient approximation (GGA) of Perdew, Burke, and Ernzerhof (PBE) (Perdew et al., 1997). In the LAPW method, the cell is divided into two types of regions, namely spheres centered at the atomic nuclear sites and an interstitial region between nonoverlapping areas. Within the atomic spheres, wave functions are replaced by atomic functions, whereas in the interstitial region, the functions are expanded in the form of plane waves. The charge density and potential expand to form spherical harmonics up to lmax = 10 inside the atomic spheres, and the wave function in the interstitial region expands in the form of plane waves with a cutoff parameter RMTKmax = 8, where RMT is the smallest radius of the atomic level within the unit cell and K max is the magnitude of the largest k vector of the reciprocal lattice. To ensure convergence in the integration of the first Brillouin zone, 1600 points were used, which corresponds to 140 k-points at the irreducible part of the first Brillouin. The integrals over the Brillouin zone were solved using the special approximation of k points provided by Monkhorst and Pack (1976). Self-consistency was achieved by requiring that the convergence of the total energy be less than 10-4 Ry. To achieve expansion of the potential in the interstitial region, G max was considered to be = 12. The corresponding muffin-tin radii were 1.6 bohr for N, 1.95 bohr for Ga, and 1.85 for V, Cr and Mn. Calculations were performed taking into consideration the spin polarization caused by the presence of V, Cr and Mn in the superlattice. To calculate the lattice constant, the minimum volume, the bulk modulus, and the cohesive energy of the two structures studied, calculations were fit to the Murnaghan equation of state (Murnaghan, 1944),Equation (1) (1) RESULTS AND DISCUSSION Structural properties The multilayers were modeled in the wurtzite structure belonging to space group 156 (P3m1), interspersing a monolayer of GaN and one of MN (M = V, Cr and Mn) along the z axis. Figure 2 shows the energy as a function of the volume of 1x1- MN/GaN (M = V, Cr and Mn) multilayers. The calculated total energy was fit to Murnaghan's equation of state. It can be noted that each of the curves has a minimum energy value, and thus the crystallization phase of the multilayers is stable or metastable. The lattice constant, the c/a value, the bulk modulus (B0), the minimum volume (V0), the minimum energy (E0), the magnetic moment (μβ) per cell, and the energy of formation of 1x1-MN/GaN (M = V, Cr and Mn) multilayers are shown in Table 1. Table 2 shows the values of the structural parameters of the binary compounds VN, CrN, MnN and GaN, calculated and reported by other authors.The calculated lattice constant for each of the binary compounds accords well with values reported theoretically and experimentally, since it differs by less than one percent. The values of the bulk modules of the multilayers are higher, which confirms that they are quite rigid, making them good candidates for possible applications in devices operated at high temperature and high power, as well as hard coatings. On the other hand, despite the difference in the crystalline structure between VN NaCl, zinc blend of CrN, MnN, and GaN wurtzite, joining of the layers of the 1x1-MN/GaN (M = V, Cr and Mn) compounds with GaN to form a multilayer does 540 Int. J. Phys. Sci. Figure 1. Unit cell 1x1-MN/GaN (M = V, Cr and Mn) multilayers. -8.4 -11.16 -11.20 -11.25 -11.22 -11.30 -11.28 -8.5 -8.6 -11.35 -11.34 -11.40 -11.40 -8.7 -11.46 -8.8 -11.45 Figure 2. Total energyas a function ofvolume for 1x1-(a) VN/GaN, (b) CrN/GaN, (c) MnN/GaN multilayers. Table 1. Structural and magnetic parameters and the energy of formation ∆E f of 1x1-MN/GaN (M = V, Cr and Mn) multilayers. Multilayer VN/GaN CrN/GaN MnN/GaN a0 (Å) 3.227 a 3.267 3.210 3.190 c/a V0 (Å3) B0 (GPa) E0 (eV) µ (µβ ) ∆Ef (eV) 1.631 47.41 176.07 - 11.47 ̴ 2.0 + 0.621 1.628 1.626 47.19 46.31 191.50 181.00 - 11.48 - 8.570 ̴ 3.0 ̴ 4.0 + 0.461 + 0.403 not change the GaN wurtzite structure, as seen in Table 1 in the value of the lattice constant and the c/a value of the multilayers, which are very close to the value of the lattice constant and the c/a value of GaN in Table 2. In order to verify the relative stability of the multilayer, we calculated the energy of formation of each multilayer. For this purpose, we calculated the total energy E0 (Table 2) of the binary compounds VN, CrN, MnN and GaN in their ground states. Table 1 shows the values of formation energy ∆Ef calculated using Equation 2. The energy of VN, CrN, MnN and GaN binary compounds in their ground state is negative, whereas, according to the results of Table 2, the value of the energy of formation of each multilayer is positive. Miguel et al. 541 Table 2. Structural parameters of binary compounds VN, CrN, MnN and GaN in ground state. Binary VN CrN MnN GaN a0 (Å) 4.129 4.127b c 4.139 c/a B0 (GPa) 306.01 305.3c E0 (eV) - 15.25 4.148 b 4.146 4.135c 4.271 4.256d - 211.15 204.15 - 14.95 - 291.5 - 9.524 3.222 3.221f g 3.190 1.629 1.631f 184.50 170.56f g 188.00 - 8.933 - A (González et al., 2009) Theoretical, b (Liangcai et al., 2013) Theoretical, c (International center for diffraction data, 2007) Experimental, d (Suzuki et al., 2000) Experimental, e (Lukashev and Lambrecht, 2004) Theoretical, f (Shultz and Thiemann, 1977) Theoretical, g (Arbouche et al., 2009) Experimental. Therefore, 1x1-MN/GaN (M = V, Cr and Mn) multilayers are metastable. This means that the multilayer cannot grow under equilibrium conditions, so in order to grow them, it is necessary to supply power to the system, as Rawat et al. (2009) did in order to grow a 1x1-TiN/GaN multilayer using the reactive pulsed laser deposition technique (PLD). These results for the energy of formation are important, because through knowing these values, growing conditions can be improved, and therefore 1x1- MN/GaN (M = V, Cr and Mn) multilayers of excellent quality can be grown. Table 1 shows that energy of formation of the 1x1MN/GaN (M = V, Cr and Mn) multilayer. The smallest value of the energy of formation corresponds to the 1x1MnN/GaN multilayer; therefore, it is the most energetically stable. Electronic properties Figure 3(a), (b) and (c) shows the calculated band structures of 1x1-MN/GaN (M = V, Cr and Mn) multilayers in their ferromagnetic state phase. Figure 4b and 4c shows that the 1x1-CrN/GaN and 1x1-MnN/GaN multilayers are not half-metallic behavior due valence and conduction bands cross the Fermi level, however 1x1VN/GaN multilayer is half-metallic and ferromagnetic, since in the valence band near the Fermi level the majority spin (spin-up) is metallic, and the minority spin (spin-down) is semiconducting. The 1x1-VN/GaN multilayer exhibit 100% polarization of the conduction carriers in the ground state, which is required in spin injection. This suggests that it can be used efficiently for injection of spin polarized charge carriers. Figure 4(a), (b) and (c) show the total density of states (TDOS) and partial density of states (PDOS) of the orbitals that more contribute near the Fermi level of 1x1MN/GaN (M = V, Cr, and Mn) multilayers in the ground state. The calculations were performed with spin polarization up and down. Figures 4a confirm the half-metallic and ferromagnetic nature of 1x1-VN/GaN multilayer, since the up-spin density is metallic, whereas the down-spin density is of semiconductor character, namely, the spin-up channel is completely occupied and the spin-down channel is completely empty. Whereas that 1x1-CrN/GaN and 1x1MnN/GaN have metallic behavior of the two spin channels. The 1x1-MN/GaN(M = V, Cr, and Mn) multilayers, have magnetic behavior with magnetic moments of 2, 3 and 4 µβ respectively, is mainly determined by the orbitals (M = V, Cr, and Mn)-d, and to a lesser extent by the N-p orbitals that cross the Fermi level. However, as seen in Figure 4, the contribution of the N-p (up-spin) orbital near the Fermi level increases with the increase in the atomic number Z of the transition metal in the multilayer, the contribution of orbital N-p being lower in the VN/GaN and higher in the CrN/GaN multilayer. Additionally, according to the theory by Jhi et al. (1999), the hybridization of the metallic states (M = V, Cr, and Mn)-d and nonmetallic electrons N- p that cross the Fermi level results in a strong covalent bond, which is responsible for the high degree of stiffness of the multilayer. Figure 5 shows the variation of the magnetic moment as a function of the atomic number of the transition metal present in the1x1-MN/GaN (M = V, Cr, and Mn) multilayer, with Z = 23, 24 and 25 respectively. It can be observed that the magnetic moment increases linearly with an increase in the atomic number. This increase in the magnetic moment value can 542 Int. J. Phys. Sci. Figure 3. Band structure (a) 1x1-VN/GaN, (b) 1x1-CrN/GaN and (c) 1x1-MnN/GaN. understood as follows: the magnetic moments of 2, 3 and 4 µβ are due V3+, Cr3+ and Mn3+ configuration, respectively; with electronic configurations V3+ =:[Ar]3d2, Cr3+ =:[Ar]3d3 and Mn3+ =:[Ar]3d4; because, when the V, Cr and Mn atoms are in the multilayer each atom gives three electrons. Then, the V atom remain two valence electrons, Cr atoms three and Mn atom four valence electrons (configurations d2, d3 and d4, respectively). This valence electrons couple ferromagnetically, as result the two electrons produce a total magnetic moment of 2 μβ/atom-V, the three electrons produce a total magnetic moment of 3 μβ/atom-Cr and the four electrons produce a total magnetic moment of 4 μβ/atom-Mn. Conclusions We reported first principles calculations to determine the structural, electronic, and magnetic properties of a 1x1MN/GaN (M = V, Cr, and Mn) multilayer. The calculated Miguel et al. 1.8 1.8 1.2 1.2 0.6 0.6 0.0 0.0 -0.6 -0.6 -1.2 -1.2 -1.8 -1.8 1.8 1.2 0.6 0.0 -0.6 -1.2 -1.8 Figure 4. Total and partial density of states of 1x1 (a) VN/GaN, (b) CrN/GaN, (c) MnN/GaN multilayers. 4.0 3.5 3.0 2.5 2.0 Figure 5. Magnetic moment as a function of the atomic number of the transition metal present in the1x1-MN/GaN (M = V, Cr, and Mn) multilayer. The line is a visual guide. 543 544 Int. J. Phys. Sci. values of the bulk modules were quite high; therefore, the multilayers are quite rigid, which makes them attractive for potential applications at high temperatures and for hard coatings. Also, we found that the magnetic moment increases linearly with an increase in the atomic number of the transition metal present in the multilayer. On the basis of the density of states, we found that the multilayer exhibits a half metallic behavior, due to the orbital M-d(M = V, Cr, andMn) andN-p that cross the Fermi level in each corresponding multilayer. Finally, we found that 1x1-MN/GaN (M = V, Cr, and Mn) multilayers exhibit magnetic properties with magnetic moments 2, 3 and 4 µβ, respectively. These properties show that multilayers are good candidates for possible applications in diluted magnetic semiconductors, spin injectors, and other spintronics applications. Conflict of Interest The authors have not declared any conflict of interest ACKNOWLEDGEMENT The authors thank the Research Center of the University of Cordoba CUIC for its financial support. REFERENCES Arbouche O, Belgoumène B, Soudini B, Driz M (2009). First principles study of the relative stability and the electronic properties of GaN. Computational Materials Sci. 47(2):432–438. http://dx.doi.org/10.1016/j.commatsci.2009.09.007 Birch J, Joelsson T, Eriksson F, Ghafoor N, Hultman L (2006). Single crystal CrN/ScN superlattice soft X-ray mirrors: Epitaxial growth, structure, and properties. Thin Solid Films 514(1-2):10–19. http://dx.doi.org/10.1016/j.tsf.2006.02.011 Dietl T (2002). Ferromagnetic semiconductors. Semicond. Sci. Technol. 17(4):377-392. http://dx.doi.org/10.1088/0268-1242/17/4/310 Dietl T, Ohno H, Matsukura F, Cibert J, Ferrand D (2000). Zener Model Description of ferromagnetism in ZincBelndeMagnwticSemicondutors. Science 287(5455):1019-1022. http://dx.doi.org/10.1126/science.287.5455.1019 González HR, López PW, Fajardo F, Rodríguez M, Jairo A (2009). Pressure effects on the electronic and magnetic properties of GaxV1−xN compounds: Ab-initio study. Materials Science and Engineering B. 163(3):190–193. http://dx.doi.org/10.1016/j.mseb.2009.05.029 International center for diffraction data (2007). Powder diffraction files 00-045-0978 (ScN), 00-035-0779 (YN), 03-065-0565 (TiN), 00-0350753 (ZrN), 00-033-0592 (HfN), 00-035-0768 (VN), 03-065-5011 (NbN), 03-065-9404 (TaN), 00-065-2899 (CrN), International center for diffraction data, PDF-2/release 2007 (2007). Jhi SH, Ihm J, Louie SG, Cohen ML (1999). Electronic mechanism of hardness enhancement in transition-metal carbonitrides. Nature. 399:132–134. http://dx.doi.org/10.1038/20148 Koide N, HikosakaT, Honda Y, Yamaguch M (2005). Incorporation of carbon on a (1 ī 01) facert of GaN by MOVPE. J. Crystal Growth. 284(3-4):341–346. http://dx.doi.org/doi:10.1016/j.jcrysgro.2005.07.021 Liangcai Z, David H, Paul HM (2013). Ab initio study of the alloying effect of transition metals on structure, stability and ductility of CrN. J. Phys. D: Appl. Phys. 46(36):365301. http://dx.doi.org/10.1088/00223727/46/36/365301 Lukashev P, Lambrecht WRL (2004). First-principles study of the preference for zinc-blende or rocksalt structures in FeN and CoN. Phys. Rev. B. 70:245205. http://dx.doi.org/ 10.1103/PhysRevB.70.245205 Monkhorst HJ, Pack JD (1976). Physical Review B. Special points for Brillouin-zone integrations. 13(12):5188-5192. http://dx.doi.org/10.1103/PhysRevB.13.5188 Morkoc H, Strite S, Gao GB, Lin ME, Sverdlov B, Burns M (1994). Large‐band‐gap SiC, III‐V nitride, and II‐VI ZnSe‐based semiconductor device technologies. J. Appl. Phys. 76(3):1363-1368. http://dx.doi.org/10.1063/1.358463 Murnaghan FD (1944). The Compressibility of media under pressure. Proceedings of the National Academy Science U.S.A. 30(9):244-247. http://www.ncbi.nlm.nih.gov/pmc/articles/PMC1078704/ Nakamura S (1997). III-IV Nitride based light-emitting devices. Solid State Communications. 102(2-3):237-243. http://dx.doi.org/doi:10.1016/S0038-1098(96)00722-3 Nakamura S, Mukai T, Senoh M (1994). Candela‐class high‐brightness InGaN/AlGaN double‐heterostructure blue‐light‐emitting diodes. Appl. Phys. Lett. 64(13):1687-1692. http://dx.doi.org/10.1063/1.111832. Perdew J, Burke K, Ernzerhof M (1997). Generalized Gradient Approximation Made Simple: Physical Review Letter. 77(18):38653868. http://dx.doi.org/10.1103/PhysRevLett.77.3865. Rawat V, Zakharov DN, Stach EA, Sands TD (2009). Pseudomorphic stabilization of rocksalt GaN in TiN/GaN multilayers and superlattices. Phys. Rev. B. 80:24114. http://dx.doi.org/10.1103/PhysRevB.80.024114 Schwarz K, Blaha P, Trickey SB (2010). Electronic structure of solids with WIEN2k. Molecular Physics: Int. J. Interface between Chem. Phys. 108(21-23):3147–3166. http://dx.doi.org/10.1080/00268976.2010.506451 Sheng SH, Zhang RF, Veprek S (2008). Phase stabilities and thermal decomposition in the Zr1-xAlxN system studied by ab initio calculation and thermodynamic modeling. ActaMaterialia. 56(5):968–976. http://dx.doi.org/10.1016/j.actamat.2007.10.050 Shultz H, Thiemann KH (1977). Crystal structure refinement of Al Nans GaN. Solid State Commun. 23(11):815-819. http://dx.doi.org/10.1016/0038-1098(77)90959-0 Steckl AJ, Birkahn R (1998). Visible emission from Er-doped GaN grown by solid source molecular beam epitaxy. Appl. Phys. Lett. 73(12):1700-1702. http://dx.doi.org/10.1063/1.122250 Suzuki K, Kaneko T, Yoshida H, Obi Y, Fujimori H, Morita H (2000). Crystal structure and magnetic properties of the compound MnN. J. Alloys Compounds 306(1-2):66–71. http://dx.doi.org/10.1016/S09258388(00)00794-5 Zhang R, Kuech TF (1998). Photoluminescence of carbon in situ doped GaN grown by halide vapor phase epitaxy. Appl. Phys. Lett. 72(13):1611-1613. http://dx.doi.org/10.1063/1.121144 Zhang RF, Veprek S (2007). Phase stabilities and spinodal decomposition in the Cr1-xAlxN system studied by ab initio LDA and thermodynamic modeling: Comparison with the Ti1-xAlxN and TiN/Si3N4 systems.Acta Materialia. 55(14):4615-4619. http://dx.doi.org/10.1016/j.actamat.2007.04.029 Zunger A, Wei SH, Ferreira L, Bernard JE (1990). Special quasirandom structures. Phys. Review Lett. 65:353. http://dx.doi.org/10.1103/PhysRevLett.65.353 Vol. 9(24), pp. 545-555, 30 December, 2014 DOI: 10.5897/IJPS2014.4229 Article Number:B72482449175 ISSN 1992 - 1950 Copyright © 2014 Author(s) retain the copyright of this article http://www.academicjournals.org/IJPS International Journal of Physical Sciences Full Length Research Paper UV Absorption and dynamic mechanical analysis of polyethylene films P. Kuria Kamweru1*, F. Gichuki Ndiritu2, T. Kinyanjui3, Z. Wanjiku Muthui1, R. Gichuki Ngumbu2 and P. Migunde Odhiambo2 1 Basic Science Department, Chuka University College, P. O. Box 109-60400, Chuka, Kenya. 2 Physics Department, Egerton University Njoro, P. O. Box 536-20115, Egerton, Kenya. 3 Chemistry Department, Egerton University Njoro, P. O. Box 536-20115, Egerton, Kenya. Received 30 October, 2014; Accepted 1December, 2014 Photooxidative processes that lead to chain scission and chain linking in polymers play an important role in polymer degradation. These processes are induced by both ultraviolet (UV) and visible light absorption. The capability of these radiations to be absorbed depends on the existence of chromophores in the polymeric material. Assessment of photodegradation data obtained from a polymer material processed in a conventional manner is of more practical use than extrapolation of data obtained from pure resin. This study reports on the absorption of ultraviolet-light by conventionally processed polyethylene (PE) films. The PE film samples were submitted to UV from fluorescent lamps at 20°C and relative humidity 40% for two hours. Transmission, reflection and emission spectra, from which absorption was inferred, were obtained with anoptical spectrum analyzer. The study also reports the natural degradation under solar action of these PE films for a period of up to 150 days. Degradation was analyzed by change of the storage modulus using a dynamic mechanical analyzer instrument. Evidence of chromophoric sites was inferred from the absorption of UV light in the range 250 to 400 nm. However, the UV absorption was low in this range. The drop of storage modulus up to 150 days, averaged for the range (50 to 98°C), fit well a hypothetical polynomial of order two. Key words: Polyethylene, ultraviolet absorption, degradation, chromophores, storage modulus. INTRODUCTION Ultraviolet radiation (UV) with wavelength ranging from 200 to 400 nm, initiates oxidation degradative processes and is therefore responsible for the discoloration, weathering and loss of gloss and mechanical properties (cracking) of polymeric materials (Shah et al., 2008; Singh and Sharma, 2008; Salem, 2001). The physiochemical changes which occur during photo- oxidative reactions are characterized by an increase in the concentration of oxygen-containing groups, such as peroxides and hydroperoxides, and also ketonic carbonyl groups (Choon et al., 2004; Wiles and Scott, 2006; Massey et al., 2007). These peroxides chemically attack the bonds in the polymer molecules, reducing the molecular chain lengths to a level where they can be *Corresponding author. E-mail: [email protected], [email protected], [email protected]. Tel: +254726320644, (+49)179 5819198. Author(s) agree that this article remain permanently open access under the terms of the Creative Commons Attribution License 4.0 International License 546 Int. J. Phys. Sci. Table 1: Dissociation Energies of Various Bonds (Schnabel, 1981). Bond O-O C – Cl C–C C–N N–H C–O C–H C=C O-H Dissociation Energy (kJ/mol) 213 326 351 330 339 372 393 502 426 consumed by microorganisms (Wiles and Scott, 2006; Mahmood and Reza, 2004; Orhan et al., 2004). Changes in the mechanical properties of polyethylene are attributed to cross linking and chain scission processes occurring during photo-oxidation of the material (Ngunyen et al., 2000). The formation of chemical functional groups in polyolefins and their role in polymer chain-breaking has been reported. These studies showed that the degradative process starts with free radical formation followed by repeated oxidization and hydroperoxides formation which leads to polymer chain breakages (Singh and Sharma, 2008; Wiles and Scott, 2006). For instance, it was found that alkyl radicals e.g. (-CH2- *CH- CH3) may be formed in low density polyethylene (LDPE) films during UV-irradiation (Sarathi et al., 2003). Formation of oxy-radicals and chain scission is more likely for lower wavelengths (higher energy) but also possible for wavelengths greater than 300 nm (Corrales et al., 2001; Basfar and Ali, 2006). Thus, UV radiation energy effects are evident when there is a probability of its absorption. The energy is related to wavelength by the simple formula: Where h is Planks constant, c is the speed of light and λ is thewavelength of the radiation. This gives the energy of one photon. Multiplying by Avogadro’s number gives the energy for a mole of photons. The average bond energy of the carbon-carbon bond along a polymer backbone is 351 kJ/mol (Ranby and Rabek, 1975). Therefore, using the equation for energy and considering one mole of photons, 341 nm becomes the threshold wavelength where the energy is sufficient to cause chain scission of the C-C backbone. Any wavelength that is below 340 nm is capable of causing main chain backbone breakages. Table 1 gives the bond dissociation energies of various bonds of interest in polymers and the corresponding wavelengths that can cause scission. However, most polymers containing C-C, C-H, C-O, CN or C-Cl bonds have been reported to require a Corresponding wavelength λ (nm) 562 367 341 363 353 321 304 238 281 wavelength below 190 nm for appreciable formation of free radicals and subsequent photolysis (Hrdlovic, 2000). This is most likely due to steric effects of nearby chains, which assist in holding the bonds together by the close packing in a solid polymer, thus decreasing the rate of free radical formation (Hrdlovic, 2000). The portion of the sunlight-spectrum that reaches the earth’s surface is limited. Most of the higher energy X-rays, gamma rays, and cosmic rays never make it through the atmosphere due to their absorption by ozone, leaving only UV, visible, and infra red (IR) rays. Ozone absorption even takes care of the highest energy UV radiation, blocking radiation below 290 nm. The solar energy that reaches the surface is limited to the wavelength range 290 to 2450 nm. The total radiant solar energy consists of (in order of increasing energy): 37.8% IR (800-2450 nm), 55.4% visible light (400-800 nm), and 6.8% UV light (290-400 nm) (Ranby and Rabek, 1975). Polyethylene free from impurities and defects is, therefore, expected to not be susceptible to degradation under natural solar radiation since sufficiently low wavelengths do not make it to the earths surface. Ultraviolet-absorbing impurities (chromophores) in a polymer are what enable photolysis with wavelengths greater than 290 nm (Hrdlovic, 2000; Kroschwitz, 1990). Thus photodegradation (either photolysis or photo-oxidation) of a material is determined by the absorption characteristics of radiation in that material (Ngunyen et al., 2002). Polymeric materials are often manufactured using extrusion, injection molding, or extrusion blowing. The processing of polymers using heat and high shear to produce useful end products introduces impurities and reaction products that make them susceptible to UV radiation absorption and damage (Gowariker et al., 1988; Kroschwitz 1990; Global, 2008). Example of such impurities includes peroxides and hydroperoxides that are always formed during processing (Billingham et al., 2009; Gugumus, 2005; Kulikov and Hornung, 2004). Physical surface defects, e.g.fractures and fissures, are also known to occur during manufacture (Kulikov and Hornung, 2004; Migler et al., 2002). As a result of these complications, the extrapolation of research findings on UV-induced degradation of pure Kamweru et al. polymer resins to compounded and processed products of the same polymeris often unreliable. UV absorption data and degradation data generated on the actual polymer formulation used in practice, processed in a conventional manner, is most useful for assessment of the potential of photodegradation of that product in application. Several methods can be used to determine the presence of UV absorbing chromophoric sites, including UV andFourier transform infrared (FTIR) spectroscopy, among others. These methods rely on the knowledge of the functional groups or compounds that correspond to given absorption bands. In this study, an Optical Spectrum Analyzer (OSA Spectro 320) by Instrument Systems, Germany was used; itis a useful tool that gives spectral analysis emission, transmission and reflection spectra. These spectra carry information that directly infers absorbance of any radiation between 200nm and 880nm by samples of different materials. The OSA was used to measure the transmission and reflection of UV radiation by thepolyethylene. Absorption of UV by these PE films is discussed. Degradation analysis of conventionally processed PE films, processed by film extrusion, was done using dynamic mechanical analysis witha DMA 2980 from TA Instruments, USA. The DMA was used to analyze the temperature dependence of the mechanical behavior (viscoelasticity) of the films. Viscoelasticity is prominent behaviour in polymers (Sperling, 2006) and it means that mechanical properties, like stiffness, are time dependent and, therefore, stress dependent. Change inviscoelasticity, and hence mechanical properties, depict a change in the inner structure of the material. MATERIALS AND METHODS Commercial 30 µm thick low density polyethylene films processed by blown film extrusion from two Kenyan companies, PIL and StyroplastKenya Ltd were used as they were received from the supplier. For the purposes of this study the samples were manufactured without any additives, in a similar manner as those that were in Kenyan market for single short time use-and latter banned by the government. Emission, transmission and reflection measurements Samples were cut into 70 x 40 mm sizes for UV transmission and reflection measurements. The UV-irradiation was obtained from UV mercury fluorescent lamps emitting light in the region from 250 to 400 nm. The temperature of the samples during the UV transmission and reflection measurements was maintained at 20°C and the relative humidity was 40%. Emission of the mercury fluorescent lamps and the intensity, transmission and reflection by the films, as a function of wavelength, were measured using an OSA aided by SpecWin software (both from Instrument Systems, Germany). Sunlight exposure To investigate degradation due to solar radiation and the 547 environment, fresh untreated samples obtained from the same film as those which optical properties were tested, were exposed to natural conditions at Egerton University for a period of 150 days between May and September, 2011. The samples were clipped on stiff cardboards and elevated from the ground facing upward to the sun that is, inclined at 0° with respect to the horizontal. The cardboards were cut to form a rectangular frame, and the samples loosely clipped at the hollow center portion of the frames, to ensure that the largest portion of the sample was not in contact with the cardboard. Dynamic mechanical analysis was done on smaller samples cut out from the center of the exposed bigger sampleson the 70th and 150th days. Mechanical analysis Measurements were carried out on the DMA model 2980 using the Tension Film clamp. After exposure rectangular strips of dimensions 30 x 5 mm were prepared by carefully cutting them out of the parent exposed sample longitudinally along the extrusion direction. For the purpose of analyzing degradation, the storage modulus was chosen. The storage moduli values were determined at a frequency of 2 Hz, amplitude of 50 µm and an oscillating force of 0.01 N. The scan temperatures were from room temperature (25 to 100°C) but the 50 to 100°C range was chosen for analysis. To ensure data quality, calibration of the DMA instrument using standard samples supplied with the instrument preceded any measurement done. Control samples (undegraded) were tested for their storage modulus, loss modulus and loss factor, however, only storage modulus was used in the analysis of the data. These measurements were used as a reference for the subsequent measurements of aged /treated samples. RESULTS AND DISCUSSION UV, reflection and transmission Emission of the employed mercury lampin the ranges 200 to 300 nm and 300 to 400 nm was determined. This is shown in Figures 1 and 2, respectively. The lamps emitted with a number of peaks as shown in the figures with the highest peaks at 242 nm with an irradiance of 0.0475% W/m2 and at 360 nm with an irradiance of 3.8590 W/m2.The solar UV reaching the earth’s surface is between 290 to 400 nm with a maximum peak of 0.5 W/m2/nm at 375 nm measured at sea level. The units of this solar irradiance is given here as spectral irradiance that is, irradiance per unit wavelength. Comparably, the integrated mercury lamp emission in the range of 300 to 400 nm was approximately 10 times the UV available at the earths surface (> 290 nm). The effects of the mercury lamp irradiation therefore, are expected to be different from that of the sun. This study reports on the UV absorption and effects of the sun on the reduction of the storage modulus. Smaller wavelengths, less than 290 nm, do not penetrate the ozone layer (Ranby and Rabek, 1975). These smaller wavelengths are energetic enough to cause direct photolysis when incident on a polymeric material. Radiation above 290 nm is responsible forinitiation of peroxidization of the polymer (Dilara and Briassoulis, 2000). As a result natural polymer degradation follows the peroxidation route rather than 548 Int. J. Phys. Sci. Figure 1. Emission Spectral analysis at the range (200 -300) nm. Figure 2. Emission Spectral analysis of lines between (300-400) nm. direct photolysis. As shown in Figure 3 the reflection of the UV radiation by the 30 µm PE film within the range (200-300) nm was generally below 20%, except at 274, 208, 232 and 292 nm with highest peaks of 70 and 100% at 274 and 292 nm respectively. These percentages for the reflection and transmission are read in reference to the 100% reflection and transmission reference lines respectively, e.g. light reflection of 20% is read as 120% from the spectral graph. This low reflection suggests that most of the radiation actually entered the material film either for absorption or transmission. Reflection of the UV radiation by the 30 µm PE film within the range 300 to 400 nm is shown in Figure 4. Reflection peakedat 311, 314, 358 and at 375 nm. In the (200-300) nm range transmission waslower than 20% except at 243, 228 and 237 nm where transmission was above 30%, peaking at 243 nm with above 80% as shown in Figure 5. Given that the reflection in this range 200 to 300 nm as Kamweru et al. 549 Figure 3. UV Reflection by 30 µm PE film at 200-300 nm range. Figure 4. UV Reflection by 30 µm PE film at 300-400 nm range. shown in Figure 3 was generally low, it suggests that the samples absorbed this UV. The transmission spectrum shown in Figure 6 has absorption of less than 20% in the (300 to 325) nm, (328 to 360) nm and (378 to 394) nm ranges except at 349 and 359 nm with slightly above 20%. There also existed transmission peaks at 327 nm, five between 358 and 376) nm, the highest at 363 nm with transmission of almost 80% and a single line near 397 nm. It also shows a transmission of less than 20% of wavelengths between 330 and 345 nm. This could be the 550 Int. J. Phys. Sci. Figure 5. UV Transmission within 200 to 300 nm range. Figure 6. UV Transmission of 30 microns sample at the range 300 to 400 nm emission spectra or fluorescence spectra of LDPE which is normally at 330 to 345 nm (Konar and Ghosh, 1989; Teyssedre et al., 2005). There was no emission of UV between 300 and 310 nm as shown in Figure 2 (except at 306 nm of 20%) and hence the same wavelengths show missing reflection and transmission in Figures 4 and 6 respectively. The low reflectivity within the 318 to 358 nm region in Figure 4 where the transmission was also lower than 20%, except at 326 nm, as shown in Figure 6 suggests that the radiation was absorbed. This absorption may correspond to the excitation spectra of LDPE (Konar and Ghosh, 1989). Kamweru et al. 551 Figure 7. UV Absorption in the range (200 to 300) nm. Figure 8. UV Absorption in the range (300 to 400) nm UV absorption Using the simple formula, A =1-(T+R) where A = percentage absorption, T = percentage transmission and R = percentage reflection of the incident UV and in Excel program, the UV absorption spectra were obtained as a percentage of incident UV. Figures 7 and 8 shows the absorption percentages in the ranges (200 to 300) nm and (300 to 400) nm respectively, in reference to the 100% line. Absorption was generally low, especially at 552 Int. J. Phys. Sci. Table 2. UV absorption of 30% and above Wavelenght (nm) 317 282 249 300 347 372 260 304 360 211 Absorption % 30 32 33 33 33 33 34 36 40 41 Wavelenght (nm) 222 398 283 223 399 381 376 338 354 392 216 Absorption % 41 42 43 50 51 59 61 62 62 62 89 Temperature (°C) Figure 9. DMA plot of 30 µm PE sample, showing storage and loss modulus and damping factor. The values of the storage and loss modulus and shape of the damping factor curve as expected suggests that the sample measurements are made at the rubbery plateau of the polymeric material. low wavelengths, with absorption peak values above 30% shown in Table 2. These low wavelengths (below 300 nm) were given low attention since degradation of polyethylene is known to be caused by absorption of UV by various internal or external impurities, usually photoabsorbing chromophores rather than direct photolysis. These chromophores absorb UV at or above 290 nm (Gijsman and Dozeman, 1996). Many wavelengths that had absorption above 30% were in the range (300 to 400) nm. Normally, the chain scission quantum efficiency of solid polymers is low (Ngunyen et al., 2002), meaning that for substantive degradative process to be initiated, the presence of a high number of incident photons is needed. Dynamic mechanical analysis Figure 9 shows the storage modulus, loss modulus and loss factor taken before any treatment. Samples from both companies showed no difference in their properties. For the special case of unconstrained uniaxial tension, the stiffness k of a sample is given by: Where A- Cross sectional area, E- Modulus, L- Length of the sample. The slow drop of modulus confirms that the polymer is within the rubbery plateau. Figure 10 shows Kamweru et al. 553 Temperature (°C) Figure 10. Reduction of storage modulus of a 30 μm PE film at 0 days (control) and after 70 and 150 days exposure to natural environment in Egerton University, Njoro. Figure 11. Decrease in storage modulus, with a hypothetical fitted trend. the change of storage modulus as the films were exposed to sunlight for75 and 150 days. Before any treatment the storage modulus measured is shown in Figure 10 as the control, after 70 and 150 days the storage modulus curves measured had the same gradient but displaced downwards indicating that exposure to sunlight led to drop in storage modulus. The storage modulus is proportional to the peak energy stored per cycle in the sample; hence a measure of its viscoelasticity. Chain breakages (degradation) are associated with adecrease in energy storage capacity during a strain and this is recorded in a decrease of storage modulus (Choon et al., 2004). This loss of storage modulus and hence viscosity of a material, makes the material brittle with subsequent breakage on application of external force (Xie and Huilin, 2007). Studies done earlier shows that the action of sunlight on LDPE films begins with photo-oxidation of the outer layers, which after direct contact with atmospheric oxygen this oxidation can proceed rapidly through radical chain oxidation reactions. The inner layers which cannot be reached by atmospheric oxygen degrade slowly through photo-reactions of peroxy radicals. In addition this photodegradation is known to start at the amorphous region of the polymeric material (Dilara and Briassoulis, 2000). The drop of storage modulus averaged for the range (50 to 98°C), fits a hypothetical polynomial of order two fairly well as shown in Figure 11. This implies that the polymer take much time to degrade to low modulus values. Our results are consistent with other studies that 554 Int. J. Phys. Sci. reports aging of polymers showing non-Arrhenius behavior of polymeric materials (Gillen et al., 2005; Celina et al., 2005). CONCLUSION AND RECOMMENDATIONS The UV absorption by the PE films used in this study was below 62% except at 216 nm where absorption is 89%. This suggests existence of a concentration of chromophoric sites such as C=C, C=O and C-O bonds which are known to absorb within these wavelengths ranges and initiates photo-degradation. Other concentrations possible could be hydroxyls, carbonyl, carboxyl, ketonic compounds or amino groups as chromophores and catalyst residues containing Ti, Al and Cl (Gijsman et al., 1999). These initiators of photodegradation can be introduced to the polymer during manufacture (that is, polymerization) and during processing (that is, extrusion). As expected therefore, these PE films were relatively unstable to sunlight as shown by the reduction of the storage modulus, but the degradation is slow as compared to biodegradation. For applications in horticulture (e.g. for green houses), use of stabilizers e.g. UV absorbers, Ni quenchers and hindered amine light stabilizers (HALS), as it has been done (Khan and Hamid, 1995; Gijsman and Dozeman, 1996; Dilara and Briassoulis, 2000), is encouraged. For short term consumers e.g. food packaging, fast degradation can be encouraged by addition of chromophores capable of near visible radiation absorption. In other words, different degrees of degradation in the PE can be induced depending on the use of the material, expected route of disposal and possibility of re-use. This absorption should however be able to ignite degradation and quick fragmentation of these products that ends in landfills. This could be one way of reducing pollution menace created by the high use of PE for short-term uses in places where collection for recycling is not possible. Conflict of Interest The authors have not declared any conflict of interest. ACKNOWLEDGEMENT Author acknowledge Egerton University and the entire Physics Department for the support and permission to utilize laboratory resources. REFERENCES Basfar AA, Ali KM (2006). Natural weathering test for films of various formulations of low density polyethylene (LDPE) and linear low density polyethylene (LLDPE). Polym. Degrad. Stabil. 91:437-443. http://dx.doi.org/10.1016/j.polymdegradstab.2004.11.027 Billingham NC, Chiellini E, Corti A, Baciu R, Wiles DM (2009). Environmentally Degradable Plastics Based on Oxo-Biodegradation of Conventional Polyolefins. www. oxobio.org/Cologne%20paper.pdf. Accessed 15/09/12. Celina M, Gillen KT, Assink RA (2005). Accelerated aging and lif etime prediction: Review of non-Arrhenius behaviour due to two competing processes. Polym. Degrad. Stabil. 90:395–404. http://dx.doi.org/10.1016/j.polymdegradstab.2005.05.004 Choon SL, Seung HY, Jae YJ (2004). Mechanical properties of ultrahigh molecular weight polyethylene irradiated with gamma rays. Macromolecular Res. 12(1):112-118. http://dx.doi.org/10.1007/BF03219003 Corrales T, Catalina F, Peinado C, Allen NS, Fontan E (2001). Photooxidative and thermal degradation of polyethylenes: interrelationship by chemiluminescence, thermal gravimetric analysis and FTIR data. J. Photoch. Photobio. A. 147:213–224. http://dx.doi.org/10.1016/S1010-6030(01)00629-3 Dilara PA, Briassoulis D (2000). Degradation and stabilization of Low density Polyethylene films used as greenhouse covering materials. J. Agric. Eng. Res. 76:309-321. http://dx.doi.org/10.1006/jaer.1999.0513 Gijsman P, Dozeman A (1996). Comparison of the UV-degradation chemistry of unstabilized and HALS-stabilized polyethylene and polypropylene. Polym. Degrad. Stabil. 53(1):45–50. http://dx.doi.org/10.1016/0141-3910(96)00027-4 Gijsman P, Meijers G, Vitarelli G (1999). Comparison of the UVDegradation Chemistry of Polypropylene, Polyethylene, Polyamide 6 and Polybutylene Terephthalate. Polym. Degrad. Stabil. 65:433-441. http://dx.doi.org/10.1016/S0141-3910(99)00033-6 Gillen KT, Bernstein R, Celina M (2005). Non-Arrhenius behavior for oxidative degradation of chlorosulfonated polyethylene materials. Polym. Degrad. Stabil. 87(2):335–346. http://dx.doi.org/10.1016/j.polymdegradstab.2004.09.004 st Global C (2008). www.gcrio.org/UNEP1998/UNEP98p62. Accessed 21 July 2008 4.25PM. Gowariker VR, Viswanathan NV, Screedhar J (1988). Polymer Science. Willy Eastern publishers. India. pp. 263-280. Gugumus F (2005). Physico-chemical aspects of polyethylene processing in an open mixer. Part 10: Mechanisms and formal kinetics of hydroxyl group formation. Polym. Degrad. Stabil. 87:245– 256. http://dx.doi.org/10.1016/j.polymdegradstab.2004.08.009 Hrdlovic P (2000). Comparison of photodegradation of some common polymers; Polyethylene, Polypropylene, Polyamide 6 and Polybutene Terephthalate. Polymer News. 25(8):261-265. Khan JH, Hamid SH (1995). Durability of HALS-stabilized polyethylene "lm in a greenhouse environment. Polym. Degrad. Stabil. 48:137-142. http://dx.doi.org/10.1016/0141-3910(95)00015-E Konar J, Ghosh R (1989). Characterization of oxidized LDPE by solid state fluorescence spectra. J. Appl. Polym. Sci. 40:719–729. http://dx.doi.org/10.1002/app.1990.070400509 Kroschwitz JJ (1990). Concise, Encyclopedia of Polymer Science and Engineering. John Wiley and sons. Canada. Kulikov O, Hornung KA (2004). Simple way to suppress surface defects in the processing of polyethylene. J. Non-Newton Fluid. 124:103– 114. http://dx.doi.org/10.1016/j.jnnfm.2004.07.009 Mahmood TA, Reza HH (2004). Preparation of biodegradable low density polyethylene by starch – urea composition for agricultural applications Iran. J. Chem. Chem. Eng. 23. Massey S, Adnot A, Rjeb A, Roy D (2007). Action of water in the degradation of low-density polyethylene studied by X-ray photoelectron spectroscopy. Express Polym. Lett. 8:506–511. http://dx.doi.org/10.3144/expresspolymlett.2007.72 Migler KB, Son Y, Flynn K (2002). Extensional deformation, cohesive failure, and boundary conditions during sharkskin melt fracture. J. Rheol. 46:383–400. http://dx.doi.org/10.1122/1.1445186 Ngunyen T, Martin JW, Byrd E (2000). Effects of relative humidity on the photodegradation of acrylic melamine coatings; a quantitative Study. J. Am. Chem. Soc. 83:118-119. Ngunyen T, Martin JW, Byrd E, Embree E (2002). Effects of Spectral UV on Degradation of Acrylic-Urethane Coatings. Proceedings of the 80th Annual Meeting of the program of the FSCT, Federation of Societies for Coatings Technology, October30-November 1, 2002, Kamweru et al. New Orleans, LA, CD-ROM. Orhan Y, Hrenović J, Büyükgüngör H (2004). Biodegradation of plastic compost bags under controlled soil conditions. Acta. Chim. Slov. 51: 579−588. Ranby B, Rabek JF (1975). Photodegradation, Photo-oxidation and Photostabilisation of Polymers. London: John Wiley & Sons, 1975. Salem MA (2001). Mechanical Properties of UV-Irradiated Low-Density Polyethylene Films Formulated With Carbon Black and Titanium Dioxide. Egypt. J. Sol. 24(2). Sarathi R, Chandrasekar S, Giri VS, Venkataseshaiah C, Velmurugan R (2003). Analysis of surface degradation of high density polyethylene (HDPE) insulation material due to tracking. Bull. Mater. Sci. 27(3): 251–262. http://dx.doi.org/10.1007/BF02708514 Schnabel W (1981). Polymer Degradation, Principles and Practical Applications. Macmillan Publishing Co. New York. 1981, pp. 95-151. Shah AA, Hasan F, Hameed A, Ahmed S (2008). Biological degradation of plastics: A comprehensive review. Biotechnol. Adv. 26:246–265. http://dx.doi.org/10.1016/j.biotechadv.2007.12.005 555 Singh B, Sharma N (2008). Mechanistic implications of plastic degradation. Polym. Degrad. Stabil. 93:561–584. http://dx.doi.org/10.1016/j.polymdegradstab.2007.11.008 Sperling LH (2006). Introduction to Physical Polymer Science. John Wiley & Sons, Inc: Canada, 2006, Chap. 11. Teyssedre G, Laurent C, Montanari GC, Campus A, Nilsson UH (2005). From LDPE to XLPE: Investigating the Change of Electrical Properties. Part II: Luminescence.IEEE T DIELECT EL IN.12:447454. http://dx.doi.org/10.1109/TDEI.2005.1453449 Wiles DM, Scott G (2006). Polyolefins with controlled environmental degradability. Polym. Degrad. Stabil. 91:1581-1592. http://dx.doi.org/10.1016/j.polymdegradstab.2005.09.010 Xie M, Huilin L (2007). Viscosity reduction and disentanglement in ultrahigh molecular weight polyethylene melt: Effect of blending with polypropylene and poly(ethylene glycol). EUR. POLYM. J. 43:3480– 3487. http://dx.doi.org/10.1016/j.eurpolymj.2007.05.016 International Journal of Physical Sciences Related Journals Published by Academic Journals African Journal of Pure and Applied Chemistry Journal of Internet and Information Systems Journal of Geology and Mining Research Journal of Oceanography and Marine Science Journal of Environmental Chemistry and Ecotoxicology Journal of Petroleum Technology and Alternative Fuels


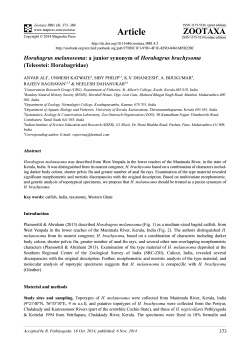


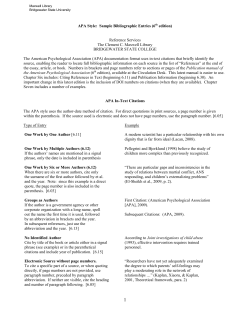

© Copyright 2026