
Awards in Statistical Methods
Awards in Statistical Methods Specification Edexcel Level 1 Award in Statistical Methods (AST10) Edexcel Level 2 Award in Statistical Methods (AST20) Edexcel Level 3 Award in Statistical Methods (AST30) For first teaching from January 2013 Pearson Education Ltd is one of the UK’s largest awarding organisations, offering academic and vocational qualifications and testing to schools, colleges, employers and other places of learning, both in the UK and internationally. Qualifications offered include GCSE, AS and A Level, NVQ and our BTEC suite of vocational qualifications, ranging from Entry Level to BTEC Higher National Diplomas. Pearson Education Ltd administers general qualifications. Through initiatives such as onscreen marking and administration, Pearson is leading the way in using technology to modernise educational assessment, and to support teachers and learners. Acknowledgements This specification has been produced by Edexcel on the basis of consultation with teachers, examiners, consultants and other interested parties. Edexcel would like to thank all those who contributed their time and expertise to its development. References to third-party material made in this specification are made in good faith. We do not endorse, approve or accept responsibility for the content of materials, which may be subject to change, or any opinions expressed therein. (Material may include textbooks, journals, magazines and other publications and websites.) Authorised by Martin Stretton Prepared by Sharon Wood Publications Code UG031213 All the material in this publication is copyright © Pearson Education Limited 2012 Introduction The Edexcel Level 1, Level 2 and Level 3 Awards in Statistical Methods are designed for use in schools and colleges. They are part of a suite of mathematics qualifications offered by Edexcel. Qualification Objectives The Edexcel Level 1, Level 2 and Level 3 Awards in Statistical Methods enable students to: develop an understanding of concepts in statistics and a sound foundation of statistical methods when: o calculating with data o displaying data o analysing data o interpreting statistical calculation and representations o using probability acquire confidence when using data to move into further study in the subject or related areas solve statistical problems enjoy using mathematics and become confident when using data develop a proficiency in statistics to support progression in their studies, in the workplace and in training. These qualifications support progression to other level 1, level 2 and level 3 qualifications, such as GCSE and GCE. The awards give statistical proficiency to support study in other subjects such as business, economics, biology and geography. Contents Specification at a glance 1 External assessment Calculators 2 3 Qualification content National Qualifications Framework (NQF) 5 5 Knowledge, skills and understanding Assessment overview 5 5 Edexcel Level 1 Award in Statistical Methods 7 Overview Edexcel Level 2 Award in Statistical Methods Overview Edexcel Level 3 Award in Statistical Methods Overview Assessment Assessment summary Assessment objectives and weightings Relationship of assessment objectives to papers Entering your students for assessment Student entry Access arrangements and special considerations Assessing your students Awarding and reporting Language of assessment Malpractice and plagiarism Student recruitment Prior learning Guided learning hours Progression Level descriptors Support and training Edexcel support services Training Appendices Appendix 1: Calculators Appendix 2: Wider curriculum Appendix 3: Codes Appendix 4: Normal Distribution Tables Appendix 5: Mapping of the Level 1 Award content to GCSE Mathematics content 7 11 11 15 15 19 19 20 21 21 21 21 22 22 22 22 23 23 23 24 24 26 26 26 27 29 31 33 35 37 Appendix 6: Mapping of the Level 1 Award content to GCSE Statistics content Appendix 7: Mapping of the Level 2 Award content to GCSE Mathematics content Appendix 8: Mapping of Level 2 Award content to GCSE Statistics content Appendix 9: Mapping of Level 3 Award content to GCE Mathematics Statistics 1 (S1) unit content 43 47 55 61 Specification at a glance These Level 1, Level 2 and Level 3 Awards qualifications consist of a single assessment at each level. Students are entered at either level 1, level 2 or level 3. Each Award is either pass or unclassified. Level 1 Paper code: AST10 Externally assessed. Availability: January and June series. 100% of the Award First assessment: June 2013. Overview of content Collecting and displaying data. Calculating and interpreting data. Probability. Overview of assessment The award is assessed through a 1 hour and 30 minutes examination set and marked by Edexcel. The total number of marks for the paper is 80. The qualification is awarded at pass or unclassified. Level 2 Paper code: AST20 Externally assessed. Availability: January and June series. 100% of the Award First assessment: June 2013. Overview of content Collecting and displaying data. Calculating and interpreting data. Probability. Overview of assessment The award is assessed through a 1 hour and 30 minutes examination set and marked by Edexcel. The total number of marks for the paper is 80. The qualification is awarded at pass or unclassified. UG031213 – Specification – Edexcel Level 1, Level 2 and Level 3 Award in Statistical Methods – Issue 1 – December 2012 © Pearson Education Limited 2012 1 Level 3 Paper code: AST30 Externally assessed. Availability: January and June series. 100% of the Award First assessment: June 2013. Overview of content Collecting and displaying data. Calculating and interpreting data. Probability. Overview of assessment The award is assessed through a 2 hour examination set and marked by Edexcel. The total number of marks for the paper is 90. The qualification is awarded at pass or unclassified. External assessment In all examination papers: 2 diagrams will not necessarily be drawn to scale and measurements should not be taken from diagrams unless instructions to this effect are given each student may be required to use mathematical instruments, eg ruler and protractor calculators may be used. UG031213 – Specification – Edexcel Level 1, Level 2 and Level 3 Award in Statistical Methods – Issue 1 – December 2012 © Pearson Education Limited 2012 Calculators Students will be expected to have access to a suitable electronic calculator. Details are given below. Students will be expected to know how to use estimation to evaluate approximations to numerical calculations and to show the appropriate stages of their working out. The electronic calculator to be used by students attempting the level 1 examination paper should have these functions as a minimum: +, , , , memory, brackets. The electronic calculator to be used by students attempting the level 2 examination paper should have these functions as a minimum: +, , , , x 2, x, memory, brackets The electronic calculator to be used by students attempting the level 3 examination paper should have these functions as a minimum: +, , , , x 2, x, memory, xy, x1/y, brackets, statistical and reciprocal functions Calculators with any of the following facilities are prohibited in all examinations: databanks; retrieval of text or formulae; QWERTY keyboards; built-in symbolic algebra manipulations; symbolic differentiation or integration. UG031213 – Specification – Edexcel Level 1, Level 2 and Level 3 Award in Statistical Methods – Issue 1 – December 2012 © Pearson Education Limited 2012 3 4 UG031213 – Specification – Edexcel Level 1, Level 2 and Level 3 Award in Statistical Methods – Issue 1 – December 2012 © Pearson Education Limited 2012 Qualification content National Qualifications Framework (NQF) These qualifications comply with the requirements of the statutory regulation of qualifications in England, Wales and Northern Ireland which are prescribed by the regulatory authorities. Knowledge, skills and understanding The Edexcel Level 1, Level 2 and Level 3 Awards in Statistical Methods require students to demonstrate competency in statistical methods, concepts and techniques. Level 1, Level 2 and Level 3 content contains: 1. Data 2. Displaying data 3. Calculating with data 4. Interpreting data 5. Probability Assessment overview One written paper taken at the end of the course. The Level 1 Award: o is assessed through a 1 hour and 30 minutes examination set and marked by Edexcel o Total number of marks for the paper is 80. The Level 2 Award: o is assessed through a 1 hour and 30 minutes examination set and marked by Edexcel o Total number of marks for the paper is 80. The Level 3 Award: o is assessed through a 2 hour examination set and marked by Edexcel o Total number of marks for the paper is 90. Each Award is pass or unclassified. Available in January and June. First assessment: June 2013. UG031213 – Specification – Edexcel Level 1, Level 2 and Level 3 Award in Statistical Methods – Issue 1 – December 2012 © Pearson Education Limited 2012 5 6 UG031213 – Specification – Edexcel Level 1, Level 2 and Level 3 Award in Statistical Methods – Issue 1 – December 2012 © Pearson Education Limited 2012 Edexcel Level 1 Award in Statistical Methods Overview Content overview This qualification contains: 1. Data 2. Displaying data 3. Calculating with data 4. Interpreting data 5. Probability UG031213 – Specification – Edexcel Level 1, Level 2 and Level 3 Award in Statistical Methods – Issue 1 – December 2012 © Pearson Education Limited 2012 7 Level 1 What students need to learn: Topic 1. Concepts and skills Data 1. Understand and use discrete, continuous and categorical data 2. Design and use simple data collection sheets for discrete and continuous data, using tallies including grouped frequencies 3. Criticise a question for a questionnaire 4. Understand reliability (including the significance of the number of trials) 2. Displaying data 1. Draw pictograms, bar charts, line graphs, dual bar charts, two-way tables, pie charts, simple timeseries graphs and scatter graphs 2. Identify simple misuse of visual representations 3. Calculating with data 1. Find totals, mean, mode, median and range for lists of data 2. Find range and mode from a stem and leaf diagram 4. Interpreting data 1. Read and interpret data presented in tables 2. Interpret pictograms, bar charts, line graphs, dual bar charts, twoway tables, pie charts, simple timeseries graphs, and scatter graphs 3. Find totals and modes from frequency tables or diagrams 4. Describe correlation in scatter graphs 5. Identify trend in time-series graphs 6. Compare data using frequencies, totals, mean, median, mode and range 7. Make comparisons and predictions from data and representations of data 8 UG031213 – Specification – Edexcel Level 1, Level 2 and Level 3 Award in Statistical Methods – Issue 1 – December 2012 © Pearson Education Limited 2012 Topic 5. Concepts and skills Probability 1. Use and interpret a probability scale 2. Write down theoretical/experimental probabilities ( 1 a and ) n n 3. Estimate probabilities from practical situations 4. Add two probabilities (including 1 p ) 5. List outcomes in theoretical and practical situations UG031213 – Specification – Edexcel Level 1, Level 2 and Level 3 Award in Statistical Methods – Issue 1 – December 2012 © Pearson Education Limited 2012 9 10 UG031213 – Specification – Edexcel Level 1, Level 2 and Level 3 Award in Statistical Methods – Issue 1 – December 2012 © Pearson Education Limited 2012 Edexcel Level 2 Award in Statistical Methods Overview Content overview This qualification contains: 1. Data 2. Displaying data 3. Calculating with data 4. Interpreting data 5. Probability All level 1 content is assumed knowledge and can be tested at level 2. UG031213 – Specification – Edexcel Level 1, Level 2 and Level 3 Award in Statistical Methods – Issue 1 – December 2012 © Pearson Education Limited 2012 11 Level 2 What students need to learn: All level 1 content is assumed knowledge and can be tested at level 2. Topic 1. 2. Concepts and skills Data Displaying data 1 Classify discrete, continuous and categorical data 2 Recognise the difference between a sample and a population and give a simple reason for sampling 3 Design a question for a questionnaire 4 Identify possible sources of bias in sampling methods 5 Calculate a stratified sample using one category 1. Draw composite bar charts, two-way tables and time-series graphs with or without moving averages, ordered and unordered stem and leaf diagrams, complete grouped frequency tables, frequency polygons, cumulative frequency diagrams, box plots, histograms (equal class interval) and sample space diagrams 2. Identify misuse of visual representations 3. Calculating with data 1. Calculate means for grouped and ungrouped data 2. Find the median, quartiles and interquartile ranges for grouped and ungrouped data 3. Calculate moving averages, combined means and fixed base index numbers 4. Calculate means and standard deviation 5. Understand and use summation notation in statistical calculations 12 UG031213 – Specification – Edexcel Level 1, Level 2 and Level 3 Award in Statistical Methods – Issue 1 – December 2012 © Pearson Education Limited 2012 Topic 4. Concepts and skills Interpreting data 1. Interpret and compare composite bar charts, frequency polygons, scatter diagrams, cumulative frequency diagrams and box plots, histograms with equal class intervals, and sample space diagrams. 2. Find the modal class interval from a frequency table or diagram 3. Find the class interval which contains the median 4. Identify outliers 5. Draw lines of best fit on scatter graphs and trend lines by eye with or without mean point 6. Identify and describe skew 7. Compare data using interquartile range, skew and standard deviation 8. Make comparisons and predictions from data and representations of data and describe trend 9. Interpret and compare moving averages and fixed base index numbers 5. Probability 1. Compare theoretical and experimental probabilities 2. Add two or more probabilities (including 1 p ) 3. Use sample space diagrams to calculate probabilities 4. Use probability to estimate outcomes 5. Multiply probabilities using tree diagrams UG031213 – Specification – Edexcel Level 1, Level 2 and Level 3 Award in Statistical Methods – Issue 1 – December 2012 © Pearson Education Limited 2012 13 14 UG031213 – Specification – Edexcel Level 1, Level 2 and Level 3 Award in Statistical Methods – Issue 1 – December 2012 © Pearson Education Limited 2012 Edexcel Level 3 Award in Statistical Methods Overview Content overview This qualification contains: 1. Data 2. Displaying data 3. Calculating with data 4. Interpreting data 5. Probability All level 2 content is assumed knowledge and can be tested at level 3. UG031213 – Specification – Edexcel Level 1, Level 2 and Level 3 Award in Statistical Methods – Issue 1 – December 2012 © Pearson Education Limited 2012 15 Level 3 What students need to learn: All level 2 content is assumed knowledge and can be tested at level 3. Topic 1. Concepts and skills Data 1. Understand and explain census, population, sampling frame, discrete, continuous, categorical, qualitative, quantitative, primary and secondary data 2. Calculate a stratified sample using two categories 3. Use Peterson’s capture and recapture method to estimate the size of populations 2. Displaying data 1. Draw back-to-back stem and leaf diagrams, box plots (with outliers) and generated from cumulative frequency graphs, histograms (unequal class intervals), sketch normal distributions and Venn diagrams 3. Calculating with data 1. Calculate geometric means, mean seasonal variation and moving base index numbers 2. Calculate means and standard deviations for grouped and ungrouped data, including using summation notation 3. Use LQ – 1.5 IQR and UQ + 1.5 IQR to identify outliers 4. Calculate measures of correlation including Spearman’s coefficient of rank correlation and Product-moment correlation coefficient (PMCC) 5. Calculate variances S xx , S yy and S xy from given information [NB Questions will state the expected formulae used to calculate variance: typically 1 Sxx = ∑x2 – n ( x) 2 or equivalent 6. Calculate standardised scores 16 UG031213 – Specification – Edexcel Level 1, Level 2 and Level 3 Award in Statistical Methods – Issue 1 – December 2012 © Pearson Education Limited 2012 Topic 4. Concepts and skills Interpreting data 1. Compare histograms and normal distributions 2. Identify and describe correlation in scatter graphs and interpret measures of correlation 3. Identify trend and seasonality in timeseries graphs (including moving averages) 4. Interpret and compare data using frequencies, totals, mean/median/mode/range, interquartile range, skew and standard deviation and standardised scores 5. Interpret and compare geometric means and chain base index numbers 6. Interpret back to back stem and leaf diagrams, box plots with outliers, venn diagrams, and data from a variety of representations to solve a problem 5. Probability 1. Use probability and relative frequency to estimate outcomes or make predictions 2. Use sample space and Venn diagrams to calculate probabilities 3. Multiply and add probabilities using tree diagrams 4. Understand mutually exclusive and independent events, that P(A or B) = P(A) + P(B) 5. Use P(A and B) = P(A) P(B) for independent events A and B P(A or B) = P(A B) = P(A) + P(B) – P(A B) 6. Find conditional probabilities and use P(AB) = 7. Identify and calculate binomial probabilities 8. Find probabilities using standard normal distribution tables UG031213 – Specification – Edexcel Level 1, Level 2 and Level 3 Award in Statistical Methods – Issue 1 – December 2012 © Pearson Education Limited 2012 17 18 UG031213 – Specification – Edexcel Level 1, Level 2 and Level 3 Award in Statistical Methods – Issue 1 – December 2012 © Pearson Education Limited 2012 Assessment Assessment summary Level 1 Paper code: AST10 One written examination paper. The paper is assessed through a 1 hour and 30 minute examination, set and marked by Edexcel. The total number of marks for the paper is 80. The qualification is awarded at pass or unclassified. Level 2 Paper code: AST20 One written examination paper. The paper is assessed through a 1 hour and 30 minute examination, set and marked by Edexcel. The total number of marks for the paper is 80. The qualification is awarded pass or unclassified. Level 3 Paper code: AST30 One written examination paper. The paper is assessed through a 2 hour examination, set and marked by Edexcel. The total number of marks for the paper is 90. The qualification is awarded pass or unclassified. UG031213 – Specification – Edexcel Level 1, Level 2 and Level 3 Award in Statistical Methods – Issue 1 – December 2012 © Pearson Education Limited 2012 19 Assessment Objectives and weightings Level 1 % in Award AO1: Demonstrate knowledge, understanding and skills in collecting and representing data 25%–35% AO2: Demonstrate understanding, knowledge, and skills in performing statistical calculations 15%–25% AO3: Demonstrate understanding, knowledge, and skills in interpreting and discussing data 20%–30% AO4: Demonstrate understanding, knowledge, and skills in probability 20%–30% TOTAL 100% Level 2 % in Award AO1: Demonstrate knowledge, understanding and skills in collecting and representing data 25%-35% AO2: Demonstrate understanding, knowledge, and skills in performing statistical calculations 25%-35% AO3: Demonstrate understanding, knowledge, and skills in interpreting and discussing data 15%–25% AO4: Demonstrate understanding, knowledge, and skills in probability 15%–25% TOTAL 100% Level 3 % in Award AO1: Demonstrate knowledge, understanding and skills in collecting and representing data 20%–30% AO2: Demonstrate understanding, knowledge, and skills in performing statistical calculations 25%–35% AO3: Demonstrate understanding, knowledge, and skills in interpreting and discussing data 10%–20% AO4: Demonstrate understanding, knowledge, and skills in probability 25%–35% TOTAL 20 100% UG031213 – Specification – Edexcel Level 1, Level 2 and Level 3 Award in Statistical Methods – Issue 1 – December 2012 © Pearson Education Limited 2012 Relationship of assessment objectives to papers Paper number Assessment objective AO1 AO2 AO3 AO4 Total for AO1, AO2 and AO3 and AO4 Level 1 25–35% 15—25% 20–30% 20-30% 100% Level 2 25–35% 25–35% 15-25% 15-25% 100% Level 3 20–30% 25-35% 10–20% 25-35% 100% Entering your students for assessment Student entry Students are entered at either level 1, level 2 or level 3. Details of how to enter students for this qualification can be found in Edexcel’s Information Manual, copies of which (in CD format) are sent to all active Edexcel centres. The information can also be found on Edexcel’s website: www.edexcel.com Access arrangements and special considerations Edexcel’s policy on access arrangements and special considerations for GCE, GCSE, International GCSE, and Entry Level qualifications aims to enhance access to the qualifications for students with disabilities and other difficulties without compromising the assessment of skills, knowledge, understanding or competence. The access arrangements and special arrangements for these qualifications will comply with this policy. Please see the Edexcel website (www.edexcel.com/sfc) for: the Joint Council for Qualifications (JCQ) policy Access Arrangements, Reasonable Adjustments and Special Considerations 2010-2011 the forms to submit for requests for access arrangements and special considerations dates for submission of the forms. Requests for access arrangements and special considerations must be addressed to: Special Requirements Edexcel One90 High Holborn London WC1V 7BH UG031213 – Specification – Edexcel Level 1, Level 2 and Level 3 Award in Statistical Methods – Issue 1 – December 2012 © Pearson Education Limited 2012 21 Assessing your students The first assessment opportunity for these qualifications will take place in the June 2013 series and in each January and June series thereafter for the lifetime of the qualifications. Your students’ assessment opportunities All papers June 2013 January 2014 June 2014 January 2015 Level 1, Level 2 and Level 3 Awarding and reporting The awarding and certification processes for these qualifications will comply with the current GCSE/GCE Code of Practice, which is published by the Office of Qualifications and Examinations Regulation (Ofqual). The Level 1, Level 2 and Level 3 Awards qualifications will be pass only. The first certification opportunity for the Edexcel Level 1, Level 2 and Level 3 Awards in Statistical Methods will be June 2013. Students whose level of achievement is below the minimum judged by Edexcel to be of sufficient standard to be recorded on a certificate will receive an unclassified (U) result. Language of assessment Assessment of this qualification will be available in English only. Assessment materials will be published in English only and all work submitted for examination must be produced in English. Malpractice and plagiarism For up-to-date advice on malpractice and plagiarism, please refer to the JCQ’s Suspected Malpractice in Examinations: Policies and Procedures document on the JCQ website: www.jcq.org.uk. 22 UG031213 – Specification – Edexcel Level 1, Level 2 and Level 3 Award in Statistical Methods – Issue 1 – December 2012 © Pearson Education Limited 2012 Student recruitment Edexcel’s access policy concerning recruitment to our qualifications is that: they must be available to anyone who is capable of reaching the required standard they must be free from barriers that restrict access and progression equal opportunities exist for all students. Prior learning For Level 1 and Level 2, these qualifications build on the content, knowledge and skills developed in the Key Stage 3 Programme of Study for Mathematics as defined by the National Curriculum Orders for England. For Level 3, this qualification builds on the content, knowledge and skills taught as part of GCSE mathematics. Guided learning hours The number of guided learning hours (GLH) required for these qualifications is 60-70 GLH. These qualifications can be co-taught as part of other mathematics programmes, so the delivery time allocated may be more or less than this, according to delivery plans and individual learner needs. UG031213 – Specification – Edexcel Level 1, Level 2 and Level 3 Award in Statistical Methods – Issue 1 – December 2012 © Pearson Education Limited 2012 23 Progression At Level 1 and Level 2, these qualifications support progression to: GCSE in Mathematics GCSE in Statistics further level 2 qualifications in numerate disciplines, such as the sciences and geography further education or employment where statistical skills are required. At Level 3, this qualification supports progression to: GCE AS and A Level Mathematics further level 3 qualifications in numerate disciplines, such as psychology and geography. further education or employment where statistical skills are required. Level descriptors The following level descriptors indicate the level of attainment characteristic of the given level. They give a general indication of the required learning outcomes at each specified level. The descriptors should be interpreted in relation to the content outlined in the specification; they are not designed to define that content. The level awarded will depend in practice upon the extent to which the candidate has met the Assessment Objectives overall. Shortcomings in some aspects of the examination may be balanced by better performance in others. Level 1 Candidates understand and use the mean of discrete data. They choose suitable methods to represent data. They compare two simple distributions using the range and one of the mode, median or mean. They interpret graphs and diagrams, including pie charts, and draw conclusions. They understand and use the probability scale from 0 to 1. Candidates make and justify estimates of probability by selecting and using a method based on equally likely outcomes or on experimental evidence as appropriate. They understand that different outcomes may result from repeating an experiment. 24 UG031213 – Specification – Edexcel Level 1, Level 2 and Level 3 Award in Statistical Methods – Issue 1 – December 2012 © Pearson Education Limited 2012 Level 2 Candidates understand sampling and design questions for questionnaires. They construct and interpret frequency diagrams. They determine the modal class and estimate the mean, median of a set of grouped data, selecting the statistic most appropriate to a line of enquiry. They use measures of average and range with associated frequency polygons, as appropriate, to compare distributions and make inferences. They use and understand moving averages, cumulative frequency, stem and leaf diagrams, index numbers, probability tree diagrams and sample space diagrams. Candidates understand relative frequency as an estimate of probability and use this to compare outcomes of experiments. Level 3 Candidates are increasingly sophisticated in their handling of data. They use stratified sampling, histograms with unequal class intervals, back-to-back stem and leaf diagrams, outliers, seasonal variation and chain base index numbers. They calculate standard deviation, geometric means, Spearman’s coefficient of rank correlation and product moment correlation coefficient. They use Venn Diagrams and the Normal distribution. Candidates interpret and construct histograms. They recognise when and how to work with probabilities associated with independent and mutually exclusive events and they find conditional probabilities. UG031213 – Specification – Edexcel Level 1, Level 2 and Level 3 Award in Statistical Methods – Issue 1 – December 2012 © Pearson Education Limited 2012 25 Support and training Edexcel support services Edexcel has a wide range of support services to help you implement this qualification successfully. ResultsPlus – ResultsPlus is an application launched by Edexcel to help subject teachers, senior management teams, and students by providing detailed analysis of examination performance. Reports that compare performance between subjects, classes, your centre and similar centres can be generated in ‘one-click’. Skills maps that show performance according to the specification topic being tested are available for some subjects. For further information about which subjects will be analysed through ResultsPlus, and for information on how to access and use the service, please visit www.edexcel.com/resultsplus. Ask the Expert – To make it easier for you to raise a query with us online, we have merged our Ask Edexcel and Ask the Expert services. There is now one easy-to-use web query form that will allow you to ask any question about the delivery or teaching of Edexcel qualifications. You’ll get a personal response, from one of our administrative or teaching experts, sent to the email address you provide. We’ll also be doing lots of work to improve the quantity and quality of information in our FAQ database, so you’ll be able find answers to many questions you might have by searching before you submit the question to us. Examzone – The Examzone site is aimed at students sitting external examinations and gives information on revision, advice from examiners and guidance on results, including remarking, resitting and progression opportunities. Further services for students – many of which will also be of interest to parents – will be available in the near future. Links to this site can be found on the main homepage at www.examzone.co.uk. Training A programme of professional development and training courses, covering various aspects of the specification and examination, will be arranged by Edexcel. Full details can be obtained from our website: www.edexcel.com 26 UG031213 – Specification – Edexcel Level 1, Level 2 and Level 3 Award in Statistical Methods – Issue 1 – December 2012 © Pearson Education Limited 2012 Appendices Appendix 1: Calculators 29 Appendix 2: Wider curriculum 31 Appendix 3: Codes 33 Appendix 4: Normal Distribution Tables 35 Appendix 5: Mapping of the Level 1 Award content to GCSE Mathematics content 37 Appendix 6: Mapping of the Level 1 Award content to GCSE Statistics content 43 Appendix 7: Mapping of the Level 2 Award content to GCSE Mathematics content 47 Appendix 8: Mapping of Level 2 Award content to GCSE Statistics content 55 Appendix 9: Mapping of Level 3 Award content to GCE Mathematics Statistics 1 (S1) unit content 61 UG031213 – Specification – Edexcel Level 1, Level 2 and Level 3 Award in Statistical Methods – Issue 1 – December 2012 © Pearson Education Limited 2012 27 28 UG031213 – Specification – Edexcel Level 1, Level 2 and Level 3 Award in Statistical Methods – Issue 1 – December 2012 © Pearson Education Limited 2012 Appendix 1: Calculators The range of functions on calculators is increasing all the time. Current models can be used to answer questions on a number of topics, including fractions. It would clearly be unfair if sophisticated calculators gave candidates an advantage in the examination. In addition to ensuring fairness to candidates, another of our aims as examiners is to encourage good classroom practice. Appropriate and efficient use of calculators is desirable but reliance on them at the expense of understanding and learning mathematical techniques is not. UG031213 – Specification – Edexcel Level 1, Level 2 and Level 3 Award in Statistical Methods – Issue 1 – December 2012 © Pearson Education Limited 2012 29 30 UG031213 – Specification – Edexcel Level 1, Level 2 and Level 3 Award in Statistical Methods – Issue 1 – December 2012 © Pearson Education Limited 2012 Appendix 2: Wider curriculum Signposting and development suggestions Issue Paper Opportunities for development Spiritual All papers Moral All papers Ethical All papers Social All papers Legislative All papers Economic All papers Cultural All papers These qualifications will enable centres to provide courses in mathematics that will allow students to discriminate between truth and falsehood. As students explore mathematical models of the real world there will be many naturally arising moral and cultural issues, environmental and health and safety considerations and aspects of European developments for discussion, for example: Sustainable All papers use and abuse of statistics in the media Health and safety All papers financial and business mathematics European initiatives All papers how mathematics is used to communicate climate change cultural and historical roots of mathematics use of mathematics in cultural symbols and patterns. UG031213 – Specification – Edexcel Level 1, Level 2 and Level 3 Award in Statistical Methods – Issue 1 – December 2012 © Pearson Education Limited 2012 31 32 UG031213 – Specification – Edexcel Level 1, Level 2 and Level 3 Award in Statistical Methods – Issue 1 – December 2012 © Pearson Education Limited 2012 Appendix 3: Codes Type of code Use of code Code number National Qualifications Framework (NQF) codes Each qualification title is allocated a National Qualifications Framework (NQF) code. The QNs for the qualifications in this publication are: The National Qualifications Framework (NQF) code is known as a Qualification Number (QN). This is the code that features in the DfE Funding Schedule, Section 96, and is to be used for all qualification funding purposes. The QN is the number that will appear on the student’s final certification documentation. Level 1: 600/7262/3 The cash-in code is used as an entry code to aggregate the student’s scores to obtain the overall grade for the qualification. Centres will need to use the entry codes only when entering students for their qualification. Level 1: AST10 The entry codes are used to: Please refer to the Information Manual, available on the Edexcel website. Cash-in codes Entry codes enter a student for assessment aggregate the student’s paper scores to obtain the overall grade for the qualification. Level 2: 600/7264/7 Level 3: 600/7266/0 Level 2: AST20 Level 3: AST30 UG031213 – Specification – Edexcel Level 1, Level 2 and Level 3 Award in Statistical Methods – Issue 1 – December 2012 © Pearson Education Limited 2012 33 34 UG031213 – Specification – Edexcel Level 1, Level 2 and Level 3 Award in Statistical Methods – Issue 1 – December 2012 © Pearson Education Limited 2012 Appendix 4: Normal Distribution Tables These tables are included in the paper for the Level 3 Award in Statistical Methods. THE NORMAL DISTRIBUTION FUNCTION z The function tabulated below is (z), defined as (z) = 1 12 t 2 dt . e 2 z (z) z (z) z (z) z (z) 0.00 0.5000 0.50 0.6915 1.00 0.8413 1.50 0.9332 2.00 0.9772 0.01 0.5040 0.51 0.6950 1.01 0.8438 1.51 0.9345 2.02 0.9783 0.02 0.5080 0.52 0.6985 1.02 0.8461 1.52 0.9357 2.04 0.9793 0.03 0.5120 0.53 0.7019 1.03 0.8485 1.53 0.9370 2.06 0.9803 0.04 0.5160 0.54 0.7054 1.04 0.8508 1.54 0.9382 2.08 0.9812 0.05 0.5199 0.55 0.7088 1.05 0.8531 1.55 0.9394 2.10 0.9821 0.06 0.5239 0.56 0.7123 1.06 0.8554 1.56 0.9406 2.12 0.9830 0.07 0.5279 0.57 0.7157 1.07 0.8577 1.57 0.9418 2.14 0.9838 0.08 0.5319 0.58 0.7190 1.08 0.8599 1.58 0.9429 2.16 0.9846 0.09 0.5359 0.59 0.7224 1.09 0.8621 1.59 0.9441 2.18 0.9854 0.10 0.5398 0.60 0.7257 1.10 0.8643 1.60 0.9452 2.20 0.9861 0.11 0.5438 0.61 0.7291 1.11 0.8665 1.61 0.9463 2.22 0.9868 0.12 0.5478 0.62 0.7324 1.12 0.8686 1.62 0.9474 2.24 0.9875 0.13 0.5517 0.63 0.7357 1.13 0.8708 1.63 0.9484 2.26 0.9881 0.14 0.5557 0.64 0.7389 1.14 0.8729 1.64 0.9495 2.28 0.9887 0.15 0.5596 0.65 0.7422 1.15 0.8749 1.65 0.9505 2.30 0.9893 0.16 0.5636 0.66 0.7454 1.16 0.8770 1.66 0.9515 2.32 0.9898 0.17 0.5675 0.67 0.7486 1.17 0.8790 1.67 0.9525 2.34 0.9904 0.18 0.5714 0.68 0.7517 1.18 0.8810 1.68 0.9535 2.36 0.9909 0.19 0.5753 0.69 0.7549 1.19 0.8830 1.69 0.9545 2.38 0.9913 0.20 0.5793 0.70 0.7580 1.20 0.8849 1.70 0.9554 2.40 0.9918 0.21 0.5832 0.71 0.7611 1.21 0.8869 1.71 0.9564 2.42 0.9922 0.22 0.5871 0.72 0.7642 1.22 0.8888 1.72 0.9573 2.44 0.9927 0.23 0.5910 0.73 0.7673 1.23 0.8907 1.73 0.9582 2.46 0.9931 z UG031213 – Specification – Edexcel Level 1, Level 2 and Level 3 Award in Statistical Methods – Issue 1 – December 2012 © Pearson Education Limited 2012 (z) 35 z (z) z (z) z (z) z (z) 0.24 0.5948 0.74 0.7704 1.24 0.8925 1.74 0.9591 2.48 0.9934 0.25 0.5987 0.75 0.7734 1.25 0.8944 1.75 0.9599 2.50 0.9938 0.26 0.6026 0.76 0.7764 1.26 0.8962 1.76 0.9608 2.55 0.9946 0.27 0.6064 0.77 0.7794 1.27 0.8980 1.77 0.9616 2.60 0.9953 0.28 0.6103 0.78 0.7823 1.28 0.8997 1.78 0.9625 2.65 0.9960 0.29 0.6141 0.79 0.7852 1.29 0.9015 1.79 0.9633 2.70 0.9965 0.30 0.6179 0.80 0.7881 1.30 0.9032 1.80 0.9641 2.75 0.9970 0.31 0.6217 0.81 0.7910 1.31 0.9049 1.81 0.9649 2.80 0.9974 0.32 0.6255 0.82 0.7939 1.32 0.9066 1.82 0.9656 2.85 0.9978 0.33 0.6293 0.83 0.7967 1.33 0.9082 1.83 0.9664 2.90 0.9981 0.34 0.6331 0.84 0.7995 1.34 0.9099 1.84 0.9671 2.95 0.9984 0.35 0.6368 0.85 0.8023 1.35 0.9115 1.85 0.9678 3.00 0.9987 0.36 0.6406 0.86 0.8051 1.36 0.9131 1.86 0.9686 3.05 0.9989 0.37 0.6443 0.87 0.8078 1.37 0.9147 1.87 0.9693 3.10 0.9990 0.38 0.6480 0.88 0.8106 1.38 0.9162 1.88 0.9699 3.15 0.9992 0.39 0.6517 0.89 0.8133 1.39 0.9177 1.89 0.9706 3.20 0.9993 0.40 0.6554 0.90 0.8159 1.40 0.9192 1.90 0.9713 3.25 0.9994 0.41 0.6591 0.91 0.8186 1.41 0.9207 1.91 0.9719 3.30 0.9995 0.42 0.6628 0.92 0.8212 1.42 0.9222 1.92 0.9726 3.35 0.9996 0.43 0.6664 0.93 0.8238 1.43 0.9236 1.93 0.9732 3.40 0.9997 0.44 0.6700 0.94 0.8264 1.44 0.9251 1.94 0.9738 3.50 0.9998 0.45 0.6736 0.95 0.8289 1.45 0.9265 1.95 0.9744 3.60 0.9998 0.46 0.6772 0.96 0.8315 1.46 0.9279 1.96 0.9750 3.70 0.9999 0.47 0.6808 0.97 0.8340 1.47 0.9292 1.97 0.9756 3.80 0.9999 0.48 0.6844 0.98 0.8365 1.48 0.9306 1.98 0.9761 3.90 1.0000 0.49 0.6879 0.99 0.8389 1.49 0.9319 1.99 0.9767 4.00 1.0000 0.50 0.6915 1.00 0.8413 1.50 0.9332 2.00 0.9772 36 z (z) UG031213 – Specification – Edexcel Level 1, Level 2 and Level 3 Award in Statistical Methods – Issue 1 – December 2012 © Pearson Education Limited 2012 Design an experiment or survey Identify possible sources of bias SP c SP b in Statistical Methods – Issue 1 – December 2012 © Pearson Education Limited 2012 UG031213 – Specification – Edexcel Level 1, Level 2 and Level 3 Award the number of trials) (including the significance of 4. Understand reliability questionnaire 3. Criticise a question for a frequencies tallies including grouped and continuous data, using collection sheets for discrete 2. Design and use simple data data Understand how different sample sizes may affect the reliability of conclusions drawn Discuss how data relates to a problem, identify possible sources of bias and plan to minimise it Understand how sources of data may be biased Design a question for a questionnaire Understand sample and population Consider fairness Identify which primary data they need to collect and in what format, including grouped data Criticise questions for a questionnaire Group discrete and continuous data into class intervals of equal width Design data-collection sheets distinguishing between different types of data SP d 1. Understand and use discrete, 1. Data Sort, classify and tabulate data and discrete or continuous quantitative data Content descriptor Ref Concepts and skills Topic continuous and categorical Concepts and skills Design and use data-collection sheets for grouped, discrete and continuous data GCSE Mathematics – Statistics content Level 1 Award in Statistical Methods Higher tier GCSE content is shown in bold Progression opportunities are shown in green Appendix 5: Mapping of the Level 1 Award content to GCSE Mathematics content 37 38 3. Calculating with data diagram from a stem and leaf 2. Find range and mode range for lists of data mode, median and 1. Find totals, mean, representations of visual 2. Identify simple misuse graphs graphs and scatter simple time-series tables, pie charts, bar charts, two-way charts, line graphs, dual SP i SP h SP h Find the median for large data sets with grouped data Find the range, mode, median and greatest and least values from stem and leaf diagrams UG031213 – Specification – Edexcel Level 1, Level 2 and Level 3 Award Estimate the mean of grouped data using the mid-interval value Estimate the mean for large data sets with grouped data Calculate: mean, mode, median, range, modal class, interval containing the median in Statistical Methods – Issue 1 – December 2012 © Pearson Education Limited 2012 Interpret a wide range of graphs and diagrams and draw conclusions Calculate median, mean, range, mode and modal class Produce charts and diagrams for various data types SP g 1. Draw pictograms, bar 2. Displaying Data Concepts and skills Content descriptor Ref Concepts and skills Topic Produce: Pictograms, composite bar charts, comparative and dual bar charts, pie charts, histograms with equal class intervals, frequency diagrams for grouped discrete data, line graphs, scatter graphs, frequency polygons for grouped data, ordered stem and leaf diagrams GCSE Mathematics – Statistics content Level 1 Award in Statistical Methods SP k SP i SP i Recognise correlation and draw and/or use lines of best fit by eye, understanding what these represent Interpret a wide range of graphs and diagrams and draw conclusions Interpret a wide range of graphs and diagrams and draw conclusions in Statistical Methods – Issue 1 – December 2012 © Pearson Education Limited 2012 Distinguish between positive, negative and zero correlation using lines of best fit Use a line of best fit to predict values of one variable given values of the other variable Interpret scatter graphs in terms of the relationship between two variables Interpret correlation in terms of the problem Understand that correlation does not imply causality Draw lines of best fit by eye, understanding what these represent From pictograms, bar charts, line graphs, frequency polygons, frequency diagrams and histograms with equal class intervals: read off frequency values, calculate total population, find greatest and least values Interpret: composite bar charts, comparative and dual bar charts, pie charts, stem and leaf diagrams, scatter graphs, frequency polygons Extract data from lists and tables Extract data from printed tables and lists UG031213 – Specification – Edexcel Level 1, Level 2 and Level 3 Award in scatter graphs 4. Describe correlation diagrams frequency tables or modes from 3. Find totals and graphs graphs, and scatter simple time-series tables, pie charts, charts, two-way graphs, dual bar bar charts, line 2. Interpret pictograms, tables data presented in SP e 1. Read and interpret 4. Interpreting Data Concepts and skills Ref Concepts and skills Topic Content descriptor GCSE Mathematics – Statistics content Level 1 Award in Statistical Methods 39 40 (continued) data representations of data and and predictions from 7. Make comparisons and range mean, median, mode frequencies, totals, 6. Compare data using time-series graphs SP k SP l SP l 5. Identify trend in 4. Interpreting Data Compare the mean and range of two distributions, or median and interquartile range, as appropriate Compare distributions and make inferences, using the shapes of distributions and measures of average and spread, including median and quartiles Compare the mean and range of two distributions, or median and interquartile range, as appropriate Use dual or comparative bar charts to compare distributions Compare the measures of spread between a pair of box plots/cumulative frequency graphs Use a line of best fit, or otherwise, to predict values of one variable given values of the other variable UG031213 – Specification – Edexcel Level 1, Level 2 and Level 3 Award Compare distributions and make inferences, using the shapes of distributions and measures of average and spread, including median and quartiles in Statistical Methods – Issue 1 – December 2012 © Pearson Education Limited 2012 Recognise correlation and draw and/or use lines of best fit by eye, understanding what these represent Compare distributions and make inferences Compare distributions and make inferences Concepts and skills Ref Concepts and skills Topic Content descriptor GCSE Mathematics – Statistics content Level 1 Award in Statistical Methods and ) List all outcomes for single events, and for two successive events, in a systematic way and derive relative probabilities in Statistical Methods – Issue 1 – December 2012 © Pearson Education Limited 2012 UG031213 – Specification – Edexcel Level 1, Level 2 and Level 3 Award situations theoretical and practical 5. List outcomes in (including 1 − p) 4. Add two probabilities from practical situations 3. Estimate probabilities probabilities ( theoretical/experimental SP o Understand and use estimates or measures of probability from theoretical models (including equally likely outcomes), or from relative frequency SP n 2. Write down Identify different mutually exclusive outcomes and know that the sum of the probabilities of all these outcomes is 1 Understand and use the vocabulary of probability and probability scale SP m 1. Use and interpret a 5. Probability SP p Content descriptor Ref Concepts and skills Topic probability scale GCSE Mathematics – Statistics content Level 1 Award in Statistical Methods Find the probability of an event happening using theoretical probability Find the probability of an event happening using relative frequency Estimate the number of times an event will occur, given the probability and the number of trials Use theoretical models to include outcomes using dice, spinners, coins List all outcomes for single events systematically Find a missing probability from a list or table Use and draw sample space diagrams List all outcomes for two successive events systematically Use 1 − p as the probability of an event not occurring where p is the probability of the event occurring Identify different mutually exclusive outcomes and know that the sum of the probabilities of all these outcomes is 1 41 Write probabilities in words, fractions, decimals and percentages Add simple probabilities Mark events and/or probabilities on a probability scale of 0 to 1 Distinguish between events which are; impossible, unlikely, even chance, likely, and certain to occur Concepts and skills 42 UG031213 – Specification – Edexcel Level 1, Level 2 and Level 3 Award in Statistical Methods – Issue 1 – December 2012 © Pearson Education Limited 2012 Types of data 1. Understand and use discrete, 1. Data Understand and use measures of probability from a theoretical perspective and from a limiting frequency or experimental approach. Formal definition and notation of a limit will not be required but terminology such as ‘as the number of trials increases’ is expected. in Statistical Methods – Issue 1 – December 2012 © Pearson Education Limited 2012 Understand the aspects of accuracy, reliability, relevance and bias as related to secondary data. Questioning the reliability of secondary sources and data is expected. Construct frequency tables by tallying raw data where appropriate Processing, representing and analysing data Collecting data Design and use efficient and effective data capture sheets and methods of recording data Collecting data UG031213 – Specification – Edexcel Level 1, Level 2 and Level 3 Award the number of trials) (including the significance of 4. Understand reliability questionnaire 3. Criticise a question for a frequencies tallies including grouped and continuous data, using collection sheets for discrete 2. Design and use simple data data continuous and categorical Concepts and skills Content descriptor Concepts and skills Topic Recognise the difference between discrete and continuous data GCSE Statistics content Level 1 Award in Statistical Methods Higher tier GCSE content is shown in bold Progression opportunities are shown in green Appendix 6: Mapping of the Level 1 Award content to GCSE Statistics content 43 44 with data 3. Calculating stem and leaf diagram 2. Find range and mode from a data median and range for lists of 1. Find totals, mean, mode, visual representations 2. Identify simple misuse of and scatter graphs simple time-series graphs two-way tables, pie charts, line graphs, dual bar charts, Diagrams and representations Measures of dispersion Diagrams and representations Draw, use and understand stem and leaf diagrams for discrete and continuous data in Statistical Methods – Issue 1 – December 2012 © Pearson Education Limited 2012 UG031213 – Specification – Edexcel Level 1, Level 2 and Level 3 Award Work out and use the range for data presented in a list or frequency distribution The potential for visual misuse, by omission or misrepresentation. Knowledge of causes such as unrepresentative scales is expected. Work out and use the mean, mode and median of raw data presented as a list Understand the distinction between well-presented and poorly presented data. Poorly presented data can be misleading. stem and leaf diagrams for discrete and continuous data, scatter diagrams for bivariate data, line graphs and time series, choropleth maps (shading) for continuous data: pie charts, histograms with equal class intervals, frequency diagrams, cumulative frequency diagrams, population pyramids vertical line (stick) graphs for discrete data pictograms, bar charts, multiple or composite bar charts and pie charts for qualitative, quantitative and discrete data Diagrams and representations 1. Draw pictograms, bar charts, 2. Displaying data Concepts and skills Content descriptor Concepts and skills Topic Draw, use and understand: GCSE Statistics content Level 1 Award in Statistical Methods median, mode and range frequencies, totals, mean, 6. Compare data using graphs 5. Identify trend in time-series scatter graphs 4. Describe correlation in frequency tables or diagrams 3. Find totals and modes from graphs, and scatter graphs charts, simple time-series charts, two-way tables, pie charts, line graphs, dual bar 2. Interpret pictograms, bar presented in tables in Statistical Methods – Issue 1 – December 2012 © Pearson Education Limited 2012 Calculate and use appropriate moving averages Measures of dispersion Plot points as a time series; draw a trend line by eye and use it to make a prediction Time series Use an appropriate measure of central tendency, together with range, quartiles, interquartile range and percentiles to compare distributions of data. Identify and discuss the significance of seasonal variation by inspecting time series graphs Interpret correlation as a measure of the strength of the association between two variables. The use of words such as ‘weak’ or ‘strong’ are expected. Recognise positive, negative and zero linear correlation by inspection Scatter diagrams and correlation Interpret all forms of statistical tables, diagrams and graphs Read and interpret data presented in tabular or graphical form Work out the mean, mode and median for discrete data presented as a frequency distribution. Graphical and other methods for the median are expected. Measures of central tendency Reasoning, interpreting and discussing results Processing, representing and analysing data UG031213 – Specification – Edexcel Level 1, Level 2 and Level 3 Award Data 1. Read and interpret data 4. Interpreting descriptor Content Concepts and skills Topic Concepts and skills GCSE Statistics content Level 1 Award in Statistical Methods 45 Compare distributions of data and make comparisons using measures of central tendency, measures of dispersion and percentiles. The shapes of distributions and graphs may be used. Use interpolation and extrapolation and understand the pitfalls. Particularly the problem of extrapolating beyond the range. Plot points as a time series; draw a trend line by eye and use it to make a prediction Make predictions. The use of a trend line by eye, drawing or formula will be expected. Reasoning, interpreting and discussing results Scatter diagrams and correlation Time series Reasoning, interpreting and discussing results 7. Make comparisons and predictions from data and representations of data 4. Interpreting Data (continued) in Statistical Methods – Issue 1 – December 2012 © Pearson Education Limited 2012 UG031213 – Specification – Edexcel Level 1, Level 2 and Level 3 Award Concepts and skills Content descriptor Concepts and skills Topic 46 GCSE Statistics content Level 1 Award in Statistical Methods Design an experiment or survey Identify possible sources of bias Design an experiment or survey SP b SP c Design an experiment or survey Assumed Knowledge SP c SP c in Statistical Methods – Issue 1 – December 2012 © Pearson Education Limited 2012 UG031213 – Specification – Edexcel Level 1, Level 2 and Level 3 Award one category 5. Calculate a stratified sample using bias in sampling methods 4. Identify possible sources of questionnaire 3. Design a question for a a simple reason for sampling sample and a population and give 2. Recognise the difference between a categorical data 1. Classify discrete, continuous and 1. Data Consider fairness Use stratified sampling Select and justify a sampling scheme and a method to investigate a population, including random and stratified sampling Design an experiment or survey Understand how different sample sizes may affect the reliability of conclusions drawn Discuss how data relates to a problem, identify possible sources of bias and plan to minimise it Understand how sources of data may be biased Criticise questions for a questionnaire Design a question for a questionnaire Identify which primary data they need to collect and in what format, including grouped data Understand sample and population Concepts and skills Ref Concepts and skills Topic Content descriptor GCSE Mathematics – Statistics content Level 2 Award in Statistical Methods Higher tier GCSE content is shown in bold Progression opportunities are shown in green Appendix 7: Mapping of the Level 2 Award content to GCSE Mathematics content 47 48 representations 2. Identify misuse of visual diagrams class interval) and sample space box plots, histograms (equal cumulative frequency diagrams, diagrams, frequency polygons, averages, stem and leaf graphs with or without moving way tables and time-series 1. Draw composite bar charts, two- space diagrams (equal class interval) and sample diagrams, box plots, histograms polygons, cumulative frequency frequency tables, frequency diagrams, complete grouped unordered stem and leaf averages, ordered and graphs with or without moving Produce: Composite bar charts, comparative and dual bar charts, pie charts, histograms with equal class intervals, frequency diagrams for grouped discrete data, scatter graphs, line graphs, frequency polygons for grouped data, grouped frequency tables for continuous data, ordered stem and leaf diagrams, cumulative frequency tables, cumulative frequency graphs, box plots from raw data and when given quartiles and median, histograms from class intervals with unequal width Use and understand frequency density in Statistical Methods – Issue 1 – December 2012 © Pearson Education Limited 2012 UG031213 – Specification – Edexcel Level 1, Level 2 and Level 3 Award Produce charts and diagrams for various data types Produce charts and diagrams for various data types SP g 1. Draw composite bar charts, two- 2. Displaying data SP g Use and understand frequency density Content descriptor Ref Concepts and skills Topic way tables and time-series Concepts and skills Produce: Composite bar charts, comparative and dual bar charts, pie charts, histograms with equal class intervals, frequency diagrams for grouped discrete data, scatter graphs, line graphs, frequency polygons for grouped data, grouped frequency tables for continuous data, ordered stem and leaf diagrams, cumulative frequency tables, cumulative frequency graphs, box plots from raw data and when given quartiles and median, histograms from class intervals with unequal width GCSE Mathematics – Statistics content Level 2 Award in Statistical Methods Estimate the mean of grouped data using the midinterval value Estimate the mean for large data sets with grouped data Calculate: mean, mode, median, range, modal class, the interval which contains the median Find the median, quartiles and interquartile range for large data sets with grouped data Use cumulative frequency graphs to find median, quartiles and interquartile range Interpret box plots to find median, quartiles, range and interquartile range Calculate median, mean, range, quartiles and interquartile range, mode and modal class SP h in Statistical Methods – Issue 1 – December 2012 © Pearson Education Limited 2012 UG031213 – Specification – Edexcel Level 1, Level 2 and Level 3 Award calculations notation in statistical 5. Understand and use summation deviation 4. Calculate means and standard index numbers combined means and fixed base 3. Calculate moving averages, and ungrouped data interquartile ranges for grouped 2. Find the median, quartiles and and ungrouped data Calculate: mean, mode, median, range, modal class, interval containing the median Calculate median, mean, range, mode and modal class SP h 1. Calculate means for grouped 3. Calculating with data Concepts and skills Ref Concepts and skills Topic Content descriptor GCSE Mathematics – Statistics content Level 2 Award in Statistical Methods 49 50 point by eye with or without mean scatter graphs and trend lines 5. Draw lines of best fit on 4. Identify outliers contains the median 3. Find the class interval which diagram from a frequency table or 2. Find the modal class interval space diagrams. class intervals, and sample plots, histograms with equal frequency diagrams and box diagrams, cumulative frequency polygons, scatter Distinguish between positive, negative and zero correlation using lines of best fit Use a line of best fit to predict values of one variable given values of the other variable Interpret scatter graphs in terms of the relationship between two variables Interpret correlation in terms of the problem Understand that correlation does not imply causality Draw lines of best fit by eye, understanding what these represent Calculate: mean, mode, median, range, modal class, the interval which contains the median Calculate: mean, mode, median, range, modal class, the interval which contains the median in Statistical Methods – Issue 1 – December 2012 © Pearson Education Limited 2012 UG031213 – Specification – Edexcel Level 1, Level 2 and Level 3 Award Recognise correlation and draw and/or use lines of best fit by eye, understanding what these represent Calculate median, mean, range, quartiles and interquartile range, mode and modal class SP h SP k Calculate median, mean, range, quartiles and interquartile range, mode and modal class SP h Interpret a wide range of graphs and diagrams and draw conclusions SP i 1. Interpret and compare 4. Interpreting data composite bar charts, Content descriptor Ref Concepts and skills Topic Interpret: composite bar charts, comparative and dual bar charts, pie charts, stem and leaf diagrams, scatter graphs, frequency polygons, box plots, cumulative frequency diagrams, histograms Concepts and skills GCSE Mathematics – Statistics content Level 2 Award in Statistical Methods SP k SP l SP l Recognise correlation and draw and/or use lines of best fit by eye, understanding what these represent Compare distributions and make inferences Compare distributions and make inferences in Statistical Methods – Issue 1 – December 2012 © Pearson Education Limited 2012 UG031213 – Specification – Edexcel Level 1, Level 2 and Level 3 Award numbers averages and fixed base index 9. Interpret and compare moving describe trend representations of data and predictions from data and 8. Make comparisons and standard deviation interquartile range, skew and 7. Compare data using 6. Identify and describe skew 4. Interpreting data (continued) Ref Concepts and skills Topic Content descriptor GCSE Mathematics – Statistics content Level 2 Award in Statistical Methods Compare the measures of spread between a pair of box plots/cumulative frequency graphs Use a line of best fit, or otherwise, to predict values of one variable given values of the other variable 51 Use dual or comparative bar charts to compare distributions Compare distributions and make inferences, using the shapes of distributions and measures of average and spread, including median and quartiles Compare the mean and range of two distributions, or median and interquartile range, as appropriate Compare the mean and range of two distributions, or median and interquartile range, as appropriate Compare distributions and make inferences, using the shapes of distributions and measures of average and spread, including median and quartiles Concepts and skills List all outcomes for single events, and for two successive events, in a systematic way and derive relative probabilities Understand and use estimates or measures of probability from theoretical models (including equally likely outcomes), or from relative frequency SP o SP n 52 Identify different mutually exclusive outcomes and know that the sum of the probabilities of all these outcomes is 1 SP p outcomes 4. Use probability to estimate calculate probabilities 3. Use sample space diagrams to (including 1 − p) 2. Add two or more probabilities Find the probability of successive events, such as several throws of a single dice Estimate the number of times an event will occur, given the probability and the number of trials in Statistical Methods – Issue 1 – December 2012 © Pearson Education Limited 2012 UG031213 – Specification – Edexcel Level 1, Level 2 and Level 3 Award Use theoretical models to include outcomes using dice, spinners, coins Use and draw sample space diagrams List all outcomes for single events, and for two successive events, systematically Understand and use estimates or measures of probability, including relative frequency Find a missing probability from a list or table Use 1 − p as the probability of an event not occurring where p is the probability of the event occurring Identify different mutually exclusive outcomes and know that the sum of the probabilities of all these outcomes is 1 Add simple probabilities Compare experimental data and theoretical probabilities SP s 1. Compare theoretical and 5. Probability experimental probabilities Concepts and skills Content descriptor Ref Concepts and skills Topic Compare experimental data and theoretical probabilities GCSE Mathematics – Statistics content Level 2 Award in Statistical Methods diagrams Understand conditional probabilities Know when to add or multiply two probabilities: when A and B are mutually exclusive, then the probability of A or B occurring is P(A) + P(B), whereas when A and B are independent events, the probability of A and B occurring is P(A) × P(B) SP q in Statistical Methods – Issue 1 – December 2012 © Pearson Education Limited 2012 53 Understand selection with or without replacement Use a tree diagram to calculate conditional probability UG031213 – Specification – Edexcel Level 1, Level 2 and Level 3 Award (continued) Draw a probability tree diagram based on given information (no more than 3 branches per event) Use tree diagrams to represent outcomes of compound events, recognising when events are independent SP r 5. Multiply probabilities using tree 5. Probability Concepts and skills Ref Concepts and skills Topic Content descriptor GCSE Mathematics – Statistics content Level 2 Award in Statistical Methods 54 UG031213 – Specification – Edexcel Level 1, Level 2 and Level 3 Award in Statistical Methods – Issue 1 – December 2012 © Pearson Education Limited 2012 Types of data Population and sampling Collecting data Population and sampling Population and sampling Classify discrete, continuous and categorical data Recognise the difference between a sample and a population and give a simple reason for sampling Design a question for a questionnaire Identify possible sources of bias in sampling methods Calculate a stratified sample using one category 1. Data in Statistical Methods – Issue 1 – December 2012 © Pearson Education Limited 2012 UG031213 – Specification – Edexcel Level 1, Level 2 and Level 3 Award Content descriptor Concepts and skills Topic Understand the meaning of the term population. Have a basic idea of the concept of bias, how it might occur in a sampling procedure and how it might be minimised Understand the strengths and weaknesses of various sampling methods, including bias, influences and convenience Be able to select a simple random sample or a stratified sample by more than one category as a method of investigating a population. An appreciation of an appropriate sample size is expected, as is the ability to make a random selection or sample from a population using calculators or computers. 55 Collect or obtain data by observation, surveys, experiments (including controlled experiments), counting, data logging, questionnaires and measurement. Writing improved or good questions for a questionnaire is expected. Understand the reasons for sampling and that sample data is used to estimate values in the population. Reasons to include time and efficiency, and impossibility of reaching the whole population in many circumstances. Recognise the difference between discrete and continuous data Concepts and skills GCSE Statistics content Level 2 Award in Statistical Methods Higher tier GCSE content is shown in bold Progression opportunities are shown in green Appendix 8: Mapping of Level 2 Award content to GCSE Statistics content 56 representations 2. Identify misuse of visual space diagrams (equal class interval) and sample diagrams, box plots, histograms polygons, cumulative frequency frequency tables, frequency diagrams, complete grouped and unordered stem and leaf without moving averages, ordered The potential for visual misuse, by omission or misrepresentation. Knowledge of causes such as unrepresentative scales or other measures is expected. UG031213 – Specification – Edexcel Level 1, Level 2 and Level 3 Award The distinction between well-presented and poorly presented data. Poorly presented data can be misleading, for example, 3-D angled pie charts and 3-D pie charts with slices pulled out, scales that do not start at 0 in Statistical Methods – Issue 1 – December 2012 © Pearson Education Limited 2012 Diagrams and representations Diagrams and representations 11. Draw composite bar charts, two-way 2. Displaying data tables and time-series graphs with or Concepts and skills Content descriptor Concepts and skills Topic Draw, use and understand: pictograms, bar charts, multiple or composite bar charts and pie charts for qualitative, quantitative and discrete data and comparative pie charts with area proportional to frequency, vertical line (stick) graphs for discrete data and cumulative frequency step polygons, for continuous data: pie charts, histograms with equal class intervals, frequency diagrams, cumulative frequency diagrams, population pyramids, histograms with unequal class intervals and the concept of frequency density, stem and leaf diagrams for discrete and continuous data, scatter diagrams for bivariate data, line graphs and time series, choropleth maps (shading) GCSE Statistics content Level 2 Award in Statistical Methods Work out the quartiles, percentiles and interquartile range for discrete and continuous data presented either as a list, frequency table or grouped frequency table Calculate and use appropriate moving averages. Up to and including a 5-point moving average. Chain base index numbers. Used to calculate the annual percentage change. Calculate and use variance and standard deviation Further summary statistics Measures of dispersion Time series in Statistical Methods – Issue 1 – December 2012 © Pearson Education Limited 2012 UG031213 – Specification – Edexcel Level 1, Level 2 and Level 3 Award notation in statistical calculations 5. Understand and use summation deviation 4. Calculate means and standard index numbers combined means and fixed base 3. Calculate moving averages, ungrouped data interquartile ranges for grouped and 2. Find the median, quartiles and 57 Work out and use estimates for the mean and median of grouped frequency distributions for discrete or continuous data Measures of central tendency 1. Calculate means for grouped and 3. Calculating with data Measures of central tendency Work out the mean, mode and median for discrete data presented as a frequency distribution Content descriptor Concepts and skills Topic ungrouped data Concepts and skills Work out and use the mean, mode and median of raw data presented as a list GCSE Statistics content Level 2 Award in Statistical Methods 58 Reasoning, interpreting and discussing results 1. Interpret and compare composite 4. Interpreting data Formally identify outliers using quartiles. Dealing with outliers is expected. or without mean point graphs and trend lines by eye with 5. Draw lines of best fit on scatter UG031213 – Specification – Edexcel Level 1, Level 2 and Level 3 Award scatter diagram, by eye may be required in Statistical Methods – Issue 1 – December 2012 © Pearson Education Limited 2012 Scatter diagrams and correlation Reasoning, interpreting and discussing results y )to the points on a Formally identify outliers Fit a line of best fit passing through ( x, Understand how to discover errors in data and recognise data that does not fit a general trend or pattern, including outliers. Analytical definition of an outlier will be required. 4. Identify outliers contains the median Work out and use estimates for the mean and median of grouped frequency distributions for discrete or continuous data. Graphical and other methods for the median are expected. Measures of central tendency 3. Find the class interval which Measures of dispersion Identify the modal class interval for grouped frequency distributions for discrete or continuous data. Frequency distributions with equal class intervals only. Measures of central tendency 2. Find the modal class interval from a frequency table or diagram Construct, interpret and use box plots. The use of box plots includes comparisons. Measures of dispersion diagrams. intervals, and sample space histograms with equal class frequency diagrams and box plots, scatter diagrams, cumulative bar charts, frequency polygons, Concepts and skills Content descriptor Concepts and skills Topic Interpret all forms of statistical tables, diagrams and graphs GCSE Statistics content Level 2 Award in Statistical Methods Use interpolation and extrapolation and understand the pitfalls. Particularly the problem of extrapolating beyond the range. Plot points as a time series; draw a trend line by eye and use it to make a prediction Make predictions. The use of a trend line by eye, drawing or formula will be expected. Explore connections and look for and examine relationships between variables, including fitting the equation to a line of best fit or trend line. For example, height and weight, age and depreciation of a car, GNP and mortality in infants. Interpretations of gradient and intercept are expected. Measures of dispersion Scatter diagrams and correlation Time series Reasoning, interpreting and discussing results 7. Compare data using interquartile (continued) in Statistical Methods – Issue 1 – December 2012 © Pearson Education Limited 2012 UG031213 – Specification – Edexcel Level 1, Level 2 and Level 3 Award numbers averages and fixed base index 9. Interpret and compare moving data and describe trend from data and representations of 8. Make comparisons and predictions deviation 59 Compare distributions of data and make comparisons using measures of central tendency, measures of dispersion and percentiles. The shapes of distributions and graphs may be used. Diagrams and representations 6. Identify and describe skew 4. Interpreting data Reasoning, interpreting and discussing results Use an appropriate measure of central tendency together with range, quartiles, interquartile range, percentiles, deciles, interpercentile range, variance and standard deviation to compare distributions of data Content descriptor Concepts and skills Topic range, skew and standard Concepts and skills Understand simple properties of the shape of distributions of data including symmetry, positive and negative skew GCSE Statistics content Level 2 Award in Statistical Methods 60 probability of it happening diagrams 5. Multiply probabilities using tree outcomes 4. Use probability to estimate calculate probabilities 3. Use sample space diagrams to Probability UG031213 – Specification – Edexcel Level 1, Level 2 and Level 3 Award Draw and use tree diagrams and probability tree diagrams for independent events and conditional cases. Listing all possible joint or compound outcomes with and without replacement for up to three outcomes and three sets of branches. Produce, understand and use a sample space. Listing all outcomes of single events and two successive events, in a systematic way is expected. in Statistical Methods – Issue 1 – December 2012 © Pearson Education Limited 2012 Know, for mutually exclusive outcomes, that the sum of the probabilities is 1 and in particular the probability of something not happening is 1 minus the 2. Add two or more probabilities (including 1 p ) If P(A) = p then P(not A) = 1 – p Understand the terms mutually exclusive and exhaustive and understand the addition law P(A or B) = P(A) + P(B) for two mutually exclusive events Probability 1. Compare theoretical and 5. Probability Probability Compare expected frequencies and actual frequencies Content descriptor Concepts and skills Topic experimental probabilities Concepts and skills Understand and use measures of probability from a theoretical perspective and from a limiting frequency or experimental approach GCSE Statistics content Level 2 Award in Statistical Methods Content descriptor Concepts and skills 1. Understand and explain census, population, sampling Topic 1. Data in Statistical Methods – Issue 1 – December 2012 © Pearson Education Limited 2012 UG031213 – Specification – Edexcel Level 1, Level 2 and Level 3 Award the size of populations 3. Use Peterson’s capture and recapture method to estimate 2. Calculate a stratified sample using two categories quantitative, primary and secondary data frame, discrete, continuous, categorical, qualitative, S1 content Level 3 Award in Statistical Methods Higher tier GCSE content is shown in bold Progression opportunities are shown in green Concepts and skills Appendix 9: Mapping of Level 3 Award content to GCE Mathematics Statistics 1 (S1) unit content 61 62 1. Draw back-to-back stem and leaf 2. Displaying Data distributions and Venn diagrams intervals), sketch normal histograms (unequal class cumulative frequency graphs, outliers) and generated from diagrams, box plots (with Content descriptor Concepts and skills Topic Knowledge of the shape and the symmetry of the distribution is required. Knowledge of the probability density function is not required. Derivation of the mean, variance and cumulative distribution function is not required. Interpolation is not necessary. Questions may involve the solution of simultaneous equations. UG031213 – Specification – Edexcel Level 1, Level 2 and Level 3 Award The Normal distribution including the mean, variance and use of tables of the cumulative distribution function. Use of tree diagrams and Venn diagrams. Sampling with and without replacement. Sum and product laws. Drawing of histograms, stem and leaf diagrams or box plots will not be the direct focus of examination questions. Back-to-back stem and leaf diagrams may be required. Using histograms, stem and leaf diagrams and box plots to compare distributions. Histograms, stem and leaf diagrams, box plots. Concepts and skills in Statistical Methods – Issue 1 – December 2012 © Pearson Education Limited 2012 6. The Normal distribution 3. Probability summary of data 2. Representation and S1 content Level 3 Award in Statistical Methods Content descriptor Concepts and skills 1. Calculate geometric means, mean Topic 3. Calculating with data IQR and IQR to identify outliers summary of data in Statistical Methods – Issue 1 – December 2012 © Pearson Education Limited 2012 regression 4. Correlation and UG031213 – Specification – Edexcel Level 1, Level 2 and Level 3 Award (PMCC) moment correlation coefficient rank correlation and Product- including Spearman’s coefficient of 4. Calculate measures of correlation UQ + 1.5 3. Use LQ – 1.5 summation notation 2. Representation and summary of data deviations for grouped and ungrouped data, including using 2. Representation and 2. Calculate means and standard index numbers seasonal variation and moving base S1 content Level 3 Award in Statistical Methods The product moment correlation coefficient, its use, interpretation and limitations. Derivations and tests of significance will not be required. Students may be asked to illustrate the location of outliers on a box plot. Any rule to identify outliers will be specified in the question. Skewness. Concepts of outliers. Understanding and use of coding. Significance tests will not be expected. Data may be discrete, continuous, grouped or ungrouped. Students will be expected to draw simple inferences and give interpretations to measures of location and dispersion. Calculation of mean, mode and median, range and interquartile range will not be the direct focus of examination questions. Measures of location — mean, median, mode. Concepts and skills 63 64 4. Interpreting Data moving averages) time-series graphs (including 3. Identify trend and seasonality in measures of correlation scatter graphs and interpret 2. Identify and describe correlation in distributions 1. Compare histograms and normal 6. Calculate standardised scores 5. Calculate variances Sxx, Syy and Sxy 3. Calculating with data (continued) Content descriptor Concepts and skills Topic regression Calculation of the equation of a linear regression line using the method of least squares. Students may be required to draw this regression line on a scatter diagram. Scatter diagrams. Linear regression. Drawing of histograms, stem and leaf diagrams or box plots will not be the direct focus of examination questions. Back-to-back stem and leaf diagrams may be required. UG031213 – Specification – Edexcel Level 1, Level 2 and Level 3 Award Using histograms, stem and leaf diagrams and box plots to compare distributions. Histograms, stem and leaf diagrams, box plots. Derivations and tests of significance will not be required. The product moment correlation coefficient, its use, interpretation and limitations. Concepts and skills in Statistical Methods – Issue 1 – December 2012 © Pearson Education Limited 2012 4. Correlation and summary of data 2. Representation and regression 4. Correlation and S1 content Level 3 Award in Statistical Methods 4. Interpret and compare data using frequencies, totals, mean/median/mode/range, 4. Interpreting Data (continued) summary of data in Statistical Methods – Issue 1 – December 2012 © Pearson Education Limited 2012 UG031213 – Specification – Edexcel Level 1, Level 2 and Level 3 Award representations to solve a problem data from a variety of outliers and venn diagrams, and leaf diagrams, box plots with 6. Interpret back to back stem and numbers means and chain base index 5. Interpret and compare geometric standardised scores standard deviation and interquartile range, skew and Content descriptor Concepts and skills Topic 2. Representation and S1 content Level 3 Award in Statistical Methods Significance tests will not be expected. Understanding and use of coding. Data may be discrete, continuous, grouped or ungrouped. Students will be expected to draw simple inferences and give interpretations to measures of location and dispersion. Calculation of mean, mode and median, range and interquartile range will not be the direct focus of examination questions. Measures of location — mean, median, mode. Concepts and skills 65 66 1. Use probability and relative frequency 5. Probability B) probabilities 7. Identify and calculate binomial P(AB) = P( A B ) P( B ) 6. Find conditional probabilities and use P(A P(A or B) = P(A) + P(B) – 5. Use P(A and B) = P(A) P(B), independent events 4. Understand mutually exclusive and tree diagrams 3. Multiply and add probabilities using to calculate probabilities 2. Use sample space and Venn diagrams predictions to estimate outcomes or make Content descriptor Concepts and skills Topic P(A ∪ B) = P(A) + P(B) − P(A ∩ B) P(A ∩ B) = P(A) P(B) P(A ∩ B) = P(A) P(B|A) Understanding and use of: Conditional probability. Understanding and use of: UG031213 – Specification – Edexcel Level 1, Level 2 and Level 3 Award Exclusive and complementary events. Sum and product laws. Use of tree diagrams and Venn diagrams. Sampling with and without replacement. Use of tree diagrams and Venn diagrams. Sampling with and without replacement. Sum and product laws. Sample space. Elementary probability. Concepts and skills in Statistical Methods – Issue 1 – December 2012 © Pearson Education Limited 2012 3. Probability 3. Probability 3. Probability 3. Probability 3. Probability 3. Probability S1 content Level 3 Award in Statistical Methods 8. Find probabilities using standard 5. Probability in Statistical Methods – Issue 1 – December 2012 © Pearson Education Limited 2012 UG031213 – Specification – Edexcel Level 1, Level 2 and Level 3 Award ma041212G:\WORDPROC\LT\PD\EDEXCEL AWARDS 2011\UG031213_EDXL_AWD_STATMETH\UG031213_EDXL_AWD_STATMETH.DOC.1–74/1 normal distribution tables Content descriptor Concepts and skills Topic (continued) S1 content Level 3 Award in Statistical Methods The Normal distribution including the mean, variance and use of tables of the cumulative distribution function. Knowledge of the shape and the symmetry of the distribution is required. Knowledge of the probability density function is not required. Derivation of the mean, variance and cumulative distribution function is not required. Interpolation is not necessary. Questions may involve the solution of simultaneous equations. Concepts and skills 67 Further copies of this publication are available from Edexcel Publications, Adamsway, Mansfield, Notts, NG18 4FN Telephone 01623 467467 Fax 01623 450481 Email: [email protected] Publications Code UG031213 December 2012 For more information on Edexcel and BTEC qualifications please visit our website: www.edexcel.com Pearson Education Limited. Registered in England and Wales No. 872828 Registered Office: Edinburgh Gate, Harlow, Essex CM20 2JE. VAT Reg No GB 278 537121

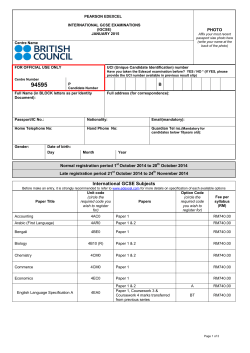


© Copyright 2026