
Read more... - NAI Houston
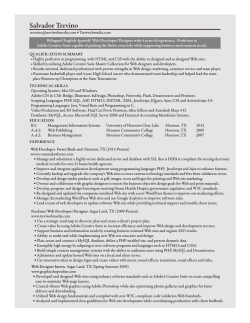
HOUSTON | SAN ANTONIO | AUSTIN
Economic and Market Outlook:
HOUSTON INDUSTRIAL | Q4 2014
Absorption
Vacancy
14
12
Houston’s
10
diversified, and is anticipated to continue
9
to grow in 2015, but at a slower pace
8
10
7
8
6
6
5
4
economy
is
healthy
and
due to the recent decline in oil prices.
Local, state, and national
economies are
growing from improvements in GDP (gross
domestic
product),
employment,
energy
costs, and business activity. Even though
2014
2013
2012
2011
2010
2009
2008
2007
2006
2005
2004
can stimulate economic growth, there is
2003
3
2002
0
2001
lower oil prices and reduced energy costs
2000
2
4
1999
Net Absorption
(millions of sq. ft.)
16
11
Vacancy (%)
18
Executive Summary
Figure 1: Supply and Demand
appropriate concern for the Houston and
Texas economies given the prominence of
the energy sector.
Demand, as measured by net absorption,
remained strong, with 1.4 million sq. ft. being
Table 1. Key market indicators for Q4 2014, and their percent
(%) change on a quarter-over-quarter (QoQ) and year-overyear (YoY) basis.
Percent Change over Prior Period
Q4 2014
QoQ (%)
YoY (%)
Asking Rent: Warehouse
$6.13
2.2
7.7
Asking Rent: Flex
$9.37
-2.6
-8.9
Net Absorption (sq.ft.)
1,434,915
-64.0
148.1
Leasing Activity
3,731,569
-15.3
-42.6
Availability (%)
7.3
-3.6
-11.9
Vacancy (%)
4.8
-0.4
-12.0
Deliveries (RBA, sq.ft)
1,466,909
-14.2
-28.2
Construction (RBA, sq.ft.)
9,115,977
16.5
26.2
536,571,701
0.3
1.3
17,712
0.2
0.6
Inventory (RBA)
Inventory (No. Buildings)
www.naipartners.com
absorbed in the Q4 2014, a 148% increase
year-over-year (YoY). The year of 2014
absorbed 10,211,455 sq. ft, the highest net
absorption since 2008. Supply, as measured
by vacancy, for the quarter was 4.8% for all
industrial space, yielding a 0.4% and 12%
decrease quarter-over-quarter (QoQ) and
YoY, respectively. The quarter saw deliveries
decline
by
28%
YoY
and
construction
increase by 26% YoY. Asking rents are up
7.7% YoY for warehouse space, but down
8.9% YoY for flex space.
1
HOUSTON INDUSTRIAL | Q4 2014
ECONOMIC OVERVIEW
While some global slowdowns are occurring, the economic profiles of the U.S., Texas, and Houston
remain strong with continued growth. Houston and Texas are among the leaders in the U.S. economy,
despite declines in the energy industry. Positive outlook is carried by improvements in GDP, employment,
energy costs, and business activity, while a slightly negative outlook, for Houston and Texas in particular,
is due to declines in both energy and Texas exports.
Energy
The global supply of 92 million barrels
of oil per day (mb/d) in 2014 is projected
to exceed demand (91.4 mb/d), with the
U.S. contributing +1.5 mb/d to the surplus.
By mid-January 2015, the price of West
Texas Intermediate (WTI) fell below $50.
Natural gas prices are down $0.71, with
an average $3.40 per MMBtu. Drops also
occurred in ethane and propane, with
prices at their lowest in over a decade.
A gallon of retail regular gasoline on the
Gulf Coast dropped to $2.31 in December
2014, lowest since mid-year 2009.
U.S. oil and gas rig count was down
from an average of 1,925 in October to
1,882 in December. In Texas, rig counts
declined from 904 in November to 855
in December. With an approximate three
month lag between energy prices and
active rigs, coming weeks and months
may see further reductions.
As of early January 2015, the US Energy
Information Administration (EIA) has revised
its 2015 projection for WTI downwards to
$62, Goldman Sachs has it at $47, and
Citi at $55. Often, however, predictions
for oil are incorrect. In 2008 it was forecast
that U.S. oil production was in a decline
that would never recover, with production
at five mb/d compared with 10 mb/d at its
peak in the early 1970s. An increase in oil
production was not considered feasible by
any forecast. Then, in 2014, oil production
in the U.S. exceeded 8 mb/d. Similarly,
forecasts for 2014 did not predict the later
decline in prices. Simply put, forecasting
oil is a complex problem.
While Houston’s economy varies with
the performance of its energy sector,
it would be misleading to equate the
decline in recent oil prices with a pending
decline in Houston’s overall economy. For
example, consider the projected changes
in GDP due to the recent decline in oil
prices. It is anticipated that reduced oil
prices and lower prices at the pump will
lead to an increase of approximately 0.3
to 0.4% in GDP, while the pullback in oil
will reduce GDP by only 0.1%. Moreover,
consumer spending accounts for ~60%
of GDP. Reductions in oil prices stimulate
consumer spending, and in turn consumer
spending stimulates demand for oil.
Overall, economic forecasts for Houston,
Texas and the U.S. are for continued
healthy growth. Certainly, the growth in
Houston’s economy will not be as strong
had oil prices not fallen, but Houston’s
economy is diversified and is anticipated
to continue to grow.
Gross Domestic Product (GDP)
While Europe’s GDP in Q3 2014 came
in at just 0.6%, the GDP of the U.S.
exceeded expectations at 5.0% growth for
the same period. Personal consumption
expenditures (PCE) and exports were key
contributors to the increase.
Employment
Ongoing improvements in the labor
market continue to support economic
growth at national, state, and city levels.
For the 11th consecutive month, job growth
increased by more than 200,000 jobs.
National unemployment in December 2014
declined 0.2% to an overall 5.6%, the lowest
it has been since June 2008. Despite
largely positive employment numbers,
average wages have largely been stagnant,
only up by $0.40 year-over-year.
Houston and Texas continue to
outperform
national
labor
markets.
Unemployment
in
November
2014
remained steady at 4.9% in Texas and
4.8% in Houston. Employment in Texas and
Houston in November 2014 grew 3.2% and
4.4%, respectively, compared to the nation’s
2.8%. The energy industry in Houston had
an increase in jobs in November, when
Houston’s payroll employment increased
3.9%, dominated by construction and
mining and leisure and hospitality.
Financial activities showed declines in
payroll employment. Job growth in energy
extraction and pipeline increased by 7.6%,
but job growth in support activities slowed
to 6.6%. Job growth in Texas and Houston
are expected to be ~2.7% in 2015. This is
~1% less than 2014 but still higher than the
long term average of 2.1%.
Interest Rates
While interest rates continue to remain
unchanged, the Federal Reserve may begin
to increase them in 2015, through relatively
small and incremental changes.
Consumer Price Index
The Consumer Price Index (CPI) for
Urban Consumers (CPI-U) is a key measure
of inflation, and when reported as the core
inflation rate does not include the volatility
of short-term food and energy prices.
The CPI-U for all items decreased 0.4% in
December 2014, the biggest drop in six
years, and increased only 0.8% for the past
12 months, compared to 1.3% for 12 months
2
HOUSTON INDUSTRIAL | Q4 2014
ending November 2014. Excluding food and
energy, the index remained unchanged in
December. The energy index declined 10.6%
over the 12 months ending December 2014.
As the economy continues to grow, so will
inflation, though probably not sooner than a
year or two.
inflation-adjusted retail sales. The index
shows that, while the business growth rate
in Houston remains positive, it declined
to 6% in November from 7.4% in October.
Inexpensive oil and a growing economy are
expected to support continued growth in
manufacturing.
Business Activity
Exports/Trade
The Dallas Federal Reserve reports the
Production Index for Texas Manufacturing,
which subtracts the percentage of firms
reporting a decrease in manufacturing from
those reporting an increase. Positive values
represent increases in manufacturing,
negative values represent decreases. The
Production Index increased sharply from
6.0 in November to 15.8 in December
2014. At the national level, factories are
at 77.2% capacity (compared to 63.9% in
early 2009), indicating near term expansion
to meet demands.
In November 2014, monthly exports
from Texas declined 2.4%, following a 5.2%
decline in October. Year-over-year, Texas
exports were down 8.6%.
The Houston Business-Cycle Index of the
Dallas Federal Reserve is a single measure
assessing the Houston-Sugar LandBaytown economy based on movements
in local unemployment, nonagricultural
employment, inflation-adjusted wages, and
Housing
National home prices gained 4% in 2014,
and sales are expected to grow 8% in the
coming year. Fannie Mae and Freddie Mac
reduced down payments from 5% to 3%,
indicating that rules for mortgage lending
may begin to relax. In Texas, existing home
sales decreased 0.3% in November, but
they were up 7.6% year-over-year. Permits for
construction of single-family homes in Texas
dropped 4.4% in November (compared
to 2.2% increase in October), but they are
up 5.6% year-over-year. With high demand
and low inventory for single family homes,
there has been a strong rental market that
has increased multifamily construction.
However, Texas housing starts (both single
and multi-family) were down 12.2% in
November and 14.7% year-over-year. Texas
home inventory was down to 3.4 months in
November 2014, compared to 3.7 months
a year ago. Demand for housing in 2015 is
likely to increase as unemployment declines
and incomes increase.
Retail
National retail and food service sales
decreased 0.9% in December 2014, but
were up 3.2% year-over-year. The revenue
index for the Texas Retail Outlook Survey
(TROS) shows strong growth in recent
months, with highs not seen since 2007.
Retailers appear optimistic about business.
Houston and Texas continue to outperform national labor markets.
Unemployment in November 2014 remained steady at 4.9% in Texas and 4.8%
in Houston. Employment in Texas and Houston in November 2014 grew 3.2%
and 4.4%, respectively, compared to the nation’s 2.8%.
3
HOUSTON INDUSTRIAL | Q4 2014
MARKET OVERVIEW
Demand remained strong with 1,434,915 sq. ft. absorbed in Q4 2014, a 148% increase YoY. With net
absorption of 10,211,455 sq. ft., 2014 had the highest rate since 2008. Supply, as measured by vacancy,
was 4.8% for all industrial space for the Q4 2014, yielding a 0.4% and 12% decrease QoQ and YoY,
respectively. Deliveries decreased by 28% YoY and construction increased by 26% YoY. Asking rents are
up 7.7% YoY for warehouse space, but down 8.9% YoY for flex space.
Net Absorption
18
16
14
Net Absorption
(millions of sq. ft.)
Q1
Q2
Q3
Q4
annual
12
10
8
6
4
2
2007
2008
2009
2010
2011
2012
2013
2014
2007
2008
2009
2010
2011
2012
2013
2014
2006
2005
2004
2003
2002
2001
2000
Figure 3: Leasing Activity
2006
2005
2004
2003
2002
Q1
Q2
Q3
Q4
2001
Leasing Activity
(millions of sq. ft.)
30
28
26
24
22
20
18
16
14
12
10
8
6
4
2
0
2000
−2
1999
0
Leasing Activity
Leasing activity, another measure of
demand, is the gross amount of space
represented by direct leases, subleases,
renewals, and pre-leasing of rentable
building area (RBA) under construction.
Figure 3 reports leasing activity from
1999-2014 by year and quarter for
combined industrial space. Leasing
activity for Q4 2014 fell to 3,731,569
sq. ft., a 15% and 43% decrease QoQ
and YoY, respectively (Table 1). Leasing
activity in each quarter of 2014 was flat
or lower than each respective quarter
for the past three years. While 2014 had
lower leasing activity compared with the
recent years, it was not abnormally low
compared to other years dating back to
1999, with eight other years having even
lower leasing activity.
Figure 2: Net Absorption
1999
Net absorption is a key metric that
shows actual demand for industrial space.
Net absorption measures the change
in occupied inventory over a specific
time period, including direct and sublet
space and the addition and subtraction
of building area. Figure 2 shows net
absorption from 1999-2014 by year and
quarter for combined industrial space. Net
absorption of 1,434,915 sq. ft. occurred in
Q4 2014, yielding a 64% decrease QoQ,
but still a 148% increase YoY (Table 1). In
general, Q4 net absorption during the past
14 years tends to be less than or equal
to that of Q3, so the 64% QoQ decline in
Q4 2014 should be interpreted cautiously
with regard to oil. The year of 2014
absorbed 10,211,455 sq. ft, the highest
net absorption since 2008.
4
HOUSTON INDUSTRIAL | Q4 2014
Vacancy and Availability
Prices
reflect
the
relationships
between supply and demand. Figure 5
plots direct and sublet asking rent prices
from 1999 - 2014 for warehouse and flex
space. Warehouse asking rent rose to
$6.13 nnn in Q4 2014 and flex asking
rent fell to $9.37 nnn. Overall, average
annual asking rents for warehouse
space have risen 67% in 16 years, from
$3.59 in 1999 to $6.00 in 2014. Average
annual asking rents for flex space have
risen even faster, 83% from $5.27 in
1999 to $9.64 in 2014.
14
12
10
8
6
4
2008
2009
2010
2011
2012
2013
2014
2008
2009
2010
2011
2012
2013
2014
2007
2006
2005
2004
2003
2002
2001
Figure 5: Asking Rent (nnn)
2007
2006
2005
2004
2003
2002
Warehouse: Direct
Warehouse: Sublet
Flex: Direct
Flex: Sublet
2001
15
14
13
12
11
10
9
8
7
6
5
4
3
2
1
0
2000
2
1999
Availability and Vacancy (%)
Warehouse: Availability
Warehouse: Vacancy
Flex: Availability
Flex: Vacancy
2000
Asking Rent
16
Figure 4: Availability and Vacancy
1999
Figure 4 shows availability and
vacancy from 1999-2014 for each of
warehouse and flex industrial space.
Availability tends to be ~3% greater than
vacancy, with warehouse space showing
lower availability and vacancy rates than
flex space. Availability for the Q4 2014
decreased to 7.3% for all industrial space,
while vacancy dropped to 4.8%. Vacancy
of both warehouse and flex spaces in
2014 were nearly as low as in 1999, the
lowest of the past 16 years.
18
0
Asking Rent
(average annual $ nnn/sq. ft.)
Vacancy and availability are two
different measures of the supply of
industrial space. Vacancy (%) is the
amount of space that is not occupied by a
tenant relative to the total rentable space
of the market. Vacancy is independent
of whether or not the space has a paid
lease or is even available for lease.
Availability (%) is the amount of space
currently available for lease relative to
the total rentable space, whether or not
the space is vacant, occupied, sublet,
or becoming available in the near term.
In this way, vacancy under estimates
supply by not including space for lease
that is still occupied, while availability
does little to evaluate how much space
is sitting empty.
20
Construction
Construction of new RBA is another
key variable determining the supply of
office space. RBA delivered refers to
completed construction that occurs
during a given time period, while RBA
under construction refers to space not yet
completed construction. Deliveries in Q4
2014 amounted to more than 1.4 million
sq. ft., while RBA under construction was
9.1 million sq. ft. Warehouse construction
shows continued strength following low
levels of new buildings and RBA under
construction in 2010. Flex construction
continues to be episodic, and low relative
to pre-2010 levels.
5
HOUSTON INDUSTRIAL | Q4 2014
Inventory
Figure 7 depicts changes in the
inventory of warehouse and flex space
over the past 16 years, both in terms of
the number of buildings and the RBA of
that space. RBA inventory for all industrial
space increased slightly to 536 million
sq. ft. for 17,712 buildings, an increase of
about 0.25% and ~0.95% QoQ and YoY,
respectively (Table 1).
RBA inventory
for all industrial
space included 536
million sq. ft. for
17,712 buildings, an
increase of about
0.25% and ~0.95%
QoQ and YoY,
respectively (Table 1).
6
HOUSTON INDUSTRIAL | Q4 2014
Select Largest Deliveries
Under Construction
Rentable
Building Area
Percent
Leased
Rentable
Building Area
Percent
Leased
10565 Greens Crossing Blvd
600,750
83%
8303 Fallbrook Dr
400,250
0%
777 Highway 90A W
650,000
100%
3507 Pasadena Blvd
600,000
100%
3505 Pasadena Blvd
400,000
100%
4800 W Greens Rd
350,820
0%
11810 N Gessner Rd
441,000
0%
8401 Fallbrook Dr
362,320
0%
19802 Imperial Valley Dr
328,020
8039 Humble Westfield Rd
250,200
0%
11717 Windfern Rd
362,180
100%
0%
20710 Hempstead Rd
357,887
0%
121 Esplanade Blvd
300 Airtex Dr
244,550
0%
971 N Sam Houston Parkway E
352,000
0%
225,360
0%
660 Greens Pky
350,000
100%
3750 Highway 225
185,168
100%
28450 West Ten Blvd
340,503
0%
16245 Port NW
171,850
100%
11747 Windfern Rd
320,430
0%
11220 Ella Blvd
162,780
0%
8520-B S Sam Houston Pky W
310,010
67%
13627 W Hardy Rd
151,339
100%
1910 Cypress Station Dr
284,170
0%
11951 Spectrum Blvd
150,000
100%
5300 Highway 146
243,000
100%
400 Century Plaza Dr
149,760
0%
1300 Greens Pky
213,218
0%
525 Century Plaza Dr
149,500
100%
10634 Tanner Rd
204,070
0%
7330 Langfield Rd
132,470
100%
619 E Sam Houston Pky S
199,680
0%
16501 Central Green Blvd
129,143
81%
8401 Fallbrook Dr
197,917
0%
16507 Central Green Blvd
129,143
0%
9254 Park South Vw
193,741
0%
14820 North Fwy
126,568
0%
6410 Langfield Rd
180,928
0%
13615 S Gessner Rd
123,300
0%
431 E Airtex Dr
166,250
0%
5737 Brittmoore Rd
122,500
100%
11720 N Gessner Rd
155,400
0%
433 Plaza Verde Dr
120,159
100%
18945 Kenswick Dr
150,000
100%
545 Plaza Verde Dr
120,159
0%
2172-2188 Greens Rd
147,112
0%
4525 Kennedy Commerce Dr
120,000
100%
1902 Cypress Station Dr
129,936
0%
3700 Hwy 225 Rd
118,500
57%
20702 Hempstead Rd
114,800
0%
7390 Northcourt Rd
113,065
100%
Way Out West Blvd
88,000
38%
14646 Kirby Dr
110,000
100%
611 E Sam Houston Pky S
87,880
0%
71 Esplanade Blvd
106,700
0%
8401 Fallbrook Dr
86,747
0%
15882 Diplomatic Plaza Dr
104,242
0%
5737 Brittmoore Rd
86,250
0%
22350 Merchants Way
101,300
100%
8770 West Rd
77,987
0%
8780 West Rd
28480 West Ten Blvd
74,793
0%
8520-A S Sam Houston Pky W
68,370
0%
Building Address
Building Address
100,275
100%
15892 Diplomatic Plaza Dr
94,074
0%
16235 Port NW
91,731
100%
22130 Merchants Way
67,743
0%
9258 Park South Vw
90,067
100%
11710 N Gessner Rd
67,200
0%
10401 S Sam Houston Pky W
90,000
0%
10618 Tanner Rd
66,420
0%
13721 S Gessner
85,500
45%
8401 Fallbrook Dr
62,061
0%
2425 Mowery Rd
69,760
0%
9191 Gulf Fwy
52,200
0%
22110 Merchants Way
67,743
100%
6410 Langfield Rd
51,424
0%
1050 Greens Pky
66,798
100%
14155 W Hardy Rd
42,600
0%
22240 Merchants Way
64,313
0%
6410 Langfield Rd
37,636
0%
529 Stonegate Dr
63,382
100%
Bammel Rd
37,500
0%
8790 West Rd
63,000
62%
Bammel Rd
33,000
0%
3800 Highway 225
61,794
100%
25311 Kingsland Blvd
31,000
0%
12550 N Houston Rosslyn Rd
56,876
100%
7800 Breen Rd
30,000
100%
616 Spring Hill Dr
56,700
83%
Katy Hockley Cutoff & Cla Dr
30,000
0%
4351 E Highway 6
55,000
100%
18400 Kieth Harrow Blvd
30,000
0%
27603 Commerce Oaks Dr
27,603
0%
9370 Kirby Dr
26,250
0%
7
HOUSTON INDUSTRIAL | Q4 2014
Select Major Lease Transactions
Tenant
Qtr.
Building
American Tile & Stone
4th
ClayPoint Distribution Park
Size (SF)
Veritrust Corp*
4th
2000 Afton Rd.
87,000
Pharmedium Services*
4th
12620 West Airport Blvd.
74,100
Overseas Trading*
4th
1800 South St.
66,000
Flotek Industries
4th
8846 N. Sam Houston Parkway W.
50,400
ERA Industries
4th
6028 Navigation
44,000
Surface Preparation Texas
4th
Southport Business Park
40,150
N2It Containers
4th
6002 Murphy
33,000
Performance Contracting Group
4th
221 Beltway Green Blvd.
32,140
Iron Acces
4th
3815 Hollister
30,194
Interstate-McBee
4th
Central Green Business Park
25,600
Hoist Manufacturing
4th
2410 Broad St.
19,580
Foundation Logistics & Services
4th
15370 Vantage Parkway West
17,646
Medical Transportation Management
4th
5400 Mitchelldale
16,600
Standard Alloys & Manufacturing
4th
1101 Howard Dr.
15,300
Sherrariums Co.
4th
7221 Wynnwood
14,490
JYC Enterprise
4th
12634 East Freeway
12,000
121,795
8
HOUSTON INDUSTRIAL | Q4 2014
Flex Market Statistics
YTD Net
Under
Absorption Construction SF
Quoted Rental
Rates ($/SF/Yr)
# Blds
Total RBA
Total
Available SF
Vacancy %
0
0
0
0.0%
0
0
$0.00
CBD Ind
176
3,751,140
303,421
8.1%
26,576
0
$5.35
North Corridor Ind
373
10,464,071
873,619
8.3%
98,895
34,325
$7.60
Northeast Corridor Ind
64
774,295
30,969
4.0%
21,930
0
$8.75
Northwest Corridor Ind
539
15,985,542
1,068,649
6.7%
239,757
6,000
$9.63
San Jacinto County Ind
0
0
0
0.0%
0
0
$0.00
Southeast Corridor Ind
203
3,081,010
375,096
12.2%
5,230
0
$10.96
Southern Corridor Ind
117
2,423,673
198,716
8.2%
53,025
0
$9.21
Southwest Corridor Ind
467
12,187,403
725,683
6.0%
323,458
26,250
$10.38
# Blds
Total RBA
Total
Available SF
Vacancy %
23
1,540,395
2,400
0.2%
(500)
0
$0.00
CBD Ind
1,928
55,500,276
2,422,780
4.4%
291,354
0
$4.57
North Corridor Ind
2,800
78,573,539
6,427,835
8.2%
2,676,149
2,263,391
$6.67
Northeast Corridor Ind
880
33,332,696
530,280
1.6%
511,578
30,560
$4.97
Northwest Corridor Ind
3,930
130,441,793
4,484,008
3.4%
2,803,484
4,158,546
$6.45
San Jacinto County Ind
4
34,464
0
0.0%
0
0
$0.00
Southeast Corridor Ind
2,171
83,116,524
3,829,616
4.6%
2,039,686
1,241,888
$4.70
Southern Corridor Ind
1,822
46,468,311
1,517,815
3.3%
1,082,228
258,341
$5.47
Southwest Corridor Ind
2,158
57,815,582
2,867,261
5.0%
177,238
1,096,676
$6.37
Submarket
Austin County Ind
Warehouse Market Statistics
Submarket
Austin County Ind
YTD Net
Under
Absorption Construction SF
Quoted Rental
Rates ($/SF/Yr)
Total Industrial Market Statistics
YTD Net
Under
Absorption Construction SF
Quoted Rental
Rates ($/SF/Yr)
# Blds
Total RBA
Total
Available SF
Vacancy %
23
1,540,395
2,400
0.2%
(500)
0
$0.00
CBD Ind
2,104
59,251,416
2,726,201
4.6%
317,930
0
$4.63
North Corridor Ind
3,173
89,037,610
7,301,454
8.2%
2,775,044
2,297,716
$6.82
Northeast Corridor Ind
944
34,106,991
561,249
1.6%
533,508
30,560
$5.04
Northwest Corridor Ind
4,469
146,427,335
5,552,657
3.8%
3,043,241
4,164,546
$6.88
San Jacinto County Ind
4
34,464
0
0.0%
0
0
$0.00
Southeast Corridor Ind
2,374
86,197,534
4,204,712
4.9%
2,044,916
1,241,888
$5.01
Southern Corridor Ind
1,939
48,891,984
1,716,531
3.5%
1,135,253
258,341
$5.63
Southwest Corridor Ind
2,625
70,002,985
3,592,944
5.1%
500,696
1,122,926
$7.00
Submarket
Austin County Ind
9
(Proposed)
Grand Pkwy
HOUSTON INDUSTRIAL | Q4 2014
The Houston Industrial Sub-market Map
249
290
Fm 1960
CBD IND (1)
Rd W
F-M Rd 1960
NORTH CORRIDOR IND (2)
Grand Pkwy (Proposed)
6
NORTH EAST CORRIDOR IND (3)
90
NORTH WEST CORRIDOR IND (4)
8
SOUTHEAST CORRIDOR IND (5)
8
290
SOUTHERN CORRIDOR IND (6)
249
BUS
SOUTHWEST
CORRIDOR IND (7)
90
mH
E Sa
548
45
to
ous
90
yN
n Pkw
59
6
wy
tH
on
aum
Be
rty
St
610
Highway Blvd
Mc
ca
8
10
10
10
59
610
45
Waysi
de
Dr
8
146
225
Addicks-Howell Rd
610
l
sh Tr
pani
Old S
99
t
in S
Ma
6
SS
am
146
288
Ho
usto
nP
kw
yW
8
Sam Houston Pkwy
ALT
90
45
(Proposed)
The change in occupied space in a
given time period.
Available Square Footage
Net rentable area considered available
for lease; excludes sublease space.
Average Asking Rental Rate
Rental rate as quoted from each
building’s owner/management
company. For office space, a full
service rate was requested; for retail, a
triple net rate requested; for industrial,
a NN basis.
Building Class
Class A Product is office space of
steel and concrete construction, built
after 1980, quality tenants, excellent
amenities & premium rates. Class
B product is office space built after
1980, fair to good finishes & wide
range of tenants.
Rd
Grand Pkwy
Absorption
(Net)
36
nd
rla
Av
e
ga
Su
nu
in-
e
H
Alv
59
Methodology | Definitions
146
6
35
Direct Vacancy
Sublease
288
Space currently available for lease
directly with the landlord or building
6
owner.
Market Size
Includes all existing and under
construction office buildings (office,
office condo, office loft, office medical,
all classes and all sizes, both multitenant and single-tenant, including
owner-occupied buildings) within each
market.
Overall Vacancy
All physically unoccupied lease space,
either direct or sublease.
SF/PSF
Square foot/per square foot, used as a
unit of measurement.
Arrangement in which a tenant leases
3
rental property to another, and the
tenant becomes the landlord to the
subtenant.
Sublease Space
Total square footage being marketed
for lease by the tenant.
Sublease Vacancy
Space currently available in the market
for sublease with an existing tenant
within a building acting as the landlord.
Copyright © and (P) 1988–2012 Microsoft Corporation and/or its su
Certain mapping and direction data © 2012 NAVTEQ. All rights rese
America are trademarks of Tele Atlas, Inc. © 2012 by Applied Geog
RBA (Rentable Building Area)
Expressed in square feet, this area
includes the usable area and its
associated share of the common
areas.
10
Marketing & Research Team
J. Nathaniel Holland, Ph.D.
Steven Cox
Nuance Stone
Chief Research and Data Scientist
Director of Property Research
Sr. Director of Marketing and Research
Information herein was obtained from sources deemed to be reliable, but no warranty or representation is made as to guarantee its
accuracy.
Sources include: CoStar, Federal Reserve Bank of Dallas, Greater Houston Partnership, Houston Association of Realtors, National
Association Realtors, Texas A&M Real Estate Center, U.S. Bureau of Labor Statistics, U.S. Bureau of Commerce.
Economic and Market Outlook:
HOUSTON INDUSTRIAL | Q4 2014
HOUSTON | SAN ANTONIO | AUSTIN
www.naipartners.com
1900 West Loop South, Suite 500 | Houston, TX 77027 | tel 713 629 0500


© Copyright 2026