
I Know What You Did Last Sunday: - Public Religion Research Institute
I Know What You Did Last Sunday: Measuring Social Desirability Bias in Self-‐Reported Religious Behavior, Belief, and Identity Daniel Cox, Robert P. Jones, Ph.D., and Juhem Navarro-‐Rivera May 17, 2014 2027 Massachusetts Ave NW, 3rd Floor Washington, DC 20036 www.publicreligion.org I Know What You Did Last Sunday A Paradox: Stability and Change in Self-‐reported Religion Measures The United States is unique among Western industrialized countries in the strength and stability of its citizens’ religious commitment. Compared to citizens of other industrialized nations, particularly those in Western Europe, Americans exhibit substantially higher rates of religious service attendance, belief in God, and in religious affiliation (Norris and Inglehart 2004). Self-‐reported worship attendance between 2003 and 2013 is remarkably stable. In 2003, 39% of Americans reported attending religious services at least once a week, a rate comparable to the 37% who reported weekly attendance in 2013.1 The rate of those who report seldom or never attending exhibited only a modest increase over the same time period (25% to 29%). In fact, previous work has shown that self-‐reported religious participation has been relatively unchanged at least as far back as the mid 1970s (Hout and Greeley 1987). One of the central measures of religious belief, belief in God, has been remarkably stable, even over a much longer time period. According to Gallup, the proportion of Americans reporting they believe in God has changed little over the last roughly 40 years. In 1976, 94% of the public affirmed a belief in God or a universal spirit, compared to 90% in 2013.2 Chart 1. Reported Frequency of Worship A9endance in the US. (2003-‐2013) Weekly or more Percent who a6end religious services... 50 40 Occasionally Seldom or Never 39 37 30 29 20 25 10 0 2003 2004 2005 2006 2007 2008 2009 2010 2011 2012 2013 Source: Pew Research Center Surveys 2003-‐2013 1 Even when questions gauging religious participation are posed differently, the pattern of reported attendance is quite similar. In 1992, Gallup found that 40% of the public reported attending church in the last seven days, compared to 39% in 2013. http://www.gallup.com/poll/1690/religion.aspx 2 Gallup Poll, June 1976; Gallup Poll, May 2013. Public Religion Research Institute 2 I Know What You Did Last Sunday However, the high level of self-‐reported religious participation in public opinion surveys is in tension with the mounting evidence of declining religious vitality in the U.S. Previous work has demonstrated the long slow decline experienced by many mainline Protestant denominations (Roof and McKinney 1987), and more recently some evangelical Christian denominations began facing shrinking membership as well.3 Finally, the stability of worship attendance persists despite the dramatic rise of religious disaffiliation and non-‐affiliation. More Americans than ever before claim no religious identity, but rates of religious attendance have not witnessed a similar decline. Today more than 1-‐in-‐5 (21%) Americans claim no formal religious identity, more than doubling in number over the last two decades. Previous research exploring the gap between self-‐reported rates of religious participation and the anecdotal experiences of many denominations found that conventional public opinion surveys consistently overestimate attendance rates (Chaves and Cavendish 1994; Hadaway, Marler, and Chaves 1993; Marcum 1999). By comparing aggregate head counts of Protestants in a particular Ohio county and Catholics in 18 dioceses, for example, Hadaway, Marler, and Chaves (1993) concluded that attendance rates can be inflated in public surveys by as much as 50%. Examining a larger sample of Catholic dioceses, Chaves and Cavendish (1994) similarly concluded that Catholic Church attendance based on individual counts was lower than self-‐reported attendance in surveys. Using data from the Presbyterian Church (USA), Marcum (1999) found that roughly twice as many Presbyterians report attending a religious service as can actually be found in church on a given Sunday. Subsequent efforts to refine survey questions to more accurately measure religious participation yielded lower rates than traditional survey-‐based estimates. Smith (1998) found that framing the question about participation in general by asking about religious service attendance along with other activities, such as eating out at a restaurant, reduced reports of regular religious attendance. Presser and Stinson (1998) found that self-‐administered questionnaires, and time-‐use questions that required respondents to mention everything they did within a designated time period, also elicited lower reported rates of worship attendance than traditional survey items. Yet, other work has suggested that the discrepancy between attendance counts and survey reports are the result of nonresponse error and biases based on coverage (Woodberry 1998). Woodberry (1998) argued that public opinion surveys systematically over-‐represent more religiously active Americans and thus produce inflated attendance rates. Religious Attendance and Social Desirability Bias The preponderance of evidence suggests that traditional survey questions that measure religious service attendance produce inflated rates of religious 3 According to Lifeway research, Southern Baptist-‐affiliated congregations reported an aggregate decline of more than one hundred thousand members in 2013. Public Religion Research Institute 3 I Know What You Did Last Sunday participation. Much of the previous work on why Americans overestimate their religious participation attributed the behavior to social desirability bias—the tendency for people to deny acting in ways that are inconsistent with prescribed norms or values. In the U.S., religiosity has been traditionally associated with morality and pro-‐social behavior. Two-‐thirds (67%) of the American public, for example, believe that it is important for children to be brought up in a religion so they can learn good values.4 Religiosity is also seen as a positive trait in elected officials.5 Because religious behaviors such as religious service attendance are widely regarded as positive, self-‐reported behavior is susceptible to exaggeration. Hadaway and Marler (2005, 308) noted that “inflation is to be expected in the case of behaviors that are socially approved, part of a frequent routine, or based on past experience.” Presser and Stinson (1998, 138) further concluded that questions about religious attendance may be misapprehended by respondents for whom the question is as much about self-‐perception—Am I a good Christian?—than it is about reporting actual behavior—How often do I attend church? When respondents report attending services every week to an interviewer, they may be attempting to signal to others positive information about themselves. The problem of social desirability bias is most pronounced when respondents believe they are sharing the information publicly, such as when questions are posed directly by an interviewer (Tourangeau and Smith 1996). There are several ways to mitigate the problem of social desirability bias. Smith (1998), for example, allowed respondents to signal to the interviewer that they are the type of person who regularly attends, even if they did not attend services in the previous week. The efficacy of these approaches in reducing social desirability bias is questionable, however, because respondents are still publicly sharing sensitive information. One of the most effective ways to minimize social desirability bias is to eliminate the public aspect of the data collection by removing the interviewer. Tourangeau and Smith (1996, 277), reviewing previous work on sensitive topics such as illicit drug use, found that “self-‐administration of sensitive questions increases levels of reporting relative to administration of the same question by an interviewer.” Data & Methods In the current study, we test the effect of removing the public factor by comparing the results of a series of identical questions that measure religious behavior, belief and belonging across different modes of administration: an online self-‐administered survey and a live interviewer telephone survey. Both surveys were conducted in 2013 among a random sample of adults age 18 and older currently living in the U.S. The telephone survey included 2,002 adult respondents; 60% were interviewed on a landline telephone and 40% were interviewed on a cellular telephone. The online survey was conducted among a random sample of 4 Public Religion Research Institute, American Values Survey, October 2013. 5 Public Religion Research Institute, PRRI/RNS Religion News Survey, May 2012. Public Religion Research Institute 4 I Know What You Did Last Sunday 2,317 adults who are part of GfK’s Knowledge Panel, a nationally representative probability sample of the U.S. population recruited through a process of address-‐
based sampling. Four questions were included in our analysis—religious affiliation, belief in God, frequency of religious attendance, and religious salience (the extent to which religion plays an important role in one’s life)—which were identically worded in both surveys.6 The order in which the questions appeared in each survey was not identical but roughly comparable. Respondents in each survey answered a series of questions about economic and political attitudes followed by a religious identity question. In both surveys, the religious attendance question immediately followed the question about religious affiliation. In the online survey, belief in God was asked immediately preceding the question about religious salience, while in the telephone survey the religious salience question came first. How Often Do Americans Really Attend Religious Services? Consistent with previous work, we find that when answering telephone surveys with live interviewers Americans report significantly higher rates of attendance than when they answer the same question in relative privacy that online surveys afford. On the telephone survey, 36% of Americans report attending religious services weekly or more, compared to 31% on the online survey. Unlike previous studies, which primarily focused on the tendency for Americans to over-‐
report weekly attendance, our results indicate that the greatest differences are found among those who say they seldom or never attend. Telephone survey respondents are 13 percentage points less likely than online respondents to say they seldom or never attend religious services (30% vs. 43%). Social desirability bias, therefore, appears to have the greatest impact on respondents’ willingness to admit that they never attend religious services. Online survey respondents are nearly twice as likely to report never attending religious services as those interviewed on a telephone (21% vs. 12%). The degree to which Americans over-‐report their religious participation varies considerably by religious affiliation. Among religious groups, Catholics and white mainline Protestants are more likely than white evangelical Protestants to over-‐report their levels of religious participation. When interviewed by telephone, fewer than 3-‐in-‐10 (28%) white mainline Protestants report that they seldom or never attend religious services, compared to 45% in the self-‐administered online survey. Catholics are less than half as likely to report seldom or never attending religious services when responding to a telephone versus online survey (15% vs. 33%). Among white evangelical Protestants, the differences between modes are less stark: 9% report they seldom or never attend religious services when speaking with a live interviewer, compared to 17% who report the same in a self-‐administered survey. Among black Protestants, the differences between modes are also not as glaring. Only 14% of black Protestants report seldom or never attending on a telephone survey, compared to nearly one-‐quarter (24%) on the online survey. 6 The exact question wording is included in Appendix 1. Public Religion Research Institute 5 I Know What You Did Last Sunday Surprisingly, the social desirability effects are strong among the religiously unaffiliated. While 73% say they seldom or never attend religious services in a telephone survey, that number jumps nearly 20 percentage points to 91% on an online survey. There are also notable differences between younger and older Americans in the degree to which they Table 1. Differences in Reported Religious Attendance over-‐report religious By Survey Mode Among Religious Groups involvement. Among young Percent reporting that they attend religious services… adults (age 18 to 29), fewer All Americans Telephone Online Diff. than one-‐third (31%) report 36 31 5 low levels when asked about Weekly or more Occasionally 33 25 8 attendance on a telephone Seldom or Never 30 43 -‐13 survey; in contrast, nearly half (49%) of young people White Evangelical Prot. Telephone Online Diff. report seldom or never Weekly or more 65 60 5 attending religious services Occasionally 26 23 3 when completing a self-‐
administered survey. The Seldom or Never 9 17 -‐8 difference among seniors is Black Protestant more modest. About one-‐
Telephone Online Diff. quarter (23%) of seniors say Weekly or more 54 40 14 they seldom or never attend Occasionally 30 34 -‐4 services when answering a Seldom or Never 14 24 -‐10 telephone survey, compared to 35% of seniors White Mainline Prot. Telephone Online Diff. interviewed online. There are Weekly or more 29 21 8 no significant differences Occasionally 42 34 8 between different racial or Seldom or Never 28 45 -‐17 ethnic groups and no significant gender differences Catholic Telephone Online Diff. in the tendency to over-‐
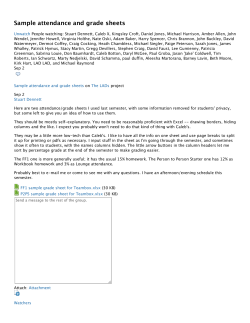
Weekly or more 41 34 7 report religious service Occasionally 44 34 10 attendance. Over-‐reporting also Seldom or Never 15 33 -‐18 appears to be more common Unaffiliated in some parts of the country Telephone Online Diff. than others. Northeasterners Weekly or more 5 2 3 and westerners are much Occasionally 23 7 16 more prone to over-‐report Seldom or Never 73 91 -‐18 their levels of religious attendance than southerners. Sources: PRRI, Economic Values Survey, July 2013 (telephone); PRRI, American Values Survey, September 2013 (online). Roughly one-‐third (34%) of The occasional category includes respondents who say they attend telephone respondents living once or twice a month or a few times a year. in the Northeast say they seldom or never attend religious services, compared to nearly half (49%) who report online they seldom or never attend. Americans living in the West Public Religion Research Institute 6 I Know What You Did Last Sunday demonstrate equally dramatic differences in reported attendance depending on the administered survey mode. Among westerners, one-‐third (33%) of telephone respondents say they seldom or never attend services, while a majority (52%) of online respondents say the same. In contrast, southern respondents are much less likely to exaggerate their levels of attendance. Twenty-‐seven percent of telephone respondents from the South report that they seldom or never attend services compared to 35% of online survey respondents. Beyond Attendance: Self-‐Reports of Religious Affiliation, Religious Salience and Belief in God If American responses to survey questions about frequency of worship attendance lead to inflated estimates of religious participation due to social desirability bias, might the same process also affect self-‐reports of other religious traits, such as belief or the importance of religion? In this section we compare differences in religious salience, religious affiliation and belief in God across different survey administration modes. Religious Salience Most Americans report that religion is an important part of their lives.7 But the degree to which Americans report that religion is an important part of their lives varies between the different survey modes. When compared to reports of religious participation, the differences in reported religious salience between telephone survey and online survey respondents is more modest. More than 7-‐in-‐10 Americans polled by a live interviewer over the telephone say that religion is the most important thing in their life (27%) or that it is one among many important things in their life (45%). In contrast, approximately 6-‐in-‐10 Americans who completed online surveys report that religion is the most important (20%) or one among many important things in their life (43%). Online survey respondents are more likely to say religion is not important to them than telephone survey respondents (19% vs. 13%). 7 Public Religion Research Institute, American Values Survey, October 2013. Public Religion Research Institute 7 I Know What You Did Last Sunday Chart 2. Reported Differences in Religious Salience by Survey Mode 50 45 Percent who say religion is... 45 43 40 Religion is the most important thing in my life 35 30 27 Religion is one among many important things 25 20 20 15 14 13 19 15 Religion is not as important as other things Religion is not important 10 5 0 Telephone Survey Online Survey Among religious groups, the pattern of overstating religious salience differs from religious attendance. In fact, the differences about religious salience between survey modes are more about degree than type for most religious groups. The vast majority of affiliated Americans identify religion as incredibly important, but online respondents are more likely to say religion is one among many important things than the most important. For instance, among white evangelical Protestant telephone respondents, 54% say that religion is the most important thing in their life, while 40% say it is one among many important things. We find the inverse true among online respondents: white evangelical Protestants are less likely to say that religion is the most important thing in their life (44%), and more likely to say it is one among many important things (50%). The same pattern is evident among black Protestants. An overwhelming number of black Protestants, regardless of survey mode, report that religion is important. However, black Protestants responding to a telephone survey are more likely to say it is the most important thing than those answering the online survey (55% vs. 40%). There are more modest differences among Catholics, indicating that they are more likely to exaggerate church attendance than they are the personal salience of religion. When answering a telephone survey, Catholics are somewhat more likely to say religion is the most important thing in their life than when answering an online survey (22% vs. 14%). A majority of Catholics across interview modes report that that religion is one among many important things (60% online survey; 59% telephone survey). There are differences between older and young Americans as well. Among young adults, only 20% say religion is not important when interviewed on the telephone, but when completing an online survey, nearly 3-‐in-‐10 (29%) admit that religion is not important to them. Among seniors (age 65+), there is no significant Public Religion Research Institute 8 I Know What You Did Last Sunday percentage difference between those reporting that religion is not important by telephone or online (10% vs. 11%). Social desirability also appears to affect liberals and conservatives differently. Liberals interviewed on the telephone were far less likely to say religion is not important than those using self-‐administered online surveys (27% vs. 40%). In contrast, the responses from conservatives are roughly the same across survey modes with 4% of telephone respondents reporting that religion is not important compared to 6% of online survey respondents. Religious Affiliation Over the last two decades, the Chart 3. Mode Differences in percentage of Americans who do not Reported Religious AffiliaQon identify with any religious tradition has increased dramatically. Most surveys of Atheist AgnosXc Nothing in parXcular Americans find that roughly 1-‐in-‐5 adults are now religiously unaffiliated. 30 The results of telephone and online interviews find no significant difference in the overall number of Americans who claim no formal religious affiliation. Twenty-‐one percent of telephone respondents 20 reported their religious identity was atheist, agnostic or nothing in particularly. Similar numbers of online 14 survey respondents (18%) also 9 identified as members of one of these three categories. There also does not appear to be 10 an increase in atheist or agnostic self-‐
4 identity among online survey 4 respondents. Given the strongly negative views of atheists in the U.S., 5 4 we might expect substantial social 0 pressure to select a “safer” non-‐
Telephone Survey Online Survey religious identity, such as the “nothing in particular” category. However, this is not the case. Roughly equal numbers of telephone and online survey respondents identify as agnostic (4% in both modes) or atheist (4% telephone vs. 5% online). Belief in God Similar to religious affiliation, belief in God seems immune to social pressure. The patterns of responses about belief in God are nearly identical across survey modes. Roughly 6-‐in-‐10 (62%) Americans completing telephone surveys say that Public Religion Research Institute 9 I Know What You Did Last Sunday they believe God is a person with whom one can have a relationship, 25% say God is an impersonal force, and 8% say they do not believe in God. Among online respondents 61% say that they believe God is a person, 25% say God is an impersonal force, and 10% do not believe in the existence of God. Among different political, religious and demographic subgroups, there are no significant mode differences with one exception: the religiously unaffiliated. Secretly Secular? A New Look at the Religiously Unaffiliated Previous work that has documented the rise of America’s unaffiliated has noted that the group is not entirely irreligious despite eschewing formal religious attachments. Hout and Fischer (2002) concluded that the majority of those who have no religious preference hold rather conventional religious beliefs, leading the authors to label them “unchurched believers.” Moreover, the authors found that most of the increase among the unaffiliated was concentrated among those who have a more religious or spiritually friendly disposition, even if they remained detached from or suspicious about religious institutions. Yet these findings leave unanswered the question of how much social desirability bias Table 2. Secretly Secular? Differences in impacts the reporting of religious Religious Characteristics Among the attributes among the unaffiliated. Unaffiliated by Survey Mode As noted above, the Among the Religiously Unaffiliated unaffiliated appear to be strongly Telephone Online affected by social influence when it God is a person 30 19 comes to reporting religious God is an impersonal force 34 35 behavior. No other religious group Do not believe in God 31 43 demonstrates larger mode differences in reporting religious Telephone Online attendance than the religiously Religion is most important 4 3 unaffiliated. In reporting religious One among many 21 6 participation, only 36% of Not as important 25 17 unaffiliated telephone Religion i
s n
ot i
mportant 49 73 respondents say they never attend services. In sharp contrast, nearly twice as many (68%) of the Telephone Online More than once a week unaffiliated who completed the 2 1 online survey, report they never Once a week 3 1 attend services, a 32-‐point Once or twice a month 5 1 difference. A few times a year 18 6 There are also dramatic Seldom 37 23 differences in self-‐reports of Never 36 68 religious salience based on survey mode. Unaffiliated respondents of telephone surveys are much less likely than those completing online surveys to report that religion is not important in their life (49% vs. 73%). Compared to online respondents, unaffiliated telephone respondents are Public Religion Research Institute 10 I Know What You Did Last Sunday nearly three times as likely to say religion is the most important or one among many important things in their life (25% vs. 9%). Finally, even though there are no significant differences in the degree to which Americans overall report a belief in God, there is a notable difference among the unaffiliated. Among unaffiliated telephone respondents, 30% report a belief in a personal God, 34% say God is an impersonal force in the universe, and fewer than one-‐third (31%) do not believe in God. Unaffiliated online respondents, however, express a greater degree of skepticism. Only 19% of the unaffiliated who completed online surveys believe that God is a person, 35% say God is an impersonal force, and a plurality (43%) say they do not believe in God. Conclusion The U.S. religious landscape has undergone dramatic changes over the last few decades, at once becoming increasingly pluralistic accommodating a greater number of non-‐Christian communities, and also more secular. Yet our results confirm that, despite the shifting cultural and religious contours, there are powerful social incentives for Americans to embellish their religious résumés. Yet, if belief, belonging and behavior constitute the primary elements of individual religiosity, not all of these elements are equally likely to be misreported. Consistent with previous research, we find that Americans continue to over-‐
report their religious attendance on telephone surveys—although the degree to which they do so varies substantially between different religious traditions. Heretofore, research has not addressed whether other religious characteristics might also be prone to exaggeration. We find that Americans interviewed on telephone surveys also over-‐report religious salience, the extent to which religion is a central feature in their lives. Notably, the patterns of religious affiliation do not differ between the survey modes, nor does self-‐reported belief in God. It is perhaps not so surprising that patterns of religious affiliation and belief are stable across survey modes. Rising religious pluralism has wrought greater acceptance for alternative religious associations, attachments, and beliefs. The definition of what constitutes American mainstream religion has been steadily expanding over the last half-‐century, and, with only a couple of exceptions, the vast majority of Americans view different religious communities positively. This development has mitigated the importance of religious differences, while serving to highlight the division between the religious and the non-‐religious (Edgell et al. 2006). When deciding their vote for President, Americans now care more that candidates profess strong religious beliefs than they do about the particularity of their affiliations and beliefs.8 Americans prefer strongly religious candidates, but the actual congregation they attend or the particular beliefs they subscribe to appear to matter less. Further, with public confidence in institutional religion at an all-‐time 8 Public Religion Research Institute, American Values Survey, November 2011. Public Religion Research Institute 11 I Know What You Did Last Sunday low, describing oneself as a member of a religious congregation may not offer the same social benefit as describing oneself as religious.9 Going forward, at least as long as religiosity is a socially favorable trait in the American context, we would generally expect to find continued over-‐reporting of religious behavior and salience on telephone surveys, alongside more accurate reporting of particular religious affiliation and belief in God. The growing numbers of religiously unaffiliated Americans, as members of an out-‐group, may feel social desirability bias more acutely, as is reflected in their over-‐reporting of attendance, salience, and belief in God on telephone surveys indicates. 9 In 2012, Gallup found that only 44% of the public reported a great deal or quite a lot of confidence in church or organized religion, down from 60% just a decade earlier (in 2001). Saad, Lydia. “U.S. Confidence in Organized Religion at Low Point.” Gallup, July 12, 2012 Public Religion Research Institute 12 I Know What You Did Last Sunday Cited Works Chaves, Mark, and James C. Cavendish. 1994. “More Evidence on U.S. Catholic Church Attendance.” Journal for the Scientific Study of Religion 33(4): 376–81. Edgell, Penny, Joseph Gerteis, and Douglas Hartmann. 2006. “Atheists as ‘Other’: Moral
Boundaries and Cultural Membership in American Society.” American Sociological
Review 71(2): 211–34.
Hadaway, C. Kirk, and Penny Long Marler. 2005. “How Many Americans Attend Worship Each Week? An Alternative Approach to Measurement.” Journal for the Scientific Study of Religion 44(3): 307–22. Hadaway, C. Kirk, Penny Long Marler, and Mark Chaves. 1993. “What the Polls Don’t Show: A Closer Look at U.S. Church Attendance.” American Sociological Review 58(6): 741–
52. ———. 1998. “Overreporting Church Attendance in America: Evidence That Demands the Same Verdict.” American Sociological Review 63(1): 122–30. Hout, Michael, and Claude S. Fischer. 2002. “Why More Americans Have No Religious Preference: Politics and Generations.” American Sociological Review 67(2): 165–90. Hout, Michael, and Andrew M. Greeley. 1987. “The Center Doesn’t Hold: Church Attendance in the United States, 1940-‐1984.” American Sociological Review 52(3): 325–45. Marcum, John P. 1999. “Measuring Church Attendance: A Further Look.” Review of Religious Research 41(1): 122–30. Marler, Penny Long, and C. Kirk Hadaway. 1999. “Testing the Attendance Gap in a Conservative Church.” Sociology of Religion 60(2): 175–86. Presser, Stanley, and Linda Stinson. 1998. “Data Collection Mode and Social Desirability Bias in Self-‐Reported Religious Attendance.” American Sociological Review 63(1): 137–
45. Smith, Tom W. 1998. “A Review of Church Attendance Measures.” American Sociological Review 63(1): 131–36. Tourangeau, Roger, and Tom W. Smith. 1996. “Asking Sensitive Questions: The Impact of Data Collection Mode, Question Format, and Question Context.” The Public Opinion Quarterly 60(2): 275–304. Wade Clark Roof, and McKinney, William. 1987. American Mainline Religion. Rutgers University Press. Woodberry, Robert D. 1998. “When Surveys Lie and People Tell the Truth: How Surveys Oversample Church Attenders.” American Sociological Review 63(1): 119–22. Public Religion Research Institute 13 I Know What You Did Last Sunday Appendix 1 Question Order and Wording, Telephone vs. Online Surveys Source: PRRI, Economic Values Survey, July 2013 Mode: Telephone survey administered by live interviewers Now a few different questions... RELIG What is your present religion, if any? Are you Protestant, Roman Catholic, Mormon, Orthodox such as Greek or Russian Orthodox, Jewish, Muslim, Buddhist, Hindu, atheist, agnostic, something else, or nothing in particular? INTERVIEWER: IF R VOLUNTEERS “nothing in particular, none, no religion, etc.” BEFORE REACHING END OF LIST, PROMPT WITH: and would you say that’s atheist, agnostic, or just nothing in particular?] 1
Protestant (Baptist, Methodist, Non-‐denominational, Lutheran, Presbyterian, Pentecostal, Episcopalian, Reformed, Church of Christ, Jehovah’s Witness, etc.) 2 Roman Catholic (Catholic) 3 Mormon (Church of Jesus Christ of Latter-‐day Saints/LDS) 4 Orthodox (Greek, Russian, or some other orthodox church) 5 Jewish (Judaism) 6 Muslim (Islam) 7 Buddhist 8 Hindu 9 Atheist (do not believe in God) 10 Agnostic (not sure if there is a God) 11 Something else [SPECIFY] 12 Nothing in particular 13 Christian (VOL.) 14 Unitarian (Universalist) (VOL.) 99 Don't know/Refused (VOL.) IF SOMETHING ELSE OR DK/REF (RELIG = 11, 99) ASK: CHR Do you think of yourself as a Christian or not? {for RELIG back-‐coding purposes only} IF R NAMED A NON-‐CHRISTIAN RELIGION IN PREVIOUS QUESTION (e.g. Native American, Wiccan, Pagan, etc.), DO NOT READ (ENTER "NO" CODE 2) 1 Yes 2 No 9 Don't know/Refused (VOL.) Public Religion Research Institute 14 I Know What You Did Last Sunday IF CHRISTIAN (RELIG=1-‐4, 13 OR CHR=1), ASK: BORN Would you describe yourself as a "born-‐again" or evangelical Christian, or not? 1 Yes 2 No 9 Don't know/Refused (VOL.) ASK ALL: ATTEND Aside from weddings and funerals, how often do you attend religious services... more than once a week, once a week, once or twice a month, a few times a year, seldom, or never? 1 More than once a week 2 Once a week 3 Once or twice a month 4 A few times a year 5 Seldom 6 Never 9 Don't know/Refused (VOL.) Q.18 Which of the following comes closest to how you think about the place of religion in your life? [READ IN ORDER] {New} 1 Religion is the most important thing in my life 2 Religion is one among many important things in my life 3 Religion is not as important as other things in my life 4 Religion is not important in my life 9 Don’t know/Refused (VOL.) Q.19 Which comes closest to your view? [READ IN ORDER] [Holy book: If Christian or no religion (RELIG=1-‐4, 9, 10, 12, 13 OR CHR=1) insert “the Bible”; If Jewish (RELIG=5), insert “the Torah”; If Muslim (RELIG=6), insert, “the Koran”; If other non-‐Christian affiliations (RELIG=7,8,14 OR (RELIG=11 AND CHR=2,9)), insert “the Holy Scripture”; IF DK/REF IN RELIGION (RELIG=99) AND CHR=2,9, insert "the Bible"] 1 [Holy book] is the word of God, OR 2 [Holy book] is a book written by men and is not the word of God. 3 Other (VOL.) 9 Don’t know/Refused (VOL.) Public Religion Research Institute 15 I Know What You Did Last Sunday IF BELIEVE HOLY BOOK IS WORD OF GOD (Q19=1), ASK: Q.20 And would you say that [READ, IN ORDER]? 1 [Holy book] is to be taken literally, word for word, OR 2 Not everything in [Holy book] should be taken literally, word for word. 3 Other (VOL.) 9 Don’t know/Refused (VOL.) ASK ALL: Q.21 Which statement comes closest to your view of God: God is a person with whom people can have a relationship, God is an impersonal force, or I do not believe in God? 1 God is a person 2 God is an impersonal force 3 I do not believe in God 4 Both/Neither/Other (VOL.) 9 Don’t know/Refused (VOL.) Public Religion Research Institute 16 I Know What You Did Last Sunday Source: PRRI, American Values Survey, September 2013. Mode: Online survey, self-‐administered Now a few questions about you… RELIG What is your present religion, if any? 1 Protestant (Baptist, Methodist, Non-‐denominational, Lutheran, Presbyterian, Pentecostal, Episcopalian, Reformed, Church of Christ, Jehovah’s Witness, etc.) 2 Roman Catholic (Catholic) 3 Mormon (Church of Jesus Christ of Latter-‐day Saints/LDS) 4 Orthodox (Greek, Russian, or some other orthodox church) 5 Jewish (Judaism) 6 Muslim (Islam) 7 Buddhist 8 Hindu 9 Atheist (do not believe in God) 10 Agnostic (not sure if there is a God) 11 Nothing in particular 12 Just Christian 13 Unitarian (Universalist) 14 Something else [SPECIFY] IF CHRISTIAN (RELIG=1, 12 OR 14), ASK: BORN Would you describe yourself as a "born-‐again" or evangelical Christian, or not? 1 Yes 2 No ASK ALL: ATTEND Aside from weddings and funerals, how often do you attend religious services? 1 More than once a week 2 Once a week 3 Once or twice a month 4 A few times a year 5 Seldom 6 Never IF RELIGIOUS (RELIG=1-‐8, 10-‐14), ASK: DUAL Do you follow the teachings or practices of more than one religion? 1 Yes 2 No Public Religion Research Institute 17 I Know What You Did Last Sunday ASK ALL: Q.15 Which comes closest to your view? [Holy book: If Christian or no religion (RELIG=1-‐4, 9, 10, 12, 13 OR CHR=1) insert “the Bible”; If Jewish (RELIG=5), insert “the Torah”; If Muslim (RELIG=6), insert, “the Koran”; If other non-‐Christian affiliations (RELIG=7,8,14 OR (RELIG=11 AND CHR=2,9)), insert “the Holy Scripture”; IF DK/REF IN RELIGION (RELIG=99) AND CHR=2,9, insert "the Bible"] 1 [Holy book] is the word of God, OR 2 [Holy book] is a book written by men and is not the word of God. 3 Other [SPECIFY] IF BELIEVE HOLY BOOK IS WORD OF GOD (Q15=1), ASK: Q.16 And would you say that? 1 [Holy book] is to be taken literally, word for word, OR 2 Not everything in [Holy book] should be taken literally, word for word 3 Other [SPECIFY] ASK ALL: Q.17 Which statement comes closest to your view of God? {AVS 2012} 1 God is a person with whom people can have a relationship 2 God is an impersonal force 3 I do not believe in God Q.18 Which of the following comes closest to how you think about the place of religion in your life? 1 Religion is the most important thing in my life 2 Religion is one among many important things in my life 3 Religion is not as important as other things in my life 4 Religion is not important in my life Public Religion Research Institute 18


© Copyright 2026