
You Can Get There From Here - Victoria Transport Policy Institute
www.vtpi.org [email protected] 250-360-1560 You Can Get There From Here Evaluating Transportation System Diversity 4 June 2014 By Todd Litman Victoria Transport Policy Institute Abstract Transportation diversity (also called options, choice and multi-modalims) refers to the quantity and quality of transportation options available in a particular situation. It includes different modes, services and prices. Increased transport diversity can provide numerous benefits, including increased transport system efficiency, consumer savings, and support for equity objectives. Many of these benefits are overlooked or undervalued in conventional transport planning. This paper describes transportation diversity benefits, objectives and solutions. It discusses methods for evaluating transport diversity. Twentyfive specific transport options are considered, including various travel modes, substitutes for physical travel, and land use strategies that improve access. Originally published as: “You Can Get There From Here: Evaluating Transportation Choice,” Transportation Research Record 1756, TRB (www.trb.org), 2001, pp. 32-41. Todd Alexander Litman 2001-2014 You are welcome and encouraged to copy, distribute, share and excerpt this document and its ideas, provided the author is given attribution. Please send your corrections, comments and suggestions for improvement. You Can Get There From Here Victoria Transport Policy Institute Contents Introduction ..................................................................................................................... 2 Transportation Diversity Benefits ..................................................................................... 6 Network Analysis ............................................................................................................. 8 Barriers to Transportation Diversity ................................................................................. 9 Basic Access and Basic Mobility ................................................................................... 11 Optimal Level of Transportation Diversity ...................................................................... 13 1. 2. 3. Basic Access/Mobility ....................................................................................................... 13 Premium or Budget ........................................................................................................... 13 Optimal Transportation Market ......................................................................................... 13 Evaluation Methods ....................................................................................................... 14 Method 1 Transportation Diversity Indicators ...................................................................... 14 Method 2: Solving Specific Problems from Inadequate Transportation Options ...................... 15 Method 3: Strategic Planning For Transportation Options ........................................................ 16 Method 4: Evaluating Individual Transportation Options .......................................................... 17 Summary ................................................................................................................................... 33 Method 5: Network Analysis of Transportation Diversity .......................................................... 34 Method 6: Planning Process Analysis of Transportation Diversity ........................................... 35 Land Use Factors .......................................................................................................... 36 Evaluating Investments That Increase Transportation Diversity .................................... 36 Conclusions .................................................................................................................. 37 Acknowledgements ....................................................................................................... 38 References.................................................................................................................... 39 A motorist driving on a rural road stops to ask an old farmer for directions to a nearby town. The farmer ponders the question and replies, “I’m afraid you can’t get there from here.” This old joke is amusing because it contradicts what we know of transportation. Given accurate directions and sufficient fuel a motorist can reach nearly any location on a public road. But if the visitor were walking, the situation might not be so funny. Rather than suggesting that the destination is generally inaccessible, it could mean, “You can’t get there, at least not the way you are traveling.” It is tragic rather than comic if some groups of people have inferior transportation options. 1 You Can Get There From Here Victoria Transport Policy Institute Introduction Diversity is a valuable attribute. Investors want diversified portfolios. Communities want diversified economies. People want diverse activities in their lives. Engineers recognize that diversity helps increase system resilience, for example, by having multiple routes in a network or sources or energy. Similarly, there are benefits to transport system diversity. Transportation diversity (also called options, choice and multi-modalism) refers to the quantity and quality of transport options available in a particular situation. This can include different modes, services, pricing structures, and destinations. Diverse Terms For Transport Diversity Various terms are used to describe transport diversity. It is sometimes called travel choice, but the word choice is both a noun (“having options”) and a verb (“making a decision”), so to avoid confusion I prefer the terms options for specific options, and diversity for the availability of various options. Another term is multi-modalism (a transport system which offers users multiple forms of mobility and accessibility), in contrast to automobile dependency (a transport system designed for automobile travel, which provides poor access by other modes). Multi-modalism means that most common destinations can be reached conveniently without a car, so non-drivers (people who for any reason cannot drive an automobile) do not bear excessive delay, discomfort, risk or financial costs. Because travel demands are diverse (users differ in their needs and preferences), transport efficiency and equity tend to increase with system diversity, which allows travelers to choose the best option for each trip. For example, shorter-distance trips by physicallyable people are most efficiently made by non-motorized modes, longer-distance trips on major urban corridors are often most efficiently made by public transport, and longerdistance trips to dispersed destinations are most efficiently made by automobile. An efficient transport system should also accommodate people with disabilities, low incomes, inability to drive and heavy loads. Table 1 compares automobile-dependent and multi-modal transport systems ability to meet various transport demands. Motorist can still drive (although somewhat slower) in a multi-modal transport system, but a non-motorist has significantly reduced accessibility in an automobile-dependent transport systems. Automobile dependency forces most travel to be made by personal automobile, even when inconvenient or costly. A diversified, multi-modal transport system provides more options so travelers can choose the best mode for each trip. For example, automobile dependency causes many seniors and young people drive despite their relatively high crash risk because they have no alternative, or they must rely on family members and friends to chauffeur them. It can force lower-income households to own more vehicles than affordable. A more multimodal transport system allows seniors, youths, and lower-income households to rely more on alternatives, reducing the costs they bear and impose on others. As a result, a more diverse transport system tends to increase transport system efficiency by allowing users to choose the most cost effective option for each trip. 2 You Can Get There From Here Victoria Transport Policy Institute Table 1 Travel Demand Meeting Travel Demands: Auto-Dependent Versus Multi-Modal Size Automobile Dependent Multi-Modal Consequences Driver commute 85-95% of commuters Drives Sometimes drives, but can use alternative modes when preferred. Multi-modalism allows drivers to choose the best option for each trip Non-driver commute 5-15% of commuters Requires chauffeuring Can use alternative modes Multi-modalism gives nondrivers options, and reduces chauffeuring costs. Travel by youths (people 10-20 years of age) 10-15% of population Requires chauffeuring Can use alternative modes, mainly walking and cycling. Multi-modalism gives youths independence and exercise, reduces chauffeuring costs Seniors (people over 65 years of age) 10-15% of population and growing Must drive, even if high risk, or must be chauffeured Can rely on alternative modes. Multi-modalism gives seniors independence, reduces chauffeuring costs Teenage males Small portion of total population, but high risk Must drive, even if high risk, or must be chauffeured Can rely on alternative modes. Is less likely to drive. Multi-modalism reduces high risk driving and chauffeuring costs. Lower-income households 20-40% of the population Relies on automobile travel, despite high financial burdens and risks. Relies on a mix of modes. Multi-modalism lets lower-income people save money and improve access. This table indicates how various types of trips are made in automobile dependent and multi-modal transport systems. “Driver” refers to somebody who is able to drive and has an automobile. “Nondriver” refers to somebody who for any reason cannot drive an automobile. Several recent issues highlight the importance of transport diversity: Concern about high risk drivers (young and old, and those with a history of crashes and traffic violations), and the importance of meeting their transport needs in ways that minimize the amount they drive, and allowing society to withdraw driving privileges when necessary by providing suitable alternatives to driving. Desire to increase restrictions on inebriated driving without spoiling peoples’ enjoyment or entertainment industries, by providing alternative options for traveling to and from restaurants, bars and pubs. Increasing concern about the public health risks associated with sedentary living, and the need to allow more walking and bicycling activity, both as a special activity and as part of normal utilitarian travel. Concerns about transport inaffordability, the high financial costs of automobile travel to lower-income households, and the financial risks of rising fuel prices. Desires to address specific planning problems, such as traffic and parking congestion, excessive energy consumption and pollution emissions, and to redevelop existing urban communities by creating more compact, mixed, walkable neighborhoods. 3 You Can Get There From Here Victoria Transport Policy Institute A more diverse transport system can respond to all of these concerns. Even people who continue to travel by automobile can benefit from reduced accident risk, road and parking facility costs, traffic congestion, pollution emissions and chauffeuring burdens. Many people intuitively appreciate the value of transportation diversity. If you know somebody with a physical disability you probably appreciate the importance of transport facilities and services that meet their needs. If you have experienced poverty you may recognize the value of more affordable transport options. If you enjoy walking, running or cycling you may value having facilities that accommodate these activities. Yet, these are often treated as special issues rather than general planning goals. For example, when evaluating potential ways to reduce traffic congestion, accidents and pollution, little consideration is generally given to the additional value provided by solutions that also improve transport options. Transport project economic analysis assigns a value to reduced congestion, accidents and pollution, but generally none to improved transportation diversity. This is not to suggest that public officials are unaware of these problems. To their credit, many public officials support walking, cycling, public transit and accessible land use polices more than is justified by their economic models. They realize that a diverse transport system can provide additional economic, social and environmental benefits. But this support for transport system diversity occurs despite, rather than because of, conventional economic analysis. Better understanding of transportation diversity benefits can help better incorporate this factor in transport policy and planning. Transport diversity supports other transport policy reforms, such as transport pricing. Road tolls and parking pricing tend to be more effective (a given price causes a greater reduction in peak-period vehicle trips) and less harmful to travelers if there are good alternatives to driving (Guo, et al. 2011). Figure 1 Automobile Mode Share 100% Automobile Owner Mode Share 80% Automobile Renter 60% Non-Driver 40% 20% 0% Auto Dependent Transport System Efficient Transport Pricing Efficient Pricing & Diverse Transport System With automobile dependent transport systems, efficient pricing causes relatively modest reductions in automobile travel. Pricing has much greater impacts if travelers have better transport options. 4 You Can Get There From Here Victoria Transport Policy Institute For example, a major study found that commuters’ responsiveness to congestion tolls is significantly affected by the quality transit services available: the overall average Hometo-Work vehicle trip price elasticity was approximately -0.04 (a 10% price increase causes a 0.4% commute trip reduction), but increased to -0.16 (a 10% price increase reduces commute trips 1.6%) for workers with the best transit service (PSRC 2005). Figure 1 illustrates these impacts. In an automobile dependent transport system, most travel is by automobile. With more efficient pricing (efficient road tolls and parking fees, distance-based vehicle insurance, and higher fuel taxes) people drive somewhat less, but automobile travel still dominates. With efficient pricing and improved transport options, automobile travel declines much more. This can be considered the economically optimal mode share, that is, the type and amount of travel that consumers choose if they have good travel options and efficient pricing (Litman 2006). This paper explores the value of transport diversity and practical ways to incorporate these values into planning. It describes various benefits to users and society from increased transport system diversity, barriers to increased transport diversity, methods for quantifying the benefits of specific transport options, examples of transport diversity analysis, and ways to increase transport system diversity. The Costs of Chauffeuring Chauffeuring refers to additional vehicle travel required to carry a passenger, in contrast to a rideshare trip in which a passenger is carried in an otherwise empty seat in a vehicle that would be making a trip anyway, and so does not increase vehicle travel. In automobile-dependent conditions non-drivers often require significant amounts of chauffeuring: children driven to and from school, recreational and social activities; people with disabilities driven to medical appointments and shopping; and out-of-town visitors being chauffeured to and from airports or train stations, and to various activities. Chauffeured travel is inefficient. It requires drivers’ time, increases vehicle travel (chauffeured trips often require an empty backhaul, so transporting a passenger 5 miles generates 10 miles of vehicle travel), and deprives passengers of independence. People sometimes value chauffeuring as an opportunity to socialize, such as a time when parents can talk with their children, but it can also generate stress and conflict, such as when a driver must interrupt an important activity to fulfill chauffeuring obligations, or when a passenger or driver misses a scheduled connection. Parents often complain about the time poverty and stress of chauffeuring, and seniors with declining ability are often reluctant to giving up driving because they do not want to lose their independence or burden others for rides. Studies indicate that both time poverty and reduced independence tend to reduce people senses of wellbeing and happiness (Curie and Delbose 2010). A diverse transport system with efficient non-automobile transport options (walking, cycling, public transit, taxi services, and telecommunications), can reduce the need for chauffeuring. More accessible land use, which minimizes travel distances, increases the portion of trips that can be made by walking, cycling and taxi. Transit-oriented development, with appropriate housing located in transit-rich areas can significantly reduce the need for chauffeuring. 5 You Can Get There From Here Victoria Transport Policy Institute Transportation Diversity Benefits This section describes specific benefits that can be provided by transport system diversity. Transportation diversity can provide various benefits: Efficiency. Improved transportation options can reduce traffic congestion, facility cost savings, increased road safety, environmental improvement and consumer cost savings by allowing travelers to choose the most cost-effective option for each trip. Consumer benefits and savings. Consumers benefit from options that allow them to save money, avoid stress, enjoy recreation and exercise, and reduce chauffeuring needs. Equity. Inadequate transport options often limit the personal and economic opportunities available to people who are physically, economically or socially disadvantaged. Option value. People who do not currently use an alternative mode may value its availability for possible future use when they are unable to drive. This is called option value (DfT 2006). Livability. Many people value travel options such as walking and cycling, and being in a community where these activities are safe, pleasant and common. Improved transport diversity can result in increased property values and commercial activity. In a typical community 20-40% of residents cannot or should not drive due to disability, poverty, age (too young), or lack of drivers’ license, and some trips are most efficiently made by non-automobile modes, such as neighborhood trips, commuting on congested urban corridors, or after drinking alcohol or drug consumption. Transport diversity is particularly important for these people and their family members or friends who would otherwise need to chauffeur them. Various methods can be used to quantify and monetize (measure in monetary units) the value that people place on having better transport options (DfT 2006; Stanley, et al. 2010). Many specific problems can be addressed by improving transport system diversity. For example, traffic congestion can be reduced by improving alternative modes on major corridors, and inadequate mobility for non-drivers can be addressed by improving the mobility options that serve economically and physically disadvantaged people in an area (Fan and Huang 2011). The value of transportation diversity becomes clearer if, instead of dividing travelers into a large group of motorists and a small group of non-motorists, we divide them into a small group who expect to always travel by automobile, and a larger group who expect to rely on other modes sometime during their life. Travelers who don’t use alternative modes may also benefit from reduced traffic and parking congestion, facility cost savings, reduced crash risk, and reduced pollution. Not all mobility options support all of these goals. For example, some public transit service is justified primarily for equity objectives and others primarily for efficiency objectives (“Transit Evaluation,” VTPI 2010). However, in general, a more diversified transportation system tends to provide these benefits. 6 You Can Get There From Here Victoria Transport Policy Institute Each transport mode has a unique performance profile, that is, a combination of abilities and constraints that determine the role it can play in an efficient transportation system. For example, walking is affordable and does not require special skill or a license, but it does require physical ability and is limited in speed, distance and carrying capacity. Automobile travel is more costly and requires a driver’s license, but it can travel faster, farther and can carry a relatively heavy load. Table 2 summarizes these factors. Table 2 Mode Travel Modes Performance Profiles Disadvantaged Users NonDrivers Poor Limitations Most Appropriate Uses Disability Walking Yes Yes Varies Wheelchair Yes Yes Yes Bicycle Yes Yes Varies Taxi Fixed Route Transit Paratransit Yes Limited Yes Yes Yes Yes Yes Yes Yes Auto driver No Limited Varies Ridesharing (auto passenger) Yes Yes Yes Carsharing (Vehicle Rentals) No Limited Varies Motorcycle Telecommute No Yes Limited Varies No Varies Requires physical ability. Limited distance and carrying capacity. Difficult or unsafe in some areas. Shorter trips by physically able people. Access trips to motorized mode Recreational trips. Requires sidewalk or path. Limited Short urban trips by people with distance and carrying capacity. physical disabilities. Requires bicycle and physical Short to medium length trips by ability. Limited distance and physically able people on carrying capacity. suitable routes. Infrequent trips, short and Relatively high cost per mile. medium distance trips. Short to medium distance trips Destinations and times limited. along busy corridors. High cost and limited service. Travel for disabled people. Requires driving ability and Travel by people who can drive automobile. High fixed costs. and afford an automobile. Requires cooperative automobile Trips that the driver would take driver. Consumes driver’s time if a anyway (ridesharing). special trip (chauffeuring). Occasional special trips (chauffeuring). Requires convenient and affordable Occasional use by drivers who vehicle rentals services. don’t own an automobile. Requires riding ability and Travel by people who can ride motorcycle. High fixed costs. and afford a motorcycle. Requires equipment and skill. Alternative to some types of trips. Each mode has a unique performance profile making it suitable for certain users and uses. 7 You Can Get There From Here Victoria Transport Policy Institute Network Analysis Transportation is provided by an integrated system, so transportation diversity should be evaluated at a network level. Current transport and land use systems generally serve motorists well. Motorists can drive to most destinations with modest cost, discomfort or risk. It is the non-automotive transportation system (i.e., the transport network that serves nondrivers) that tends to have the greatest weaknesses. Automobile-oriented (also called automobile dependent) transportation systems tend to provide inferior transport options for non-drivers (Newman and Kenworthy 1999; Litman 1999). Policies that favor driving (e.g., generous road and parking capacity, increased traffic speeds, development along busy highways) tend to create physical barriers to nonmotorized travel, provide poor accessibility for non-drivers, and reduce public support for alternative modes. Conversely, efforts to improve one type of transport can have positive spillover effects on other modes. For example, improving pedestrian conditions can improve access to transit. In automobile dependent areas each driver needs a personal automobile, but in areas with more multi-modal transport systems households tend to own fewer vehicles and rely more on walking, cycling and public transit. Only if consumers have viable mobility options does travel behavior necessarily reflect their true preferences. Current levels of automobile dependency result, in part, from market distortions that underprice automobile use, encourage urban sprawl, and reduce transportation diversity (“Market Principles,” VTPI 2000). Given better options and less distorted markets, consumers would probably drive significantly less, rely more on transportation alternatives, and be better off overall as a result (Litman 2006). It is important to evaluate transportation diversity in terms of accessibility (the ability to reach desired goods, activities and destinations) rather than just mobility (physical movement). Accessibility is affected by mobility, affordability, land use patterns, and mobility substitutes (such as telecommunications and delivery services). For example, from this perspective, accessibility can be improved by locating common destinations closer together, as well as improving mobility between destinations (Litman 2003). A more diverse transportation system can provide significant economic benefits. Households in communities with good transport options spend thousands of dollars a year less on transportation than households in automobile dependent communities (McCann 2000). This tends to increase regional economic development since motor vehicles and fuel expenditures tend to provide less employment and business activity than other types of consumer expenditures (“TDM and Economic Development” VTPI 2010). Increasing transportation system diversity can have important positive effects on the prestige of alternative modes. For example, when walking, cycling and public transit transport is only used by a small number of economically, socially and physically disadvantaged people, they tend to be stigmatized, further reducing their use. When they have a wider range of users, they receive more respect and public support. 8 You Can Get There From Here Victoria Transport Policy Institute Barriers to Transportation Diversity There are many barriers to improved transportation diversity. Existing planning practices and regulations discourage specialization and innovation in transportation markets. Motor carrier and taxi regulations tend to prohibit or severely limit development of new transportation services, often due to outdated objectives or entrenched interests. In many jurisdictions they prohibit virtually any form of transit service competition, and are often applied so broadly that an entirely new service and route is illegal, even if would not directly compete with existing transit (Klein, Moore and Reja 1997). For example, it is illegal for private companies to offer jitney or paratransit services even in areas or at times that conventional transit service is poor. Similarly, taxi regulations often discourage competition and innovations (Moore and Rose 1998). Land use regulations and development practices in most communities (such as minimum parking requirements and prohibitions on mixed land use) tend to favor automobile transport to the detriment of other forms of access. In many communities households searching for a home to rent or purchase must choose between living in an automobiledependent suburb with good schools and public services, or neighborhood with better transportation options but inferior schools and services. They often lack the option of having goods community services with good transportation diversity. Conventional transportation planning tends to undervalue many benefits of transport diversity because they tend to be difficult to measure and accrue to less powerful members of society. Planning that focuses on specific transport problems, such as traffic and parking congestion, pollution or crashes, tends to give little weight to other benefits associated with improved transport options. Most public officials are physically-able, middle-income motorists who may have little personal experience with the problems facing people who are transportation disadvantaged. Planning and funding practices often give little attention to transport options that are considered minor. For example, in most communities, integrating cycling and transit transport by installing bikeracks on buses and providing bike storage and rental services at transit stations would only serve a tiny portion of total personal travel needs, and only directly benefit a small portion of the population, mostly young and lower-income people. It might therefore be given little consideration in conventional planning, particularly by officials who don’t expect to depend on these services themselves. Yet, these may be important transport options for some people, improving their potential to access schools and jobs, or providing an opportunity to save money. They can have significant benefits if they help some household reduce their automobile ownership, providing substantial financial savings and leveraging a greater reduction in vehicle travel. It could be an important part of a comprehensive program that improves transit service and cycling conditions, and encourages use of alternative modes. In some regions of the world, a significant portion of commute and visitor transportation relies on such services. Pricing and management strategies that would improve transportation diversity are often politically difficult to implement. For example HOT lanes offer travelers new options: they can continue driving free in congestion, travel without congestion by using transit or 9 You Can Get There From Here Victoria Transport Policy Institute ridesharing, or travel without congestion by paying an extra fee (“Road Pricing,” VTPI 2000). Parking pricing allows motorists to pay for a more convenient parking space, or to use a cheaper or free space that is less conveniently located. Similarly, premium-priced, express commuter bus service can be faster and more comfortable than standard transit service. All of these directly benefits users, and indirectly benefit society if they reduce total vehicle travel. However, transport and the general public are reticent to implement these pricing and management options. Some people feel that they contradict the egalitarian tradition of transport service (all users should bear congestion and poor transit service discomfort equally). However, in practice, a single quality of service probably does little to achieve equity objectives. Higher income people can avoid much of the discomfort of congestion with flexible schedules, luxury cars and cellular telephones. They will simply drive rather than using inferior transit service. Even lower-income people may value having premium road, parking and transit options for occasional use. For example, low-income motorist may pay to use an HOT lane in an emergency. Similarly, a lower-income employee may be willing to pay extra for express bus service if they are feeling ill, or if the alternative is the even higher cost of driving an automobile. 10 You Can Get There From Here Victoria Transport Policy Institute Basic Access and Basic Mobility Basic Access refers to people’s ability to access goods, activities and destinations that are considered important to society, such as medical care and other essential services, schooling and employment, and a certain amount of social activities (“Basic Access,” VTPI (2010). Basic Mobility refers to mobility that provides basic access. A transport option is particularly valuable if it provides basic access to people who have significant unmet accessibility needs. In general, people who can drive and afford an automobile have relatively good mobility, except under urban peak conditions, or other situations where driving is constrained. The greatest unmet mobility needs are for people who for any reason are unable to drive or afford an automobile, and this is compounded for people with mobility disabilities. Serves Non-drivers Requires Driving Ability Private Airplane Air travel High Cost Automobile Paid Chauffeur Motorcycle Occasional taxi travel Carsharing Low Cost Public Transit Walking Transportation options that serve non-drivers and affordable provide the greatest transportation equity and basic mobility benefits. Described differently, most motorists are easily able to meet their basic access needs. Their marginal travel consists of relatively low-value mobility. But people who are economically, physically or socially disadvantaged often have significant unmet travel demand, so an increase in their mobility can provide significant benefits to those individuals and society, for example, allowing them to access medical services, school and employment opportunities. Conventional transportation planning focuses primarily on vehicle or personal mobility as an indicator of access, but physical movement is seldom an end in itself (except for the recreational travel that has no destination). Evaluating transport in terms of access allows a wider range of solutions to be considered for addressing transport problems (Litman 2003). Basic access (or basic mobility) means that people can obtain goods, services and activities that society considers important, such as emergency services, medical care, education, employment, and essential goods. Transportation disadvantaged refers to people who have significant unmet transportation needs. The six attributes listed in the table below may contribute to a person being 11 You Can Get There From Here Victoria Transport Policy Institute transportation disadvantaged. Somebody with just one or two of these attributes is not necessarily transportation disadvantaged. For example, a non-driver may have adequate transportation options if they are physically able, live in a community with good walking and transit services, and can afford taxi and delivery services when necessary. Similarly, a wheelchair user may have adequate transportation options if they can drive or afford a chauffeur, and live in a community that accommodates wheelchairs. However, adding one or two more attributes (for example, if the non-driver goes to an automobiledependent community, or if the wheelchair user cannot drive) can make them significantly transportation disadvantaged. Table 3 Attributes That Contribute to Transportation Disadvantage Transportation Ability Transportation Need Non-drivers. People who cannot drive or do not have access to a motor vehicle. Commuter. People who must make daily trips to work or school. Low Income. Drivers and non-drivers whose basic transportation needs are significantly constrained by financial limitations. Caregiving Responsibilities. Primary caregiver to non-driving dependents (children, elderly relatives, etc.). Disabled. People who have physical disabilities that limit their ability to travel independently. Automobile Dependency. Lives in a community with automobile-dependent transportation and land use patterns. Below are types of people that tend to be transportation disadvantage, and so should be given particular consideration in planning. Households that do not own an automobile. People with significant physical disabilities. Low-income households. Low-income single parents. People who are too young or old to drive. Recent immigrants from developing countries. Bailey (2004) uses the portion of residents who do not travel on a given day as reported in travel surveys as an indication of the number of people who are significantly transportation disadvantaged in a community. This study focused on elderly residents, but the same indicator could be used for other populations. It found that the portion of residents age 65+ who do not travel on an average day ranges from 44% up to 69%, and is affected by their ability to own an automobile, ability to drive, quality of walking conditions and transit services, and community design factors. 12 You Can Get There From Here Victoria Transport Policy Institute Optimal Level of Transportation Diversity Although there are clearly benefits to increased transportation options, it can be difficult to determine what level of diversity is optimal. It requires answering questions such as the level of subsidy that is justified for supporting alternative modes, the allocation of such subsidies between different modes, and the degree that use of one mode may be constrained in order to improve other modes. Below are three general conceptual approaches that can be used to determine the optimal level of transportation diversity. 1. Basic Access/Mobility This approach involves defining a basic level of access/mobility that all community residents should enjoy, and improve transport options until it is provided. 2. Premium or Budget This approach involves defining a reference premium or total budget that society should be willing to pay to improve transportation diversity. For example, when evaluating solutions to a transportation problem such as traffic congestion, decision-makers may favor those that increase transportation options, and be willing to pay up to a certain amount extra for diversity-improving options. 3. Optimal Transportation Market This approach involves estimating the level of transportation diversity that would occur in an undistorted market, which includes full cost pricing of transport unless a subsidy is specifically justified, economically neutral public policies, and least-cost planning. 13 You Can Get There From Here Victoria Transport Policy Institute Evaluation Methods This section describes six practical methods of evaluating transportation diversity. Transportation diversity is a complex issue, involving a variety of impacts, many of which are difficult to measure. There is no single best method for evaluating transportation diversity. Six possible methods are described below. They can be incorporated individually or in combination into a particular planning process. Method 1 Transportation Diversity Indicators Indicators are a conceptual tool that measures progress towards (or away from) a measurable objective. A set of indicators, such as the five defined in the box below, can be used to evaluate transportation diversity. Policies, projects or options can be rated according to how well they help achieve these objectives. These indicators can be modified as appropriate to meet the needs of a particular planning process. Transportation Diversity Indicators Equity Objectives Non-drivers. Does it improve access or otherwise benefit non-drivers? Low-incomes. Does it improve access or otherwise benefit people with lower incomes? Physical disabilities. Does it improve access or otherwise benefit people with disabilities? TDM Objectives Commuting. Does it improve access or support other TDM objectives (road safety, reduced environmental impacts) for commute trips. Non-Work Travel. Does it improve access or support other TDM objectives for non-work trips, including shopping, medical visits, recreation trip, and tourist travel. 14 You Can Get There From Here Victoria Transport Policy Institute Method 2: Solving Specific Problems from Inadequate Transportation Options This method involves identifying and addressing specific problems associated with inadequate transportation options. Examples include: Insuring that transportation disadvantaged patients can access medical services. Insuring that elderly residents can access shops and personal services. Insuring that low-income youths can access education and employment opportunities. Insuring that developmentally disadvantaged people can participate in social and recreational activities. Planners can identify individual solutions to these transportation problems, such as establishing a special mobility service, contracting with existing mobility service providers to provide additional trips, changing scheduled transit service to accommodate such needs, or subsidizing taxi service. This is a common approach to addressing such problems. However, it may not be the best approach because it defines problems and solutions narrowly. For example, providing weekday paratransit service intended to help elderly residents access medical services and stores may leave them unable to participate in evening and weekend social activities that users consider equally important. Some elderly non-drivers may sometimes prefer walking to stores, rather than being chauffeured for all trips. As much as possible, problems should be defined broadly and a wide range of solutions should be considered. For example, rather than defining a problem as a lack of bus service for elderly shoppers, it is better to define the problem as a lack of access for moderate-income non-drivers with limited physical ability. This broader problem definition allows a wider range of solutions to be considered. Users should be involved in defining the problem, identifying potential solutions, and establishing priorities, prices and rules. 15 You Can Get There From Here Victoria Transport Policy Institute Method 3: Strategic Planning For Transportation Options This approach involves categorizing policies and projects according to whether they tend to increase or reduce transport diversity (DfT 2003). It recognizes that transportation and land use decisions have cumulative and synergetic effects (Louis Berger & Associate 1998). Although the impacts of an individual decision may appear modest and difficult to measure, their general direction is usually predictable. Rather than modeling individual impacts, it may be best to simply categorize decisions according to whether they support or contradict strategic goals regarding transport diversity. For example, if a number of solutions are being considered to help solve a problem such as traffic congestion, possible solutions can be rated according to whether they increase or reduce transportation options. The table below categorizes the transportation diversity impacts of various polices and programs. This method can be modified to reflect the needs of a particular situation. Table 4 Policy and Planning Impacts on Transportation Diversity Tends to Increase Transport Options Tends to Reduce Transport Options Additional modes, such as new transit or carsharing services. Wider roads and new highways, particularly if they bisect communities. Pedestrian and cycling improvements. Increased motor vehicle traffic volumes and speeds. Traffic calming. Public transit improvements. Generous parking requirements and buildings designed for automobile access with poor pedestrian access. HOV priority measures. Transportation Demand Management programs. Low-density, homogeneous land use and urban fringe development. Pricing reforms that reduce automobile use (i.e., parking pricing, congestion pricing, distance-based insurance pricing). Pricing that encourages driving (e.g., free parking, low fuel taxes, fixed insurance) or increase the price of alternatives (transit fare increases). Land use policies favorable to transit and non-motorized transport, including higher densities, increased mix, and transit-oriented development. Anything that degrades pedestrian and cycling conditions. 16 You Can Get There From Here Victoria Transport Policy Institute Method 4: Evaluating Individual Transportation Options This method involves evaluating individual transport options in terms of various objectives. The following information is provided for 25 transport options: A description of the option. A discussion of demand for the option, including information on how to measure demand. Performance indicators, including Level of Service (LOS) standards if available. A table indicating how well that option helps achieve various transport diversity objectives. The Online TDM Encyclopedia (VTPI 2010) provides additional information. This framework can be modified as appropriate to include different options and objectives. Walkability Walkability refers to the overall quality of the pedestrian environment. Pedestrian travel is slow, averaging about 3 mph, and walking trip distances tend to be short, typically ¼ to ½ mile. As a result, even small changes in the pedestrian network can have a large effect on walkability. For example, reducing walking distance by a few hundred feet can significantly increase the feasibility of walking, particularly for people with disabilities or loads such as shopping or laundry. Demand Nearly everybody walks, but some people are particularly dependent on walking, including non-drivers, children, transit users, and tourists. Pedestrian travel tends to be more common in areas with suitable facilities, traffic conditions and land use patterns. Models are available for predicting pedestrian demand (“Evaluating N on-motorized Transport,” VTPI 2000). Performance Indicators Various standards and indicators can be used for evaluating walkability (Dixon, 1996; VTPI 2010, “Evaluating N on-motorized Transport). Performance indicators include: The number of barriers identified by pedestrians in surveys. Portion of streets with continuous and connected sidewalks, paths and crosswalks. Quality of pedestrian facilities, including functional width, surface condition, etc. Width and traffic volumes on roads to be crossed, and average crossing wait. Pedestrian security, including risk of falls and assaults. Support for Transportation Objectives Pedestrian improvements benefit people who are transportation disadvantaged, and support TDM objectives, both directly, and by improving access to transit. Support for Transportation Objectives Transportation Disadvantaged NonLowDrivers Income Pedestrian 3 3 Rating from 0 (no benefit) to 3 (very beneficial). 17 Physically Disabled 3 TDM Commuting 3 Non-Work Travel 3 You Can Get There From Here Victoria Transport Policy Institute Universal Design Universal Design or barrier-free design refers to facilities that accommodate people with diverse abilities and needs, including wheelchairs users, people who walk with difficulty or have visual disabilities, and pedestrians pushing strollers or handcarts. The term Universal Design is preferred to handicapped access because these design requirements can benefit many users, not just those with disabilities. Demand Demand for Universal Design requirements can be estimated based on the number of people in an area with physical disabilities (people using wheelchairs and walker, and who have severe visual disabilities), plus pedestrians with strollers and handcarts. Performance Indicators Several planning and professional organizations publish Universal Design guidelines and standards (Access Board 1998; Litman, et al. 1999). Performance indicators include: The number of mobility barriers identified by people with physical disabilities. The portion of the pedestrian network that meets barrier-free design standards. Availability of information on barrier-free facilities in an area. How well other modes (transit, taxies, long-distance travel services) accommodate people with special needs. Support for Transportation Objectives Universal Design benefits people who are physically disabled or using strollers and handcarts. Support for Transportation Objectives Transportation Disadvantaged NonLowDrivers Income Universal Design 1 1 Rating from 0 (no benefit) to 3 (very beneficial). 18 Physically Disabled 3 TDM Commuting 1 Non-Work Travel 1 You Can Get There From Here Victoria Transport Policy Institute Cycling Cycling is an important transportation option in some situations. Cyclists’ needs and preferences vary considerably. Some cyclists are comfortable riding on roads with heavy traffic, while others consider even moderate traffic a significant deterrent, and have a strong preference for separated facilities. Demand Cycling demand tends to be highest among certain demographic groups (children, young adults, some elderly), for local trips, in communities with suitable facilities. Models are available to predict cycling demand taking into account demographic, geographic and facility design factors (VTPI 2010, “Evaluating N on-motorized Transport”). Performance Indicators Dixon (1996) provides a relatively easy-to-use method for evaluating cycling Level of Service. VTPI 2010, “Evaluating N on-motorized Transport, summarizes other evaluation models. Performance indicators include: Barriers identified by cyclists. Roadway cycling conditions, including traffic volumes and speeds, lane widths, surface conditions, and presence of hazards such as potholes and railroad track crossings. Existence and quality of special cycling facilities, including separated paths, bike lanes and paved shoulder on highways and arterials. Quality of bicycle parking and changing facilities. Support for Transportation Objectives Cycling provides basic mobility for some transportation disadvantaged people, is inexpensive, and supports TDM objectives. Support for Transportation Objectives Transportation Disadvantaged NonLowDrivers Income Cycling 3 3 Rating from 0 (no benefit) to 3 (very beneficial). 19 Physically Disabled 1 TDM Commuting 3 Non-Work Travel 3 You Can Get There From Here Victoria Transport Policy Institute Moped Mopeds are small, low-powered motorcycles. They provide an inexpensive form of transportation that reduces parking and some environmental impacts. Mopeds travel at moderate speeds (averaging about 30 km/hr), with medium trip lengths, that are suitable for local roads but not major highways. Demand Moped travel demand varies significantly, depending on geographic, demographic, social and roadway condition factors. Performance Indicators Performance indicators include: Roadway cycling conditions, including traffic volumes and speeds, lane widths, surface conditions, and presence of special hazards to moped travel. Caution and respect for mopeds exhibited by motor vehicle drivers. Moped crash and injury rates. Affordability of mopeds and fuel relative to average incomes. Existence and quality of moped parking facilities. Support for Transportation Objectives Mopeds benefit some transportation disadvantaged people, including some with low incomes and physical disabilities. Some jurisdictions allow people too young to drive an automobile to drive a moped. Mopeds support some TDM objectives, including parking cost savings and fuel conservation. Support for Transportation Objectives Transportation Disadvantaged NonLowDrivers Income Moped 1 2 Rating from 0 (no benefit) to 3 (very beneficial). 20 Physically Disabled 1 TDM Commuting 1 Non-Work Travel 1 You Can Get There From Here Victoria Transport Policy Institute Taxi Taxis are an important mode in some situations (Trudel, 1999; Taxi-L): Non-drivers often rely on taxis for basic mobility, including emergencies, errands, shopping, and even commuting. Visitors who do not have an automobile (i.e., business travelers and tourists who arrive by airplane, ship or train). As a backup option to motorists (i.e., when a vehicle fails, drivers have drunk alcohol, etc.). Taxi service is often regulated, with restrictions on market entry and pricing, although many communities are shifting to more competitive markets (Moore and Rose, 1998). Informal taxi service often develops in rural communities where certain motorists will drive their neighbors for a fee. Demand Taxi demand is affected by the size of transportation disadvantaged population in an area, the portion of trips by transportation disadvantaged people that cannot be met by other modes, and the number of visitors who arrive in an area without a car. Potential users can be surveyed and taxi commissions or companies in similar communities can be consulted to develop demand estimates. Performance Indicators Performance indicators include: Average response time for various conditions and locations. Number of taxis per capita, or per non-driver in an area. Price for an average trip relative to users’ income. Comfort, safety, reliability, and courtesy of service. Number of taxis able to carry people with disabilities (i.e., wheelchair users). Number of problems reported by users. Support for Transportation Objectives Taxi service is an important transportation option for many people who are transportation disadvantaged. Conventional taxi travel does not reduce motor vehicle travel, and so does not support TDM objectives. Support for Transportation Objectives Transportation Disadvantaged NonLowDrivers Income Taxi 3 2 Rating from 0 (no benefit) to 3 (very beneficial). 21 Physically Disabled 3 TDM Commuting 0 Non-Work Travel 0 You Can Get There From Here Victoria Transport Policy Institute Transit Public transit includes various types of services, including: Fixed route bus. Express commuter bus. Light rail (smaller, lower-speed trams, in urban areas, with frequent stops). Heavy rail (larger, higher-speed trains, in suburban areas, with infrequent stops). Demand Models Most transportation models can provide information on public transit demand. More detailed studies are usually needed to determine how transit demand is affected by specific design or service changes. Performance Indicators Recent publications provide guidelines for evaluating public transit service quality (Kittelson & Associates, 1999; TRB 2010). The Local Index of Transit Availability (LITA) rates transit service availability within urban areas, taking into account demographic and geographic factors (Rood 1999). Transit service can be assessed with respect to specific mobility needs, such as welfare-to-work (Tomer, et al. 2011). Performance indicators include: Service coverage (transit routes within walking distance of residential, commercial and employment destinations) and frequency (number of transit vehicles per hour). Quality of pedestrian access to transit stops and stations. Service reliability, average wait time, and comfort (e.g., shelters at bus stops). Personal security while walking, waiting and riding on transit. Comfort (e.g., crowding and cleanliness of shelters and vehicles). Fares relative to users’ income. Average trip time costs, and how those compare with other modes (particularly driving). Number of problems reported by users. Support for Transportation Objectives Transit provides mobility to transportation-disadvantaged groups and helps achieve TDM objectives (VTPI 2010, “Social Benefits of Public Transit). Commuter bus and heavy rail services generally provide relatively little benefit to transportation disadvantaged groups and for non-work travel, although there may be exceptions. Support for Transportation Objectives Transportation Disadvantaged NonLowDrivers Income Fixed Route Bus 3 3 Commuter Bus 1 1 Light Rail 2 2 Heavy Rail 1 1 Rating from 0 (no benefit) to 3 (very beneficial). 22 Physically Disabled 3 1 2 1 TDM Commuting 3 3 3 3 Non-Work Travel 3 1 2 1 You Can Get There From Here Victoria Transport Policy Institute Paratransit Paratransit uses small buses or vans to provide various types of transportation services (VTPI 2010, “Shuttle Services”). Specific examples include: “Community Transportation” programs that provide special mobility services for disadvantaged groups. Flexible route, door-to-door transit service provided to the general public. This can be more efficient and attractive than fixed-route bus service in lower-density areas. Mobility-to-work programs that involve reverse-commute shuttle services between lowincome neighborhoods and suburban employment centers (Multisystems, et al., 2000). Private “jitney” mini-bus services. Demand Demand can be evaluated based on the size of the group that would use such services. Performance Indicators Paratransit can be evaluated with the same level-of-service factors used for public transit, modified to reflect targeted users. For example, special mobility services can be evaluated based on the quantity of trips provided per potential user. Performance indicators include: Number of trips provided per potential user (i.e., people who qualify for the service). Portion of trips requested that are served. Average response time. Price for an average trip relative to users’ income. Comfort, safety, reliability, and courtesy of service. Number of problems reported by users. Support for Transportation Objectives Paratransit provides mobility to transportation disadvantaged groups and helps achieve TDM objectives. These impacts depend on type of service. Support for Transportation Objectives Transportation Disadvantaged NonLowDrivers Income Community Transportation 2 2 Flexible-Route Transit 3 3 Mobility to Work 3 3 Private Jitney 3 3 Rating from 0 (no benefit) to 3 (very beneficial). 23 Physically Disabled 3 2 1 1 TDM Commuting 1 2 3 3 Non-Work Travel 1 1 0 2 You Can Get There From Here Victoria Transport Policy Institute Interregional Bus and Rail Interregional bus and rail services (e.g. Greyhound, Amtrak, Via Rail) provide mobility between cities and regions. Although most North American regions have rail or bus service, quality is often poor and prices are relatively high, making it unattractive and unaffordable to many users. In many communities, long-haul bus service is infrequent, connections are difficult, terminals are inconveniently located and unattractive, support services are minimal, buses are sometimes unpleasant, and costs are far greater than what motorists would pay to drive the same distance (the poor quality of interregional bus service is striking compared with the service quality, amenities and support provided to interregional air service). As a result of poor quality and high costs, in many areas interregional bus service is stigmatized and used only by people who have no practical alternative (low-income, nondrivers). Demand Interregional travel models and studies may provide information for predicting demand for interregional bus and rail. On some corridors, a portion of medium-distance (100-500 mile) journeys could use interregional bus and rail service, rather than personal automobile or air travel, if service quality improved. Performance Indicators Interregional bus and rail can be evaluated with similar level-of-service factors used for public transit, modified as needed to reflect the special needs of longer-distance trips. For example, interregional bus and rail must accommodate baggage, and may have seasonal peaks that should be considered. Performance indicators include: Existence and frequency of interregional bus or train service to a community. Price of interregional bus or train service relative to user incomes and other travel modes. Average trip speeds. Convenience of connections with other routes and transportation services. Comfort, safety, reliability, and courtesy of service. Comfort and convenience of terminals, including connections with local transportation. Number of problems reported by users. Support for Transportation Objectives Interregional bus and train service is an important transportation options for non-drivers, particularly for short- and medium-distance trips, and to destinations not served by commercial air service. It is not usually used for commuting. Support for Transportation Objectives Transportation Disadvantaged NonLowDrivers Income Intercity Bus and Rail Services 3 3 Rating from 0 (no benefit) to 3 (very beneficial). 24 Physically Disabled 3 TDM Commuting 1 Non-Work Travel 1 You Can Get There From Here Victoria Transport Policy Institute Commercial Air Travel Commercial air services provide mobility between cities and regions. Commercial air service requires a suitable airport. Due to economies of scale, commercial air travel is often more expensive in smaller communities than in major cities. Demand Interregional travel models and studies may provide information that may be useful in predicting demand for commercial air travel. Performance Indicators Performance indicators include: Existence and frequency of commercial air service in a community. Price of air travel relative to user incomes and other travel modes. Comfort, safety, reliability, and courtesy of service. Number of problems reported by users. Support for Transportation Objectives A portion of commercial air travel serves basic mobility, including access to special medical services and family emergencies, particularly in isolated communities. Air service does not usually support TDM objectives (i.e., reductions in traffic congestion, facility costs, risk, pollution or consumer costs). Support for Transportation Objectives Transportation Disadvantaged NonLowDrivers Income Commercial Air Service 2 1 Rating from 0 (no benefit) to 3 (very beneficial). 25 Physically Disabled 2 TDM Commuting 0 Non-Work Travel 0 You Can Get There From Here Victoria Transport Policy Institute Automobile This refers to motorists, which includes people who can drive a personal automobile or are chauffeured (a driver makes a special trip). For this analysis, “automobile” includes cars, light trucks, vans and motorcycles. Many transportation disadvantaged people are motorists, including people with physical disabilities and low incomes, although age restrictions, the physical requirements of driving, and the financial costs of owning and operating an automobile limits many people’s ability to drive. Various management and pricing options, such as those listed below, can improve transportation options for motorists (VTPI 2010): Distance-based Insurance makes insuring a low-annual-mileage vehicle more affordable, which can allow lower-income drivers to own a car, and other drivers to own an extra vehicle for special uses, such as an old truck for errands or a recreational vehicle. Some Parking Management strategies, such as improved user information, shared parking arrangement and overflow parking plans, give motorists better parking options. Parking Pricing can insure that motorists have a convenient parking space, provided that they are willing to pay for it. Road Pricing such as Value Pricing and HOT lanes, allow motorists to avoid congestion provided that they are willing to pay for it. Demand Models Conventional transportation demand models used in most communities provide information on automobile travel demand. Performance Indicators Level of Service standards exist for motor vehicle traffic flows (TRB, 1994). Performance indicators with respect to transportation options are described below. Portion of population licensed to drive. Portion of people with disabilities and low income licensed to drive. Portion of population that owns a personal automobile. Portion of people with disabilities and low income that own a personal automobile. Ability of drivers with disabilities to find convenient parking spaces. Support for Transportation Objectives Non-drivers are often chauffeured by automobile, and many lower-income and physically disadvantaged people drive automobiles. SOV travel does not support TDM objectives (which are often defined as reducing SOV travel). Support for Transportation Objectives Transportation Disadvantaged NonLowDrivers Income Automobile Travel 1 2 Rating from 0 (no benefit) to 3 (very beneficial). 26 Physically Disabled 2 TDM Commuting 0 Non-Work Travel 0 You Can Get There From Here Victoria Transport Policy Institute Ridesharing Ridesharing (carpooling and vanpooling) refers to a passenger using an otherwise empty automobile seat (ridesharing does not include chauffeured passengers, i.e., when drivers make a special trip). Rideshare matching services exist in many communities, and informal ridesharing is common among families, friends and neighbors. Demand Models No standard demand models currently exist for ridesharing. Performance Indicators Performance indicators include: Existence and quality of rideshare matching services in a community. Number of potential users registered by rideshare matching service. Number of successful rideshare matches and trips. Employee benefits offered rideshare users (such as Parking Cash Out). Support for Transportation Objectives Ridesharing benefits all categories of transportation-disadvantaged people, and supports TDM objectives. Support for Transportation Objectives Transportation Disadvantaged NonLowDrivers Income Ridesharing 3 3 Rating from 0 (no benefit) to 3 (very beneficial). 27 Physically Disabled 3 TDM Commuting 3 Non-Work Travel 3 You Can Get There From Here Victoria Transport Policy Institute Vehicle Rentals and Carsharing Vehicle rentals are common but mostly oriented toward particular markets, such as visitors to an area or people who need a van or truck to move a large load. Carsharing is an automobile rental service designed to substitute for private vehicle ownership (VTPI 2010, “Carsharing”). Vehicles are rented by the hour, located near residences, and require minimal effort to check in and out. Demand Models Vehicle rentals are used by lower-income drivers who don’t own an automobile, whose vehicle is temporarily not operating, who need a particular type of vehicle (such as a truck or van), or who are visiting another community. Carsharing tends to be most attractive to low- and middle-income residents of higher-density urban neighborhoods with good travel alternatives (i.e., good walking, cycling and public transit). It is considered a cost-effective alternative to owning an automobile that is driven less than 6,000 miles (10,000 kilometers) annually. Experience in Europe indicates considerable demand in some communities. Performance Indicators Performance indicators include: Number of rental and carshare vehicles per capita. Portion of residents living within a 10-minute walk of a carsharing station. Portion of population that regularly uses carsharing services. Vehicle rental and carshare rates relative to user income. Support for Transportation Objectives Vehicle rentals and carsharing benefits people who are low income. Because carsharing tends to reduce total per capita driving, it supports TDM objectives compared with car ownership. Support for Transportation Objectives Transportation Disadvantaged NonLowDrivers Income Vehicle Rentals and Carsharing 0 3 Rating from 0 (no benefit) to 3 (very beneficial). 28 Physically Disabled 1 TDM Commuting 2 Non-Work Travel 2 You Can Get There From Here Victoria Transport Policy Institute Telecommunications Electronic communications (telephones, Internet, and other communications services) can substitute for some physical trips, including work or school commutes, shopping, banking, government transactions, and research (Plaut, 1997; VTPI 2010, “Tele-work). Demand Models Demand for telephones is nearly universal, and demand for Internet access is increasing as people become more familiar with the technology, and its practical uses. Organizations such as the International Telework Association and the Canadian Telework Association have developed guidelines indicating which employment categories, tasks and employees are most suitable for telecommuting. Performance Indicators Performance indicators include: Portion of households with telephone and Internet access. Portion of transportation-disadvantaged people telephone and Internet access. Portion of employers who allow telework. Portion of public services (banks, government agencies, libraries, etc.) that can be performed by telephone or Internet. Support for Transportation Objectives Telecommunications can benefit most transportation-disadvantaged people, and it can support TDM objectives, although how much this reduces automobile travel is uncertain. Support for Transportation Objectives Transportation Disadvantaged NonLowDrivers Income Telecommunications 3 3 Rating from 0 (no benefit) to 3 (very beneficial). 29 Physically Disabled 3 TDM Commuting 3 Non-Work Travel 3 You Can Get There From Here Victoria Transport Policy Institute Delivery Services Delivery services include postal systems, private couriers, and local delivery services for goods such as groceries. Such services can provide basic access for transportationdisadvantaged people and substitute for some car trips. Demand Models Various types of deliveries have different types of demand. There is no demand model for all types of delivery. Performance Indicators Various types of delivery services have different performance standards related to what can be carried, delivery speed, cost, etc. Range and quality of package delivery services (such as the availability and price of guaranteed overnight delivery). Portion of retail businesses (particularly those providing essential goods, such as grocery stores and pharmacies) that deliver, and the charges required. Support for Transportation Objectives Delivery services can benefit most transportation disadvantaged people, support telework (working at home), and substitute for some non-work travel. Support for Transportation Objectives Transportation Disadvantaged NonLowDrivers Income Delivery Services 3 2 Rating from 0 (no benefit) to 3 (very beneficial). 30 Physically Disabled 3 TDM Commuting 1 Non-Work Travel 3 You Can Get There From Here Victoria Transport Policy Institute Transportation Management Various transportation management strategies can improve transport diversity (VTPI 2010): Flextime allows employees to adjust their travel schedules. Parking Cash Out allows commuters to choose between receiving free parking or another transportation benefit. Guaranteed Ride Home provides commuters with a fallback commute option. HOT lanes allow motorists the option of avoiding congestion if they pay a toll or rideshare. Most commute trip reduction, campus and school trip management, tourist trip management, and freight transport management programs improve transportation options and information about these options. Some transportation management strategies have mixed impacts on transportation diversity. For example, Traffic Calming and New Urbanist development practices tend to improve n on-motorized transportation and transit, but reduces motorists’ option of driving fast or taking short cuts through neighborhoods. Demand There tends to be considerable demand for transportation management strategies that increase diversity. Performance Indicators Performance indicators include: Implementation of TDM and Commute Trip Reduction programs. User involvement in developing TDM programs. Consideration of transportation diversity objectives in transport and TDM program planning. Least-cost transportation planning. Support for Transportation Objectives Transportation management strategies that improve transportation diversity can benefit people who are transport disadvantaged and help support TDM objectives. Some strategies primarily affect commuters, and HOT lanes provide minimal benefit to nondrivers and low-income people. Transportation management programs can support all transport diversity objectives, depending on their design and conditions. Support for Transportation Objectives Transportation Disadvantaged NonLowDrivers Income Flextime 3 3 Parking Cash Out 3 3 Guaranteed Ride Home 3 3 HOT lanes 1 1 TDM Programs 3 3 Rating from 0 (no benefit) to 3 (very beneficial). 31 Physically Disabled 3 3 3 3 3 TDM Commuting 3 3 2 3 3 Non-Work Travel 0 0 0 2 3 You Can Get There From Here Victoria Transport Policy Institute Land Use Management A variety of land use factors affect access and transport diversity (VTPI 2010, “Land Use Impacts on Transportation”). Below are examples of land use management strategies that can improve access and transportation diversity: Increased land use density and mix (Smart Growth or New Urbanism). Transit Oriented Development and clustered commercial centers. Location-Efficient Housing, which maximizes the economic benefits to households that result from choosing a more accessible home location that reduces transportation costs. Demand Some studies indicate significant demand for New Urbanist and Location-Efficient housing, suggesting that some consumers prefer living in areas that offer improved transportation diversity. Performance Indicators Performance indicators include: Average annual per capita vehicle mileage. Average number of public services (e.g., schools, shops, medical offices) and employment within a ½ mile walk of residents. Overall quality of transit, walking and cycling conditions in an area. Affordability and quality of accessible neighborhoods, particularly for people who are transportation disadvantaged (i.e., can non-drivers afford to live in a nice neighborhood with good walking and cycling conditions, and good transit service). Degree to which zoning laws and development policies support accessible land use objectives (e.g., urban infill, clustering, Transit Oriented Development, etc.). Support for Transportation Objectives Land use management strategies that improve transportation diversity can benefit people who are transportation disadvantaged and help support TDM objectives. Support for Transportation Objectives Transportation Disadvantaged NonLowDrivers Income Smart Growth/New Urbanism 3 3 Transit Oriented Development 3 3 Location Efficient Housing 3 3 Accessible Employment Centers 3 3 Rating from 0 (no benefit) to 3 (very beneficial). 32 Physically Disabled 3 3 3 3 TDM Commuting 3 3 2 3 Non-Work Travel 3 3 3 1 You Can Get There From Here Victoria Transport Policy Institute Summary The table below summarizes how the twenty-five transportation options described above support the five transportation diversity objectives. This can help identify options that are particularly appropriate for achieving a particular objective. This analysis can be modified to meet the values and needs of a particular planning application. Table 5 Summary of Transportation Diversity Evaluation Transportation Disadvantaged NonLowPhysically Drivers Income Disabled Mobility Options Pedestrian Universal Design Cycling Moped Taxi Fixed Route Bus Commuter Bus Light Rail Heavy Rail Intercity Bus and Rail Services Commercial Air Service Automobile Travel Ridesharing Vehicle Rentals and Carsharing Mobility Substitutes Telecommunications Delivery Services Transportation Management Flextime Parking Cash Out Guaranteed Ride Home HOT lanes TDM Programs Land Use Management Smart Growth/New Urbanism Transit Oriented Development Location Efficient Housing Accessible Employment TDM Non-Work Commuting Travel 3 1 3 1 3 3 1 2 1 3 2 1 3 0 3 1 3 2 2 3 1 2 1 3 1 2 3 3 3 3 1 1 3 3 1 2 1 3 2 2 3 1 3 1 3 1 0 3 3 3 3 1 0 0 3 2 3 1 3 1 0 3 1 2 1 1 0 0 3 2 3 3 3 2 3 3 3 1 3 3 3 3 3 1 3 3 3 3 1 3 3 3 3 3 3 3 3 2 3 3 0 0 0 2 3 3 3 3 3 3 3 3 3 3 3 3 3 3 3 2 3 3 3 3 1 This table indicates how much each transportation option supports various objectives. 33 You Can Get There From Here Victoria Transport Policy Institute Method 5: Network Analysis of Transportation Diversity Below are some indicators that can be used to evaluate network level transport diversity. Comparing Transportation Costs of Drivers and Non-drivers Non-drivers can travel just about anywhere a driver can go, but their cost is often higher. A non-driver can hire a taxi or chauffeur, at a significant financial cost. They can walk or bicycle, but this often has high time, discomfort and risk costs. Transportation diversity can therefore be evaluated by comparing the generalized cost (financial and time, with time costs incorporating discomfort and risk factors) of travel between drivers and various types of non-drivers. This analysis can be disaggregated into different transportation disadvantaged groups, such as people with disabilities, people with low incomes, youths, elders, etc. The incremental costs they bear for basic access relative to motorists can be considered an indicator of transportation diversity. Comparing Household Transportation Expenditures Holtzclaw (1994) and McCann (2000) compare household surface transportation expenditures (i.e. automobile and transit) by geographic area. The higher expenditures associated with automobile-dependent land use can be considered, in part, to reflect a lack of transportation options. This analysis can also be disaggregated into different groups, such as households with low incomes, youths, elders, etc. For example, if lowincome residents in one area spend 30% more on transportation than otherwise similar residents in another area, the difference may be explained by differences in transport diversity. Higher expenditures may be considered a cost of inferior transport options. Mobility, Cost and Satisfaction Surveys Another approach for evaluating the quality of transportation diversity is to survey users (residents, commuters and visitors to an area) concerning the quality of transportation they experience, with special attention to comparing differences in mobility, costs and satisfaction between motorists (people who can driver and afford an automobile) and people who are transportation disadvantaged. Mode Split Another indicator of transportation diversity is the mode split in an area compared with otherwise similar communities. For example, a neighborhood with higher levels of walking, cycling and transit than other neighborhoods with similar demographics can be considered to offer relatively good transport options. Even relatively small differences (i.e., between 4% and 8% of total trips made by transit) may represent a significant difference the quality of service available to non-drivers. 34 You Can Get There From Here Victoria Transport Policy Institute Method 6: Planning Process Analysis of Transportation Diversity This approach evaluates how well the planning process incorporates transportation diversity objectives. The following are indicators of whether transportation diversity is given appropriate consideration and support. Transportation is evaluated based on access rather than vehicle traffic or mobility (VTPI 2010, “Measuring Transportation”). Non-motorized trips are considered equally in travel surveys and models (VTPI 2010, “Evaluating N on-motorized Transportation”). Transportation surveys and other data collection activities effectively incorporate transportation-disadvantaged populations. Transportation disadvantaged populations are consulted and effectively involved in transportation policy and planning decisions. Transportation services and policy options are evaluated from different perspectives, including the perspectives of transportation disadvantaged people. Least Cost planning principles are followed in transportation planning and funding (VTPI 2010, “Least Cost Planning”). A broad range of costs is considered, including vehicle ownership costs, parking costs, safety and health costs, and environmental impacts. Equity and basic mobility objectives are incorporated in transportation planning (VTPI 2010, “Evaluating Equity”). Land use accessibility factors are considered in transportation planning (VTPI 2010, “Land Use Impacts on Transportation”). At least some neighborhoods are suitable for people who are transportation disadvantaged, with good walking and cycling conditions, good public transit services, and convenient access to basic services such as shops and parks (VTPI 2010, Location Efficient Development,” and “Transit Oriented Development”). Transportation policies and planning practices support development and use of a wide range of transportation options, including n on-motorized travel, shuttle services, transit, carsharing, delivery services and tele-access. For example, Parking Cash Out is implemented to allow non-drivers benefits similar in value to parking subsidies, and Parking Management is implemented to allow non-drivers to avoid paying for parking spaces they don’t use. 35 You Can Get There From Here Victoria Transport Policy Institute Land Use Factors As mentioned earlier, land use patterns affect accessibility and transport system quality. Automobile-oriented land use patterns are offer few transportation options for nondrivers, making them mobility disadvantaged. Accessibility and basic mobility can be improved by locating more activities closer together, increasing land use mix, creating more connected road and path networks, and designing more mulit-modal streets. Evaluating Investments That Increase Transportation Diversity Many transportation diversity benefits are difficult to measure so it can be difficult to determine exactly how much society should invest in a particular option. It may seem most fair and efficient to allocate public resources based on current travel activity, so if walking represents 2% of travel then it should receive 2% of transport funding. From this perspective, many transport diversity improvements may seem inefficient and unfair. But current practices tend to create an inefficient, self-fulfilling prophecy: if alternative modes receive inadequate support, their quality of service is inferior, use is low, and so they continue to receive inadequate support. As a result, they may never achieve their true potential. There are several justifications for increasing support for alternative modes beyond what is indicated by current travel surveys and models. Current transportation surveys and models tend to undercount use of alternative modes, particularly n on-motorized travel (“Measuring Transportation,” VTPI 2000). Non-drivers and lower-income people tend to take shorter trips and travel less per year than motorists and higher income people. Much greater funding per passenger-mile can be justified for alternative modes in order for non-drivers to receive a fair share of transportation funds. For example, although since people who are transit dependent tend to travel less than one-third as many miles per day as motorists, an equal per capita expenditure would result in three times the public funding for transit as automobile travel per passenger-mile. Improvements to alternative modes may be justified to provide basic access. The most cost effective way to improve access to medical services, education, employment, and other basic services to transport disadvantaged people is often an improvement to non-automotive travel. Some alternative modes are particularly cost effective under urban-peak conditions, where automobile improvements are relatively expensive. Although transit improvements are expensive in congested urban areas, increasing roadway capacity on the same corridor is often even more expensive. Paths and trails for n on-motorized modes are justified for recreation as well as transportation purposes. For that reason, a portion of the cost of building such facilities can come from recreation budgets, rather than transportation budgets. The cost burden of automobile travel is dispersed, and so many costs tend to be ignored in conventional investment analysis. Vehicle ownership, parking facility expenses, and other external costs are often overlooked, making highway investments appear cheap relative to transit investments (VTPI 2010, “Evaluating TDM”). For these reasons, non-automobile transportation modes may deserve a far greater portion of transportation resources than indicated by their portion of trips or passenger-miles. 36 You Can Get There From Here Victoria Transport Policy Institute Conclusions Transportation diversity refers to the quantity and quality of transportation options available to an individual or group, taking into account their needs and abilities. It includes various modes, transport services and pricing options. Transport diversity can provide a variety of benefits. Increased options can help solve many specific transport problems, and tends to create a more efficient, equitable and robust transportation system. Transportation diversity includes not only the type of modes and vehicles, but also the range of service and price options available. For example, consumers can benefit from being able to choose between different levels of transit service, since they sometimes place greater value on financial savings and at other times on comfort or speed. Similarly, motorists can benefit from being able to pay for different levels of road and parking services, such as Value Pricing lanes that provide higher travel speeds for toll payers, and the option of more convenient but paid parking. Transportation options can also include improved pricing options such as carsharing, distance-based vehicle insurance, and Parking Cash Out. Because transport and land use are interrelated, transport diversity can also include land use and location options, such as the ability to afford living in a more accessible, less automobile-dependent neighborhood. Because many of these benefits are difficult to measure, it is difficult to determine exactly what level of transport diversity is optimal, but it is almost certainly greater than what is recognized by current planning practices. Transport and land use planning practices that unintentionally increase automobile dependency tend to be economically harmful and unfair, particularly if they reduce the options available to disadvantaged people. In order to evaluate transportation diversity it is useful to prioritize trips, recognizing that some types of transportation, called basic access, provide particularly high value to society. It would be difficult to underestimate the economic and social benefits of basic access, that is, the ability of people and industry to reach the goods, services and activities they need. This indicates that evaluating transportation diversity requires economic analysis, not simply engineering analysis. For example, it is not adequate to simply determine whether a particular travel option exists and is physically accessible, it is equally important to determine whether it is affordable, particularly to people who rely on it for basic access. In general, most transportation and land use systems do a good job of accommodating automobile transportation. Motorists can drive to most destinations with modest cost, discomfort or risk. Improving transport diversity involves improving alternatives to automobile transport, creating more accessible land use options, and providing new options for motorists, such as carsharing. Although most of these strategies individually affect only a small portion of total travel, they have large network effects if several coordinated strategies are implemented together. 37 You Can Get There From Here Victoria Transport Policy Institute Transportation diversity goals and solutions tend to be defined narrowly. Conventional transportation planning tends to recognize some, but not all of these benefits. Other benefits are difficult to measure and so are often overlooked and undervalued. Similarly, conventional planning tends to focus on a limited set of solutions, often a special mobility service to deal with a specific problem. This paper describes a more comprehensive range of transportation diversity objectives and solutions, and describes several methods for evaluating transportation options. Some methods focus on particular transportation problems, others on particular transportation modes, and others focus on the transportation planning process. These methods can be modified as needed to meet the requirements of a particular planning application. Twenty-five specific transportation options are considered, including mobility modes, substitutes for physical travel, and land use strategies that improve access. This is a broader range of solutions than is usually considered in transport planning. Many of these solutions are justified for a number of reasons, including consumer benefits, reduced transportation problems, economic benefits, and community livability. An optimal transport system would probably be more diverse, with better transport options and less automobile use. Acknowledgements Portions of this paper are based on research sponsored by the American Association of State Highway and Transportation Officials and the Federal Highway Administration through the National Cooperative Highway Research Program, Project 25-19. 38 You Can Get There From Here Victoria Transport Policy Institute References The Access Board (www.access-board.gov). Linda Bailey (2004), Stranded Without Options, Surface Transportation Policy Project (www.transact.org); at http://apta.com/resources/reportsandpublications/Documents/aging_stranded.pdf. Gary Barnes and Heather Dolphin (2006), An Exploratory Survey of Potential Community Transportation Providers and Users, University of Minnesota Center for Transportation Studies (www.cts.umn.edu); at www.cts.umn.edu/pdf/CTS-06-08.pdf. Evelyn Blumenberg and Gregory Pierce (2012), “Automobile Ownership and Travel By The Poor,” Transportation Research Record 2320, Transportation Research Board (www.trb.org), pp. 28-36, http://trb.metapress.com/content/c55v7w5212611141. CTOD (2011), Transit and Regional Economic Development, Center for Transit Oriented Development (www.ctod.org/portal); at http://reconnectingamerica.org/assets/Uploads/TransitandRegionalED2011.pdf. CTOD (2011), Transit and Regional Economic Development, Center for Transit Oriented Development (www.ctod.org/portal); at http://reconnectingamerica.org/assets/Uploads/TransitandRegionalED2011.pdf. Graham Currie and Alexa Delbose (2010), “Modelling the Social and Psychological Impacts of Transport Disadvantaged,” Transportation, Vol. 37, No. 6, pp. 953-966; abstract at www.springerlink.com/content/e1j732870x124241. DfT (2003), Transport Analysis Guidance: 3.6.1: The Option Values Sub-Objective, Department for Transport (www.dft.gov.uk); at www.dft.gov.uk/webtag/documents/expert/unit3.6.php#3.6.1. Linda Dixon (1996), “Bicycle and Pedestrian Level-of-Service Performance Indicators and Standards for Congestion Management Systems,” Transportation Research Record 1538, pp. 1-9. Yingling Fan and Arthur Huang (2011), How Affordable is Transportation? An AccessibilityBased Evaluation, CTS Report 11-12, Transitway Impacts Research Program, Center for Transportation Studies (www.cts.umn.edu); at www.cts.umn.edu/Publications/ResearchReports/reportdetail.html?id=2024. Gerard Fitzgerald (2012), The Social Impacts Of Poor Access To Transport In Rural New Zealand, Research Report 484, NZ Transport Agency (www.nzta.govt.nz); at www.nzta.govt.nz/resources/research/reports/484/docs/484.pdf. David J. Forkenbrock and Glen E. Weisbrod (2001), Guidebook for Assessing the Social and Economic Effects of Transportation Projects, NCHRP Report 456, TRB (www.trb.org). Genevieve Giuliano and Jacqueline Golog (1998), “Impacts of the Northridge Earthquake on Transit and Highway Use,” Journal of Transportation Statistics, Vol. 1, No. 2, May; at www.bts.gov/publications/journal_of_transportation_and_statistics/volume_01_number_02/jts_v1_n2.pdf . 39 You Can Get There From Here Victoria Transport Policy Institute Zhan Guo, et al. (2011), The Intersection of Urban Form and Mileage Fees: Findings from the Oregon Road User Fee Pilot Program, Report 10-04, Mineta Transportation Institute (http://transweb.sjsu.edu); at http://transweb.sjsu.edu/PDFs/research/2909_10-04.pdf. John Holtzclaw (1994), Using Residential Patterns and Transit to Decrease Auto Dependence and Costs, National Resources Defense Council www.nrdc.org. Anthony C. Homan (2012), Using Option Pricing Theory in Valuing Benefits from Transit Projects, U.S. Department of Transportation (www.transportationresearch.gov); at www.transportationresearch.gov/dotrc/eco/Shared Documents/Option Value of Transit.docx. Kittelson & Associates (1999), Transit Capacity and Quality of Service Manual, Web Document 6, TCRP A-15, TRB (www.trb.org); at www4.nationalacademies.org/trb/crp.nsf/All+Projects/TCRP+A-15. Daniel Klein, Adrian Moore and Binyam Reja (1997), Curb Rights: A Foundation for Free Enterprise Urban Transit, Brookings Institution Press (Washington, DC; www.brookings.edu). Todd Litman (1994), “Quantifying Bicycling Benefits for Achieving TDM Objectives,” Transportation Research Record 1441, TRB (www.trb.org), pp. 134-140; updated version titled, Evaluating Non-Motorized Transport Benefits and Costs; at www.vtpi.org/nmt-tdm.pdf. Todd Litman (2001), “You Can Get There From Here: Evaluating Transportation Choice,” Transportation Research Record 1756, Transportation Research Board (www.trb.org), pp. 32-41. Todd Litman (2003), “Measuring Transportation: Traffic, Mobility and Accessibility,” ITE Journal (www.ite.org), Vol. 73, No. 10, October, pp. 28-32; at www.vtpi.org/measure.pdf. Todd Litman (2005), Transportation Cost and Benefit Analysis, Victoria Transport Policy Institute (www.vtpi.org/tca). Todd Litman (2006), Socially Optimal Transport Prices and Markets, Victoria Transport Policy Institute (www.vtpi.org); www.vtpi.org/sotpm.pdf. Todd Litman (2007), Build for Comfort, Not Just Speed: Valuing Service Quality Impacts In Transport Planning, VTPI (www.vtpi.org); at www.vtpi.org/quality.pdf. Todd Litman (2007), Land Use Impacts on Transport: How Land Use Factors Affect Travel Behavior, VTPI (www.vtpi.org); at www.vtpi.org/landtravel.pdf. Todd Litman (2007), Evaluating Accessibility for Transportation Planning, Victoria Transport Policy Institute (www.vtpi.org); at www.vtpi.org/access.pdf . Todd Litman (2008), Comprehensive Transport Planning: Best Practices For Evaluating All Options And Impacts, VTPI (www.vtpi.org); at www.vtpi.org/comprehensive.pdf. Todd Litman (2008), Celebrate (Transportation) Diversity!, Planetizen Blogs (www.planetizen.com); at www.planetizen.com/node/30539. Todd Litman (2009), Evaluating Public Transit Benefits and Costs, VTPI (www.vtpi.org); at www.vtpi.org/tranben.pdf. 40 You Can Get There From Here Victoria Transport Policy Institute Karen Lucas and Sophie Tyler (2006), Evaluating The Contribution of Transport Projects to Welfare To Work: An International Study, Transportation Research Board 85th Annual Meeting (www.trb.org); available at www.mdt.mt.gov/research/docs/trb_cd/Files/06-0309.pdf. Louis Berger & Associates (1998), Guidance for Estimating the Indirect Effects of Proposed Transportation Projects, Report 403, Transportation Research Board (www.trb.org). Barbara McCann (2000), Driven to Spend; The Impact of Sprawl on Household Transportation Expenses, STPP (www.transact.org). Adrian T. Moore and Tom Rose (1998), Regulatory Reform at the Local Level, RPPI Policy Study No. 238 (www.urbanfutures.org/ps238.html#A1). Multisystems, et al (2000), Welfare to Work: Integration and Coordination of Transportation and Social Services, TCRP Web Document 16, TRB (www4.national-academies.org/trb/crp.nsf). P. Newman and J. Kenworthy (1999), Sustainability and Cities; Overcoming Automobile Dependency, Island Press (www.islandpress.org). NGA (2000), In the Fast Lane: Delivering More Transportation Choices to Break Gridlock, National Governors Association Center for Best Practices (www.nga.org/Center). Pnina Ohanna Plaut (1997), “Telecommunications Vs. Transportation,” Access, No. 10 (www.uctc.net), Spring, pp. 21-25. PSRC (2008), Traffic Choices Study: Summary Report, Puget Sound Regional Council (http://psrc.org); at http://psrc.org/assets/37/summaryreport.pdf. Timothy Rood (1999), Local Index of Transit Availability (LITA), Local Government Commission (www.lgc.org). W.L. Schwartz, et al. (1999), Guidebook on Methods to Estimate N on-motorized Travel: Overview of Methods, Turner-Fairbanks Highway Research Center (www.tfhrc.gov). Scott Sharpe and Paul Tranter (2010), “The Hope For Oil Crisis: Children, Oil Vulnerability And (In)Dependent Mobility,” Australian Planner, Vol. 47, No. 4, December, pp. 284-292; summary at http://dx.doi.org/10.1080/07293682.2010.526622. J. Stanley and D. Vella-Brodrick (2009), “The Usefulness of Social Exclusion To Inform Social Policy in Transport,” Transport Policy, Vol. 16, No. 3, pp. 06-114; summary at http://ideas.repec.org/a/eee/trapol/v16y2009i3p90-96.html. John Stanley, et al. (2010), Social Exclusion And The Value Of Mobility, ITLS-WP-10-14, Institute of Transportation and Logistical Studies, University of Sydney (http://sydney.edu.au); at http://sydney.edu.au/business/__data/assets/pdf_file/0004/72913/itls-wp-10-14.pdf. STPP (2001), Easing the Burden: A Companion Analysis of the Texas Transportation Institute's Congestion Study, Surface Transportation Policy Project (www.transact.org). 41 You Can Get There From Here Victoria Transport Policy Institute Adie Tomer, Elizabeth Kneebone, Robert Puentes, and Alan Berube (2011), Missed Opportunity: Transit and Jobs in Metropolitan America, Brookings Metropolitan Policy Program, Brookings Institute (www.brookings.edu); at www.brookings.edu/~/media/Files/Programs/Metro/jobs_transit/0512_jobs_transit.pdf. TRB (2010), Highway Capacity Manual, Transportation Research Board (www.trb.org); at www.trb.org/Main/Blurbs/Highway_Capacity_Manual_2010_164718.aspx. Michael Trudel (1999), “The Taxi as a Transit Mode,” Transportation Quarterly, Vol. 53, No. 4, Fall, pp. 121-130. VTPI (2010), Online TDM Encyclopedia, Victoria Transport Policy Institute (www.vtpi.org). www.vtpi.org/choice.pdf 42


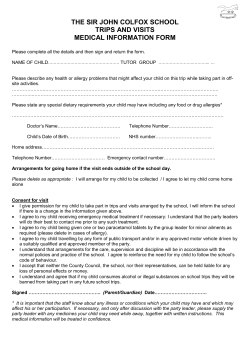


© Copyright 2026