
Online vs. Paper Evaluations of Faculty: When Less is Just as Good
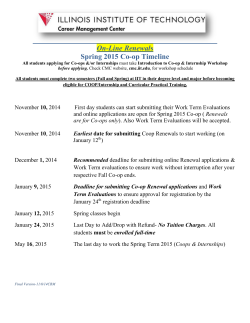
The Journal of Effective Teaching
an online journal devoted to teaching excellence
Online vs. Paper Evaluations of Faculty:
When Less is Just as Good
David S. Fike1ab, Denise J. Doyle b, Robert J. Connelly b
Texas Tech University Health Sciences Center, Amarillo, TX 79106
b
University of the Incarnate Word, San Antonio, TX 78209
a
Abstract
Evaluation of teaching effectiveness is considered a critical element in determining
whether or not faculty members are retained at higher education institutions; academic
milestones such as tenure and promotion often require documentation of the quality of
faculty teaching. As methods of assessing teaching effectiveness evolve, concerns about
the equity of alternative methods arise. This study compared two methods of student
evaluations of faculty, online versus the traditional paper format. Although the student response rate for online evaluations was lower, evaluation scoring patterns were similar for
both methods. The findings suggest that conducting faculty evaluations online may be a
suitable alternative to the traditional, paper-based approach.
Keywords: Course evaluations, student evaluations, faculty evaluations, online
evaluations, evaluation of instruction.
Evaluations of teaching effectiveness are considered a critical element in determining
whether or not faculty members are retained, especially at colleges and universities that
emphasize teaching. Additionally, academic milestones, such as tenure and promotion,
often require documentation of the quality of faculty teaching. As schools identify all of
the costs associated with traditional paper methods of evaluation, online options become
more attractive from an institutional standpoint because of the possible cost savings but
also because of their efficiency and their environmentally friendly production.
But, as institutions consider moving to online evaluations, concerns of faculty may begin
to surface regarding the lower participation rate anticipated with students who have the
option of going online on their own time, and the fear that a lower participation rate will
skew the results of the evaluations. Some may even be concerned that only students with
a negative opinion of the instructor will take the time to go online to voice their views.
Institutions need to determine the relative costs of online and paper methods of evaluation, but as importantly, they need to be able to address the concerns of faculty before
implementing a new online system of evaluation.
1
Corresponding author's email: [email protected]
The Journal of Effective Teaching, Vol. 10, No. 2, 2010, 42-54
©
2010 All rights reserved
Online vs. Paper Evaluations of Faculty
43
Literature Review
The emerging research comparing online with traditional student evaluations of teaching
is showing that the results of the two methods are not significantly different (Layne, DeCristoforo, & McGinty, 1999; Handwerk, Carson, & Blackwell, 2000; Sax, Gilmartin,
Keup, Bryant, & Plecha, 2002; Dommeyer, Baum, Hanna, & Chapman, 2004; Avery,
Bryant, Mathios, Kang, & Bell, 2006). Research designs typically compare two sections
of the same class taught by the same instructor, one using the online method and the other
paper in class (Thorpe, 2002). Through a comprehensive literature review, only one published study was identified that was based upon a research design in which students in
participating classes were randomly assigned at the student level to one method or the
other (Layne, DeCristoforo, & McGinty, 1999).
While the results of online and paper-based evaluation methods seem equivalent, the
online response rate typically falls below that of the paper-based response rate. The continuum of responses reported in the literature ranges from 23% to a high of 92% (Ha,
Marsh, & Jones, 1998), with around 50% being a commonly reported response rate
(Avery et al., 2006; Brown, 2008).
Various factors may explain lower online rates. Since online surveys involve out-of-class
time, students can be distracted and not remember or simply choose not to take the time
to complete the evaluation (Laubsch, 2006). There may also be technical problems with
accessing surveys online (Anderson, Cain, & Bird, 2005). Concerns persist about
whether responses are anonymous (Layne, DeCristoforo, & McGinty, 1999; Dommeyer,
Baum, & Hanna, 2002b), although this has long been a student concern about traditional
methods of evaluation. Another study suggests that filling out numerous surveys may
cause students to reach a saturation point and decline some or all evaluation opportunities
(Sax, Gilmartin, & Bryant, 2003). Gender can also have significant bearing on response
rates with some research showing that more women than men were likely to complete
online evaluations when compared with paper (Thorpe, 2002). One study on who responds to online evaluations also found that students with higher grade point averages
were more likely to complete surveys as were sophomores as compared to seniors who
tended to have the lowest response rate (Layne, DeCristoforo, & McGinty, 1999). Even
class size can be a factor. Students in larger classes were found to have a lower response
rate than those in smaller classes (Avery et al., 2006).
On the other hand, research on student perceptions about online evaluations show that
most students clearly prefer the online method (Layne, DeCristoforo, & McGinty 1999;
Donovan, Mader, & Shinsky, 2007). It is more flexible because it is done on the student’s own time schedule. The convenience and lack of time limits have also allowed for
longer and more constructive responses to open-ended survey questions and students perceive this as an advantage to the online method (Dommeyer et al., 2002a; Ravelli, 2000;
Anderson et al., 2005; Donovan, Mader, & Shinsky, 2006, 2007).
Faculty seem more cautious about online methods of evaluation according to one study
that found that a strong majority of faculty preferred traditional methods of evaluation
The Journal of Effective Teaching, Vol. 10, No. 2, 2010, 42-54
©
2010 All rights reserved
Fike, Doyle, and Connelly
44
(Dommeyer et al., 2002a). Faculty are concerned about the prospect of lower response
rates and question whether online data will be as accurate as that from the traditional inclass approach.
A number of studies suggest that the response rate can be influenced by a variety of incentive strategies. In one study, a grade incentive was used, one-quarter of 1%, and this
increased the response rate to be comparable to a paper survey in class (Dommeyer et al.,
2004). Other incentives, cash or prizes, can also increase the response rate (Bosnjak &
Tuten, 2003; Cobanoglu & Cobanoglu, 2003). Others show positive gains using reminder messages (Crawford, Couper, & Lamias, 2001). There is also evidence that once
an online system has been implemented, over time the response rate will gradually increase (Avery et al., 2006).
Finally, one study showed that increased response rate correlated with the degree of involvement of faculty and department heads in developing the survey used online (Anderson, Brown, & Spaeth, 2006). The authors suggest more generally that faculty and administrative support for assessment and intentional engagement of students in assessment
efforts is a key to making an online system successful.
Study Purpose
While the literature provides insight into the impacts of conducting faculty evaluations
via online methods, research methods and results are not uniformly consistent. Accordingly, this research study was initiated to add to the body of knowledge on two of the
primary research questions. Do response rates differ between online and paper-based
evaluation methods? Do scoring patterns differ between online and paper-based respondents? Given the uses of evaluations data, answers to these research questions will be of
interest to faculty and administrators who have implemented or are considering implementing online course evaluations.
In 1999, Layne, DeCristoforo, and McGinty conducted a study which focused on a southeastern university enrolling 12,000 students, mostly in engineering-related programs; the
study design was based upon random assignment at the student level. The present study
involves a smaller university, a larger number of courses and almost double the number
of students involved in the prior study. Perhaps more importantly, the courses represent
nearly every program in the institution: humanities, arts, business, education, nursing,
science, etc. By targeting a broader span of academic programs, the present study strives
to provide a more comprehensive assessment of alternative methods of faculty evaluations.
Findings from this study will inform research and practice regarding the equivalence of
online and paper evaluations.
The Journal of Effective Teaching, Vol. 10, No. 2, 2010, 42-54
©
2010 All rights reserved
Online vs. Paper Evaluations of Faculty
45
Methods
Setting
This research study was conducted on the central campus of a private university in the
southwest US. The campus is located in an urban setting and serves both residential and
commuter students. The primarily teaching university provides a wide variety of academic programs including undergraduate, graduate and first professional degree programs; it awards baccalaureate, masters and doctoral degrees. The university maintains
a low student-faculty ratio of 14 to 1; many course sections have fewer than 20 students.
During the 2008-09 academic year, approximately 4600 students enrolled in courses on
the central campus. Student enrollments reflect a diverse ethnicity; the university is designated a Hispanic Serving Institution by the US Department of Education. At this institution, all undergraduate students are required to own laptop computers thereby facilitating the opportunity for online activities for students; computer literacy is a core competency emphasized across the curriculum.
Research Design
To assess the response rates and scoring patterns of online and paper-based evaluations, a
prospective, two-group randomized study design was implemented. Evaluations were
conducted using either paper-based or online evaluation instruments. The online evaluation instrument, developed with CoursEval™ software, was crafted such that it contained
the same items and used the same scoring metrics as the paper-based instrument; the instruments were equivalent with respect to content.
The evaluation instruments contained 18 items representing course attributes, 5 items describing self-reported student characteristics (e.g., GPA, expected grade in course), and 6
items requesting comments. The 18 items representing course attributes were scored using a Likert five-point scale with scores of 1 through 5 representing strongly disagree,
disagree, neutral, agree and strongly agree, respectively. All 18 items were written in a
manner such that low scores were undesirable and high scores were desirable. For the
18-item scale, the best outcome possible would be represented by a score of 5 on each of
the 18 items; the least desirable outcome would be represented by a score of 1 on each of
the 18 items.
Evaluations were conducted during roughly a two-week period in the spring 2009 semester. Prior to distributing the evaluation instruments, students enrolled in course sections
were randomized at the student level to participate in either paper-based or online evaluations. Through the randomization process, each student enrolled in a course section had
an equal probability of being assigned to either the paper or online evaluation method.
On the date that evaluations were to be conducted within a classroom, the instructor exited the classroom, a student monitor administered the paper-based preprinted forms to
the students selected for the paper-based evaluation, and the student monitor provided
written instructions for the students selected for the online process. Students selected for
the online process left the classroom while the students selected for the paper-based
method remained and completed the evaluations; students selected for online evaluations
The Journal of Effective Teaching, Vol. 10, No. 2, 2010, 42-54
©
2010 All rights reserved
Fike, Doyle, and Connelly
46
were sent emails with additional instructions for completing the evaluations. Since instructors of the courses were not present during the evaluation process, the instructors
were not aware of which students were assigned to the paper-based or online methods.
Students who were selected to participate in online evaluations were required to use a
user ID and password; only students selected for online evaluations were allowed to
complete online evaluations, and controls prevented the students from submitting more
than one evaluation per section. Since many students were enrolled in more than one
course, the students may have participated in paper-based evaluations in some courses
and online evaluations in others.
The controls implemented in the evaluation process provided assurance that students in
the two groups (i.e., online, paper) had equivalent opportunity to participate in the
evaluation process while maintaining anonymity. The randomization process provided
assurance that the two groups were homogeneous. The instruments were designed to assure that the evaluation metrics were equivalent.
Sample
Eighty-one instructors teaching a total of 247 course sections were evaluated. The course
sections included in the study were those taught by tenure-track or tenured faculty.
Course sections taught by adjunct faculty were not included in this study. Also, courses
that did not meet for the 16-week semester (e.g., accelerated courses) and courses that
met only at clinical sites were excluded from the study. Course sections evaluated were
drawn from all of the schools within the university, and from all course levels (i.e.,
freshman through graduate). A total of 4550 student enrollments were assigned for participation in the study; 2270 were randomly assigned to the online evaluation group and
2280 were assigned to the paper-based group.
Analysis
Paper-based responses were scanned to electronic format and exported to SPSS 16.0 for
analysis. Online responses were similarly exported to SPSS. The response datasets were
merged, and data cleaning was conducted for quality assurance. Chi square tests were
used to determine if response rates differed between the online and paper-based evaluation methods and to assess differences between self-reported student attributes on items
19 through 23. To determine if scoring patterns differed between online and paper-based
respondents, mean scores (i.e., means of the 18 items) were calculated for each respondent. These mean scores, which could range from a low of 1.0 to the high of 5.0, were
compared between the online and paper-based groups using Student’s t test. Additionally, mean scores on each of the 18 items were compared between the online and paperbased groups using Student’s t test with a Bonferroni adjustment. Comment lengths on
items 24 through 29 were also compared using Student’s t. Cronbach’s alpha was used to
determine the internal consistency for the instruments. Two-way analysis of variance
was used to evaluate the effects of course grade level (e.g., freshman, sophomore) and
evaluation method (i.e., paper, online) on evaluations scores. For all analyses, the level
of significance is 0.05.
The Journal of Effective Teaching, Vol. 10, No. 2, 2010, 42-54
©
2010 All rights reserved
47
Online vs. Paper Evaluations of Faculty
Results
Response rates for online and paper-based methods differed. For the online evaluation
group, a total of 1229 responses were submitted yielding a response rate of 54.14%. For
the paper-based evaluation group, a total of 1557 responses were submitted yielding a
response rate of 68.29%. These response rates differed significantly (Chi-square =
95.921, df=1, p<.001). Accordingly, the online response rate was lower than the response
rate for paper-based evaluations. As depicted in Figure 1, online response frequencies
varied daily, with notable increases when email reminders were distributed on February
23, March 2 and March 5.
Figure 1. Online Response Frequencies by Date
Of the students who completed evaluations, as revealed in Figure 2, scoring patterns as
reflected by mean scores were strikingly similar between the online and paper-based
groups. By far, the most common scoring pattern for both groups was ratings of 5 on all
of the 18 items on the evaluation instrument. A small percentage of evaluations yielded a
mean score that fell below a neutral score of 3.0. Although there was some detectable
variation between the scoring patterns of the two groups, Figure 2 does not reveal any
substantial bias between the methods.
Scores for the online and paper-based groups were 4.33 ± 0.67 (Mean ± SD) and 4.40 ±
0.64, respectively. These means differed significantly (t = 2.872, df = 2784, p = .004)
with a 95% confidence interval for the difference of (.02, .12). Using Glass’s Δ, the effect size was 0.11. Mean scores for the online group were approximately 1.6% lower
than scores for the paper-based group.
For each of the items on the 18 item scale, mean differences between paper and online
scores varied from a low of 0.03 to a high of 0.16. Using Student’s t test with a Bonferroni adjustment, only one of the 18 items produced mean scores that differed between
The Journal of Effective Teaching, Vol. 10, No. 2, 2010, 42-54
©
2010 All rights reserved
Fike, Doyle, and Connelly
48
Figure 2. Frequencies of Mean Scores by Online and Paper-Based Responses
the online and paper-based groups in a statistically significant manner. Thus, individual
item scoring patterns between each of the two groups were generally consistent.
Responses on items 19 through 23 describing self-reported student characteristics were
analyzed. A key findings was that the online group reported spending more “out of
class” time on the course (Chi square = 12.181, df = 4, p = .016). Forty-two percent of
the online respondents reported spending 4 or more hours per week on the course; only
37% of the paper-based respondents reported spending 4 or more hours per week. Another key finding was that 55.5% the online respondents were enrolled in junior-senior
level courses compared to 50.1% of the paper-based respondents (Chi square = 10.435, df
= 4, p = .034). For each of the two groups, 92% of the respondents expected to receive a
grade of A or B for the course.
Comment lengths on items 24 through 29 were compared to see if differences existed between the online and paper-based groups. Mean comment lengths differed on all of the
items 24 through 29 (p < .001 for all questions). In all cases, students using the online
method tended to provide more lengthy comments.
The Journal of Effective Teaching, Vol. 10, No. 2, 2010, 42-54
©
2010 All rights reserved
49
Online vs. Paper Evaluations of Faculty
To assess the internal consistency of the evaluation instrument, Cronbach’s alpha was
calculated. Cronbach’s alpha was 0.968 for paper-based evaluations, 0.963 for online
evaluations, and 0.965 for the combined set of evaluations, indicating a high degree of
reliability among the 18 items and consistency between both methods of evaluation.
To test the effects of course grade level (e.g., freshman, sophomore) and evaluation
method (i.e., paper, online) on mean evaluations scores, a two-way analysis of variance
was implemented. Evaluation scores, stratified by course grade level and evaluation
method, are presented in Table 1. Main effects for course grade level (F = 9.431, df = (4,
2727), p < .001) and evaluation method (F = 6.124, df = (1, 2727), p = .013) were significant; the interaction effect was not significant. Post hoc tests reveal that freshman and
sophomore level courses had significantly lower mean evaluation scores than junior and
senior level courses. Furthermore, when assessing differences in evaluation scores by
course grade level, differences between paper-based and online evaluation scores were
only significant for sophomore level courses (t = 2.487, df = 648, p = .013).
Table 1. Evaluation Scores by Course Level and Evaluation Method (Mean ± SD)
Course Level
Freshman
Sophomore
Junior
Senior
Graduate
Evaluation Scores
(Paper)
4.36 ± .682
4.34 ± .661
4.45 ± .603
4.51 ± .591
4.38 ± .678
Evaluation Scores
(Online)
4.29 ± .694
4.20 ± .781
4.41 ± .548
4.47 ± .588
4.33 ± .612
Discussion
This study was initiated to answer two primary questions. The first questions was “Do
evaluation response rates differ based upon the method of response (paper-based vs.
online)?” The finding was that the online response rate (54%) fell below that of the paper-based response rate (68%). Though the investigators anticipated a higher paperbased response rate, the findings of the study are consistent with those from other institutions. Reasons for non-response on paper-based evaluations include student absences on
the day the evaluation was administered, students self-selecting not to participate in the
evaluations, and errors in scheduling/administration of the evaluations. Given that course
section enrollments were generally less than 20, the difference in response rates between
the two methods may be considered of practical significance. Thus, efforts to increase
response rates should be pursued. As reflected in Table 1, online response rates can be
increased when students are encouraged to participate. Students were sent email messages on February 23, March 2 and March 5 requesting that they complete online evaluations, and there were notable increases in response to the email reminders. This is consistent with prior findings that online response rates can be increased with directed efforts to
encourage student participation.
The Journal of Effective Teaching, Vol. 10, No. 2, 2010, 42-54
©
2010 All rights reserved
Fike, Doyle, and Connelly
50
This study also was initiated to answer the question “For the students who participate in
evaluations of teaching, do scoring patterns differ based upon the method of response
(paper-based vs. online)?” Figure 2 provides a graphical review of scoring patterns for
the two response methods. The graph clearly displays a high degree of consistency in
scoring patterns between the two groups. Only a small percentage of respondents by either method provided mean scores that fell below a neutral score of 3.0. The most common score for both groups was 5.0, with the majority of scores falling in the 4.0 to 5.0
range. This finding may help to assuage some concerns that those who self-select to respond via the online method may have a greater likelihood of being disgruntled or displeased with the instructor and thus submit low scores. In general, scoring patterns between the online and paper-based groups were similar.
Although scoring patterns between online and paper-based groups were similar, mean
scores for the online group were marginally below those of the paper-based group. The
online group had an aggregate mean score of 4.33 compared to 4.40 for the paper-based
group. Thus, scores for the online group were about 1.6% lower than the paper-based
group. Given the relatively small effect size, the difference in mean scores between the
two methods is of limited practical significance. This finding suggests that the two
evaluation methods produce roughly equivalent mean scores.
Scores were reviewed on each of the 18 items in the Likert scale. The scoring patterns
between the online and paper-based groups did not differ in a statistically significant
manner on 17 of the 18 items. This finding further supports the assertion that online and
paper-based scoring methods generally produce comparable results. Also of interest,
internal consistency of the 18 items was confirmed by a Cronbach’s alpha of 0.968 for
paper-based evaluations and 0.963 for online evaluations, indicating a high degree of
consistency between the two evaluation methods and a high degree of reliability among
the 18 items.
In this study, the students who responded by the online method tended to spend more
time on the courses outside of class, and a higher percentage of the online respondents
were in junior and senior level courses. The reasons for these differences are unknown.
Perhaps upper-level students are more inclined to participate in online evaluations than
lower-level students. Perhaps those students who spend more time on their courses are
more focused or motivated and this may influence their likelihood of participating in
online evaluations. Although the reasons for these differences are unknown, they may
have some bearing on why there were minor differences in scoring between the online
and paper-based groups. Further research to determine why online respondents differ
from paper-based respondents is warranted.
In both the online and paper-based groups, 92% of the students who responded stated that
they expected a grade of A or B in the class. This finding may suggest that students who
expect to receive higher grades are more likely to participate in evaluations than those
who receive lower grades. Alternatively, this may simply reflect a general expectation of
all students. Additional research studying the association of grade expectations with participation and scoring of evaluations may help to clarify this issue.
The Journal of Effective Teaching, Vol. 10, No. 2, 2010, 42-54
©
2010 All rights reserved
Online vs. Paper Evaluations of Faculty
51
Consistent with prior research, this study demonstrated that online respondents tended to
produce more lengthy comments than paper-based respondents. Possible explanations
are as follows. First, students may be able to key in comments more rapidly than writing
by hand, so this provides an efficiency gain for the students. Second, without time constraints, students may be able to provide more detailed, informative comments. Third,
students may be more comfortable with assurances of anonymity without their handwriting being present. Although our study does not reveal why the respondents provided
more lengthy comments, the online method in this sense appears to offer an advantage
over a paper method when evaluation questions are in an open-entry format. However,
future studies will need to determine if longer comments necessarily provide qualitatively
different information than shorter ones.
To further assess potential differences between online and paper-based responses, analyses were conducted at the course level (e.g., freshman, sophomore). As demonstrated in
Table 1, mean scores for both online and paper-based evaluations were lower in lowerlevel undergraduate courses than in upper-level undergraduate courses. Additionally, differences between online and paper-based scores were of greater magnitude in lower-level
undergraduate courses than in upper-level courses. In fact, differences in means scores
between online and paper-based evaluations were only significant in sophomore-level
courses. Thus, differences in mean scores between online and paper-based methods are
most pronounced in lower-level undergraduate courses. Furthermore, differences by
course level are more substantial than differences by evaluation method. Accordingly,
while online and paper-based methods may yield marginally different results, this study
suggests that factors other than the evaluation method (i.e., online, paper) may play a major part in differences in scoring patterns. The reasons why students in lower-level undergraduate courses may provide lower scores than students in upper-level undergraduate
courses are unknown; this merits further research.
Implications for Future Practice and Research
As noted above, further research to explore reasons why online response rates and scoring patterns may differ from the paper-based method are needed. Furthermore, studies to
address differences among online respondents are warranted. For example, are full-time
students who enroll in multiple courses less likely to participate in online evaluations
compared to students who are enrolled in fewer courses? Although many studies within
the literature have explored differences among respondents, further research may yield
additional insights.
From a practice perspective, the findings of this study suggest that online evaluations
may be a suitable alternative to paper-based evaluations. Although online response rates
are lower, they can be boosted with directed efforts of an institution. Furthermore, online
evaluations tend to produce results roughly comparable to paper-based evaluations.
Therefore, the online evaluation method should be considered as a viable alternative to
paper-based methods.
The Journal of Effective Teaching, Vol. 10, No. 2, 2010, 42-54
©
2010 All rights reserved
52
Fike, Doyle, and Connelly
Limitations
This study provided a comparison of online and paper-based methods of evaluations for
full-time faculty teaching courses with relatively small enrollments in a private university
setting; care should be taken when generalizing the findings from this study to other
populations. Although this study demonstrated a high degree of consistency between
online and paper-based scoring patterns, this study did not attempt to validate either
online or paper-based methods. Furthermore, there may be factors other than those included in this study which have a significant influence on evaluation scoring patterns.
Conclusion
This study demonstrated that conducting online evaluations of teaching is a suitable alternative to the traditional paper-based approach. Scoring patterns for online evaluations
are generally consistent with those of paper-based evaluations, thereby providing evidence that the online evaluation process is reliable. Faculty and university administrators
who are considering the implementation of online evaluations of teaching should have a
well-defined plan to yield optimal participation. To maximize student response rates, the
administrators of the online evaluation system need to communicate effectively with the
faculty being reviewed, so that they in turn can communicate with the students and encourage their participation. Based upon the review of the literature as well as the findings
from this study, online evaluations are most effective when faculty and administrators
“buy in” to the process, and when focused efforts are directed at encouraging student participation.
Some education needs to be part of faculty “buy in”. As a minimum, faculty should be
informed that empirical research demonstrates the practical equivalence of online to paper evaluations even if response rates are different, and that any faculty fear about an increase in negative student opinion online is unwarranted. Assuring students that their
online responses will be anonymous can relieve a common fear and encourage their “buy
in” as well.
Adopting a system of conducting online evaluations of teaching can yield many benefits
including cost effectiveness, environmental friendliness, time efficiencies, and availability of robust analytical capabilities. Online evaluation should be considered as a viable
alternative to the traditional, paper-based approach provided faculty and administrators
agree to collectively and actively promote student participation.
Acknowledgements
The authors wish to acknowledge Catherine Hays and Roland Carrillo, Institutional Research Analysts, for their exceptional assistance in the areas of data management and literature review.
The Journal of Effective Teaching, Vol. 10, No. 2, 2010, 42-54
©
2010 All rights reserved
Online vs. Paper Evaluations of Faculty
53
References
Anderson, J., Brown, G., & Spaeth, S. (2006). Online student evaluations and response
rates reconsidered, Innovate: Journal of Online Education, 2(6).
Anderson, H. M., Cain, J., & Bird, E. (2005). Online course evaluations: Review of literature and a pilot study. American Journal of Pharmaceutical Education, 69(1), 3443.
Avery, R. J., Bryant, K. W., Mathios, A., Kang, H., & Bell D. (2006). Electronic course
evaluations: Does an online delivery system influence student evaluations? Journal of
Economic Education, 31(1), 21-37.
Bosnjak, M., & Tuten, T. L. (2003). Prepaid and promised incentives in Web surveys.
Social Science Computer Review, 21(2), 208-217.
Brown, G. (2008). Online course evaluations and response rate considerations. Pullman,
WA: Washington State University, Center for Teaching, Learning and Technology.
Retrieved May 13, 2009 from http://wsuctlt.wordpress.com/2008/06/20/onlinecourse-evaluations-and-response-rate-considerations/.
Cobanoglu, C., & Cobanoglu, N. (2003). The effect of incentives in web surveys: Application and ethical considerations, International Journal of Market Research, 45(4),
475-488.
Crawford, S. D., Couper, M. P., & Lamias, M. J. (2001). Web surveys: Perceptions of
burden, Social Science Computer Review, 19(2), 146-162.
Dommeyer, C. J., Baum P., Chapman, K. S., & Hanna R. W. (2002a). Attitudes of business faculty toward two methods of collecting teaching evaluations: paper vs. online,
Assessment & Evaluation in Higher Education, 27(5), 445-462.
Dommeyer, C. J., Baum P., & Hanna R.W. (2002b). College student’s attitudes toward
methods of collecting teaching evaluations: In-class versus on-line. Journal of Education for Business, 78(1), 11-15.
Dommeyer, C. J., Baum P., Hanna R. W., & Chapman K. S. (2004). Gathering faculty
teaching evaluations by in-class and online surveys: Their effects on response rates
and evaluations. Assessment & Evaluation in Higher Education, 29(5), 611-623.
Donovan, J., Mader, C., & Shinsky, J. (2006). Constructive student feedback: Online vs.
traditional course evaluations. Journal of Interactive Online Learning, 5(3), 283-296.
Donovan, J., Mader, C., & Shinsky, J. (2007). Online vs. traditional course evaluation
format: Student perceptions, Journal of Interactive Online Learning, 6(3), pp. 158178.
Ha, T. S., Marsh, J., & Jones, J. (1998). A Web-based system for teaching evaluation.
Paper presented at the NCITT’98 Conference, Hong Kong, May 1998.
Handwerk, P., Carson, C., & Blackwell, K. (2000). On-line vs. paper-and-pencil surveying of students: A case study. Paper presented at the 40th Annual Meeting of the Association of Institutional Research, May 2000.
Laubsch, P. (2006). Online and in-person evaluations: A literature review and exploratory comparison. MERLOT Journal of Online Learning and Teaching 2(2), 62-73.
Layne, B. H., DeCristoforo, J. R., & McGinty D. (1999). Electronic versus traditional
student ratings of instruction. Research in Higher Education, 40(2), 221-232.
The Journal of Effective Teaching, Vol. 10, No. 2, 2010, 42-54
©
2010 All rights reserved
Fike, Doyle, and Connelly
54
Ravelli, B. (2000). Anonymous online teaching assignments: Preliminary findings. Paper
presented at Annual National Conference of the American Association for Higher
Education, Charlotte, North Carolina.
Sax, L., Gilmartin, S., Keup, J., Bryant, A., & Plecha, M. (2002). Findings from the 2001
pilot administration of Your First College Year (YFCY): National norms. Higher
Education Research Institute, University of California. Retrieved June 1, 2009 from
http://www.gseis.ucla.edu/heri/yfcy/yfcy_report_02.pdf.
Sax, L. J, Gilmartin, S. K., & Bryant, A. N. (2003). Assessing response rates and nonresponse bias in web and paper surveys. Research in Higher Education, 44, 409-432.
Thorpe, S. W. (2002 June). Online student evaluation of instruction: An investigation of
non-response bias. Paper presented at the 42nd Annual Forum of the Association for
Institutional Research, Toronto, Ontario, Canada.
The Journal of Effective Teaching, Vol. 10, No. 2, 2010, 42-54
©
2010 All rights reserved


© Copyright 2026