
Bus Rapid Transit (BRT) has come to mean many things to many
Report No.
FL-26-7104-4
Advanced Network Planning
for Bus Rapid Transit
The “Quickway” Model as
a Modal Alternative to “Light Rail Lite”
This page intentionally left blank.
Form Approved
OMB No. 0704-0188
REPORT DOCUMENTATION PAGE
Public reporting burden for this collection of information is estimated to average 1 hour per response, including the time for
reviewing instructions, searching existing data sources, gathering and maintaining the data needed, and completing and reviewing
the collection of information. Send comments regarding this burden estimate or any other aspect of this collection of information,
including suggestions for reducing this burden, to Washington Headquarters Services, Directorate for Information Operations and
Reports, 1215 Jefferson Davis Highway, Suite 1204, Arlington, VA 22202-4302, and to the Office of Management and Budget,
Paperwork Reduction Project (0704-0188), Washington, DC 20503.
3. REPORT TYPE AND
2. REPORT DATE
1. AGENCY USE ONLY (Leave blank)
DATES COVERED
February, 2008
5. FUNDING
4. TITLE AND SUBTITLE
NUMBERS
Advanced Network Planning for Bus Rapid Transit:
The “Quickway” Model as a Modal Alternative to “Light Rail Lite”
6. AUTHOR(S)
FL-26-7104
Alan Hoffman
8. PERFORMING
ORGANIZATION
REPORT NUMBER
7. PERFORMING ORGANIZATION NAME(S) AND ADDRESS(ES)
The Mission Group
1250 Sixth Avenue, Suite 214
San Diego, CA 92101
9. SPONSORING/MONITORING AGENCY NAME(S) AND ADDRESS(ES)
U.S. Department of Transportation
Federal Transit Administration,
Office of Research, Demonstration and Innovation (TRI)
1200 New Jersey Avenue, SE
Washington, DC 20590
11. SUPPLEMENTARY NOTES
FL-26-7104-04
10. SPONSORING/
MONITORING
AGENCY REPORT
NUMBER
FTA-FL-26-7104.2007.4
12a. DISTRIBUTION/AVAILABILITY STATEMENT
Available From: National Technical Information Service/NTIS, Springfield, Virginia, 22161. Phone
703.605.6000, Fax 703.605.6900, Email [[email protected]]
Also available through NBRTI web site: https://www.nbrti.org
12b. DISTRIBUTION
CODE
13. ABSTRACT
Transit planning in the United States has tended toward viewing BRT as an analogue to light rail transit, with similar operating
patterns. This model, referred to as “Light Rail Lite,” is compared to international best practices, which have often favored the
development of a grade-separated bus infrastructure (“Quickways”) that in turn supports a varied mix of all-stops, express, and
branching services. This model, dubbed the Quickway model, evolved out of the practical necessity of cities to meet ambitious
ridership or mode split targets. The two models are contrasted along the key dimensions of BRT service, and significant differences
are identified. Three international case studies—Ottawa, Bogotá, and Brisbane—are reviewed for their particular application of this
model and of the results they have obtained. Four domestic cities are compared to these international examples: Eugene, Oregon,
and Los Angeles are profiled for their adoption of the Light Rail Lite model, and two other cities, Pittsburgh and Miami, are profiled
for their BRT implementations which share elements in common with the Quickway model. A set of lessons is drawn from this
comparison, including a review of those conditions which may favor the adoption of either model or light rail in any given urban
context. Recommendations are offered at the level of the Federal Government, Metropolitan Planning Organizations, and planning
and engineering firms, for the proper planning and evaluation of Quickway-based alternatives. An appendix introduces a fifth
domestic case study, a Quickway-based planning effort sponsored by a nonprofit organization for the San Diego region, and the
preliminary results of this effort are reviewed.
14. SUBJECT TERMS
Bus Rapid Transit, BRT, Public Transportation, Quickway, T-Way, Infrastructure, Network Planning, Transit
Strategy, Ottawa, Brisbane, Bogotá
17. SECURITY CLASSIFICATION
OF REPORT
Unclassified
NSN 7540-01-280-5500
18. SECURITY CLASSIFICATION
OF THIS PAGE
Unclassified
Standard Form 298 (Rev. 2-89)
19. SECURITY CLASSIFICATION
OF ABSTRACT
Unclassified
15. NUMBER OF
PAGES
114
16. PRICE CODE
20. LIMITATION
OF ABSTRACT
Advanced Network Planning for Bus Rapid Transit:
The “Quickway Model” as a Modal
Alternative to “Light Rail Lite”
Funded by the Federal Transit Administration
Project Manager: Venkat Pindiprolu
Team Leader, Service Innovation Team (TRI-12)
FTA Office of Mobility Innovation
400 7th Street, SW
Washington, DC 20590
Project Manager: Alasdair Cain
Senior Research Associate, National BRT Institute
Center for Urban Transportation Research
University of South Florida (USF)
4202 E. Fowler Ave, CUT 226
Tampa, FL 33620
THE MISSION GROUP
Principal Investigator: Alan Hoffman
Principal, The Mission Group
1250 Sixth Avenue, Suite 214
San Diego, CA 92101
(619) 232-1776
[email protected]
NOTICE
This document is disseminated under the sponsorship of the U.S. Department of Transportation in the interest of information exchange. The United States Government assumes no liability for its contents or use
thereof.
The United States Government does not endorse products of manufacturers. Trade or manufacturers’
names appear herein solely because they are considered essential to the objective of this report.
This page intentionally left blank.
iv
Foreword
Bus Rapid Transit (BRT) has become, in the space of less than a decade, a fixed
and growing part of the American transit landscape, with numerous projects being planned, developed, built, and operated in cities large and small. However,
in the process of this widespread adaptation, there has been considerable confusion as to what exactly BRT is, what it could be, and how best to take advantage
of this mode in regional transportation strategies. All too often, in too many
American metro areas, BRT is seen as the “consolation prize,” if that, in the intense competition of local cities and neighborhoods to be the focus of the next
light rail line or other transit improvement. Likewise, some of the support—
perhaps too much of the support—for BRT comes from those who view BRT as
“light rail on the cheap,” as a means to placate transit advocates without spending too much money.
In contrast, those cities internationally that represent the most impressive
BRT implementations—measured in terms of ridership gains or modal split, if
nothing else—did not approach BRT as an “on the cheap” approach to service,
nor was their goal that of mimicking a light or heavy rail plan. Rather, these cities invested considerable sums in the development of a mostly grade-separated
infrastructure that could support a range of services, some resembling light rail,
others express, limited-stop, branching, direct, or even streetcar lines in terms of
station spacing, frequencies, travel speed, and route behavior.
This report focuses on what it was these cities did that make their experience
of BRT not merely different from that of most American cities, but one which is
arguably superior to anything yet attempted in this country. Along the way,
these cities put to rest many misconceptions of BRT—that it is an “intermediate
capacity” mode (all three cities routinely move as many or more people than
any light rail line in the U.S.), that it is a stepping stone to light rail (some BRT
systems clearly are, but the international examples go beyond the limitations of
light rail in significant ways), that its capacity to promote, attract, or support
Transit-Oriented Development (TOD) is limited (all of these cities have impressive and growing amounts of investment made around BRT stations), or that
bus-based systems are limited in their ability to attract choice riders from their
cars (it turns out that people value significant time savings and convenience
more than they value vehicle type).
This report introduces new terminology to the discussion of BRT, the key
term of which is Quickway, which is defined as a primarily grade-separated
(that is, fully segregated) busway capable of supporting express and all-stops
operations. Functionally, a busway is a Quickway if a bus can traverse its length
without being stopped or slowed by auto traffic, pedestrians, or buses which are
loading or discharging passengers. Quickways, it is argued, are not merely a
step in the gradation of bus-based infrastructure; their particular characteristics
change the operating logic, the cost logic, and the market responsiveness of
transit operations in significant ways, and can help American cities achieve a
“phase shift” in the role that transit plays in their functioning.
v
This page intentionally left blank.
vi
Acknowledgments
As any author comes to realize, it is impossible to acknowledge all of the many
people who have contributed to their understanding of any given subject, nor to
recognize everyone who is deserving of mention.
Still, there are many people whose unique contributions need to be mentioned. Foremost among them is Chuck Morison of the National Transit Institute, whose tireless work promoting BRT not only brought this mode—or collection of modes—to attention in many cities across the land, but who also brought
me into contact with two of the foremost practitioners of BRT planning on the
planet, Sam Zimmerman of the World Bank, and John Bonsall of McCormick
Rankin International, both of whom made immeasurable contributions to my
understanding, however, limited, of this field.
Likewise, my colleagues in Australia, chief among them Barry Gyte of GCI
Pty Ltd., Brian Bothwell of Brisbane City Services, Professor David Hensher of
the University of Sydney, and Professor Graham Currie of Monash University,
have all deeply enriched my understanding of the potential of BRT to meet regional goals, and have made various contributions to this study. Special thanks
is also offered to Jurgen Pasieczny, Ray Donato, and the staff of TransLink, overseers of the Brisbane Busway projects, for their support and insight; to Lyall
Kennedy of New South Wales Ministry of Transport; and to Professor Phil
Charles of the University of Queensland and Phil Sayeg of Transport Roundtable Australasia, whose Smart Urban Transport Conferences first brought global
attention to the Quickway model of BRT.
The contributions made by the staff and management of TransMilenio in Bogotá are considerable; their achievements are nothing short of miraculous in
producing a rapid transit system of impressive growth, speed, popularity, and
impact. I would especially like to acknowledge Ing. Liliana Pereira for all of her
contributions to my understanding of the TransMilenio and of the many planning decisions that were made in support of that system.
Many people contributed their thoughts and knowledge to this study, in addition to the people mentioned above. Roderick Diaz, now of the Los Angeles
County Metropolitan Transportation Authority, and a former classmate of mine
at MIT, has done much to advance the domestic understanding of BRT, including many of the concepts dealt with in this report; he was also instrumental in
providing background information on Los Angeles, as was Leon Bukhin and
Rex Gephart, both of the MTA. In Miami, I would like to thank David Fialkoff of
Miami-Dade Transit for his contributions. In Pittsburgh, both Rich Feder and
David Wohlwill of the Port Authority of Allegheny County provided insight
and data as to their busway network. In Eugene, Graham Carey of Lane Transit
District has been not merely a source of data, but a source of inspiration as he
dealt over the years with the difficulties of implementing the EmX.
At MIT, Nigel Wilson, Joe Sussman, Fred Salvucci, and Ralph Gakenheimer
all played a major role in developing my understanding of the behavior of public transit systems.
vii
To the staff of the National Bus Rapid Transit Institute at the Center for Urban Transportation Research at the University of South Florida I extend my
thanks for their support and encouragement in formalizing my thoughts about
BRT. In particular, I would like to thank Alasdair Cain who helped shepherd
this project from the idea stage to the final product you are now reading.
Finally, I would like to acknowledge the role that many of my clients have
played in creating the opportunities through which I was able to explore the
practical application of the ideas embedded in this report. Anthony Beckford
and Sarah Blanchard of Sarasota County Area Transit; Jacob Snow, Tina Quigley, and Mark Wells of the Regional Transportation Commission of Southern
Nevada (as well as the entire staff of that agency); and Carolyn Chase, Craig
Jones, and the entire board of Move San Diego, Inc. all have believed in the
goals of creating regionally effective transit systems and encouraged me to
search for solutions beyond those of the ordinary.
viii
Table of Contents
FOREWORD............................................................................................................. v
ACKNOWLEDGMENTS.......................................................................................... vii
TABLE OF CONTENTS ............................................................................................ ix
EXECUTIVE SUMMARY ......................................................................................... xi
1.
INTRODUCTION: A NEW MODEL, A NEW MODE..................................................1
2.
THE QUICKWAY MODEL .........................................................................................5
2.1
2.2
2.3
2.4
2.5
2.6
2.7
2.8
2.9
3.
THE QUICKWAY MODEL: INTERNATIONAL CASE STUDIES ..............................13
3.1
3.2
3.3
4.
Introduction ..................................................................................................................... 5
Running Ways................................................................................................................. 5
Stations ............................................................................................................................. 6
Vehicles ............................................................................................................................ 6
Intelligent Transportation Systems............................................................................. 7
Fare Collection ................................................................................................................ 7
Service Patterns............................................................................................................... 7
Identity and Branding.................................................................................................... 8
Strategic Intent ................................................................................................................ 9
Ottawa, Ontario: The Transitway .............................................................................. 13
3.1.1 Transitway: Background................................................................................. 13
3.1.2 Transitway: Strategic Elements...................................................................... 14
3.1.3 Ottawa and the Quickway Model ................................................................. 19
Bogotá, Colombia: TransMilenio............................................................................... 21
3.2.1 TransMilenio: Background ............................................................................. 21
3.2.2 TransMilenio: Strategic Elements .................................................................. 21
3.2.3 TransMilenio and the Quickway Model....................................................... 28
Brisbane, Queensland, Australia: Busway............................................................... 29
3.3.1 Brisbane’s Busways: Strategic Elements ....................................................... 34
3.3.2 Brisbane’s Busways and the Quickway Model............................................ 43
“LIGHT RAIL LITE”: EUGENE AND LOS ANGELES...............................................47
4.1
4.2
Eugene/Sprinfield, Oregon: EmX (Emerald Express) ............................................ 47
4.1.1 Description........................................................................................................ 47
4.1.2 Comparison to the Quickway Model ............................................................ 48
4.1.3 Conclusions: Eugene/Springfield’s EmX ..................................................... 51
Los Angeles: Metro Rapid and the Orange Line .................................................... 51
4.2.1 Metro Rapid: Description................................................................................ 51
4.2.2 The Orange Line: Description ........................................................................ 54
4.2.3 Comparison to the Quickway Model ............................................................ 55
4.2.4 Conclusions: Los Angeles’s Metro Rapid and Orange Line ...................... 60
ix
5.
BEYOND “LIGHT RAIL LITE”: PITTSBURGH AND MIAMI ...................................63
5.1
5.2
6.
CONCLUSIONS ......................................................................................................73
6.1
6.2
6.3
6.4
6.5
6.6
6.7
6.8
7.
Pittsburgh: Busways..................................................................................................... 63
5.1.1 Description........................................................................................................ 63
5.1.2 Comparison to the Quickway Model ............................................................ 65
5.1.3 Conclusions: Pittsburgh’s Busways............................................................... 67
Miami: South Miami-Dade Busway ......................................................................... 68
5.2.1 Description........................................................................................................ 68
5.2.2 Comparison to the Quickway Model ............................................................ 68
5.2.3 Conclusions: South Miami-Dade Busway .................................................... 72
The Role of Passenger Demand ................................................................................. 73
The Role of Existing Services ..................................................................................... 73
The Role of Strategy..................................................................................................... 75
The Role of Targets ...................................................................................................... 75
The Role of Growth...................................................................................................... 76
The Role of Branding................................................................................................... 76
The Role of Models and Understanding.................................................................. 77
The Match between Models and Urban Form ........................................................ 77
RECOMMENDATIONS FOR PRACTICE ................................................................81
7.1
7.2
7.3
7.4
Federal Level.................................................................................................................. 81
Metropolitan Planning Organizations (MPOs) and Public Transit Agencies . 82
Planning and Engineering Firms............................................................................... 83
Final Thoughts .............................................................................................................. 84
APPENDIX: APPLICATION OF THE QUICKWAY MODEL TO AN AMERICAN CITY:
SAN DIEGO AND THE FAST PLAN .................................................................................85
NOTES....................................................................................................................92
x
Executive Summary
The Quickway Model as a New Mode
tional Light Rail Lite model. Bus Rapid
Transit, therefore, may be understood not as
Planning for Bus Rapid Transit (BRT) in the
a mode of transit, but as comprised of at least
United States is dominated by the “Light
these two distinct modes.
Rail Lite” model, in which a bus service is
The Quickway model emerged internaconfigured to behave in ways that resemble
tionally from the specific need of different
traditional light rail systems. This model is
cities to meet ambitious ridership or mode
typified by having a single “BRT” route
share targets. It has its origins in the pioserve a corridor, enjoying at least some
neering work of Ottawa, Ontario, and its
measure of transit priority (ranging from
Transitway system and has been further
signal priority systems to dedicated
developed, in different ways, by both Bobusways), stopping at widely-spaced stops
gotá’s TransMilenio system and Brisbane,
or stations, and using distinct branding for
Australia’s Busway network. All three cities
the service thus provided. It has been
demonstrate the role of strategy and targets
widely embraced because it permits cities to
in favoring the Quickway model.
offer a service level which approaches that
This report presents case studies of
of light rail, but at reduced capital investthese three cities, and
ment.
then contrasts their
Some of the more
experience with that
outstanding models
of four American citof BRT implementaies which have develtion internationally
oped BRT systems,
follow a different
two of which explicmodel. They focus on
itly follow the Light
the creation of gradeRail Lite model and
separated bus guidethe other two repreways, or Quickways,
senting the closest
that then support not
American cities have
just a “light rail-like”
Figure ES.1. Quickway station in Brisbane, Austracome to implementing
service, but a variety
lia, showing tunnel segment in background. Grade
the Quickway model.
of
express
and
separation is at the heart of the Quickway model;
it supports express operations and fundamentally
This report also
branching
services
reduces
the
relative
operating
cost
of
services.
introduces new terthat extend the beneminology to the discussion of BRT systems.
fits of the infrastructure far beyond the imBusways are described as comprising Tmediate service areas.
Ways, which are characterized by gradeThe “Quickway Model” is not merely a
crossings, and Quickways¸ which are gradestep on the continuum of the Light Rail Lite
separated facilities that permit express (limmode, but represents a fundamentally disited or nonstop) operations. BRT systems
tinct mode of transit, much in the same way
that operated exclusively within a busway
that streetcar and heavy rail are two distinct
infrastructure are described as internalized
modes of rail transit. The Quickway model
systems, and those that branch off that inimposes its own planning, cost, and operatfrastructure are, appropriately enough, deing logic, leading to fundamentally different
scribed as externalized systems.
transit networks than does the more tradi-
EXECUTIVE SUMMARY • xi
The Quickway Model
The essential focus of the Quickway model
is that of creating a primarily gradeseparated infrastructure which then permits
the cost-effective operation of a range of
transit services, many of which may not be
identified during the infrastructure planning stage. Stations, too, play a central role
as the primary means of branding the system, integrating it into surrounding land
uses, and permitting high-volume operations.
The Quickway model differs from the
Light Rail Lite model in virtually every strategic element of the service.
Running ways. The Quickway model focuses on the creation of grade-separated
running ways, or Quickways, with passing
facilities at stations, in order to permit a
range of services, many of which will
branch off from the originating corridor.
The investment in grade-separation permits
much higher operating speeds (especially at
high bus volumes) than would be possible
with at-grade busways, reducing the travel
time needed to produce any given service,
changing in fundamental ways the cost basis of operating such services: as operating
costs go down (due to shorter round-trip
times) and revenues increase (due to the
increase in ridership associated with reduced travel time), a virtuous circle is created.
Stations. Quickway stations tend to be
designed for higher passenger and bus volumes than equivalent Light Rail Lite stations, and they are often located off automotive corridors. They mostly employ gradeseparated pedestrian crossings to minimize
potential conflicts with bus operations.
Vehicles. The Light Rail Lite model often
leads to the use of specialty BRT vehicles
which more closely mimic light rail vehicles
in terms of design and passenger comfort.
As implemented to date, the Quickway
model has been based either on standard
transit buses or, in the case of Bogotá, highfloor transit buses with wide, level-boarding
doors, but which otherwise are standard
articulated transit buses.
Intelligent Transportation Systems. Most
implementations of Light Rail Lite depend
on advanced signaling systems to give transit vehicles some measure of priority at intersections; these systems are not required
for Quickways. Advanced passenger information systems may be deployed, but have
not proven essential to Quickway operations.
Fare collection. Most implementations of
Light Rail Lite employ off-board fare collection as a means of minimizing vehicle dwell
times; Only Bogotá among the Quickway
examples relies on this technique (but in
doing so more resembles heavy-rail systems
by using stored-fare media and a barrier
system); other Quickway cities rely on
grade separation to reduce total travel time.
Service patterns. Quickway-based cities
use the infrastructure to create a range of
services which take people directly to major
employment sites, often eliminating intervening stops and transfers in the process.
The Light Rail Lite model generally produces single routes per corridor serviced,
imposes additional modal transfers, requires all vehicles to stop at all stations, and
in a number of cases delivers people not to
employment sites but to a rail station for an
additional modal transfer.
Identity and branding. Quickway-based
systems are more likely to brand the infrastructure (the Quickways themselves and
the stations that serve them) than any particular service using them (with the exception of fully-internalized systems such as
TransMilenio); in contrast, most Light Rail
Lite implementations of BRT focus on
branding the vehicles and the particular
routes they serve.
Strategic Intent. The primary intent of
the Quickway model is to change the under-
EXECUTIVE SUMMARY • xii
highest-volume light rail line in Canada or
the U.S. and gives Ottawa the highest percapita transit mode share of any mid-sized
city in Canada or the U.S.
Bogotá: TransMilenio. Bogotá’s TransMilenio network was not originally conceived of using the Quickway model, but
planners backed into a version of the model
while attempting to overcome the limitations of the Light Rail Lite model to meet
crushing passenger demand. Though TransMilenio’s busways are only partially gradeseparated, grade-crossings are still relatively
minimal for an urban system, and the system was designed to support both passenInternational Case Studies
ger and vehicle volumes normally associated with high-volume heavy rail systems.
Three international cities represent the state
While much attention world-wide has
of the practice in implementing the Quickbeen paid to Bogotá’s BRT infrastructure
way model.
(busways and stations),
Ottawa:
Tranits service plan is a
sitway. Ottawa, Onprimary contributor to
tario, has develits success. An extenoped a network of
sive series of express
grade-separated
and “super express”
Quickways—the
routes link different
Transitway—which
groups
of
stations
it uses to operate a
based on actual originrange
of
local,
destination travel patbranching, and externs. The network is
press services. Otfed, in turn, by an extawa developed its
Figure
ES.2.
Bogota’s
TransMilenio
system
makes
tensive feeder network
Transitway as a
use of grade separation and station passing faciliof traditional collector
cost-effective means
ties to move passenger loads typically associated
with
heavy
rail
systems—at
a
fraction
of
both
the
buses operating in tradiof meeting ambicapital and operating costs of heavy rail.
tional bus mode.
tious
mode-split
Brisbane: Busways. Brisbane, Australia,
targets which were dictated by its longalong with Bogotá, represents the state of
range land use plan and adopted transporthe art in Quickway implementation. It has
tation policies.
been developing a network of Quickways—
Ottawa’s Transitway system has been
the Busway network—which includes exlimited by at-grade operation using bus
tensive tunneling and bridging in order to
lanes through its relatively dense downmaintain full grade separation, even
town core. Its stations, which do provide
through the busy Central Business District.
some measure of protection from the harsh
Unlike the other two international cities,
winter elements, are nonetheless Spartan in
Brisbane also has an extensive electrified
design and materials. Nonetheless, the
commuter rail network that behaves, in
Transitway at its busiest point matches the
lying economic performance of transit services and hence permit a significant “ramping-up” of service in order to meet ambitious mode-split or ridership targets. They
meet these targets by then being able to
cost-effectively deploy services which connect more places together (improved network structure), reduce travel time while
improving reliability (improving system
performance), all while paying attention to
the many other aspects of service which together influence a person’s disposition to
use transit (improving the customer experience).
EXECUTIVE SUMMARY • xiii
practice, like a hybrid heavy rail system.
The Busway strategy has allowed Brisbane
to reverse declining transit ridership and
register impressive system-wide gains; its
Busway, at its busiest point, is now moving
significantly more peak-hour passengers
than any light rail line in North America.
Busway stations in Brisbane are an outstanding element of the system and are considered its primary branding focus. They
integrate in many cases into surrounding
land uses and can comfortably handle
heavy passenger loads while providing effective protection from the elements. The
extensive network of branching and express
services that use the Busways create significant travel time savings for many passengers and in fact give buses a sustainable
competitive advantage over all other modes
of transport for a key set of regional trips.
“Light Rail Lite”:
Eugene and Los Angeles
Two American cities were chosen for their
implementation of the Light Rail Lite model:
Eugene, Oregon, and Los Angeles, California. In both cases, planning began and
ended with this model. In the case of
Eugene, that decision was consonant with
projected levels of passenger demand; in the
case of Los Angeles, that decision may have
precluded a more effective solution in the
Orange Line corridor.
Eugene, Oregon: EmX. The Emerald Express is Eugene, Oregon’s new BRT service,
the first segment of which, the Green Line,
opened in early 2007. It connects the downtowns of the two primary cities in Lane
County, Eugene and Springfield. This BRT
service features specialty vehicles and a
range of running ways, including an innovative “trackway” as well as on-street operations. Passenger acceptance has been
high, with significant gains in corridor ridership, though some of this increase may be
due to fare-free operation for the present.
Los Angeles: Metro Rapid and the Orange
Line. Los Angeles has implemented BRT at
the two poles of the Light Rail Lite model:
Metro Rapid, which some consider “BRT
Lite,” and the Orange Line, a full attempt to
replicate light rail service using rubber-tired
vehicles. Metro Rapid relies primarily on
vehicle branding, simplified route design
(with widely-spaced stops), and signal priority measures to reduce vehicle run times.
It has been credited with measurable ridership increases in the 16 bus corridors in
which it operates.
The Orange Line, in contrast, uses specialty vehicles (some of which are also used
for Metro Rapid service) on a dedicated TWay serving specialty stations along a 14
mile corridor. The history of that corridor
was one of many failed attempts to create
some form of rapid transit and much political posturing. BRT—and the Light Rail Lite
model in particular—was dictated not by
planning or transit strategic concerns, but
out of political expedience: the desire to “get
something built” within a given pot of
money. It has proven highly successful at
attracting riders, greatly exceeding projections, but as a result is also running into capacity and operational limitations which
have planners scrambling for solutions.
Beyond “Light Rail Lite”:
Pittsburgh and Miami
Pittsburgh and Miami together offer the
closest American equivalent to the Quickway model. Each, however, falls short on
certain key dimensions, limiting the ability
of these implementations to influence further Quickway adoption within the U.S.
Pittsburgh: Busways. Pittsburgh is by far
the American city that comes closest to the
Quickway model in terms of its physical
infrastructure and service plan. Its three
Busways are largely grade-separated and
support a range of services, and have
proven highly cost-effective compared to
EXECUTIVE SUMMARY • xiv
other transit services (including its light rail
Several conclusions may be drawn from this
system). The lack of infrastructure in the
initial review of the Quickway model as a
downtown and a conservative approach to
modal alternative to Light Rail Lite.
route planning have limited the further efThe role of passenger demand. The Quickfectiveness of the network, and Busway staway model is appropriate in contexts where
tions are not nearly to the standard estabsufficient passenger demand may be created
lished by Brisbane, creating both operato justify the investment in gradetional issues and lowered perceptions of the
separation. In many cases, this demand is
system.
generated off-corridor, and is captured
Miami-Dade: South Miami-Dade Busway.
through careful service planning. Properly
The South Miami-Dade Busway is a T-Way
planned, the Quickway model can push
facility that connects far suburbs to the tertransit over a “tipping point” in which pasminus of Miami’s single heavy rail line.
senger demand rises significantly not just
Even with these limitations, it supports a
for Quickway-based services, but for all
range of services
transit services.
H
a
za
rd
C
tr
Mis
s
ion
Va
lle
y
C
tr
R
io
Vis
ta
W
S
ta
diu
m
R
a
ncho
Miss
ion
G
ra
ntville
that more closely
The role of exresembles
the
isting services. The
Quickway model, Fashion
Quickway model
Valley
and has attracted
has proven espeMC
T
IP
T
e
xa
s
30th
33rd
W
ils
on
healthy ridership in
cially useful for
Fairmount
Winona 54th Crawford
EdCenter
a
cost-effective
transit
agencies
DMV
manner
(though
that already operwith noted operaate a variety of
Euclid
C
Alabama
tional issues). Its
express services.
success begs the
In all cases, it imUniversity
Rainbow/
E
gyptia
n
&I-15
question of how UptownDistrict
plies
networkCity HeightsVillage
well an improved
level analysis, not
infrastructure could Figure ES.3. Segment of draft route structure for the San merely the kind of
attract
additional Diego FAST Plan showing express, all-stops, and branching
corridor-level
services in both Quickway infrastructure (solid lines) and
ridership (and pro- arterial operations (striped lines).
analysis typical to
vide even greater
the Light Rail Lite
operational cost benefits).
model, and implies a greater degree of serAn appendix to this study reports on a
vice redesign if all of the benefits of the inQuickway plan developed for the San Diego
frastructure are to be realized.
region, the preliminary findings for which
The role of strategy. In contrast to the
are encouraging for the application of this
Light Rail Lite model—which is a service
model in an American context. The FAST
strategy—the Quickway model is an infraPlan, sponsored by Move San Diego, Inc., a
structure strategy. The cities that have
nonprofit organization, specifically built off
adopted it have looked to create an underlythe experience of cities such as Brisbane and
ing infrastructure which can best support
Ottawa, and identified new innovations that
the organic and evolving deployment of a
would make the model more closely match
range of transit services, but nonetheless
the trip patterns of a American sunbelt city.
confer the benefits of fixed infrastructure.
More to the point, Quickway infrastructure
Conclusions
is inherently scalable, meaning that it can
effectively support a very wide range of
F30
UNIVERSITYHEIGHTS– ADAMSAVE– NORMALHEIGHTS
TROLLEYBARNPK
CARTERI CTR
B20
KENSINGTON
35TH& ADAMS
ANTIQUEROW
MONTE
EMTNVW
UNIVERSITYHTS
T30
T32
T34
CMNODELA RENIA
NODELRIOS
T20
T20
4
T20
4
T20
4
4
4
4
4
4
4
4
4
T2
0
S1
0
T2
0
T20
4
T10
T20
F10
F20
F30
B20
4
F10
4
T34
T10
T10
T10
G10
G10
G10
P20
P20
F10
30TH& UPAS
T10
30TH&UNIVERSITY
G10
P20
F10 G10
F20 G20
F30
T34
G20
S10
EXECUTIVE SUMMARY • xv
passenger demand. In contrast, most Light
Rail Lite implementations have limited scalability; if ridership grows too much, then operations are compromised and service begins to break down.
The role of targets. In every case, the
Quickway model was adopted (or backedinto) as a strategic response to the need of
the cities to achieve measurable ridership or
mode share targets. In contrast, targets as
such are generally not a major factor in
Light Rail Lite planning.
The role of growth. For transit to shape
urban form, there must be growth or investment at a scale that can respond to transit infrastructure and services. The Quickway model appears most valuable in moderate- to high-growth cities, as it can respond to such growth in a way that begins
to shape market demand.
The role of branding. Light Rail Lite depends on branding of the route and vehicle
(and infrastructure, although to a slightly
lesser extent). The Quickway model tends to
put much more emphasis on branding of
the infrastructure, and in the best practices
example treats stations as the primary
branding vehicle, raising the profile of the
system significantly.
The role of models and understanding. Most
cities learn from other cities when attempting to implement a new transit mode. The
importance of such city models is therefore
paramount, as is knowledge of the elements
that contribute to the success of that model.
The match between models and urban form.
When is Light Rail Lite, Light Rail itself, or
the Quickway model most appropriate for a
city? This study identifies a number of factors, including:
• The corridor type;
• Residential and employment density
and the location of demand;
• Dispersion of origins;
• Corridor conditions;
• Total demand;
•
•
•
•
•
Demand for express services;
Passenger volumes;
Internalized vs. externalized systems;
Hybrid service opportunities; and
The role of the corridor in the network.
These factors together suggest the need
for further consideration by the Federal
Transit Administration in terms of how it
can best support the Quickway model
where it comes closest to meeting adopted
strategic goals.
Recommendations for Practice
For the Quickway model to make a contribution to transit planning in the United
States, a number of recommendations are
proposed.
At the Federal level, interest in the
Quickway model should be driven by that
model’s demonstrated ability to costeffectively attract and carry massive ridership. The Federal Transit Administration in
particular can encourage the appropriate
exploration of this mode in several notable
ways:
• Recognition of the Quickway model as a
distinct mode;
• Support for network-level planning;
• Support for improved alternatives development;
• Flexible funding criteria;
• Additional technical study;
• Improved operating cost modeling; and
• A more competitive alternatives generation process, including the adoption of
mode split targets.
Metropolitan Planning Organizations
(MPOs) and public transit agencies can undertake a number of steps as well:
• Develop mode-split targets;
• Improve network-level analysis and
planning;
• Learn from and about the Quickway
model; and
• Embrace high-level market research.
EXECUTIVE SUMMARY • xvi
Planning and engineering firms—who
perform the bulk of the alternatives development and analytical work in this country—can and should become more familiar
with the Quickway model as a means of
helping regions meet their long-range goals:
• Become familiar with the Quickway
model; and
• Explore Quickway service planning
concepts.
In short, the effective implementation of
the Quickway model calls for a number of
elements:
• The adoption of targets;
• Embracing an infrastructure strategy;
• Understanding the role of infrastructure
in supporting regional growth;
•
Understanding the role of stations in
branding Quickway infrastructure;
• Understanding the limitations of current
ridership modeling; and
• Improving the state of practice of network planning.
Quickways are not merely a graduated
step-up in BRT-supportive infrastructure;
they imply their own logic on system design
and operations and make possible services
that otherwise would not be cost-justifiable.
They should be treated as a distinct mode,
particularly for network and corridor-level
planning, and one with great potential for
helping American cities achieve phase shifts
in the role that transit plays in their daily
lives and long-range growth.
EXECUTIVE SUMMARY • xvii
This page intentionally left blank.
EXECUTIVE SUMMARY • xviii
1.
Introduction:
A New Model, a New Mode
Bus Rapid Transit (BRT) has come to mean many things to many people within
the United States. At one extreme lie “Rapid Bus” schemes such as Los Angeles’s
Metro Rapid network, consisting of a number of bus routes that feature simplified
routing, lengthy stop spacing (just under one mile), mild signal priority measures
in many corridors, and special system branding. At the other extreme lie dedicated guideway systems, such as Los Angeles’s Orange Line, a bus route that
mimics a light rail line by operating in a dedicated right-of-way and connecting
specialty-built stations typically spaced at about one mile apart. Like Metro
Rapid, the Orange Line enjoys signal priority measures at street crossings; unlike
many rail systems, it does not enjoy signal override.
A common feature of the range of most BRT applications in the United States
is that the route and the underlying alignment or guideway are essentially one
and the same. The Orange Line, for example, is a single route operating in a
dedicated busway; every bus stops at every busway station, and every busway
station is served by every bus. To be sure, there are some notable exceptions to
this rule (such as Pittsburgh’s busways), but the vast number of BRT projects in
the US follow this model.
The service model that dominates BRT planning in the United States may
described as that of “Light Rail Lite,” in that BRT is intended, at some level, to
mimic the kind of service that light rail (LRT) typically provides: compared to a
bus in mixed traffic, light rail is often deployed so that it operates, if not entirely
in its own right of way, at least separated from auto traffic, connecting enhanced
stops or stations typically spaced one-half to one-mile apart (closer in urban centers, occasionally farther apart in outlying areas) with a generally higher-speed
operation. The Light Rail Lite model of BRT has found favor not because of any
innate interest in the bus per se (it is relatively common to see people clamoring
for rail systems for rail’s sake, but rarely buses for bus’s sake), but as a cheaper
means of introducing a light rail-like service (or what some have dubbed “Like
Rail Transit”); it has sometimes been described as “light rail on the cheap.”
Both LRT and Light Rail Lite models may be compared to pearls on a string,
in that a corridor is conceived as a string of stations that are all linked by a single
transit service. This image of “rapid transit” is a classic one and hence is relatively easy to conceive and communicate.
Though most current applications of BRT in the United States follow the
Light Rail Lite model, some of the outstanding examples of BRT systems internationally follow a different network model. This other model involves the creation
of relatively high-speed guideways or Quickways that support not just an “allstops” or Light Rail Lite route but also a range of other routes, some or many of
which may bypass individual stations through the use of passing lanes. Some of
these other routes may branch off of the core or central guideway to serve locations along other corridors or alignments. These Quickways often take advantage
ADVANCED NETWORK PLANNING FOR BUS RAPID TRANSIT · 1
of grade separation to minimize travel times and permit high-volume operations.
This model, which may be called the Quickway model, differs fundamentally
from the Light Rail Lite model in that it focuses planning attention on creating an
underlying infrastructure to support a range of services, some of which may enter or leave that infrastructure.
The differences between the two models are sufficient to suggest that Quickway-based systems be understood as a distinct mode of transit, not merely a variant on the continuum of the Light Rail Lite mode of Bus Rapid Transit as currently understood in the United States.1 That is to say, just as rail transit is not a
single mode but rather a collection of modes (including heavy rail, light rail,
commuter rail, and streetcar), Bus Rapid Transit itself comprises at least two distinct modes, each of which implies its own planning and service logic.
As the review of international practice will suggest, the Quickway mode of
BRT emerges as a preferred or desirable alternative following a planning process
that is focused on deploying a network of services to achieve specific and ambitious ridership targets. The Quickway model evolved from a sophisticated understanding of the relationship among a set of variables—the cost of operating buses
(and under what conditions), the factors that drive modal choice, the role that
station design, location, and amenity play in driving choice, the willingness of
passengers to transfer (and under what conditions), and the relationship between
and among different services in an overall transit network.
Three outstanding examples of the Quickway model internationally are located in three vastly different cities on three different continents. The model
originated with the pioneering work of John Bonsall in Ottawa, Ontario, capital
of Canada, a generally well-planned metro area whose population passed the
million mark in the 1990s. Ottawa has developed what it calls the Transitway, a
network of mostly grade-separated roadways used by a variety of transit services
in the region. Ottawa’s Transitway differs from virtually all US BRT systems in
its use of grade separation, its service plan, and the quality of the stations that
serve the corridors.2
Bogotá, Colombia, is the capital of a South American republic long associated
with social strife and generally unsafe conditions, in addition to the problems of
urban poverty and rapid growth exacerbated by a steady stream of refugees
from poor and less-safe rural provinces. A city of maybe perhaps 7 million residents (in a metro area that exceeds 8 million), Bogotá is actually in the throes of
an urban renaissance variously noted even in the American media.3 This renaissance has, as one of its core elements, the development of the TransMilenio BRT
system. This system was not directly inspired by Ottawa, but rather evolved into
the Quickway model following an original attempt to plan a Light Rail Lite form
of BRT for the city, as a means of overcoming the limitations of that model.
The other notable city sits half a world away from Bogotá. Brisbane, Australia, is the capital of Queensland, a state which is enjoying relatively high inmigration from other parts of Australia due, in part, to a healthy economy and
perceived high quality of life. Brisbane is a city of about 1.6 million residents,
within a metro area of about 2.25 million residents. Brisbane—which was directly
inspired by Ottawa—has been developing a network of grade-separated Quick-
ADVANCED NETWORK PLANNING FOR BUS RAPID TRANSIT · 2
ways (the Busway system) which together support literally dozens of bus routes
operating in all-stops, branching, and express modes.
Though there are significant differences in the underlying approach to developing BRT in the three cities, what they share in common is a service plan
which differs sharply from the Light Rail Lite model. It is the purpose of this
study to identify the features that distinguish these international cities’ approach
to BRT, to compare them with recent and relevant BRT projects in the United
States, and to then discuss issues relating to the applicability of this model to cities in the U.S. A central theme of this discussion is the role of strategy in general
and strategic goals in particular, as the Quickway model as implemented has consistently reflected the need to meet targets.
This report is structured in four primary sections. The first introduces the
theme and sets the stage for the analysis that follows. The second focuses on the
three international examples of Quickway-based BRT systems, describing key
features of these systems and highlighting major issues with their development.
The third section looks at four American cities with notable BRT systems, and
compares these cities with the international case studies. These four American
cities are themselves divided into two groups: those that are unabashed implementation of the Light Rail Lite model, and the two that come closest to the
Quickway model. The final section highlights key points that emerge from the
preceding analysis in terms of the applicability of the Quickway model to US cities. An appendix looks at a planning process currently underway in San Diego to
develop a Quickway infrastructure for that region, and reviews some key initial
findings of that process.
The report follows a case study methodology, in which each city’s BRT system is reviewed according to the key characteristics of BRT systems which have
been commonly advanced world-wide.4 The importance of each of these elements to the overall functioning of the system is discussed, as well as the interrelationship among these elements.
This study introduces or reinforces several new terms to the discussion of transit
systems in the hopes of highlighting the distinction among differing elements
that are often called by the same name; as transportation professionals and the
broader public become more familiar with the distinctions, their ability to promote more effective solutions will be heightened. Among the terms used in this report are
the following.
T-Way. It is common to use the expression
“busway” to describe any running surface dedicated for use by buses. In practice, though, there
is a world of practical difference between an atgrade busway such as the Los Angeles Orange
Line and a grade-separated busway such as
Brisbane’s Southeast Busway. The term “TWay” is proposed for an at-grade busway, or
one whose operations are determined by grade
Figure 1.1
Sydney’s T-Way
network operates
mostly at grade.
ADVANCED NETWORK PLANNING FOR BUS RAPID TRANSIT · 3
crossings. The term “TWay” is taken from Sydney,
Australia’s busway network
(Figure 1.1), which operates
mostly at grade.
T-Ways are an example
of a “Category B,” or “Longitudinally Physically Separated” right-of-way, to use
Vuchic’s framework.5 In
such a right-of-way, transit
vehicles are separated longitudinally from other vehicles (traffic), but there are atgrade crossings from automobiles and/or pedestrians.
Quickway. In contrast to
a T-Way, which is an atgrade facility, a Quickway is a grade-separated busway, such as those found in
Brisbane (Figure 1.2) and Ottawa,6 that allows for buses to pass at stations (to
support express routes). Quickways offer not merely faster travel times than TWays, but generally offer much higher capacity, fewer traffic impacts, and produce markedly greater operating cost benefits. They are also far more expensive
to build.
Quickways are an example of a “Category A,” or “Fully Controlled” right-ofway; access to the facility is fully controlled, and cross traffic is eliminated
through grade-separation or, in limited circumstances, signal override at grade
crossings.
Internalized Networks are rapid transit systems that operate exclusively within
specialty guideways, be they T-Ways or Quickways. Examples of such systems
are Bogotá’s TransMilenio and Los Angeles’s Orange Line. Such systems tend to
use specialty vehicles that are unique to the network. Prior studies of BRT have
suggested the notion of “open” or “closed” systems to describe BRT infrastructure which is open to “any” operator or vehicle, or is operated with only a specific
set of vehicles by operators specifically contracted or otherwise entitled to operate them; the concepts of “internalized” and “externalized” networks as introduced here are intended to focus entirely and specifically on the issue of whether
buses operate only within dedicated guideways, or whether they branch out of
them.
Externalized Networks are those that permit or even depend on “standard”
transit vehicles to enter and/or leave the guideway system to serve origins and
destinations off-corridor. Such systems rely more on the branding of the infrastructure than of the services running on the guideways. Examples of externalized networks are the South Miami-Dade Busway as well as Brisbane’s, Ottawa’s, and Pittsburgh’s busway systems.
Figure 1.2
Brisbane’s Southeast Busway is an
example of a
Quickway—a transitway that enjoys
the benefits of
grade separation
and passing lanes
at stations.
ADVANCED NETWORK PLANNING FOR BUS RAPID TRANSIT · 4
2.
The Quickway Model
2.1
Introduction
The Quickway model of BRT differs from the Light Rail Lite model by its essential focus: the role that infrastructure, namely rights-of-way and stations, plays in
the system. The Light Rail Lite model of BRT is generally concerned with duplicating the service pattern of LRT; the underlying right-of-way may involve any
degree of transit priority, from signal priority measures or even the simple ability
to stop a bus in a travel lane, on up to grade separation at key choke points, but
such infrastructure is justified primarily in terms of supporting the LRT-like level
of service.
Quickway-based systems focus instead on creating a dedicated and primarily
grade-separated right-if-way to permit a range of transit services to travel
through a corridor at the highest practicable speed. It is expected that such services will evolve and change over time, and only a handful or even just one of
these services will resemble an equivalent LRT service.
BRT systems are commonly described in terms of a set of elements, or at least
a range of considerations for a number of standard elements. These include:7
• Running Ways;
• Stations;
• Vehicles;
• Intelligent Transportation Systems;
• Fare Collection;
• Service Patterns; and,
• Identity and Branding.
Quickway-based BRT systems differ from the more common Light Rail Lite
model in a number of key fashions; however, since neither is a fixed model, there
is considerable room on both sides for variance. Still, a comparison of BRT implementations in different cities yields the following insights.
2.2
Running Ways
For the Quickway-based model, the running way is the key variable, the strategic
choice that in turn shapes and enables service choices. Quickway-based systems
focus considerable capital resources on creating a mostly grade-separated infrastructure (Quickways) to support a range of transit services. These Quickways
almost always feature passing lanes at stations to permit some routes to bypass
intervening stations. In cases where full grade-separation is not possible, sufficient right-of-way is still provided (often, as is the case with TransMilenio, two
travel lanes in each direction) to maintain high capacities and still permit passing
at stations. The importance of the grade separation lies in its impact in terms of
both ridership (revenues) and operating costs (public subsidies); because significantly faster services may usually be provided at less cost than slower services
ADVANCED NETWORK PLANNING FOR BUS RAPID TRANSIT · 5
(this will be explored in greater detail below), a transit agency is able to provide
more service per available dollar; likewise, because faster services generally attract a higher ridership, these services generate more farebox revenue. The double-play of lower costs and higher revenues can be used to drive a “virtuous circle” and lead to a phase-shift in the role of transit in a given area (there is evidence that this is occurring in two of the international case studies discussed in
this report).
Full or even partial grade separation is rarely a component of the Light Rail
Lite model, as projected ridership along a single route may not justify the scale of
cost (or, more often, push planners or decision-makers to favor a rail mode for
the corridor, given the scale of investment). Many applications of BRT in the
United States anticipate operation within a major arterial, either in a dedicated
bus lane or relying almost entirely on signal priority measures to help buses
compensate for the effects of road congestion and signal-induced delay. Where
dedicated right of way is provided, it may not necessarily include passing lanes
at stations, forcing all buses either to stop or await a stopped bus before proceeding, and even when passing lanes are provided, frequent and complex grade
crossings significantly slow services, even with signal priority.
2.3
Stations
Since the Quickway-based model focuses on creating exclusive and primarily
grade-separated right-of-way, stations are a major component, and in some systems are quite elaborate and generously sized (such as with Brisbane). Quickway
stations almost always include passing lanes for vehicles not stopping, and also
include separated crossways for pedestrians (typically, pedestrian bridges) to
reduce conflicts with buses that are not stopping and permit higher bus operating speeds through stations.
Stations may take a large variety of forms for the Light Rail Lite model, ranging from simple signs (such as those found at some stops of Los Angeles’s Metro
Rapid) to light rail-like stations, generally comparable to stations commonly used
in Quickway-based systems.
2.4
Vehicles
Cities with Quickway-based systems,
such as Brisbane and Ottawa, tend not
to use specialty “BRT” vehicles, but
rather run their traditional transit buses
through their Quickways. In the case of
Bogotá, TransMilenio does use specialty
articulated vehicles, outfitted with extra-wide high doorways designed for
platform loading, but otherwise are
configured internally much like traditional transit buses.
Figure 2.1
Gillig 35’ transit bus
in “BRT treatment”
(top) and “regular”
treatment (bottom).
The primary difference is in the shape
of the vehicle’s front
end and custom paint
scheme. Other physical differences are
due to the use of a
hybrid electric drive
train (top).
ADVANCED NETWORK PLANNING FOR BUS RAPID TRANSIT · 6
Many cities implementing Light Rail Lite versions of BRT are choosing specialty buses that cost considerably more than standard transit vehicles. These
buses are purportedly designed to provide a higher degree of passenger comfort,
level low-floor boarding, and a more appealing exterior. Some bus manufacturers offer their standard buses in a “BRT treatment,” often implying design cues
that add visual interest to the exterior. As a result, the meaning of “BRT” has become even more diluted, as some transit operators have been observed to say,
“let’s run the BRT on this [non-BRT] route.”
2.5
Intelligent Transportation Systems
Quickway-based systems, in practice, have rarely had to rely on advanced ITS
systems (such as advanced signaling systems), as physical infrastructure generally provides many of the benefits that such systems are otherwise called upon to
provide. Advanced passenger information systems may be a part of Quickwaybased systems, though the improved schedule adherence of Quickway-based
systems may somewhat obviate the need for live, as opposed to scheduled, information.
ITS systems become of greater importance to most Light Rail Lite implementations of BRT, as these systems generally must contend with traffic signals and
automotive flows that affect vehicle travel time.
2.6
Fare Collection
Quickway-based systems may or may not use off-board fare collection or various
smart media; the use of such systems may confer benefits, but is again not central
to the model.
Light Rail Lite-based systems must often rely on advanced fare collection
systems (primarily, the use of off-board collection) as a means of reducing vehicle dwell times. Given the delays that otherwise may be expected due to at-grade
operations, reduced dwell time is one of the primary means by which Light Rail
Lite systems are able to gain travel time savings (the other four are through the
use of wider station spacing, queue-jumping infrastructure, more direct routing,
and traffic signal priority systems).
Quickway-based systems, in contrast, gain substantial travel time savings by
the elimination of most or all traffic signals and traffic queuing and by reducing
the number of stops that most routes make. While reductions to dwell time could
further improve operations, the gains created by grade separation are significantly greater and hence may have overshadowed the benefits that off-board fare
collection could bestow.
2.7
Service Patterns
Quickway-based systems are characterized by a rich mixture of services taking
advantage of a high-speed guideway (the Quickway) in order to deliver transit
ADVANCED NETWORK PLANNING FOR BUS RAPID TRANSIT · 7
services to a wide swath of a metro area. They typically feature a “spine” service
which is otherwise comparable to the Light Rail Lite service, but also feature
various express, semi-express, branching, and direct (point-to-point) routes.
A key feature of the service patterns of cities such as Brisbane, Ottawa, and
Bogotá is that the infrastructure is designed to support services which deliver
passengers directly to major employment sites and other key trip generators.
Though transfers are facilitated by these networks, the operational goal is to deliver as many riders as possible to their destinations as directly as possible, bypassing intervening stops and eliminating many transfers.
The Light Rail Lite service pattern is typically just that: a single route mimicking a light rail service along a given alignment. This route may or may not
serve key trip generators, and it may be conceived as an extension to a more
capital-intensive transit mode, albeit with a forced transfer where it meets that
mode (as is the case, for example, with both Los Angeles’s Orange Line and the
South Miami-Dade Busway, both of which terminate at a heavy rail station).
2.8
Identity and Branding
Branding has been identified as a common feature of BRT
systems, but it is in how and what is branded that the distinction between the Quickway and Light Rail Lite models becomes clear.
Quickway-based systems, generally speaking, are as
likely or more likely to brand the infrastructure as they are
the transit services that use that infrastructure. Both Ottawa and Brisbane, for example, have special logos for
their Transitways and Busways (respectively); the various
routes that use these guideways are not necessarily branded any differently from
traditional transit services. Brisbane, in particular, uses station architecture as an
element of branding and identity; as one Brisbane planner explained, it’s hard to
give a special identity to what is essentially just a two-lane road (the Quickway
itself), so the stations become the opportunity to give a “corporate architecture”
to the system. The message may be understood as “any service that uses the
Quickway is, by definition, faster than surface services.”
The Light Rail Lite model generally focuses on branding not just the stations
or right of way but the vehicles as
well, given that they need to be distinguished from traditional bus services even more than with the Quickway model (as in most cases they are
more likely to operate adjacent to or
within traffic). The message may be
understood as “this service is faster
than other transit services.”
Figure 2.2
Logo for Brisbane’s
Busway network.
Figure 2.3
Original branding
for LA’s Metro
Rapid bus service.
ADVANCED NETWORK PLANNING FOR BUS RAPID TRANSIT · 8
2.9
Strategic Intent
To sum up, the Quickway model may be characterized therefore as:
1. Created around a dedicated, often grade-separated right-of-way;
2. Employing major stations along that right-of-way, and occasionally off
that right-of-way as well, which incorporate passing facilities so that
some routes may bypass individual stations;
3. Less dependent on advanced transit vehicles;
4. Less dependent on advanced signaling and traffic management systems,
as well as advanced passenger information systems;
5. Benefiting from advanced or off-board fare collection, but less dependent
on it to achieve travel time savings;
6. Employing a robust and multi-route service pattern, designed to deliver
the largest number of passengers to key destinations with a minimum of
transfers; and
7. Focusing branding and identify more on the infrastructure and less on the
vehicles.
Beyond these elements of service lies the strategic intent of creating Quickwaybased networks. The Quickway model is designed to change the economic performance of transit services by focusing on those elements that generate costs and
those that generate revenues. It is precisely because the Quickway model responds
to these “cost and revenue drivers” that the model is not only relevant to the
U.S., it holds out at least the promise of effecting a major change in the role of
transit in many American cities.
To understand better the impact of Quickway infrastructure on costs and
revenues, it is necessary to explore in greater detail the relationship between operating characteristics and operating costs.
Throughout the United States, transit systems routinely maintain distinct
capital and operating budgets; what’s more, federal funding for capital purchases (such as for new vehicles or the New Starts and Small Starts capital programs) is generally divorced from operating funding. As a result, some agencies
with limited dedicated local funding sources find themselves “capital rich but
operating poor,” as one transit agency general manager once lamented. In addition, while the public officials who generally sit on transit agency boards may
favor capital projects for political reasons, the political payback for funding operations may be more limited.
Most, if not all, US transit agencies rely on accounting models to allocate costs
to routes. While these models vary by agency, it is common to have models that
assign some costs based on in-service hours (to account for drivers) and others
based on mileage traveled (to account for fuel, tires, oil, and maintenance, which
together can be considerable). While this might be a useful and even appropriate
way to allocate costs when all bus routes behave approximately the same, it can distort
the actual costs of operating truly rapid BRT services; to begin with, a bus operating at higher speeds with fewer stops will generate less wear-and-tear than a bus
going stop-and-go in an urban low-speed environment (implying reduced maintenance costs per mile traveled); then too, at higher speeds, the vehicle is gener-
ADVANCED NETWORK PLANNING FOR BUS RAPID TRANSIT · 9
ally operating more efficiently. Of even greater impact, high speed operations
may allow a transit operator to produce a given service frequency with fewer
vehicles, as each vehicle is able to complete a round trip in less time.
Economists generally distinguish accounting models from production function
models. Accounting models seek to allocate costs for accounting purposes, which
is fair, but they rarely identify the drivers of such cost. It may be that, on average,
a transit bus costs, say, $60/hour to operate, but that doesn’t tell us what specific
dimensions of service generate those costs or, of greater importance, what the
additional or marginal cost would be of adding (or removing) new services.
A production function model is one that identifies the attributes of a service
that generate costs. For example, using the above example, operating speed is one
such attribute; as speed increases, some costs generally go down (such as fuel
required per mile of travel, maintenance required per mile of travel). As certain
thresholds are crossed, the number of vehicles that must be in service to produce
a given route schedule is reduced, leading to a further reduction in labor costs.
So from an economics perspective, a transit agency that seeks to systematically
reduce the time it takes to produce a given round trip is one that will be lowering
its operating costs.
The above facts are salient in the discussion of the relative performance of
BRT vs. LRT systems. Common pronouncements will often claim that LRT systems are more cost effective than BRT systems at relatively modest ridership
thresholds because of the need to operate more buses to match the seating (or
gross) capacity of a three- or four-car LRT train. This argument was advanced,
for example, by former California State Senator James Mills, who is widely credited with being the father of modern light rail in the United States:
The belief that buses on guideways are cheaper to operate than light
rail trains is false. To carry 400 riders at rush hour requires five or six
buses with five or six drivers. One light rail train would do that with
only one driver, and most of the cost of transit operations is labor.8
The Senator was correct that “most of the cost of transit operations is labor,”
but with LRT systems, most labor costs are for maintenance; a review of the operating budget of one LRT operator suggests that driver costs may account for
only 13% of gross costs, so while driver costs on the bus side would indeed be
higher, the scale of difference would be far less than the ratio of drivers (and the
cost of adding a car to a train, rather than being trivial, can be nearly that of operating a bus with driver). More to the point, though, a thoughtful BRT service
plan (based on the Quickway model) would not have each of those five or six
buses operating identically, but would involve some mixture of express, allstops, and short-lined service, thereby reducing total vehicle in-service time and
freeing up resources to be used on other routes. In addition, in the off-peak, demand may only require one or two buses, at substantially lower cost than that of
operating a train.
ADVANCED NETWORK PLANNING FOR BUS RAPID TRANSIT · 10
Also, and this leads to the other side of the equation, that of revenues, there
are known attributes of service that attract ridership to a transit service; they
generally fall into three groups:9
1. Network structure, which defines the places that are connected by a transit
system, the location of access/egress points, and the directness of such
connections;
2. System performance, which is a function of waiting time, access time, invehicle travel time, capacity, and overall system reliability; and
3. Customer experience, which consists of many different attributes or stages
in a transit service encounter and the various degrees of perceived risk or
benefit involved in each stage; issues of identity and self-validation are
also important to this dimension.
By and large, Quickway-based systems generally offer higher service frequencies and shorter travel times than many other modes (figure 2.4), and more
advanced systems also eliminate many interim transfers, or locate such transfers
in stations (as opposed to making them on-street), typically along the same platform.10 So, returning to the LRT example, one would not expect the same level of
ridership for a train that operated every 15 minutes versus a bus that operated
every 3 minutes, everything else being equal. Likewise, given a 30 minute train trip
or a 20 minute bus trip, assuming equivalent reliability and service frequencies,
the faster trip would be likely to attract a larger share of riders. So the combination of higher base frequencies and shorter travel times would induce higher ridership on the bus-based system, further offsetting the difference in operating
costs.
Figure 2.4
AM route schedule
for spine services
on Brisbane’s
Southeast Busway,
showing the extraordinarily high
frequencies on this
corridor. Express
services, not included in this
schedule, offer
faster connections
from outer stations
to destinations in
the central business district.
This issue is of extreme importance in the development of Quickway-based
alternatives for an Alternatives Analysis program; the relative operating costperformance of a Quickway-based alternative is based on a somewhat nuanced
ADVANCED NETWORK PLANNING FOR BUS RAPID TRANSIT · 11
service plan that seeks to move as many riders as possible to express services,
and that seeks to eliminate transfers whenever feasible—precisely opposite the
planning logic of the Light Rail Lite model.
So, again, this leads to the fundamental strategic intent of a Quickway-based
system: the creation of an infrastructure that significantly lowers the net costs of
providing transit services while at the same time attracting a larger market (more
riders). While it should be obvious that the conditions where this could occur (to
the point where the capital costs are justified) are likely present in a limited set of
corridors in any given urban area, they do highlight a rather paradoxical fact of
the model: in contrast to popular notions (fueled by conceptions of the Light Rail
Lite model) that hold that BRT is an “intermediate” capacity mode or a steppingstone on the way to light rail, the Quickway-based model both relies on and,
properly planned and configured, generates higher ridership than is typically
found in US light rail implementations. If it’s a stepping stone, it’s a stepping
stone to heavy rail or metro systems, but likely not light rail.11
The next section of this report will review the experience of three global cities,
Ottawa, Bogotá, and Brisbane, with their BRT systems. While the three cities—
and the three systems—are different, they each illustrate many key features of a
Quickway-based approach to BRT systems planning, and will serve as a point of
contrast for comparing American approaches to BRT.
ADVANCED NETWORK PLANNING FOR BUS RAPID TRANSIT · 12
3.
The Quickway Model:
International Case Studies
3.1
Ottawa, Ontario: The Transitway
3.1.1
Transitway: Background
Ottawa, Ontario, is the capital of Canada and its fourth-largest metropolitan region (behind Toronto, Montreal, and Vancouver) with a 2005 metro population
of approximately 1.15 million residents.12 Ottawa is noted for its Transitway system, a network of mostly grade-separated roadways that serve as the backbone
of its transit system. Ottawa is widely regarded as having by far the highest per
capita transit use of any mid-sized city in North America (approximately 120 annual transit trips per capita, equating to an equivalent mode split for transit of
20% of daily trips).13
Though other cities had developed busways, or even grade-separated
busways before Ottawa, it was Ottawa that assembled the elements that together
make up the Quickway model of BRT. The system was not conceived in toto, but
rather evolved as the considered response to a long series of decisions and challenges. Before discussing the elements of the system, it is worth looking at the
background of the system.
In the early 1970s, public sentiment in Ottawa was reportedly aligned against
a road expansion approach to dealing with growth and congestion. The 1974 Official Plan, developed by the then-regional government, contained deliberate policy language favoring public transportation above all forms of road construction
and widening, and that further, as a result, set out ambitious and calculated
mode share objectives for transit investments and services on a corridor-bycorridor basis.
These mode-share objectives were the salient and overriding “push” that led
to the development of the Quickway model. The 1974 Official Plan was, above all
else, a land use plan, directing which areas were to be the targets of growth and
development. Since road development was to be limited, it then fell to transit to
meet the projected demand for movement to, from, through, and within the region and its associated land uses. These targets then became the basis for planning; it was not enough that any particular transit alternative demonstrate its
cost-efficiency relative to other alternatives (as is often the case in traditional Alternatives Analyses conducted in the U.S.); if the alternative(s) did not meet the
mode share goals, then it would need to be revised, revamped, or replaced until
it did.
The pressure to meet modal targets forced Ottawa area planners to confront
the limitations of a surface-based transit system; clearly, some form of rapid transit would be needed, and for transit to be rapid, it would need to be gradeseparated. Ottawa was at this time operating express buses on freeways, so there
ADVANCED NETWORK PLANNING FOR BUS RAPID TRANSIT · 13
was some appreciation of the costs and benefits of higher-speed transit operations.
Ottawa originally conceived of its “transitways” as mode-undefined gradeseparated corridors that linked downtown with other principal destinations and
that offered access to a large share of the bedroom communities in the region.
These transitways were evaluated in terms of costs, ease of construction (regardless of mode), ability to serve land uses, and connection with other alignments,
without reference to any particular technology As such, these transitways were
conceived as mode-neutral; they could be either light rail or busway corridors.
Ottawa planners, when looking at transitways from a bus perspective, understood from the start that the transitways could support a range of services;
the fact that they already operated multiple service types (feeder, mainline, express, and limited stop routes) meant they already had a more nuanced understanding of the behavior of such service types. More to the point, they also recognized that a grade-separated Quickway infrastructure would favor a restructuring of the entire transit system into an integrated network of services.
The alternatives analysis performed by Ottawa planners was undertaken at
the system level, in which an optimized light rail-based transitway system was
compared against an optimized bus-based system. This study determined that
the bus-based system would have a large set of advantages over a rail-based system:
1. It would be cheaper to both build and operate;
2. It met mode share objectives more effectively than LRT, primarily because of the reduced need for transfers on the bus network;
3. It was stageable, meaning both that the benefits of investment could be
spread around the region (a political reality) and that the system could be
implemented much sooner, as transit services could operate over existing
roadways while dedicated infrastructure was being built on a prioritized,
as-needed basis; and
4. It offered riders a higher level of service, with shorter wait times and
more express choices.
3.1.2
Transitway: Strategic Elements
The elements that make up Ottawa’s Transitway system were, generally speaking, not copied from other cities, but evolved out of Ottawa’s need to achieve
certain targets and goals. They set the pattern that would be picked up later by
Brisbane with its Busway system.
Running Ways. While Ottawa’s transitways were originally conceived as
mode-neutral, the system-wide alternatives analysis recommended that the transitways be configured to serve a bus-based system. Thus was the Transitway—
the name formally adopted for the infrastructure—born. The first sections
opened in 1983; by 2004 some 28 miles of Transitway had been constructed, and
plans continue to call for further expansion of the system.
ADVANCED NETWORK PLANNING FOR BUS RAPID TRANSIT · 14
Ottawa’s Transitways were designed to be compatible with both rail and
bus technologies, in terms of basic geometries. However, these geometries were
not optimized for light rail (in constrained environments), as doing so would
have imposed significant additional construction costs on the system.
The Transitways do not continue through Ottawa’s downtown. Rather, buses
travel along transit lanes on surface streets (Figure 3.3). This routing followed the
strategic decision to not attempt grade-separation through the downtown given
the very significant costs involved. A downtown twin-bore tunnel plan was developed, however, to demonstrate the feasibility and identify the costs and issues
involved in creating
such grade-separation.
This tunnel plan assumed traditional diesel bus operations;
should Ottawa decide
to revisit the bus tunnel
concept, some cost savings
might
accrue
should the tunnel be
redesigned for hybrid
electric vehicles (given
the potential for operation in electric mode
through a tunnel).
Concerns about bus volumes downtown have played a role in Ottawa’s recent interest in developing light rail infrastructure. A starter light rail line (using
self-propelled units) of approximately five miles along an existing rail track was
inaugurated in 2001. More recently, a more detailed plan for light rail expansion
Figure 3.1
Map of Transitway
corridors.
Figure 3.2
Bus leaving station
along Transitway.
Note access ramp
ahead of bus on right.
ADVANCED NETWORK PLANNING FOR BUS RAPID TRANSIT · 15
was first abandoned then readopted;
meanwhile, the completion of the
Transitway network remains a regional priority.14
Ottawa’s Transitways are generally designed to support bus operations of 45-50 mph between stations
and 30 mph within stations. Stations
are spaced at approximately one mile
intervals.
Stations. Ottawa’s Transitway
strategy emphasized the importance
of both running ways and stations in
terms of implementing a vision of
rapid transit. Planners report that
they understood that stations needed
to be special, that they needed to be the equivalent of a light rail station. In this
sense, the choice of buses for the Transitway was not viewed as a cost-cutting
move, but as more cost-efficient than a rail alternative. There would still be equal
attention to the quality of infrastructure.
Though original plans for stations proved too ambitious, the OC Transpo
Board rejected the revised station concepts as second-class; political support for
quality stations was strong, as it was understood that stations would project the
system’s image in the community.
Stations on the Transitway are designed with Ottawa’s frigid winter
climate in mind. They feature a significant degree of enclosure to protect
waiting passengers from the harsh
elements, and feature common design
elements (red metal, glass, and raw
concrete form the primary palette).
Stations vary in size depending on
passenger demand.
Vehicles. Ottawa’s Transitway was
conceived as an infrastructure that
would permit the more efficient operation of the existing transit fleet. As
such, no special vehicles were anticipated. Over time, passenger volumes led to the addition of articulated, low-floor
buses to the fleet. Though not all of these operate on the Transitway, they all
share certain operational policies, which are discussed under the heading of Fare
Collection.
Figure 3.3
Bus in transit lane
through Ottawa’s
downtown.
Figure 3.4
Minimal Station
on Transitway.
ADVANCED NETWORK PLANNING FOR BUS RAPID TRANSIT · 16
One other factor that led Ottawa
planners to discount the role of specialty vehicles (or a special livery for
Transitway services) was the general
lack of stigma attached to the bus.
Transit ridership in Ottawa traditionally attracted a range of users from
most socio-economic groups; hence, it
was not viewed as necessary to distinguish BRT services (that is, services
enjoying the advantages of the
Quickway infrastructure) from other
transit services. Then, too, a large
share of routes, and virtually all buses
at some point, use at least some part
of the Transitway infrastructure, diluting the potential impact of vehicle branding.
Intelligent Transportation Systems. Ottawa makes use of real-time service control and passenger information systems; however, neither is central to Transitway operations. Service control technology is useful at a network level to improve and monitor bus operations as a whole, but is not specific per se to the
Transitway. Passenger information
systems are seen as useful to customers, particularly for lower-frequency
express routes that use the Transitway. Other routes are so frequent—
some feature two- or three-minute
headways—that live information is of
little consequence.
Fare Collection. Ottawa has typically relied on traditional fare collection strategies (farebox and passes).
However, interest in reducing vehicle
dwell times at stations led to the
adoption of a policy for articulated
buses that permits holders of prepaid fare media to board through any
of the doors on the vehicle (through the honor system); only those paying the
driver are required to board through the front door. It is reported that boarding
time has, as a result, been reduced to an average of one second per passenger on
3-door articulated buses. The policy on multiple-door boarding applies to articulated vehicles anywhere they travel, including routes off the Transitway.
Transitway stations do not currently feature fare machines.
Service Patterns. OC Transpo, the agency responsible for bus operations (and
for the operation of the Transitway and O-Train systems), operates four kinds of
service on (and off) the Transitway system.
Figure 3.5
Major station
along Transitway.
Figure 3.6
Articulated bus at
Transitway station.
ADVANCED NETWORK PLANNING FOR BUS RAPID TRANSIT · 17
•
•
•
•
BRT Spine Services are all-stops routes that run entirely on the Transitways, providing a very high-frequency core “Light Rail Lite” service (but
at much higher frequencies than would be typical for most light rail systems). Four such routes—the 94, 95, 96, and 97—connect different corridors with the downtown spine.
Mainline routes travel across the region and may use portions of the Transitway for part of their route. An example would be the 101 and 102.
Local feeder buses connect neighborhoods with Transitway stations. Some
offer connecting service in non-peak hours (during peak hours, Express
services operate as local feeders, then continue through the Transitway to
or from downtown), whereas others operate all day.
Express and Limited Stop services are the fourth kind of service using the
Transitways. Express services target the outer parts of the region; they
begin at the periphery as a local bus in feeder mode until they reach the
entry Transitway station, then operate mostly nonstop until they reach
downtown Ottawa; they then mostly travel through the other side of
downtown to serve other corridors. Limited Stop services serve closer-in
neighborhoods; they behave like Express services, except they are more
likely to stop at more stations along the Busway, given the greater likelihood of people traveling the shorter distances to these stations.
Ottawa makes extensive use of interlining to maximize service efficiencies.
The Quickway infrastructure of the Transitway makes it feasible to do extensive
interlining, as travel time among points along the infrastructure is minimal.
Identity and Branding. Given the importance of the Transitway in meeting
numerical mode split targets, attention was paid to station design and to the
Figure 3.7
Ottawa Rapid
Transit Network
showing
Transitway spine
services (94, 95,
96, and 97), two
mainline routes
(101 and 102),
and the O-Train
light rail.
ADVANCED NETWORK PLANNING FOR BUS RAPID TRANSIT · 18
branding of the overall infrastructure. As such, it is the Transitway that is
branded, not the buses using it or the particular services that operate through it.
It is worth observing that OC Transpo in recent years seems to have been
pulling back from promoting Transitway as a brand; with the inclusion of the
light rail O-Train in the mix, OC Transpo (see, for example, figure 3.7, the rapid
transit network map) has described the “Rapid Transit
Network” in which the O-Train
is specifically identified but the
Transitways are not. This may
Figure 3.8
have been in response to politiTransitway logo.
cal pressure to promote a light
rail plan for the region.
3.1.3
Ottawa and the Quickway Model
Ottawa represents the birthplace of the Quickway model, in that the key elements of that model came together with the Transitway project:
1. The development of a network of mostly- or entirely-grade separated
rights-of-way designed to directly target key destinations, provide access
to a large number of residential zones, and minimize travel times among
these various origins and destinations;
2. The elaboration of a service plan that include both Light Rail Lite elements (a spine service and feeders) and Quickway-specific services
(branching express and limited-stop services, as well as right-of-way to
support mainline cross haul services), much of which has been optimized
through interlining to reduce overall system operation costs;
3. A focus on developing significant stations, which were seen from the
start as projecting the image of the infrastructure (and its many services)
to the communities, and which were designed as rapid transit facilities
(as opposed to glorified bus stops) with significant passenger amenity;
4. A staged infrastructure development plan that allowed services to be implemented before the completion of the underlying Quickway infrastructure, and which in fact was able mostly to target elements and pieces of
infrastructure where and when they would produce the greatest network
benefits; and
5. Continued elaboration and refinement of the original service plan,
matching capacity and routes to actual travel demand.
The combination of fixed infrastructure but variable service plan has been
identified as one of the major strengths of Ottawa’s approach, particularly in
terms of its impact on transit-oriented development:
One of the major advantages of a busway compared to an LRT system is that it gives the benefits of a fixed infrastructure without the
drawbacks of a fixed guideway. The presence of a fixed rapid transit
infrastructure gives developers and the public the confidence that a
ADVANCED NETWORK PLANNING FOR BUS RAPID TRANSIT · 19
high level of service will be always be provided to the stations, so
that stations can act as a catalyst for promoting transit-friendly patterns of development. The lack of a fixed guideway allows incredible
flexibility of operation. The new Transitway station at Place d'Orleans is a prime example of how a busway station will be able to influence growth decades before a separated right-of-way is built to
it.15
The success of Ottawa’s strategy—as a strategy—is made clear by transit mode
splits in the region. Ottawa ranks first among similar-sized cities in North America in transit mode split (20.1%), placing it ahead of Canadian cities such as Calgary (13.2%) and Vancouver (11.5%).16 Actual Transitway bus ridership is approximately 200,000 trips/day, with peak loading of 10,000 passengers per hour
at the peak locations in the peak direction.17
Ottawa is also facing major challenges with its Transitway system, principal
of which is the impact of surface bus operations through the downtown. This
“weak link” in the system has spurred wholesale questioning of the entire system and has led to political calls for its replacement by light rail (though no published technical studies have demonstrated the cost effectiveness or positive ridership impacts of such a replacement). It may also be worth asking whether the
stations, though clearly designed to a standard superior to that of many other
transit facilities, are perceived as desirable by users and potential users of the
transit system (passengers are still exposed to potentially harsh weather when
accessing vehicles, and the hard materials, such as exposed concrete, do little to
create a warm and welcoming environment).
Figure 3.9
Targeted vs. actual
transit mode split
at screenlines.
Source: John Bonsall
ADVANCED NETWORK PLANNING FOR BUS RAPID TRANSIT · 20
Though Ottawa’s is often cited as an example of a successful transit project
(let alone successful transit strategy), few cities have attempted to copy Ottawa’s
approach to developing a Quickway network. Indeed, the primary example globally to date is Brisbane, though a BRT network for suburban Toronto is being
planned which generally follows the Quickway model. The question as to why
this model has not been more widely replicated or studied for application, particularly in the United States, will follow a review of BRT projects in the U.S.
3.2
Bogotá, Colombia: TransMilenio
3.2.1
TransMilenio: Background
Bogotá is the capital of the Republic of Colombia and its largest city, with a
population that varying estimates place close to eight million residents, with significant in-migration from the rest of the country. Bogotá is justly famous for its
BRT system, TransMilenio, which was the subject of an extensive technical study,
published in 2006 by the National Bus Rapid Transit Institute, which reviewed
the applicability of the TransMilenio experience to the United States.18 Rather
than repeat the information contained in that report, the current study will focus
on TransMilenio as an expression of a model of BRT planning rather than as
merely a set of choices along a continuum of BRT elements. That is to say, it is
not just that TransMilenio represents an appropriate set of choices, but that some
of these choices determined what TransMilenio could achieve as a BRT system.
3.2.2
TransMilenio: Strategic Elements
The elements that together make up TransMilenio have been effectively catalogued. They are recapped here in brief form in order to highlight aspects relevant to the Quickway model.19
Running Ways. TransMilenio is actually composed of two separate networks
of service that interface only at terminal stations: a feeder network, composed primarily of transit buses that operate in mixed traffic at the periphery of the metro
area and that deliver passengers to one of the system’s seven terminal stations
(and a small set of in-line stations); and the mainline network, which is served by
specialty articulated transit vehicles operating exclusively in dedicated busways
which to date have been built in over half a dozen corridors. These busways,
which depending on the corridor may be at grade or extensively gradeseparated, are composed of either one or two transit travel lanes per direction; in
cases where only a single travel lane is provided, passing lanes are nonetheless
provided at stations.
It is worth noting that grade separation plays only a partial role in the system, found primarily in those corridors that are built within major express roads.
Just the same, other corridors nevertheless mostly feature limited grade crossings, conferring at least some of the benefits of grade separation and providing
significant travel time benefits.
ADVANCED NETWORK PLANNING FOR BUS RAPID TRANSIT · 21
It is also worth noting that the
mainline (trunk) network of TransMilenio may be characterized as both
a “closed” system (meaning that only
designated operators may use the infrastructure for specific routes) and
an “internalized” system, meaning
that all trunk transit services operate
internally to the infrastructure (guideways). Red mainline TransMilenio
buses do not operate outside of
busways specially developed for
them; in contrast, the green feeder
buses operate entirely outside of the
busway infrastructure, except at the
transfer stations. This stands in contrast to externalized systems such as Brisbane’s (which will be discussed shortly)
and Ottawa’s.
Stations. Stations along the TransMilenio system are, generally speaking, in
median locations, with vehicle doors opening on the left. Much like Curitiba’s
famed BRT system, stations have automated sliding glass doors which are activated by the bus driver along with bus doors. Fare prepayment (using proof-ofpayment entry) and level boarding together help minimize dwell times.
Stations have designated platforms, with specific routes assigned to specific
platforms on a permanent basis.
Stations are built using a modular architecture. A typical module has two bus
platforms on either side. Stations that require more platforms employ additional
modules, separated from the other modules with sufficient space for buses to be
able to merge to the station lane from an outer lane and dock level with the station; the modules are bridged, so that passengers may easily walk from one set of
platforms to another. Because within
station modules the two bus platforms are closely spaced, buses seeking to access the second platform
must first clear the first platform,
which may be occupied by another
bus. As a result, TransMilenio planners report that the second platform
within each module only gives approximately a 30% capacity boost to
the module. A single-platform module has a capacity for 60 buses an
hour per direction; with two platforms, that increases to about 80.
A key feature of stations is their
spacing. Like Curitiba’s “Surface
Figure 3.10
Grade-separated
interchange at
juncture of two
TransMilenio
corridors.
Figure 3.11
Grade-separation
along TransMilenio
corridor.
ADVANCED NETWORK PLANNING FOR BUS RAPID TRANSIT · 22
Subway”
system,
TransMilenio
spaces its stations, as a general rule,
every 500 meters, or just under 1/3
mile. The reasons for such spacing are
described as practical: prior to
TransMilenio, the custom among bus
riders in Bogotá was (and still is) to
flag down buses at any point along
their routes; the custom of walking
along an arterial to access a bus stop
was not well-established. Planners of
TransMilenio decided on 500 meters
as the preferred station spacing
through little more than the educated
guess that people would not be willing to walk more than about 3 minutes (250 meters) to get to a station once they reached a major arterial.
The concern with customer behavior was also reflected in the decision to use
high-floor level-boarding, as opposed to low-floor, buses. With a low-floor system, planners were concerned that passengers would still attempt to flag down
buses between stations in an attempt to board; with level-boarding from highplatform stations, passengers would instinctively understand the need to board
vehicles at stations. Such concerns, though they may seem anachronistic today,
were well-founded, as TransMilenio was preceded by a busway in which many
of these problems emerged.
Phase III of TransMilenio expansion, which was launched in November,
2006, will include the development of an underground “Central Station” at a
point in which principal corridors meet up. This station will feature tunnel access
from the different corridors (grade separation) and a massive “Transit-Oriented
Development” project built on top of the station.
Vehicles. The mainline network of TransMilenio is operated entirely by specially-designed high-floored level-boarding articulated buses. The choice of these
buses followed an economic analysis which
compared capital, operating, and maintenance costs, as well as
capacity, of such buses
with the biarticulated
buses used in Curitiba
and other Brazilian cities. This analysis purportedly demonstrated
that articulated buses
would be sufficient to
meet capacity needs at
Figure 3.12
“Bridge” section
connecting two
modules of a
TransMilenio
station. Separated
modules allow for
buses to align
themselves to
station platforms
for level boarding.
Figure 3.13
Underground
walkway leading to
station. Since most
TransMilenio stations
are located in the
medians of major
arterials, gradeseparated crossways
are required to
handle the sheer
volume of pedestrian
movements, which
would otherwise
severely impact road
operations.
ADVANCED NETWORK PLANNING FOR BUS RAPID TRANSIT · 23
an overall lower cost than biarticulated vehicles, at least for quite a number of
years. Should demand continue to rise in the busiest corridor, even with the
opening in Phase III of a parallel corridor, then the issue of biarticulated vehicles
may be reviewed anew.
Intelligent Transportation Systems. ITS systems play an important role in the
management of the TransMilenio system. While traffic signals at intersections
along trunk corridors have optimized timing for signal progression, the sheer
volume and frequency of buses preclude the use of signal priority with any degree of effectiveness.
Fare Collection. TransMilenio relies on fare prepayment, using contact-less
smartcard technology, in order to simplify fare collection and speed boardings at
stations. All stations feature barriers and require payment prior to entry.
Service Patterns. The service plan for TransMilenio is one of its outstanding
features and indeed represents arguably the greatest innovation in the service.
The service plan has permitted some corridors on the TransMilenio system to
move passenger loads normally thought of as the exclusive domain of heavy rail
systems, and several times more than is observed in the most heavily utilized
light rail systems in North America.
The service plan for Bogotá was initially inspired by that of Curitiba. Curitiba’s RIT (Integrated Transport Network as rendered in Portuguese) system
featured BRT corridors which operated only all-stop service (essentially, the
Light Rail Lite model) using bi-articulated buses stopping at stations generally
spaced every 500 meters. At
varying distances, generally 3-5
km., major transfer facilities,
known as Integration Terminals (Figure 3.15), were located.
The BRT network operated in
five radial corridors, supplemented by a network of Speedy
buses (the ligeirinhos) which
connected the Integration Terminals with a generally nonstop service operating in mixed traffic (much of it along a network of one-way
express roads); major trip generators off-corridor were also served by the Speedy
network which, like the BRT lines, used modular “boarding tubes” for stations.
As the system further developed, Speedy routes were extended to additional
places, tying in certain neighborhoods into the “rapid” component of the rapid
transit system.
According to TransMilenio planners, the initial concept for Bogotá was to
largely import the Curitiba service plan and apply it to Bogotá. However, planners reached a major hurdle in that sufficient land did not exist for integration
terminals in Bogotá, or, more to the point, creating such terminals at an appropriate scale would have required excessive rebuilding of the major throughroads within which TransMilenio busways were built (unlike Curitiba, which
generally relied on a “trinary” road system for its major corridors, pushing major
Figure 3.14
TransMilenio bus.
The use of levelboarding high-floor
buses precludes
boarding between
stations—a strategic
decision that was
successful in shaping
passenger behavior.
ADVANCED NETWORK PLANNING FOR BUS RAPID TRANSIT · 24
traffic flows to two “outer” roads, Bogotá’s busways were located within the major traffic arterials), at tremendous expense and disruption. As a result, planners
were forced to consider how else to provide an express network in the absence of
major transfer facilities.
The breakthrough in
planning seems to have occurred when it became obvious that demand for service
would be enough to support
express services connecting
different groups of stations.
An extensive origin/destination survey along the key corridors was conducted, and
the result of this exercise was
the identification not of a single set of parallel express
routes, but of a network of
express routes, each linking a
group of stations that the
O/D analysis had identified
as generating sufficient demand for such services.
The power of this express network becomes apparent when one considers
that both all-stops and express services were devised that “turn the corner” from
one corridor to another, permitting travel along different corridors without the
need for transfer.
In the network map (Figure 3.16) representing the system as it was approximately 3-4 years into service, it becomes obvious that between any two stations,
there may be multiple options for making the trip. As an example, for travel between the Calle 57 station on Avenida Caracas and the Escuela Militar station on
Calle 80, one could ride the No. 1 All-stops, stopping at five intervening stations
(but avoiding a transfer at Calle 76), or one could ride the Express No. 40, making
only one intervening stop (and also avoiding a transfer). For travel between the
Tercer Milenio station along Avenida Caracas and Minuto de Dios along Calle 80,
it’s more complicated; one may take the No.1 and make 20 intervening stops, or
one can take the Express No. 30 five stops to Calle 72, then transfer to the Express
No. 20 for a nonstop run to Minuto de Dios.
This combination of express and local services, some branching, was the key
to providing the capacity required within the limitations of the infrastructure.
According to planners, origin/destination data is collected and reviewed three
times a year, and express routes adjusted, based on observed demand among
different groups of stations.
Figure 3.15
“Integration
Terminal” or
transfer center in
Curitiba. These
terminals typically
cover an entire city
block and feature
extensive
passenger facilities
for BRT and local
buses in addition
to a range of retail
shops.
ADVANCED NETWORK PLANNING FOR BUS RAPID TRANSIT · 25
Figure 3.16
Yet even this attention to moving passengers off all-stops service and
TransMilenio
onto express services was still insufficient to meet increasing passenger demand.
network map ca.
2003, announcing
As a result, a Super-Express service was initiated, providing a one-way service in
“new map, new
the peak direction during the peak hours (and in one case, all-day). These routes
services.” All-stop
are designed to transport people from the terminal stations to the central em- routes are indicated
by colored lines,
ployment corridor along Avenida Caracas in the heart of the city, a primary deswhereas express
tination for most passengers, without stopping at any intervening stations. In routes are implied by
order to free up capacity for people boarding at non-terminal stations (within the alternative gray lines.
actual corridors), some Express routes were redesigned so that they begin or end
not at the terminal station but at the penultimate station (and hence do not fill up
immediately), channeling passengers at the terminal stations thereby onto the
more efficient Super Express routes.
As of the most recent major route restructuring (April 2006), the total number
of Express and Super-Express routes was 55, of which 26 are symmetrical (twoway operation) and 29 asymmetrical (generally, one-way service).
Though the TransMilenio system is designed to reduce the need for transfers,
planners estimate that up to 50% of TransMilenio’s riders use feeder buses to access the system, with 60% of all riders boarding at one of the terminal (portal)
stations. Though on the one hand this illustrates the limitations of a system that
by itself does not reach into the far suburbs where large numbers of lowerincome households are located, it also illustrates a fact of the system that is
commonly repeated among not just local planners but people “on the street” in
ADVANCED NETWORK PLANNING FOR BUS RAPID TRANSIT · 26
Bogotá: TransMilenio has improved access to better-paying jobs for lower income residents of the city’s periphery.
Approximately 70% of all demand is generated by the central section of the
city (where much employment is concentrated), namely the Avenida Caracas
corridor between Calle 100 and Tercer Milenio. Even with the extensive network of
express and branching services, about 28% of all trips on TransMilenio involve a
transfer.20
Identity and Branding. TransMilenio employs a distinct logo which is used on
promotional materials, buses, and stations, though in common practice, the red
TransMilenio vehicles stand out and are visually distinct from
other buses (the green feeder buses less so). Of greater interest, the
author, in his two visits to Bogotá and in discussions with Bogotanos both within and outside Colombia, has never heard anyone
refer to TransMilenio as “the bus”; it was always referred to as the
TransMilenio.
It is worth noting that, in contrast to both the Ottawa and Brisbane models, the TransMilenio identity, which certainly applies to
stations, is mostly visible as relates to vehicles. This is a stronger
possibility with internalized systems. It is also worth noting that,
even though significant right-of-way is devoted to TransMilenio,
that right-of-way is not itself the focus of specific brand-related
imagery or identity, perhaps in great part because it is generally
located within existing roadways.
Figure 3.17
Following the
completion of Phase
II of TransMilenio
expansion in 2006,
multiple corridors are
now in operation. The
service map, though,
is unable to illustrate
the routes operating
on the infrastructure,
such is the current
complexity of the
system.
Figure 3.18
TransMilenio pylon at
Calle 19 station.
ADVANCED NETWORK PLANNING FOR BUS RAPID TRANSIT · 27
3.2.3
TransMilenio and the Quickway Model
In the introduction to this report, it was suggested that BRT systems were outgrowths of one of two distinct visions or core strategies: a “Quickway” model
that emphasized the development of infrastructure in order to support a network
of services, and a “Light Rail Lite” model that emphasized the emulation of a
light rail-like service using buses (one would guess, primarily, on cost grounds).
While Bogotá clearly has elements of both—its implementation of a core “Light
Rail Lite” service ranks among the most successful and copied examples of its
kind (for example, Indonesia’s TransJakarta busways are based almost entirely
on this aspect of the Bogotá system, as are the BRT systems implemented in Mexico City and the Mexican city of Leon)—it will be argued here that Bogotá’s implementation of Quickway concepts is at least as important to the success of the
system and its ability to move passenger volumes normally seen only on the
busiest metro systems. In fact, TransMilenio “backed into” a Quickway model as
it was forced to deal with meeting capacity targets far in excess of anything that
the Light Rail Lite (or, for that matter, LRT) model could achieve.
Bogotá has devoted considerable resources to developing the T-Way and
Quickway infrastructure of TransMilenio. While grade separation is generally a
function of the arterial on which it operates (for example, the Autopista Norte
enjoys full grade separation, whereas some other corridors have only infrequent
at-grade crossings), some grade separation is being built, at considerable expense, in the core of the system (to create a Central Station) and at certain major
intersections. More to the point, Bogotá has attempted to mitigate where feasible
the lack of complete grade separation through strategies that minimize dwell
times, optimize traffic signals, and by providing passing lanes either along the
length of the busway or at least by stations, in addition to designing modular
stations that permit at least some segment of buses to enter and leave their platforms directly.
On the service end, Bogotá has realized that express overlays are the key to
moving large volumes of people. Whereas the T-Ways of Curitiba are limited to
moving approximately 12-13,000 passengers an hour in the peak direction at the
peak location, Bogotá is routinely moving well over 40,000 passengers. The key
not just to moving these passenger flows, but doing so economically, is an express network that permits vehicles to produce more round trips per service
hour through shorter end-to-end travel times. Since service planning follows
demand, it also follows that routes will turn from one corridor onto another,
without forcing the transfer, if demand warrants.
Bogotá represents the implementation of Quickway concepts within an internalized system and may justifiably be considered an example of Global Best Practice; of equal importance, and the subject of the next section, is an example of an
externalized system: Brisbane’s Busway system.
ADVANCED NETWORK PLANNING FOR BUS RAPID TRANSIT · 28
3.3
Brisbane, Queensland, Australia: Busway
Brisbane is the capital of the Australian state of Queensland and is the home of
approximately 1.6 million residents in a metro area of approximately 2.25 million
residents. It is the fastest growing region in Australia, with an expanding economy and major investments underway in preparing the region to be more globally competitive in the future.21
One of the central features of Brisbane’s current growth is its development of
a network of grade-separated Quickways, known simply as the Busway. In its
development of its Quickways, Brisbane demonstrates the predominance of the
infrastructure-oriented strategy over the service-oriented strategy for BRT development—namely, that it was concerned first and foremost with creating an infrastructure that could then be used in ways partially unforeseen, as opposed to the
service-oriented strategy which assumes the development of a particular route, and then seeks how
to best “right size” the investment
needed to produce that route.
Brisbane has been served for
many decades by a legacy electrified commuter rail system. This
system is configured in some respects more like light rail, in that
stations are relatively closely
spaced (perhaps every mile). The
State, through Queensland Railroads, operates this Citytrain
network, with a well-established
institutional and bureaucratic
structure. Four corridors radiate
out of the CBD, which then split
into seven primary corridors.
Absolute data on system ridership is hard to obtain, as it is not
available publicly, but anecdotal
evidence suggests that the system
is well-used, particularly by
commuters to downtown employment as well as those going to other activities. Still, Brisbane transit planners
Figure 3.19
noted that, while the trains seemed to serve the areas surrounding stations fairly
Brisbane’s Citytrain
well, they were struggling to attract a larger set of riders from zones between rail
operates an
lines. They also noted that the size of these “wedges” grew as one left down- extensive electrified
commuter rail service
town, with large areas of the city essentially without effective (or timethat runs through a
competitive) access to the rail system. They further noted that, though the rail subway in the central
core.
system enjoyed full grade separation through the core of Brisbane (operating
mostly through a subway in the CBD and the adjacent urban neighborhood of
ADVANCED NETWORK PLANNING FOR BUS RAPID TRANSIT · 29
Fortitude Valley), stations were not
necessarily within comfortable walking distance (during Brisbane’s tropical summers, even short walks can be
taxing) of many of the job sites.
The inspiration for the Busway
system is largely credited to former
Lord Mayor Jim Soorley, who apparently was looking for means to help
transform Brisbane from a somewhat
sleepy and unsophisticated town into
a truly competitive city. A private bus
operator who had toured Ottawa’s
Transitway system shared his observations of the efficiencies of that system with the Lord Mayor, who saw in
the concept something that could be
implemented in a relatively short
time (as opposed to working through
the State bureaucracy) and that would
accomplish his goal of providing
more and better transit (Brisbane area
planners note that the goal was always expressed in terms of transit,
not in terms of any particular mode).
Though initial planning for the
Brisbane busway network (it was
conceived from the beginning as an
infrastructure network comprised of
Figure 3.20
four initial Quickways, with future expansion possibilities) was directly influThe original plan for
enced by Ottawa’s Transitways—the people who had been involved in developBrisbane’s Busway
system was
ing Ottawa’s system did the original planning on the Brisbane system—these
developed in the
plans began to change and evolve as they were applied to Brisbane’s specific 1990s. Subsequent
context.
planning led to the
There were a number of key differences between Brisbane and Ottawa addition of a western
spur to the Eastern
which began to influence Quickway planning in Brisbane:
Busway crossing the
1. In Ottawa, the Transitways are the regional rapid transit system; in Bris- river the University of
bane, that role was played by the Citytrain network. The new busways Queensland Campus.
The first Busway, the
would need to position themselves as competitive with—or even supe- Southeast, was built
from the core just
rior to—that network if they were to overcome any stigma from being
past Garden City,
bus-based.22
with an off-Busway
2. Brisbane already had an underground bus station built beneath the
station in
Springwood.
Queen Street pedestrian mall, the “heart” of the city; this infrastructure
meant that busway services feeding the CBD could enjoy some degree of
grade separation, as well as staging areas, in the heart of the CBD.
ADVANCED NETWORK PLANNING FOR BUS RAPID TRANSIT · 30
3. Ottawa had a fairly strong land planning regimen compared to Brisbane.
Notions of closer transit/land use coordination had apparently been
floated in Brisbane in the mid-90s, but attracted little political support.
This paradoxically favored a Quickway-based approach to Brisbane’s
transport network: if it wasn’t feasible to bring more people to transit infrastructure (via transit-oriented development), then a Quickway network made it easier to bring transit out to the zones where people already were.
Brisbane had also, prior to the development of the first Busway, developed a
“two-tiered” bus network. The first tier was made up of traditional city bus service, with routes that generally extended as far as 10 km (6 miles) from the center. Transit planners recognized, however, that beyond this distance, this model
of bus service generally broke down: land uses didn’t favor close bus stop spacing, and excessive travel times along routes meant that few commuters were attracted to these routes from beyond the 10 km range.
Planners at first considered increasing bus stop spacing within the urbanized
area (that is, the area within about 10 km of the city center), but realized the difficulty involved in removing bus stops that people had come to rely on (anyone
who has attempted to remove bus stops and then dealt with public backlash will
be familiar with the problem). The solution was to overlay a new kind of service,
CityXpress, which was built around a service standard that called for bus stops
in the periphery to be widely
spaced (800-1000 km, or 0.50.6 miles); within the urbanized area, buses would stop
only at selected bus stops
spaced approximately every 2
km (about every mile and a
half). CityXpress was generally an all-day service;
“Rockets” were developed as
a peak-only service that
would serve the same outerarea stops as CityXpress, but
would then travel directly
into the CBD.
The first of the Busways
to be built was the Southeast
Busway, which traversed four
principal zones of the city:
• The Southbank district (Figure 3.21), which, following the development
of the extensive Southbank Parklands, was emerging as a major urban
neighborhood and regional recreational draw;
• The Mater Hill hospital district;
• The Woolloongabba cricket grounds (and surrounding zone); and
Figure 3.21
The emerging
Southbank district,
with the Southbank
Parklands and
Brisbane River, is
now served by both
rail and Busway
stations.
ADVANCED NETWORK PLANNING FOR BUS RAPID TRANSIT · 31
•
The Southeast Motorway corridor, a mostly residential zone but with major educational and shopping facilities located along its length.
When the Southeast Busway was first under development, the service plan
emphasized spine (all-stops) service, with various express and branching services mostly at the peak hour. Though such a plan was undoubtedly the most
efficient use of bus resources, Brisbane planners opted for a more extensive plan,
essentially rerouting existing CityXpress services so that they operated on the
Busway. As one planner explained,23
We took the view that the CityXpress services were full when they
arrived at the Busway—so if you have a full bus, why on earth
would you ask people to transfer to a new bus that does the same
journey you’d otherwise do?
The performance of the Southeast Busway has exceeded even optimistic projections. Corridor ridership has gone up 124% overall since the opening of the facility, with even more impressive gains on Sunday (215%) and Saturday (176%),
and the economic performance has been equally strong; planners believe that it
exceeds 90% farebox recovery on the “premium” network (made up of CityXpress; “BUZ” routes, which are described below; and Rockets). Some routes are
believed to generate a profit, which is then used to cross-subsidize the system
(which include school services and relatively poorly performing “community
routes”).
One difficulty in identifying the actual cost performance of the system is the
Byzantine funding structure employed by the State of Queensland. Funding for
City bus services comes from TransLink, an arm of the State Government, but
costs and revenues are functionally split. When the City of Brisbane wishes to
implement a new set of services, for example, that together cost $14 million a
year to operate, it must request from TransLink the entire (gross) cost of providing those services. Farebox revenues are returned to TransLink, but through a
separate channel, divorced from the original funding request. This structure
makes it difficult for both the City and the State to readily and systematically
understand the cost effectiveness of individual routes and make adjustments accordingly; it may also limit the amount of new services developed, even if such
services could actually produce an operating profit.
A related issue is the limited availability of new buses. Again, bus purchases
are funded through a separate process, so rising demand for new services—
which might otherwise convince state officials that investment in additional new
buses is warranted—may not necessarily get acted upon in the fastest light. Officials from Brisbane were known to have been scouring Australia for additional
buses; in the end, the State Government agreed to expand the capacity of the bus
assembly plant in the state to help meet the demand for new vehicles.24
The opening of the Southeast Busway was notable in that it helped turn
around what had been declining transit ridership in Brisbane; in the year before
it opened, annual ridership had declined by 800,000 fares; after its first year of
operations, annual regional ridership had climbed by 866,556, erasing the previ-
ADVANCED NETWORK PLANNING FOR BUS RAPID TRANSIT · 32
ous year’s loss.25 In the past three years, overall transit ridership city-wide has
climbed between 30-40%, depending on the source cited, with annual growth
rates ranging from 10-12%. Peak ridership on the Southeast Busway (peak
hour/peak direction) is now reported at over 15,000 passengers, which is approximately 50% above the highest confirmable ridership observed on any light
rail line in North America and close to the ridership on the busiest metro line in
Washington, D.C.
Brisbane opened the Inner Northern Busway to service in 2006 and the Green
Bridge (later renamed the Eleanor Schonell Bridge) in 2007. This bridge, which
spans the Brisbane River, connects the University of Queensland main campus
with what will be the Boggo Road Busway, a short extension of the planned Eastern Busway, branching off from the Southeast Busway just north of the Buranda
station. An Inner Northern Connector, linking the Queen Street underground
bus station with the Inner Northern Busway via the Roma Street Transportation
Terminal, is under construction and should open for revenue service in 2008; the
Boggo Road Busway between the
Southeast Busway and the Green
Bridge has been fast-tracked and
should open by 2009, and preferred plans have been published
for the Eastern and Northern
Busways.
It is of especial interest that,
as the magnitude of the success of
the Busway system is more fully
appreciated, planning on the new
Busways has moved in a new direction. When the Eastern and
Northern Busways were given
the green light to go into project
development in 2002, they were
roughly budgeted at $400 million
Australian for both projects;26 the
Figure 3.22
latest plans, which have emerged as the preferred alternatives, are pegged at sevA section of the Inner
eral times that amount, if not more. Design compromises that otherwise might
Northern Busway
running through a
have been made (for example, serious consideration was given to operating
golf course. The
much of the Eastern Busway as a surface T-Way) have been jettisoned in favor of
screen structure is
plans that rely extensively on tunneling to produce high-speed Quickways capa- designed to prevent
ble of significantly reducing transit travel times in their respective corridors, in errant golf balls from
interfering with bus
addition to supporting a larger share of “transit-oriented development.”
operations.
ADVANCED NETWORK PLANNING FOR BUS RAPID TRANSIT · 33
3.3.1
Brisbane’s Busways:
Strategic Elements
Brisbane is, along with Ottawa, the classic example of
the Quickway model in operation. More so than Ottawa,
it has developed, and continues to develop, grade separated infrastructure in the
central business district, and
hence will serve as the most
advanced example of this
model for the foreseeable future.
Running Ways. At the
heart of the Brisbane system
are its Quickways, which opFigure 3.23
erate fully grade-separated along their lengths. Currently, however, there is a
T-Way
by entrance
gap between the terminus of the Southeast Busway at Melbourne Street in South
(off to left) to
Brisbane and the beginning of the Queen Street bus tunnel just east of William
Southeast Busway.
Street. Connecting the two is a T-Way section with one Busway station—the CulFigure 3.24
tural Center Station. Brisbane planners have discussed the possibility of replacTunnel
segment
ing the current T-Way with a Quickway linkage, sending a bus-only bridge over
along the Southeast
the Brisbane River and building a new station at the Cultural Center to enable Busway. Planned new
busways will rely
full grade-separation. To date, though, this plan has yet to be formally adopted
heavily on tunneling
or funded. Also, a modest middle segment of the proposed Eastern Busway is
to create full gradecurrently designated as a T-Way; even so, pedestrian crossings will be made in
separation.
an overhead structure to
minimize conflicts and maximize bus through-speeds.
Brisbane’s Busways all
are two lane roads with pulloff lanes at stations. They are
designed to support 80 kph
(50 mph) travel speeds,
though there are reports that
bus drivers have been able to
exceed these speeds at certain
points. The Southeast Busway, which runs for 16 km
(10 miles), features approximately 1.6 km (1 mile) of underground sections (both
bored and cut & cover tunnels) and about 2 km (1.25
ADVANCED NETWORK PLANNING FOR BUS RAPID TRANSIT · 34
miles) of elevated or bridge sections. Travel time by express bus from the farthest
station to the CBD is reported to be 18 minutes; travel by auto from the adjacent
freeway is said to be about 40 minutes during the AM peak.
Though Brisbane has designed its Busways so that they could be converted to
light rail should demand warrant, in practice the geometry of the busways is
such that light rail would not be able operate at the same speed as the buses.
The Preferred Plan for the Eastern Busway calls for a facility that, at its western end (where it approaches and meets the Southeast Busway), is almost completely underground for the final 2-3 km. Though the cost of the entire Busway
clearly exceeds the budget that had been allocated for it, analysis suggested that
components of the facility would not be required until beyond the 20 year planning horizon that guides investments; in other words, rather than building the
entire facility within the established budget (and needing to make major design
compromises along the way), planners have instead suggested a staging plan in
which different segments are constructed when warranted (Figure 3.25).
Brisbane’s Busways are also used by emergency vehicles; it is not uncommon
to see police or ambulances take advantage of the right-or-way when necessary.
Busway planning stresses locating facilities so that emergency service facilities
(for example, hospitals) are directly connected.
Given the tight tolerances to which the Busways are built—there are stretches
with relatively narrow lanes and minimal shoulders—only professional drivers
are allowed to operate on the facility, and then they must be specifically trained
in using the Busway. Brisbane planners therefore report an unusually high reliability record, which is especially enviable given the number and length of tunnel segments in the system.
Figure 3.25
The staging plan for
the Eastern Busway
reflects the fact that
not all pieces of infrastructure need to be
built at once or even
contiguously in order
to provide effective
Quickway-style
service. In the case
above, the target
dates for segment
completion reflect
when such segments
are fully warranted. In
some cases, interim
measures, such as
at-grade bus lanes,
can provide sufficient
capacity and
reliability for a number of years.
ADVANCED NETWORK PLANNING FOR BUS RAPID TRANSIT · 35
Stations. Sations are the most visible element of Brisbane’s Busways, and are
considered by planners as critical to the system’s success. Typical stations feature
linear platforms with four bus bays; platforms are generally 5 meters (16.4 feet)
deep and 55 meters (181 feet) long, are screened on the sides and covered on top
(Figure 3.26). High quality materials are in evidence throughout, as well as a
high standard of design; Brisbane planners are proud to point to design details,
such as flush bolts and recessed lighting, that add to the feeling of being a “first
class” “rapid transit” station. Indeed, planners report that the overriding design
goal was that of being perceived, not as a bus stop, but as a rapid transit station.
Figure 3.26
Typical station
platform along
Southeast Busway.
Figure 3.27
Original (left) and
rebuilt (right) Cultural
Center Station. In
addition to providing
passing lanes, the
rebuilt station
features improved
platforms and
shelters.
ADVANCED NETWORK PLANNING FOR BUS RAPID TRANSIT · 36
Most buses that enter stations
stop at the lead stop, but when bus
traffic is heavy, they may stop at any
of the stops along the platforms. In
practice, this likely induces at least
some measure of rider anxiety (it did
with the author), as riders seek to determine where they need to be to
catch and board their desired bus.
All stations along the Busways
feature through lanes for express
buses. When the system first opened,
the Cultural Center station—which
technically is not on one of Busways,
but which links the Southeast Busway
with the CBD—was built with a single lane in each direction, which had been expected to be sufficient over a multiFigure 3.28
Elevated
walkway
year time horizon; however, demand for transit services was so strong that the
over Cultural Center
station became a choke point in the system (figure 3.27). Within five years of
Station, connecting
the Cultural Center
opening, the station needed to be rebuilt, colonizing right-of-way that had been
with the Brisbane
previously reserved for a companion light rail (in streetcar mode) line that had
Museum and Science
been planned to connect the West End with the CBD and Fortitude Valley (this Center. The elevators
and walkway also
line has recently been authorized to begin development, though it is unclear how
serve an
it will share right-of-way with the T-Way along Melbourne Street).
underground parking
0.6
Platform
3.0 – 5.0
Stopping
Lane
3.0
Through Quickway Through
Median
Lane
Lane
1.6
3.5
3.5
Stopping
Lane
3.0
garage.
Platform
3.0 - 5.0
0.6
(eg min. offset
to public
carriageway)
(eg min. offset
to public
carriageway)
TYPICAL CROSS-SECTION
Overhead or underground
footpath access to platforms
15m
Taper
20m
55m Desirable
20m
21m
Taper
Platform & Shelter
Median with fence
Platform & Shelter
21m
Taper
3m min.
20m
55m Desirable
20m
15m
Taper
Figure 3.29
Typical Busway
station schematic,
showing approximate
dimensions of the
station (except for
the stair/elevator
towers) in meters.
ADVANCED NETWORK PLANNING FOR BUS RAPID TRANSIT · 37
The Cultural Center station also serves as an important “lynch pin” of the system; two-thirds of all buses in
Brisbane pass through there,
and it has become an important transfer site. The station
also represents an especially
fine example of transit/land
use integration; a wide elevated walkway connects the
station with the Brisbane Museum, Brisbane Science Center, and State Library on the
north, and the Brisbane Cultural Center and Southbank
parklands on the south (figure 3.28).
Stations are barrier-free, and are monitored by closed-circuit video cameras.
Stations along most of the Busways feature a standard “corporate” architecture to give a consistent identity to the system (stations along the Inner Northern
Busway, which were planned/designed by a different team than was involved
with the Southeast, Northern, and Eastern Busways, are visibly different in architectural treatment). The most striking of the elements are the elevator/stair towers and arched pedestrian bridges found at most stations. For stations to be built
along the Eastern Busway, the decision has been made to maintain the same corporate architecture, but permit variations in the color of materials so as to better
blend into surrounding communities. Attention to station design is especially
justified because, with so much of the proposed running way underground, sta-
Figure 3.30
Standard
architectural
elements of
Brisbane’s Busway
stations are the
stair/elevator towers
and the arched
pedestrian bridges.
These are provided
even where other
structures bridge the
Busway, as can be
seen in this photo.
The deep, covered
platforms also help
give an architectural
identity to stations.
Figure 3.31
The Cultural Center
Station, following its
remake in 2004.
ADVANCED NETWORK PLANNING FOR BUS RAPID TRANSIT · 38
tions become the most visible
component of the Busway.
While the Queen Street
underground bus station was
conceived independently of
and prior to the Busway system, it has nonetheless helped
contribute to the perception
and success of the system by
providing a means for large
numbers of buses to provide
direct connections into a major transit hub in the heart of
the CBD. While the design
standards of this station were
not as advanced as those later
adopted for the Busway system, they still create a different experience than that of waiting for a bus on the street (figure 3.33). The Inner
Northern Busway connector, currently under construction, will link this station
underground with a new station adjacent to the Brisbane City Hall by King
George Square and a retrofitted set of platforms at the Roma Street Train Station,
a major hub for local and interregional train services in South East Queensland.
The new underground bus station at King George Square is designed to service
up to 300 buses an hour during the peak periods. A 32-story office building has
been proposed for a location across the street from this station; the new Busway
station has been cited as a factor in the choice of location for the project.27
Vehicles. Brisbane uses its Busways as a means of deploying its bus fleet efficiently and effectively; it does not as of yet operate specialty vehicles, nor does it
brand vehicles that use the
Busway. Given the level of
demand for Busway services,
consideration is being made
to introducing articulated or
even bi-articulated vehicles
along popular routes; press
reports mention the European
Megabus as the vehicle being
reviewed for introduction.28
Intelligent Transportation
Systems. While the Busways
avoid the need for advanced
traffic signaling systems, the
transit network as a whole
relies on corridors beyond the
Busways, necessitating so-
Figure 3.32
Standard livery bus at
Wooloongabba
Busway station. Note
the live bus arrival
information displays.
Figure 3.33
Queuing lines painted
on floor by a bus bay
at the Queen Street
Bus Station.
Retail shops and fast
food eateries are part
of the complex.
ADVANCED NETWORK PLANNING FOR BUS RAPID TRANSIT · 39
phisticated traffic signaling systems on certain key arterials. The Busway also
uses advanced passenger information systems, with live displays at stations. This
is seen as necessary in a system that operates a plethora of routes at high frequencies, so that passengers know when to begin “staging themselves” to catch
their bus. This is especially important in that system maps are largely not up to
the same level of design and usability as other aspects of the Busway system.
Fare Collection. To date, fare collection is still handled on board buses, though
there has been some experimentation with fare pre-payment.29 Passengers may
purchase a fare from the driver (who makes change), use a multi-day or monthly
pass, or use on-board fare validation for prepaid fare media. There is no question
that the use of on-board fare payment adds to vehicle dwell time, but these losses
are more than adequately offset by time savings elsewhere in the system. Still,
high and increasing demand will likely lead to broader application of various
pre-paid fare schemes.
Service Patterns. As described earlier, Brisbane operates a rich mixture of services that use its Busways.
• Spine, or all-stops services, ply each corridor at relatively high frequencies;
• CityXpress services generally operate off-corridor in an on-street mode,
then enter the Busway at various ramps provided for that purpose along
the length of the Busways. CityXpress vehicles then stop at the first
Busway station they encounter (usually located by the point of entry) to
allow for transfers to the Spine or other services, but then proceed generally non-stop inbound until they reach the “inner core” of stations, bypassing most suburban stops.
• Rockets behave similarly to CityXpress services, except that they leave the
Busway near the Woolloongabba station (which is itself located on a
short spur from the Southeast Busway), enter the Southeast Motorway to
access the CBD more directly, and then travel to the major office buildings on the southeast side of the CBD.
Some CityXpress routes have been split into two as ridership has increased;
along the originating corridor, the original route now only serves the outer stops
before proceeding non-stop to the Busway, while the new route is a shortlined
version, serving only those stops closest to the Busway. As a result, people living
farther out have an even faster journey; and people who live closer in can find
seats (or at least standing room).
The operational flexibility of the Busway has been a key to its success. The
service pattern is seen by planners as deliberately tailoring different services to
different market segments, and the Busway allows them to provide the benefits
of a fixed infrastructure (stable station locations, for example) while permitting
continued evolution and refinement of services. What’s more, it is acknowledged
that the service plan could not have been anticipated when the infrastructure itself
was being planned:30
ADVANCED NETWORK PLANNING FOR BUS RAPID TRANSIT · 40
When busways were first planned, current operating plans couldn’t
have been foreseen… At the time, no one really comprehended what
a busway could deliver.
Key to the increasing ridership on the system is its ability to deliver those elements of service that actually drive mode choice: frequency, speed, and reliability:31
Our experience is that we don’t hear people clamoring to convert
bus service to LRT because of the high frequency we can offer compared to LRT—so in the peak, LRT may offer a higher caliber of ride,
but reliability and frequency score higher than comfort in all the
market research we’ve done here in Brisbane. So we’re offering the
reliability and frequency, which is what really matters when people
make their choices.
Indeed, ridership response to service improvements on the Busway can exceed
the ability of the system to respond quickly enough:32
We get overcrowding and leave people behind, so we get the funding to increase service to every 10 minutes, which attracts more riders, so that in 3 weeks we’re back to the same crowding. In some corridors, we’re up to 1-2 minute service, which people then see.
The City of Brisbane has also responded to increased demand for transit by
identifying a set of core bus routes that together serve the principal corridors in
the City. It then upgraded the frequencies on these routes to “peak frequencies,
all day and into the evening,” with a maximum headway generally of 15 minutes
(some services operate more frequently). It then designated these routes as the
BUZ network—the Brisbane Urban Zone—and produced specialized, “subwaystyle” maps of this network (Figure 3.34). The BUZ network comprises CityXpress, local, and Busway Spine services; though each is a different service, together they make for a specialized network.
ADVANCED NETWORK PLANNING FOR BUS RAPID TRANSIT · 41
Figure 3.34
Brisbane’s BUZ
Network is defined by
relatively high
frequencies all day
and into the mid/late
evening. It includes
“city bus” service
such as the 199;
“spine services” such
as the 333, 444, and
the Southeast
Busway running 111,
and CityXpress
services such as the
130, 150, and 200.
Branding and Identity. Branding and identity are key features of Brisbane’s
Busway system, and reflect the fact that the decision to embrace Quickways was
driven by an infrastructure strategy—namely, that the development of a network
of grade-separated Quickways would permit a range of evolving transit services
to be offered. As a consequence, and unlike most US BRT implementations, the
buses that use the Quickways are not themselves “branded”—they’re just Bris-
ADVANCED NETWORK PLANNING FOR BUS RAPID TRANSIT · 42
bane’s “regular” transit vehicles; it is the infrastructure, and in particular the
stations, that are the focus
of the branding and image
effort. As one local planner
noted, it is hard to brand or
give a special identity to
what is essentially a twolane road (without resorting to specialized running
ways, such as the O-Bahn
guided busway in Adelaide), but stations can
stand out and hence create
an identify for the system.33
3.3.2
Brisbane’s Busways and the Quickway Model
More than any other city, Brisbane has made the Quickway model central to its
growth strategy, and has taken the notion of creating a grade separated infrastructure farther than other comparable cities. Though Ottawa, for example, has
a more extensive Quickway network, and has seen land uses respond over time
to its Transitway, Brisbane is creating grade separation through its CBD, enhancing capacity, reducing travel times, and aiming to attract a higher ridership, or at
least an accelerated growth in per capita ridership.
There are a number of key ways in which Brisbane’s implementation of the
Quickway model differs from Bogotá’s.
1. Brisbane’s is an externalized system; though there are routes that essentially
operate only within the infrastructure (the so-called Spine Service), most routes
travel out of the system to serve other corridors. In fact, as most buses in the system use the Quickway infrastructure at some point in their journey, it makes little sense to brand these vehicles as different or special.
2. Brisbane’s Quickways avoid running in the center of arterials or freeways—at
least, in the central urbanized area. This is a major distinction between the two
systems, and one that represented a deliberate choice for Brisbane planners.
Freeway-based operations posed a number of strategic hazards:
• They would create pressure to open up the facilities to automobiles
(for example, the El Monte Busway in Los Angeles was eventually
opened to carpools), which would then create safety concerns at stations and reduce the reliability of the system (maintaining exceptionally high reliability was seen as key for attracting and retaining transit riders).;
• They would locate stations farther away from actual land uses, forcing potential users to walk longer distances on isolated bridges over
freeways, reducing the attractiveness of the system;
Figure 3.35
Entrance to the Eight
Mile Plains Station at
the southern
terminus of the
Southeast Busway.
The consistent
station architecture,
as well as the scale
of the architectural
elements, conveys a
degree of importance
and centrality to the
Busway system.
ADVANCED NETWORK PLANNING FOR BUS RAPID TRANSIT · 43
•
Additional noise and isolation would make stations less attractive,
and tighter spaces would preclude full stations (with passing lanes
and generous passenger platforms); and
• In the end, it would impose greater costs and engineering challenges
to get transit vehicles in and out of the facility without getting caught
in intervening traffic.
The southern segment of the Southeast Busway was therefore built adjacent
to the Southeast Motorway in mostly unused right-of-way; at key points, it deviates slightly to permit better station integration into major trip generators.
Future Busway alignments—notably, the Northern and Eastern Busways—
are located along major arterials. Current plans call for extensive use of tunneling
(both cut-and-cover and bored tunnels), especially in the inner sections; some
median operations are suggested at the farther ends, with tunnel or bridge sections leading to stations located off-arterial (figure 3.36; unlike “Texas Ts,” these
stations are served by separate connectors at both ends to permit more of a
straight-line movement).
Median
Surface
Segment
Median
Surface
Segment
Tunnel
Segment
Tunnel
Segment
Transition
Segment
Transition
Segment
Open-air, belowgrade, off-corridor
station
3. Brisbane is chasing a different target. In the case of Bogotá, latent demand
for transit services among transit-dependents represented not a goal to be
reached but almost a threat that needed to be accommodated…or else. Crushing
demand forced Bogotá’s service planners to restructure routes and upgrade
planned infrastructure; it also implied an internalized system.34 Demand was
always taken as a given; the planning challenge was how to meet it costeffectively using a fleet of articulated buses.
In Brisbane, the challenge was more about meeting mode share targets,
which forced Brisbane planners to consider a range of design and planning elements in terms of their potential appeal to a largely choice market. Though the
decision to pursue a Quickway strategy was made at the political level for strategic/political reasons, it fell to planners the task of using that infrastructure to
help meet ambitious targets for moving people in and out of Brisbane’s already
dense urban center (figure 3.37; plans for the CBD call for major increases in both
employment and residential density, without expanding the CBD’s footprint).
Figure 3.36
Plans for Brisbane’s
Eastern busway in
the easternmost
section propose
running in the
median of a surface
arterial, but locating
stations off-corridor
to better integrate
with land uses and
provide a better
station environment.
ADVANCED NETWORK PLANNING FOR BUS RAPID TRANSIT · 44
4. Brisbane’s land use environment is
less concentrated. Since, outside of the portal
stations, TransMilenio serves a mostly
walk-up market, close-spaced stations provide dense corridor coverage; in contrast,
Brisbane’s Busways are not within dense
urban arterials, and as an externalized system, rely on branching services to bring
people in from areas beyond surrounding
stations (which average mile spacing outside of the CBD).
5. Brisbane did not, until now, need to
worry about capacity constraints. TransMilenio has focused on systematically reducing bus dwell time through a variety of measures; these are central to achieving capacity goals. No such pressure had existed until now in Brisbane, where
the emphasis has been on run times and frequencies, though such pressures are
now emerging as ridership continues its double-digit growth.
Brisbane demonstrates the power of the Quickway model to produce major and
sustained benefits when implemented fully.
1. By providing or developing grade separation not just on the periphery
but in the core of a region, the benefits of travel time savings are maximized
(both in terms of attracting riders and reducing operating costs).
2. The greater the degree of grade separation, particularly as one moves
into the core, the greater the overall operational savings, as even minor time savings are shared by a larger and larger subset of vehicles. These operational savings allow for increased frequencies or service extensions, that themselves create
the conditions spoken of earlier where service frequency improvements have not
lessened crowding but instead have attracted even more riders.
3. Time savings attract new riders; when those time savings become significant (that is, when potential users see a benefit relative to driving), large-scale
modal shift may occur. The 30-40% increase in total transit ridership observed in
Brisbane in the past three years may be understood in this context.
4. Travel time savings also begin to justify more express services, as the cost
of providing them, and the potential ridership, tend to move in complementary
directions. The result is a virtuous circle.
5. The emphasis placed on station design appears to have paid off in customer acceptance. Brisbane planners report unusually high levels of transfer
within Busway stations, suggesting that customers find the burden of transferring significantly reduced within a station environment (and between relatively
high frequency services). Stations are also the principal means for branding the
infrastructure and creating the kind of “corporate identity” that communicates
the relative importance and centrality of the system for the metro area.
Figure 3.37
Adelaide Street in
Brisbane’s Central
Business District
(CBD). The bus mall
component of this
street will be
replaced by the new
underground Inner
Northern Busway link
under construction,
while service along
the surface will
eventually be taken
up by a streetcar line.
Plans for the CBD call
for a doubling of
employment and
residential densities—
remarkable targets
given the existing
density levels. Major
issues with the plan
include that of
striking the right
balance between
pedestrian facilities
and room for autos.
ADVANCED NETWORK PLANNING FOR BUS RAPID TRANSIT · 45
This page intentionally left blank.
ADVANCED NETWORK PLANNING FOR BUS RAPID TRANSIT · 46
4.
“Light Rail Lite”: Eugene and Los Angeles
Of the four American cities reviewed in this report, two operate what are unabashedly implementations of the Light Rail Lite model of BRT: Eugene, Oregon,
and Los Angeles, California. In one respect, they sit at opposite ends of the scale:
Eugene is perhaps the smallest metro area in the United States to have implemented a “true” BRT project, while Los Angeles forms part of the nation’s second largest metropolitan area. In both cases, BRT thinking began and ended with
the Light Rail Lite model, though the applicability of the Quickway model was
raised unsuccessfully by external planners working on LA’s Orange Line. Both
systems are considered successful at the project level, though questions must be
asked in particular about the success of LA’s program at the strategic level.
4.1
Eugene/Sprinfield, Oregon: EmX (Emerald Express)
4.1.1
Description
Eugene, Oregon, together with its twin city of Springfield, is a small metropolitan area approximately two hours south of Portland; Lane County, where both
cities are located, had just under 325,000 residents in the 2000 census. Its BRT system, currently a single line, opened in early 2007. The system is known as the
Emerald Express, or EmX, which was also the name of the original transit service
first operated by the Lane Transit District.35
EmX was conceived of directly along the lines of the Light Rail Lite model.
The first line of EmX, the Green Line, connects the two major transit hubs of the
region, located respectively in downtown Eugene and downtown Springfield.
This four mile line, serving eight intermediate stations, was built at a capital cost
of $6 million a mile including vehicles; close to 80% of the costs were provided
by the Federal Government.
The Green Line replaced a local bus service that previously operated in the
corridor. EmX relies on a combination of mostly dedicated right-of-way and signal priority to reduce travel time on the corridor from 22 minutes to 16 minutes;
Figure 4.1
Service map of EmX
Green Line.
ADVANCED NETWORK PLANNING FOR BUS RAPID TRANSIT · 47
in addition, some intervening bus stops were removed. This necessarily entailed
extensive work with the community, which was ultimately successful.
Ridership on the new service has increased rapidly. During its first week of
operations, ridership had climbed by 40%; within a few months, it was up 80%,
though some of the increase in ridership may be due to the fact that fares on the
line are now free; fares are not planned to be introduced until 2010. According to
system planners, ridership now reaches 500 passengers an hour at the peak hour,
which is accommodated with a 10 minute frequency produced by only four
buses.
4.1.2
Comparison to the Quickway Model
The Green Line is a model expression of the Light Rail Lite model, in that it
represents the very strengths of that model: producing a rail-like customer experience while adapting to difficult and varied corridor conditions.
Running Ways. The Green Line operates in a combination of on-street, transit
lane, and at-grade T-Way environments. Among the issues dictating the choice of
running way were right of way availability and corridor conditions.
Where T-Ways are provided, they were designed to an unusual standard: as
two “tracks,” separated by a grassy strip, with hard curbs set just 10.5 feet apart.
This design was chosen to highlight the “rail-like” nature of the service and distinguish it from more lanes
of asphalt or concrete. It
has the practical implication, though, of creating
certain operational challenges: driver response to
this unusual guideway
ranges from caution (and
hence
slower
travel
speeds) to behavior that
has been compared to that
of driving in a video game.
There is also one
stretch of the corridor
where only a single two-way lane is available for transit vehicles. While the current service plan is able to effectively mitigate the impacts of a single lane, there
is some concern that future system development, if met with strong ridership
response, may turn this stretch into a bottleneck.
Figure 4.2
Section of T-Way
running in special
“trackway”. The use
of such trackway is
purely cosmetic: it
establishes that the
EmX is more of a
“like rail” system
than a typical bus.
Note that the
inbound lanes must
deviate around a
mature tree.
Environmental
concerns in Eugene
are paramount.
Source: Graham Carey,
Lane Transit District
ADVANCED NETWORK PLANNING FOR BUS RAPID TRANSIT · 48
Finally, environmental
concerns in Eugene—noted
for its impassioned environmental
community—
make it extremely difficult
to remove mature trees for
any reason (figure 4.2), dictating the need, at times, for
vehicle
guideways
to
“swerve” around trees that
in other cities would have
been removed (and hopefully replaced).
Stations. Stations along
the EmX are attractively
designed and able to support level boarding with the
vehicles. Some are quite
simple, whether others
have more elaborate shelter
structures. Some stations
feature waist-high screens
separating the station from
the bus running way so as
to enhance passenger safety
(figure 4.3); openings are
located to coincide with
doors on the EmX vehicles. Some stations are located curbside, whereas others
are located in the medians, and hence may board passengers either on the right
or left side of the vehicles. Traditional transit buses therefore cannot use some of
the stations along the corridor. Stations do not appear designed for heavy bus
volumes, and bus passing, though possible at certain curbside stations, was not a
design consideration.
Vehicles. The EmX uses a specialty articulated BRT vehicle with doors on both
sides of the vehicle. Though active vehicle guidance is not utilized, drivers are
able to position vehicles so that level boarding at stations is supported. Vehicles
employ a continuously variable transmission to enable smooth acceleration and
deceleration, purportedly increasing passenger comfort.
Intelligent Transportation Systems. EmX depends on a signal priority system to
help maintain system reliability and help reduce travel times. While there were
initial problems with the system, these issues have been resolved.
Fare Collection. Fare collection is at the present not an element of the system,
as fares are not charged. This has helped reduce the risk for new users to “try
out” the system, as well as reduce dwell times and even the risk to passengers of
missing a bus as they attempt to purchase a fare from a fare machine.
Figure 4.3
Simple station along
EmX Green line.
Source: Mark Wells, RTC
of Southern Nevada
Figure 4.4
Major station along
EmX Green line.
Source: Mark Wells, RTC
of Southern Nevada
ADVANCED NETWORK PLANNING FOR BUS RAPID TRANSIT · 49
Service Patterns. The Green Line is the first line of what is planned to be a 60
mile system of lines. Though it was originally hoped to complete the system by
2020, planners currently hope to extend the system an average of two miles a
year, giving a 30 year time horizon for the project.
Each line in the EmX system is conceived of as a light rail-like service replacing existing bus service. At full build-out, six lines are anticipated. At its busiest
point, three lines are expected to operate in one segment of the system.
The service pattern for Eugene/Springfield reflects the conditions unique to
that community:
• sufficient ridership demand for a core or spine service, but insufficient to
support a network of express services; and
• a public constituency interested in light rail, but aware that the community could not afford it; planners describe it in terms of “the community
pretty much wanted light rail, but got ‘like rail’.”
Identity and Branding.
EmX features a strong identity and branding; its logo is
used extensively, buses are
painted with a special livery,
and indeed, are sufficiently
distinct from traditional
buses to alone warrant notice, and T-Way segments
Figure 4.5
Current plans for
Eugene anticipate a
set of radial lines
feeding out of the
region’s two principal
centers and a
circumferential line
linking the outskirts.
Figure 4.6
EmX branded bus on
the Green Line
Source: Mark Wells, RTC
of Southern Nevada.
ADVANCED NETWORK PLANNING FOR BUS RAPID TRANSIT · 50
are configured as trackways, further highlighting the difference between EmX
and local bus services.
4.1.3
Conclusions: Eugene/Springfield’s EmX
Ridership potential was the singular motive behind the selection of the Light Rail
Lite model; or rather, that model was by default the only one to have been considered precisely because existing or potential ridership demand was never as
high enough to support a web of express services (though physical choke points
on the network might necessitate a creative planning response to support even a
Light Rail Lite service). Eugene, therefore, represents the opposite extreme from
Bogotá, which was “forced” into a Quickway model by the sheer need to meet
passenger demand with a bus system operating in a compromised infrastructure,
or Brisbane, which needed to attract a large share of the demand that would be
generated as the city grew. In the case of Eugene, it is the lack of demand, or
rather, the lack of demand for which express services could be cost-effectively
supplied, that drives the appeal of the Light Rail Lite model.
This is not to categorically dismiss the Quickway model as having any potential for a region the size of Eugene/Springfield, but the very real capital costs involved in creating a grade-separated infrastructure would pose a significant challenge for a smaller community that otherwise is not facing even greater expenses
in order to keep its transportation system functioning.36
4.2
Los Angeles: Metro Rapid and the Orange Line
Los Angeles has not just one but two distinct implementations of BRT: Metro
Rapid, a rapid bus network operating on multiple corridors, and the Orange
Line, a T-Way-based BRT route serving the San Fernando Valley. They represent
two different approaches to the Light Rail Lite Model (in fact, they arguably represent its two extremes), as well as illustrate how that model can come to dominate planning even when conditions might otherwise favor the Quickway
model.37
4.2.1
Metro Rapid: Description
Metro Rapid is a network of rapid buses that represent the most minimal implementation of BRT concepts; it is often referred to as “BRT Lite.” The program,
which will eventually feature single routes operating in 28 corridors and covering 450 route miles, had its genesis in the confluence of three currents:
• Planners within the Los Angeles County Metropolitan Transportation
Authority (MTA) had been looking for means to speed bus services
along congested arterials;
• The then-mayor of Los Angeles, along with other local elected officials, had recently traveled to Curitiba to inspect its BRT system at
the instigation of Martha Welborne, a local architect; and
ADVANCED NETWORK PLANNING FOR BUS RAPID TRANSIT · 51
•
The Federal Transit Administration had launched a new and still
loosely-defined BRT program and was looking for city partners.
Metro Rapid was developed and launched within only a six month time window, relatively unheard of for major transit initiatives. Planners decided on several basic principles to guide the development of this “overlay” network of services:
1. Route design—routes were to be kept as simple and straight-line as
possible, in order to facilitate ease of understanding;
2. Transit priority—traffic signal priority measures were to be employed
wherever possible to help buses avoid excessive signal delay;
3. Branding—system branding would be important in order to differentiate the service in the eyes of the public;
4. Frequency—headway-based schedules would be employed, rather
than timetable-based. Service would be operated frequently enough
so that riders could just show up at a station without excessive wait
times or the need to consult a timetable;
5. Boarding—level boarding vehicles would be used, to minimize dwell
times;
6. Stations—special bus stops, highlighting the rapid and frequent nature of the service, would be employed; and
7. Station spacing—bus stops would be widely separated, close to one
mile apart.
The first two routes chosen to demo the project represented two corridor extremes. Wilshire Boulevard is arguably one of the longest, densest urban corridors in the United States; the Metro Red Line subway runs underneath it from
downtown as far as Western Avenue. Wilshire also intersects many of LA’s major north/south arterials, and hence provides a lot of connectivity options.
The other corridor selected, Ventura Boulevard, is bisected by relatively few
major arterials, sitting as it does at the southern end of the San Fernando Valley.
The pilot program proved successful; bus travel times were reduced by about
25% in the corridors, with overall ridership rising by substantial amounts in both
corridors. Though Metro Rapid had not been planned with the intention of raising ridership, this result was welcomed, though it meant that additional buses
needed to be identified and put into service, particularly on the Wilshire corridor.
The success of the Metro Rapid pilot project led to the expansion of that program. Changes in the program were made, though, in keeping with practical and
political concerns.
1. Along the new corridors, certain existing bus stops were designated
as Metro Rapid stops. The cost and difficulty of building dedicated
Metro Rapid bus stops led to this decision.
2. Specialty BRT vehicles, chosen originally for the Orange Line, were
also introduced into the Metro Rapid program.
3. The system was rebranded, with a new color scheme and a new tagline: “Metro Rapid: Fast, Frequent, Fabulous.”
ADVANCED NETWORK PLANNING FOR BUS RAPID TRANSIT · 52
To date 16 lines are operating. One new line was considered unsuccessful
and terminated: Beverly Boulevard. Its failure was attributed to the mismatch
among trip patterns/trip lengths, service frequencies, and the relative competitiveness of traditional bus services. Otherwise, ridership gains across corridors
range from 4-5% up to 40%, with an average of 15-20%. Average speed improvements for all 16 corridors average 26%.
One interesting development in Metro Rapid—one that hearkens to the
Quickway model—
is the recent introduction of a “super
express” service in
the Wilshire corridor. Dubbed “Metro
Express,” this service stops, on average, only every four
or five Metro Rapid
stops. Metro Express
came about because
of issues with overcrowding on Metro
Rapid services in
Figure 4.7
Map showing existing
and planned Metro
Rapid Routes, along
with LA’s rapid transit
(rail and busway)
infrastructure.
Figure 4.8
On board Metro
Rapid. Fast,
frequent…but
fabulous?
ADVANCED NETWORK PLANNING FOR BUS RAPID TRANSIT · 53
that corridor (as Figure 4.8 attests) and the discovery that many people were
making longer trips in that corridor. Planners reasoned that the cost of moving
these people would be cheaper if they could bypass stops and essentially recycle
the buses in less time, in essence making the same discovery that drove service
planning in Bogotá for the TransMilenio system.
4.2.2
The Orange Line: Description
The Orange Line is Los Angeles’s first dedicated BRT T-Way. It roughly parallels
Ventura Boulevard, operating in what had been an abandoned railroad corridor.
It operates primarily as a feeder to the terminal station on the Metro Red Line
subway. While it is often viewed as a success on many levels (ridership has significantly exceeded projections, and the system’s modest capital costs compared
to light rail has given more legitimacy to BRT as an effective mode in Los Angeles), it may also be understood as a lesson in opportunities lost as well as the role
of vision and strategy in devising effective regional transportation solutions.
The Orange Line is a 14 mile route that opened for service in October of 2005.
By August of 2007, daily ridership averaged 23,814 passengers,38 significantly
exceeding the far-more-expensive Gold Line light rail and attracting a ridership
that had been projected for fifteen years after project opening.
The Orange Line was built in an abandoned rail right-of-way that had long
been recognized for its potential utility as a transit corridor. Virtually every
mode of rapid transit had been considered for this corridor since the 1970s, including light rail, heavy rail, DMU, and monorail. When a public referendum
halted funding for the subway program, light rail was seriously explored for the
corridor, but opponents of the project succeeded in passing a state law prohibiting anything other than a deep bore subway from being built, essentially creating
an untenable situation.
When Bus Rapid Transit emerged at the political level as an option for Los
Angeles, it was proposed again for the corridor. In this case, leadership and conceptualization came from the political side, and state funding was quickly obtained for building a BRT line. The funding determined the project, and the political desire to develop something quickly and expeditiously strongly favored a
single-route, Light Rail Lite model for the corridor. Though consultants involved
in the design of the facility and route were familiar with the Quickway model
and had even suggested it for the corridor (especially given its scalability, the ability of the infrastructure to function effectively at a wide range of passenger demand), both the municipal and regional agencies and political representatives
favored a quick and simple project. As one project consultant put it:
So without a constituency for branching lines, little staff interest,
politicians satisfied they have a line there, and agency hostility, no
one’s pushing for a branch line structure.39
ADVANCED NETWORK PLANNING FOR BUS RAPID TRANSIT · 54
4.2.3
Comparison to the Quickway Model
Though Metro Rapid and the Orange Line are separate projects, they will be
treated here together in comparison to the Quickway Model, as they reflect many
of the same planning assumptions.
Running Ways. Metro Rapid operates along major arterials in Los Angeles,
many of which experience congestion during all or most of the day. It derives its
time benefits primarily through the combination of distant station spacing and
traffic signal priority measures. Together, these deliver major travel time benefits
relative to traditional bus service, but the service is not time competitive with the
subway, for example.
The Orange Line, in contrast, is a dedicated T-Way with no traffic queuing.
It, too, relies on traffic signal priority measures at intersections, though planners
have suggested that these measures are less effective here than along many
Metro Rapid routes (though fewer major arterials cross the Orange Line, the ones
that do carry major traffic flows and are less amenable to major changes in cycle
timing).
Why was the Orange Line designed as a T-Way and not as a Quickway? In
the long history of transit planning for the corridor, different modal alternatives
were considered, each with its champions or detractors. When finally a BRT solution was suggested, it was seen as being relatively simple to implement, relatively low-impact, and feasible. An appropriation was secured from the state
government; according to
planners associated with
project, the Orange Line
was designed to the
budget available. Grade
separation may have been
more cost-effective, but it
would have required a different planning approach
and focus, and most cerFigure 4.9
Buses on the
tainly would have had
Orange Line.
higher up-front costs.
Stations. Metro Rapid employs special stops only along its pilot corridors of
Wilshire and Ventura Boulevards. These stations were designed to be distinct
from regular bus stops; among their distinction is the lack of seats (lean rails are
employed instead), since the high frequency of the system meant that passengers
would not need to wait very long.
Metro Rapid stations feature “Next Bus” displays which, naturally enough,
give the projected arrival time of the next bus based on its actual location. One
issue facing this system, though, is that the current implementation of the technology will not be able to distinguish between a Metro Rapid bus and a Metro
Express bus, leading undoubtedly to some degree of customer confusion and
frustration.
ADVANCED NETWORK PLANNING FOR BUS RAPID TRANSIT · 55
Figure 4.10
Metro Rapid “station”
by the terminus of
the Metro Red Line
subway at Wishire &
Western.
The Orange Line, in contrast, features specialty stations along its length.
While such stations are attractive, their platforms are smaller than those of Brisbane (as should be expected, given the difference in number of bus operations)
and shelter structures are not contiguous. Given the width of the busway corridor, which is attractively landscaped, and the use of at-grade crossings, stations
are only peripherally integrated into surrounding land uses, but many of those
land uses are auto-oriented. Stations feature step-up boarding to low-floor vehicles, but are not level loading as are those in Eugene. Some stations are equipped
with passing lanes, whereas others are not.
Vehicles. The Orange Line employs specialty articulated BRT vehicles, some
of which have been placed into service on Metro Rapid routes (Figure 4.12).
Capacity issues with the Orange Line40 have led the MTA to order new vehicles which exceed the 60 foot length of the existing articulated vehicles, necessitating a special waiver from Caltrans.41 Though the new vehicles are
only five feet longer, they provide
three more rows of seats and a 20%
boost in total passenger capacity
(Figure 4.13).
Intelligent Transportation Systems.
Both Metro Rapid and the Orange
line rely on advanced traffic signal
priority measures, as well as live passenger “next bus” information. Traf-
Figure 4.11
Orange Line bus at
West Hollywood
Station.
Source: Cian Ginty.
ADVANCED NETWORK PLANNING FOR BUS RAPID TRANSIT · 56
fic signal priority measures
in fact represent the major
construction component of
the Metro Rapid program.
Three issues have tested
the limit of current implementations of ITS technologies.
1. Traffic signal priority systems begin to lose effectiveness when bus headways get shorter than three
minutes. This has been observed on the busiest corridors of Metro Rapid, which achieves a peak frequency
of a bus every two minutes.
2. The same systems have less flexibility when dealing with major crossarterials. This has been an issue on the Orange Line, where some intersections
have as many as 18 different signal phases, limiting the range of signal priority
measures and essentially
losing effectiveness at peak
periods when headways dip
below four minutes. As a
result, bus bunching has
been observed at peak hours
on the Orange Line.42
3. As previously noted,
the passenger information
system currently employed
cannot distinguish between
Metro Rapid and Rapid Express buses, leading to potential customer confusion.
Fare Collection. The Orange Line relies on off-board fare collection to minimize dwell times. Fare machines are located at stations. As with Metro rail lines,
the honor system is employed, with roving fare inspectors to ensure compliance.
Metro Rapid buses require on-board fare payment (or use of pre-purchased
passes), identical to city bus services.
Service Patterns. Both Metro Rapid and the Orange Line are built around the
one corridor/one route approach which typifies the Light Rail Lite model. In neither case did ridership patterns (origins to destinations) play a role in service
planning, for one of several reasons.
1. Having multiple routes interlined into one corridor was viewed as
potentially confusing to riders, particularly new riders.
2. For the Orange Line, LA City traffic engineers were concerned that
multiple routes would overwhelm the traffic signal priority system,
triggering a breakdown in automotive flows across the busway.
Figure 4.12
Specialty BRT vehicle
used on both Orange
Line and some Metro
Rapid routes. This
bus is painted in the
Metro Rapid livery.
Figure 4.13
New 65-foot “Metro
Liner” buses for
Metro Orange Line.
ADVANCED NETWORK PLANNING FOR BUS RAPID TRANSIT · 57
3. The goal in both projects was to develop service, not specifically to attract new riders.
The Orange Line, in particular, was the product of a long history of planning
for rapid transit in the corridor in which rail had been the preferred mode. Local
politics placed the corridor in an untenable position: on the one hand, one voterpassed measure blocked the use of certain tax streams to build more rail lines in
Los Angeles; on the other hand, the State Legislature passed a measure which
stipulated that only a subway could be built in the corridor.
When local elected officials pushed for a BRT line in the corridor, a state appropriation was quickly granted ($300 million for two corridors). As one planner
described it, the pot of money designed the corridor. It was not a case of “what’s
the best solution for the corridor, “ it was more “let’s just get something built.”
External planners working on the Orange Line corridor recognized the potential value of the corridor as a Quickway, or even as a T-Way supporting a
modified Quickway service pattern, but these notions were rejected on several
grounds:
• Most people, ranging from agency planning staffs to elected officials,
were not familiar with the practical and operating costs and benefits
of a Brisbane-style network, and hence did not recognize either the
opportunity or the benefits of such an approach;
• Of the many different agencies which are involved in planning, designing, and operating transportation services in the LA area, not all
were involved early enough in the project to participate in the learning phases or to buy into other aspects of the project;
• No constituency emerged that was clamoring for anything other than
a core service along the corridor, again likely because few would
have understood the possibilities or the benefits of alternative approaches; and
• Many elected officials were satisfied that they were getting a line, and
were not themselves as focused on what may have been perceived as
“staff’s job.”
As a consequence, people within the San Fernando Valley that wish to access
their jobs in Los Angeles’s CBD and do so by transit may need to take a city bus
service down to the Orange Line, ride the Orange Line (stopping at every station)
Figure 4.14
Orange Line service
map.
ADVANCED NETWORK PLANNING FOR BUS RAPID TRANSIT · 58
to the end of the line, transfer to the Metro Red Line subway (stopping at every
station), and possibly needing to transfer within the CBD to either a DASH bus
or the Metro Blue Line light rail.
The Orange Line was also clearly designed as a suburban feeder service, with
3,200 free parking spaces provided in five park-and-ride lots, as well as bicycle
and pedestrian access to stations.43
Identity and Branding. Identity and branding were always central to both efforts. Both have branded their services and given them a special identity, and the
Orange Line in particular enjoys the benefits of being branded as a rapid transit
line alongside LA’s major rail lines (the Red, Blue, Green, and Gold). The Orange
Figure 4.15
Los Angeles rapid
transit map
ADVANCED NETWORK PLANNING FOR BUS RAPID TRANSIT · 59
Line shows up on the LA rail rapid transit system map (Figure 4.15), though it is
identified as a “Transitway” line instead of a “rail” line.
With Metro Rapid, the branding of vehicles was key to making the system
stand out from other bus services. As the image in Figure 4.16 suggests, even an
effectively branded on-street bus stop can easily get caught up in the confusion
of “street furniture” that lines the side of many arterials. Though much of the
Metro Rapid fleet is made up of the same kind of buses used in regular service,
the buses operate under a different livery and are easily noticeable.
Figure 4.16
Metro Rapid stop
along Wilshire
Boulevard.
4.2.4
Conclusions: Los Angeles’s Metro Rapid and Orange Line
Transit planning in Los Angeles has had to contend with a difficult political context and a history of “grand projects” (such as the LA Rail Plan that led to the
development of the Red Line subway) that often failed to deliver on their promises, often at greater cost than advertised.44 The frustration or desire to “just do
something” was clearly an impetus for LA to embrace not just BRT, but the Light
Rail Lite model of BRT—it was easy to understand, comparable to rail, relatively
easy to implement, and could always be justified with the reasoning that, if it
proves successful, it can be converted to rail “some day.”
Unfortunately, the LA experience also points to the dangers of transit development without clear strategy or situation-driven goals—transit projects may be
successful as projects, but they produce only marginal benefits that by themselves
do little to advance broader goals. Brisbane’s Busway strategy has been catalytic
in producing a major change in the role that public transport plays in that city (if
the dramatic increase in public transit ridership system-wide is any measure);
Bogotá’s TransMilenio has reshaped much of the city and been part of a measurable and notable improvement in regional quality of life.
Circumstances in LA are forcing transit to begin to innovate beyond the
Light Rail Lite model, however; the recent development of Metro Express as a
skip-stop service overlaid over Metro Rapid is evidence of this, as is renewed
ADVANCED NETWORK PLANNING FOR BUS RAPID TRANSIT · 60
interest in the potential of grade separation for future busways (and possibly
portions of the existing Orange Line) in the San Fernando Valley.45 And LA-area
transit planners may be right that “keeping routes simple” is the key to attracting
and retaining riders, although both Bogotá and Brisbane have managed to
achieve impressive ridership growth with networks that are anything but simple
(in part by operating an easy-to-understand “spine service” in addition to their
more complex express networks).
LA’s interpretation of the Light Rail Lite model should not be rejected out of
hand, however, as it has indeed demonstrated the existence of a market that
would respond to improvements in transit quality of service as well as the effectiveness of measures to speed buses (and hence reduce corridor operating costs);
it has also demonstrated that BRT is indeed a viable mode, even in the supposedly car-worshipping world of Angelinos.
For LA to achieve a phase shift in the role of transit, however, a broad range
of interested parties will need to learn about the experience of cities that have
Figure 4.17
embraced the Quickway model and how they have been able to deploy networks Numan Parada
of the
which better match market demand and the generators of that demand.46 This
LA Transit Coalition
developed this
will be difficult in a city that for many years has thought in terms of grand metro
“Fantasy Map” for
rail schemes, both official and unofficial; several “rail fantasy maps” have reLos Angeles rail
transit.
cently appeared online,47 as LA-area transit advocates attempt to devise the kind
ADVANCED NETWORK PLANNING FOR BUS RAPID TRANSIT · 61
Figure 4.18
of network of rapid transit services that best match their understanding of
Damien Goodman’s
movement patterns in that region. These maps are universally based on the rail “fantasy rail plan” for
LA more closely
model of service, even though LA is hardly configured the way successful rail
follows
its grid street
cities are typically configured; still, each has great merit from the point of view of
network than does
understanding how LA actually works as a city, for at least some of its denizens.
Numan Parada’s
proposal.
ADVANCED NETWORK PLANNING FOR BUS RAPID TRANSIT · 62
5.
Beyond “Light Rail Lite”:
Pittsburgh and Miami
Pittsburgh and Miami together offer the closest American equivalent to the
Quickway model employed internationally. Both cities have developed bus
guideways—in the case of Pittsburgh, three busways that near Quickway standards, in the case of Miami-Dade County, a T-Way—that serve a combination of
service types. Each, however, also must contend with limitations that prevent the
full benefits of the Quickway model from contributing to their respective regions.
5.1
Pittsburgh: Busways
5.1.1
Description
Pittsburgh is the American
city that comes closest to the
Quickway model in terms of
its physical infrastructure
and service plan. Still, the
differences between Pittsburgh and the international
examples are noteworthy,
and help illustrate the challenges of pursuing a Quickway-based model for BRT
development in the United States.
Pittsburgh currently operates three near-Quickways:48
• the South Busway, which when it opened in 1977 was the first dedicated non-freeway based busway to open in the U.S.;
• the Martin Luther King, Jr., East Busway, which opened in 1983; and
• the West Busway (airport link), which opened in 2000.
Table 5.1 provides comparative data on these three busways.49
While all three busways provide grade-separation, design speeds vary; the
South Busway in particular shares a tunnel with light rail trains, necessitating
more cautious operating speeds. Pittsburgh’s 25-mile light rail network is more
extensive than its busways (that is, it’s longer than all busways combined and
serves more stations), and it operates in a subway through the downtown, enhancing travel times as well as the customer experience, but still attracts far
fewer riders.
Figure 5.1
Pittsburgh’s
busway system.
ADVANCED NETWORK PLANNING FOR BUS RAPID TRANSIT · 63
As indicated in Table 5.1, a large
number of bus routes use the three
busways. Both the East and the West
Busways support a spine, or all-stops service that operates exclusively on the facility (except for downtown, where all buses
must operate on surface streets); the
South Busway has no dedicated all-stops
route, but is served by routes that continue beyond the last station to serve destinations beyond the busway. Just over
half of all busway users ride an all-stops
service (the numbers for each busway are
remarkably consistent, and range between 51 and 53%).50
Figure 5.2
In terms of cost performance, the busways in Pittsburgh are reported to be
Pittsburgh’s
highly efficient. Data for the South and East Busways shows an average Opera- South Busway shares
tions and Maintenance cost per rider ranging from $0.95 (the latter) to $1.03 (the part of its right-of-way
with a light rail line.
former), which is less than half that of the rest of the bus system ($2.55 per rider)
and less than a third that of the light rail system ($3.22 per rider).
Facility
Construction
Cost
Year
Opened
Length
(miles)
Stations/
Stops
Routes
Using
Daily
Trips
Travel
Time
Savings
Average
Daily
Ridership
South
Busway
$27 m
1977
4.3
9
16
552
20-30
mins.
11,000
MLK, Jr.,
East
Busway
$115 m
1983
6.8
9+1
34
943
25-34
mins.
East
Busway
extension
$68 m
West
Busway
$258 m
2003
2000
6-15
mins.
2.3
5.0
~ 30,000
6
11
413
20 mins.
9,500
Table 5.1
Pittsburgh’s
busways.
Though Pittsburgh as a metro area is relatively static as far as population is
concerned, the busways have attracted various amounts of development. While
it is difficult to determine how much of that development was because of the
busways, the total amount and scale of development has been impressive. In the
period 1993-1996, some $302 million in development (divided among 54 projects)
occurred within 1500 feet of the Eastern Busway corridor; in the seven years
since, an additional $203 million occurred.51
ADVANCED NETWORK PLANNING FOR BUS RAPID TRANSIT · 64
5.1.2
Comparison to
Quickway Model
the
Pittsburgh’s busways are
clearly successful on many
levels, yet they have not
stimulated much in the way
of interest in copying or
modeling them within the
United States (virtually all
recent BRT projects, even at
the scale of Los Angeles’s
Orange Line, have been
based on an Light Rail Lite
model operating mostly if
not entirely at grade). Pittsburgh area planners concede that buses are seen as
second class compared to
their LRT system, which
Figure 5.3
operates in a subway in the downtown, and communities along the Eastern
Spine services on the
Busway have clamored at times for their busway to be converted to light rail.52
Martin Luther King Jr.
East Busway.
Running Ways. Pittsburgh’s busways are fully grade separated from other
traffic (except for a section of the South Busway that shares a guideway with the
Figure 5.4
light rail); however, busway infrastructure is not carried into and through the
“Station”
on the
downtown; on the east side, the busway terminates at the Pennsylvania Station,
South Busway.
which is at the eastern edge of downtown; on the western end, the West Busway
Stations on more
recently built
currently terminates by the south bank of the Ohio River.
busways feature a
What are the consequences of not continuing dedicated bus infrastructure
higher standard of
into the downtown? Pittsburgh planners have identified bottlenecks that limit
design and shelter.
capacity and add to bus travel
times. However, the light rail system does travel through a downtown subway serving underground
stations (as opposed to on-street
bus stops). The significance of the
impact of surface bus operations in
the downtown can best be illustrated by comparing the PM peak
travel time of the all-stop route EBS
on the MLK, Jr East Busway, as illustrated in the route map (figure
5.3). The travel time required for a
bus to complete a one-way loop in
the downtown section—20 minutes—is identical to the amount of
ADVANCED NETWORK PLANNING FOR BUS RAPID TRANSIT · 65
time it takes to then traverse the
entire busway, stopping at every
station, until the terminus at Swissvale.
Stations. Stations on the original
South Busway were extremely basic
(figure 5.4); later busways feature
improved stations (figure 5.5), but
these are still modest in dimensions, design, and materials compared to Brisbane. All stations rely
on at-grade pedestrian crossings,
unlike in Brisbane, where such
crossings are made using pedestrian bridges, or Bogotá, which relies on elevated structures or underground tunnels outside of the CBD. It would be fair to say that stations on
Figure 5.5
Busway
station on
Pittsburgh’s busway are treated more as enhanced bus stops (some even feature
the Dr. Martin Luther
“bus stop” signs) than as the “rapid transit” stations envisioned for Brisbane.
King, Jr., Eastern
Busway.
Like in Brisbane, stations are not barrier-separated, and fares are paid onboard
vehicles.
Vehicles. Pittsburgh operates its traditional transit fleet through the busways;
like Brisbane, it uses the busways to provide travel time benefits to an existing
bus system, and hasn’t yet seen the need to “upgrade” spine services to larger or
more specialty vehicles (such as that used by Los Angeles for its Orange Line).
Intelligent Transportation Systems. Since Pittsburgh’s busways are grade separated, there has been little need for advanced traffic signaling systems as part of
Figure 5.6
Left,
bus
riders wait
the infrastructure. Live passenger information is not employed, either.
on street in downFare Collection. Like Brisbane, Pittsburgh does not employ any special fare town Pittsburgh (this
location lacked a
collection scheme exclusively for its busways.
Service Patterns. Pittsburgh’s service pattern reflects that of a Quickway infra- shelter); Right, light
rail riders wait in a
structure, with all-stops, branching, and express services all taking advantage of
spacious underthe busway infrastructure. Given Pittsburgh’s unusually difficult topography— ground metro station.
ADVANCED NETWORK PLANNING FOR BUS RAPID TRANSIT · 66
with two large rivers coming together to form a third, and steep hills and valleys,
places that may seem close on a map may be far apart in practice—it may be that
the busway infrastructure, however useful, is still insufficient to provide adequate connectivity to the metro area. More to the point, Pittsburgh’s route structure has changed only modestly over time, and more aggressive proposals to
improve on that route structure—for example, through larger reliance on interlining—have largely been rejected. A recent budget crisis has led to some reduction in transit services, affecting especially a number of lower-ridership express
routes.
Identity and Branding. Pittsburgh has done relatively little to create a busway
brand or focus strategically on creating a specific system image. The busways
when first conceived and as originally developed were seen in very practical
terms—they were designed to reduce bus travel times, and at this they succeeded remarkably. But little if any thought went into viewing or positioning
them as a distinct brand or mode of service. Stations are still indicated with regular “Bus Stop” signs, and were hardly conceived of as rapid transit stations on
the level of a light rail station (or beyond).
5.1.3
Conclusions: Pittsburgh’s Busways
Pittsburgh’s busway system is without question the closest to a global
Quickway model in the United States.
That it has not had more of an impact
in promoting this model may be due
to several factors.
1. Identity/branding. The lack of a
strong, “high class” identity or image
reduces the busways to private roads
supporting a traditional bus network.
The customer experience of using the
busway is not very different from that
of boarding a bus along any other
(little-traveled) roadway.
2. Infrastructure. The lack of
Figure 5.7
dedicated infrastructure in the central business district cancels out a portion of
Platform on the MLK,
the travel time benefits of the busways and is generally uncompetitive with the Jr., Eastern Busway.
light rail system, which enjoys subway operations in the center.
3. Routing. Relatively inflexible route planning has limited the potential for
evolving more market-responsive routes or taking greater advantage of the efficiencies of interlining.
4. Stagnant growth. The relatively declining share of transit use in Pittsburgh—the result of a generally stagnant population but increased suburbanization of residents and employment—and the relative extensiveness of the transit
system make it difficult to achieve attention for “breakthrough” service, or to
significantly attract new ridership.
ADVANCED NETWORK PLANNING FOR BUS RAPID TRANSIT · 67
5. Station design and configuration. Stations, which are the means of accessing
the system and its most public face, are as yet exceedingly basic in design and
amenities, and hence do little to promote the system and its attributes.
5.2
Miami: South Miami-Dade Busway
5.2.1
Description
The South Miami-Dade Busway is an approximately 13-mile long T-Way, or atgrade busway, running parallel (and adjacent to) US 1, a multilane express arterial. The Busway begins at the Dadeland South Metrorail Station, and terminates
at SW 344th Street. The first segment, terminating at SW 112th Avenue, began service in 1997; the extension to SW 264th Street opened for service in 2005. A final
segment, terminating at SW 344th Street in Florida City, opened for service in late
2007.53
The Busway operates primarily as a feeder to the Metrorail heavy-rail system
which serves the central Miami area. For those traveling to worksites in downtown Miami, an automated people mover connects with the Metrorail at
the Brickell and Government Center stations, located seven and eight stops respectively from the
Dadeland South station.
Busway services are considered generally economical to operate; staff at the Miami-Dade County
Transit Agency report that Busway services are
much cheaper per boarding, in terms of public subsidy, than the Metrorail it feeds. No data could be
ascertained, though, to compare trip lengths or discretionary ridership.
Park-and-Ride facilities are located at several
stations along the Busway. The three inmost stations report parking utilization rates approaching
100%, but the two farthest lots (which are both
smaller) report much lower utilization rates (43.7%
and 11.1%),54 indicating the likelihood that auto
travel to the inbound stations is probably seen as
preferable/faster than parking at the farther stations.
5.2.2
Comparison to the Quickway Model
At least superficially, the South Miami-Dade Busway appears to implement
many of the concepts of the Quickway Model; at the same time, other elements
are missing, and they may as a result have a significant impact on the overall impact of the Busway.
Figure 5.8
South Miami-Dade
Busway Diagram.
ADVANCED NETWORK PLANNING FOR BUS RAPID TRANSIT · 68
Running
Ways.
The
South Miami-Dade Busway
is a T-Way operating parallel to a major traffic artery.
As such, it passes through
many signalized intersections. Signal-induced delay
is a major factor in vehicle
travel time along the
Busway; effective travel
speeds along the Busway are
under 20 mph. Even comparing the Busway Flyer
with the Busway Local service on the stretch between
SW 200th St and the terminus at Dadeland South Metrorail Station shows a
Figure 5.9
scheduled time savings of only 2 minutes (25 vs. 27 minutes), even though the Station along South
Flyer service only makes two stops in comparison to the fourteen stops made by Miami-Dade Busway.
the Local service.
The location of the Busway, running parallel to a busy arterial, is one that
generates numerous conflicts with cross traffic, including cars blocking the
busway as they queue to enter or cross U.S. 1 (figure 5.10).
Of greater importance, the Busway terminates at the Metrorail station; all
Figure 5.10
Operational
issues
services feed the Metrorail, forcing a transfer to an all-stops service that itself
observed on busway.
may require an additional transfer at the destination end of a trip.
Left, queued cars
blocking busway
Stations. Busway stations provide some protection from the elements, but are
(which has green
generally not integrated into surrounding land uses. Pedestrian crossings are
light); Right,
made at-grade. It is unknown how the stations rate aesthetically with the tarapparently
unauthorized
geted market for Busway services.
vehicles driving on
Vehicles. Most Busway services use standard transit vehicles; Flyer services
busway.
ADVANCED NETWORK PLANNING FOR BUS RAPID TRANSIT · 69
use on-the-road coaches, which are typically used for commuter services and are
reported to be popular with riders. Two routes still operate minibuses. While
some routes are named for the Busway, both MAX and Flyer designations are
also used for equivalent limited-stop services in other corridors.
Intelligent Transportation Systems. The Miami-Dade County Transit Agency is
only now in the process of outfitting intersections with transit signal priority
measures, using loop detectors to determinate the presence of a bus. It is hoped
that such a system will enhance system reliability and in particular reduce bus
bunching, which is reported to be a problem in the northern (original) section of
the Busway.
Fare Collection. No special fare collection measures are yet employed on the
Busway.
Service Patterns. The service pattern on the Busway is clearly consistent with a Quickway model,
though the efficacy of that pattern
(and the ability to extend it to other
routes) is hampered by the generally slow operating speeds dictated
by the many at-grade crossings
along the alignment. The service
pattern in also limited by the fact
that the Busway serves as a feeder
to
another
transit
service—
Metrorail—which, as an all-stops
service, doesn’t take full advantage
of its grade separation.
A total of nine bus routes use
the South Miami-Dade Busway, all
with a terminus at the Dadeland South Metrorail Station. Three of these are
Busway-specific routes, whereas the others use the Busway for a portion of their
journey before branching out onto other arterials.55
The three Busway-specific routes (Figure 5.7) are emblematic of three kinds
of services normally found in Quickway-based BRT systems: all-stops, express,
and super-express.
• Route 31, Busway Local, is an all-stops service along the length of the
original Busway; it does not continue along the recently-opened extension to SW 264th Street, but rather travels off-corridor to serve the
South Dade Government Center.
• Route 34, Busway Flyer, is a very limited-stop “super-express” service
that connects key points in Florida City before entering the Busway,
where it stops at only six of the twenty-one intervening stations before arriving at the Dadeland South station, including the four parkand-ride stations. The Busway Flyer operates only during peak hours,
at approximately every 20 minutes. The Flyer also differs from the
other bus services using the Busway in that it uses commuter coaches
Figure 5.11
Busway terminus at
Dadeland South
Metrorail station
(notice train waiting
above).
ADVANCED NETWORK PLANNING FOR BUS RAPID TRANSIT · 70
as opposed to more typical transit buses. To manage or limit crowding, Flyer service has a higher fare and certain service rules (for example, on the inbound journey, no alightings are permitted except at
the terminal station; on the outbound journey, no boardings are permitted except at the Metrorail, or originating, station); limited stops
help improve travel times, but only marginally, given the role of signal delays on the system.
• Route 38, Busway MAX, is a semi-express or “skip-stop” service that,
like the Busway Flyer, begins off-corridor in Florida City, then enters
the Busway, stopping at all stations (except for the innermost seven
stations during peak hours only). Interestingly, this route deviates
from the Busway near its former terminus in order to serve a major
trip generator off-corridor (the Southland Mall). MAX services operate 24 hours and use typical 40’ transit buses.
Non Busway-specific services include routes #1, 52, 65, 136, 252, and 287.
A good illustration of the flexibility of bus-based rapid transit infrastructure
is the experience of the Miami-Dade County Transit Agency during the first year
of Busway operations. There was concern among planners as to whether or not
the Busway would be successful (particularly as scheduled travel times along the
Busway were in fact no better than those of the route that previously ran along
the parallel US 1 highway), so in an attempt to maintain relatively high frequencies at relatively modest operating costs, minibuses were employed on most
routes.56 Within a year, ridership response was robust enough to lead to a shift to
standard sized buses on most routes. Articulated buses were introduced for
MAX service, but these were eventually abandoned in favor of standard transit
buses, but at a higher frequency.
Figure 5.12
Busway-specific
routes.
ADVANCED NETWORK PLANNING FOR BUS RAPID TRANSIT · 71
Identity and Branding. While the Busway is certainly named, publicity and
informational materials reviewed for this study did not stress any particular
brand identity for the Busway or Busway services.
5.2.3
Conclusions: South Miami-Dade Busway
The South Miami-Dade Busway by all accounts is a successful BRT project; for a
modest capital cost, transit ridership in the corridor has risen 184% in nine
years.57 Just the same, it deviates from the Quickway model along four salient
aspects:
1. Destinations. The Busway does not itself deliver riders to major employment sites, but instead feeds a modal transfer to an elevated rail system that itself
only partially delivers riders to an end-destination. The benefits of express or
super-express service are therefore limited, as transit riders are still generally
forced to transfer to an all-stops mode.
2. Land Use. It features limited integration into surrounding land uses or,
perhaps more appropriately, surrounding land uses are not configured to optimize the value of Busway stations. This is probably a common issue in farsuburban locations, regardless of mode.
3. Grade Crossings. As an at-grade T-Way operating parallel to a major surface highway, cross traffic poses both significant travel delays as well as issues
for operational safety. Travel times on the Busway, while faster than many onstreet bus services, are still relatively slow, and stations are often not optimally
located.
4. Demand. The combination of the three factors above serves to depress potential demand, making additional branching or express service non-viable. An
infrastructure that could support significantly faster through-speeds along with
direct links to principal work centers would likely create significant additional
market demand (and lower the cost of providing the linkages), opening up the
potential for a richer and denser mixture of services.
ADVANCED NETWORK PLANNING FOR BUS RAPID TRANSIT · 72
6.
Conclusions
The preceding review of BRT planning in seven cities highlights the conditions
that together lead to effective implementation of the Quickway model, as well as
those conditions that lead one to the Light Rail Lite model. In some cases, the factors are positive, meaning they represent choices or options; in other cases, they
are passive, representing conditions which dictate one option or another (such as
relatively low passenger demand and limited capital resources driving Eugene’s
choice of model).
6.1
The Role of Passenger Demand
Overall passenger demand is or should be the primary criterion driving the
choice of BRT model. In the case of Eugene, ridership demand even under the
best of conditions is insufficient to justify much more than a relatively frequent
Light Rail Lite service. In the case of Bogotá, ridership demand literally required
Quickway services in order to avoid the collapse of the system. In the middle,
Brisbane is within the “sweet spot”—while demand immediately surrounding
the corridor could easily have been met with just a Light Rail Lite service, the
strategic decision to embrace the Quickway model permitted the operation of a
much denser web of services which both responded to market demand and generated new demand; the recent and dramatic growth in public transit ridership
in that city is a testament to the power of the Quickway model to push transit
services over a “tipping point,” changing significantly the “value equation” for
potential customers.
6.2
The Role of Existing Services
What role do existing transit services play in shaping a Quickway service? To
what extent should services using a Quickway supplement or replace such services?
In the case of both Ottawa and Brisbane, complex transit systems, consisting
of overlapping networks of service, were in place before planning for Quickways
was undertaken. In the case of Ottawa, the infrastructure was seen as a catalyst
for systematic, network-level analysis to devise the most efficient transit network
possible. In the case of Brisbane, the infrastructure led less to a redesign of the
transit network, but rather was seized opportunistically to re-route a range of
pre-existing services so as to either make those services faster or, at least, collect
them so that inter-route transfers could take place within a station environment.
The end result appears less efficient than Ottawa’s system but clearly is effective on
both a patronage (ridership) and cost recovery basis.
The Bogotá case is strikingly different, but its genesis was also strikingly different. Unlike Ottawa, which was seeking to meet mode-split targets, or Brisbane, which “stumbled’ into Quickways for political reasons but then discovered
ADVANCED NETWORK PLANNING FOR BUS RAPID TRANSIT · 73
their utility for meeting mode-split targets, Bogotá developed TransMilenio specifically to replace existing transit services, which were seen as chaotic and generating many negative externalities (such as air pollution and traffic congestion).
For most transit agencies, the development of a Quickway infrastructure
should lead to network-level analysis of existing transit routes, especially if that
infrastructure is targeted at key employment sites and serving a major regional
role (in comparison, the South Miami-Dade Busway is limited to a single corridor
where it feeds a line-haul heavy rail system). Since Quickway infrastructure can
significantly alter the cost-performance of bus services (by reducing travel time,
reducing the effects of “stop-and-go” wear-and-tear on buses, and raising additional farebox revenue due to the increased attractiveness of services to potential
riders), such network-level analysis is both warranted and justified.
A related issue,
particularly in the
U.S. context, is the
extent and degree to
which an infrastructure project like a
Quickway should or
must necessarily involve the introduction of completely
new services. Under
current FTA pracFigure 6.1
tices for both New
Network types.
Starts and Small Starts projects, such projects, particularly if branded as “BRT,”
must include a specifically “branded” higher-frequency (minimum headways of
10 minutes peak and 15 minutes off-peak) BRT service. While such a requirement
is a natural outgrowth of the Light Rail Lite model, it imposes a unique and unnecessary burden on Quickway projects; many corridors might be ideal for the
development of a Quickway infrastructure that allows services to speed their
way to many connecting corridors, but otherwise may not generate sufficient
ridership in their immediate catchment area to justify a stand-alone higherfrequency all-stops service—or if they do, only enough to support such a service,
and not other routes that would branch off the corridor.
This situation places some transit agencies in a bind; they may look to a
Quickway solution in a major corridor in order to improve operating efficiency
and increase ridership, but the requirement that they add a new route, with its
attendant costs, may make the project (which otherwise could demonstrate costeffectiveness on a system-wide basis) untenable.
This problem is illustrated in Figure 6.1. The network depicted on the left
may represent a smaller city’s implementation of a Quickway infrastructure, in
which otherwise lower-frequency routes combine to create a high frequency corridor. The map on the right represents the traditional approach to BRT development in the U.S., in which the infrastructure, if there is to be any, is expected to
have a high-frequency spine service, the operating cost of which may no longer
ADVANCED NETWORK PLANNING FOR BUS RAPID TRANSIT · 74
make through-routing of connecting services feasible. The result may be “easier”
for a casual or first-time user, but in the end such a system imposes transfer penalties (such transfers rarely take place on the same platform) which will ultimately depress ridership compared to the faster, one-seat ride of the network on
the left.
6.3
The Role of Strategy
Strategy, or more particularly strategic vision, was integral to Ottawa, Bogotá.
and Brisbane. In these cases, regional strategies were developed that described
how an infrastructure could be deployed that could then support an evolving set
of services that together could meet numeric targets for transit system performance. Corridors were analyzed not so much as independent entities, as they typically are in the U.S. Federal New Starts Program, but in terms of their role within
the broader network strategy.
The presence of a strategic vision is hardly “fluff;” rather, it is the key to politically generating buy-in to certain projects, or at least to the understanding of
what these projects need to achieve. The experience of the Orange Line in Los Angeles is especially instructive in this regard; the absence of a coherent (and
achievable) regional infrastructure strategy—linked to the lack of clear targets as
to what transit would need to achieve in order to meet a broader set of regional
goals—meant that virtually all aspects of the Orange Line’s design and operating
plan were up for grabs. Since it didn’t matter if potential ridership was lost, the
argument in favor of many design decisions was weakened and often lost. That
the infrastructure is capable of supporting a more intense service plan is probably due more to the thoughtfulness of project staff than to any specific political or
managerial dictate. And while the Orange Line may rightly be held up as an example of a successful project—for it is—and even one worthy of emulation—for it
is that, too—it must also be understood as a much weaker example of strategy,
one whose marginal contribution to regional goals may be insufficient in the end
(though to be fair, to the extent it demonstrates latent demand for quality transit
services, even those provided by BRT, it will indeed serve an important strategic
purpose).
6.4
The Role of Targets
The most outstanding attribute all three global examples of the Quickway model
share is how they all evolved out of the necessity of meeting ridership or mode
split targets which were exogenous to the transit planning process itself. In the
case of both Ottawa and Brisbane, these targets emerged from regional land use
plans: if growth were to take place in certain zones, and only limited improvements were to be made in the road network serving these zones, then transit
would need to achieve relatively high mode splits if the land use plans were to
work. In the case of Bogotá, existing and latent demand for transit services was
exceedingly high, and would overwhelm the ability of a BRT system modeled
ADVANCED NETWORK PLANNING FOR BUS RAPID TRANSIT · 75
after Curitiba’s to meet without significant and sustained innovation intended to
continuously increase the carrying capacity of individual corridors.
In none of the domestic examples of BRT were ridership targets a major—or
even minor—factor in planning. This is not to say that ridership projections were
not made; they clearly were. But in no case did targets actually serve the role of
pushing system design to need to achieve anything. It is this lack of hard and
meaningful targets on the domestic level and the absolute role of them on the
international level that most stands out from this study, and it was in the response to these targets that the Quickway model emerged in the first place.
6.5
The Role of Growth
Both Brisbane and Bogotá are rapidly growing cities (Ottawa’s growth, while
solid, is more moderate); as growing cities, transit is able to shape trip patterns
and land uses to a greater and greater degree. University of California professor
Robert Cervero has previously observed that transit can shape urban form only
to the extent that an urban area is growing or at least attracting significant and
ongoing investment,58 and while Pittsburgh has been successful at diversifying
its economy and attracting some share of investment, it has largely over the decades lost population and ceased to be a growth center. It is perhaps for this reason that its busway system has not been the model for other American cities the
way Bogotá’s system in particular has served as the dominant model for cities
throughout the Third World.
6.6
The Role of Branding
The Light Rail Lite model of BRT, because it tends to emphasize a bus operating
in a surface treatment, depends heavily on bus branding to distinguish the service
from standard “city bus” services. The Quickway model, however, suggests a
different priority: that of branding the infrastructure, precisely because, in externalized systems, buses using that infrastructure may otherwise be traveling on
traditional arterials in traditional bus mode. Brisbane especially has placed great
emphasis not merely on branding the infrastructure with a standard logo, but
with using station architecture, in particular, to establish the identity of the system. In fact, they go beyond mere design cues to focus on creating stations which
many planners in the US would consider too lavish, certainly by the standards of
typical bus stops. Again, this was a deliberate strategic decision: since the vehicles couldn’t or wouldn’t be distinguished from the rest of the bus fleet, stations
would need to establish the tone and image of the system, and communicate the
importance of the system to the general public.
ADVANCED NETWORK PLANNING FOR BUS RAPID TRANSIT · 76
6.7
The Role of Models and Understanding
Most cities do not develop unique responses to their transit challenges in a vacuum. One theme that emerges from this study is the role that models from other
cities play in stimulating thought and consideration for a particular strategy in
any given city; the better understood these models (particularly in terms of their
specific elements), the more they were able to stimulate further innovation, as a
response to the conditions in the new city. Bogotá turned to BRT because the
Mayor was concerned that the Metro scheme otherwise under development
would not provide sufficient system-wide benefits soon enough for the amount
of money it would cost (let alone whether Bogotá could actually raise the massive amounts of capital that would have been required), so he reached to Curitiba
as a model for what Bogotá could do (and then promptly reinvented BRT service
in an attempt to make the model “fit” the situation of Bogotá). Los Angeles, too,
reached to Curitiba, but came up with a spectacularly different application of
what they learned and understood than did Bogotá. Brisbane only developed its
Busway strategy after seeing it in operation in Ottawa. The list goes on.
For the Quickway model to be better understood and appreciated in the
United States, more people at more levels will either need to learn about examples such as Brisbane or Ottawa or wait for an American city to successfully follow through on the full implementation of the strategy (though Pittsburgh comes
close, its station strategy and CBD strategy, along with relatively conservative
service planning, limit the ability of the model to produce the greatest results,
and hence limit its appeal to other cities).
6.8
The Match between Models and Urban Form
When is the Light Rail Lite model more appropriate than the Quickway model?
When is light rail itself more appropriate than BRT, given the choice of the Light
Rail Lite model? And what conditions favor the Quickway model?
The preceding review of cities large and small offers clues for answering
these questions.
1. Corridor type. The Light Rail Lite model is most appropriate in contexts
where relatively dense corridors exist with relatively short trip lengths, and
where most trips begin and end on the corridor. The service pattern thus produced matches many likely trips, and often can be produced in a cost-effective
manner.
2. Density. If the above conditions exist but densities run high and right of
way is available, rail solutions can become preferable. Rail solutions are especially preferable to BRT where at-grade operations are required and large volumes of passengers need to be transported crossing other arterials. We learn
from LA that signal priority systems are most effective when bus headways are
at least three-four minutes; an articulated bus every three minutes can only provide an effective throughput of under 2,000 passengers an hour per direction
(and that’s assuming 65’ vehicles, which are still technically illegal in most locales). Though some cities achieve much higher volumes on their at-grade BRT
ADVANCED NETWORK PLANNING FOR BUS RAPID TRANSIT · 77
systems (Curitiba is reported to move over 12,000 passengers per hour using
biarticulated buses), they rely less on true traffic signal priority, employ dedicated lanes or T-Way configurations, and/or are willing to degrade the performance of traffic in favor of buses. If, however, grade separation is possible and significant demand for transit is located beyond potential station locations, then the
Quickway model could be preferable to most rail alternatives.
3. Dispersion of origins. The Quickway model is most appropriate when the
opportunity exists to deliver people directly and rapidly to major destinations
from generally dispersed origins. Given that most American cities can be described in terms of “dispersed origins to multiple destinations,” the Quickway
model likely has widespread applicability to US urban areas.
4. Corridor conditions. Quickways are preferred over freeway-based solutions for BRT when located in zones that generate potential ridership (and hence
can support stations) and when the highest degree of reliability is required (particularly noteworthy if the “wedge” of land being served by branching services is
capable of generating significant ridership).
5. Total demand. Quickways are generally only warranted in environments
capable of generating a large number of bus trips, at least during the peak period. Unlike Light Rail Lite or rail lines, which could in a large metro area conceivably be justified in a plethora of corridors, cities that develop Quickways can
focus these investments more tightly and then rely on T-Way or even simpler
transit priority measures on corridors that feed the Quickways.
6. Demand for express services. Quickways are also warranted in metro areas
that would gain from express and super express services that will want to stop at
multiple destinations.
7. Volume. Quickways should also be explored in corridors with existing
significant transit volumes, as Quickways have the potential to dramatically
lower operating costs (by speeding services). With Quickway infrastructure, the
capital investment is intended to produce an ongoing revenue benefit. This benefit results from both lower operating costs and increased ridership (hence fares).
Analysis of Quickway alternatives must take this dynamic into account.
8. Internalized vs. Externalized systems. Within the Quickway model, the
choice of externalized or internalized operating schemes is a function of the ability to provide adequate specialized infrastructure (i.e., rights of way and specially branded vehicles). In the case of Brisbane, this would not have been possible, given the multitude of corridors that feed into their Busways; in the case of
Bogotá, it represented a deliberate strategy that understood the role of infrastructure in meeting practical needs for high capacity and operational efficiency.
9. Hybrid service opportunities. It is indeed possible to create hybridized internalized/externalized transit networks. Brisbane, for example, has built a
Busway-style station in Springwood, several kilometers to the south of the terminus of the Southeast Busway, extending the brand image and service pattern
beyond the core infrastructure. Particularly in cities where buses are viewed as
“second class,” it may make sense to use specialty vehicles for services that rely
in great part on the Quickway infrastructure, and develop Quickway-like stations or stops off-corridor in order to distinguish the services from more tradi-
ADVANCED NETWORK PLANNING FOR BUS RAPID TRANSIT · 78
tional services. Other buses could still share the same Quickway infrastructure,
but would be perceived as opportunistic as opposed to strategic uses of the
Quickways.
10. Role of corridor in network. Light Rail Lite, much as Light Rail, is manifestly a corridor strategy, and so may prove useful in single corridors in a metro
area. The three international cities reviewed here that adopted the Quickway
model saw it as an infrastructure strategy that could then support a high-capacity
and cost-effective service plan. In other words, the infrastructure could support a
network plan in which much of the ridership along any one Quickway might
actually be attracted far off the alignment itself. This is why, for cities interested
in exploring the Quickway model, the first step must be that of developing and
testing a Quickway network plan, much as was done for Ottawa, Brisbane, and
Bogotá, identifying the set of infrastructure projects that together could achieve
whatever numerical goals (e.g., ridership, mode share, or economic performance)
needed to be achieved.
This is not to say that the Federal Alternatives Analysis process, with its emphasis on corridor-level analysis, would need to be abandoned. Rather, the fact
of an integrated network strategy would permit in any one corridor a more appropriate review of a properly configured Quickway alternative compared to
other alternatives; since the infrastructure strategy would almost certainly identify the larger set of corridors that would be expected to feed services into any
one Quickway project, the AA process would have an effective starting point for
comparing the overall performance of the project to competing alternatives.
ADVANCED NETWORK PLANNING FOR BUS RAPID TRANSIT · 79
This page intentionally left blank.
ADVANCED NETWORK PLANNING FOR BUS RAPID TRANSIT · 80
7.
Recommendations for Practice
The Quickway model has clearly produced benefits for cities such as Ottawa and
Brisbane that resemble, in many ways, their U.S. counterparts; even Bogotá’s experience is of value to U.S. cities. But for these benefits to be realized, different
actors involved in planning major transit projects will need to familiarize themselves with the dimensions of this new mode and make adjustments to existing
planning policies and processes.
7.1
Federal Level
Planning for major transit capital projects in the United States is often driven by
the requirements for funding under the Federal Transit Administration’s New
Starts program (and its relatively new sibling, the Small Starts program). The
FTA can encourage the exploration of Quickway concepts (and, in the light of
international experience with the model, should encourage such exploration) in
many notable ways.
1. Recognition of mode. Quickways should be identified as a distinct mode of
transit, essentially distinct from the Light Rail Lite model of BRT. As a distinct
mode, however, proper attention could and should be paid to Quickways in the
Alternatives Analysis (AA) process.
This point bears emphasizing. Quickway infrastructure is typically far more
expensive than surface BRT treatments, be they in mixed traffic or segregated TWays; on the other hand, the potential travel time savings and increase in corridor carrying capacity imply opportunities for a multi-layered route structure that
typically goes beyond the more basic route-level planning associated with more
traditional modal alternatives. As a result, a properly-developed Quickway alternative should be significantly different than a “BRT” alternative derived from
the Light Rail Lite model.
2. Support for network-level planning. Network-level planning should be encouraged in metro areas large enough to support a reasonably high level of transit service. Currently, FTA involvement in transit planning is focused almost entirely at the corridor level; as a result, many regions pay short shrift to systemwide planning, instead allowing the corridor-level AA process to dictate actual
modal alternatives. The foreign example of Ottawa is an example of why this
makes good planning and funding sense: had the FTA’s New Starts process been
applied to Ottawa, it is almost a certainty that a properly qualified LRT alternative could have emerged in any one of its principal Transitway corridors. However, because Ottawa conducted a systematic network analysis, it was able to
identify and specify the ways that a Quickway infrastructure could support a
redesign of its bus network (less likely under a purely corridor-level analysis),
and hence could therefore demonstrate significant network benefits to a Quickway strategy.
ADVANCED NETWORK PLANNING FOR BUS RAPID TRANSIT · 81
3. Support for improved alternatives development. The FTA should support
demonstration projects for Quickway alternatives development. Since few transit
planners in the United States are familiar with the dimensions of the Quickway
model (Pittsburgh’s busways, as an example, come close to the model, but fall
short at the level of station branding and network design), the FTA can play a
major role in helping willing regions explore the concept in a meaningful way.
4. Flexible funding criteria. Funding criteria should embrace network-level
improvements. Current transit infrastructure funding programs emphasize corridor-level projects, which is appropriate to rail systems but not to bus-based
rapid transit systems. Cities such as Brisbane and Ottawa have developed
phased infrastructure plans in which different pieces of a network may be built
at different times, prioritized by the immediate benefit they offer the system. One
corridor, for example, may consist of “permanent” and “temporary” capital improvements, with some elements vital in the short term and others not required
for decades. To the extent Federal funding policy discounts or limits funding for
such strategies, it misses the opportunity to achieve potentially higher returns on
its capital investments at less general risk than most New Starts projects.
5. Additional technical study. The FTA might wish to sponsor and publish
further technical study of the Quickway model. In particular, a more in-depth
comparative study of the Ottawa and Brisbane systems could shed additional
light on the most effective planning methodologies and processes for Quickway
system development. This study should aim at a domestic process for Quickway
Alternatives development as an input into corridor-level Alternatives Analysis
projects, let alone network-level analysis.
6. Improved operating cost modeling. The FTA might wish to further support
research into proper cost-modeling for Quickway-based systems, as well as
sponsor market research to identify market responsiveness to Quickway infrastructure and services. Such research would be most valuable if it is able to suggest coefficients appropriate to the specific analysis of Quickway alternatives in
regional modal split models (such as modal utility, in-station transfer penalties,
and network-level impacts on individual trip mode choice59).
7. A more competitive alternatives generation process, including the adoption of
mode split targets. As a means of further improving the development of alternatives for the AA process, the FTA might consider the development of a process
for supporting the competitive development of such alternatives. Since the Quickway model evolved from the attempt of different cities to meet specific targets in
the most cost-effective means possible, it stands to reason that a competitive AA
process could also lead competing teams to innovate and sharpen the alternatives they develop. Such a process would almost certainly lead to the development of new Quickway-based proposals in at least some U.S. cities.
7.2
Metropolitan Planning Organizations (MPOs)
and Public Transit Agencies
MPOs and transit agencies involved in the development of transit infrastructure
projects can benefit from an improved understanding of the Quickway model
ADVANCED NETWORK PLANNING FOR BUS RAPID TRANSIT · 82
and a deeper knowledge of how to exploit the model’s features for their respective regions.
1. Develop mode-split targets. MPOs should consider the development of
transit mode split targets as a function of land use plans. These targets should
organize and focus long-range transit planning, and would also serve the needed
use of testing and identifying limitations in their Regional Travel Model (the experience of several cities is that these models may inaccurately underproject
transit’s potential to attract new riders to an extent not warranted by actual
data60). Mode split targets are most effective when applied at screen lines and
when driven by either projected demand for transit or (more likely) by the projected deficiencies in the automotive system’s ability to provide connectivity
within acceptable standards.
2. Improve network-level analysis and planning. MPOs and transit agencies
should improve their ability to conduct network-level analysis in which network
alternatives are developed and studied in some detail. This kind of analysis
could be incorporated into the processes for developing Regional Transportation
Plans, though they would tend to be more complex and systematic than the processes used to screen proposed projects in an RTP.
3. Learn from and about the Quickway model. MPOs and transit agencies
should familiarize themselves and their key constituents/stakeholders with the
dimensions and requirements of successful Quickway-based systems so as to
better support the alternatives development process.
4. Embrace high-level market research. MPOs and transit agencies should also
consider contracting for specific market research to test public acceptance of and
reaction to Quickway concepts and infrastructure as a means both of driving system design and gauging potential ridership.
7.3
Planning and Engineering Firms
Though they belong to the private sector, planning and engineering firms set the
basic tone for the planning of transit infrastructure projects in the United States,
particularly at the level of alternatives development to feed into the Alternatives
Analysis process. To better understand and take advantage of the Quickway
model, such firms should consider the following.
1. Become familiar with the Quickway model. Firms should familiarize themselves with the Quickway model, particularly with the specific technical issues
involved in the design of Quickway infrastructure, the role and importance of
stations, issues regarding ongoing operating costs of vehicles and infrastructure,
and issues related to ridership demand and customer acceptance issues.
2. Explore Quickway Service planning concepts. Firms should become more
expert in the kinds of service planning that characterize the international Quickway examples cited in this report. Of particular note, the use by these systems of
overlapping networks made up of multiple service types is a central concern, as
is that of matching origins with likely destinations.
ADVANCED NETWORK PLANNING FOR BUS RAPID TRANSIT · 83
7.4
Final Thoughts
To sum up the preceding points, the effective implementation of the Quickway
model calls for the following steps or elements.
1. Targets. The adoption of targets, whether for ridership or mode share, is a
powerful inducement to focus planning efforts on devising the most effective
service plan, and hence lead to the appropriate specification of infrastructure. It
takes considerable work to design an effective service plan, which may be one
reason why such plans have been few and far between.
2. Infrastructure strategy. Quickways represent an infrastructure strategy, and
hence are less likely to prove useful if developed solely on a corridor-by-corridor
basis. This is not to say that the Alternative Analysis process need be bypassed,
but rather that an integrated regional application of a Quickway model will yield
precisely those corridors where Quickway infrastructure can support the kind of
service plan that can generate the ridership that can justify the investment (and it
is these proposed corridors that can be then tested in an AA process).
3. Regional growth. Quickways can begin to shape an urban area only to the
extent that they provide a perceived and significant benefit, and that the region
as a whole is growing. The Light Rail Lite model may be more appropriate in
environments where capital investment cannot be justified at the scale necessary
to produce benefits, however valuable those benefits may be.
4. Stations as branding. The Quickway Model benefits from branding, but
such branding is more focused on the infrastructure than on the services. Station
design and configuration in particular are the key means for establishing a brand
identity and system image.
5. Modeling challenge. When devising and assessing the performance of
Quickway alternatives, it may be necessary to go beyond ridership projections,
as few models are able to capture some of the potential benefits of such alternatives without specific and expensive dedicated market research. Other evaluative
measures, such as projected travel time savings and impacts on operation and
maintenance costs, should also be employed as significant measure of user and
system benefits.
6. Network planning. While Quickways are compatible with corridor-level
Alternatives Analyses, the development of competitive Quickway alternatives
should follow a network-level analytical process; corridor-specific Alternatives
Analyses can then examine how the infrastructure proposed for that corridor
compares to other alternatives.
Quickways are not merely a graduated step-up in BRT-supportive infrastructure,
nor are they a precursor or stepping stone to light rail systems; they imply their
own logic on system design and operations and make possible services that otherwise would not be cost-justifiable. They should be treated as a distinct mode,
particularly for network and corridor-level planning, and one with great potential for helping American cities achieve phase shifts in the role that transit plays
in their daily lives and long-range growth.
ADVANCED NETWORK PLANNING FOR BUS RAPID TRANSIT · 84
Appendix
Application of the Quickway Model to an
American City: San Diego and the FAST Plan
Can the Quickway model be applied fully within the United States? Given that
there are no full-fledged examples of this mode within the U.S., the first question
is whether such a model could be designed, configured, and priced to match an
American city—its trip patterns, urban form, physical and topographical constraints, and reasonably expected transit capital and operating resources.
Many modal innovations in public transit arise not from within the industry
itself (or its governmental counterparts), but from private individuals and organizations that become familiar with such innovations internationally and then
work toward raising the possibilities for domestic application. Examples of this
include former California State Senator James Mills, often credited with being the
“father of light rail” in the U.S., and Los Angeles-area architect Martha Welborne, who played a major role in bringing the concept of Bus Rapid Transit to
fruition in the U.S.
Move San Diego, Inc., is a non-profit organization that emerged from a set of
agreements between San Diego’s land development and environmental communities, dedicated to the promotion and wide scale adoption of alternatives to private passenger automobiles within San Diego County. This County, with a population slightly above three million residents, borders on the Mexican city of Tijuana, with its two million residents, creating the largest binational city on the
planet.
Move San Diego assembled an international team of transit planning experts
to develop a new regional public transit plan, building off the Global Best Practices discussed earlier in this report. This team included several of the professionals responsible for planning and developing both Brisbane’s and Ottawa’s
Quickway systems, as well as an engineering firm with extensive domestic experience in designing bus facilities in the U.S. The author served as project
leader.61
The team began by reviewing a major market research study commissioned
by the former Metropolitan Transit Development Board (MTDB) in 1999, which
was conducted by Cambridge Systematics, Inc., with the assistance of The Mission Group. This study identified six primary market segments in the San Diego
region, each of which was found to respond to a different set of cues when it
came to mode choice. However, a number of overall generalizations were drawn
from this study.
1. Speed. Transit services would need to be significant faster if they were to
appeal to four of the six market segments. San Diegans across the board valued
their time more so than had been expected.
2. Experience. Special attention would need to be paid to upgrading the customer experience associated with transit services.
ADVANCED NETWORK PLANNING FOR BUS RAPID TRANSIT · 85
3. Walking. Station location mattered more than had previously been
thought, with much of the market responding to even minor improvements in
walking distance.
4. Coverage. The decision to use transit was not only a function of the viability of transit for that particular trip, but of subsequent trips that that person
might wish to make (that is, system extensiveness counted).
Following this review, the team reviewed origin/destination data for the region, focusing on its major employment centers. Maps were drawn depicting
these desire lines, using a projected data set supplied by the San Diego Association of Governments (SANDAG). These maps confirmed that movement patterns
in San Diego were highly dispersed, and could be characterized as a “dispersed
origins to multiple destinations” network problem.
These maps were also compared with existing transit services, both bus and
Figure A.1
light rail. Both networks were found to provide some but nonetheless limited
Trip pattern
opportunities to attract significant additional ridership. It was further found,
analysis to two
regional job
though, that many bus routes could be re-routed in such a manner that they
centers. Downtown
could better serve commute trips, should the appropriate infrastructure be promap (left) shows
vided.62
existing light rail
The team then set about attempting to identify whether a Quickway infra- lines superimposed.
structure could be configDaily commute to Downtown
Daily commute to
ured to support the trip pat(>500 commute trips:
aggregated Golden Triangle
terns identified above. An
home-to-work & higher education trips)
(>500 commute trips)
“urban spine” was identiSCALE
SCALE
fied, running from Kearny
7000 trips
7000 trips
5000 trips
5000 trips
Total:
Total:
Mesa in the north to Down3000 trips
3000 trips
145,776 trips
181,433 trips
town in the south, via Mis1000 trips
1000 trips
500 trips
500 trips
sion Valley and Hillcrest,
that linked many of the principal employment sites and
other key destinations in the
central region. From Kearny
Mesa, a branch to the North
County
coastal
region
emerged, serving the Golden
Triangle region; another
branch moved along the I-15
corridor northward, where it
would take advantage of the
managed lanes then under
development in that zone;
and a connecting alignment
along the north provided
direct service into the heart
of Sorrento Mesa, San
Diego’s major high tech
zone.
ADVANCED NETWORK PLANNING FOR BUS RAPID TRANSIT · 86
EscondidoSprinter
Quickways(Express)
T-Ways(SurfaceRunning)
Light Rail (Trolley)
Freeway-BasedRapidTransit
Arterial-Running
Commuter Train(Coaster)
Sorrento
Gateway
SorrentoCoaster
Horizontal Elevator (Shuttle)
Scripps
Business
Park
SORRENTO/
Super Station(ExpressStop)
Station
UTC ZONE
UTC
Santee
KEARNY MESA ZONE
CountyKearny
PBGateway
SharpHospitals
MISSION VALLEY ZONE
Grossmont
FashionValley
OldTown
SDSU
McTIP
Hillcrest Center
College
AIRPORT
LEMONGROVEAVE
5thAve
N
OW
NT
W
DO
SantaFe
NE
ZO
Gaslamp/
ConventionCtr
8thSt
San Diego Regional
Central and South County
FAST Plan
PlazaBonita
HSt
Infrastructure Component
SanYsidro
OtayMesa
Figure A.2
The infrastructure
map of the FAST
Plan as of late
2007, showing
proposed Quickway
and related bus and
rail infrastructure.
The Quickway
section running
north/south from
Kearny Mesa to
Downtown (just
north of the Sharp
Hospitals station to
the Gaslamp/
Convention Center
station) becomes
the central spine of
the system.
Capital cost and
feasibility analysis
was performed on
an earlier draft of
this plan; notable
posterior changes
include the
extension of
infrastructure
through Mid-City
(east of the McTIP
station), the
rerouting of the
South Bay Quickway
through National
City, and the
reconfiguration of
infrastructure in the
Golden Triangle.
These changes
would be expected
to increase the total
capital cost of the
Plan.
A coastal alignment was also identified from the Golden Triangle/UCSD
area south to Mission Valley, whose purpose was primarily to connect into the
various beach communities (La Jolla, Pacific Beach, Mission Beach, and Ocean
Beach); a branch through Mid-City provided service into this population-dense
heart of the metro area; and a branch south/southeast to the international border
provided connectivity into the rapidly developing southeast suburbs.
Given the highly-developed nature of some of these alignments, grade separation would require extensive tunneling (both cut-and-cover and bored segments) in certain locations; in other locations, it would be relatively easy to provide or colonize surface alignments that were free of cross-traffic. A first draft of
the infrastructure plan was analyzed by the team’s engineers for basic feasibility,
ADVANCED NETWORK PLANNING FOR BUS RAPID TRANSIT · 87
50%
40%
44%
30%
20%
10%
18%
13%
9%
9%
2%
2%
3%
Existing At Cut & Open Cut & Cover
Grade
Tunnel
Modified
LRT
0%
Bridge
Elevated
New At
Grade
$16.1b
$15 Billion
$10.6b
$10 Billion
$8.6b
$5.8b
$5 Billion
0
RTP:
RTP:
New Transit
Total Transit
Capital Projects Capital Budget
RTP:
Total Transit
Spending
FAST Plan:
Projected
Capital Costs
and a conservative cost model, with healthy contingencies, was developed for
purposes of deriving a total price tag for the project.63
The first draft’s total capital cost was projected at $5.8 billion64 (in 2006 dollars); which fit well within the 2003 Regional Transportation Plan’s $8.6 billion in
new transit capital projects; subsequent work on the plan has added, extended,
or modified a number of segments, likely raising the total price by $1-2 billion,
but significantly extending the reach of the network and potentially adding significant value to the plan.
The current plan covers only Central and South County, Move San Diego is
planning to conduct a North County planning exercise to determine whether the
plan’s elements can work as well in the different environment of North County.
Still, the plan, dubbed the FAST Plan (Financially Affordable, Saves Time), has
passed the first test for capital affordability.
The infrastructure component of the FAST Plan was complemented by a service plan composed of a number of distinct route types:
1. Spine routes, an internalized network operating entirely within Quickway
or T-Way infrastructure, operating in all-stops mode. These “core lines” include
the existing light rail lines. Seven BRT Spine Lines complement the three LRT
Spine Lines in the total network.
2. CityXpress Routes, and externalized network which mostly begin as local or
limited-stop routes along arterials, then enter the Quickway infrastructure and
operate in limited-stop mode until reaching a major destination zone.
Figure A.3
Above, Infrastructure components
of the first draft of
the FAST Plan as a
percent of total
guideway length.
Below, Projected
capital costs
compared to
transit projects in
the 2003 Regional
Transportation
Plan. Subsequent
changes to the
plan will have
significantly
increased the
percent of
infrastructure in
cut & cover
tunnels (and hence
costs). These
changes were
made, though, in
response to
encouraging signs
of potential
ridership gains and
operating
efficiencies.
ADVANCED NETWORK PLANNING FOR BUS RAPID TRANSIT · 88
EscondidoSprinter
U3
G4 0
0
NCountyFair
F52
P
F50
Carmel Valley
RANCHOBERNARDO
RanchoBernardo
P
RANCHOPEÑASQUITOS
F50
F52
Valley Centre
Carmel Mtn
P
SabreSprings
F50
F52
HighBluff
F52
P
A20 4
F70
Poway CivicCenter
RED
LIME
F60
G40
P
U30
P
U30
G40
Del Mar Hts
P
U30
G40
F50
F60
P10
PowayBusinessPark
F60
F70
A20 4
MIRA MESA
P20
MiraMesa
ScrippsRanch
U20
P
GOLDENTRIANGLE/SORRENTOMESAZONE
F40
F50
F52
F60
F70
U20
Lusk
U10
U20
U10
U20
U10
U20
U10
P
P
P
P
P
A10 4
P
GeneticCtr
U10
U20
A10 4
A20 4
F40
Sorrento
Gateway
A10 4
U20
U20
P
P
A10 4
A10 4
F40
Scripps
Business
Park
RanchoEncantada
U20
CaminoRuiz
U20
Alliant University
U20
P
LIME
Viper
F70
T
F70
Executive
T
F70
U
MANDELLWEISS
ts
en
Reg U
UCSD
Central
T
T
T
T
F70
F70
F70
F70
Morehouse
BlackMtnRd
PacificCtr
LIME
GOLD
YELLOW
RED
U
Library Walk
T
G40
ton
orn
Th U
ACQUARIUM
T
T
F70
F70
F70
U
A10 4
Eastgate
ScrippsMemorial
U
G40
U
A10 4
U
A10 4
TowneCentre
T
U
SorrentoValley
A10 4
GOLD
OCEANOGRAPHY
UTC
YELLOW
PURPLE
Mahaila
T4
F4
T4 0
T5
F5 0
T6 0
F5 0
0
F6 2
F7 0
G
50
0
4
A20
U30
U10
U20
RuffinNorth
y
ple
Co
l
icia
Jud
PROSPECT
KEARNY
MESAZONE
or
vern
Go
4
U10
U20
Kearny
CountyCtr
T
A10
GilmanS
CostaVerde
Avantine
A10
A20
J
Spectrum
0
P1
GO
LD
RE
D
CLAIREMONTDR.
BALBOA& GENESSEEW
P
AeroDr
G30 T10
G40 T20
4
0
A
0
G5
0
U1
SharpHospitals
F40
F50
F52
F60
F70
P2
G
50
G60
PBDRIVE
ALLIEDGARDENS
T40
Arnele
F30
SANTACLARA
ParkwayPlaza
MISSIONVALLEYZONE
FriarsMission
Morena/LindaVista
0
G6
U10
HazardCtr
MissionValley Ctr
RioVistaW
Stadium
RanchoMission
Grantville
T2
A
4
A
4
A
4
4
Z
4
Z
4
Z
4
0
S1
4
4
4
SK
Y
4
4
DOWNTOWN
ZONE
T34
T10
T10
G10
G10
P20
P20
Rainbow/
Egyptian
30TH& UPAS
UptownDistrict
T30
T32
Euclid
T30
70th &
ElCajon
CASA DEORO
T30
Troy
0
T3
LaMesaBlvd
College
T34
T10
G10
30TH&UNIVERSITY
G20
T30
Sharp
Grossmont
G20
T34
UNIVERSITYAVE
F10
University
&I-15
T10
4
4
4
Alabama
P20
F10 G10
F20 G20
F30
Upas
SpringSt
CityHeightsVillage
Cuyamaca
College
T30
Laurel/BalboaPark
30TH&JUNIPER
BalboaPark/Prado
4
TAN
4
4
4
G20
F10
F20
F30
B20
4
G J
T30
Baltimore
F20
T30
Winona 54th Crawford
4
F10
4
Z
4
4
A
4
4
4
4
Z
F A
Middletown
Commuter
SKY
4
4
Hillcrest Center S
A
Fairmount
T20
4
F10
RED
LIME
PURPLE
U1
0
0
B1
TAN
F20
73rd
F20
S10
B20
1
T20
4
G20
SanDiegoInternational Airport
2E
T20
4
T2
T10
T20
Washington
2W
T20
4
S10
ORANGE
0
T20
0
T10
T20
Mercy
33rd WilsonMCTIP
Texas 30th
EdCenter
DMV
S10
TAN
UNIVERSITYHTS
CMNODELRIOS
B10
F20
Montezuma
EMTNVW
CARTERICTR
B20
4
S10
Ch T30
oct
aw
TROLLEYBARNPK
CMNODELARENIA
A
UCSDHillcrest
ELCAJONMAINST
70th
MONTEZUMARD
KENSINGTON
35TH& ADAMS
ANTIQUEROW
T30
T32
T34
P20
UNIVERSITYHEIGHTS– ADAMSAVE– NORMALHEIGHTS
G10
B10
U10
Hotel CircleSouth
OldTown
B20
ElCajon
Transit Ctr
T40
GREEN
Amaya
Fashion
Valley
4
J
G30 T10
G40 T20
G50
G60
4
B10
F40
F50
F52
F60
F70
U20
A
Grossmont
Alvarado
SDSU
F30
LIME
T32
0
GREEN
RED
B1
PURPLE
G60
Bay Park
SANCARLOS
T32
Clairemont Dr
ELCARMEL
GOLD
MISSIONBEACH
OC
EA
NB
EA
CH
F30
Birdland
Independence
Belmont Park
Weld
S10
GREEN
BALBOA AVE.
P10
G30
Kearny MesaSouth
ORANGE
LIME
U10
U20
J
Grossmont College
LD
GO
P20
TechWay
BALBOA&GENESSEEE
PBGateway
U20
U30
0
PACIFICBEACH
B00
P1
P10
P
4
line
aw
Sh
A10
J
Crystal Pier
TIERRASANTA
4
CLAIREMONTMESA BLVD.
A20
4
CLAIREMONTTOWNSQ
oy
nv
Co
A10
Ardath
Contemporary
T50
4
G
50
T50
4
U30
LAJOLLACOVE
Santee
T60
LIME
VillageSq
GilmanN
G30
VillaLaJolla
ORO
PLAYA
CollegeGrove
Cortez
Federal
Harris
T32
T32
30TH&GRAPE
G J
5th Ave
G J
S
S F A
Grove
T32
T32
T32
Columbus
Lemon
Grove
4
4
S F A
CivicCenter
ORANGE
RED
30TH& BEECH
BLUE
PURPLE
AmericaPlaza
Santa
Fe
SKY
Z
TAN
CruiseShipTerminal
LIME
CountyCtr/
LittleItaly
4
EmbarcaderoNorth
B20
4
Harbor Island
4
BankersHill
B20
City College
GoldenHill
P20
S
F
A
N10
Submarine
S
F
A
4
TAN
4
S
F
A
4
4
T32
4
4
SKY
4
Z
E
B20
4
Z
E
N10
N10
B20
B20
4
Justice HortonPlaza
FST
OR
AN
GE
Z
E
N10
FST
MIDWAY
E
GST
G J
Z
GOLD
B20
N10
GST
GaslampCenter
EMBARCADEROSOUTH
Market St
CHILDREN’SMUSEUM
OLDPOLICEHQ
N10
Seaport Village
DOWNTOWNZONE
CabrilloNational
Monument
E
G J
Z
12th& Imperial
ORANGE
47th St
ORANGE
LE
RP
PU
ING
ND
LA
RY
FER
Gaslamp/
Convention
Ctr
BarrioLogan
J
E
BL
UE
N
ConventionCtrWest
N10
NorthIsland
Z
4
E10
Harborside
SOUTHBAYTERRACES
J
SouthFleet
N10
E20
E30
E40
E50
E55
PacificFleet
0
E55
E50
BLUE
E3
10
LD
GO PLE
R
PU
N10
Palomar
Z
4
C
C
C
N10
C20
Corky McMillin
N10
IBPIER
4
Z
4
Sunbow Heritage
Magdalena
N10
C20
Palm
Otay RanchTownCtr
N10
Z
E60
V10
IBGateway
Streetcar stop
E40
EUCNorth
N10
Coaster
Station
All “D”routes
stopat station
C10
D10
D10
D10
E40
C10
Southwestern
College
Iris
Airport service
V10
Z
D10
C10
Z
Terminal stop
(routeend)
E40
C10
Paseo
Ranchero
EUCSouth
4
Terminal
Station
(routeend)
D
Principal
arterial stop
C10
Z
Quickway
Station
Routestops
at thisstation
Onlyroutes
indicatedstop
at thisstation
C10
Tierra
Nova
E40
GOLD
C10
E40
PURPLE
HSt
E40
4
V10
V20
4
C
Beyer
C
Z
4
C
Otay MesaBorder
C
Otay MesaBorder
4
SanYsidro
V20
Z
© 2008 by The Mission Group
All rights reserved.
Z
The Coaster commuter rail connects Oceanside with
Downtown via Sorrento Valley.
Z
Commuter Rail
Arterial Operation
4
C
N
E/WTram
J
V
d
aR
nit
Bo
N/STram
W
B
V
Streetcars operate in select corridors in Downtown San
Diego and inner neighborhoods.
Stations & Stops
Spine Lines: CityXpress: Other:
ExpressOperation
(mostly within
Quickwaynetwork)
Bonita
Point
E50
E55
E
BLU
Streetcar Lines
A
Z
0
E3 0
E4
EscondidotoDowntownviaKearny Mesa
P
S
Tierra
del Rey
0
SanYsidrotoOldTownviaDowntown
E
Y
U
N
PlazaBonita
ESt
E6
EscondidotoDowntownviaGoldenTriangle
V
NorthCountyCoastal toUCSDviaCarmel Valley
BONITA
N10
4
OtayMesatoGoldenTriangleviaDowntown
SorrentoExpress
GaslampExpress
SantaFeExpressNorth
SantaFeExpressSouth
SanYsidroExpress
UCSDExpress
NavyExpress
PBExpress
SDSUExpress
Airport ExpressNorth
Airport ExpressSouth
PowayExpress
OBExpress
LaJolla/CoronadoExpress
Fun’n’SunLine
BonitaExpress
ChulaVistaExpress
Z
ElCajontoDowntownviaImperial Ave
T
G
F
E55
10
Automated shuttles (“horizontal elevators”) connect
these stations with satellite entrances.
OtayMesatoSorrentoMesaviaI-15
E20
E50
E55
N
CityXpress Lines offer rapid connectivity to major
destinations in the region. They operate in local or limitedstop mode along major streets and arterials, then enter
the Quickway network where they stop primarily at
principal stations, skipping many intermediate stations.
E30
ter
wa
eet
Sw
Shuttles
Spine Lines are high frequency routes that operate all day
and until late at night. They operate exclusively within
Quickway, light rail, or T-Way corridors.
Grossmont toSantaFeDepot viaMidCity
Manila
4
24thSt
CityXpress Lines
SDSUtoAirport viaMidCity
HighlandAve
PURPLE
Note: Thismapisfor illustrativeandplanningpurposesonly.
Significant changestoroutesarelikely astheplanisfurther refined.
SanteetoOldTownviaMissionValley
0
4
National City
Blvd
Z
Spine Lines
Green
Tan
Sky
Gold
Orange
Purple
Yellow
Lime
Blue
Red
E20
SPRINGVALLEY
Z
5
-80
&I
za 10
Pla N
DRAFT– JAN2008
8th St
N10
N10
GloriettaBay
E2
L
DE
TEL DO
HO RONA
CO
FAST Plan Service Map
E60
GOLD
E10
MOVESAN DIEGO, INC.
C20
4
3. Streetcar Routes, to provide surface connectivity within Downtown and
Figure A.4
Current draft of
near-in neighborhoods.
(nonoptimized) routes.
The most recent draft of the FAST Plan service network (figure A.4) illus- The map is intended
trates the complexity of a route network designed to meet the challenges of a
to be read at large
scale.
“dispersed origins to multiple destinations” network problem. Though “simpli-
ADVANCED NETWORK PLANNING FOR BUS RAPID TRANSIT · 89
GOLD
fied route structure” has
long been considered a deHazardCtr MissionValleyCtr RioVistaW
Stadium
RanchoMission
Grantville
Alvarado
sirable element of BRT
SDSU
planning, in Quickway
Fashion
Montezum
planning it becomes less of
Valley
a concern: Spine services
Texas 30th
33rd WilsonMCTIP
provide the “easy to underFairmount
Winona 54th Crawford
EdCenter
stand” introduction to serDMV
vices for new riders, but the
more complex CityXpress
Euclid
College
Alabama
services provide the daily
travel time savings and
University
Rainbow/
Egyptian
flexibility that retains rid&I-15
UptownDistrict
CityHeightsVillage
ers.
In the draft FAST Plan
CollegeGrove
BalboaPark/Prado
map, most zones of the
Central/South County are
served
by
CityXpress
routes which operate in arterials, then use (primarily) the Quickway network to
Figure A.5
Zoomed-in
view of
connect to the principal employment zones and other major destinations. Spine
section of draft
services provide all-day high-frequency connectivity along Quickways, and spe- route map, showing
cialized lines serve airport trips and the tourism market. The FAST Plan antici- Spine Lines (thicker
lines) and
pates further refinement of the transit route network as modeled data is reCityXpress routes.
viewed.
CityXpress routes
operating along
Stations for the FAST Plan were initially modeled along the lines of Busway
arterials are
stations in Brisbane, but a new station type—the Super Station—emerged in the
depicted by a thin
planning process. These are spaced along Quickways on average every three to
white line in the
middle of the
five miles, which serve all routes passing through, including CityXpress and
colored line; when
Spine Lines. These are where many transfers would be expected to take place. operating in express
mode, the lines are
They are mostly located at very major destinations, though there are a few excepsolid. CityXpress
tions.
routes are further
Super Stations work especially with CityXpress routes to create a unique regrouped by
destination: all T
gional rapid network in which many if not most CityXpress routes intersect most
routes serve the
other such routes, providing very extensive regional coverage in an express
Sorrento Mesa
framework—something that would prove impracticable with the existing light
technology center,
all G routes
rail network.
terminate at the
The FAST Plan has been going through continuous refinement since the ini- Gaslamp station, all
S routes serve San
tial infrastructure draft was produced in the Spring of 2006. In the Fall of 2007, an
Diego State
operational analysis was conducted of the second draft service network to ascerUniversity, and all F
tain ridership and operating cost impacts of the plan.
routes terminate at
the Santa Fe Depot
This analysis was performed using 2003 and 2030 trip tables supplied by
downtown.
SANDAG, though only transit trip tables (as opposed to total trip tables) were
available in time for the analysis. The major impact of this limitation was to depress likely ridership among trip pairs that currently have poor transit connectivity (and that would enjoy competitive transit connectivity in the new plan), so
the operational analysis was designed more to help guide continued service reF30
UNIVERSITYHEIGHTS– ADAMSAVE– NORMALHEIGHTS
CARTERI CTR
B20
4
MONTEZUMA RD
S10
F20
EMTNVW
T30
T32
T34
UNIVERSITYHTS
CMNODELRIOS
T30
4
T20
4
T20
4
4
4
4
4
4
4
4
SK
Y
4
4
T20
4
4
T32
T34
P20
T10
G10
UNIV
F10
30TH& UNIVERSITY
30TH& UPAS
30TH& JUNIPER
F10
T10
G10
P20
T10
T10
G10
G10
P20
F10 G10
F20 G20
F30
T30
T32
F10
4
G20
T34
F10
F20
F30
B20
T3
0
F20
G20
S10
T32
T10
T20
Ch T30
oc
taw
T20
T2
0
S1
0
T2
0
T20
4
S10
TAN
G50
G60
TROLLEYBARNPK
KENSINGTON
35TH& ADAMS
ANTIQUEROW
CMNODELARENIA
30TH& GRAPE
ADVANCED NETWORK PLANNING FOR BUS RAPID TRANSIT · 90
finement and ascertain a lower bound on the FAST Plan’s operating performance.
The operational analysis generally confirmed the viability and efficiency of
the Quickway model as applied in the FAST Plan to San Diego. The analysis projected a nearly trebling of transit use (again, this projection was made using only
an incomplete data set), though with a per-passenger operating subsidy significantly less than that of the current bus system and also less than that of the current light rail system. Certain Quickway segments (namely, the Quickway connecting Downtown with Mission Valley, and the “Broadway Extension” downtown) were projected to carry the highest ridership of any transit infrastructure
in the County. What’s more, these projections were made on a network that was
not yet optimized (for frequency, service span, and routing); such refinements
would be expected to significantly reduce projected operating subsidies, further
highlighting the ability of a Quickway infrastructure to change the operating cost
structure of transit services.
Move San Diego is continuing to refine and update the FAST Plan, even as
discussions have begun with and among regional leadership regarding plan
adoption. Still, the FAST Plan, having been developed by a team with international experience in Quickway design and implementation, and vetted by an engineering firm familiar with U.S. requirements, is a domestic proof-of-concept
that the Quickway model may indeed be cost-effectively applied to American
cities with the potential for significant, positive impacts.
ADVANCED NETWORK PLANNING FOR BUS RAPID TRANSIT · 91
Notes
While it is true that the Quickway model relies on buses, it is as much a distinct
mode as Light Rail Lite is from “city bus” service in that the interaction between infrastructure and services implies a distinct approach to planning and operations.
2 Pittsburgh’s Busways come the closest to this model within the U.S., but differ primarily in the attention paid to station design, pedestrian crossings, the provision of
downtown infrastructure, and in the extensive use of interlining to gain operational
efficiencies, a key virtue of Quickway-based systems.
3 See, for example, Gabrielle Birkner, “Answers to City’s Traffic Woes Could Arrive
Via Bogotá,” New York Sun, October 12, 2006.
4 See especially Roderick B. Diaz, editor, Characteristic of Bus Rapid Transit for DecisionMaking, U.S. Federal Transit Administration, 2004.
5 V R Vuchic, Urban Public Transportation: Systems and Technology (Prentice Hall:
Englewood Cliffs, NJ), 1981.
6 Pittsburgh’s Busways would not qualify as full Quickways under this definition, as
pedestrians cross at-grade within many stations, limiting top speeds through these
stations.
7 This framework, published in the previously cited CBRT document, is also discussed clearly in Mark A. Miller, Graham Carey, Ian McNamara, and Sam Zimmerman, “Development of Bus Rapid Transit Information Clearinghouse,” California
PATH Research Report (Berkeley: Institute of Transportation Studies, University of
California, Berkeley), May 2006.
8 James Mills, letter to the editor, San Diego Union-Tribune, March 15, 2001.
9 The author developed this framework for a long-range strategy study undertaken
for the San Diego Metropolitan Transit Development Board (MTDB) in 1999. It was
subsequently published in William Lieberman, David Schumacher, Alan Hoffman,
and Chris Wornum, “Creating a new century of transit opportunity: strategic planning for transit,” Transportation Research Record 1747, 2001, pp. 60-67.
10 The elimination, or reduction, of transfers is a major benefit of the Quickway
model. The literature on modal choice generally finds a fairly significant penalty that
potential customers assign to transfers; some regional travel models assign a specific
penalty for the fact of a transfer, others instead weight average transfer waiting time.
Still, the elimination of a transfer can have as dramatic a positive impact on ridership
as many far more expensive measures.
In addition, the environment in which a transfer is made, and the ease of such
transfer, may also be a factor having some influence on a person’s ultimate choice of
mode.
11 Both Brisbane and Bogotá have documented peak ridership exceeding that of any
light rail system in North America, and Ottawa matches that of the highest-volume
light rail system.
12 Source: www.ottawakiosk.com/people.html. Accessed on September 9, 2007.
13 For this and other data/background on the Ottawa system, the author is indebted
to Mr. John Bonsall, former General Manager of the OC Transpo system in Ottawa.
1
ADVANCED NETWORK PLANNING FOR BUS RAPID TRANSIT · 92
See also John Bonsall, “Implementing BRT: The Results,” presentation to the
TRB/APTA 2004 Bus Rapid Transit Conference.
14 A review of newspaper articles from Ottawa and discussions with planners familiar with the on-again, off-again light rail plan suggest that, unlike the original planning efforts which led to the development of the Transitway system, recent planning
has been driven less by the need to achieve targets and far more by political concerns.
15 Colin Leech, head of OC Transpo’s long-range planning section, quoted in Robert
Cervero, The Transit Metropolis: A Global Inquiry (Washington, D.C.: Island Press),
1998.
16 As reported by Tommy Au, David Nguyen, and Demetri Prevatt, “16th Avenue
North: The People’s Corridor,” 16corridor.com/case.html. Accessed on September 9,
2007. The discussion on transit mode share has generated a variety of points of view,
some of which claim that Calgary, for example, has been enjoying much higher rates
of increase in transit use than Ottawa, which otherwise has seen its mode share remain fairly stagnant. Still, it cannot be disputed that Ottawa has been able to maintain impressive levels of transit use at least in part due to the provision of extensive
and rapid transit connections, and that Calgary’s growth, though impressive, still
places it at a level significantly below Ottawa.
17 John Bonsall, op. cit.
18 Alasdair Cain, Georges Darido, Michael R. Baltes, Pilar Rodriguez, and Johan C.
Barrios, Applicability of Bogotá’s TransMilenio BRT System to the United States, Final Report (Tampa: National Bus Rapid Transit Institute, Center for Urban Transportation
Studies, University of South Florida), May 2006.
19 The author wishes to acknowledge the major contribution made by Ing. Liliana
Pereira and the entire planning staff at TransMilenio to this section. Additional sources reviewed include Instituto de Desarrollo Urbano, “Plan Marco Sistema: TransMilenio,” November, 2003; and Liliana Pereira, “Rediseño de Servicios Troncales para la
Fase 2 del Sistema TransMilenio,” Alcaldía Mayor de Bogotá, undated,
20 The phenomenon of “new” transfers was also observed in Brisbane; as transit networks make primary travel easier, through higher frequencies, more direct routes,
and faster travel times, and particularly as transfers take place within stations, more
passengers are willing to make new transit trips that involve transfers, particularly
for suburb-to-suburb trips.
21 The author wishes to acknowledge the major contribution that three individuals
made to this section: Barry Gyte of GCI Pty, Ltd., the Australian firm that is contracted to the Queensland Department of Transportation for planning and developing much of the Busway system; Mr. Brian Bothwell, Bus Services Manager for the
City of Brisbane, who supplied much in the way of background and data; and Mr.
John Bonsall of McCormick-Rankin International, who developed the initial Busway
plans for Brisbane.
22 A very small but vocal local group, the “Smogbusters,” agitated loudly for the
abandonment of busway concepts in favor of light rail. The very real success of the
Busways has made much of this opposition moot.
ADVANCED NETWORK PLANNING FOR BUS RAPID TRANSIT · 93
From an interview with Brian Bothwell, Bus Services Manager for the City of Brisbane, February 7, 2007.
24 “Another report into Brisbane's public buses has found services are overcrowded
and hundreds of passengers are being left behind. The demand for bus services in
Brisbane is growing at a rate of 12 percent each year.” from “Brisbane Council Bus
Services Fail to Meet the Grade,” Australasian Bus and Coach, January 23, 2007
25 Lachlan Heywood and Chris Jones, “City on Board for New Busways,” Brisbane
Courier-Mail, April 29, 2002.
26 Lachlan Heywood and Chris Jones, op. cit.
27 “DA Lodged for 32-Storey Office Tower in Brisbane CBD,” Brisbane Business Review, August 10, 2006.
28 A recent newspaper article alleges that the Southeast Busway is “approaching gridlock” under the existing operating plan. Edmund Bourke, “Busway Approaching
Gridlock,” Brisbane Sunday Courier, September 30, 2007.
29 Ibid.
30 From an interview with Brian Bothwell, Bus Services Manager for the City of Brisbane, February 7, 2007.
31 Ibid.
32 Ibid.
33 The author especially cites the observations offered in various interviews with
Barry Gyte of GCI Pty, Ltd., who is in charge of the planning for the Northern and
Eastern Busways.
34 It also implied a feeder system exogenous to the internalized network as the only
means of managing capacity at terminals and literally getting buses to fit into surrounding communities.
35 The author wishes to thank Graham Carey, BRT Project Manager of Lane Transit
District, for his input into this section.
36 It is a legitimate question whether smaller communities necessarily require fully
grade-separated Quickways to support a Quickway service model. Planners in Sarasota, Florida, for example, have been exploring the potential of a T-Way infrastructure to support what is essentially a modified Quickway operating plan.
37 The author wishes to thank both Rex Gephardt, Project Manager for the Metro
Rapid system, and Roderick Diaz, a consultant who worked extensively with Orange
Line planning, for their input to this section. Also of great use was Roderick Diaz,
“Metro Orange Line Benefits from Worldwide BRT Design Principles,” BRT
NewsLane (WestStart/Calstart), vol. 4, no. 5, p. 2.
38 Source: www.mta.net/news_info/ridership_avg.htm. Accessed on September 16,
2007.
39 Interview with Roderick Diaz, August 10, 2007.
40 Reports suggest that it was nearing its engineered capacity within two years of
opening, with ridership levels that were not expected for fifteen years. See Racher
Uranga, “Busway so Popular, It's Nearing Capacity,” LA Daily News, June 10, 2006.
41 Rong-Gong Lin II, “MTA Super Sizes Bus Service,” Los Angeles Times, August 25,
2007.
23
ADVANCED NETWORK PLANNING FOR BUS RAPID TRANSIT · 94
Interview with Leon Bukhin, Systems Engineering Project Manager for the Los
Angeles County Metropolitan Transportation Authority, November 14, 2007.
43 Source: “Metro joins elected officials in dedication of new 14-mile Metro Orange
Line,” MTA Press Release, October 28, 2005.
44 This theme is explored in great detail by Martin Wachs, “The Evolution of Transportation Policy in Los Angeles,” in Edward Soja and Allan Scott, eds., The City: Los
Angeles and Urban Theory at the End of the Twentieth Century (UC Press), 1996.
45 Interview with Leon Bukhin, op. cit.
46 The importance of other cities modeling transit solutions is apparently a major
theme in LA. Jonathon Richmond, in his doctoral dissertation at MIT, suggested that
LA’s pursuit of the Blue Line light rail was a direct response to San Diego’s being
able to “whip out” a light rail line previously; LA’s Metro Rapid is also widely credited to have been inspired by a tour of Curitiba’s BRT system.
47 Tony Barboza, “Fantasy Maps Re-Imagine Public Transit,” Los Angeles Times, May
1, 2007.
48 Again, what prevents Pittsburgh’s busways from being formally classified as
Quickways is their reliance on at-grade pedestrian crossings within stations, imposing significantly reduced operating speeds on express buses traveling through stations.
49 Source: “Quick Facts” for Busways, on www.portauthority.org.
50 Data supplied by David Wohlwill, Lead Transit Planner for the Port Authority of
Allegheny County.
51 David Wohlwill, “Transit-Oriented Development in a Changing Urban Corridor,”
presentation to the Rail~Volution conference, Chicago, November 7, 2006.
52 See, for example, Brandon Keat, “Group claims public transit is unequal,” Pittsburgh Tribune-Review, December 9, 2000.
53 Federal Transit Administration, “Bus Rapid Transit Demonstration Program: Miami-Dade Transit Agency—The South Miami-Dade Busway,” undated; Miami-Dade
County Government, “South Miami-Dade Busway,” at www.miamidade.gov/transit/south_miamidade_busway.asp.
54 Miami-Dade Country Transit, “Ridership Technical Report: Budget & Performance
Reporting,” May 2007.
55 The Busway-specific routes had until recently branched out to serve destinations
off-corridor beyond its southern terminus. Following the recent completion of the
extension of the Busway into Florida City, these routes no longer operate on regular
surface roads.
56 As a contracted service, minibuses were available to the agency at a cheaper perhour operating cost than standard transit buses.
57 Isabel Patron, “South Dade Busway Design,” presentation to the South MiamiDade Busway 2006 Design Conference.
58 Robert Cervero, The Transit Metropolis: A Global Inquiry (Washington, D.C.: Island
Press), 1998.
59 Specifically, to measure the influence of a transit network’s overall characteristic on
individual trip choices. Does the presence of a dense web of rapid transit services
help shape the individual’s choice of transit for any given trip?
42
ADVANCED NETWORK PLANNING FOR BUS RAPID TRANSIT · 95
A common theme among planners associated with the Quickway model is that
regional travel models become less and less useful or accurate for predicting ridership on services which differ fundamentally from existing services (particularly
when travel time savings change the fundamental competitive position of transit
relative to the automobile); their strength is in projecting marginal changes, not
wholesale changes. As a result, some cities interested in exploring the Quickway
model have contracted for specific market research to gauge public acceptance of the
concepts and elements and better project potential ridership.
61 Alan Hoffman of The Mission Group. Other team members included Barry Gyte of
GCI Pty. Ltd, which is responsible for the planning and development of Brisbane’s
Eastern and Northern Busways and Brian Bothwell of Brisbane City Enterprises; as
well as the staff of McCormick Rankin International of Toronto, Canada, and
Wendel-Duchscherer Architects & Engineers of Buffalo, New York.
62 At about this time, the Metropolitan Transit Service (MTS), the agency that took
over from the now-defunct MTDB, was undergoing a Comprehensive Operations
Analysis that led to similar findings.
63 This capital cost model was applied to the then-recently-completed Mission Valley
East light rail project, where it was found to significantly over-project the cost of that
project, even including ancillary elements. The run-up in construction costs over the
past several years has probably rendered even this cost model outdated at the present; still, the relative cost performance of the Quickway component of the FAST Plan
remains attractive compared to other modal alternatives.
64 It should be noted that, although most corridors and stations were located in public
rights of way, there are segments which were located on private land; cost for land
acquisition was not specifically factored in to the capital cost projections, though was
assumed to be covered by the contingency.
60
ADVANCED NETWORK PLANNING FOR BUS RAPID TRANSIT · 96

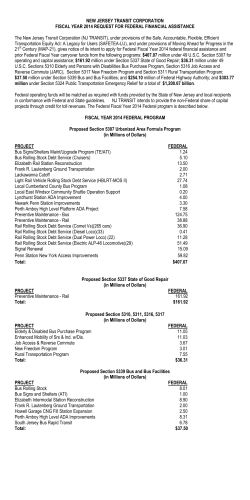
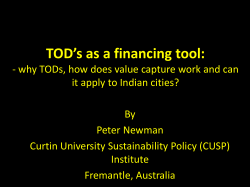

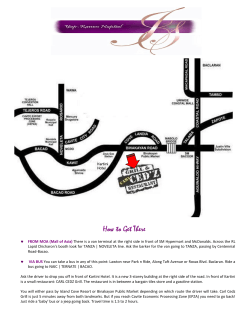

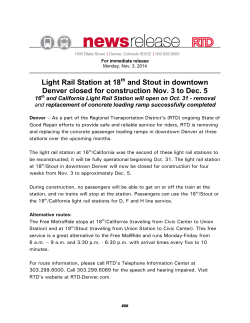

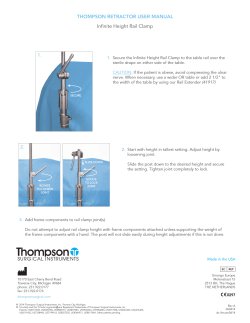
© Copyright 2026