
Package `beadarray`
Package ‘beadarray’
February 9, 2015
Title Quality assessment and low-level analysis for Illumina BeadArray
data
Version 2.16.0
Date 2014-09-11
Author Mark Dunning, Mike Smith, Jonathan Cairns, Andy Lynch, Matt Ritchie
Maintainer Mark Dunning <[email protected]>
Description The package is able to read beadlevel data (raw TIFFs and text files) output by BeadScan as well as beadsummary data from BeadStudio. Methods for quality assessment and lowlevel analysis are provided.
Depends R (>= 2.13.0), BiocGenerics (>= 0.3.2), Biobase (>= 2.17.8),
methods, ggplot2
Imports BeadDataPackR, limma, AnnotationDbi, stats4, reshape2,
GenomicRanges, IRanges, illuminaio
Suggests lumi, vsn, affy, hwriter, beadarrayExampleData,
illuminaHumanv3.db, gridExtra, BiocStyle,
TxDb.Hsapiens.UCSC.hg19.knownGene, ggbio, Nozzle.R1, knitr
License GPL-2
biocViews Microarray, OneChannel, QualityControl, Preprocessing
LazyData yes
VignetteBuilder knitr
R topics documented:
beadarray-package . . . . . . .
addFeatureData . . . . . . . . .
Annotation . . . . . . . . . . .
backgroundCorrectSingleSection
BASH . . . . . . . . . . . . . .
BASHCompact . . . . . . . . .
BASHDiffuse . . . . . . . . . .
BASHExtended . . . . . . . . .
.
.
.
.
.
.
.
.
.
.
.
.
.
.
.
.
.
.
.
.
.
.
.
.
.
.
.
.
.
.
.
.
.
.
.
.
.
.
.
.
1
.
.
.
.
.
.
.
.
.
.
.
.
.
.
.
.
.
.
.
.
.
.
.
.
.
.
.
.
.
.
.
.
.
.
.
.
.
.
.
.
.
.
.
.
.
.
.
.
.
.
.
.
.
.
.
.
.
.
.
.
.
.
.
.
.
.
.
.
.
.
.
.
.
.
.
.
.
.
.
.
.
.
.
.
.
.
.
.
.
.
.
.
.
.
.
.
.
.
.
.
.
.
.
.
.
.
.
.
.
.
.
.
.
.
.
.
.
.
.
.
.
.
.
.
.
.
.
.
.
.
.
.
.
.
.
.
.
.
.
.
.
.
.
.
.
.
.
.
.
.
.
.
.
.
.
.
.
.
.
.
.
.
.
.
.
.
.
.
.
.
.
.
.
.
.
.
.
.
.
.
.
.
.
.
.
.
.
.
.
.
.
.
. 3
. 3
. 4
. 6
. 7
. 10
. 12
. 14
R topics documented:
2
beadarrayUsersGuide . . . .
beadIntensityPlots . . . . . .
beadLevelData-class . . . .
BeadLevelList-class . . . . .
beadRegistrationData-class .
boxplot-methods . . . . . .
calculateDetection . . . . . .
calculateOutlierStats . . . .
checkRegistration . . . . . .
combine . . . . . . . . . . .
controlProbeDetection . . .
convertBeadLevelList . . . .
createTargetsFile . . . . . .
deprecatedFunctions . . . .
dim . . . . . . . . . . . . .
expressionQCPipeline . . . .
ExpressionSetIllumina-class
generateNeighbours . . . . .
getBeadData . . . . . . . . .
HULK . . . . . . . . . . . .
identifyControlBeads . . . .
illuminaChannel-class . . . .
illuminaOutlierMethod . . .
imageplot . . . . . . . . . .
imageProcessing . . . . . .
insertBeadData . . . . . . .
insertSectionData . . . . . .
limmaDE . . . . . . . . . .
limmaResults-class . . . . .
makeGEOSubmissionFiles .
makeQCProfile . . . . . . .
makeQCTable . . . . . . . .
medianNormalise . . . . . .
metaTemplate . . . . . . . .
metrics-methods . . . . . . .
noOutlierMethod . . . . . .
normaliseIllumina . . . . . .
numBeads . . . . . . . . . .
outlierplot . . . . . . . . . .
platformSigs . . . . . . . . .
plotBeadLocations . . . . .
plotChipLayout . . . . . . .
plotMA-methods . . . . . .
plotMAXY . . . . . . . . .
plotTIFF . . . . . . . . . . .
poscontPlot . . . . . . . . .
processSwathData . . . . . .
quickSummary . . . . . . .
.
.
.
.
.
.
.
.
.
.
.
.
.
.
.
.
.
.
.
.
.
.
.
.
.
.
.
.
.
.
.
.
.
.
.
.
.
.
.
.
.
.
.
.
.
.
.
.
.
.
.
.
.
.
.
.
.
.
.
.
.
.
.
.
.
.
.
.
.
.
.
.
.
.
.
.
.
.
.
.
.
.
.
.
.
.
.
.
.
.
.
.
.
.
.
.
.
.
.
.
.
.
.
.
.
.
.
.
.
.
.
.
.
.
.
.
.
.
.
.
.
.
.
.
.
.
.
.
.
.
.
.
.
.
.
.
.
.
.
.
.
.
.
.
.
.
.
.
.
.
.
.
.
.
.
.
.
.
.
.
.
.
.
.
.
.
.
.
.
.
.
.
.
.
.
.
.
.
.
.
.
.
.
.
.
.
.
.
.
.
.
.
.
.
.
.
.
.
.
.
.
.
.
.
.
.
.
.
.
.
.
.
.
.
.
.
.
.
.
.
.
.
.
.
.
.
.
.
.
.
.
.
.
.
.
.
.
.
.
.
.
.
.
.
.
.
.
.
.
.
.
.
.
.
.
.
.
.
.
.
.
.
.
.
.
.
.
.
.
.
.
.
.
.
.
.
.
.
.
.
.
.
.
.
.
.
.
.
.
.
.
.
.
.
.
.
.
.
.
.
.
.
.
.
.
.
.
.
.
.
.
.
.
.
.
.
.
.
.
.
.
.
.
.
.
.
.
.
.
.
.
.
.
.
.
.
.
.
.
.
.
.
.
.
.
.
.
.
.
.
.
.
.
.
.
.
.
.
.
.
.
.
.
.
.
.
.
.
.
.
.
.
.
.
.
.
.
.
.
.
.
.
.
.
.
.
.
.
.
.
.
.
.
.
.
.
.
.
.
.
.
.
.
.
.
.
.
.
.
.
.
.
.
.
.
.
.
.
.
.
.
.
.
.
.
.
.
.
.
.
.
.
.
.
.
.
.
.
.
.
.
.
.
.
.
.
.
.
.
.
.
.
.
.
.
.
.
.
.
.
.
.
.
.
.
.
.
.
.
.
.
.
.
.
.
.
.
.
.
.
.
.
.
.
.
.
.
.
.
.
.
.
.
.
.
.
.
.
.
.
.
.
.
.
.
.
.
.
.
.
.
.
.
.
.
.
.
.
.
.
.
.
.
.
.
.
.
.
.
.
.
.
.
.
.
.
.
.
.
.
.
.
.
.
.
.
.
.
.
.
.
.
.
.
.
.
.
.
.
.
.
.
.
.
.
.
.
.
.
.
.
.
.
.
.
.
.
.
.
.
.
.
.
.
.
.
.
.
.
.
.
.
.
.
.
.
.
.
.
.
.
.
.
.
.
.
.
.
.
.
.
.
.
.
.
.
.
.
.
.
.
.
.
.
.
.
.
.
.
.
.
.
.
.
.
.
.
.
.
.
.
.
.
.
.
.
.
.
.
.
.
.
.
.
.
.
.
.
.
.
.
.
.
.
.
.
.
.
.
.
.
.
.
.
.
.
.
.
.
.
.
.
.
.
.
.
.
.
.
.
.
.
.
.
.
.
.
.
.
.
.
.
.
.
.
.
.
.
.
.
.
.
.
.
.
.
.
.
.
.
.
.
.
.
.
.
.
.
.
.
.
.
.
.
.
.
.
.
.
.
.
.
.
.
.
.
.
.
.
.
.
.
.
.
.
.
.
.
.
.
.
.
.
.
.
.
.
.
.
.
.
.
.
.
.
.
.
.
.
.
.
.
.
.
.
.
.
.
.
.
.
.
.
.
.
.
.
.
.
.
.
.
.
.
.
.
.
.
.
.
.
.
.
.
.
.
.
.
.
.
.
.
.
.
.
.
.
.
.
.
.
.
.
.
.
.
.
.
.
.
.
.
.
.
.
.
.
.
.
.
.
.
.
.
.
.
.
.
.
.
.
.
.
.
.
.
.
.
.
.
.
.
.
.
.
.
.
.
.
.
.
.
.
.
.
.
.
.
.
.
.
.
.
.
.
.
.
.
.
.
.
.
.
.
.
.
.
.
.
.
.
.
.
.
.
.
.
.
.
.
.
.
.
.
.
.
.
.
.
.
.
.
.
.
.
.
.
.
.
.
.
.
.
.
.
.
.
.
.
.
.
.
.
.
.
.
.
.
.
.
.
.
.
.
.
.
.
.
.
.
.
.
.
.
.
.
.
.
.
.
.
.
.
.
.
.
.
.
.
.
.
.
.
.
.
.
.
.
.
.
.
.
.
.
.
.
.
.
.
.
.
.
.
.
.
.
.
.
.
.
.
.
.
.
.
.
.
.
.
.
.
.
.
.
.
.
.
.
.
.
.
.
.
.
.
.
.
.
.
.
.
.
.
.
.
.
.
.
.
.
.
.
.
.
.
.
.
.
.
.
.
.
.
.
.
.
.
.
.
.
.
.
.
.
.
.
.
.
.
.
.
.
.
.
.
.
.
.
.
.
.
.
.
.
.
.
.
.
.
.
.
.
.
.
.
.
.
.
.
.
.
.
.
.
.
.
.
.
.
.
.
.
.
.
.
.
.
.
.
.
.
.
.
.
.
.
.
.
.
.
.
.
.
.
.
.
.
.
.
.
.
.
.
.
.
.
.
.
.
.
.
.
.
.
.
.
.
.
.
.
.
.
.
.
.
.
.
.
.
.
.
.
.
.
.
.
.
.
.
.
.
.
.
.
.
.
.
.
.
.
.
.
.
.
.
.
.
.
.
.
.
.
.
.
.
.
.
.
.
.
.
.
.
.
.
.
.
.
.
.
.
.
.
.
.
.
.
.
.
.
.
.
.
.
.
.
.
.
.
.
.
.
.
.
.
.
.
.
.
.
.
.
.
.
.
.
.
.
.
.
.
.
.
.
.
.
.
.
.
.
.
.
.
.
.
.
.
.
.
.
.
.
.
.
.
.
.
.
.
.
.
.
.
.
.
.
.
.
.
.
.
.
.
.
.
.
.
.
.
.
.
.
.
.
.
.
.
.
.
.
.
.
.
.
.
.
.
.
.
.
.
.
.
.
.
.
.
.
.
.
.
.
.
.
.
.
.
.
.
.
.
.
.
.
.
.
.
.
.
.
.
.
.
.
.
.
.
.
.
.
.
.
.
.
.
.
.
.
.
.
.
.
.
.
.
.
.
.
.
.
.
.
.
.
.
.
.
.
.
.
.
.
.
.
.
.
.
.
.
.
.
.
.
.
.
.
.
.
.
.
.
.
.
.
.
.
.
.
.
.
.
.
.
.
.
.
.
.
.
.
.
.
.
.
.
.
.
.
.
.
.
.
.
.
.
.
.
.
.
.
.
.
.
.
.
.
.
.
.
.
.
.
.
.
.
.
.
.
.
.
.
.
.
.
.
.
.
.
.
.
.
.
.
.
.
.
.
.
.
.
.
.
.
.
.
.
.
.
.
.
.
.
.
.
.
.
15
16
17
19
19
20
21
23
24
25
26
27
28
30
30
31
32
33
34
35
37
38
39
40
42
43
44
45
46
46
48
49
50
51
51
52
53
55
56
57
57
58
59
60
61
63
64
65
beadarray-package
3
readBeadSummaryData . .
readIdatFiles . . . . . . .
readIllumina . . . . . . . .
readLocsFile . . . . . . .
readSampleSheet . . . . .
readTIFF . . . . . . . . .
sectionNames . . . . . . .
setWeights . . . . . . . . .
show-method . . . . . . .
showArrayMask . . . . . .
squeezedVarOutlierMethod
summarize . . . . . . . . .
transformFunctions . . . .
weightsOutlierMethod . .
.
.
.
.
.
.
.
.
.
.
.
.
.
.
.
.
.
.
.
.
.
.
.
.
.
.
.
.
.
.
.
.
.
.
.
.
.
.
.
.
.
.
.
.
.
.
.
.
.
.
.
.
.
.
.
.
.
.
.
.
.
.
.
.
.
.
.
.
.
.
.
.
.
.
.
.
.
.
.
.
.
.
.
.
.
.
.
.
.
.
.
.
.
.
.
.
.
.
.
.
.
.
.
.
.
.
.
.
.
.
.
.
.
.
.
.
.
.
.
.
.
.
.
.
.
.
.
.
.
.
.
.
.
.
.
.
.
.
.
.
.
.
.
.
.
.
.
.
.
.
.
.
.
.
.
.
.
.
.
.
.
.
.
.
.
.
.
.
.
.
.
.
.
.
.
.
.
.
.
.
.
.
.
.
.
.
.
.
.
.
.
.
.
.
.
.
.
.
.
.
.
.
.
.
.
.
.
.
.
.
.
.
.
.
.
.
.
.
.
.
.
.
.
.
.
.
.
.
.
.
.
.
.
.
.
.
.
.
.
.
.
.
.
.
.
.
.
.
.
.
.
.
.
.
.
.
.
.
.
.
.
.
.
.
.
.
.
.
.
.
.
.
.
.
.
.
.
.
.
.
.
.
.
.
.
.
.
.
.
.
.
.
.
.
.
.
.
.
.
.
.
.
.
.
.
.
.
.
.
.
.
.
.
.
.
.
.
.
.
.
.
.
.
.
.
.
.
.
.
.
.
.
.
.
.
.
.
.
.
.
.
.
.
.
.
.
.
.
.
.
.
.
.
.
.
.
.
.
.
.
.
.
.
.
.
.
.
.
.
.
.
.
.
.
.
.
.
.
.
.
.
.
.
.
.
.
.
.
.
.
.
.
.
.
.
.
.
.
.
.
.
.
.
.
.
.
.
.
.
.
.
.
.
.
.
.
.
.
.
.
.
.
.
.
.
.
.
.
.
.
.
.
.
.
.
.
.
.
.
.
.
.
.
.
.
.
.
.
.
.
.
.
.
.
.
.
.
.
.
.
.
.
Index
beadarray-package
66
69
70
72
72
73
74
75
76
77
78
79
81
82
84
The beadarray package: a tool for low-level analysis of Illumina
BeadArrays
Description
The beadarray package: a tool for low-level analysis of Illumina BeadArrays
Author(s)
Mark Dunning, Mike Smith, Jonathan Cairns, Matt Richie, Andy Lynch
addFeatureData
Add probe data
Description
Adds extra probe-specific data to an ExpressionSetIllumina object using an installed annotation
package
Usage
addFeatureData(data, toAdd = c("SYMBOL", "PROBEQUALITY",
"CODINGZONE", "PROBESEQUENCE"), annotation = NULL)
4
Annotation
Arguments
data
An ExpressionSetIllumina object
toAdd
Either a pre-prepared data frame, or characters which refer to mappings within
an annotation pacakge
annotation
Optional character identifying the annotation of the ExpressionSetIllumina object. e.g. Humanv3, Mousev2.
Details
The function will identify which package should be used by concatenating the character string
illumina with the value of the annotation slot of the object, or the annotation argument passed in. If
this package is not installed on the users computer, then the function will fail.
Assuming the package has been correctly loaded, the character vector toAdd is converted to the
names of environments within the package. These environments are then queried with the featureNames
of the input object. The result of each query is converted to a data frame and merged with the original feature data of the object.
Alternatively, rather than querying from an annotation pacakge, a pre-prepared data frame can be
used.
Value
An ExpressionSetIllumina object with modified featureData
Examples
if(require(beadarrayExampleData)){
data(exampleSummaryData)
exampleSummaryData <- addFeatureData(exampleSummaryData)
head(fData(exampleSummaryData))
}
Annotation
Storage of annotation information
Description
An interface to set or retrieve information about the annotation of a beadLevelData or ExpressionSetIllumina
object.
Usage
suggestAnnotation(data,verbose=FALSE)
annotation(object,...)
Annotation
5
Arguments
data
An object of class beadLevelData-class.
verbose
If TRUE, report overlaps with known platforms
object
Either a beadLevelData-class or ExpressionSetIllumina-class
...
Extra arguments used by annotation
Details
A character string is used to specify the annotation with the currently supported values being; Humanv4, Humanv3, Humanv2, Humanv1, Mousev2, Mousev1, Mousev1p1 and Ratv1. This string is
used within beadarray to retrieve control probe IDs within particular QC functions.
The suggestAnnotation function tries to determine a suitable value for a beadLevelData-class
based on the probe IDs and compiled list of IDs from all expression platforms. This is based on
the percentage of IDs on the array that overlap with IDs from known platforms. The platform with
highest overlap is chosen.
Author(s)
Mark Dunning
Examples
if(require(beadarrayExampleData)){
data(exampleBLData)
annotation(exampleBLData)
suggestAnnotation(exampleBLData,verbose=TRUE)
annotation(exampleBLData) <- "Humanv2"
data(exampleSummaryData)
annotation(exampleSummaryData)
annotation(exampleBLData) <- "Humanv1"
}
6
backgroundCorrectSingleSection
backgroundCorrectSingleSection
Background correct an array-section
Description
Function to perform a basic bead-level background correction using a defined set of foreground and
background intensities.
Usage
backgroundCorrectSingleSection(BLData, array = 1, fg="Grn", bg="GrnB", newName = "Grn.bc")
Arguments
BLData
a beadLevelData object
array
the number of the array-section to be corrected
fg
the name under which the foreground intensities are stored
bg
the name under which the background intensities are stored
newName
Name to store the corrected intensities
Details
This function takes two attributes of a bead-level object and returns that bead-level object with an
additional attribute consisting of the difference of the other two. We anticipate this being used as
a simple background correction step, returning the difference between foreground and background
intensities to be used as the specific intensity associated with a bead.
Functions to perform more advanced background correction steps can easily be constructed after
consideration of this function.
Value
beadLevelData object with modified beadData slot for the particular section
Author(s)
Mark Dunning
Examples
## Not run:
if(require(beadarrayExampleData)){
data(exampleBLData)
BASH
7
head(exampleBLData[[1]])
for(i in 1:2){
exampleBLData = backgroundCorrectSingleSection(exampleBLData, array=i)
}
head(exampleBLData[[1]])
} else {
stop("You will need the beadarrayExampleData package to run this example")
}
## End(Not run)
BASH
BASH - BeadArray Subversion of Harshlight
Description
BASH is an automatic detector of physical defects on an array. It is designed to detect three types
of defect - COMPACT, DIFFUSE and EXTENDED.
Usage
BASH(BLData, array, neighbours=NULL, transFun = logGreenChannelTransform,
outlierFun = illuminaOutlierMethod, compn=3, wtsname=NULL, compact = TRUE,
diffuse = TRUE, extended = TRUE, cinvasions = 10, dinvasions = 15,
einvasions = 20, bgcorr = "median", maxiter = 10, compcutoff = 8,
compdiscard = TRUE, diffcutoff = 10, diffsig = 0.0001, diffn = 3,
difftwotail = FALSE, useLocs = TRUE, ...)
Arguments
BLData
BeadLevelList
array
integer specifying which section/array to plot.
neighbours
the user may specify the neighbours matrix, rather than have BASH calculate
it. Time can be saved if using BASH and HULK, by calculating the neighbours
matrix once and passing it to the two functions.
transFun
function to use to transform data prior to running BASH
outlierFun
the choice of outlier calling function to use.
compn
Numerical - when finding outliers in the compact analysis, how many MADs
away from the median (for example) an intensity must be for it to be labelled an
outlier.
8
BASH
wtsname
name under which bead weights are stored in the BLData object. It is only
necessary to specify this if a) weights have already been set, and b) you wish
BASH to observe them.
compact
Logical - Perform compact analysis?
diffuse
Logical - Perform diffuse analysis?
extended
Logical - Perform extended analysis?
cinvasions
Integer - number of invasions used whenever closing the image - see BASHCompact
dinvasions
Integer - number of invasions used in diffuse analysis, to find the kernel - see
BASHDiffuse
einvasions
Integer - number of invasions used when filtering the error image - see BGFilter.
bgcorr
One of "none", "median", "medianMAD" - Used in diffuse analysis, this determines how we attempt to compensate for the background varying across an
array. For example, on a SAM array this should be left at "median", or maybe
even switched to "none", but if analysing a large beadchip then you might consider setting this to "medianMAD". (this code is passed to the method argument
of BGFilter). Note that "none" may be the correct setting if HULK has already
been applied.
maxiter
Integer - Used in compact analysis - the max number of iterations allowed. (Exceeding this results in a warning.)
compcutoff
Integer - the threshold used to determine whether a group of outliers is in a compact defect. In other words, if a group of at least this many connected outliers is
found, then it is labelled as a compact defect.
compdiscard
Logical - should we discard compact defect beads before doing the diffuse analyis?
diffcutoff
Integer - this is the threshold used to determine the minimum size that clusters
of diffuse defects must be.
diffsig
Probability - The significance level of the binomial test performed in the diffuse
analysis.
diffn
Numerical - when finding outliers on the diffuse error image, how many MADs
away from the median an intensity must be for it to be labelled an outlier.
difftwotail
Logical - If TRUE, then in the diffuse analysis, we consider the high outlier and
low outlier images seperately.
useLocs
Logical - If TRUE then a .locs file corresponding to the array is sought and, if
found, used to identify the neighbouring beads. If FALSE the neighbours are
infered algorithmically. See generateNeighbours for more details.
...
Logical - Perform compact analysis?
Details
The BASH pipeline function performs three types of defect analysis on an image.
The first, COMPACT DEFECTS, finds large clusters of outliers, as per BASHCompact. The outliers
are found using findAllOutliers(). We then find which outliers are clustered together. This
process is iterative - having found a compact defect, we remove it, and then see if any more defects
are found.
BASH
9
The second, DIFFUSE DEFECTS, finds areas which are densely populated with outliers (which
are not necessarily connected), as per BASHDiffuse. To make this type of defect more obvious,
we first generate an ERROR IMAGE, and then find outliers based on this image. (The error image
is calculated by using method = "median" and bgfilter = "medianMAD" in generateE, unless
ebgcorr = FALSE in which case we use bgfilter = "median".) Now we consider a neighbourhood
around each bead and count the number of outlier beads in this region. Using a binomial test we
determine whether this is more that we would expect if the outliers were evenly spread over the
entire array. If so, we mark it as a diffuse defect. (A clustering algorithm similar to the compact
defect analysis is run to reduce false positives.)
After each of these two analyses, we "close" the image, filling in gaps.
The third, EXTENDED DEFECTS, returns a score estimating how much the background is changing across an array, as per BASHExtended. To estimate the background intensity, we generate an error image using the median filter (i.e. generateE with method = "median" and bgfilter = "median").
We divide the variance of this by the variance of an error image without using the median filter, to
obtain our extended score.
It should be noted that to avoid repeated computation of distance, a "neighbours" matrix is used in
the analysis. This matrix describes which beads are close to other beads. If a large number of beads
are missing (for example, if beads with ProbeID = 0 were discarded) then this algorithm may be
affected.
For more detailed descriptions of the algorithms, read the help files of the respective functions listed
in "see also".
BASH is currently quite a slow, memory-intensive function. It will only run on a single array at a
time, and for analysis of multiple arrays, we recommend parallelising the command. An example
is shown using the base parallel package.
Value
The output is a list with four attributes:
wts: A vector of weights for the matrix.
ext: A vector of extended scores (null if the extended analysis was disabled).
QC: A summary of the extended score and the number of beads masked.
call: The function you used to call BASH.
Author(s)
Jonathan Cairns
References
J. M. Cairns, M. J. Dunning, M. E. Ritchie, R. Russell, and A. G. Lynch (2008). BASH: a tool for
managing BeadArray spatial artefacts. Bioinformatics 15; 24(24)
See Also
BASHCompact, BASHDiffuse, BASHExtended, generateNeighbours, HULK
10
BASHCompact
Examples
## Not run:
if(require(beadarrayExampleData)){
data(exampleBLData)
output <- BASH(exampleBLData,array=1,useLocs=FALSE)
exampleBLData <- setWeights(exampleBLData, output$wts, array=1) #apply BASH weights to exampleBLData
###BASH only accepts one array at a time, but it can be made to run in a parallel fashion
library(parallel)
output <- mclapply(c(1,2), function(x) BASH(exampleBLData, array=x, useLocs=FALSE))
for(i in 1:2){
exampleBLData <- setWeights(exampleBLData, output[[i]]$wts, array=i)
}
#diffuse test is stricter
output <- BASH(exampleBLData, diffsig = 0.00001,array=1, useLocs=FALSE)
#more outliers on the error image are used in the diffuse analysis
output <- BASH(exampleBLData, diffn = 2,array=1, useLocs=FALSE)
#only perform compact & diffuse analyses (we will only get weights)
output <- BASH(exampleBLData, extended = FALSE,array=1, useLocs=FALSE)
#attempt to correct for background.
output <- BASH(exampleBLData, bgcorr = "median",array=1, useLocs=FALSE)
}
else{
stop("You will need the beadarrayExampleData package to run this example")
}
## End(Not run)
BASHCompact
BASH - Compact Defect Analysis
Description
Creates a list of probes marked as being in compact defects.
BASHCompact
11
Usage
BASHCompact(inten, probeIDs, neighbours = NULL, wts=1, n=3, maxiter = 10, cutoff = 8, cinvasions = 10, o
Arguments
inten
the (transformed) intensities associated with beads on an array.
probeIDs
the probe identities associated with those beads (i.e. indicating which beads are
of which sort)
neighbours
A Neighbours matrix such as that generated by generateNeighbours. Compulsory - the function will no longer generate this for you.
wts
weights indicating any beads to be masked in calculations.
n
Specify a cut-off for outliers (e.g. as n median absolute deviations (MADs) from
the median). The default value is 3
maxiter
Integer - Maximum number of iterations.
cutoff
Integer - Size a cluster must be to be labelled a compact defect.
cinvasions
Integer - Number of invasions used when closing the image.
outlierFun
the choice of outlier calling function to use.
...
Additional arguments to be passed to outmeth.
Details
BASHCompact finds "compact defects" on an array. A compact defect is defined as a large connected
cluster of outliers.
This function first finds the outliers on an array. This is done via the user’s choice of function (e.g.
illuminaOutlierMethod or squeezedVarOutlierMethod.
Next, using the Neighbours matrix and a Flood Fill algorithm, it determines which beads are in
large connected clusters of outliers (of size larger than cutoff). These beads are then temporarily
removed and the process repeated with the remaining beads. The repetition continues until either
no large clusters of outliers remain, or until we have repeated the process maxiter times (and in
this case, a warning will be given). In this way, we obtain a list of defective probes.
Finally, we "close" the image, to fill in small gaps in the defect image. This consists of a "dilation"
and an "erosion". In the dilation, we expand the defect image, by adding beads adjacent to defective
beads into the defect image. This is repeated cinvasions times. In the erosion, we contract the
defect image, by removing beads adjacent to non-defective beads from the defect image. (Erosion
of the defect image is equivalent to a dilation of the non-defective image.)
Value
A vector consisting of the BeadIDs of beads labelled as compact defects.
Author(s)
Jonathan Cairns
12
BASHDiffuse
References
J. M. Cairns, M. J. Dunning, M. E. Ritchie, R. Russell, and A. G. Lynch (2008). BASH: a tool for
managing BeadArray spatial artefacts. Bioinformatics 15; 24(24)
See Also
BASH, generateNeighbours
Examples
## Not run:
if(require(beadarrayExampleData)){
data(exampleBLData)
o <- BASHCompact(getBeadData(exampleBLData,array=1,what="Grn"), getBeadData(exampleBLData,array=1,what="ProbeIDs
o <- BASHCompact(getBeadData(exampleBLData,array=1,what="Grn"), getBeadData(exampleBLData,array=1,what="ProbeIDs
o <- BASHCompact(getBeadData(exampleBLData,array=1,what="Grn"), getBeadData(exampleBLData,array=1,what="ProbeIDs
}
## End(Not run)
BASHDiffuse
BASH - Diffuse Defect Analysis
Description
Creates a list of probes marked as being in diffuse defects.
Usage
BASHDiffuse(inten, probeIDs, wts=NULL, neighbours = NULL, E = NULL, n = 3,
compact = NULL, sig = 0.0001, invasions = 10, cutoff = 8, cinvasions = 10,
twotail = FALSE, einvasions = 20, outlierFun = illuminaOutlierMethod, ...)
Arguments
inten
the (transformed) intensities associated with beads on an array.
probeIDs
the probe identities associated with those beads (i.e. indicating which beads are
of which sort)
wts
weights indicating any beads to be masked in calculations.
neighbours
A Neighbours matrix such as that generated by generateNeighbours. Compulsory - the function will no longer generate this for you.
BASHDiffuse
13
E
Numerical vector - The error image to use. Optional - if left blank, it will be
computed, using generateE using bgfilter = "median".
n
Specify a cut-off for outliers (e.g. as n median absolute deviations (MADs) from
the median). The default value is 3
compact
Vector - Optional. BeadIDs of beads in compact defects to remove from the
analysis.
sig
Numerical - Significance level of binomial test.
invasions
Integer - Number of invasions to use to find the kernel (see below).
cutoff
Integer - Size a cluster must be to be labelled a diffuse defect.
cinvasions
Integer - Number of invasions used when closing the image.
twotail
Logical - If TRUE, then we analyse positive and negative outliers separately,
and then combine the diffuse defect images at the end.
einvasions
Integer - Number of invasions used when forming the error image E.
outlierFun
the choice of outlier calling function to use.
...
Additional arguments to be passed to outmeth.
Details
BASHDiffuse finds "diffuse defects" on an array. A diffuse defect is defined as a region containing
an unusually large number of (not necessarily connected) outliers.
Firstly, we consider the error image E, and find outlier beads on this image. Outliers for a particular
bead type are determined using a 3 MAD cut-off from the median.
We now consider an area around each bead (known as the "kernel"). The kernel is found by an
invasion process using the neighbours matrix - we choose the beads which can be reached from the
central bead in cinvasions steps.
We count how many beads are in the kernel, and how many of these are marked as outliers. Using
a binomial test, we work out if there are significantly more outliers in the kernel than would be
expected if the outliers were equally distributed over the entire array. If so, then the central bead is
marked as a diffuse defect.
Lastly, we run a clustering algorithm and a closing algorithm similar to those in BASHCompact.
Value
A vector consisting of the BeadIDs of beads considered diffuse defects.
Author(s)
Jonathan Cairns
References
J. M. Cairns, M. J. Dunning, M. E. Ritchie, R. Russell, and A. G. Lynch (2008). BASH: a tool for
managing BeadArray spatial artefacts. Bioinformatics 15; 24(24)
14
BASHExtended
See Also
BASH, generateNeighbours
Examples
## Not run:
if(require(beadarrayExampleData)){
data(exampleBLData)
o <- BASHDiffuse(getBeadData(exampleBLData,array=1,what="Grn"), getBeadData(exampleBLData,array=1,what="ProbeIDs
o <- BASHDiffuse(getBeadData(exampleBLData,array=1,what="Grn"), getBeadData(exampleBLData,array=1,what="ProbeIDs
o <- BASHDiffuse(getBeadData(exampleBLData,array=1,what="Grn"), getBeadData(exampleBLData,array=1,what="ProbeIDs
}
## End(Not run)
BASHExtended
BASH - Extended Defect Analysis
Description
Returns a score, which assesses the extent to which the background is changing across the array/strip.
Usage
BASHExtended(BLData, array, transFun = logGreenChannelTransform, neighbours = NULL, useLocs = TRUE, E =
Arguments
BLData
array
transFun
neighbours
useLocs
E
E.BG
BeadLevelList
integer specifying which section/array to analyse
Function to use to transform data prior to running BASH.
A Neighbours matrix. Optional - if left NULL, it will be computed, using default
generateNeighbours settings.
Logical value, specifiying whether the .locs file (if present) should be used to
determine neighbours.
Numerical vector - The error image to use. Optional - if left blank, it will be
computed, using generateE (with bgfilter = "none", i.e. no background
filter applied).
Numerical vector - The background error image to use. Optional - if left blank, it
will be computed from E, using default BGFilter settings (i.e. method = "median").
beadarrayUsersGuide
15
Details
BASHExtended assesses the change of background across an array.
The error image used should not be background filtered (as opposed to the error image used in
BASHDiffuse). Here, E is the error image
Value
Scalar (Extended defect score)
Author(s)
Jonathan Cairns
References
J. M. Cairns, M. J. Dunning, M. E. Ritchie, R. Russell, and A. G. Lynch (2008). BASH: a tool for
managing BeadArray spatial artefacts. Bioinformatics 15; 24(24)
See Also
BASH, generateNeighbours,
Examples
## Not run:
if(require(beadarrayExampleData)){
data(exampleBLData)
extended <- BASHExtended(exampleBLData, 1)
}
## End(Not run)
beadarrayUsersGuide
View beadarray User’s Guide
Description
Finds the location of the beadarray User’s Guide and opens it.
16
beadIntensityPlots
Usage
beadarrayUsersGuide(view=TRUE, topic="beadlevel")
Arguments
view
logical, should the document be opened using the default PDF document reader?
(default is TRUE)
topic
character string specifying topic ("beadlevel", "beadsummary" or "BASH")
Details
The function vignette("beadarray") will find the short beadarray vignette which describes how
to obtain the more detailed user’s guide on the analysis of raw "beadlevel" data, "beadsummary"
data or how to use the "BASH" method for detecting spatial artefacts.
Value
Character string giving the file location.
Author(s)
Matt Ritchie
Examples
beadarrayUsersGuide(view=FALSE)
beadarrayUsersGuide(view=FALSE, topic="beadsummary")
beadIntensityPlots
Plotting the intensities of selected beads on a section
Description
The function will plot the intensities of selected beads on a specified array
Usage
plotBeadIntensities(BLData, array = 1, BeadIDs, transFun = logGreenChannelTransform, cols = NULL, ...)
Arguments
BLData
a beadLevelData object
array
numeric specifying which array to plot the intensities from
BeadIDs
what ArrayAddress IDs to be plotted
transFun
function specifying what transformation to be applied to the beadLevelData
prior to plotting
beadLevelData-class
cols
...
17
a vector of colours to be used to plot each ID. If NULL the rainbow function is
used to generate colours.
other argument that may be passed along to plot.
Details
The function will take all data from the specified section, apply the transformation (the default is to
do log2) and then find the subset of beads that have the specified ID. These IDs should match the
numeric ArrayAddress IDs that are stored in the beadLevelData object.
Value
Plot is produced on current graphical device.
Author(s)
Mark Dunning
Examples
if(require(beadarrayExampleData)){
data(exampleBLData)
randIDs = sample(getBeadData(exampleBLData, array=1, what="ProbeID"),10)
plotBeadIntensities(exampleBLData, array=1, BeadIDs = randIDs)
}
beadLevelData-class
Class "beadLevelData"
Description
A class for storing red and green channel foreground and background intensities from an Illumina
experiment.
Objects from the Class
Objects can be created by calls of the form new("beadLevelData"), but are usually created by
readIllumina.
Slots/List Components
Objects of this class contain the following slots
18
beadLevelData-class
beadData:
sectionData:
experimentData:
history:
A list of arrays, indexed by array name. Each item in this list is itself a list, containing enviroments holdin
a list containing information. Each item in the list is a data frame containing one row for each section
a list containing the annotation of the platform, link to the sdf file and type of data (slide or Sentrix Array
Character vector storing the operations performed on this object.
Methods
show(beadLevelData) Printing method for BeadLevelList
sectionNames(object,arrays=NULL) Returns the strip/array names from a
numBeads(object,arrays=NULL) Returns the number of beads on selected arrays
Accessing data from the class
getBeadData retrieve data
insertBeadData Input or modify existing data
Author(s)
Mark Dunning, Mike Smith
See Also
readIllumina
Examples
if(require(beadarrayExampleData)){
data(exampleBLData)
sectionNames(exampleBLData)
head(exampleBLData[[1]])
getBeadData(exampleBLData, array=1, what="Grn")[1:10]
}
beadRegistrationData-class
BeadLevelList-class
19
Class "BeadLevelList"
Description
A class for storing red and green channel foreground and background intensities from an Illumina
experiment.
Objects from the Class
Objects can be created by calls of the form new("BeadLevelList"), but are usually created by
readIllumina.
Slots/List Components
Objects of this class contain the following slots
beadData:
phenoData:
arrayInfo:
annotation:
an environment for storing the raw bead-level data. Each row correspond to a bead and columns the data.
an ’AnnotatedDataFrame’ containing experimental information.
a list containing array information.
character storing annotation package information.
Methods
arrayNames(object,arrays=NULL) Returns the strip/array names from a BeadLevelList object
for selected arrays
getArrayData(object,what="G",log=TRUE) Retrieves the what intensities on the log scale from
the BeadLevelList
Author(s)
Mark Dunning and Matt Ritchie
beadRegistrationData-class
Class "beadRegistrationData"
Description
A class for storing information relating to the registration of the image.
Slots/List Components
Objects of this class contain the following slots
20
boxplot-methods
layout:
registrationData:
coordinateData:
cornerData:
p95:
imageLocations:
metrics:
A list entry containing details of the structure of a BeadChip. By default entries for the number of secti
A list with length equal to the total number of segments registered. Each entry contains a vector of the
A list with length equal to the total number of segments registered. Each entry contains the coordinates
A list with length equal to the total number of segments registered. Each entry contains a set of four co
A numeric vector storing the 95th percentile of bead intensities within each segment.
Character vector storing the location of the tiff images of the array. These are obtained from the section
A data.frame, where each line contains the appropriate entry from the Metrics.txt file. Currently not use
Methods
boxplot(regScores, plotP95 = FALSE)
Author(s)
Mike Smith
See Also
checkRegistration
boxplot-methods
Boxplots from summary data
Description
The standard boxplot function has been extended to work with the ExpressionSetIllumina class.
Moreover, it generates graphics using the ggplot2 package and can incorporate user-defined factors
into the plots.
Details
Extra factors can be added to the plots provided they are present in either the phenoData or
featureData or the object.
Value
A ggplot object is produced and displayed on screen
Author(s)
Mark Dunning
calculateDetection
21
Examples
if(require(beadarrayExampleData)){
data(exampleSummaryData)
subset <- channel(exampleSummaryData, "G")[,1:8]
boxplot(subset)
boxplot(subset, what="nObservations")
###You can use columns from the featureData in the plots. Here we will use the control-type
head(fData(subset))
table(fData(subset)[,"Status"])
boxplot(subset, probeFactor = "Status")
###Similarly, we group samples according to colums in phenoData
pData(subset)
boxplot(subset, SampleGroup = "SampleFac")
##Both sample and probe factors can be combined into the same plot
boxplot(subset, SampleGroup = "SampleFac", probeFactor = "Status")
##Suppose we have found differentially expressed genes between experimental conditions and want to plot their respon
if(require(illuminaHumanv3.db)){
ids <- unlist(mget("ALB", revmap(illuminaHumanv3SYMBOL)))
subset2 <- subset[ids,]
boxplot(subset2, SampleGroup = "SampleFac")
boxplot(subset2, SampleGroup = "SampleFac", probeFactor = "IlluminaID")
}
}
calculateDetection
Calculate detection scores
Description
Function to calculate detection scores for summarized data if they are not available.
22
calculateDetection
Usage
calculateDetection(BSData, status=fData(BSData)$Status, negativeLabel="negative")
Arguments
BSData
An ExpressionSetIllumina object
status
character vector giving probe types
negativeLabel
character giving identifer for negative controls
Details
Detection scores are a measure of whether the probe is showing any specific expression. This function implements Illumina’s method for calculating the detection scores for all bead types on a given
array. Within an array, Illumina discard negative control bead-types whose summary values are
more than three MADs from the median for the negative controls. Illumina then rank the summarized intensity for each other bead-type against the summarized values for the remaining negative
control bead-types and calculate a detection p-value 1-R/N, where R is the relative rank of the bead
intensity when compared to the $N$ remaining negative controls. Thus, if a particular bead has
higher intensity than all the negative controls it will be assigned a value of 0. This calculation is
repeated for all arrays.
The function expects the negative controls to be indicated by the Status column in the featureData
slot of the ExpressionSetIllumina object. If this is not present the user can supply a status vector
with the same length as the number of rows in the ExpressionSetIllumina object.
Value
Matrix of detection scores with the same dimensions as the exprs matrix of BSData. This matrix
can be stored in a ExpressionSetIllumina object using the Detection function
Author(s)
Mark Dunning and Andy Lynch
Examples
if(require(beadarrayExampleData)){
data(exampleSummaryData)
##By default, the status column of featureData is used
exampleSummaryData.log2 <- channel(exampleSummaryData ,"G")
det <- calculateDetection(exampleSummaryData.log2)
Detection(exampleSummaryData.log2) <- det
##Example of specifying own status vector
calculateOutlierStats
23
exampleSummaryData.log2 <- addFeatureData(exampleSummaryData.log2)
pq <- fData(exampleSummaryData.log2)$PROBEQUALITY
det2 <- calculateDetection(exampleSummaryData.log2, status="pq", negativeLabel="No match")
}
calculateOutlierStats Outlier distribution stats
Description
Function that determines the outlier beads on an array and how they are distributed among the
segments
Usage
calculateOutlierStats(BLData, array = array, transFun = logGreenChannelTransform, outlierFun = illumina
Arguments
BLData
a beadLevelData-class object
array
the number of the array of interest
transFun
how the section data is to be transformed prior to calculating outliers
outlierFun
a function for calculating outliers
n
an indicator of how extreme an observation must be (e.g. how many MADs from
the median), to be passed to the function that will identify outliers
useLocs
use locs and sdf information (if available) to determine section layout
nSegments
manually set how many segments the section is divided into
...
Additional arguments to be passed to outmeth.
Details
A section of an expression BeadChip (e.g. the Humanv3 or HumanHT-12) is made up of 9 physciallyseparate segments. A useful QA check is to see how the outliers are distributed among these segments. Outliers are beads that have outlying intensities according to some rule that the user can
specify. The default (as used by Illumina) is to exclude beads that are more than 3 median absolute
deviations from the median. Once outliers are determined, the coordinates for these outliers are
binned into segments by assuming that the segments are evenly spaced across the section surface.
Note that sections from Sentrix Array Matrix do not have segments, so the results may not be
informative
Value
vector with the percentage of beads found in each segment that were determined to be outliers
24
checkRegistration
Author(s)
Mark Dunning
Examples
if(require(beadarrayExampleData)){
data(exampleBLData)
##Artificial example, there are no segments on this type of BeadArray
calculateOutlierStats(exampleBLData, array=1, nSegments=10, useLocs=FALSE)
calculateOutlierStats(exampleBLData, array=2, nSegments=10, useLocs=FALSE)
}
checkRegistration
Perform check for misregistered array segments.
Description
Occasionally the registration of an array can go wrong, with the bead centres found in the wrong
place in an image. The effective result of this is a scrambling of the bead IDs.
Note that the function requires that the sdf file and locs file are present, and has particular expectations towards their file names and locations.
Usage
checkRegistration(BLData, array = 1)
Arguments
BLData
array
An object of class beadLevelData-class.
Integer specifying the index of the arrays to be checked. Can be a vector to
process multiple arrays e.g. 1:12.
Details
In order to check for mis-registration we can examine the within bead-type variance across the array.
This function computes this statistic twice for each array segment (since each segment is registered
independently), once using the given bead IDs and once using a randomly assigned set of IDs. The
former is then subtracted from the later. In cases where the registration has worked successfully
we expect the majority of these values to be greater than zero, which for misregistered arrays the
differences should be centred about zero.
combine
25
Value
Returns an object of class beadRegistrationData.
Author(s)
Mike Smith
References
Smith ML, Dunning MJ, Tavare S, Lynch AG. Identification and correction of previously unreported
spatial phenomena using raw Illumina BeadArray data. BMC Bioinformatics (2010) 11:208
combine
Combine two objects.
Description
Combine two seperate objects into a single object.
Usage
## S4 method for signature beadLevelData,beadLevelData
combine(x, y)
## S4 method for signature ExpressionSetIllumina,ExpressionSetIllumina
combine(x,y)
Arguments
x
An object of class beadLevelData or ExpressionSetIllumina.
y
An object of the same class as x.
Details
The combine function allows two objects of the same class that have been created seperately to be
combined into one.
Value
Returns an object of the same class as the two inputs.
Author(s)
Mark Dunning, Mike Smith
26
controlProbeDetection
Examples
if(require(beadarrayExampleData)){
data(exampleBLData)
sectionNames(exampleBLData)
data2 <- combine(exampleBLData, exampleBLData)
sectionNames(data2)
data(exampleSummaryData)
d1 <- exampleSummaryData[,c(1:4)]
d2 <- exampleSummaryData[,c(5:8)]
d3 <- combine(d1, d2)
d3
}
controlProbeDetection Percentage of beads detected
Description
Function to calculate the percentage of beads matching a defined set of control types that are detected as having intensity above background level on an array-section.
Usage
controlProbeDetection(BLData, transFun = logGreenChannelTransform, array = 1, controlProfile = NULL, ta
Arguments
BLData
a beadLevelData object
transFun
transformation to be applied to data
array
a numeric index of the array section
controlProfile optional data frame defining ArrayAddressIDs belonging to each control type
tagsToDetect
vector of character strings defined which control types to interrogate
negativeTag
character string defining which control type to use as background
detThresh
numeric value for threshold for detection
convertBeadLevelList
27
Details
Details of the controls on the array-section can be inferred from the annotation of the beadLevelData
object or supplied as a data frame. The first column of the data frame should contain ArrayAddressIDs, with the control type of the each ID in the second column. The strings supplied in the
tagsToDetect and negativeTag parameters should be present in this column.
The ArrayAddressIDs that correspond to the specified tags are matching to the ArrayAddressIDs
for the chosen array and intensities for all beads are extracted. The function implements Illumina’s
method for calculating the detection scores for all bead types on a given array. Within an array,
Illumina discard negative control bead-types whose summary values are more than three MADs
from the median for the negative controls. Illumina then rank the summarized intensity for each
other bead-type against the summarized values for the remaining negative control bead-types and
calculate a detection p-value 1-R/N, where R is the relative rank of the bead intensity when compared to the $N$ remaining negative controls. Thus, if a particular bead has higher intensity than
all the negative controls it will be assigned a value of 0. This calculation is repeated for all arrays.
The percentage reported is the percentage of beads of each control type that are detected at the
defined threshold.
Author(s)
Mark Dunning
See Also
beadStatusVector,calculateDetection
Examples
if(require(beadarrayExampleData)){
data(exampleBLData)
for(i in 1:2){
print(controlProbeDetection(exampleBLData, array = i, tagsToDetect=c("housekeeping", "biotin"), negativeTag="nega
}
}
convertBeadLevelList
Convert a BeadLevelList object into a beadLevelData object
28
createTargetsFile
Description
As of beadarray version 2.0 the BeadLevelList class has been deprecated and replaced by the
beadLevelData class. Whilst these are superficially similar, the way the data are stored is quite
different, meaning most functionality within the package is no longer compatible with the original
BeadLevelList class.
This function converts any object that is of the old BeadLevelList class into a beadLevelData object.
Usage
convertBeadLevelList(BeadLevelList)
Arguments
BeadLevelList
An object of class BeadLevelList
Value
Returns an object of class beadLevelData.
Author(s)
Mike Smith
See Also
beadLevelData-class
createTargetsFile
A function to generate a targets file given a directory of Illumina beadlevel files
Description
This function, when pointed to a directory containing Illumina bead-level files (e.g. txt, idat, locs,
tif) will return a simple targets file of the sort expected by beadarray. Note that a user created targets
file is likely to be of greater value.
Usage
createTargetsFile(dir = NULL, nochannels = 1, channel1 = "Grn", channel2 = "Red", txtsuff = "txt", imgsuf
createTargetsFile
29
Arguments
dir: The directory containing the Illumina bead-level files. By default, will
search the working directory.
nochannels
nochannels: Does the directory contain 1 or 2 channel arrays? Setting this
argument to be null will result in the function making its best guess.
channel1
channel1: The string indicating that files are associated with the first channel
(usually Grn).
channel2
channel2: The string indicating that files are associated with the second channel
(usually Red).
txtsuff
txtsuff: The suffix of files containing the bead-level intensities (usually txt,
but occasionally csv).
imgsuff
imgsuff: The suffix of files containing the images.
locssuff
locssuff: The suffix of files containing the precise bead locations (usually
locs).
xmlsuff
xmlsuff: The suffix of files containing the meta-data (usually xml).
verbose
verbose: Determines whether or not the function reports on its progress as it
goes along.
special
special: Files with names containing special words (such as fiducial) are ignored.
ColourConfusionStop
ColourConfusionStop: This determines the behaviour of the function if there
is a discrepancy between the number of channels specified, and the number apparently present.
metricsflag
codemetricsflag: This gives the key word that can be used to identify metrics
files.
metsep
metsep: This gives the cell separator used in the metrics file.
metricsection metricsection: This gives the column heading used in the metrics file to indicate array section names.
metricchip
metricchip: This gives the column heading used in the metrics file to indicate
the chip name.
dir
Details
This function bases its resultant targets file on the files with suffix txtsuff.
Value
This returns a dataframe containing
Author(s)
Andy Lynch
See Also
readIlluminaData()
30
dim
Examples
#createTargetsFile(verbose=T)
deprecatedFunctions
Deprecated Functions
Description
Functions that have been renamed in the latest version of beadarray, but kept in for backwards
compatibility.
Author(s)
Mark Dunning
dim
Retrieve the dimensions of an object
Description
Retrieve the dimension of an object.
Usage
## S4 method for signature beadLevelData
dim(x)
## S4 method for signature ExpressionSetIllumina
dim(x)
Arguments
x
Author(s)
Mark Dunning
An object of class beadLevelData or ExpressionSetIllumina
expressionQCPipeline
31
expressionQCPipeline
Flexible bead-level QC pipeline
Description
Function to produce various QC plots and HTML summary pages for bead-level data.
Usage
expressionQCPipeline(BLData, transFun = logGreenChannelTransform, qcDir = "QC", plotType = ".jpeg", hor
Arguments
BLData
a beadLevelData object
transFun
what transformation function to apply
qcDir
a directory to write output to
plotType
desired file extension for plots (jpeg or png)
horizontal
if TRUE imageplots and outlier plots are produced with longest edge on x axis
controlProfile a data frame defining all control types. not required if annotation information is
stored in the bead-level object
overWrite
if FALSE any plots that exist in the directory will not be recreated
nSegments
how many segments each section is divided into
outlierFun
a function to removed outliers
tagsToDetect
which control types to used in the detection metrics
zlim
the range of the imageplots
boxplotFun
what transformation function to be used in boxplots
imageplotFun
what transformation function to be used for imageplots
positiveControlTags
character strings defining which positive controls to plot
hybridisationTags
additional control types to be plotted
negativeTag
character string to identify which control type in the control profile corresponds
to negative controls
...
other plot arguments
Details
This function is a convient way of automatically generating QC plots for each section within a
beadLevelData object. The following plots are produced for each section. i) scatter plots of all
bead observation of the positive controls. See poscontPlot. ii) Further scatter plots of other
controls of interest using poscontPlot. iii) imageplot (imageplot) of section data after applying
transformation function iv) plot of outlier locations using specified outlier function. A HTML page
displaying all the plots is produced.
32
ExpressionSetIllumina-class
After plots have been produced for each section, makeQCTable is run to make a table of mean and
standard deviations for the defined control types, followed by the results of calculateOutlierStats
and controlProbeDetection for each section and written to a HTML page in the requested directory.
The function should be able to run automatically for expression data that has its annotation stored
using setAnnotation or using readIllumina. Otherwise the controlProfile data frame can be
used to define the control types on the array and their associated ArrayAddressIDs. Similarly, the
function assumes single-channel data but a transformation function can be passed.
Author(s)
Mark Dunning
See Also
poscontPlot imageplot outlierplot controlProbeDetection
Examples
if(require(beadarrayExampleData)){
## Not run:
data(exampleBLData)
expressionQCPipeline(exampleBLData, horizontal=T)
## End(Not run)
}
ExpressionSetIllumina-class
Class "ExpressionSetIllumina"
Description
Container for high-throughput assays and experimental metadata. ExpressionSetIllumina class
is derived from eSet, and requires matrices exprs, se.exprs, nObservations, Detection as assay
data members. The slots featureData, phenoData are accessed in the usual manner using fData
and pData functions.
For ExpressionSetIllumina objects created from bead-level data (using the summarize function),
a QC slot is used to contain any quality control data that was present in the beadLevelData object.
This is a change from previous versions of beadarray, where the intensities of the control probes
themselves were stored in this slot. From version 2.0.0 onwards, control probes are stored in the
generateNeighbours
33
assayData slot with the regular probes and the featureData slot has a reference for which rows
correspond to controls.
The ExpressionSetIllumina class is able to accomodate different channels when created from
bead-level data. The channelNames function may be used to find out what channels are present
in the object. The channel function can be used to select a particular channel, returning an
ExpressionSetIllumina object.
Author(s)
Mark Dunning
generateNeighbours
Generate matrix of neighbouring beads
Description
Generates a neighbours matrix from either a .locs file or the X and Y coordinates in a beadLevelData
object.
Usage
generateNeighbours(BLData, array = 1, useLocs = TRUE, window = 30, margin = 10, thresh = 2.2)
Arguments
BLData
An object of class beadLevelData-class
array
integer specifying which section/array to process
useLocs
logical value, specifiying whether the .locs file (if present) should be used to
determine neighbours.
window
numeric value, specifying window size (see below)
margin
numeric value, specifying size of window margin (see below)
thresh
numeric value, which determines how large links are removed. (see below)
Details
generateNeighbours determines, for each bead on the array, which beads are next to it. It assumes
that the beads are in a hexagonal lattice.
If the .locs file is present and useLocs = TRUE then the ordering of the .locs file is used to infere
the grid layout. This is far quicker than the alternative and is thus recommended, but can only be
used on BeadChip platforms. If the data is from a Sentrix Array useLocs is automatically set to
FALSE and the following algorithm is applied instead.
The algorithm used first links each bead to its 6 closest neighbours. It then removes the longest link
if its squared length is more than thresh multiplied by the squared length of the next longest link.
A similar process is applied to the 2nd and 3rd longest links.
34
getBeadData
Finally, any one way links are removed (i.e. a link between two beads is only preserved if each bead
considers the other to be its neighbour).
To ease computation, the algorithm only computes neighbours of beads in a square window of side
length 2*(window) which travels across the array. Beads in a margin around the square, of width
(margin), are also considered as possible neighbours.
Value
A matrix with 6 columns. Each row corresponds to a bead in the passed beadLevelData-class
and the six entries are the indices of the 6 neighbouring beads. Values of NA indicate that the
neighbouring bead appears to be missing, either due to failing Illumina’s decoding or being at the
edge of the array.
Author(s)
Jonathan Cairns, Mike Smith
References
Lynch AG, Smith ML, Dunning MJ, Cairns JM, Barbosa-Morais NL, Tavare S. beadarray, BASH
and HULK - tools to increase the value of Illumina BeadArray experiments. In A. Gusnato, K.V.
Mardia, & C.J. Fallaize (eds), Statistical Tools for Challenges in Bioinformatics. 2009 pp. 33-37.
Leeds, Leeds University Press.
See Also
HULK, BASH
Examples
## Not run:
if(require(beadarrayExampleData)){
data(exampleBLData);
neighbours <- generateNeighbours(exampleBLData, array = 1, useLocs = FALSE);
}
## End(Not run)
getBeadData
Get raw data from a beadLevelData object
Description
Retrieves the raw bead data from a beadLevelData object for a given section/array.
HULK
35
Usage
getBeadData(BLData, what="Grn", array=1)
Arguments
BLData
BeadLevelList
what
character string specifying the values to retrieve (e.g. "ProbeID", "Grn" etc.).
array
integer specifying the section/array to use
Value
A vector containing the specified bead data for the particular array.
Author(s)
Mark Dunning
Examples
if(require(beadarrayExampleData)){
data(exampleBLData)
summary(getBeadData(exampleBLData))
}
HULK
HULK - Bead Array Normalization by NEighbourhood Residuals
Description
Normalizes an probe intensities by calculating a weighted average residual based on the residuals
of the surrounding probes.
Usage
HULK(BLData, array = 1, neighbours = NULL, invasions = 20, useLocs = TRUE, weightName = "wts", transFun =
36
HULK
Arguments
BLData
An object of class beadLevelData-class
array
integer specifying which section/array to process
neighbours
A Neighbours matrix. Optional - if left NULL, it will be computed.
invasions
Integer - Number of invasions used when identifying neighbouring beads.
useLocs
If information from an associated .locs file is to be used. If available using a
.locs file can improve both the speed and accuracy of determining the network
of neighbouring beads.
weightName
Column name where bead weights are to be taken from.
transFun
Transformation function.
outlierFun
Name or definition for the function to be used to calculated outliers.
Details
HULK is a method of intensity normalization based upon the BASH framework. Firstly For each
bead a local neighbourhood of beads is determined, using the same process as the other BASH
functions.
For each bead a weighted average residual is calculated. The average residual is calculated as the
sum of the residuals for each bead in the neighbourhood, divided by 1 plus the number of invasions
it took to reach that bead. This calculation is made by a call to HULKResids.
The average residuals are then subtracted from each bead and a vector of the resulting corrected
intensities object is returned. These corrected intensities can be saved in the original beadLevelData
object using insertBeadData
Value
A vector of corrected intensities.
Author(s)
Mike Smith
References
Lynch AG, Smith ML, Dunning MJ, Cairns JM, Barbosa-Morais NL, Tavare S. beadarray, BASH
and HULK - tools to increase the value of Illumina BeadArray experiments. In A. Gusnato, K.V.
Mardia, & C.J. Fallaize (eds), Statistical Tools for Challenges in Bioinformatics. 2009 pp. 33-37.
Leeds, Leeds University Press.
See Also
BASH, insertBeadData, logGreenChannelTransform, squeezedVarOutlierMethod, illuminaOutlierMethod
identifyControlBeads
37
Examples
## Not run:
if(require(beadarrayExampleData)){
data(exampleBLData)
o <- HULK(exampleBLData, 1)
}
## End(Not run)
identifyControlBeads
Classify each bead according to its control status
Description
Using the control annotation specified for the array, the function will classify each bead as belonging
to a control group, or as being a regular probe.
Usage
identifyControlBeads(BLData, array = 1, controlProfile = NULL)
Arguments
BLData
a beadLevelData object
array
the numeric id of the array section
controlProfile an optional control profile data frame
Details
The function requires either that a control profile data frame is specified (This associates probe IDs
with their control status - see the example), or that the annotation of the beadLevelData object be
set to an array that the package recognises (see getAnnotation). Note that some positive control
bead-types may also be functioning ’regular’ probes.
Value
a vector of character strings giving the status of each bead
Author(s)
Mark Dunning
38
illuminaChannel-class
Examples
if(require(beadarrayExampleData)){
data(exampleBLData)
statVec = identifyControlBeads(exampleBLData)
table(statVec)
}
illuminaChannel-class Class "illuminaChannel"
Description
A class to define how illumina bead-level data are summarized
Details
From beadarray version 2.0 onwards, users are allowed more flexibility in how to create summarized data from bead-level data. The illuminaChannel is a means of allowing this flexibility by
definining how summarization will be performed on each array section in the bead-level data object.
The three keys steps applied to each section are; 1) use a transform function to get the quantities
to be summarized (one value per bead). The most common use-case would be to extract the Green
channel intensities and possibly perform a log2 transformation. 2) remove any outliers from this
list of values 3) split the values according to ArrayAddressIDs and apply the definied exprFun and
varFun to the quantities belonging to each ArrayAddress.
Slots/List Components
Objects of this class contain the following slots
transFun:
outlierFun:
exprFun:
varFun:
name:
function to transform the data from each array-section.
A function for identifying outliers from a list of bead intensiites and associated ArrayAddressIDs .
A function for producing a single summary of expression level from a vector of bead-type intensities. e.g. mea
A function for producing a single summary of variability from a vector of bead-type intensities. e.g. sd
Character vector that defines a name for the channel
Author(s)
Mark Dunning
illuminaOutlierMethod
39
See Also
summarize
Examples
greenChannel
redChannel = new("illuminaChannel", redChannelTransform, illuminaOutlierMethod, mean, sd, "R")
logRatio = new("illuminaChannel", logRatioTransform, illuminaOutlierMethod, mean, sd, "M")
illuminaOutlierMethod Identifier outliers on an array section
Description
Implementation of the illumina method for excluding outliers using a fixed number of MADs (median absolute deviations) cutoff for each bead type
Usage
illuminaOutlierMethod(inten, probeList, wts=1, n = 3)
Arguments
inten
a list of intensities
probeList
the IDs corresponding to each intensity value
wts
Weights associated with beads, indicating those recommended for removal by,
for example, BASH
n
number of MADs cutoff used
Details
This function is called within the summarisation routine of beadarray to exclude outliers from an
array-section prior to summary. The intensities are not assumed to be on any particular scale and
can result from any user-defined transformation function.
Beads with weight zero do not contribute to the outlier calling.
Value
the positions in the original vector that were determined to be outliers
Author(s)
Mark Dunning
40
imageplot
See Also
squeezedVarOutlierMethod
Examples
if(require(beadarrayExampleData)){
data(exampleBLData)
oList = illuminaOutlierMethod(logGreenChannelTransform(exampleBLData, 1), getBeadData(exampleBLData, array=1, wha
}
imageplot
imageplot for beadLevelData object
Description
Generates an image plot for data from a beadLevelData object.
Usage
imageplot(BLData, array = 1, transFun = logGreenChannelTransform, squareSize = NULL, useLocs = TRUE, hor
Arguments
BLData
array
transFun
squareSize
useLocs
horizontal
low
high
ncolors
zlim
legend
...
beadLevelData
integer specifying what section to plot
Function that defines how values from the BLData object are to be transformed
prior to plotting.
Numeric specifying how many pixels in the original image make up each square
in the imageplot. If NULL, the function will guess a suitable value from the
data.
If TRUE the function will read the locs file associated with the section in order to
include the physical properties of the section in the plot
If TRUE the image will be plotted so that the longest edge of the section is on the
x axis.
colour to use for lowest intensity
colour to use for highest intensity
The number of colour graduations between high and low
numerical vector of length 2 giving the extreme values of ’z’ to associate with
colours ’low’ and ’high’.
logical, if TRUE, zlim and range of data is added to plot.
other arguments to plot
imageplot
41
Details
Produces a standard imageplot for the specified section. The default, transformation logGreenChannelTransform,
takes the log2 of the green channel. For two channel data, the red channel or log ratio can be plotted
by logRedChannelTransform or logRatioTransform functions can be used. The user can also
specify their own functions.
The default plotting orientation is such that the longest edge of the section is along the x axis. If
horizontal = FALSE, the longest edge will by on the y axis and should match how the corresponding TIFF image from the BeadScan directory is orientated.
If locs = TRUE and locs file were made available to readIllumina, the segments that the section
is comprised of will be visible (For expression BeadChips, each section is made of nine physically
separate segments). The squareSize parameter will also be set appropriately.
As a result of both having identical function names this function can conflict with the imageplot
method in ’limma’. If both packages are loaded, the function from whichever package was loaded
last takes precedence. If the ’beadarray’ imageplot() function is masking that from ’limma’, one
can directly call the ’limma’ method using the command "limma::imageplot()". Alternatively, one
can detach the ’beadarray’ package using "detach(package:beadarray)". Similar techniques can be
used if ’limma’ is masking the ’beadarray’ method.
Value
A ggplot object which is printed to screen by default
Author(s)
Mike Smith and Mark Dunning
Examples
if(require(beadarrayExampleData)){
data(exampleBLData)
##By default the first array is plotted, here we plot the 2nd which should give a more interesting example
imageplot(exampleBLData, array=2)
}
## Not run:
ip <- imageplot(exampleBLData, array=2, low="lightgreen", high="darkgreen", horizontal=FALSE)
ggsave(ip, filename="myimageplot.png")
ip2 <- imageplot(exampleBLData, array=2, low="lightgreen", high="darkgreen", horizontal=TRUE)
ggsave(ip2, filename="myimageplot2.png")
42
imageProcessing
## End(Not run)
imageProcessing
Image processing functions
Description
Functions for obtaining bead intensity values from raw tiff images. The three commands with the
illumina prefix attempt to emulate the image processing implemented by Illumina. The medianBackground function implements a more robust background calculation recommended by Smith et
al.
Usage
illuminaForeground(pixelMatrix, beadCoords)
illuminaBackground(pixelMatrix, beadCoords)
illuminaSharpen(pixelMatrix)
medianBackground(pixelMatrix, beadCoords)
Arguments
pixelMatrix
A matrix storing the individual pixel values of an image. Intended to be created
by readTIFF, although any matrix can be passed as input.
beadCoords
Two column matrix with each row containing a pair of coordinates representing
a bead centre.
Value
illuminaForeground, illuminaBackground and medianBackground return a vector of intensity values, with one entry for every row in the beadCoords argument. Any pairs of coordinates that fall
outside the dimensions of the image return NA.
illuminaSharpen returns a matrix with the same dimensions as the pixelMatrix argument.
Author(s)
Mike Smith
References
Smith ML, Dunning MJ, Tavare S, Lynch AG. Identification and correction of previously unreported
spatial phenomena using raw Illumina BeadArray data. BMC Bioinformatics (2010) 11:208
insertBeadData
insertBeadData
43
Add, modify or remove data in a beadLevelData object
Description
Add, modify or remove data in a beadLevelData object.
Usage
insertBeadData(BLData, array = 1, what, data)
removeBeadData(BLData, array = 1, what)
Arguments
BLData
An object of class beadLevelData-class.
array
Positive integer specifying what section should be modified.
what
Name of the data that is being modified. If ‘what’ doesn’t exist then a new entry
is created using the name specified in this argument.
data
A numeric vector to be stored, the same length as the number of beads in the
section specified by the array argument.
Details
These functions allow the beadData slot of the beadLevelData-class object to be modified for a
given array.
Value
Returns an object of class beadLevelData-class.
Author(s)
Mike Smith
Examples
if(require(beadarrayExampleData)){
data(exampleBLData)
logIntensity <- log2(getBeadData(exampleBLData, what = "Grn", array = 1))
## This will add a new entry called "LogGrn" to BLData
exampleBLData <- insertBeadData(exampleBLData, array = 1, what = "LogGrn", data = logIntensity)
head(exampleBLData[[1]])
## Supplying an existing entry to "what" will overwrite the current data
exampleBLData <- insertBeadData(exampleBLData, array = 1, what = "Grn", data = logIntensity)
44
insertSectionData
head(exampleBLData[[1]])
}
Modify the sectionData slot
insertSectionData
Description
A function to modify the sectionData slot of a beadLevelData object. Data can be be added if it is
a data frame with a number of rows equal to the number of sections in the beadLevelData object.
Usage
insertSectionData(BLData, what, data)
Arguments
BLData
a beadLevelData object
what
a character string specifiying a name for the new data
data
a data frame containing the data we wish to add
Details
This function allows users to modifiy the per\-section information that is included in the sectionData
slot. Typical usage would be to store quality control data that has been computed.
Value
a modified beadLevelData object with the new data attached to sectionData
Author(s)
Mark Dunning
Examples
if(require(beadarrayExampleData)){
data(exampleBLData)
qct = makeQCTable(exampleBLData)
exampleBLData = insertSectionData(exampleBLData, what="ProbeQC", data = qct)
exampleBLData@sectionData
limmaDE
45
}
Differential expression using limma
limmaDE
Description
Function to perform a standard limma analysis using a single command.
Usage
limmaDE(summaryData, SampleGroup, DesignMatrix = NULL, makeWts = TRUE, ...)
Arguments
summaryData
ExpressionSetIllumina object
SampleGroup
Name of column in phenoData that will be used to construct sample groups for
analysis
DesignMatrix
Optional design matrix
makeWts
if TRUE weights will be calculated for each array
...
Other arguments that lmFit can accept
Details
The function automates the steps used in a typical limma analysis. Firstly, the lmFit is used to fit
a linear model from the specified column in phenoData. Array weights can be calculated (arrayWeights) and used in the fit. A contrast matrix of all possible contrasts is created (makeContrasts)
and fitted (makeContrasts). The empirical Bayes shrinkage of variances is then applied (eBayes).
The design matrix, contrast matrix and array weights can all be extracted for the resulting object.
Value
a limmaResults object
Author(s)
Mark Dunning
46
makeGEOSubmissionFiles
Examples
if(require(beadarrayExampleData)){
data(exampleSummaryData)
rawdata <- channel(exampleSummaryData, "G")
normdata <- normaliseIllumina(rawdata)
limmaResults <- limmaDE(normdata, SampleGroup = "SampleFac")
limmaResults
DesignMatrix(limmaResults)
}
limmaResults-class
Class "limmaResults"
Description
Container for results from a limma differential expression analysis
Author(s)
Mark Dunning
makeGEOSubmissionFiles
Create files for a Gene Expression Omnibus submission
Description
Following the guidelines at http://www.ncbi.nlm.nih.gov/geo/info/geo_illu.html, we provide functionality to create the three types of file required for a GEO submission of Illumina expression data.
These are 1) sample metadata 2) Normalised intensities 3) Raw intensities.
Usage
makeGEOSubmissionFiles(normData, rawData, forceDetection = TRUE, basename = "GEO", softTemplate = NULL)
createGEOMeta(normData,basename)
createGEOMatrix(normData,forceDetection=TRUE,basename="GEO",softTemplate=NULL,normalised=T)
makeGEOSubmissionFiles
47
Arguments
normData
A normalised ExpressionSetIllumina object
rawData
A ’raw’ non-normalised ExpressionSetIllumina object
forceDetection TRUE forces the calculation of detection scores (if they are not present).
basename
A prefix that all the output files will be given
softTemplate
A SOFT file downloaded from GEO that we wish to annotate against. e.g.
GPL10558.annot for Humanv4
normalised
if TRUE the suffix ProcessedMatrix will be used to write the intensities to. Otherwise the Raw suffix is used.
Details
Each file is written as a tab-delimited file in the current working directory. Note that the metadata
contains the correct number of columns for the number of samples in the data, but the contents
should be entered / curated manually prior to submission.\
Meta file: A template file that can be used to record all the relevant metadata for the experiment,
plus the information required by GEO. The SAMPLES section of the file contains the per-sample
metadata and has columns generate from the required GEO data an the phenoData stored with the
input data\
Processed Matrix - GEO seems to want normalised intensities and detection scores for each probe
on each array. Detection scores can be generated if they are not present in the data. The probes
that are reported in this file are decided using the annotation slot of the object and querying the
appropriate annotation package. Otherwise, a SOFT file downloaded from GEO can be used. \ Raw
Matrix - As above, but non-normalised intensities are used
Author(s)
Mark Dunning
References
http://www.ncbi.nlm.nih.gov/geo/info/geo_illu.html
Examples
## Not run:
if(require(beadarrayExampleData)){
data(exampleSummaryData)
rawdata <- channel(exampleSummaryData, "G")
normdata <- normaliseIllumina(rawdata)
makeGEOSubmissionFiles(normdata, rawdata)
##To annotate against a SOFT file that can be downloaded from GEO
##e.g. ftp://ftp.ncbi.nlm.nih.gov/geo/platforms/GPL10nnn/GPL10558/annot/GPL10558.annot.gz
makeGEOSubmissionFiles(normdata, rawdata,softTemplate="GPL10558.annot")
}
48
makeQCProfile
## End(Not run)
makeQCProfile
Retrieve control beads
Description
Function to retrieve the bead IDs for a particular annotation platform
Usage
makeControlProfile(annoName, excludeERCC = TRUE)
Arguments
annoName
An abberviated name for the annotation packaget. e.g. Humanv3, MouseV2
excludeERCC
Ignore any controls with REPORTERGROUPNAME beginning with ERCC.
These are a large collection of spike controls on the Humanv4 chip and can
make some control tables too big if they are included.
Details
The function will use the relevant annotation package (if it is installed) and return all IDs that are
present in the REPORTERGROUPNAME mapping. Note that this mapping is only available in
versions 1.12.0 and greater.
Value
A matrix with one row per control bead-type giving the bead-level ID (ArrayAddressID) and control
type.
Author(s)
Mark Dunning
Examples
makeControlProfile("Humanv3")
makeQCTable
makeQCTable
49
Tabulate QC scores
Description
Function to make a table of quality control scores for every section in a beadLevelData object.
Either the annotation of the data needs to be specified, or a control profile data frame that lists
ArrayAddress IDs and control types. The supplied summary functions are applied to each control
type on each section.
Usage
makeQCTable(BLData, transFun = logGreenChannelTransform, controlProfile = NULL, summaryFns = list(Mean
Arguments
BLData
a beadLevelData object
transFun
a function to be applied to the beadLevelData object prior to tabulation
controlProfile an optional data frame that specifies ID and type of controls to be used to generate the table
summaryFns
list of functions to apply to each control type on every section
channelSuffix
optional character string to append to the column names of the resulting table
Details
For each section in turn, the function groups together IDs of the same control type (e.g. housekeeping), and uses an lapply with the specified summary functions. A transformation function is
applied to BLData prior to the summary, with the default being to take the log2 of the green channel.
If the annotation of the beadLevelData has been set by readIllumina or setAnnotation then the
controlProfile data frame is calculated automatically and the controlProfile argument may be
omitted.
Value
A matrix with one row per section and one column for each combination of control type and summary function.
Author(s)
Mark Dunning
50
medianNormalise
Examples
if(require(beadarrayExampleData)){
data(exampleBLData)
qct = makeQCTable(exampleBLData)
qct
}
medianNormalise
Median normalise data in a matrix
Description
Normalises expression intensities so that the intensities or log-ratios have equal median values
across a series of arrays (columns).
Usage
medianNormalise(exprs, log=TRUE)
Arguments
exprs
a matrix of expression values
log
if TRUE then do a log2 transformation prior to normalising
Details
Normalisation is intended to remove from the expression measures any systematic trends which
arise from the microarray technology rather than from differences between the probes or between
the target RNA samples hybridized to the arrays.
For median normalisation, the intensity for each gene is adjusted by subtracting the median of all
genes on the array and then adding the median across all arrays. The effect is that each array then
has the same median value.
Value
Produces a matrix of normalised intensity values (on the log2 scale by default) with the same dimensions as exprs.
Author(s)
Mark Dunning
metaTemplate
51
Examples
if(require(beadarrayExampleData)){
data(exampleSummaryData)
exampleSummaryData.log2 <- channel(exampleSummaryData,"G")
exampleSummaryData.med = assayDataElementReplace(exampleSummaryData.log2, "exprs", medianNormalise(exprs(example
}
metaTemplate
GEO required fields
Description
Template containing latest required fields for GEO submission
Usage
data(metaTemplate)
Examples
data(metaTemplate)
metrics-methods
Accessing metrics information in bead-level objects
Description
The metrics, p95 and snr methods conveniently access metrics information that is stored in a
beadLevelData object. These data are generated by the Illumina scanning software and can be an
early indicator of array quality. These include the 95th (P95) and 5th (P05) quantiles of all pixel
intensities on the image. A signal-to-noise ratio (SNR) can be calculated as the ratio of these two
quantities. These metrics can be viewed in real-time as the arrays themselves are being scanned.
By tracking these metrics over time, one can potentially halt problematic experiments before they
even reach the analysis stage. Illumina recommend that the SNR ratio should be above 10, so these
arrays are acceptable. However, the P95 and P05 values will fluctuate over time and are dependant
upon the scanner setup. Including SNR values for arrays other than those currently being analysed
will give a better indication of whether any outlier arrays exist.
Author(s)
Mark Dunning
52
noOutlierMethod
Examples
if(require(beadarrayExampleData)){
data(exampleBLData)
metrics(exampleBLData)
p95(exampleBLData, "Grn")
snr(exampleBLData, "Grn")
}
noOutlierMethod
returns no outliers on an array section
Description
The summarize function demands that an outlier function is called. This function allows one to
satisfy this requirement and still not remove any outliers.
Usage
noOutlierMethod(inten, probeList, wts=1,n=3)
Arguments
inten
a list of intensities but the intensities are not in fact used
probeList
the IDs corresponding to each intensity value (not used)
wts
Weights associated with beads. Again, these are not actually used.
n
another parameter that is not, in fact, used.
Details
This function returns integer(0).
Value
integer(0)
Author(s)
Andy Lynch
See Also
squeezedVarOutlierMethod
normaliseIllumina
53
Examples
if(require(beadarrayExampleData)){
data(exampleBLData)
oList = noOutlierMethod(logGreenChannelTransform(exampleBLData, 1), getBeadData(exampleBLData, array=1, what="Pro
}
normaliseIllumina
Normalise Illumina expression data
Description
Normalises expression intensities from an ExpressionSetIllumina object so that the intensities
are comparable between arrays.
Usage
normaliseIllumina(BSData, method="quantile", transform="none", T=NULL, status=fData(BSData)$Status,ne
Arguments
BSData
an ExpressionSetIllumina object
method
character string specifying normalisation method (options are "quantile", "qspline",
"vsn", "rankInvariant", "median" and "none".
transform
character string specifying transformation to apply to the data prior to normalisation (options are "none", "log2", neqc, rsn and "vst"
T
A target distribution vector used when method="rankInvariant" normalisation. If NULL, the mean is used.
status
character vector giving probe types (used in neqc normalisation only)
negctrl
character vector giving negative control probes (used in neqc normalisation only)
regular
character vector giving regular probes (used in neqc normalisation only)
...
further arguments to be passed to lumiT or neqc
Details
Normalisation is intended to remove from the expression measures any systematic trends which
arise from the microarray technology rather than from differences between the probes or between
the target RNA samples hybridized to the arrays.
In this function, the transform specified by the user is applied prior to the chosen normalisation
procedure.
54
normaliseIllumina
When transform="vst" the variance-stabilising transformation from the ’lumi’ package is applied
to the data. Refer to the lumiT documentation for further particulars. Note that the Detection P
values are only passed on when they are available (i.e. not NA). The rsn option calls code directly
from lumi.
For further particulars on the different normalisation methods options refer to the individual help
pages (?normalize.quantiles for "quantile", ?normalize.qspline for "qspline", ?rankInvariantNormalise
for "rankInvariant", ?medianNormalise for "median" and ?vsn2 for "vsn".
For median normalisation, the intensity for each gene is adjusted by subtracting the median of all
genes on the array and then adding the median across all arrays. The effect is that each array then
has the same median value.
Note: If your BSData object contains data already on the log-scale, be careful that you choose an
appropriate transform to avoid transforming it twice. The same applies for the "vst" transformation and "vsn" normalisation methods which require the expression data stored in BSData to be on
the original (un-logged) scale. When method="vsn", transform must be set to "none", since this
method transforms and normalises the data as part of the model.
The neqc normalisation is described in Shi et al (2010) and documented in the limma package. Note
that the output from this method has control probes removed.
Value
An ’ExpressionSetIllumina’ object which conatains the transformed and normalised expression values for each array.
Author(s)
Matt Ritchie and Mark Dunning
References
Shi. W, Oshlack. A, Smyth, GK, (2010) Optimizing the noise versus bias trade-off for Illumina
whole genome expression BeadChips. Nucleic Acids Research
Lin, S.M., Du, P., Kibbe, W.A., (2008) ’Model-based Variance-stabilizing Transformation for Illumina Microarray Data’, Nucleic Acids Res. 36, e11
Examples
if(require(beadarrayExampleData)){
data(exampleSummaryData)
exampleSummaryData.norm = normaliseIllumina(channel(exampleSummaryData, "G"), method="quantile", transform="none
exampleSummaryData.rsn = normaliseIllumina(channel(exampleSummaryData, "G.ul"),method="rsn", transform="none")
}
numBeads
numBeads
55
Gets the number of beads from a beadLevelData object
Description
Retrieves the number of beads on selected sections from a beadLevelData object.
Usage
numBeads(object, arrays=NULL)
Arguments
object
beadLevelData
arrays
either NULL to return the bead numbers for all arrays, or a scalar or vector of
integers specifying a subset of strips/arrays
Details
numBeads retrieves the number of beads on arrays from the arrayInfo slot.
Value
A vector containing the number of beads on individual array sections.
Author(s)
Matt Ritchie
Examples
if(require(beadarrayExampleData)){
data(exampleBLData)
numBeads(exampleBLData)
numBeads(exampleBLData, arrays=2)
}
56
outlierplot
outlierplot
Plot outlier locations
Description
Function to plot where the outliers are located on a given array
Usage
outlierplot(BLData, array = 1, transFun = logGreenChannelTransform, outlierFun = illuminaOutlierMethod,
Arguments
BLData
a beadLevelData object
array
the number of the array to plot
transFun
a function defining how to transform the data prior to calculating outliers
outlierFun
function that will identify outliers
n
an indicator of how extreme an observation must be (e.g. how many MADs from
the median), to be passed to the function that will identify outliers
wtsname
column name of BLData object containing weights to feed to the outlier function
horizontal
if TRUE the longest edge of the array section will be on the x axis
nSegments
How many segments the section is divided into. If this argument is left as the
default value (NULL) the code will attempt to extract this information from the
relevant .sdf file. If it can’t be found then the segments will not be indicated on
the final plot.
lowOutlierCol
what colour to plot outliers below the median
highOutlierCol what colour to plot outliers above the median
outlierPch
plotting character for the outliers
main
an optional title for the plot
...
additional arguments
Details
The function calls the specified outlier function to determine the outliers on the array and then plots
their location. Points are coloured according the intensity of the bead is above or below the median
for that bead-type.
Value
plot produced on current graphical device
Author(s)
Mark Dunning and Mike Smith
platformSigs
57
Examples
if(require(beadarrayExampleData)){
data(exampleBLData)
outlierplot(exampleBLData, array=1, horizontal = FALSE)
}
Annotation definitions
platformSigs
Description
A list of bead-level IDs for each Illumina expression array platform, as obtained by the lumi mapping packages. These are used to suggest the annotation of a possibly unknown bead-level dataset.
Usage
data(platformSigs)
plotBeadLocations
Plot bead locations
Description
Can plot where specified beads, or bead types were located on the array surface
Usage
plotBeadLocations(BLData, ProbeIDs = NULL, BeadIDs = NULL, array = 1, SAM = FALSE, xCol = "GrnX", yCol = "
Arguments
BLData
a beadLevelData object
ProbeIDs
a list of ArrayAddress IDs to plot
BeadIDs
a list of beads (rows in the beadLevelData object) to plot
array
the number of the section to plot
SAM
if TRUE the array is treated as a Sentrix Array Matrix (hexagonal)
xCol
column name for the x coordinates
yCol
column name for the x coordinates
xlab
optional label for the x axis
58
plotChipLayout
ylab
optional label for the y axis
horizontal
if TRUE the longest edge of the array surface will be plotted on the x axis
main
an optional title for the plot
...
any arguments to be passed to plots
Value
plot to current graphical device
Author(s)
Mark Dunning
Examples
if(require(beadarrayExampleData)){
data(exampleBLData)
##Plot location of first 100 beads as they are listed in beadLevelData object
plotBeadLocations(exampleBLData, BeadIDs = 1:100, array=1, horizontal = FALSE)
}
plotChipLayout
Function to Plot the Layout of an Illumina BeadChip
Description
Using the values obtained from a sentrix descriptor object generated by simpleXMLparse, a plot is
generated showing samples and sections.
Usage
plotChipLayout(SD, subsC = NULL, sampC = NULL, sectC = NULL, desectC = "red", markC = "white", main = NULL
plotMA-methods
59
Arguments
SD
A sentrix descriptor object such as that generated by simpleXMLparse from an
Illumina sdf file
subsC
The colour for the array substrate. Will be extracted from the sentrix descriptor
object if null.
sampC
The colour for the samples. Will be extracted from the sentrix descriptor object
if null.
sectC
The colour for the sections. Will be extracted from the sentrix descriptor object
if null.
desectC
The colour with which to outline the decode sections
markC
The colour for plotting decoding and analytical markers
main
A title to give the figure (e.g. chip name)
samplab
labels for the samples. Will be extracted from the sentrix descriptor object if
null.
sectlab
labels for the sections (if appropriate). Will be extracted from the sentrix descriptor object if null.
Value
returns a plot to the current device (recommend this is tall and thin)
Author(s)
Andy Lynch
Examples
## SD<-simpleXMLparse(mysdf)
## plotChipLayout(SD)
plotMA-methods
Function to construct the classic MA plots from a dataset
Description
Note that a ggplot2 object is returned, which can be modified programatically.
The default operation is to construct a reference array be averaging all probes across the whole
datasets, and then making an MA plot by comparing each array to this reference. A log2 transformation is performed, but this can be turned-off by setting do.log=FALSE.
Alternatively, a SampleGroup may be specified. This is a character string that should match a
column in the phenoData for the object. Then, the resulting MA plot will contain all pairwise
comparisons between samples belonging to the same group. A list of ggplot objects is returned,
each item in the list being a different group.
60
plotMAXY
Details
Densities are computed using the ’hexbin’ package
Value
A list of ggplot2 objects is returned.
Author(s)
Mark Dunning
Examples
if(require(beadarrayExampleData)){
data(exampleSummaryData)
rawdata <- channel(exampleSummaryData, "G")
mas <- plotMA(rawdata,do.log=FALSE)
mas
##Smoothed lines can be added
mas + geom_smooth(col="red")
##Added lines on the y axis
mas + geom_hline(yintercept=c(-1.5,1.5),col="red")
##Changing the color scale
mas + scale_fill_gradient2(low="yellow",mid="orange",high="red")
mas <- plotMA(rawdata,do.log=FALSE,SampleGroup="SampleFac")
mas[[1]]
mas[[2]]
}
plotMAXY
Scatter plots and MA-plots for all specified arrays
Description
Produces smoothed scatter plots of M versus A and X versus Y for all pairwise comparisons from a
set of arrays.
Usage
plotMAXY(exprs, arrays, log = TRUE, genesToLabel=NULL,
labels=colnames(exprs)[arrays],labelCol="red",
labelpch=16,foldLine=2,sampleSize=NULL,...)
plotTIFF
61
Arguments
exprs
a matrix of expression values
arrays
integer vector giving the indices of the arrays (columns of exprs) to plot
log
if TRUE then all values will be log2-transformed before plotting
genesToLabel
vector of genes to highlight on the plot. These must match the rownames of
exprs.
labels
vector of array names to display on the plot
labelCol
plotting colours for highlighted genes
labelpch
plotting characters for highlighted genes
foldLine
a numeric value defining where to draw horizontal fold change lines on the plot
sampleSize
The number of genes to plot. Default is NULL, which plots every gene
...
other graphical parameters to be passed
Details
This graphical tool shows differences that exist between two arrays and can be used to highlight
biases between arrays as well as highlighting genes which are differentially expressed. For each
bead type, we calculate the average (log2) intensity and difference in intensity (log2-ratio) for each
pair of arrays.
In the lower-left section of the plot we see XY plots of the intensities for all pairwise comparisons
between the arrays and in the upper right we have pairwise MA plots. Going down the first column
we observe XY plots of array 1 against array 2 and array 1 against array 3 etc. Similarly, in the
upper-right corner we can observe pairwise MA plots.
Author(s)
Mark Dunning
Examples
##This function is to be replaced. Please see plotMA
plotTIFF
Produce plots of the Illumina tiff images
Description
Produces a plot of an Illumina tiff image, which can be useful for observing spatial artifacts on an
array and checking the alignment of spot centres features in the image.
Usage
plotTIFF(tiff, xrange = c(0, ncol(tiff)-1), yrange = c(0, nrow(tiff)-1), high = "cyan", low = "black", mi
62
plotTIFF
Arguments
tiff
Intended to the the result of readTIFF, but in reality can be any matrix
xrange
Range of X coordinates to plot.
yrange
Range of Y coordinates to plot.
high
Colour to plot the brightest pixels in the image.
low
Colour to plot the dimmest pixels.
mid
If specified the colour gradient will go from low to mid to high. If not specified
then the gradient simply goes from low to high.
ncolours
Specify how many steps there should be in the gradient between the high and
low colours
log
If TRUE the pixel values are logged before the colour gradient is created.
values
When set to TRUE each pixel in the image has it’s value displayed over it. This
should only be used when displaying a very small number of pixels as the text
very quickly covers the entire image.
textCol
If values is TRUE this argument specifies the colour of the text.
...
Other graphical parameters specified in par
Details
This can be very slow, especially when the Cairo graphics library is being used. When using the
Cairo library, if one is plotting a large tiff with 10s of millions of pixels, the plotting time increases
from around 20 seconds to 5 minutes on an Intel Xeon E5420.
If running on a Linux system it is recommended to use:
x11(type = "Xlib")
before running plotTIFF(), on order to force the quicker plotting mechanism.
Of course it is debatable whether it is useful to plot all of those pixels, given that there are far more
than can be displayed on a normal screen, and future revisions of the code may address this.
Value
A plot is produced on the current graphical device.
Author(s)
Mike Smith
poscontPlot
poscontPlot
63
Plot the positive controls
Description
Function for retrieving and plotting the biotin and housekeeping controls for an expression array.
We know these controls should show high signal and are therefore useful for QA purposes. The
housekeeping control targets a bead-type believed to be universally expressed whereas the biotin
control targets the biotin used for staining.
Usage
poscontPlot(BLData, array = 1, transFun = logGreenChannelTransform, positiveControlTags = c("housekeepi
Arguments
BLData
a beadLevelData object
array
The section to be plotted
transFun
What transformation function to be applied prior to plotting
positiveControlTags
What identifiers to be used as positive controls
colList
vector of colours to be used to each positive control
controlProfile an optional data frame with columns defining the ArrayAddress IDs and control\type for all controls on the platform.
...
other arguments to plot
Details
Function for plotting the observed intensites for all replicates of the specified control probes on a
given array\-section. The identity of the control probes can be specified by passing a ControlProfile data frame, with the first column being a vector of ArrayAddress IDs and the second column
being a corresponding set of characters tags. The beads to be plotted are found by matching the
positiveControlTags argument to these character tags. Users with expression data can have the
ControlProfile data frame defining automatically within the function, provided the annotation of the
beadLevelData object has been defined by readIllumina or setAnnotation.
Value
Plot to current graphical device
Author(s)
Mark Dunning
References
www.illumina.com/downloads/GX_QualityControl_TechNote.pdf
64
processSwathData
Examples
###Load the example beadLevelData and associated controlProfile
if(require(beadarrayExampleData)){
data(exampleBLData)
poscontPlot(exampleBLData, array=1)
poscontPlot(exampleBLData, array=2)
}
processSwathData
Prepare iScan data for use with beadarray
Description
Data from Illumina’s newer iScan system come in a different format to the previous BeadScan data.
This function is intended to transform the data into a format compatible with beadarray.
Usage
processSwathData(inputDir = NULL, outputDir = NULL, twoColour=NULL, textstring="_perBeadFile.txt", seg
Arguments
inputDir
outputDir
twoColour
textstring
segmentHeight
segmentWidth
fullOutput
newTextString
verbose
Character string specifying the directory containing the data to be processed. If
left NULL this defaults to the current working directory.
Similar to the above, specifying the directory where the output should be written.
If left NULL this defaults to the current working directory.
Boolean value specifying whether the data is one or two channel. If left NULL
the function will attempt to determing the number of channels be examing the
files present in the directory.
String specifying the suffix to identify the text file containing original bead-level
data.
Each array section is made up of several segments of beads, arranged in an
hexagonal pattern. This value specifies the number of rows in a segment, and
can be found in the accompanying .sdf file (<SizeGridX>). In the future we will
attempt to automate this.
Similar to the above argument, this specifies the number of columns in an array
segment (<SizeGridY>).
Boolean value specifying the type of output. More details are given below.
Suffix for the two new "per swath" bead-level text file.
Boolean value that, if TRUE, directs the function to print progress to the screen.
quickSummary
65
Details
Data from the iScan system comes with two images of each array section (along with two .locs
files), which are labelled Swath1 and Swath2. These two images are of the two halves of the array
section, with an overlapping region in the middle. However, there is only one bead-level text file,
with no indication as to which of the two images each entry comes from. Given this, simply reading
the bead-level text file will result in any function that uses bead locations performing undesirably.
This function works to try and deconvolute the bead-level data and create two files, one per swath,
which can then be read independently into beadarray.
The exact content of the output files depends upon the fullOutput argument. If the default value
of FALSE is selected the function compares the coordinates in the "perBeadFile.txt" file with those
found in the two .locs files, in order to determine which swath each bead is from. From this two new
bead-level text files (with names containing "Swath1" and "Swath2" are created, containing all the
beads from the orginal file. If the .locs files are not present this process will fail and the assigning
of beads to swaths cannot be performed.
If the fullOutput argument is set to TRUE both text files contain all the beads that can be identified
in their respective images. Assuming that both the .locs and .tif files are present, we can use the
bead-centre coordinates stored in the .locs files to calculate intensity values for beads in both images,
even if no intensity is recorded Illumina’s text file. Any bead that is found in the overlapping
region, and thus appearing in both images, will have two intensities calculated. The files that are
created contain the same data as regular bead-level text files, but with an additional column entitled
"Weights". Beads that appear in both images are assigned a weight of 0.5 (since the are two intensity
values for them), whilst all other beads are given a weigth of 1. If the TIFF images aren’t available
the intensities cannot be calculate, so the output will default to the same as if fullOutput = FALSE.
Value
This function is called for its side effects, which is to produce two text files containing the beads
match to the approriate swath. No value it returned by the function.
Author(s)
Mike Smith and Andy Lynch
quickSummary
Create summary values for specified IDs
Description
A utility function for quickly creating summary values for particular IDs (e.g. control IDs) on a
given section.
Usage
quickSummary(BLData, array = 1, transFun = logGreenChannelTransform, reporterIDs = NULL, reporterTags =
66
readBeadSummaryData
Arguments
BLData
a beadLevelData object
array
Which section to summarize
transFun
a transformation to be applied prior to summarization
reporterIDs
vector specifying the set of IDs to be summarized
reporterTags
a vector that divides the supplied IDs into categories
reporterFun
a function used to summarize each category
Details
The function can be used to calculate summarized values for particular control types on a section.
The IDs for all controls are supplied in the reporterIDs argument along with which control type
they belong to in the reporterTags argument. A summarized value for each control type is then
calculated with the specified function (default is mean).
Author(s)
Mark Dunning
Examples
if(require(beadarrayExampleData)){
data(exampleBLData)
quickSummary(exampleBLData, array=1)
quickSummary(exampleBLData, array=2)
}
readBeadSummaryData
Read BeadStudio gene expression output
Description
Function to read the output of Illumina’s BeadStudio software into beadarray
Usage
readBeadSummaryData(dataFile, qcFile=NULL, sampleSheet=NULL,
sep="\t", skip=8, ProbeID="ProbeID",
columns = list(exprs = "AVG_Signal", se.exprs="BEAD_STDERR",
nObservations = "Avg_NBEADS", Detection="Detection Pval"),
qc.sep="\t", qc.skip=8, controlID="ProbeID",
readBeadSummaryData
67
qc.columns = list(exprs="AVG_Signal", se.exprs="BEAD_STDERR",
nObservations="Avg_NBEADS", Detection="Detection Pval"),
illuminaAnnotation=NULL, dec=".", quote="", annoCols = c("TargetID", "PROBE_ID","SYMBOL"))
Arguments
dataFile
character string specifying the name of the file containing the BeadStudio output
for each probe on each array in an experiment (required). Ideally this should be
the ’SampleProbeProfile’ from BeadStudio.
qcFile
character string giving the name of the file containing the control probe intensities (optional). This file should be either the ’ControlProbeProfile’ or ’ControlGeneProfile’ from BeadStudio.
sampleSheet
character string used to specify the file containing sample infomation (optional)
sep
field separator character for the dataFile ("\t" for tab delimited or "," for
comma separated)
skip
number of header lines to skip at the top of dataFile. Default value is 8.
ProbeID
character string of the column in dataFile that contains identifiers that can be
used to uniquely identify each probe
columns
list defining the column headings in dataFile which correspond to the matrices
stored in the assayData slot of the final ExpressionSetIllumina object
qc.sep
field separator character for qcFile
qc.skip
number of header lines to skip at the top of qcFile
controlID
character string specifying the column in qcFile that contains the identifiers
that uniquely identify each control probe
list defining the column headings in qcFile which correspond to the matrices
stored in the QCInfo slot of the final ExpressionSetIllumina object
illuminaAnnotation
character string specifying the name of the annotation package (only available
for certain expression arrays at present)
qc.columns
dec
the character used in the dataFile and qcFile for decimal points
quote
the set of quoting characters (disabled by default)
annoCols
additional columns containing annotation to be read from the file
Details
This function can be used to read gene expression data exported from versions 1,2 and 3 of the
Illumina BeadStudio application. The format of the BeadStudio output will depend on the version
number. For example, the file may be comma or tab separated of have header information at the
top of the file. The parameters sep and skip can be used to adapt the function as required (i.e.
skip=7 is appropriate for data from earlier version of BeadStudio, and skip=0 is required if header
information hasn’t been exported.
The format of the BeadStudio file is assumed to have one row for each probe sequence in the
experiment and a set number of columns for each array. The columns which are exported for
68
readBeadSummaryData
each array are chosen by the user when running BeadStudio. At a minimum, columns for average
intensity standard error, the number of beads and detection scores should be exported, along with a
column which contains a unique identifier for each bead type (usually named "ProbeID").
It is assumed that the average bead intensities for each array appear in columns with headings of
the form ’AVG\_Signal-ARRAY1’, ’AVG\_Signal-ARRAY2’,...,’AVG\_Signal-ARRAYN’ for the
N arrays found in the file. All other column headings are matched in the same way using the
character strings specified in the columns argument.
NOTE: With version 2 of BeadStudio it is possible to export annotation and sequence information
along with the intensities. We \_don’t\_ recommend exporting this information, as special characters
found in the annotation columns can cause problems when reading in the data. This annotation
information can be retrieved later on from other Bioconductor packages.
The default object created by readBeadSummaryData is an ExpressionSetIllumina object.
If the control intensities have been exported from BeadStudio (’ControlProbeProfile’) this may be
read into beadarray as well. The qc.skip, qc.sep and qc.columns parameters can be used to
adjust for the contents of the file. If the ’ControlGeneProfile’ is exported, you will need to set
controlID="TargetID".
Sample sheet information can also be used. This is a file format used by Illumina to specify which
sample has been hybridised to each array in the experiment.
Note that if the probe identifiers are non-unique, the duplicated rows are removed. This may occur
if the ’SampleGeneProfile’ is exported from BeadStudio and/or ProbeID="TargetID" is specified
(the "ProbeID" column has a unique identifier in the ’SampleProbeProfile’, whereas the "TargetID"
may not, as multiple beads can target the same transcript).
Value
An ExpressionSetIllumina object.
Author(s)
Mark Dunning and Mike Smith
Examples
##Read the example data from
##http://www.switchtoi.com/datasets/asuragenmadqc/AsuragenMAQC_BeadStudioOutput.zip
##To follow this example, download the zip file
## Not run:
dataFile = "AsuragenMAQC-probe-raw.txt"
qcFile = "AsuragenMAQC-controls.txt"
BSData = readBeadSummaryData(dataFile=dataFile, qcFile=qcFile, controlID="ProbeID",skip=0,qc.skip=0, qc.columns=
## End(Not run)
readIdatFiles
readIdatFiles
69
Read BeadScan gene expression output
Description
Function to read IDAT files into beadarray.
Usage
readIdatFiles(idatFiles = NULL)
Arguments
idatFiles
A vector of file paths to the idat files that are to be read.
Details
This function allows IDAT files, produced during the BeadArray scanning, to be read directly into
beadarray. This removes the requirement to use Illumina’s GenomeStudio software to convert
such files into an ASCII format before they can be processed.
The expection is that IDAT files from expression BeadArrays will be read using this function. However, this is not currently checked for explicitly and it is possible that files from other platforms may
be read successfully.
If files from a two-colour array are to be read, they should all be listed in the idatFiles argument.
The function will determine two-colour data is present and act accordingly. If unequal numbers of
green and red files are supplied, or the names of the array sections do not match, the function will
fail.
IDAT files often contain probes that are used as internal controls and are not annotated by Illumina.
Such probes are not included in the output of this function.
Value
An ExpressionSetIllumina object.
Author(s)
Mike Smith
70
readIllumina
readIllumina
Read bead-level Illumina data
Description
Reads bead-level ouput by Illumina’s BeadScan software.
Usage
readIllumina(dir = ".", useImages = FALSE, illuminaAnnotation = NULL, sectionNames = NULL, metricsFile
Arguments
dir
Directory from which to read the data, the default being the current working
directory. If this is set to NULL, a sample sheet can be used (see below)
useImages
Boolean value specifying if bead intensities should be read directly from the
source text files or calculated using the bead centre coordinates and image files.
More details on the intensity calculation used are given below.
illuminaAnnotation
Character string specifiying the Illumina platform on which the data were generated. This is optional and will help to automate some analyses on expression
data. Currently the choices for this argument are Humanv4, Humanv3, Humanv2, Humanv1, Mousev2, Mousev1, Mousev1p1, Ratv1.
sectionNames
Optional vector of character strings corresponding to section names to be read
in. Typically these are the 10 digit numeric ID of Illumina chip followed by an
underscore and capital letter
metricsFile
Optional name of a metrics file to be read in from the directory. Defaults to
Metrics.txt. See details below for more information.
forceIScan
Only necessary for data from iScan machines. When TRUE, this argument
forces beadarray to read data from files with the "perBeadFile.txt" extension,
rather than seeking a file per swath. Use this if you are receiving the error
"iScan data detected. This must first be processed with the function processSwathData()", but don’t have access to .locs and .tif files for the array.
dec
Decimal point character. This should be a character string containing just one
single-byte character.
sampleSheet
A comma-separated file that can be used to define the sections that make up the
experiment to be analysed. See readSampleSheet for the specifications of this
file
...
Other arguments to pass when reading bead-level text files.
readIllumina
71
Details
The bead-level data can be generated by any Illumina assay (expression, genotyping, methylation)
and via BeadChips or Sentrix Array Matrix. However, some operations within the package are optimised for expression data. For optimal performance, BeadScan needs to be modified to output coordinates for each bead and to include outliers. See http://www.compbio.group.cam.ac.uk/Resources/illumina/index.html
for details.
If present, the function will automatically read the following files from the directory
.txt Text file that lists the ID, coordinates and intensity for every decoded bead on an array section.
The intensities have been subjected to a local background correction. If useImages = FALSE these
intensities will be used as a starting point for analysis
.sdf Illumina\’s Sample Description File for the entire chip or SAM. This is used within beadarray
to determine the physical properties of a section.
.locs Locations of all beads on the array (i.e. including all those that could not be decoded)
Metrics.txt Illumina\’s metrics that are produced at the time of scanning. Identification of the Metrics file is defined by the metricsFile argument. Internally, this argument is passed to grep. The
default will thus find other items such as "Metrics.txt2" or "OtherMetrics.txt". To avoid these being
read you can use a more specific regex such as "^Metrics.txt$".
Separate functionality exists to read and manipulate TIFF images that may be found in the same
directory. See readTIFF.
If useImage is set to TRUE, intensities are extracted from the TIFF images using the bead-centre
coordinates provided in the text file. Foreground values are calculated from a sharpened version
of the image as described in Kuhn et al. Background values are calculated as the median of the 5
lowest pixels in a 17x17 pixel square around the bead-centre, detailed in Smith et al.
Value
Returns an object of class beadLevelData-class
Author(s)
Mike Smith, Mark Dunning, Andy Lynch
References
Kuhn K, Baker SC, Chudin E, Lieu MH, Oeser S, Bennett H, Rigault P, Barker D, McDaniel TK,
Chee MS. A novel, high-performance random array platform for quantitative gene expression profiling. Genome Research. 2004;14(11):2347-2356
Smith ML, Dunning MJ, Tavare S, Lynch AG. Identification and correction of previously unreported
spatial phenomena using raw Illumina BeadArray data. BMC Bioinformatics. 2010;11:208
72
readSampleSheet
readLocsFile
Read “.locs” file.
Description
Reads the binary Illumina bead location files and returns a matrix of the coordinate pairs for every
bead on the array.
Usage
readLocsFile(fileName)
Arguments
fileName
A string containing the name of the “.locs” file to be read.
Details
The locs file contains bead centre locations for every bead on the array, unlike the bead level text
files, with contain just the beads that were decoded. Reading these can be useful if one wants to
verify that the image registration was successful, or is interested in the locations of the undecoded
beads.
The locs file itself is in a binary format, with each of the bead locations stored as a pair of doubles.
The first 2 bytes contain header information, with the 3rd byte containing the number of probes on
the array. The location information begins with the 4th byte.
Value
Returns a two column matrix of bead coordinates, one row per bead.
Author(s)
Mike Smith
readSampleSheet
Read a Sample sheet for a BeadArray experiment
Description
Read a comma-separated sample sheet into beadarray, which can then be used to annotate the data
that beadarray reads in and add relevant metadata to the analysis.
Usage
readSampleSheet(sheet = "sampleSheet.csv")
readTIFF
73
Arguments
sheet
A file name for the sample sheet
Details
The sample sheet should describe all sections are expected to be part of the experiment, along with
any relevant metadata. We assume the GenomeStudio sample sheet specification, with [Data] and
[Header] sections. The Data section is where the sample metadata are defined. One row is required
for each section, and the columns Sentrix\_ID, Sentrix\_Position, Sample\_Name, Sample\_Group
must be present. The Sentrix\_ID and Sentrix\_Position columns give the name of the chip (usually
a 10 digit number) and slot (a letter A to L) where a given sample was hybridised to. The Sample\_Group and Sample\_Name columns can take any valid R name. If there are muliple images
per section, for example for Mouse WG-6 data, which have bead-level data suffixed by A\_1, A\_2,
B\_1, B\_2 etc, only one entry is required in the sample sheet for sections A and B. beadarray will
duplicate the metadata as neccessary.
Value
a list comprised of a tabular sample table and any header information that is present.
Author(s)
Mark Dunning
readTIFF
Read the Illumina tiff images
Description
Reads Illumina tiff images and produces a matrix of pixel values.
Usage
readTIFF(fileName, path = NULL, verbose = FALSE, xlim = NULL, ylim = NULL)
Arguments
fileName
String specifying the name of the tiff image to be read.
path
String specifying the path to the desired image. The default value of NULL
means the current working directory will be used.
verbose
If TRUE then details from the header of the tiff are printed as it is read. These
include things like the byte order, the number of pixels in the image, the number
of tags in the header etc. Defaults to FALSE as this is generally not of interest.
xlim
Used to specify a subsection of the image to read in. Takes a two entry vector e.g c(m,n) specifying that only pixels with x-coordinates between m and n
(inclusive) should be read in.
ylim
Same a xlim, but for the y-cordinates.
74
sectionNames
Details
This function has been specifically written to read the grayscale tiff images which are produced by
the Illumina scanners. It is not generic enough to read all tiff files, although this functionality may
be added in the future.
Given that the raw images can be quite large, functionality has also been included to read tiffs
that have been compressed as either .bz2 or .gz files. Identification is performed based on the file
extension and it is assumed that each tif is compressed individually. Support for zip files may be
added in the future.
Value
Returns a matrix with the same dimensions as the pixels in the tiff file to be read in.
Author(s)
Mike Smith
sectionNames
Gets the section names from a beadLevelData Object
Description
Retrieves the section names from a beadLevelData object.
Usage
sectionNames(object, arrays=NULL)
Arguments
object
Object of class beadLevelData
arrays
integer (scalar or vector) specifying the sections/arrays to retrieve the names of.
When NULL the names of all sections/arrays are returned.
Details
sectionNames retrieves the name of the sections from the sectionInfo slot.
Value
A character vector containing the names of the individual sections.
Author(s)
Mark Dunning
setWeights
75
Examples
if(require(beadarrayExampleData)){
data(exampleBLData)
sectionNames(exampleBLData)
}
setWeights
Set weights from BASH
Description
Function for committing the weights calculated by BASH into the beadLevelData object
Usage
setWeights(BLData, wts, array, combine = FALSE, wtName = "wts")
Arguments
BLData
a beadLevelData object
wts
the wts component of the BASH output
array
a vector of arrays that we want to set the weights for
combine
if TRUE combine the weights with existing weights (if they exist)
wtName
name of column to assign weights to
Value
Modified beadLevelData object
Author(s)
Mark Dunning
76
show-method
show-method
Display object summary
Description
Prints a summary of an objects contents.
Usage
## S4 method for signature beadLevelData
show(object)
## S4 method for signature ExpressionSetIllumina
show(object)
Arguments
object
An object of class beadLevelData or ExpressionSetIllumina
Details
show is commonly invoked by simply entering the name of an object. Calling it on the classes
defined in beadarray will print a summary of the object contents, with the actual output dependent
on the class of the object.
Output for the beadLevelData class is broken down into three sections: experiment information,
data that relate to each array section and data for individual beads. The full information relating to
the first two groups will be display, with only a short summary of the per-bead information shown
(currently 5 beads from the first section).
The ExpressionSetIllumina class is based up the eSet class and the output from show is closely
related, with a short summary of the contents of available slots.
Author(s)
Mark Dunning
showArrayMask
showArrayMask
77
Show Array Mask
Description
Function to display beads masked by BASH. The masked beads are assumed to have a weight of 0
in the specified weights column.
Usage
showArrayMask(BLData,array = 0, override = FALSE, wtsName = "wts", transFun = logGreenChannelTransform,
Arguments
BLData
A BeadLevelList object.
override
Logical. Plotting a large mask can cause slowdown problems. By default, if
more than 200 000 beads are masked, the current mask will not be plotted. You
can force the mask to be plotted by setting this argument to TRUE, however beware as this may cause slower systems to freeze.
wtsName
name under which the bead weights are stored
array
numeric index of the array to plot
transFun
function to transform intensities prior to calculating outliers
outlierFun
function to remove outliers
horizontal
if TRUE the resulting image is plotting with the longest edge along the x axis
Details
showArrayMask plots the beads on an array that have been assigned a weight of 0 by BASH in red,
and beads determined to be outliers in black.
Value
None returned
Author(s)
Jonathan Cairns and Mark Dunning
78
squeezedVarOutlierMethod
Examples
if(require(beadarrayExampleData)){
data(exampleBLData)
showArrayMask(exampleBLData,2)
}
squeezedVarOutlierMethod
Identifier outliers on an array section
Description
An outlier calling method that shrinks the observed variance for a bead-type towards the predicted
variance based on all bead-types on the array-section.
Usage
squeezedVarOutlierMethod(inten, probeList, wts=1, n = 3, predictNlim=14)
Arguments
inten
a list of intensities
probeList
the IDs corresponding to each intensity value
wts
Weights associated with beads, indicating those recommended for removal by,
for example, BASH
n
number of SDs cutoff used
predictNlim
how many beads of a bead-type must be present for that bead-type to contribute
to prediction of variances?
Details
This function is called within the summarize routine of beadarray to exclude outlying beads from
an array-section prior to summary. The intensities are not assumed to be on any particular scale and
can result from any user-defined transformation function, however a log-transformation is recommended.
Bead-types that have predictNlim numbers are used to locally regress bead-type precision against
bead-type mean, as well as the squared residual error of bead-type precision against bead-type
mean. These are then used as prior values for the distribution of precision to feed into a standard
Bayesian calcuation to obtain an estimate of the posterior variance.
Beads with weight zero do not contribute to the outlier calling.
summarize
79
Value
the positions in the original vector that were determined to be outliers
Author(s)
Andy Lynch
See Also
illuminaOutlierMethod
Examples
if(require(beadarrayExampleData)){
data(exampleBLData)
oList = squeezedVarOutlierMethod(logGreenChannelTransform(exampleBLData, 1), getBeadData(exampleBLData, array=1,
}
summarize
Create a summarized object
Description
Function to summarize the data in a beadLevelData object into a form more ameanable for downstream analysis (with the same number of observations for each bead type).
Usage
summarize(BLData, channelList = list(greenChannel), probeIDs=NULL, useSampleFac = FALSE, sampleFac=
Arguments
BLData
An object of class beadLevelData
channelList
List of objects of class illuminaChannel that defines the summarisation to be
performed. The default is to do a log2 transformation and report the mean and
standard deviation of each bead type after outlier removal.
probeIDs
Vector of ArrayAddressIDs to be included in the summarized object. The default
is to summarize all probes.
useSampleFac
if TRUE sections belonging to the same biological sample will be combined.
The default is to summarize each section separately.
sampleFac
optional character vector giving which a sample identifer for each section
80
summarize
weightNames
name of column in the beadLevelData to take extract weights
removeUnMappedProbes
if TRUE and annotation information is stored in the beadLevelData object, any
ArrayAddressIDs that cannot be mapped to ILMN IDs will be removed.
Details
From beadarray version 2.0 onwards, users are allowed more flexibility in how to create summarized data from bead-level data. The illuminaChannel is a means of allowing this flexibility by
definining how summarization will be performed on each array section in the bead-level data object.
The three keys steps applied to each section are; 1) use a transform function to get the quantities
to be summarized (one value per bead). The most common use-case would be to extract the Green
channel intensities and possibly perform a log2 transformation. 2) remove any outliers from this
list of values 3) split the values according to ArrayAddressIDs and apply the definied exprFun and
varFun to the quantities belonging to each ArrayAddress.
Some Illumina chips have multiple sections for the same biological sample; for example the HumanWG6 chip or the Infinium genotyping chips. For such cases it may be more convenient to produce
a summarized object where each column in the output is a different biological sample. This is
especially important for genotpying chips where different SNPs are interrogated on the different
sections, making a section-based summary problematic.
If the useSampleFac argument is set to TRUE, beadarray will try and combine sections belonging to the same sample. If the location of the sdf file for the chip is sucessfully stored in the
experimentData slot of the beadLevelData object, the sdf will be interrogated to determine how
samples were allocated to the chip. Otherwise the user can specifiy a sample factor that is the same
length as the number of sections. If the sample factor is not supplied, or cannot be determined, then
beadarray will summarize each section separately.
During the course of the summary, ArrayAddressIDs present in the beadLevelData object will be
converted to Illumina IDs (prefix ILMN) if the annotation of the object was set by readIllumina
or setAnnotation. The rownames of the resulting ExpressionSetIllumina will be set to these new
IDs, and the featureData slot will contain the original and new IDs. Any control probes present
in the beadLevelData object will retain their original ArrayAddressID and the Status vector in
featureData will report if each probe is a control or regular probe. Some ArrayAddressIDs present
in the beadLevelData object may be neither regular probes will ILMN IDs, or control probes.
These are internal controls used by Illumina and can be stopped from appearing in the summarized
object by choosing the removeUnmappedProbes = TRUE option.
The user can specify a vector of ArrayAddressIDs to be summarized using the probeIDs argument.
Otherwise, a unique set of IDs is derived from all the array sections in the beadLevelData object.
Value
Returns an object of class ExpressionSetIllumina
Author(s)
Mark Dunning
transformFunctions
81
Examples
if(require(beadarrayExampleData)){
data(exampleBLData)
bsd = summarize(exampleBLData)
myMean = function(x) mean(x,na.rm=TRUE)
mySd = function(x) sd(x,na.rm=TRUE)
greenChannel = new("illuminaChannel", logGreenChannelTransform, illuminaOutlierMethod, myMean, mySd,"G")
bsd = summarize(exampleBLData, channelList = list(greenChannel))
bsd
}
transformFunctions
Functions for transforming the data store in a beadLevelData object
for easier visualisation or summarisation.
Description
Functions for transforming the data store in a beadLevelData object for easier visualisation or
summarisation.
Usage
logGreenChannelTransform(BLData, array)
logRedChannelTransform(BLData, array)
logRatioTransform(BLData, array)
Arguments
BLData
beadLevelData object
array
numeric specifying the section to be transformed
Details
beadarray aims to support the whole range of data that can be generated by the Illumina BeadArray
technology and allows users to build upon the functionality in the package to make pipeline to
automtically process their own data and develop new methodologies. Therefore we have made the
quality assessment and summarisation tools general enough to take any kind of values that can
82
weightsOutlierMethod
be derived from the beadLevelData object. This is achieved by the definition of transformation
functions that can be used throughout the package whenever a function is operating on data on a
per-section basis.
The default transformation is to take the data from the Green channel (column Grn in the beadLevelData object) and perform a log2 transformation and is the default to functions such as boxplot or
imageplot.
Users with two channel data (e.g. data from methylation and SNP assays) can use the logRedChannelTransform
function which instead extracts the red channel on the log2 scale or logRatioTransform.
Value
Transformation functions return a numeric vector with the same length as the number of beads for
the particular section.
Author(s)
Mark Dunning
Examples
if(require(beadarrayExampleData)){
data(exampleBLData)
head(exampleBLData[[1]])
log2(getBeadData(exampleBLData, array=1,what="Grn")[1:10])
logGreenChannelTransform(exampleBLData, array=1)[1:10]
}
weightsOutlierMethod
returns all beads with weight=0.
Description
This function identifies those beads that have been set to having a weight of 0. Primarily intended
to allow deprecation of the function showArrayMask by the more flexible outlierplot.
Usage
weightsOutlierMethod(inten, probeList, wts,n=3)
weightsOutlierMethod
83
Arguments
inten
a list of intensities but the intensities are not in fact used
probeList
the IDs corresponding to each intensity value (not used)
wts
Weights associated with beads.
n
another parameter that is not, in fact, used.
Details
This function the locations at which wts is equal to zero.
Value
the positions in the original vector that had weight zero
Author(s)
Andy Lynch
See Also
squeezedVarOutlierMethod
Examples
## Not run:
if(require(beadarrayExampleData)){
data(exampleBLData)
outlierplot(exampleBLData, array=1, outlierFun = weightsOutlierMethod,horizontal = FALSE)
}
## End(Not run)
Index
∗Topic IO
convertBeadLevelList, 27
createTargetsFile, 28
insertBeadData, 43
processSwathData, 64
readBeadSummaryData, 66
readIdatFiles, 69
readIllumina, 70
readLocsFile, 72
readTIFF, 73
summarize, 79
∗Topic \textasciitildekwd1
plotBeadLocations, 57
∗Topic \textasciitildekwd2
plotBeadLocations, 57
∗Topic classes
beadLevelData-class, 17
BeadLevelList-class, 19
beadRegistrationData-class, 19
ExpressionSetIllumina-class, 32
illuminaChannel-class, 38
limmaResults-class, 46
∗Topic datasets
platformSigs, 57
∗Topic documentation
beadarrayUsersGuide, 15
∗Topic hplots
beadIntensityPlots, 16
imageplot, 40
poscontPlot, 63
∗Topic hplot
plotChipLayout, 58
plotMAXY, 60
plotTIFF, 61
∗Topic manip
deprecatedFunctions, 30
getBeadData, 34
imageProcessing, 42
numBeads, 55
sectionNames, 74
∗Topic methods
boxplot-methods, 20
combine, 25
dim, 30
medianNormalise, 50
metrics-methods, 51
normaliseIllumina, 53
show-method, 76
∗Topic misc
BASH, 7
BASHCompact, 10
BASHDiffuse, 12
BASHExtended, 14
checkRegistration, 24
generateNeighbours, 33
HULK, 35
showArrayMask, 77
∗Topic package
beadarray-package, 3
[,ExpressionSetIllumina,ANY-method
(ExpressionSetIllumina-class),
32
[,ExpressionSetIllumina-method
(ExpressionSetIllumina-class),
32
[,limmaResults-method
(limmaResults-class), 46
[[,beadLevelData,ANY,missing-method
(beadLevelData-class), 17
addFeatureData, 3
Annotation, 4
annotation (Annotation), 4
annotation,beadLevelData-method
(Annotation), 4
annotation,ExpressionSetIllumina-method
(Annotation), 4
annotation<-,beadLevelData,character-method
(Annotation), 4
84
INDEX
85
annotation<-,ExpressionSetIllumina,character-method
ContrastMatrix (limmaResults-class), 46
(Annotation), 4
ContrastMatrix,limmaResults-method
arrayNames (deprecatedFunctions), 30
(limmaResults-class), 46
arrayNames,BeadLevelList-method
ContrastMatrix<- (limmaResults-class),
(BeadLevelList-class), 19
46
ArrayWeights (limmaResults-class), 46
ContrastMatrix<-,limmaResults,matrix-method
arrayWeights, 45
(limmaResults-class), 46
ArrayWeights,limmaResults-method
controlProbeDetection, 26, 32
(limmaResults-class), 46
convertBeadLevelList, 27
ArrayWeights<- (limmaResults-class), 46
createBeadSummaryData
ArrayWeights<-,limmaResults,numeric-method
(deprecatedFunctions), 30
(limmaResults-class), 46
createGEOMatrix
(makeGEOSubmissionFiles), 46
backgroundCorrectSingleSection, 6
createGEOMeta (makeGEOSubmissionFiles),
BASH, 7, 12, 14, 15, 34, 36, 39, 78
46
BASHCompact, 8, 9, 10, 13
createTargetsFile, 28
BASHDiffuse, 8, 9, 12, 15
BASHExtended, 9, 14
deprecatedFunctions, 30
beadarray-package, 3
DesignMatrix (limmaResults-class), 46
beadarrayUsersGuide, 15
DesignMatrix,limmaResults-method
beadIntensityPlots, 16
(limmaResults-class), 46
beadLevelData, 20, 25, 30, 43, 76
DesignMatrix<- (limmaResults-class), 46
beadLevelData-class, 17
DesignMatrix<-,limmaResults,matrix-method
BeadLevelList-class, 19
(limmaResults-class), 46
beadRegistrationData, 25
Detection
beadRegistrationData-class, 19
(ExpressionSetIllumina-class),
beadStatusVector, 27
32
beadStatusVector
Detection,ExpressionSetIllumina-method
(identifyControlBeads), 37
(ExpressionSetIllumina-class),
boxplot,beadLevelData-method
32
(beadLevelData-class), 17
Detection<boxplot,beadRegistrationData-method
(ExpressionSetIllumina-class),
(beadRegistrationData-class),
32
19
Detection<-,ExpressionSetIllumina,matrix-method
boxplot,ExpressionSetIllumina-method
(ExpressionSetIllumina-class),
(boxplot-methods), 20
32
boxplot-methods, 20
dim, 30
dim,beadLevelData-method (dim), 30
calculateDetection, 21, 27
dim,ExpressionSetIllumina-method (dim),
calculateOutlierStats, 23, 32
30
checkPlatform (deprecatedFunctions), 30
dim,limmaResults-method
checkRegistration, 20, 24
(limmaResults-class), 46
combine, 25
combine,beadLevelData,beadLevelData-method
eBayes, 45
(combine), 25
eSet, 32
combine,ExpressionSetIllumina,ExpressionSetIllumina-method
expressionQCPipeline, 31
(combine), 25
ExpressionSetIllumina, 25, 30, 76
combinedControlPlot
(expressionQCPipeline), 31
ExpressionSetIllumina-class, 32
86
exprs,ExpressionSetIllumina-method
(ExpressionSetIllumina-class),
32
exprs<-,ExpressionSetIllumina,matrix-method
(ExpressionSetIllumina-class),
32
generateNeighbours, 8, 9, 11, 12, 14, 15, 33
genericBeadIntensityPlot
(beadIntensityPlots), 16
getAnnotation, 37
getAnnotation (deprecatedFunctions), 30
getArrayData (deprecatedFunctions), 30
getArrayData,BeadLevelList-method
(BeadLevelList-class), 19
getBeadData, 18, 34
getControlProfile (Annotation), 4
greenChannel (illuminaChannel-class), 38
greenChannelTransform
(transformFunctions), 81
HULK, 7, 9, 34, 35
identifyControlBeads, 37
illuminaBackground (imageProcessing), 42
illuminaChannel-class, 38
illuminaForeground (imageProcessing), 42
illuminaOutlierMethod, 11, 36, 39, 79
illuminaSharpen (imageProcessing), 42
imageplot, 31, 32, 40, 41
imageProcessing, 42
insertBeadData, 18, 36, 43
insertSectionData, 44
lapply, 49
limmaDE, 45
limmaResults-class, 46
lmFit, 45
LogFC (limmaResults-class), 46
LogFC,limmaResults-method
(limmaResults-class), 46
LogFC<- (limmaResults-class), 46
LogFC<-,limmaResults,matrix-method
(limmaResults-class), 46
logGreenChannelTransform, 36, 41
logGreenChannelTransform
(transformFunctions), 81
LogOdds (limmaResults-class), 46
LogOdds,limmaResults-method
(limmaResults-class), 46
INDEX
LogOdds<- (limmaResults-class), 46
LogOdds<-,limmaResults,matrix-method
(limmaResults-class), 46
logRatioTransform, 41
logRatioTransform (transformFunctions),
81
logRedChannelTransform, 41
logRedChannelTransform
(transformFunctions), 81
makeContrasts, 45
makeControlProfile (makeQCProfile), 48
makeGEOSubmissionFiles, 46
makeQCProfile, 48
makeQCTable, 32, 49
medianBackground (imageProcessing), 42
medianNormalise, 50
metaTemplate, 51
metrics (metrics-methods), 51
metrics,beadLevelData-method
(metrics-methods), 51
metrics-methods, 51
nObservations
(ExpressionSetIllumina-class),
32
nObservations,ExpressionSetIllumina-method
(ExpressionSetIllumina-class),
32
nObservations<(ExpressionSetIllumina-class),
32
nObservations<-,ExpressionSetIllumina,matrix-method
(ExpressionSetIllumina-class),
32
noOutlierMethod, 52
normaliseIllumina, 53
numBeads, 55
numBeads,beadLevelData-method
(beadLevelData-class), 17
outlierplot, 32, 56
p95 (metrics-methods), 51
p95,beadLevelData,character-method
(metrics-methods), 51
platformSigs, 57
plot,limmaResults-method
(limmaResults-class), 46
INDEX
plotBeadIntensities
(beadIntensityPlots), 16
plotBeadLocations, 57
plotChipLayout, 58
plotMA (plotMAXY), 60
plotMA,ExpressionSetIllumina-method
(plotMA-methods), 59
plotMA-methods, 59
plotMAXY, 60
plotTIFF, 61
plotXY (plotMAXY), 60
poscontPlot, 31, 32, 63
processSwathData, 64
PValue (limmaResults-class), 46
PValue,limmaResults-method
(limmaResults-class), 46
PValue<- (limmaResults-class), 46
PValue<-,limmaResults,matrix-method
(limmaResults-class), 46
qcData (ExpressionSetIllumina-class), 32
qcData,ExpressionSetIllumina-method
(ExpressionSetIllumina-class),
32
quickSummary, 65
readBeadSummaryData, 66
readIdatFiles, 69
readIllumina, 17–19, 32, 49, 70
readLocsFile, 72
readSampleSheet, 72
readTIFF, 42, 62, 71, 73
redChannelTransform
(transformFunctions), 81
removeBeadData (insertBeadData), 43
87
se.exprs<-,ExpressionSetIllumina,matrix-method
(ExpressionSetIllumina-class),
32
sectionNames, 74
sectionNames,beadLevelData-method
(beadLevelData-class), 17
setAnnotation, 32, 49
setAnnotation (deprecatedFunctions), 30
setWeights, 75
show,beadLevelData-method
(show-method), 76
show,beadRegistrationData-method
(show-method), 76
show,ExpressionSetIllumina-method
(show-method), 76
show,limmaResults-method (show-method),
76
show-method, 76
showArrayMask, 77
snr (metrics-methods), 51
snr,beadLevelData,character-method
(metrics-methods), 51
squeezedVarOutlierMethod, 11, 36, 40, 52,
78, 83
suggestAnnotation (Annotation), 4
summarize, 39, 78, 79
transformFunctions, 81
weightsOutlierMethod, 82
sampleSheet (readSampleSheet), 72
sampleSheet,beadLevelData-method
(readSampleSheet), 72
sampleSheet,ExpressionSetIllumina-method
(readSampleSheet), 72
sampleSheet<- (readSampleSheet), 72
sampleSheet<-,beadLevelData,data.frame-method
(readSampleSheet), 72
sampleSheet<-,ExpressionSetIllumina,data.frame-method
(readSampleSheet), 72
se.exprs,ExpressionSetIllumina-method
(ExpressionSetIllumina-class),
32


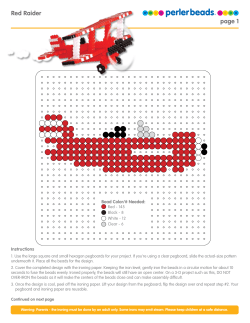
© Copyright 2026