
An Examination of the Factors Influencing Software Development Effort
International Journal of Computer, Information, and Systems Science, and Engineering 1;3 © www.waset.org Summer 2007
An Examination of the Factors Influencing Software
Development Effort
Zhizhong Jiang and Peter Naudé
Abstract—Effective evaluation of software development effort is
an important aspect of successful project management. Based on a
large database with 4106 projects ever developed, this study
statistically examines the factors that influence development effort.
The factors found to be significant for effort are project size,
average number of developers that worked on the project, type
of development, development language, development platform,
and the use of rapid application development. Among these
factors, project size is the most critical cost driver.
Unsurprisingly, this study found that the use of CASE tools
does not necessarily reduce development effort, which adds
support to the claim that the use of tools is subtle. As many of
the current estimation models are rarely or unsuccessfully
used, this study proposes a parsimonious parametric model for
the prediction of effort which is both simple and more
accurate than previous models.
Keywords—Development effort, function points, team size,
development language, CASE tool, rapid application development.
I. INTRODUCTION
I
N recent years the dramatic improvements in hardware
performance and vast increases in memory and storage
capacity have precipitated more sophisticated computerbased systems. Software has become the key factor
influencing the success of computer-based systems [1].
However, software is expensive to develop. While hardware
costs have decreased considerably, now comprising less than a
fifth of total system expenditure, the cost of software
development remains consistently high [2]. In software
development, the primary problem that has yet to be solved
satisfactorily is making systems cost-effective and of higher
quality.
Faced with increasingly high development costs, firms
developing software tend to look for ways to decrease their
development costs. Commercial software organizations also
want to have the advantage of shortening software
development life-cycles and achieving a faster time to market.
This research was supported by the ISBSG (International Software
Benchmarking Standards Group).
Zhizhong Jiang was with Department of Statistics, University of Oxford. He
is now with University of Manchester, Booth Street West, Manchester, M15
6PB, UK (phone:+44 (0) 8708328131; fax: +44 (0) 1612756596; e-mail:
[email protected]).
Peter Naudé was with University of Bath. He is now with Manchester
Business School, Booth Street West, Manchester, M15 6PB, UK (e-mail:
[email protected]).
182
Reducing development effort is an important way to achieve
this advantage.
While research has been focused on the accuracy and
reliability of the estimation of software development effort,
there are relatively few studies that statistically examine the
factors influencing development effort. Instead, a large
research stream has aimed at investigating the factors or
methods that can improve software development productivity
(e.g., [3-8]). Productivity is conceptualized as output produced
per unit of input, and normally defined as project size divided
by development effort. Clearly, unless the functional size of
the project can be controlled, the increase of productivity does
not necessarily reflect the reduction of development effort.
In the past many techniques have been developed to reduce
software development effort. For instance, the promise of
CASE (computer-aided software engineering) tools is to
increase productivity and reduce the cost of software
development [9], and all fourth-generation languages are
designed to reduce programming efforts [10]. However, a
majority of organizations reported that the use of CASE tools
has not brought about any change in productivity [11].
Therefore, the practical usefulness of these techniques still
needs to be investigated.
Furthermore, estimating the amount of effort required for
developing a system is important for effective project
management. Clearly, accurate estimates are essential since
both the client and project management team must agree on
the boundaries of cost, time and quality. A low estimate may
either cause loss or compromise the quality of the software
developed, resulting in partially functional or insufficiently
tested software that requires subsequently high maintenance
costs [12]. On the other hand, overestimates can result in
noncompetitive contract bids as well as over allocation of
development resources and personnel [13]. It is useful to
regard software development as an economic production
process [14].
The estimation of development effort has been widely
researched in the past. The various techniques that have been
used are expert judgment, algorithmic models and different
machine learning techniques including artificial neural
networks (e.g., [13, 15]), Bayesian network (e.g., [16]), fuzzy
logic (e.g., [17]), and decision trees (e.g., [18]). Most
estimation models in use or proposed in the literature are
based on statistical techniques [19], particularly regression
analysis.
Unfortunately whereas numerous models have been
proposed, two-thirds of all major software projects
substantially overrun their estimates [20]. In practice, many of
the estimation models are used rarely or unsuccessfully [21,
22]. This is due to either the unreliability or else obscurity of
International Journal of Computer, Information, and Systems Science, and Engineering 1;3 © www.waset.org Summer 2007
the proposed models. For example, although the explanatory
power of the model developed by Albrecht and Gaffney [23]
is relatively high (R2=87.4%), the model is problematic with
serious autocorrelation of the residuals [24]. With regard to
the traditional COCOMO model, the main disadvantage is that
the underlying concepts and ideas are not publicly defined and
the users are provided with the model as a black box [25].
Consequently, estimating software development effort still
remains to be a complex problem requiring considerable study.
Our research has two main objectives. First, we aim to
identify the factors that significantly influence software
development effort. This should enable project managers to
choose the most appropriate development techniques to
control the development costs. Second, as many of the current
estimation models are used rarely or unsuccessfully, we
attempt to develop a useful model for the prediction of effort
with reasonably high accuracy. Therefore our research has
both of theoretical and managerial significance.
This paper is organized as follows. Section II presents seven
hypotheses and their theoretical justifications. To test the
hypotheses, section III provides the details of the model
development and validation. Discussions based on the model
are given in section IV. Finally, section V presents the
conclusions and limitations of this study.
II. RESEARCH HYPOTHESES
A large part of software cost comes from the development
effort. Software development effort is the time taken to
complete a software project. It is usually defined as the total
man-hours or man-months taken to complete the project. This
section focuses on the propositions of the hypotheses with
regards to the potential factors that affect development effort.
Clearly, large projects entail more working effort. Therefore,
we propose the following hypothesis.
Hypothesis 1: Project size is positively related to software
development effort.
B. Average Team Size
Average team size is the average number of people that
worked on the project across all the development phases (e.g.
software building, testing). Compared to the metric of
maximum team size that has been examined by some
researchers (e.g. [33, 34]), we consider it to be more
appropriate to use the metric of average team size as an
underlying estimator of development effort. Maximum team
size is the maximum number of people that worked at any
phase of the development. It is obvious that a project with
large maximum team size does not necessarily lead to great
development effort, provided that other development phases
have small team sizes. Hence the effect of team size on
development effort can be more appropriately examined with
average team size.
Team size has been widely investigated as an influential
factor for development productivity. Literature supports a
negative relationship between team size and development
productivity (e.g., [7, 8, 35-37]), where productivity is defined
as project size divided by development effort. Therefore, the
negative relationship indicates that team size and development
effort are positively correlated when the project size is given.
This leads to our second hypothesis.
Hypothesis 2: Average Team size is positively related to
software development effort.
C. Development Language
A. Project Size
Hitherto over a thousand different development languages
have been designed by various groups and international
committees [38]. Programming languages have evolved
tremendously since the emergence of machine-level languages.
Whereas past decades have seen the development of fifthgeneration languages, in fact a majority of the software
organizations are still broadly using third-generation
languages (e.g. C++, Java) and fourth-generation languages
(e.g. SQL). In practice, all fourth-generation languages are
designed to reduce programming efforts, and they are more
productive than third-generation languages [10]. Therefore,
we have the following hypothesis.
Project size is a major estimator in nearly all effort
estimation models (e.g., COCOMO [19], ESTIMACS [26]).
As Fenton [27] observed, most of the approaches for
estimating development effort involve a prediction system in
which the underlying model has the form E = f(S), where E is
the development effort and S is a measure of project size. The
function f may involve other product attributes (e.g.
complexity or required reliability) and process and resource
attributes (e.g. programmer’s experience).
Project size is such an important estimator of development
effort that most effort estimation models consist of two phases
[20, 28]. In the first phase, an estimate of the software size is
made; and in the second, the effort of the project is predicted
based on the estimated software size. Project size is normally
measured with function points (FP) or lines of code (LOC).
The main limitation of a LOC-based model is that it is usually
difficulty to have accurate estimates of lines of code for the
development [29]. On the other hand, while the measure of
function points has been criticized relating to both its
reliability [30] and usefulness of the complexity adjustments
[31], it has been extensively used as part of overall estimation
and planning techniques for software development [9, 32].
Hypothesis 3: Development language contributes
significantly to software development effort. Specifically,
fourth-generation languages (4GL) are more useful for
reducing development effort than third-generation languages
(3GL).
D. CASE tool
Computer-aided software engineering (CASE) is the use of
software tools to support the development and maintenance of
software. With the understanding of how software can be
183
International Journal of Computer, Information, and Systems Science, and Engineering 1;3 © www.waset.org Summer 2007
produced and evolved, CASE tools can be applied to support
all aspects of the software development lifecycle. The promise
of CASE is that it can increase development productivity and
reduce development costs [9]. However, rather surprisingly, a
majority of organizations reported that CASE has not brought
about any change in productivity [11]. Yeh [39] noticed that
“heavy investment in CASE technology has delivered
disappointing results, primarily due to the fact that CASE
tools tend to support the old way of developing software”.
Bruckhaus et al. [40] pointed out that the introduction of
CASE tool does not necessarily improve productivity, and in
certain situations it can actually decrease productivity as it
increases effort on specific activities. Based on these
arguments, we propose the following hypothesis.
G. Development Type
Software can be developed either through new development
or the maintenance (enhancement in particular) of existing
software. While new development starts everything from
scratch, software enhancement simply adds, changes, or
deletes software functionality of legacy systems to adapt to
new and evolving business requirements [46]. Software that
frequently requires maintenance incurs substantial total costs,
hence deserving new development. However, for software that
only needs relatively simple improvement, it is more desirable
to adopt enhancement rather than new development in order to
lower development cost. Thus we have the following
hypothesis.
Hypothesis 7: Software enhancement is generally
preferable to new development so as to reduce development
effort.
Hypothesis 4: The use of CASE tools does not necessarily
reduce development effort.
E. Rapid Application Development
III. METHOD
Rapid application development (RAD) is a software
development technique that focuses on building applications
in a very short amount of time. According to Martin [41], the
advocate of RAD, the key objective of RAD is the fast
development of high-quality systems with low costs. One
advantage of using RAD is that the short time between design
and implementation often means the system is much closer to
the needs which constantly evolve during the development
process [42]. In contrast to the broad discussions of RAD in
practitioner circles, there appears to be very little academic
material assessing RAD [43]. Subramanian and Zarnich [42]
found projects that used RAD achieved significantly higher
productivity than those using traditional systems development
method. This leads to the following hypothesis.
The common difficulty in the study of software metrics is
the lack of accessible and reliable large datasets. Many
contemporary metrics repositories have limited use due to
their obsolescence and ambiguity of documentation [47]. On
the other hand, the data collected by individual researchers
usually have small sample size which is insufficient to give
robust results. Our research used the data repository
maintained by the ISBSG (International Software
Benchmarking Standards Group) which has been widely
researched (e.g., [45, 48-51]). The manual accompanying with
the data gives detailed descriptions of the project attributes.
The data repository is regularly updated with substantial
projects added every year. Therefore, the information provided
by the data repository is up-to-date, making it ideal for the
study of software metrics.
Hypothesis 5: The use of RAD can significantly reduce
development effort.
A. Sample
F. Computer Platform
This study used the latest publication of ISBSG data
repository Release 10. The dataset contains information on
4106 projects of which two thirds were developed between the
years 2000 and 2007. The data kept on each project includes
107 metrics or descriptive pieces of information, including the
project size, number of developers, organization type,
programming language, man-hours worked on the project by
phase, and major defects that made it to production.
Computer platform has been considered an important cost
driver in estimating software effort [44]. In most application
software development, the target machine (e.g. mainframe,
personal computer) often determines the platform
characteristics in which programming needs to be
accomplished [16]. Mainframe computers need to serve
numerous users and process large amount of data quickly.
Software development for mainframe computers requires
considerable effort, while at the other extreme development
for personal computers requires minimum effort. Compared to
single platform development, multi-platform development
needs much more effort involving repeated work on the
building and testing of all the platforms. Midrange computers,
designed to be hosts in multi-user environments, are of
relatively smaller scale than mainframe computers. Past
studies have found computer platform has a significant effect
on software development effort (e.g., [16, 45]). Therefore, we
make the following hypothesis.
B. Data Validation
The ISBSG data repository includes one parameter—Data
Quality Rating, which indicates the reliability of the data
reported. It has four grades A, B, C, and D. While the data
with quality ratings A, B and C are assessed as being
acceptable, little credibility can be given to any data with
rating D. Therefore, we excluded 141 projects with quality
rating D.
Since project size is recorded with function points, the
homogeneity of standardized methodologies for measuring
functional size is essential. Among several different count
Hypothesis 6: Computer platform has a significant effect on
software development effort.
184
International Journal of Computer, Information, and Systems Science, and Engineering 1;3 © www.waset.org Summer 2007
It describes how the development methodology was
acquired. This could be traditional, purchased, developed inhouse, or a combination of purchased and developed.
approaches of function point, NESMA is considered to
produce equivalent results with IFPUG [52]. In data Release
10, 3281 out of 4106 projects used IFPUG as the size count
approach, and there are further 152 projects using NESMA.
Thus, to give more reliable results, projects using size count
approaches other than IFPUG and NESMA were excluded
from the analysis.
Finally, projects with recording errors or unspecified
information were removed. For instance, two projects were
mistakenly recorded with Average Team Size 0.5 and 0.95
respectively. One project was recorded with development
platform ‘HH’.
After data cleaning there are 3322 projects remained. These
data will be used to test the proposed hypotheses.
The significance of the above eight variables were
statistically examined. Other variables were not considered
due to their irrelevance to this study. It is important to point
out that we did not take into account the factor Primary
Programming Language, since particular programming
language (e.g. Java, C++) belongs to one of the generation
languages (e.g. 3GL, 4GL). To do this would have meant that
redundancy is introduced into the model to be developed.
D. Variable Transformations
For the above variables, Summary Work Effort, Functional
Size, and Average Team Size are the only three that were
measured in ratio scales. Since the data for each of these three
variables vary significantly, log-transformations were
undertaken to stabilize the variation. After log transformations,
the scatterplot of Summary Work Effort against Functional
Size is given in Fig. 1, and the scatterplot of Summary Work
Effort against Average Team Size is given in Fig .2. The two
figures show that we can use a linear model to approximate
their relationships.
C. Regression Variables
Our study is based on statistical regression analysis, which
is the most widely used approach for the estimation of
software development effort. In ISBSG data repository, the
parameter Summary Work Effort gives the total effort in hours
spent on the project, and is used as the dependent variable in
the analysis. We now briefly introduce the variables in the
data repository which will be used as the predicators for the
regression analysis.
1) Functional Size
It gives the size of the project which was measured in
function points.
2) Average Team Size
It is the average number of people that worked on the
project through the entire development process.
3) Language Type
It specifies the type of generation languages for the
development, including 2GL, 3GL, 4GL, and ApG
(Application Generator).
Fig. 1 Scatterplot to examine the relationship between
Summary Work Effort and Functional Size after logtransformations.
4) Development Type
It describes whether the software development was a new
development, enhancement or re-development.
5) Development Platform
It defines the primary platform for the development. Each
project was developed for one of the platforms as midrange,
mainframe, multi-platform, or personal computer.
6) Development Techniques
These are the specific techniques used during the
development (e.g., waterfall, prototyping, RAD).
7) CASE Tool Used
It indicates whether the project used any CASE (ComputerAided Software Engineering) tool.
8) How Methodology Acquired
Fig. 2 Scatterplot to examine the relationship between
Summary Work Effort and Average Team Size after logtransformations.
185
International Journal of Computer, Information, and Systems Science, and Engineering 1;3 © www.waset.org Summer 2007
Table II below gives the preferred model with the lowest AIC
value.
As regression based on AIC tends to overestimate the
number of parameters when the sample size is large [54], it is
not appropriate to rely fully on the results produced by AIC.
The use of AIC should be combined with other statistical
criterion such as analysis of variance (ANOVA). Nevertheless,
Table II gives some guide as to the possible factors significant
to development effort, including project size, average team
size, development language and so on.
When considering the factor Development Techniques,
there exist over 30 different techniques in the data repository,
and 766 projects even used various combinations of these
techniques. Our study only considered the ten key
development techniques used, and put all the less common
ones into one group labeled as ‘Other’. The ten techniques are:
Waterfall, Prototyping, Data Modelling, Process Modelling,
JAD (Joint Application Development), Regression Testing,
OO (Object Oriented Analysis & Design), Business Area
Modelling, RAD (Rapid Application Development), and
Event Modelling. We separated each of the ten main
development techniques as one single binary variable with two
levels indicating whether it was used or not (1 = used, 0 = not
used).
The final question related to the data is that there exist
substantial missing values. After data cleaning, the metrics
with large amount of missing values are Average Team Size
(2349), How Methodology Acquired (2068), Development
Techniques (1891), CASE Tool Used (1899), Development
Platform (853), and Language Type (447). This severe level of
missingness results in a small valid sample size for the
regression. Given the rule of thumb suggesting a minimum
sample size of 50+8k (k is the number of predictors) for
multiple regression analysis [53], a large sample size is
required to efficiently assess the significance of each variable
and the model. To solve this question, we added an indicator
variable ‘Missing’, which indicates whether the use of
development techniques was recorded for particular project
(1= recorded, 0= missing). In this way, 1891 projects with
development techniques unrecorded could be saved for the
analysis. After this, the valid sample size is 574, which is
sufficient to perform regression analysis for our study.
TABLE I
SUMMARY OF THE VARIABLES FOR REGRESSION
E. Regression Analysis
Table I below gives the summary of the variables used for
the regression analysis. The variables Effort, Size and
TeamSize are measured in ratio scales, while all others are
measured in nominal scales. The twelve binary variables (from
Waterfall downward) derive from the factor Development
Techniques. Our purpose is to fit a model with Effort as the
dependent variable and all the other variables as the
predicators.
Preliminary
analysis
indicated
that
multicollinearity within the data was not a problem.
The first step was to do the automatic model selection based
on Akaike’s information criterion (AIC). AIC is a measure of
the goodness of fit of an estimated statistical model. Given the
assumption of normally-distributed model errors, AIC is given
as [54]:
Variable
Scale
Effort
Ratio
Summary Work Effort
Size
Ratio
Functional Size
TeamSize
Ratio
Average Team Size.
Language
Nominal
Language Type
DevType
Nominal
Development Type
Platform
Nominal
Development Platform
CASE
Nominal
CASE Tool Used
Methodology
Nominal
How Methodology Acquired
Waterfall
Nominal
1= Waterfall, 0 = Not
Data
Nominal
1 = Data Modelling, 0 = Not
Process
JAD
Nominal
Nominal
1 = Process Modelling, 0 = Not
1 = JAD, 0 = Not
Regression
Nominal
1 = Regression Testing, 0 = Not
Prototyping
Nominal
1 = Prototyping, 0 = Not
Business
Nominal
RAD
Nominal
OO
Nominal
Event
Nominal
Other
Nominal
Missing
Nominal
Descriptions
1 = Business Area Modelling, 0 =
Not
1
=
Rapid
Application
Development
0 = Not
1 = Object Oriented Analysis &
Design
0 = Not
1 = Event Modelling, 0 = Not
1 = uncommon development
techniques
0 = Not
1 = Missing, 0 = Not
TABLE II
REGRESSION RESULTS BASED ON AIC
Regression
AIC
Df
Sum of Sq
Terms
(if variable excluded)
AIC = n log(RSS / n) + 2 p
Here n is the number of observations, RSS is residual sum
of squares, and p is the number of parameters to be estimated.
Since increasing the number of parameters improves goodness
of fit (small RSS), AIC includes a penalty that is a function of
the number of estimated parameters. The preferred model is
the one with the lowest AIC value. Based on this criterion,
log(Size)
1
140.6
-161.7
log(TeamSize)
1
134.4
-170.4
Language
3
22.2
-357.5
DevType
2
14.2
-371.1
Platform
3
13.8
-373.8
Other
1
1.9
-393.7
RAD
1
1.2
-395.1
Missing
1
1.1
-395.3
OO
1
1.0
-395.7
The lowest value of AIC is -395.7.
186
International Journal of Computer, Information, and Systems Science, and Engineering 1;3 © www.waset.org Summer 2007
4
We further used the ANOVA approach (based on Type I
Sums of Squares) to test the significance of the variables.
Type I sums of squares measure the reduction in the residual
sums of squares provided by each additional term in the model.
It depends on the orders that the terms are specified the model.
Therefore, the variables need to be logically added into the
model in order. According to Table II, the exclusion of the
variable Size results in the greatest increase of AIC value.
Thus, the factor project size is most significant to development
effort. Likewise, average team size is the second most
important factor for development effort. AIC provides a good
guide on the order of significance of the variables.
For Type I Sums of Squares, the significance of each
variable is statistically assessed after the removal of the effect
of the more important variables which were added first. Based
on Table II, we can add the variable Size to the regression
model first, then TeamSize, and then Language and so forth.
All the variables in Table I were sequentially added to the
model. Each time when the regression was performed, the
most insignificant variable was removed. The model was then
re-fitted with the remained variables. Continuing this process
we obtained the model with the final sets of significant terms
in Table III (significance level is based on p-value <0.05).
TABLE III
ANOVA BASED ON TYPE I SUMS OF SQUARES
Df
Sum of Sq
F-Value
log(Size)
1
497.8
1026.2
< 10
-15
log(TeamSize)
1
173.7
358.1
< 10
-15
Language
3
35.9
24.7
4.8×10
-15
Platform
3
16.3
11.2
3.8×10
-7
DevType
2
13.5
13.9
1.3×10
-6
RAD
1
2.7
5.5
Other
1
3.9
8.1
573
0.019
4.6×10
-3
Other
-0.27
0.09
NB: the default language type is 2GL, default platform is
Mainframe, and the default development type is Enhancement.
Comparing Table III with Table II, we can see that the two
methods produced similar significant factors for development
effort, although the model based on AIC statistics
overestimated additional two variables (OO and Missing) as
significant. Considering that AIC tends to overestimate the
number of parameters when the sample size is large, we accept
the second parsimonious model as most appropriate for our
study.
According to Table IV, the model is fitted as (the variable
‘Other’ is not useful and not included):
log(Effort)
= 4.24 + 0.56 × log(Size) + 0.68 × log(TeamSize)
+ α i Φ (Language i ) + β j Φ (Platform j ) + γ k Φ (DevType k )
− 0.23 × Φ (RAD)
F. Model Validation
The explanatory power of the fitted model is high at R2 =
72.8%, indicating 72.8% of the variance in the dependent
variable can be explained by this model.
TABLE IV
SUMMARY OF THE REGRESSION RESULTS
Standard
Error
0.027
0.005
Here the function Φ is the indicator function with binary
values of 1 or 0 (a value of 1 means the relevant development
technique in the parentheses is used, otherwise the value is 0).
The default development techniques used are: 2GL for
development language (α1=0), Mainframe for development
platform (β1=0), and Enhancement for development type
(γ1=0). The coefficients αi, βj, and γk can be obtained from
Table IV. The fitted model can be used to estimate the effort
required for the development.
277.9
Coefficients
0.11
P-Value
The significance level is based on p-value <0.05.
Regression
Terms
-0.23
i = 1, 2, 3, 4; j = 1, 2, 3, 4; k = 1, 2, 3
Regression Terms
Residuals
RAD
pvalue
Intercept
4.24
0.30
< 10
-15
log(Size)
0.56
0.03
< 10
-15
log(TeamSize)
0.68
0.04
< 10
-15
Language3GL
-0.40
0.27
Language4GL
-0.85
0.27
LanguageApG
-0.71
0.29
PlatformMidrange
-0.12
0.08
PlatformMulti
-0.15
0.17
PlatformPC
-0.46
0.08
0.136
0.002
0.014
0.116
0.379
3.3×10-
DevTypeNew
0.29
0.07
DevTypeRe
0.56
0.15
8
1.6×10⁵
2.4×10-
Fig. 3 Scatterplot of observed values against fitted values.
187
International Journal of Computer, Information, and Systems Science, and Engineering 1;3 © www.waset.org Summer 2007
size, language type, computer platform, development type, and
Rapid Application Development. The extremely large F-value
for project size indicates that it is the most significant factor
for effort. Average team size is the second most significant
factor.
The regression coefficient of effort on project size after
their log-transformations is 0.56, as shown in Table IV. Thus
hypothesis 1 is supported. Project size is positively related to
the amount of effort spent on the development. This is
consistent with the results of most of the effort estimation
models where project size is always an important component.
Therefore, project size is the intrinsic driver of software
development cost. Given the tremendous significance of
project size to development effort, the accuracy of its
estimation remains to be a key question.
The regression coefficient of effort on average team size
after their log-transformations is 0.68. Hence hypothesis 2,
that an increase in average team size will lead to the rise of
development effort, is supported. This negative effect reveals
that effective project management is not successful for
software organizations. In contrast, some software
organizations are still prepared to increase development team
size although they are aware of the expected increase in
development cost. They reason that more developers can
shorten the development life-cycle, giving the advantage of
faster delivery to the organization or user. However,
Blackburn et al. [7] found that except for the stage of
determining customer’s requirement, faster developing firms
tend to have smaller teams. Hence, raising the number of
developers does not necessarily shrink development time. This
raises the second question of how to decide the proper team
size to efficiently complete the development within the
boundary of time and cost. Effective project planning and
management is more desirable for software development
rather than the excessive use of manpower.
Development language significantly affects development
effort. This can be seen from the regression coefficients of
3GL (-0.40) and 4GL (-0.85). These values are relative to the
value (0) for 2GL which is the default development language.
Accordingly, 4GL is more capable of reducing development
efforts than 3GL. Therefore hypothesis 3 is supported. This is
in accordance with the rule that theoretically all fourthgeneration languages are designed to reduce programming
efforts. While Fifth-generation languages are still in their
infancy, third-generation and fourth-generation languages
prevail in current software development practice.
CASE tools have generated much interest among
practitioners as a potential means to facilitate software
development. However, the fitted model shows that the use of
CASE tool is not a significant factor which supports
hypothesis 4. As other researchers have found, the expected
productivity gains of using CASE tools are subtle [5, 57], or
weakened by a lack of sufficient training and experience,
developer resistance, and increased design and testing time [40,
58-60]. The introduction of the CASE tool can in some
situations decrease the productivity as it increases effort on
specific activities [40]. Heavy investment in CASE technology
has delivered disappointing results [39]. The survey performed
by Flynn et al. [11] revealed that a majority of organizations
reported the use of CASE tools had not brought about a
The standard error of the residuals is 0.696 on 573 degrees
of freedom. Given that the model was fitted with a large
sample size, we can conclude that the accuracy of the model is
reasonably high. Fig. 3 below shows that the fitted values and
observed values conform well to each other.
Furthermore, in linear model it is assumed that the residuals
are normally distributed with zero mean and homogeneity of
variance [55]. Equal scatter of residual points about the
horizontal axis indicates the residuals have homogeneity of
variance [56]. Fig. 4 below gives the diagnostic plot of the
residuals against the fitted values. The points evenly scatter
along the horizontal axis without obvious patterns. Therefore,
the assumption of homogenous variance is validated.
Fig. 4 Diagnostic plot of the residuals against the fitted
values.
Finally, the assumption of normality of the residuals was
checked. Fig. 5 shows that the residuals are normally
distributed with mean zero. Therefore, the normal assumption
is not violated.
Fig. 5 Histogram of the residuals to check the normal
assumption.
IV. DISCUSSIONS
A. Results of the Hypotheses
As shown in Table III, the final sets of factors that are
significant to software development effort based on the normal
significance level p-value <5%, are project size, average team
188
International Journal of Computer, Information, and Systems Science, and Engineering 1;3 © www.waset.org Summer 2007
log(Effort ) = 4.24 + 0.56 × log(1000) + 0.68 × log(10)
change in productivity. Therefore, software practitioners
should avoid the misuse of tools and rethink about their
practical usefulness.
The use of Rapid Application Development (RAD) is
significant for development effort. This supports hypothesis 5.
In particular, the regression coefficient for RAD is -0.23,
which means that controlling all other factors, the use of RAD
can reduce log(Effort) by 0.23. While there are few studies on
the effect of RAD, Subramanian and Zarnich [42] found that
projects using RAD method achieved significantly higher
productivity than those using traditional development method.
Rapid Application Development is particularly useful for
projects where the scope is small or work can be broken down
into manageable segments. Segmenting the development
permits a better estimate of the necessary effort, thus reducing
the risk of underestimating effort [61].
Our study found that computer platform significantly
influences development effort, thus supporting hypothesis 6.
This finding is consistent with past studies (e.g. [16, 45]) that
computer platform has a significant effect on software
development effort. The model further shows that controlling
all other factors, the development effort for personal computer
is lowest (coefficient -0.46), while the effort for midrange
computer (coefficient -0.12) or multi-platform (coefficient 0.15) is moderately high. These are in comparison to the
default computer platform mainframe (coefficient 0) which
requires the largest development effort. Intuitively, the
development for mainframe computers needs huge effort
which has immense processing power to provide a computing
resource that can be shared by an entire company. Midrange
computers are designed on a relatively smaller scale than
mainframe computers, and the development for multi-platform
involves repeated work on the building and testing of all the
platforms, thus making it more effort-consuming than the
development for single platform. Therefore, the regression
results for the factor computer platform are reasonable.
Finally, our results support hypothesis 7. Compared to the
default development type of software enhancement, new
development increases the value of log(Effort) by 0.29. Thus,
for particular development, software enhancement is more
preferable than new development for the sake of reducing
effort. Surprisingly, the regression coefficient for redevelopment is 0.56, which is much larger than that of new
development and enhancement. That is, other things being
equal, software re-development results in more effort than new
development and enhancement.
− 0.85 + 0 + 0.29 − 0.23 = 8.884
Effort = 7216
Hence a total of 7216 man-hours are estimated for the
development.
Furthermore, the model was developed on a basis of large
sample size. The explanatory power of the model is very high
with R2 = 72.8%. Compared to other models built in the
literature, our model has both reliability and high accuracy.
Finally, for linear regression it is assumed that the residuals
are normally distributed with zero mean and homogeneity of
variance. Our model was examined with diagnostic plot,
which justified the use of linear regression.
V. CONCLUSION AND LIMITATIONS
Our research proposed the hypotheses regarding the factors
that potentially influence software development effort. All of
the hypotheses were supported. The factors significant to
software development effort are project size, average number
of developers that worked on the development, type of
development, development language, development platform,
and the use of rapid application development. Among these
factors, project size is the most critical cost driver.
Unsurprisingly, this study found the use of CASE tools does
not necessarily reduce development effort, which adds support
for the claim that the use of tools is complex.
As many of the current estimation models are used rarely or
unsuccessfully, we developed a simple statistical model for the
prediction of effort with reasonably high accuracy. The
validity of the model was tested with diagnostic plots, which
justified the use of linear regression for our study.
Nevertheless, our study still has two limitations. First,
whereas it is conceivable that different programming
languages have varied effects on effort, we did not account for
these consequences. Instead, we used the broad scope of
generation languages as one factor significant to effort.
Considering that the database we used for this study comprises
various types of programming languages, it is difficult and
impractical to consider the effect of every programming
language.
Second, while there are ten main development techniques
(e.g. waterfall, prototyping) in the database, their interactions
were not considered. The reason is that except for waterfall
which was always used alone, the other nine techniques were
arbitrarily combined among the projects in the database.
Hence it is difficult to take into account such a great number
of joint uses of different techniques. This limitation gives us
motivation to continue this research in our future work.
B. Discussions on the Model
As mentioned earlier, one of the objectives of this study is
to develop a model with simplicity and reasonable accuracy.
The model was developed with multiple linear regression
which follows the traditional method of effort estimation. The
parametric model can be easily used to predict the effort
necessary for the development. For instance, suppose one
particular project is a new development for mainframe
platform, with functional size 1000 and average team size 10,
using fourth-generation language and the technique of rapid
application development. Then the effort can be estimated as:
ACKNOWLEDGEMENTS
The authors would like to thank the ISBSG (International
Software Benchmarking Standards Group) for their generous
support for this study.
REFERENCES
189
International Journal of Computer, Information, and Systems Science, and Engineering 1;3 © www.waset.org Summer 2007
[1]
[2]
[3]
[4]
[5]
[6]
[7]
[8]
[9]
[10]
[11]
[12]
[13]
[14]
[15]
[16]
[17]
[18]
[19]
[20]
[21]
[22]
[23]
[24]
[25]
R. S. Pressman, Software Engineering : A Practitioner's Approach.
London: McGraw-Hill, 2005.
J. C. Vliet, Software Engineering : Principles and Practice. Chichester:
Wiley, 1993.
N. R. Howes, "Managing software development projects for maximum
productivity," IEEE Transactions on Software Engineering, vol. SE10,
pp. 27-35, 1984.
R. E. Loesh, "Improving productivity through standard design
templates," Data Processing, vol. 27, pp. 57-59, 1985.
D. N. Card, F. E. McGarry, and G. T. Page, "Evaluating software
engineering technologies," IEEE Transactions on Software Engineering,
vol. SE-13, pp. 845-851, 1987.
G. R. Finnie, G. E. Wittig, and D. Petkov, "Prioritizing software
development productivity factors using the analytic hierarchy process,"
Journal of Systems and Software, vol. 22, pp. 129-139, 1993.
J. D. Blackburn, G. D. Scudder, and L. N. V. Wassenhove, "Improving
speed and productivity of software development: a global survey of
software developers," IEEE Transactions on Software Engineering, vol.
22, pp. 875-885, 1996.
K. Maxwell, L. V. Wassenhove, and S. Dutta, "Software development
productivity of European space, military and industrial applications,"
IEEE Transactions on Software Engineering, vol. 22, pp. 706-718, 1996.
A. W. Brown, D. J. Carney, E. J. Morris, D. B. Smith, and P. F. Zarrella,
Principles of CASE Tool Integration. New York: Oxford University
Press, 1994.
R. Klepper and D. Bock, "Third and fourth generation language
productivity differences," Communications of the ACM, vol. 38, pp. 6979, 1995.
D. Flynn, J. Vagner, and O. D. Vecchio, "Is CASE technology
improving quality and productivity in software development?," Logistics
Information Management, vol. 8, pp. 8-23, 1995.
A. Lee, C. H. Cheng, and J. Balakrishnan, "Software development cost
estimation: Integrating neural network with cluster analysis,"
Information & Management, vol. 34, pp. 1-9, 1998.
K. Srinivasan and D. Fisher, "Machine learning approaches to estimating
software development effort," IEEE Transactions on Software
Engineering, vol. 21, pp. 126-137, 1995.
R. D. Banker, H. Chang, and C. F. Kemerer, "Evidence on economies of
scale in software development," Information and Software Technology,
vol. 36, pp. 275-282, 1994.
A. R. Venkatachalam, "Software cost estimation using artificial neural
networks," presented at 1993 International Joint Conference on Neural
Networks, Nagoya, Japan, 1993.
G. H. Subramanian, P. C. Pendharkar, and M. Wallace, "An empirical
study of the effect of complexity, platform, and program type on
software development effort of business applications," Empirical
Software Engineering, vol. 11, pp. 541-553, 2006.
S. Kumar, B. A. Krishna, and P. S. Satsangi, "Fuzzy systems and neural
networks in software engineering project management," Journal of
Applied Intelligence, vol. 4, pp. 31-52, 1994.
R. W. Selby and A. A. Porter, "Learning from examples: generation and
evaluation of decision trees for software resource analysis," IEEE
Transactions on Software Engineering, vol. 14, pp. 1743-1757, 1988.
B. W. Boehm, T. E. Gray, and T. Seewaldt, "Prototyping vs. specifying:
A multi-project experiment," presented at 7th International Conference
on Software Engineering, Orlando, 1984.
K. Maxwell, L. Van Wassenhove, and S. Dutta, "Performance
Evaluation of General and Company Specific Models in Software
Development Effort Estimation," Management Science, vol. 45, pp. 787803, 1999.
M. van Genuchten and H. Koolen, "On the use of software cost models,"
Information & Management, vol. 21, pp. 37-44, 1991.
T. K. Abdel-Hamid, "Adapting, correcting, and perfecting software
estimates: Amaintenance metaphor " in Computer, vol. 26, 1993, pp. 2029
A. J. Albrecht and J. E. G. Gaffney, "Software function, source lines of
code, and development effort prediction: A software science validation,"
IEEE Transactions on Software Engineering, vol. SE-9, pp. 639-648,
1983.
J. E. Matson, B. E. Barrett, and J. M. Mellichamp, "Software
development cost estimation using function points," IEEE Transactions
on Software Engineering, vol. 20, pp. 275-286, 1994.
F. J. Heemstra, "Software cost estimation," Information and Software
Technology, vol. 34, pp. 627-639, 1992.
[26] H. A. Rubin, "Macroestimation of software development parameters: the
ESTIMACS systems.," in SOFTAIR Conference on Software
Development Tools, Techniques, and Alternatives,. New York: IEEE
Press, 1983, pp. 109-118.
[27] N. Fenton, "Software measurement: A necessary scientific basis," IEEE
Transactions on Software Engineering, vol. 20, pp. 199-206, 1994.
[28] N. D. Singpurwalla, Statistical Methods in Software Engineering:
Reliability and Risk. London: Springer, 1999.
[29] A. Heiat and N. Heiat, "A model for estimating efforts required for
developing small-scale business applications," Journal of Systems and
Software, vol. 39, pp. 7-14, 1997.
[30] C. F. Kemerer, "Reliability of function points measurement: a field
experiment," Communications of the ACM, vol. 36, pp. 85-97, 1993.
[31] C. R. Symons, "Function point analysis: difficulties and improvements,"
IEEE Transactions on Software Engineering, vol. 14, pp. 2-11, 1988.
[32] C. F. Kemerer and B. S. Porter, "Improving the reliability of function
point measurement: an empirical study," IEEE Transactions on Software
Engineering, vol. 18, pp. 1011-1024, 1992.
[33] F. Walkerden and R. Jeffery, "An empirical study of analogy-based
software effort estimation," Empirical Software Engineering, vol. 4, pp.
135-158, 1999.
[34] B. A. Kitchenham, R. T. Hughes, and S. G. Linkman, "Modeling
software measurement data," IEEE Transactions on Software
Engineering, vol. 27, pp. 788-804, 2001.
[35] S. D. Conte, H. E. Dunsmore, and Y. E. Shen, Software Engineering
Metrics and Models. Redwood City, CA: Benjamin-Cummings
Publishing, 1986.
[36] F. Louis, "Team size and productivity in systems development,"
Information Systems Management, vol. 8, pp. 27-35, 1991.
[37] E. Mendes and B. Kitchenham, "Web Productivity Measurement and
Benchmarking," in Web Engineering, E. Mendes and N. Mosley, Eds.
Berlin: Springer, 2006, pp. 75-106.
[38] L. B. Wilson and R. G. Clark, Comparative Programming Languages.
Wokingham: Addison-Wesley, 1988.
[39] R. T. Yeh, "Notes on concurrent engineering," IEEE Transactions on
Knowledge and Data Engineering, vol. 4, pp. 407-414, 1992.
[40] T. Bruckhaus, N. H. Madhavii, I. Janssen, and J. Henshaw, "The impact
of tools on software productivity," IEEE Software, vol. 13, pp. 29-38,
1996.
[41] J. Martin, Rapid Application Development. New York: Macmillan, 1991.
[42] G. H. Subramanian and G. E. Zarnich, "An examination of some
software development effort and productivity determinants in ICASE
tool projects," Journal of Management Information Systems, vol. 12, pp.
143-160, 1996.
[43] P. Beynon-Davies, C. Carne, H. Mackay, and D. Tudhope, "Rapid
application development (RAD): An empirical review," European
Journal of Information Systems, vol. 8, pp. 211-223, 1999.
[44] B. Boehm, C. Abts, and S. Chulani, "Software development cost
estimation approaches–A survey," Annals of Software Engineering, vol.
10, pp. 177-205, 2000.
[45] Q. Liu and R. C. Mintram, "Preliminary data analysis methods in
software estimation," Software Quality Journal, vol. 13, pp. 91-115,
2005.
[46] C. F. Kemerer and S. Slaughter, "Determinants of software maintenance
profiles: An empirical investigation," Journal of Software Maintenance,
vol. 9, pp. 235-251, 1997.
[47] W. Harrison, "A flexible method for maintaining software metrics data:
a universal metrics repository," Journal of Systems and Software, vol. 72,
pp. 225-234, 2004.
[48] C. J. Lokan, "An empirical analysis of function point adjustment
factors," Information and Software Technology, vol. 42, pp. 649-660,
2000.
[49] R. Jeffery, M. Ruhe, and I. Wieczorek, "A comparative study of two
software development cost modeling techniques using multiorganizational and company-specific data," Information and Software
Technology, vol. 42, pp. 1009-1016, 2000.
[50] J. J. Cuadrado-Gallego, M. Sicilia, M. Garre, and D. Rodríguez, "An
empirical study of process-related attributes in segmented software costestimation relationships," Journal of Systems and Software, vol. 79, pp.
353-361, 2006.
[51] J. Moses, M. Farrow, N. Parrington, and P. Smith, "A productivity
benchmarking case study using Bayesian credible intervals," Software
Quality Journal, vol. 14, pp. 37-52, 2006.
[52] NESMA, NESMA FPA Counting Practices Manual 2.0: Nesma
Association, 1996.
190
International Journal of Computer, Information, and Systems Science, and Engineering 1;3 © www.waset.org Summer 2007
[53] S. A. Green, "How many subjects does it take to do a multiple regression
analysis?," Multivariate Behavioral Research, vol. 26, pp. 499-510,
1991.
[54] W. N. Venables and B. D. Ripley, Modern applied statistics with S. New
York: Springer, 2002.
[55] A. C. Rencher, Linear Models in Statistics. New York: John Wiley &
Sons, 2000.
[56] W. J. Krzanowski, An Introduction to Statistical Modelling. London:
Arnold, 1998.
[57] R. E. Yellen, "Systems analysts performance using CASE versus manual
methods," presented at Proceedings of the Twenty-Third Annual Hawaii
International Conference on System Sciences, Kailua-Kona, Hawaii,
1990.
[58] R. J. Norman, G. F. Corbitt, M. C. Butler, and D. D. McElroy, "CASE
technology transfer: A case study of unsuccessful change," Journal of
Systems Management, vol. 40, pp. 33-37, 1989.
[59] W. J. Orlikowski, "CASE Tools and the IS workplace: Some findings
form empirical research," presented at Proceedings of the ACM SIGCPR
Conference on Management of Information Systems Personnel, College
park, Maryland, 1988.
[60] I. Vessey, S. L. Jarvenpaa, and N. Tractinsky, "Evaluation of vendor
products: CASE tools as methodology companions," Communications of
the ACM, vol. 35, pp. 90-105, 1992.
[61] D. Hough, "Rapid delivery: An evolutionary approach for application
development," IBM Systems Journal, vol. 32, pp. 397-419, 1993.
191


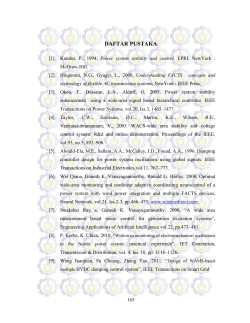


© Copyright 2026