
Ahold Annual Report 2014
Annual Report 2014
Reshaping
Retail
Ahold at a glance
Business review
Governance
Financials
Investors
Contents
Ahold
Annual Report 2014
01
In this year’s report…
Ahold at a glance
Business review
Company profile
03
Group financial highlights
04
Highlights by segment
05
Our brands and how we operate
06
Governance
Financials
Message from Dick Boer,
Ahold CEO
11
Executive Committee
and Management Board
39
Reshaping Retail framework
14
Supervisory Board
41
Our vision and values
15
Corporate governance
Our business model
16
Our promises
Investors
Financial statements
64
Share performance
161
Consolidated income statement
65
Shareholder structure
162
43
Consolidated statement of
comprehensive income
66
Shareholder returns
164
Supervisory Board report
47
Consolidated balance sheet
67
Key dates
165
17
How we manage risk
51
Five-year overview
166
Our strategic pillars
21
Remuneration57
Consolidated statement
of changes in equity
68
Contact information
168
Our formats
23
Declarations62
Cautionary notice
170
Market overview
24
Consolidated statement
of cash flows
69
Our stakeholders
25
Notes to the consolidated
financial statements
70
Group key financial indicators
26
Group financial review
27
Non-GAAP measures
37
Parent company
financial statements
142
Notes to the parent company
financial statements
144
Other information
152
Ahold at a glance
Business review
Ahold at a glance
Governance
Financials
Investors
Ahold
Annual Report 2014
02
Ahold at
a glance
Company profile
03
Group financial highlights
04
Highlights by segment
05
Our brands and how we operate
06
Ahold at a glance
Business review
Governance
Financials
Investors
Company profile
We are Ahold...
We are an international retailing group based in
the Netherlands and active in the United States
and Europe.
Ahold is built on a solid foundation, with strong
and trusted local consumer brands, millions of
loyal customers, leadership in our markets and
proud associates. Operating supermarkets and
selling great food has been our core business for
over 125 years.
Today, we serve our customers’ changing needs
by offering them their channel of choice. We have
a great network of stores and market-leading online
businesses. Through our omni‑channel offering
our customers can shop anytime, anyhow and
anywhere that is most convenient for them.
We work to be an even better neighbor
and make meaningful contributions in all our
communities. We support the health and well-being
of our customers, associates and communities,
source our products responsibly and care about
the environment.
We are able to offer customers great quality
and value, an easy and inspirational shopping
experience, and all the right choices because of
our people. Our associates are passionate about
serving our customers and getting better every day.
The relationships they build with our customers are
an important part of why they keep coming back
to shop with us.
Ahold
Annual Report 2014
3,206
227,000
90 million+
€1.3 billion
Stores serving customers in five countries
Associates
Serving a trade area population of around
Strong and trusted omni-channel retailer, with online net sales of
03
Ahold at a glance
Business review
Governance
Financials
Investors
Group financial highlights
In 2014,
we achieved
net sales of
€32.8bn and
generated
free cash flow
of €1.1bn
Net sales
€ million
Underlying operating income
€ million
€32.8bn
€1.3bn
32,682 32,615 32,774
29,353
1,376
1,377
1,412
Dividend per common share
€
€1.1bn
€0.48
1,109
1,379
30,098
Free cash flow
€ million
1,267
1,051
1,029
1,055
0.47
0.48
2013
2014
0.44
0.40
845
0.29
2010
Read more detail:
See page 26
04
Ahold
Annual Report 2014
2011
2012
2013
2014
2010
2011
2012
2013
2014
2010
2011
2012
2013
2014
2010
2011
2012
Net sales increase at constant
exchange rates
Underlying operating margin
Total returns to shareholders
through dividend payments
and share buyback and capital
repayment programs
Adjusted income from continuing
operations per share
0.8%
3.9%
€2.7bn
€0.88
(2013: 4.2%)
(2013: €1.2bn)
(2013: €0.79)
Ahold at a glance
Business review
Governance
Financials
Investors
Highlights by segment
The strength
of our brands,
with leading
market
positions in all
of our markets,
underpins
our financial
performance
Ahold
Annual Report 2014
USA
Net sales
Underlying operating income
Our brands
The
Netherlands
Net sales
Underlying operating income
Our brands
Net sales
Underlying operating income
Our brands
Stake
Ahold holds 49% of the shares in the
joint venture JMR, and shares equal voting
power on JMR’s board of directors with
Jerónimo Martins, SGPS, S.A.
Our brands
€19,557 million
€738 million
(0.5)% growth in local currency
3.8% underlying operating margin
(before Corporate
59.7% contribution to group net sales 55.5% contribution
Center costs)
€11,696 million
€574 million
1.8% growth
4.9% underlying operating margin
ontribution (before Corporate
35.7% contribution to group net sales 43.1% cCenter
costs)
Belgium
Germany
Czech
Republic
€1,521 million
11.7% growth in local currency
4.6% contribution to group net sales
€19 million
1.2% underlying operating margin
(before Corporate
1.4% contribution
Center
costs)
Joint venture
Portugal
Read more detail:
See pages 07–09
Net sales
€3,565 million
49%
05
Ahold at a glance
Business review
Governance
Financials
Investors
Our brands and how we operate
We operate
strong brands
in all our
markets
Our strong local brands in the United States and
Europe are well-known and popular with customers
– and most are leaders in their markets.
Ahold
Annual Report 2014
United States
Europe
In the United States, we serve a trading area of
approximately 56 million people.
In Europe we serve a trading area of approximately
34 million people in four countries, with the greater
part of our business in the Netherlands and the
Czech Republic, and we also have a growing
presence in Belgium.
The food market remains highly competitive, with
food being sold in a wide range of retail formats as
more and more U.S. retailers use it to drive traffic.
The grocery channel represents approximately
57% of the food market in our trading area. In a
market that was flat year-over-year, Ahold USA’s
market share was down slightly in 2014.1
In Belgium, we operate in Dutch-speaking Flanders.
While the market showed modest volume growth
in a deflationary environment in 2014, Albert Heijn
continued to successfully expand our business there
and gained market share.2
Associates
227,000
In the Czech Republic, the competitive environment
remained intense in 2014. Our Czech business
made a step increase in market share with the
acquisition of the Czech SPAR stores.1
Serving a trade area population of around
90 million+
Find out more about and stay up-to-date
with our brands at:
ahold.com
The food retail sector in the Netherlands showed
limited growth in 2014, but also some further
consolidation in the supermarket industry.
Albert Heijn’s market share grew slightly in 2014.1
1 Based on Nielsen data
2 Source: GfK Belgium
Read more detail:
See page 07
Read more detail:
See pages 08–09
06
Ahold at a glance
Business review
Governance
Financials
Investors
Our brands and how we operate (continued)
Ahold USA
Ahold
Annual Report 2014
Stop & Shop New England
Net sales
€19,557 million
Identical sales growth
(excluding gasoline)
Stop & Shop New York Metro
Stop & Shop is a leading
supermarket brand in the
northeastern United States.
Stop & Shop is a leading
supermarket brand in the northeastern
United States.
Market area
Connecticut, Massachusetts,
and Rhode Island
Market area
Connecticut, New York, and New Jersey
Store formats
Supermarkets and super stores.
Store formats
Supermarkets and super stores.
(0.1)%
216
182
Stores
Stores
Underlying operating margin
3.8%
Giant Landover
Stores
Associates
Pick-up points
768
115,000
209
07
Giant Carlisle
Giant Landover is a leading
supermarket brand in the
mid‑Atlantic United States.
Giant Carlisle is a leading
supermarket brand in the
mid-Atlantic United States.
Market area
Virginia, Maryland, Delaware,
and the District of Columbia
Market area
Pennsylvania, Virginia, Maryland
and West Virginia
Store formats
Supermarkets and super stores.
Store formats
Supermarkets and super stores.
170
Stores
Peapod
Peapod is the leading online grocery
service in the United States. It works
in partnership with Stop & Shop,
Giant Landover and Giant Carlisle.
Market area
Connecticut, District of Columbia, Illinois,
Indiana, Maryland, Massachusetts,
New Hampshire, New Jersey, New York,
Pennsylvania, Rhode Island, Virginia
and Wisconsin
Formats
Online grocery shopping.
200
Stores
Ahold at a glance
Business review
Governance
Financials
Investors
Our brands and how we operate (continued)
The
Netherlands
Albert Heijn is the leading
supermarket and online food retailer
in the Netherlands and one of
the country’s best-known brands.
Albert Heijn also operates in Belgium
where it has a growing presence.
Net sales
€11,696 million
966
Stores
2,105
Store formats
Wine and liquor stores and online shopping.
Associates
97,000
Pick-up points
34
539
Stores
bol.com
Gall & Gall is the leading wine and
liquor retailer in the Netherlands.
4.9%
Store formats
Drugstores and online shopping.
Stores
Gall & Gall
Underlying operating margin
Etos is one of the largest drugstore
chains in the Netherlands.
Store formats
Supermarkets, convenience stores and online
shopping and delivery for food and non-food.
Identical sales growth
(excluding VAT on tobacco sales)
08
Etos
Albert Heijn
Including Belgium and Germany
(0.5)%
Ahold
Annual Report 2014
600
Stores
bol.com is the number one
online retailer in the Netherlands
and also operates in Belgium.
Store formats
Online shopping for general merchandise.
Ahold at a glance
Business review
Governance
Financials
Investors
Our brands and how we operate (continued)
Czech
Republic
Ahold
Annual Report 2014
albert
Albert is among the best-known food
retail brands in the Czech Republic.
Store formats
Compact hypers and supermarkets.
333
Net sales
€1,521 million
Stores
Identical sales growth
(excluding gasoline)
(1.2)%
Underlying operating margin
1.2%
Stores
Associates
333
15,000
Acquisition of SPAR stores in
the Czech Republic completed
Joint venture:
JMR
Ahold holds 49% of the shares in the joint
venture JMR, and shares equal voting power on
JMR’s board of directors with Jerónimo Martins,
SGPS, S.A.
Stake
49%
Net sales
€3,565 million
JMR
Pingo Doce is the largest
supermarket chain in Portugal,
and is managed by JMR.
382
Stores
09
Ahold at a glance
Business review
Governance
Financials
Investors
Business review
Ahold
Annual Report 2014
10
Business
review
Message from Dick Boer, Ahold CEO
11
Reshaping Retail framework
14
Our vision and values
15
Our business model
16
Our promises
17
Our strategic pillars
21
Our formats
23
Market overview
24
Our stakeholders
25
Group key financial indicators
26
Group financial review
27
Non-GAAP measures
37
Ahold at a glance
Business review
Governance
Financials
Investors
Message from Dick Boer, Ahold CEO
Ahold
Annual Report 2014
Dear
shareholders,
We live in a time of unparalleled change in our
industry, and 2014 was no exception. One thing that
never changes, though, is that our customers remain
at the center of all we do and at the heart of our
promise to be a better place to shop. This year our
businesses continued to adapt to the evolving needs
and demands of our customers and we made great
strides in improving the total shopping experience
– online and offline – while offering healthier choices
than ever before.
In 2014, we offered
customers their
channel of choice –
to shop anywhere,
anytime, anyhow
Watch Dick Boer’s review of the year in full at:
www.ahold.com
Exceeded our
Simplicity target,
saving €865 million
from 2012-2014
€865m
New target for
growth in online
consumer sales:
€2.5 billion by
the end of 2017
€2.5bn
Returned
€2.7 billion cash
to shareholders
in 2014
€2.7bn
11
Ahold at a glance
Business review
Governance
Financials
Investors
Message from Dick Boer, Ahold CEO (continued)
Online, convenience, transparency, quality, value,
health: all are trends that are having a major impact
on the food retail sector. Customers have never had
so many ways to shop, and have never known
so much about the products they buy – and their
demands are growing. They want value for their
money, innovative and healthy products, and an
easy shopping experience personalized to their
needs – and they want it today. Retailers who will
be successful in the future will need to provide all this
and more.
After more than 125 years in the business, change
is in our DNA. As food retail continues to evolve,
we see significant growth opportunities in catering
to the rapid shifts in how our customers shop.
Our Reshaping Retail strategy helps us reinvent
the shopping experience for our customers to
maintain our long-term, sustainable profitability while
tackling difficult market circumstances in the short
term. Our promises are helping us to get better
every day for our customers, our associates and
our communities.
Our 2014 financial performance
We grew sales by 0.8% at constant exchange rates
in 2014, reflecting challenging market conditions
with no volume growth and value-focused customers.
Our successful Simplicity cost savings program
enabled us to invest in our customer proposition
while maintaining our operating income at a level
comparable to 2013. Our net income included the
cost of settling the Waterbury litigation, while in 2013
net income had been boosted by the results from the
sale of our former joint venture ICA. We continued to
generate strong free cash flow, exceeding €1 billion
in 2014.
Ahold
Annual Report 2014
Better stores, better value
Developing our omni-channel offering
In 2014, we invested in our value offering and our
in-store experience, to make our stores more attractive
and friendlier places to shop, and provide the right
products at the right prices for our customers.
Although the vast majority of our customers can – and
do – shop in our stores, today they can also order
online for pickup or home delivery. Enabling them to
choose the channel that fits their needs best, online
and offline, is becoming ever more important to
our business.
In the U.S., we launched a program to improve our
customer proposition and rolled it out to around 525
stores during the year. We are investing in our Fresh
offering, enhancing the customer experience through
associate engagement training and making targeted
price reductions across the store. We are seeing
encouraging early results and volumes have started to
pick up in locations where the program has been up
and running for several quarters. We expect to have
it rolled out to all our stores in the first half of 2015.
In the Netherlands, our Albert Heijn business
continued to introduce innovative new products and
make significant improvements to its assortment and
formats. We started to see a positive impact on
sales, especially towards the end of the year, with a
successful holiday season.
Etos also ended the year strong. Our specialty
drugstore business grew in both its health and beauty
care categories in 2014 and managed to attract
more customers and increase sales in a competitive
market. Our liquor store chain, Gall & Gall, is putting
a strong focus on service and staff friendliness, which
consumers recognized by voting it Best Retail Chain
in the Netherlands this year in the Food Specialty
Stores category.
Our acquisition of SPAR’s business in the Czech
Republic was certainly transformational for our
Czech business. We are pleased with the sales
performance of the stores that were rebranded into
Albert and expect to have all stores rebranded by
Easter 2015.
As a result of the acquisition, our Czech business
made a step increase in market share, while Albert
Heijn improved its market share slightly over the year.
In the U.S., market share was down slightly, mainly
related to Giant Landover.
Our stores provide a world of inspiration – serving
as the customer interface, to play a role in our local
communities, to enable customers to taste, try and
test instead of “only” shopping for groceries and
to serve as the connector between the online and
offline world.
For the new generation of “digital natives” coming
of age, online is an integral part of everything they
do. They expect a seamlessly integrated shopping
experience that is at least on par with – and
preferably better than – what the best brick-andmortar stores can offer. Ahold is well-positioned
to serve these demanding customers through our
leading online businesses: Albert Heijn Online,
bol.com and Peapod.
As we move forward, our online growth strategy will
revolve around three elements: “more customers,”
benefiting from general market growth and driving
share growth; “more places,” expanding into new
regions; and “more choices,” expanding the offering
for customers and partners.
We continue to invest in our online capabilities,
technology and marketing in order to stay at the
forefront of omni-channel retail. Albert Heijn Online
is experiencing its highest growth ever and offers
a wide assortment of products and more choices
to our customers. In the U.S., we opened a new
distribution center in the New Jersey area to expand
the capacity of our Peapod business so we can serve
more places and more customers in the metro New
York market.
12
Our online general merchandise retailer bol.com
reached a milestone in 2014 when its store partners,
who are able to sell products on bol.com’s site
through its Plaza marketplace, together achieved
sales in excess of €100 million over a 12-month
period. By opening its doors to outside retailers,
bol.com has increased its offering by over 2.5 million
items and customers can now choose from over nine
million in all.
This year we reached €1.4 billion in total online
consumer sales. In November, we announced the
next stage of our ambition, aiming for a growth in
online consumer sales to €2.5 billion by the end
of 2017. We believe our online business and our
omni-channel offering are crucial for our future growth
and long-term value creation.
Strengthening our own brands
Our own brands are another important part of our
strategy – they enable us to provide a more relevant
assortment of products in different price ranges,
develop new and innovative alternatives and build
customer loyalty.
We further strengthened our own brands this year,
particularly in the U.S., where we increased ownbrand penetration by 0.5% to 37.6%. Our natural
and organic Nature’s Promise and premium Simply
Enjoy ranges are so well executed they are perceived
by customers as separate consumer brands, helping
us drive sales and differentiate our stores. Albert Heijn
expanded its assortment of natural products and
products for special dietary needs during the year,
and launched a new organic own brand, to help
customers make healthy choices. Albert in the Czech
Republic leveraged the scale of our group when it
launched Albert Heijn’s value brand in all its stores
this year.
Ahold at a glance
Business review
Governance
Financials
Investors
Message from Dick Boer, Ahold CEO (continued)
Making healthy choices easy
and affordable
Our focus on healthy own-brand products is only one
example of the work we are doing to help people
make healthy choices, as part of our responsible
retailing strategy. We’re learning more about the
link between food and health, and it is clear that as
food retailers we can have a significant impact on
people’s lives.
Our vision is to make healthy, fresh, sustainable food
available and affordable for all our customers – while
still offering plenty of choices for the occasional
indulgence when they are looking for it. We invest in
our own-brand ranges to offer healthy products at a
good value. We play an important role in showing
our customers how to use our great products through
our magazines – such as Allerhande, the most widely
read magazine among women in the Netherlands,
our websites and through social media. We have
programs in place in all our markets to educate
children on healthy eating – over the past five years
we’ve reached nearly 2.8 million children this way.
It is only by making healthy choices accessible to a
broad section of the population in our markets that
we can have a real impact on our customers’ health,
and therefore their lives.
Responsible Retailing
We want to be a better neighbor and a responsible
retailer everywhere we operate. I am very pleased
with the results we have achieved against our
responsible retailing targets this year. You can
read more about the work we are doing to be a
responsible retailer and a better neighbor in our
Responsible Retailing Report 2014.
Engaged associates
As a retail company, our business is only as good
as our people, and so we are committed to being a
better place to work every day. Our 2014 Associate
Engagement Survey had its highest response rate in
three years and overall engagement was up 1% to
68% – a result that shows we are making progress
in creating a culture where associates feel engaged
and are focused on driving our strategy forward.
Our leadership
2014 was the first full year with our new Ahold
Executive Committee (ExCo) in place and having
leadership from key business and functional areas
in our top management team has already made a
positive impact.
We recently welcomed two new members to our
ExCo. Jan Ernst de Groot started on February 1,
2015, as Chief Legal Officer. He is responsible for
Ahold’s legal affairs, governance and compliance
and heads up responsible retailing and product
integrity. Wouter Kolk was appointed CEO of
Albert Heijn, to succeed Sander van der Laan,
who stepped down as of February 1, 2015. I am
very pleased that we were able to appoint an
experienced leader with a strong track record from
within our own company to this important role.
I would like to take this opportunity to personally
thank Sander for his strong contributions to our
company over his 16-year career with Ahold.
Under his leadership, Albert Heijn ran memorable
commercial campaigns that were very popular
with customers, developed into a true multi-channel
business, and began operating successfully outside
its home market for the first time in Belgium. We wish
Sander all the very best.
In October, we announced that Lodewijk Hijmans
van den Bergh, Chief Corporate Governance
Counsel and member of the Management Board
and Executive Committee, would step down.
This will take effect as of March 1, 2015. I would
like to personally thank Lodewijk for his five years of
excellent service to our company. During his tenure
he successfully resolved some of Ahold’s key legacy
issues, actively contributed to the development and
execution of our strategic agenda and played a
pivotal role in developing our Responsible Retailing
strategy. We are grateful for his many contributions
and wish him all the best in the future.
Ahold
Annual Report 2014
We also had some changes to our Supervisory
Board during the year. We welcomed a new
member when shareholders appointed René Hooft
Graafland to the Board in April, effective January 1,
2015. He came to us from Heineken, where he
will serve as CFO until April 2015, bringing a
wealth of experience in the areas of finance and
consumer goods. In June, the Supervisory Board
appointed Rob van den Bergh as interim Chairman
to temporarily replace Jan Hommen when he
became CEO of KPMG the Netherlands.
Creating value for our shareholders
As our shareholders, you are the owners of our
company, and we always strive to make Ahold an
investment that brings you good value. Due to our
confidence in our Reshaping Retail strategy, and our
ongoing strong cash generation, we propose an
increase in our dividend to €0.48.
We continue to move towards a more efficient
capital structure. In 2014, we returned €2.7 billion
cash to shareholders through the completion of
our €2 billion share buyback program, €1 billion
capital reduction and reverse stock split, and a 7%
increase in our dividend. We remain committed to
our financial guidelines on leverage, liquidity and
credit rating. Going forward we aim to maintain
a balance between investing in profitable growth,
returning cash to our shareholders and reducing
debt and we will continue to move towards a more
efficient capital structure. In February, we announced
another €500 million share buyback program, to be
completed in the next twelve months.
Outlook for 2015
We continue to invest in our customer proposition,
providing better value, quality and service to our
customers. These investments will continue to be
largely funded by our Simplicity program, that
is expected to deliver €350 million in cost and
efficiency improvements in 2015. As mentioned
earlier at our Online Strategy event, margins in
the Netherlands will be impacted by increased
13
investments, particularly at bol.com, to maintain strong
sales growth in our online business and to further
strengthen our market leading positions. Lower interest
rates will result in an increase in underlying pension
costs, especially in the Netherlands, although total
cash contributions will be lower than last year. In the
Czech Republic, we expect that the acquisition of
SPAR will remain slightly margin-dilutive in 2015,
but margin-enhancing from 2016 onwards with
an additional one-off cost of €40 million in 2015.
At current exchange rates, we expect free cash flow
for the year to be broadly in line with last year.
Our thanks
In closing, on behalf of my colleagues on the
Management Board and the Executive Committee,
I want to thank our 227,000 associates around
the company for their hard work and constant
drive to bring a better offering to our customers.
You will see examples throughout this report of how
our associates are making the difference for our
customers and communities through focus, innovative
thinking, and wholeheartedly striving to get better
every day. We are constantly working to make
Ahold a better place to work for them. I also want
to thank our customers for being our inspiration, and
for giving us the chance to serve them, 365 days
per year. We are grateful to our shareholders, for
your confidence in our company and our strategy
and for your support over the past year. It has been
a real privilege to again lead our great company
in 2014. Through our Reshaping Retail strategy we
will continue to become better every day for our
customers, while at the same time creating value for
our shareholders and other stakeholders.
Dick Boer
Chief Executive Officer
February 25, 2015
Business review
Ahold at a glance
Governance
Financials
Investors
Reshaping Retail framework
How are we
reshaping retail
at Ahold?
We have a robust business model,
built on strong local brands…
Ahold
Annual Report 2014
Our Reshaping Retail framework outlines our
strategic ambitions, how we operate and what
we want to be as a company.
Our business model
N
AN G
DS
AL
TO LOC
NE
EN
E ID R O
D R IV L E S G
SA
T
W T IC A L
H
LOW
E
BASE
OST
RC
ITAL
CAPOWTH
E
AT GR
W
O
S T R BR
D
L
I
R
BU ME
CONS U
We have a common set of values across all
our businesses and a shared vision for the future.
Our proven business model enables us to keep
investing in our customer offering, and we are
getting better every day through our shared
promises. Our strategic pillars outline our clear
ambition to grow and be competitive in years
to come.
we are keeping
our promises…
and we have the ambition to drive
performance and go for growth.
Ahold is becoming
a better place to shop,
a better place to work,
and a better neighbor.
Creating growth:
Increasing customer loyalty
Broadening our offering
Expanding geographic reach
Enabling growth:
Better
place to shop
Responsible retailing
Better
every day
Better
place to work
Our values
Putting the customer first; Doing what’s right; Winning together;
Making ideas happen; Getting better every day
Simplicity
People performance
Better
neighbor
Our vision
Better choice. Better value. Better life. Every day.
14
Ahold at a glance
Business review
Our vision and values
We’re
committed to
living the five
common values
that define
who we are…
Our vision
Our vision is to offer better choice, better value,
and a better life to all of our stakeholders –
our customers, associates, suppliers, shareholders,
and the communities we serve.
aa Better choice.
aa Better value.
aa Better life. Every day.
This vision describes our ambition to provide
the right choices and great value that support
a better life not only for our customers but also
for our other stakeholders. We work to get
better in each of these areas, every day.
Our values
All of our companies share five common values
that define who we are, what’s important to us,
and how we do things around here to grow
our business.
Governance
Financials
Investors
Ahold
Annual Report 2014
15
Ahold at a glance
Business review
Governance
Financials
Investors
Our business model
16
Our business model
Allocate capital
to new growth
Lower cost base
We use the capital we generate to drive
new growth, to get the right returns and to invest
in our businesses for the long term.
We continually work to simplify how we do
things and become more efficient in order to
lower our cost base.
EN
E ID R O
D R IV L E S G
SA
Our business model is a continuous cycle in
which we work to lower our cost base so that we
can invest in price, value, and the products and
services we offer. This enables us to drive sales, win
new customers and allocate capital to further grow
our business.
Drive identical
sales growth
The investments we have made to build our
strong consumer brands are intended to help us
to drive identical sales growth, increase volumes
and gain market share going forward.
T IC
WT AL
H
LOW
E
N
AN G
DS
ALL
TO OC
NE
ITAL
P
A
H
E C ROWT
T
A G
W
BASE
OST
RC
with a
Group‑wide
business
model that
ensures we can
keep getting
better for our
customers…
Ahold
Annual Report 2014
O
R
T
S BR
D
L
I
B U M ER
CONS U
Build strong
consumer brands
To continue to build our strong local consumer brands
and increase customer loyalty, we reinvest our cost
savings into our offering and give customers more
of what they want and need.
Ahold at a glance
Business review
Governance
Financials
Investors
Our promises
Ahold
Annual Report 2014
promises
that help
us get better
every day…
Better place
to shop
aa Great quality and freshness
aa Finding the products you want
aa Good prices and
exciting promotions
aa Easy to shop
Our promises are helping us focus on the right
priorities to drive success and create greater value
on a daily basis. They stand for the continuous
improvements we implement in our operations for
the benefit of our stakeholders.
All three of our promises are interlinked – in order
to build strong relationships with our customers, we
need happy, engaged associates and a deep
connection to our neighborhoods and communities.
As retailers, our relationship with customers has
always been at the center of everything we
do. But in today’s world, being a good retailer
is also about creating a working environment
where associates can be at their best and about
ensuring we take on our role in the wider world our
business impacts.
Our promises are to be a better place to shop,
a better place to work and a better neighbor
every day for our customers, our associates and
our communities. Our promises run across all our
businesses, but are applied locally at each of our
banners according to their needs and priorities.
aa Friendly and helpful associates
Better
place to shop
Better place
to work
aa Respect for each other
Better
every day
aa Good working conditions
aa Opportunities to develop
aa Support from my manager
aa Recognition for performance
Better
place to work
Better
neighbor
Better neighbor
aa Healthy living choices made easy
aa Contribution to community
well-being
aa Responsibly sourced products
aa Care for the environment
17
Ahold at a glance
Business review
Governance
Financials
Investors
Our promises (continued)
Better place
to shop
Putting the customer first has always been
embedded in our culture and values – but
in today’s challenging and competitive
environment, it is more important than ever.
Being a better place to shop is about doing
more each day to give our customers a
shopping experience that surprises and
delights them.
Ahold
Annual Report 2014
Better value, lower prices at Ahold USA
Customers in all our markets are watching
their budgets. To give them even better
value, stores across Ahold USA made
more than 1,000 targeted price reductions
focused largely on Fresh items in 2014.
Giant Landover launched a division-wide
service and savings campaign, engaging
associates and using mass media tools and
social media to communicate better service
and pricing to customers.
Freshening up the bakery department
at Albert Heijn
Albert Heijn rolled out an improved bakery
department, with new products – including
new and improved natural products – that
are presented better. They also added a
“bread guarantee,” promising to offer three
kinds of fresh-baked bread every day until
closing time. The changes are proving to
be popular with customers.
Best-of-breed integration of former
SPAR stores in the Czech Republic
As Albert integrates the former SPAR
stores, they are keeping the best from both
companies to improve the customer offering.
This includes implementing Albert’s strong
produce assortment at SPAR’s large stores,
and adopting SPAR bread recipes at Albert.
They have tested nearly 700 SPAR and
Albert products using consumer panels to
identify the best own-brand products for the
final assortment.
18
Ahold at a glance
Business review
Governance
Financials
Investors
Our promises (continued)
Ahold
Annual Report 2014
Better place
to work
Intensified store associate training at
Ahold USA
The Ahold USA divisions rolled out a training
program aimed at increasing customer and
associate engagement. Around 100,000
associates participated, learning to improve
how they serve and engage customers
through four easy-to- remember actions:
Greet, Assist, Share, and Thank. The skills
they learned are in turn helping associates to
be more engaged and satisfied in their jobs,
while driving greater customer satisfaction.
Our engaged associates are the face of our
business and at the heart of our success.
Throughout all our businesses, our associates
are truly dedicated to serving our customers
and getting better every day. In return, we
are committed to making sure our companies
continue to become even better places
to work.
Becoming a better place
to work at Albert in the Czech Republic
During a busy year, Albert continued
to become a better place to work.
For example, a new initiative calling for
each store to strive to be the favorite in its
market is building team pride, improving
the store culture, and making associates
feel valued. The “Respect for each other”
exchange program is helping distribution
center associates better understand each
other’s work.
Expanding our targets for hiring disabled
associates at Albert Heijn
Albert Heijn is creating more opportunities
for associates who need extra support and
face challenges in entering the job market.
In 2014, the company decided to more
than double the number of young disabled
associates it hires – from 600 to 2,000
by the end of 2016. By using experienced
associates to coach these young people,
they are also creating development
opportunities for store managers.
19
Ahold at a glance
Business review
Governance
Financials
Investors
Our promises (continued)
Better
neighbor
We want to be a good neighbor everywhere
we operate. As a company with over 3,000
stores and a trading area population of more
than 90 million people, we can really make
a difference in our communities through the
economic benefits and job opportunities our
businesses provide, and by supporting local
causes that are important to our neighbors,
our customers and our associates. We believe
we have an opportunity to help our customers
and associates make healthier choices, and
promote health in our communities. We also
endeavor to source our products responsibly
and look after the environment we operate in.
Ahold
Annual Report 2014
20
Ahold USA on the leading edge
with sustainable own-brands
After the groundbreaking decision to source
UTZ certified coffee for 42 Simply Enjoy
varieties, Ahold USA switched its “wedge”
and Guaranteed Value own-brand canned
coffees to UTZ. It also became the first
supermarket chain in the U.S. to offer
own-brand UTZ Certified chocolate bars,
reinforcing its position on the leading edge
of sustainability in own-brand products
among U.S. grocers.
Healthy reformulation of own-brand
products at Albert Heijn
Albert Heijn is continuously focused on
reducing salt and (saturated) fat in its
own‑brand products, and most of its
ready‑to-eat meals now comply with its
norms. For some meals, they were able to
take out over 20% saturated fat. Albert Heijn
also joined its food industry peers to sign
an agreement with the Dutch government to
improve the healthfulness of products.
Smurfs return to promote healthier
products at Albert
The Smurfs returned to Albert for the third
year in a row to make healthy eating more
fun for Czech children. Albert’s own-brand
healthy “I know what I eat” products had
Smurf-themed packaging to make them easy
to spot. Customers could collect Smurf as
well as fruit and vegetable figurines and
visit a new microsite for fun games and
healthy recipes.
Ahold at a glance
Business review
Governance
Financials
Investors
Our strategic pillars
Six pillars
that help
us achieve
our growth
ambitions
Our six strategic pillars outline how we aim to
accelerate the growth of our company. While our
promises stand for the continuous improvements we
are making in our businesses each day, the pillars
are designed to drive and enable step-change
innovations and, where possible, to leverage the
scale of the Group. They will also ensure we stay
ahead of customer behavior and retail trends.
Ahold
Annual Report 2014
Increasing
customer loyalty
In today’s world, consumers have more choice
than ever before. They also have growing
expectations of retailers. To gain their loyalty,
we have to understand them better than anyone
else so that we can offer them the products and
services they want, the quality and value they
expect, and a shopping experience that makes
their daily lives a little easier.
We are working to build more personal
relationships with our customers so that they will
want to keep coming back to shop with us.
Our associates are key to this – the friendly and
helpful service they provide builds our customers’
loyalty and trust. We are also using our insights
and innovative technologies to develop
personalized communications and offers to
customers on the products and services they
need and want.
Broadening
our offering
We are broadening our offering by growing
our online businesses, developing our store
formats and improving our assortment – to give
our customers shopping alternatives that meet
their changing needs.
We are accelerating the growth of our
online businesses so our customers can shop
when, where and how they want – either in
our stores or online, for delivery or pickup.
We are building an even better, more relevant
assortment, with a broader range of products
and services, including new and innovative
own-brand products and a growing assortment
of non-food products. We continue to
strengthen our successful supermarket formats,
while developing additional formats to better
serve our customers’ needs.
21
Expanding our
geographic reach
Acquiring stores in our current markets enables
us to make the most of our existing operations
and better leverage our scale. We are also
looking for opportunities to move into markets
that are adjacent to where we operate, so
we can apply our skills and build our scale
even further.
Our ambition
Our ambition
Our ambition
aa Add 1-2% to sales growth through
our customer initiatives.
aa Increase our online consumer sales
to €2.5 billion by the end of 2017
and drive profitability.
aa Continue to focus on current and
surrounding markets and evaluate
new geographies.
aa Increase own-brand penetration
to approximately 40% in our U.S.
businesses by the end of 2016.
aa Open 50 supermarkets in Belgium
by the end of 2016.
aa Open a minimum of 150 convenience
stores in Europe by the end of 2016.
Our progress
Our progress
Our progress
We remain pleased with the progress of
our company-wide initiatives. Both in the
U.S. and the Netherlands, our loyalty card
programs are showing satisfactory impact in
terms of incremental sales.
Our online consumer sales in 2014 were
€1.4 billion. Own-brand penetration in the
U.S. grew by 0.5% to 37.6%. Moreover, we
are pleased with the performance of our new
Albert Heijn to go format, showing double-digit
sales growth.
In 2014, we completed the acquisition of
49 SPAR stores in the Czech Republic, which
we are now in the progress of integrating into
our existing Albert business. We remain on
track to achieving our ambitions in Belgium.
In 2014, we opened nine new stores, now
operating 28 stores in this market.
Ahold at a glance
Business review
Governance
Financials
Investors
Our strategic pillars (continued)
Ahold
Annual Report 2014
Simplicity
Responsible
Retailing
22
People
performance
We are leveraging our capabilities and
resources as an international company and
working on better processes and systems
across our businesses. The savings we unlock
with Simplicity will be reinvested into our
offering for customers to drive our successful
business model.
We support the health and well-being of
our customers, associates and communities,
source our products responsibly and care
about the environment. Associates – throughout
our businesses – are engaged in putting
responsible retailing into practice, every
day. We have five priority areas under our
responsible retailing pillar: healthy living
choices made easy, contribution to community
well-being, responsibly sourced products, care
for the environment, and our people.
We are continuously investing in and
supporting the development of our associates.
At the same time, we are hiring new people
with new skills, so that we have the capabilities
we need to grow – and sharing these
capabilities across our businesses. We will
continue to build diverse workforces – in terms
of both personal background and professional
experience – to better serve our diverse
customer base and help us successfully cross
cultures and borders. We want to be a better
place to work for our associates, and provide
good working conditions, development
opportunities, managerial support, recognition
for performance, and an atmosphere of
mutual respect.
Our ambition
Our ambition
Our ambition
aa Reduce costs by €350 million in 2015.
aa We have ambitions in five priority
areas: healthy living, community wellbeing, responsible products, care for the
environment and our people, measured by
nine targets. Please see our Responsible
Retailing Report 2014 for further detail.
aa We have ambitions in and measure our
performance across five areas: respect
for each other, good working conditions,
development opportunities, support from
managers and recognition for performance.
Our progress
Our progress
Our progress
We set an ambition to deliver €600 million
in Simplicity savings in the period 2012-2014.
We have realized savings of €865 million,
exceeding our target. For 2015, we will
continue to drive improvements and we aim to
deliver a further €350 million in savings to be
reinvested back into the business.
We are well on track towards realizing
our Responsible Retailing targets for 2015.
Please see our Responsible Retailing Report
2014 for further detail.
Our increasing associate engagement score
(measured annually) shows we are making
progress on our ambition to motivate and
inspire our associates and enhance our
performance culture. A uniform rating system
based on both pre-set targets and on specific
values-driven behavior has been developed
and is currently being rolled out.
Ahold at a glance
Business review
Governance
Financials
Investors
Our formats
Our
omni‑channel
offering
Supermarkets are the core of our business.
However, we operate a range of other formats
and continue to expand our online options to
serve the needs of different communities and
to give customers more shopping alternatives.
Ahold
Annual Report 2014
Supermarkets
Convenience stores
Compact hypers
Specialty stores
Geography
United States, Netherlands,
Belgium, Czech Republic
Geography
Netherlands, Germany
Geography
Czech Republic
Geography
Netherlands
Offering
Quick food solutions for
on-the-go customers
Offering
Full range of food and selected
non‑food products. Emphasis
on fresh products
Offering
One chain offers health and
beauty care products; another
offers wine and liquor
Online general
merchandise
delivery
Pick-up points
Gasoline stations
Geography
United States, Netherlands
Geography
United States, Czech Republic
Offering
Full range of food and selected
non-food products. Customers
order online for pickup at
designated locations
Offering
Gasoline and, in some
locations, a small range
of convenience products
Offering
Full range of food and selected
non-food products. Emphasis on
fresh products
Online food
delivery
Geography
United States, Netherlands
Offering
Full range of food and selected
non‑food products
Geography
Netherlands, Belgium
Offering
Wide general merchandise range
23
Ahold at a glance
Business review
Governance
Financials
Investors
Market overview
Our Reshaping Retail strategy is built around
addressing the trends that are most important
to our customers and our business.
Macro trends
Economics
The macroeconomic situation in our markets is
improving. Purchasing power – especially in the
middle income groups of our core customer base
– is recovering. However, shoppers continue to be
focused on value, price and promotions. To help our
customers, we continuously work to lower our cost
base as part of our Simplicity pillar, so that we can
invest in price, value, and the products and services
we offer.
Demographics
We are seeing limited population growth in our
markets and an aging consumer base. There is
increasing diversification, not only of ethnicity but
also in other areas, including: household composition,
affluence and urban versus suburban. For us, this
presents new opportunities to diversify our offering to
best meet the needs of local communities, becoming
both a better place to shop and a better neighbor.
Lifestyle trends
Convenience
Many of our customers have busy lifestyles and
increasingly demand convenience. They want food
that is easy to prepare, personalized offers and a
convenient, flexible shopping experience. As part of
our “broadening our offering” pillar and to ensure we
fulfill these customer needs, we offer, among other
things, an increasing range of convenience meals
and fresh-cut produce, as well as multiple delivery
options for online orders.
Ahold
Annual Report 2014
Health and well-being
Customers are increasingly aware of the positive
impact of food on a healthy lifestyle. They are also
becoming more knowledgeable about lifestylerelated diseases, allergies, and other health
conditions that may be affected by diet. Through our
recipes (both in-store and online), our broad Fresh
offering, and our increasing focus on providing health
advice through dietitians in our U.S. stores, we have
an opportunity to help customers make healthier
choices, while giving them access to affordable
products that are good for them and their families.
This makes us both a better place to shop and a
better neighbor.
Transparency and sustainability
Food is safer than ever today, and customers have
a greater interest in what they eat and where it
comes from. People are increasingly aware of the
impact they can have on society and the environment
through their buying decisions. They want retailers
to help them make responsible decisions, and rely
on them to ensure the integrity of the supply chain
where possible. Our new Albert Heijn Organic
range makes it easier for our customers to make
such decisions.
Connection and communities
People are increasingly searching for a feeling of
community and personal connection. They find this
not only in their local neighborhoods, but also through
social media and online and offline communities
around common interests. Retailers have a unique
opportunity to connect individuals and communities
in many ways – whether that is through community
centers based in stores, or through the personal
relationships they build with customers in an online
environment. The MyBonus program at Albert Heijn is
a prime example of this kind of personal relationship
building, aimed at increasing customer loyalty.
Industry trends
Competition
We are seeing increasingly diversified competition,
both on the premium and discount ends of the retail
spectrum, and new competition from outside of the
traditional food retail industry. Customers are dividing
their shopping trip over multiple stores for specific
shopping needs or occasions. Retailers continue to
evolve as consumers also diversify and change the
way they shop, both online and offline.
Online and mobile
Grocery e-commerce is still a relatively small part
of the overall retail food market, but it is growing
rapidly. Online will be a key component of growth
for retailers in years to come. Mobile apps are
creating new opportunities for sales growth and an
improved customer experience in online shopping.
Customers are more in control of the shopping
experience than ever, with more product information
at their fingertips and the ability to match prices while
they shop. With our existing online business and
strategic focus on online retail under our “broadening
our offering” pillar, we are well-positioned to capture
this opportunity further in the coming years.
With our Reshaping Retail strategy we
are getting ahead of these trends
We are working to provide quality products at
affordable prices for our value-focused customers.
We are making continuous innovations in our
assortment, to offer the right products, including a
wide range of fresh, healthy and responsible choices.
Our own-brand ranges are helping us do this, while
building loyalty to our brands. We have friendly and
helpful associates of many different backgrounds
to welcome our diverse customer base. And our
omni-channel offering enables people with busy
lifestyles, or those who are less mobile, to still benefit
from our quality products, brought to them through
new delivery channels.
24
Ahold at a glance
Business review
Governance
Financials
Investors
Our stakeholders
As a major international retailing group with
thousands of suppliers, employing over 200,000
associates, and serving a trading area population
of 90 million people, we have many different
stakeholders who impact or are impacted by our
business in various ways.
Our stakeholders include our customers, associates,
communities (including governments, NGOs,
academic / research institutes and industry bodies),
shareholders and suppliers. We engage with
these groups in various ways, including through
stakeholder events, industry-wide conferences,
round-table discussions and supplier days. We do
this in order to gain insight into their expectations
and to share our progress with them. Listening to
and engaging with our stakeholders enables us to
better understand their needs.
Ahold
Annual Report 2014
Customers
Communities
Our customers are central to our business. We are
committed to offering them healthy choices and
providing products that are made with respect
for people, animals and the environment.
In addition, we aim to offer competitive prices
combined with high product quality and a great
shopping experience.
The communities where our customers and
associates live are very important to us.
Our businesses are committed to being active and
engaged members of their communities. We do
this through our initiatives, events and charitable
contributions that support the communities and
neighborhoods in which we operate.
We regularly ask our customers what they think of
our stores, assortment and service, including their
perception of Ahold’s brands as being healthy
retailers. We receive feedback via third-party surveys,
proprietary tracking studies and consumer panels,
as well as directly from customers in stores and online.
Shareholders
Associates
Engaged associates are key to our success.
Their hard work and commitment define us as a
leading international retailer. We constantly strive to
make sure we provide an even better place to work,
every day. We do this by creating workplaces built
on fairness and mutual respect, and by maintaining
strong businesses to drive stable jobs and provide
opportunities for great careers. We respect and
protect the rights of associates: we are committed
to the principles of equal employment opportunities,
freedom of association, and respecting the legal
rights to collective bargaining. We maintain an open
and honest company culture and carry out an annual
associate engagement survey. In 2014, 81% of our
associates participated in the survey globally.
Our shareholders are crucial to our business; they
put their trust in us by investing in Ahold financially.
They monitor our company closely and challenge us
on our strategy and how we manage our company.
We meet with investors, including socially responsible
investment (SRI) analysts, on a regular basis and work
to broaden the investment community’s understanding
of our company by providing accurate and timely
information on Ahold’s performance and prospects.
We continually engage with our shareholders in
various ways, and our general meetings also provide
an opportunity for them to engage with Ahold.
Suppliers
We rely on our suppliers to deliver the high quality
products our customers expect from us. Increasingly,
we work in collaboration with our suppliers and
engage with them in many ways, aiming to
strengthen and improve our relationships. We hold
supplier events to discuss a wide range of topics,
including company strategy, sustainability, supplier
diversity, and food safety. In addition, we hold
a special supplier day during which awards are
given out for good performance. Through the Albert
Heijn Foundation in Africa we work to improve
the livelihoods of Albert Heijn’s African fruit and
vegetable suppliers, which in turn supports their
families and communities and helps to secure longterm relationships with them.
25
Ahold at a glance
Business review
Governance
Financials
Investors
Group key financial indicators
Monitoring our
performance
Ahold
Annual Report 2014
26
2014
€ million
2013
€ million
Change versus
prior year
% change
constant rates
32,774
1,267
3.9%
1,250
791
594
32,615
1,379
4.2%
1,239
805
2,537
0.5%
(8.1)%
(0.3)% pt
0.9%
(1.7)%
(76.6)%
0.8%
(8.0)%
2014
€
2013
€
Change versus
prior year
0.68
0.88
51%
0.48
6.4%
13.0%
2.48
0.79
51%
0.47
35.8%
13.8%
(72.6)%
11.4%
—
2.1%
(29.4)% pt
(0.8)% pt
2014
2013
Change versus
prior year
Liquidity (€ billion)
Net debt (€ million)
Debt leverage (times)4
Free cash flow (€ million)
3.1
1,311
1.9
1,055
5.0
(942)
0.9
1,109
(38.0)%
(239.2)%
111.1%
(4.9)%
Other information
2014
2013
Change versus
prior year
3,206
740
227,000
BBB / stable
Baa3 / positive
3,131
830
222,000
BBB / stable
Baa3 / positive
2.4%
(10.8)%
2.3%
—
—
Results
Net sales
Underlying operating income
Underlying operating margin
Operating income
Income from continuing operations
Net income1
Shareholders
Net income per common share (basic)
Adjusted income from continuing operations per share2
Dividend payout ratio3
Dividend per common share
Total shareholder return
Return on capital employed
Leverage and liquidity
Number of stores (including franchise stores)
Capital expenditures (excluding acquisitions)
Number of employees
Credit rating / outlook Standard & Poor’s
Credit rating / outlook Moody's
Certain key performance indicators contain non-GAAP measures. The definitions of these non-GAAP measures are described on page 37 of this Annual Report.
1 The decline in net income for 2014 compared to 2013 was primarily due to the results from discontinued operations. 2014 results include a charge representing the net of tax
settlement amount and associated legal fees for the Waterbury litigation of €194 million, while 2013 results included income of €1,751 million following the sale of our former joint
venture ICA.
2 For more information on adjusted income from continuing operations, see the Group financial review in this section.
3 Dividend payout ratio is based on adjusted income from continuing operations, see the Group financial review section for more information.
4 The debt leverage ratio of the net lease adjusted debt divided by EBITDAR is defined in the non-GAAP measures section.
0.9%
(1.9)%
(76.6)%
Ahold at a glance
Business review
Governance
Financials
Investors
Group financial review
We remain
focused on our
business model,
lowering our
cost base and
reinvesting the
savings to
improve our
customer
proposition.
The food retail sector has been undergoing major
changes, turning a strong focus to Fresh, convenience
and omni-channel. These developments are taking
place in an environment that continues to be highly
competitive, with customers remaining value-oriented
and focused on price and promotion in all of
our markets.
27
Ahold
Annual Report 2014
Under these market conditions, our strategic promise
to be a better place to shop is helping us focus on
the right priorities by improving quality, service and
value for our customers while developing our formats
and accelerating our online business.
Despite a successful savings program in 2014, our
underlying operating margin was 3.9%, down from
4.2% in 2013, primarily due to investments in value
and growth in our main markets and deleverage of
fixed costs resulting from soft sales trends.
Our continuous efforts have started to bear fruit, with
sales trends stronger in the second half of the year.
Underlying operating income (which excludes
impairments, gains on the sale of assets,
restructuring and related charges, and other
unusual items listed below) was €1,267 million in
2014, down €112 million or 8.1% (down 8.0% at
constant exchange rates). Operating income was
€1,250 million, up €11 million or 0.9% compared
to 2013.
However, cautious consumer spending kept volume
growth under pressure and, combined with our
investments in price improvements and low inflation,
resulted in modest sales growth. Net sales in 2014
were €32.8 billion, up 0.5% compared to 2013.
At constant exchange rates, net sales grew 0.8%.
Our net sales increased primarily due to new store
openings, including the acquisition of 49 SPAR stores
in the Czech Republic and the impact from 15 stores
in the Netherlands that were converted in 2014 as
part of the agreement to transfer 82 stores from Jumbo.
In addition, we continued remodeling and expanding
our stores. Identical sales growth was negative in
all three segments. Both our grocery and general
merchandise online businesses continued to grow by
double-digits. Our online businesses contributed 3.9%
to Ahold’s net sales in 2014 (2013: 3.3%).
Tight cost management remains a core part of our
business model. By the end of 2014, we exceeded
our three-year (2012-2014) €600 million cost
savings program, having delivered €865 million.
This enabled us to continue to invest in our
competitive position and, at the same time, our
businesses benefited from optimized store processes
and improved sourcing. In Europe, as part of our
Simplicity program, we implemented a reorganization
of our head office support roles to improve efficiency.
In addition, we streamlined Albert Heijn’s commercial
organization to enable a greater focus on improving
quality and value for our customers and to successfully
introduce new products, especially in Fresh.
Ongoing initiatives from our Simplicity program,
which will be re-invested in our customer proposition,
are expected to deliver €350 million of cost savings
in 2015.
We remain committed to maintaining a balance
between investing in profitable growth, returning cash
to our shareholders, and reviewing opportunities for
debt reduction. In 2014, we returned €2.7 billion
cash to shareholders through the completion of our
€2 billion share buyback program, €1 billion capital
reduction and reverse stock split, and a 7% increase
in our dividend. This helped us to move toward our
capital structure guidelines for liquidity (€2 billion) and
debt leverage (ratio of around 2 times).
During the year, we entered into a settlement
agreement and paid $297 million (€241 million) to
resolve a class action relating to the pricing practices
of Ahold’s former subsidiary U.S. Foodservice
(referred to as “Waterbury litigation” in Note 34 of
the Financial statements in this Annual Report).
Consistent strong cash flow generation has enabled
our continued investment in growth, with capital
expenditure of €1 billion during the year including the
acquisition of the SPAR business.
We will continue to look for ways to simplify our
business in order to reduce costs and expect that
ongoing investments in our customer proposition and
further development of our formats and assortment
will result in improved sales trends.
Net sales
€ million
29,353
30,098
4.6%
2010
32,682
32,615
3.6%
2.0%
2012
2013
32,774
5.5%
2011
0.8%
2014
Net sales
Net sales growth at constant exchange rates
Online sales
€ million
1,267
1,086
830
426
457
1.5%
1.5%
2010
2011
2.5%
2012*
3.3%
2013
3.9%
2014
Online sales
Contribution to Ahold’s net sales
* During 2012 Ahold acquired bol.com
Underlying operating income
€ million
1,376
1,377
1,412
1,379
4.7%
4.6%
4.3%
4.2%
3.9%
2010
2011
2012
2013
2014
Underlying operating income
Underlying operating margin
1,267
Ahold at a glance
Business review
Governance
Financials
Investors
Group financial review (continued)
Ahold
Annual Report 2014
Results from operations
The Netherlands
Ahold’s 2014 and 2013 consolidated income statements are summarized as follows:
€ million
Net sales
Gross profit
Underlying operating expenses
Underlying operating income
Impairments
Gains on the sale of assets
Restructuring and related charges and
other items
Operating income
Net financial expense
Income taxes
Share in income of joint ventures
Income from continuing operations
Income / (loss) from discontinued operations
Net income
2014
32,774
8,686
(7,419)
1,267
(31)
20
(6)
1,250
(235)
(248)
24
791
(197)
594
% of
net sales
100.0%
26.5%
(22.6)%
3.9%
3.8%
2.4%
1.8%
2013
32,615
8,682
(7,303)
1,379
(83)
28
(85)
1,239
(291)
(153)
10
805
1,732
2,537
% of
net sales
100.0%
26.6%
(22.4)%
4.2%
3.8%
2.5%
7.8%
Ahold USA
Net sales, at $26.0 billion, decreased by 0.5% in
2014. Identical sales, excluding gasoline, decreased
by 0.1%. Sales growth was negatively impacted by
the closure of 14 stores, including the exit from the
New Hampshire market in 2013. This was partly
offset by the initial results of the program to improve
our customer proposition, and a business disruption at
one of our main competitors in the Stop & Shop New
England division. In a highly competitive landscape,
market share was down slightly, mainly related to the
Giant Landover division.
At Ahold USA, our main focus in 2014 was on
the rollout of the program to improve our customer
proposition through targeted price reductions and
marketing, an improved Fresh offering, and an
enhanced customer experience through in‑store
merchandising and associate engagement.
The program is largely funded through Simplicity
savings. In the 523 stores where we rolled out
28
this program so far, we saw encouraging volume
uplifts resulting in improved sales trends. We plan
to complete the rollout to all stores in the first half
of 2015.
During 2014, our U.S. business increased its
own‑brand penetration by 0.5 percentage points to
37.6%, towards our ambition of 40% in 2016.
Our online business, Peapod, continued to grow in its
existing market area and opened 89 pick-up points
where customers can drive up and conveniently
pick up their online orders, bringing the total to 209.
To enable further growth, Peapod increased its
capacity by opening a new distribution center in the
New Jersey area.
Ahold USA achieved an underlying operating income
of $980 million, which was $84 million lower than
last year. Underlying operating profit margin at 3.8%
decreased by 0.3 percentage points.
Net sales amounted to €11.7 billion in 2014, an
increase of 1.8% compared to last year. For the full
year, market share at Albert Heijn increased slightly,
to 34.1% (source: Nielsen), positively impacted by the
conversion of 15 more former C1000 supermarkets
into our Albert Heijn format. By the end of 2014,
we converted 54 out of 82 stores following our 2012
agreement with Jumbo.
Bol.com delivered strong double-digit growth of over
25% in net consumer online sales, as in previous
years fueled by the launch of new categories
and accelerated growth in Belgium as well as
the success of Plaza, which offers a marketplace
to over 4,000 merchant partners and will be an
important driver in delivering on our 2017 ambition
of €2.5 billion.
Other factors that positively impacted sales were
the continued growth of bol.com and the further
extension of our store network in the Netherlands
and Belgium.
Our net sales in the Netherlands consist of sales to
consumers and to franchise stores. Franchise stores
typically operate under the same format as Aholdoperated stores. Franchisees purchase merchandise
primarily from Ahold, pay a franchise fee and receive
support services, including management training, field
support and marketing and administrative assistance.
Identical sales decreased by 0.5%. Similar to
last year, at Albert Heijn, transactions in identical
stores remained broadly stable while basket size
continued to be under pressure. Towards the end
of the year, basket size improved, positively driving
identical sales. In 2014, we started to roll out format
improvements to our larger Albert Heijn stores, to offer
more inspiration to customers, primarily in our Fresh
offering, and great value in dry grocery categories,
resulting in an enhanced store experience. We are
also pleased with the performance of our Albert
Heijn to go convenience stores in the Netherlands
that were remodeled to a new format.
In 2014, we further expanded our Albert Heijn
business in Belgium by opening an additional nine
supermarkets, bringing the total to 28 at year-end,
and are on target to operate at least 50 supermarkets
by the end of 2016.
Albert Heijn Online achieved double-digit sales
growth by opening an additional 17 pick-up points
for a total of 34, expanding its geographic reach
within the Netherlands and through the full-year
impact of doubling its assortment to over 20,000
products in 2013.
The Netherlands reported an underlying operating
income of €574 million, which was €45 million
lower comparing to last year. The year-over-year
underlying margin was down 0.5 percentage points
to 4.9%. Excluding bol.com, underlying operating
margin was 5.2% (2013: 5.6%).
In 2015, margins in the Netherlands will be impacted
by increased investments in our online business,
particularly at bol.com. We expect this to have a
dilutive effect of 25 bps on the segment’s underlying
operating profit margin. In addition, due to lower
interest rates, underlying operating profit margin will
be negatively impacted by higher defined benefit
pensions costs, up €23 million compared to 2014.
Ahold at a glance
Business review
Governance
Financials
Investors
Group financial review (continued)
Czech Republic
Net sales amounted to €1.5 billion in 2014, an
increase of 5.3%, or an increase of 11.7% at constant
exchange rates. The main driver impacting sales
growth was the successful integration of 49 acquired
SPAR stores, of which all 14 supermarkets were
remodeled to the Albert banner. With the acquisition
of the SPAR business we made a step increase in
our market share in the Czech Republic. After the
conversion of all the remaining SPAR stores at the end
of the first quarter of 2015, Albert will be a leading
brand in the Czech food retail market.
Identical sales excluding gasoline decreased by 1.2%
as the market continued to be significantly impacted
by competitive pressure and an increasing share of
promotional sales.
Ahold
Annual Report 2014
Net sales in 2014 and 2013 were as follows:
Net sales
contribution by segment
million
Ahold USA ($)
Czech Republic (CZK)
4.6%
Czech Republic
35.7%
The Netherlands
59.7%
Ahold USA
Sales growth
25,976
41,908
26,118
37,522
(0.5)%
11.7%
(0.4)%
(1.8)%
(0.1)%
(1.2)%
0.1%
(1.1)%
Ahold USA
The Netherlands2
Czech Republic
Total
19,557
11,696
1,521
32,774
19,676
11,494
1,445
32,615
(0.6)%
1.8%
5.3%
0.5%
(0.4)%
(0.5)%
(1.8)%
(0.5)%
(0.1)%
(0.5)%
(1.2)%
(0.5)%
0.1%
(0.3)%
(1.1)%
(0.3)%
1 For the definition of identical and comparable sales excluding gas see non-GAAP measures at the end of this section.
2 Identical sales growth in the Netherlands excludes the VAT on tobacco sales. For the definition see non-GAAP measures at the end of
this section.
Underlying operating income
Underlying operating margin
million
2014
2013
% Change
2014
2013
% pt Change
Ahold USA ($)
980
1,064
(7.9)%
3.8%
4.1%
(0.3)% pt
738
574
19
(64)
1,267
801
619
30
(71)
1,379
(7.9)%
(7.3)%
(36.7)%
9.9%
(8.1)%
3.8%
4.9%
1.2%
4.1%
5.4%
2.1%
(0.3)% pt
(0.5)% pt
(0.9)% pt
3.9%
4.2%
(0.3)% pt
€ million
46%
General
54%
Food
merchandise
Underlying operating income
contribution by segment
1.4%
Czech Republic
Corporate Center
Underlying Corporate Center costs were €64 million,
down €7 million compared to 2013. Excluding the
impact of our self-insurance activities, underlying
Corporate Center costs were €82 million, €2 million
lower than last year.
Identical sales Comparable sales
growth ex gas1
growth ex gas1
2013
Underlying operating income and underlying operating income margin for 2014 and 2013 were as follows:
Online net sales
contribution by category
The acquisition of SPAR will remain slightly dilutive in
2015, but margin-enhancing from 2016 onwards.
We expect an additional one-off cost of €40 million
in 2015, related to this transaction.
During the first quarter of 2014, we successfully
completed the divestment of our Slovakian
operations, where we had a limited market position.
Identical sales
growth1
2014
€ million
The Czech Republic reported an underlying operating
income of €19 million, down €11 million from last
year. The SPAR acquisition had a negative impact of
€12 million on underlying operating income.
Underlying operating profit margin, at 1.2%,
was 0.9 percentage points lower than last year.
Excluding SPAR, underlying operating profit margin
was 2.3%, or up 0.2 percentage points from 2013.
29
43.1%
The Netherlands
55.5%
Ahold USA
Ahold USA
The Netherlands
Czech Republic
Corporate Center
Total
Ahold at a glance
Business review
Governance
Financials
Investors
Group financial review (continued)
Adjustments to underlying
operating income
Impairment of assets
Ahold recorded the following impairments and
reversals of impairments of assets (primarily related to
stores) in 2014 and 2013:
€ million
Ahold USA
The Netherlands
Czech Republic
Total
2014
(10)
(21)
–
(31)
2013
(75)
(9)
1
(83)
The impairment of assets in 2013 at Ahold USA
included charges related to the exit from
New Hampshire.
Gains and losses on the sale of assets
Ahold recorded the following gains on the sale of
non-current assets in 2014 and 2013:
€ million
Ahold USA
The Netherlands
Czech Republic
Corporate Center
Total
2014
2013
6
14
—
—
20
25
2
—
1
28
Restructuring and related charges and other items
Restructuring and related charges and other items in
2014 and 2013 were as follows:
€ million
Ahold USA
The Netherlands
Czech Republic
Corporate Center
Total
2014
(7)
17
(6)
(10)
(6)
2013
(88)
—
—
3
(85)
Ahold
Annual Report 2014
In 2014, restructuring and related charges and
other items included gains from the Dutch pension
plan amendments totaling €59 million (of which
€50 million was in The Netherlands and €9 million
at Corporate Center). These were partly offset by
the €40 million restructuring charge related to the
European reorganization (of which €24 million was
in The Netherlands and €16 million at Corporate
Center). In addition, Czech Republic recognized
€6 million in restructuring and related charges
primarily related to the acquisition of SPAR.
Income taxes
In 2013, restructuring and related charges at Ahold
USA included €63 million of costs related to reducing
our exposure to our U.S. multi-employer pension plans
through negotiations with the New England Teamsters
and Trucking Industry Pension Fund as well as a
€23 million restructuring provision related to our exit
from New Hampshire.
Share in income of joint ventures
Net financial expense
Net financial expense, at €235 million, decreased
by €56 million compared to 2013. Excluding interest
income and expense on defined benefit pension
plans, net interest expense of €206 million was
€12 million lower than in 2013, and it fell at the
lower end of our guidance of €200-€220 million.
Net interest expense on defined benefit pension
plans decreased by €8 million in 2014.
Other financial expense of €13 million was lower by
€36 million compared to 2013 and primarily related
to a €22 million lower valuation adjustments related
to notes and derivatives and an €11 million one-time
adjustment to a financial liability in 2013.
At current exchange rates, we expect net interest
expense for 2015 to be in the range of €215 million
to €235 million, excluding net interest on defined
benefit pension plans.
In 2014, income tax expense was €248 million,
up €95 million compared to last year. In 2013,
income tax expense was positively impacted by
one-time transactions and by movements in income
tax contingency reserves. The effective tax rate,
calculated as a percentage of income before income
taxes, was 24.4% (2013: 16.1%), in line with our
guidance. Similar to 2014, we anticipate the effective
tax rate to be in the mid-twenties in 2015.
Ahold’s share in income of joint ventures, which
relates primarily to our 49% shareholding in JMR, was
€24 million in 2014, up by €14 million compared to
last year. For further information about joint ventures,
see Note 14 to the consolidated financial statements.
Income (loss) from discontinued operations
The main contributor to the €197 million loss from
discontinued operations in 2014 was a charge
representing the net of tax settlement amount and
associated legal fees for the Waterbury litigation of
€194 million. Income from discontinued operations
in 2013 included a gain on the sale of our 60%
stakeholding in ICA of €1,751 million.
In April, we completed the sale of our Slovakian
business to Condorum, an agreement we had
announced in November 2013. An exit from this
country enables management to focus on the
continued successful improvement of our business
in the Czech Republic. Ahold recorded a net
loss of €1 million in 2014 on this divestment, with
negative cash proceeds amounting to €34 million.
Ahold Slovakia operated 24 stores, with net sales
of €139 million in 2013.
30
In addition, 2014 and 2013 results from discontinued
operations were impacted by various adjustments
to the results of prior years’ divestments as a
consequence of warranties and indemnifications
provided in the relevant sales agreements.
For further information about discontinued operations,
see Note 5 to the consolidated financial statements.
Ahold at a glance
Business review
Governance
Financials
Investors
Group financial review (continued)
Earnings and dividend per share
Basic income from continuing operations per
common share was €0.90, an increase of €0.11
or 13.9% compared to 2013. This increase
was primarily driven by the average number of
outstanding common shares, which decreased as a
result of (i) the shares repurchased under the €2 billion
share buyback program that we completed in
2014 and (ii) the €1 billion capital repayment and
reverse stock split transaction. The value of shares
repurchased in 2014 amounted to €1,232 million.
The decrease in the average number of outstanding
common shares was marginally offset by shares
that were issued under employee share-based
compensation programs.
Our dividend policy is to target a payout ratio in
the range of 40-50% of adjusted income from
continuing operations. As part of our dividend policy
we adjust income from continuing operations for
significant nonrecurring items. Adjusted income from
continuing operations amounted to €777 million and
€807 million in 2014 and 2013, respectively, and
was determined as follows:
€ million
Income from continuing operations
Income from continuing operations per share
Add-back (after-tax):
European reorganization
Dutch pension plan amendments
Multi-employer pension plan settlement with the New England Teamsters and
Trucking Industry Pension Fund
Movements in income tax contingency reserves
Adjusted income from continuing operations
Adjusted income from continuing operations per share
31
Ahold
Annual Report 2014
2014
2013
791
0.90
805
0.79
30
(44)
–
–
—
—
777
0.88
39
(37)
807
0.79
Reflecting the confidence we have in our strategy and our ability to generate cash, we propose a common
stock dividend of €0.48 for the financial year 2014, up 2% from last year. It represents a payout ratio of 51%,
based on the expected dividend payment on adjusted income from continuing operations. We consider this to
be broadly in line with our dividend policy.
Our strong balance sheet enables us to launch a new 12-month €500 million share buyback program while
continuing to actively pursue our growth strategy and taking advantage of opportunities as they arise.
Income from continuing operations
per common share (basic)
€
0.82
0.84
2011
2012
0.72
2010
0.90
0.79
2013
2014
Dividend per common share
(2014 includes proposed dividend)
€
0.40
0.44
0.47
0.48
2013
2014
0.29
2010
2011
2012
Ahold at a glance
Business review
Governance
Financials
Investors
Group financial review (continued)
Financial position
Ahold’s consolidated balance sheets as of December 28, 2014, and December 29, 2013, are summarized
as follows:
€ million
Property, plant and equipment
Intangible assets
Pension assets
Other non-current assets
Cash, cash equivalents and short-term deposits and
similar instruments
Inventories
Other current assets
Total assets
Equity
Non-current portion of long-term debt
Pensions and other post-employment benefits
Other non-current liabilities
Short-term borrowings and current portion of
long-term debt
Payables
Other current liabilities
Total equity and liabilities
32
Ahold
Annual Report 2014
December 28,
2014
% of total
December 29,
2013
% of total
6,150
1,763
5
1,772
43.5%
12.5%
—
12.5%
5,712
1,563
5
1,594
37.7%
10.3%
—
10.5%
1,886
1,589
973
14,138
4,844
3,032
290
1,506
13.3%
11.2%
7.0%
100.0%
34.3%
21.4%
2.1%
10.6%
3,963
1,450
855
15,142
6,520
2,873
348
1,259
26.2%
9.6%
5.7%
100.0%
43.1%
19.0%
2.3%
8.3%
165
2,655
1,646
14,138
1.2%
18.8%
11.6%
100.0%
148
2,387
1,607
15,142
1.0%
15.7%
10.6%
100.0%
Property, plant and equipment increased by
€438 million, primarily due to the strengthening
of the U.S. dollar against the euro, while capital
expenditures were more than offset by depreciation
and impairments.
Our defined benefit plans showed a net deficit
of €285 million at year-end 2014 compared to
a net deficit of €343 million at year-end 2013.
This improvement was primarily due to positive
investment results on the plan assets and a decrease
of 0.7% in the indexation assumption for the Dutch
plan, mostly offset by decreases of 1.3% and 0.7%
in the discount rate assumption for the Dutch and
U.S. plans, respectively. A significant number of
union employees in the United States are covered
by multi-employer plans. With the help of external
actuaries, we have updated the most recent available
information that these plans have provided (generally
as of January 1, 2014) for market trends and
conditions through the end of 2014. We estimate
our proportionate share of the total net deficit to be
$658 million (€540 million) at year-end 2014 (2013:
$662 million or €481 million). These amounts are
not recognized on our balance sheet. While this
is our best estimate based on the information
available to us, it is imprecise and not necessarily
reliable. For more information see Note 23 to the
consolidated financial statements.
Equity decreased by €1,676 million, primarily
reflecting returns to shareholders which, in 2014,
included €1,232 million share buyback on the
€2 billion program, €1 billion capital repayment and
reverse stock split, and the dividend payment related
to 2013 of €414 million. These were partially offset
by the current year’s net income.
In 2014, gross debt increased by €176 million to
€3.2 billion, primarily due to the strengthening of the
U.S. dollar against the euro, partly offset by regular
payments on finance lease liabilities. Ahold’s net debt
was €1,311 million as of December 28, 2014, up
€2,253 million compared to last year, reflecting the
significant reduction in cash balances primarily as a
result of returns to shareholders.
Gross and net debt
€ billion
3.6
0.7
3.7
1.1
2.8
2.6
2010
2011
3.2
3.0
1.4
3.2
1.3
1.9
(0.9)
2012
2013
1.9
4.0
2014
Gross debt
Net debt
Cash, short-term deposits and similar instruments
Net debt does not include our commitments under
operating lease contracts, which, on an undiscounted
basis, amounted to €5.8 billion at year-end 2014.
These off-balance sheet commitments impact
our capital structure. The present value of these
commitments is added to net debt to measure our
leverage against EBITDAR (i.e. underlying operating
income before depreciation, amortization and gross
rent expense). The ratio of net lease-adjusted debt
to EBITDAR stood at 1.9 times at year-end 2014, up
from 0.9 times last year, distorted by a temporary
increase in cash balance. Under normal conditions
we expect to operate at around 2 times, which is
consistent with our commitment to maintaining an
investment grade credit rating.
Our ambition for return on capital employed is to
deliver in the top quartile of the food retail sector.
Ahold at a glance
Business review
Governance
Financials
Investors
Group financial review (continued)
Liquidity and cash flows
Liquidity
Ahold relies on cash provided by operating activities
as a primary source of liquidity, in addition to debt
and equity issuances in the capital markets, credit
facilities and available cash balances. Based on our
current operating performance and liquidity position,
we believe that cash provided by operating activities
and available cash balances (including short-term
deposits and similar instruments) will be sufficient
for working capital, capital expenditure, planned
shareholder returns including dividend payments
and our new €500 million share buyback program,
interest payments, and scheduled debt repayment
requirements for the next 12 months and the
foreseeable future. A total of €30 million in loans will
mature in 2015, €0.4 billion in 2016 through 2019
and €1.0 billion after 2019.
As of year-end 2014, liquidity amounted to
€3.1 billion (2013: €5.0 billion), defined as cash
(including cash, cash equivalents and short-term
deposits and similar instruments) of €1.9 billion and
the undrawn portion of the committed credit facility
of €1.2 billion.
We continue to take a balanced approach between
investing in the business, repaying debt, and returning
cash to shareholders.
Under normal conditions we expect to operate with
liquidity of around €2.0 billion, evenly split between
cash and the undrawn portion of our committed
credit facilities. It is our intention to move to this level
of liquidity as we continue to invest in growth, reduce
our debt and return cash to shareholders, resulting in
a more efficient capital structure.
Group credit facility
Ahold has access to a €1.2 billion committed,
unsecured, multi-currency and syndicated credit
facility which was refinanced in June 2011. In June
2013, the full amount of the facility was extended
to June 2018. The facility may be used for working
capital and for general corporate purposes
and provides for the issuance of $550 million
Ahold
Annual Report 2014
(€400 million) in letters of credit. As of December 29,
2013, there were no outstanding borrowings under
the credit facility other than letters of credit to an
aggregate amount of $16 million (€13 million).
In the beginning of 2015, we issued a request to our
relationship banks to amend the facility by extending
it through 2020 and reducing the amount from
€1.2 billion down to €1 billion, which we expect to
be the undrawn amount. Ahold expects to close the
process during the first quarter of 2015.
Credit ratings
Maintaining investment grade credit ratings is a
cornerstone of our strategy as they serve to lower
the cost of funds and to facilitate access to a variety
of lenders and markets. S&P upgraded Ahold’s
corporate credit rating to BBB with a stable outlook in
June 2009 and, since then, this rating has remained
unchanged. In July 2013, Moody’s affirmed Ahold’s
Baa3 issuer credit rating and changed its outlook to
positive from stable.
Cash flows
Free cash flow, at €1,055 million, decreased by
€54 million compared to 2013. Operating cash
flows from continuing operations were down
€158 million, primarily as a result of higher income
tax paid. The purchase of non-current assets was
lower by €79 million.
Ahold consolidated cash flows for 2014 and 2013 are as follows:
Operating cash flows from continuing operations
Purchase of non-current assets
Divestment of assets / disposal groups held for sale
Dividends from joint ventures
Interest received
Interest paid
Free cash flow
Repayments of loans and finance lease liabilities
Dividends paid on common shares
Share buyback
Acquisition / divestments of businesses, net of cash acquired / divested
Cash flows from discontinued operations
Capital repayment
Other
Change in cash, cash equivalents, and short-term
deposits and similar instruments
Changes in short-term deposits and similar instruments
Net cash from operating, investing and financing activities
In 2014, the main uses of free cash flow included:
aa Completion of the €2 billion share buyback
program of €1,232 million
aa Capital repayment and reverse stock split of
€1 billion
aa Settlement of Waterbury class action amounting to
€241 million
1,051
1,029
1,109
aa Acquisition of SPAR of €167 million (total purchase
consideration net of cash acquired)
1,055
845
2010
2011
2012
2013
2014
2014
€ million
aa Common stock dividend at €0.47 per share
resulting in a cash outflow of €414 million
Free cash flow
€ million
33
aa Debt repayments totaling €104 million primarily
related to regular payments on finance
lease liabilities
2013
1,893
(732)
77
18
6
(207)
1,055
(104)
(414)
(1,232)
(481)
(19)
(1,008)
(24)
2,051
(811)
52
27
6
(216)
1,109
(94)
(457)
(768)
2,343
115
—
(95)
(2,227)
1,222
(1,005)
2,153
(1,472)
681
In 2013, cash flow from discontinued operations
reflects the dividend received from ICA.
Other cash flows in 2013 included a settlement paid
to Vornado (€92 million), the result of a judgment
rendered in the Stop & Shop Bradlees lease litigation.
Business review
Ahold at a glance
Governance
Financials
Investors
Group financial review (continued)
Capital investments and
property overview
Capital expenditure, which include new finance
leases, amounted to €1 billion in 2014 and
€0.8 billion in 2013. Our investments were primarily
related to the construction, remodeling and expansion
of stores and supply chain (including online) and
IT infrastructure improvements. In 2014, capital
expenditure also included the acquisition of SPAR in
the Czech Republic. Excluding acquisitions, capital
expenditure in 2014 was €0.7 billion, below our
guidance of €0.9 billion.
At current exchange rates, capital expenditures,
excluding acquisitions, are expected to be around
€0.9 billion in 2015.
Capital expenditures
€ billion
0.9
0.9
0.8
1.0
0.8
0.8
2.9%
2.7%
2.8%
2.5%
2.3%
2010
2011
2012
2013
2014
Acquisition capex
Regular capex
0.8
Regular capex as % of sales
0.7
December 29,
2013
Opened /
acquired
767
2,056
284
3,107
24
3,131
3
74
50
127
—
127
Closed / sold
(2)
(25)
(1)
(28)
(24)
(52)
We also operated the following other properties as
of December 28, 2014:
December 28,
2014
768
2,105
333
3,206
—
3,206
1 The number of stores as of December 28, 2014, includes 1,139 specialty stores (Etos and Gall & Gall). In addition, 15 C1000 stores
were converted to the Albert Heijn banner during 2014.
Franchisees operated 869 Albert Heijn, Etos and Gall & Gall stores, 523 of which were either owned by the
franchisees or leased independently from Ahold.
Number of stores leased or owned
Number of stores subleased to franchisees
Number of stores operated
1.9
1.1
At the end of 2014, we operated 3,206 stores, a net increase of 75 stores. Total sales area increased by
5.1% (or 1.7% excluding the SPAR stores) to 4.9 million square meters. This includes franchise stores and
excludes the stores operated by our joint venture JMR.
Ahold USA
The Netherlands1
Czech Republic
Continuing operations
Slovakia
Total number of stores
34
Ahold
Annual Report 2014
Ahold
Franchisees
Total
2,683
(346)
2,337
523
346
869
3,206
—
3,206
Ahold’s stores range in size from 20 to 10,000 square meters. The average sales area of our stores in the
United States is approximately 3,850 square meters and in Europe approximately 1,350 square meters
(excluding Etos and Gall & Gall, which operate much smaller stores).
At the end of 2014, Ahold operated 243 pick-up points, 106 more than in 2013. These were either
standalone, in-store or office-based. In 2014, we opened 89 pick-up points in the U.S., bringing the total to
209, and 17 in the Netherlands, bringing the total to 34.
Our total number of retail locations, including the 2,683 stores owned or leased by Ahold and 14 pick-up
points in stand-alone locations, was 2,697 in 2014, higher by 73 compared to 2013.
Warehouse / distribution centers /
production facilities / offices
Properties under construction / development
Investment properties
Total
84
9
685
778
The investment properties consist of buildings and
land. Virtually all these properties were subleased
to third parties. The majority were shopping centers
containing one or more Ahold stores and third-party
retail units generating rental income.
The following table breaks down the ownership
structure of our 2,697 retail locations and 778 other
properties as of December 28, 2014:
% of total
Company-owned
Leased
of which:
Finance leases
Operating leases
Retail locations
Other properties
20%
80%
40%
60%
13%
67%
7%
53%
Our leased properties have terms of up to 25 years,
with renewal options for additional periods.
Store rentals are normally payable on a monthly basis
at a stated amount or, in a limited number of cases,
at a guaranteed minimum amount plus a percentage
of sales over a defined base.
Ahold at a glance
Business review
Governance
Financials
Investors
Group financial review (continued)
Ahold USA
Ahold
Annual Report 2014
The Netherlands
Number of stores
2014
2013
Number of stores
Stop & Shop New England
Stop & Shop New York Metro
Giant Landover
Giant Carlisle
Total Ahold USA
Sales area of own-operated stores
(in thousands of square meters)
216
182
170
200
768
215
182
170
200
767
Albert Heijn: the Netherlands
Albert Heijn: Belgium
Albert Heijn to go: the Netherlands
Albert Heijn to go: Germany
Etos
Gall & Gall
Total The Netherlands
Sales area of own-operated stores
(in thousands of square meters)
2,958 2,941
Ahold USA increased its number of stores by one, net
of three openings and two closures. Peapod opened
another 89 pick-up points, bringing the total to 209
in 2014.
In 2014, the Ahold USA divisions remodeled,
expanded, relocated or reconstructed 43 stores
as part of their continuous focus on keeping stores
fresh and up-to-date. Total investments at Ahold USA
amounted to around 2% of sales and ranged from
new stores to investments in IT, distribution centers,
and minor construction work in the stores.
At the end of 2014, Ahold USA operated 231 fuel
stations, an increase of one station over last year,
the majority of which are located in the Giant Carlisle
and the Stop & Shop New England market areas.
Czech Republic
2014
2013
872
849
28
19
62
59
4
5
539
538
600
586
2,105 2,056
976
935
In 2014, we opened an additional 49 stores net
of closings, bringing the total to 2,105. This year,
15 former C1000 stores were converted to the
Albert Heijn brand, bringing the total converted stores
to 54. These converted stores were part of the 2012
transfer of 82 stores from Jumbo. We also opened
another nine stores in Belgium, bringing the total
number of stores there to 28.
Albert Heijn online opened another 17 pick-up points,
bringing the total to 34 in 2014.
In the Netherlands, our businesses remodeled,
expanded, relocated or reconstructed 131 stores as
part of their continuous focus on keeping stores fresh
and up-to-date. Total investments in the Netherlands
amounted to around 2.8% of sales and ranged from
opening new stores to investing in IT, distribution
centers, and minor construction work in the stores.
Number of stores
2014
2013
Czech Republic
Sales area of own-operated stores
(in thousands of square meters)
333
284
550
393
In 2014, the main focus area in the Czech Republic
was the integration of the 49 stores following the
acquisition of the SPAR business, including the
successful re-branding of 14 SPAR supermarkets and
one hypermarket into Albert.
We also remodeled 15 Albert stores in part as
a result of the further rollout of the project started
in 2011 to remodel all its hypers to a new
compact format.
At the end of 2014, Albert operated 333 stores in
the Czech Republic, 91 of which were compact
hypers, and 242 supermarkets.
35
Ahold at a glance
Business review
Governance
Financials
Investors
Group financial review (continued)
Ahold
Annual Report 2014
36
The key financial and non-financial information per segment for 2014 and 2013 is presented below:
Ahold USA
€ million
Net sales (€ millions)
Net sales ($ millions)
Net sales growth
Identical sales growth1
Identical sales growth (excluding gasoline sales)
Comparable sales growth (excluding gasoline sales)1
Operating income (€ millions)
Operating income ($ millions)
Underlying operating income (€ millions)
Underlying operating margin
Number of employees / headcount (at year end in thousands)
Number of employees / FTEs (at year end in thousands)
Contribution to Ahold net sales
Contribution to Ahold underlying operating income2
The Netherlands
Czech Republic
2014
2013
2014
2013
2014
2013
19,557
25,976
(0.5)%
(0.4)%
(0.1)%
0.1%
19,676
26,118
1.1%
0.2%
0.3%
0.4%
11,696
11,494
1,521
1,445
1.8%
(0.5)%
4.0%
0.6%
(0.3)%
0.5%
5.3%
(1.8)%
(1.2)%
(1.1)%
(4.7)%
(1.7)%
(1.5)%
(1.5)%
727
965
738
3.8%
663
883
801
4.1%
584
612
13
31
574
4.9%
619
5.4%
19
1.2%
30
2.1%
115
83
117
83
97
31
94
30
15
12
10
8
59.7%
55.5%
60.3%
55.3%
35.7%
43.1%
35.3%
42.7%
4.6%
1.4%
4.4%
2.0%
1 Identical sales growth and comparable sales growth in the Netherlands excludes the VAT on tobacco sales. For the definition see non-GAAP measures at the end of this section.
2 Before Corporate Center costs.
Ahold at a glance
Business review
Governance
Financials
Investors
Non-GAAP measures
This Annual Report includes
the following non-GAAP
financial measures:
Adjusted income from continuing operations
Income from continuing operations adjusted for
significant non-recurring items. This measure is a
component of Ahold’s dividend policy, which sets
the dividend payout ratio to be 40-50% of adjusted
income from continuing operations.
Comparable sales, excluding gasoline net sales
Identical sales plus net sales from replacement stores
in local currency, excluding gasoline net sales.
Because gasoline prices have experienced greater
volatility than food prices, Ahold’s management
believes that by excluding gasoline net sales, this
measure provides a better insight into the growth
of its comparable store sales.
Corporate Center costs
Corporate Center costs relate to the responsibilities
of the Corporate Center, including Corporate
Finance, Corporate Strategy, Internal Audit, Legal,
Compliance, Human Resources, Information
Technology, Insurance, Communications, Corporate
Responsibility, and the majority of the Executive
Committee. Corporate costs also include results from
other activities coordinated centrally but not allocated
to any operating company. Underlying Corporate
Center costs exclude impairments of non-current
assets, gains and losses on the sale of assets, and
restructuring and related charges and other items,
including business acquisition transaction costs.
Free cash flow
Operating cash flows from continuing operations
minus net capital expenditures minus net interest
paid, plus dividends received. Ahold’s management
believes this measure is useful because it provides
insight into the cash flow available to, among other
things, reduce debt and pay dividends.
Ahold
Annual Report 2014
Gross rent
Gross rent comprises all of the rent that Ahold is
required to pay to third parties and is not corrected
for rental income Ahold receives from other
third parties.
Identical sales
Net sales from exactly the same stores and online
sales in existing market areas, in local currency for
the comparable period.
Identical sales, excluding gasoline net sales
Because gasoline prices have experienced greater
volatility than food prices, Ahold’s management
believes that by excluding gasoline net sales, this
measure provides a better insight into the growth of
its identical store sales.
Identical / comparable sales, excluding VAT from
tobacco sales
Until July 1, 2013, Value Added Tax (VAT) on
tobacco products sold in the Netherlands was
levied over the retail price at the same time as the
excise duties were due. From July 1, 2013, levying
VAT on tobacco products was aligned with the
mechanism of levying VAT on all other consumer
products. The result is a reduction in recognized
net sales related to tobacco products without a
corresponding reduction in volume or gross margin.
Ahold’s management believes that excluding the
pre- as well as the post-July 1, 2013 VAT from
tobacco sales in the measure of identical /
comparable sales provides a better insight into the
growth of its identical / comparable store sales.
Liquidity
Cash and cash equivalents, short-term deposits
and similar instruments, and undrawn funds
available under the committed credit facility.
Ahold’s management believes this measure
is useful because it provides insight into funds
available to manage the company.
Net consumer online sales
Total online sales to customers, excluding sales taxes
and value-added taxes, but including sales of third
parties via bol.com’s Plaza. Ahold management
believes that this measure provides more insight into
the growth of our online businesses.
Net debt
Net debt is the difference between (i) the sum of
loans, finance lease liabilities, cumulative preferred
financing shares and short-term debt (i.e., gross
debt) and (ii) cash, cash equivalents, and short-term
deposits and similar instruments. In management’s
view, because cash, cash equivalents, and short-term
deposits and similar instruments can be used, among
other things, to repay indebtedness, netting this
against gross debt is a useful measure for investors
to judge Ahold’s leverage. Net debt may include
certain cash items that are not readily available for
repaying debt.
Net lease adjusted debt / EBITDAR
Net debt increased by the present value of future
operating lease commitments over underlying
operating income before depreciation, amortization
and gross rent expense. Ahold’s management
believes this measure is useful because it provides
insight into Ahold’s leverage, adjusted for the impact
of operating leases that count for a significant part of
Ahold’s capital structure.
Net sales at constant exchange rates
Net sales at constant exchange rates exclude
the impact of using different currency exchange
rates to translate the financial information of Ahold
subsidiaries or joint ventures to euros. Ahold’s
management believes this measure provides a better
insight into the operating performance of Ahold’s
foreign subsidiaries or joint ventures.
Net sales in local currency
In certain instances, net sales are presented in
local currency. Ahold’s management believes this
measure provides a better insight into the operating
performance of Ahold’s foreign subsidiaries.
37
Operating income in local currency
In certain instances operating income is presented
in local currency. Ahold’s management believes this
measure provides better insight into the operating
performance of Ahold’s foreign subsidiaries.
Return on capital employed
Return on capital employed (ROCE) is calculated
as the sum of underlying operating income and the
50% gross rent add back, divided by the annual
rolling average of the sum of property, plant and
equipment, intangible assets, working capital
components, and gross rent expense multiplied
by eight.
Total shareholder return
Total shareholder return (TSR) is the sum of share
price growth and dividends paid. In this report, we
disclose TSR as defined for the purposes of Ahold’s
Global Reward Opportunity (GRO) program.
A daily TSR index obtained from Thomson Reuters is
averaged over a six-month period preceding the year
end (average TSR index). Annual TSR is an increase
in the average TSR index compared to the average
TSR index in the previous year.
Underlying operating income
Total operating income, adjusted for impairments of
non-current assets, gains and losses on the sale of
assets, restructuring and related charges, and other
unusual items. Ahold’s management believes this
measure provides better insight into the underlying
operating performance of Ahold’s operations.
Management believes that these non-GAAP financial
measures allow for a better understanding of Ahold’s
operating and financial performance. These nonGAAP financial measures should be considered in
addition to, but not as substitutes for, the most directly
comparable IFRS measures.
Ahold at a glance
Governance
Business review
Governance
Financials
Investors
Ahold
Annual Report 2014
38
Governance
Executive Committee
and Management Board
39
Supervisory Board
41
Corporate governance
43
Supervisory Board report
47
How we manage risk
51
Remuneration57
Declarations62
Ahold at a glance
Business review
Governance
Financials
Investors
Our Executive Committee and Management Board1
Ahold
Annual Report 2014
39
A balance of
expertise and
experience
Our Executive Committee and Management
Board provide a management structure designed
to support our business, meet the needs of our
stakeholders and comply with relevant rules and
regulations. Our Executive Committee is comprised
of our Management Board (that has ultimate
responsibility for the overall management of the
company) and certain of our key officers.
Board diversity
Gender
2
Female
5
Male
Nationality
Jeff Carr
James McCann
President and Chief Executive Officer
Executive Vice President and
Chief Financial Officer
Executive Vice President and
Chief Operating Officer Ahold USA
Chairman Management Board and
Executive Committee
Member Management Board and
Executive Committee
Member Management Board and
Executive Committee
Dick Boer (August 31, 1957) is a Dutch national.
On September 29, 2010, the Supervisory Board
appointed him Chief Executive Officer of Ahold,
effective March 1, 2011. Prior to that date, Dick had
served as Chief Operating Officer Ahold Europe
since November 6, 2006.
Jeff Carr (September 17, 1961) is a British national.
Ahold’s shareholders appointed him to the
Management Board on April 17, 2012. Jeff joined
Ahold in November 2011 as acting member of the
Management Board and Chief Financial Officer
(CFO).
Dick joined Ahold in 1998 as CEO of Ahold Czech
Republic and was appointed President and CEO of
Albert Heijn in 2000. In 2003, he became President
and CEO of Ahold’s Dutch businesses. Ahold’s
shareholders appointed him to the Management
Board on May 3, 2007.
Before joining Ahold, Jeff was group finance director
and a member of the board at UK-based FirstGroup,
the leading transport operator in the United Kingdom
and North America. He began his career at
Unilever, and held senior roles in finance at easyJet,
Associated British Foods, Reckitt Benckiser and
Grand Metropolitan. Jeff has served as CFO of listed
companies since 2005, and has lived and worked
in Europe and the United States.
James McCann (October 4, 1969) is a British
national. Ahold’s shareholders appointed him to the
Management Board on April 17, 2012. James had
first joined Ahold on September 1, 2011, as acting
member of the Management Board and Chief
Commercial & Development Officer. On February 1,
2013, he became Chief Operating Officer
Ahold USA.
Prior to joining Ahold, Dick spent more than 17 years
in various retail positions for SHV Holdings N.V. in the
Netherlands and abroad and for Unigro N.V.
Dick is co-chair of The Consumer Goods Forum,
member of the board of the European Retail Round
Table, and vice chair and a member of the executive
board of The Confederation of Netherlands Industry
and Employers (VNO-NCW). He is also a member
of the advisory board of G-star.
1
USA
2
UK
Dick Boer
4
Netherlands
1 The duties of the Management Board are described under Corporate Governance in this Annual Report.
Before joining Ahold, James was executive director
for Carrefour France and a member of Carrefour’s
group executive board for one year. During the
previous seven years, he held leading roles in various
countries for Tesco plc. Prior to that, he worked for
Sainsbury’s, Mars and Shell.
Ahold at a glance
Business review
Governance
Financials
Investors
Our Executive Committee and Management Board (continued)
Ahold
Annual Report 2014
40
Hanneke Faber
Abbe Luersman
Jan Ernst de Groot
Wouter Kolk
Chief Commercial Officer
Chief Human Resources Officer
Chief Legal Officer
Chief Operating Officer Ahold Netherlands
and Chief Executive Officer Albert Heijn
Member Executive Committee
Member Executive Committee
Member Executive Committee
Member Executive Committee
Hanneke Faber (April 19, 1969) is a Dutch national.
On August 21, 2013, the Supervisory Board
appointed Hanneke as Chief Commercial Officer
and member of the Executive Committee, effective
September 1, 2013. She is responsible for leading
the global online and customer loyalty initiatives,
ensuring and accelerating an integrated approach
to the first two pillars of Ahold’s strategy, “increasing
customer loyalty” and “broadening our offering.”
Abbe Luersman (December 4, 1967) is a U.S.
national. The Supervisory Board appointed Abbe
as Chief Human Resources Officer and member
of the Executive Committee, effective November
1, 2013. She is responsible for HR, inclusive of
talent, performance, leadership and organizational
development, Total Reward and HR Services
and Solutions.
Jan Ernst de Groot (April 11, 1963) is a Dutch
national. On January 8, 2015, the Supervisory
Board appointed Jan Ernst as Chief Legal Officer
and member to the Executive Committee, effective
February 1, 2015. He is responsible for legal
affairs, the Company’s governance and compliance
functions, product integrity, and our responsible
retailing strategy.
Before joining Ahold, Abbe worked for Unilever,
where she held various HR leadership roles,
most recently as head of Human Resources for
Unilever Europe. Prior to Unilever, Abbe worked
at Whirlpool Corporation, holding various senior
roles in human resources, both in the United States
and internationally.
Before joining Ahold, Jan Ernst was general counsel
and managing director External Affairs & Corporate
Responsibility at TNT Express. Prior to that, he worked
for KLM Royal Dutch Airlines in a wide range of
business and legal roles, most recently as managing
director and member of the board of management.
He was also responsible for the development
and implementation of KLM’s transformative
sustainability strategy.
Wouter Kolk (April 26, 1966) is a Dutch national.
On January 14, 2015, the Supervisory Board
appointed Wouter as Chief Executive Officer
Albert Heijn and member of the Executive Committee,
effective February 1, 2015. Wouter had re-joined
Ahold in 2013 as EVP Specialty Stores and New
Markets at Albert Heijn following a six-year career
as CEO of international retailer WE Fashion. He first
started at Ahold in 1991, and over the next 16
years served in several commercial and operational
management roles, including Commercial Director
Asia-Pacific based in Singapore, Regional Director
Albert Heijn, General Manager Gall & Gall, and,
until 2007, General Manager of Etos.
Before joining Ahold, Hanneke was vice president
and general manager Global Pantene, Head &
Shoulders and Herbal Essences at Procter & Gamble.
She began her career at Procter & Gamble in 1992
and has held various senior roles in marketing in both
Europe and in the United States.
Jan Ernst is chairman of the supervisory councils of
Hivos and Wetlands International. He is a board
member of the Hermitage Museum Amsterdam and
of the U.S. non-profit Salzburg Global Seminar where
he chairs the health & sustainability committee.
Ahold at a glance
Business review
Governance
Financials
Investors
Supervisory Board
Ahold
Annual Report 2014
Rob van den Bergh
Judith Sprieser
Stephanie Shern
Jan Hommen
Chairman (ad interim)
Vice Chairman
Chairman of the Audit Committee
Chairman of the Remuneration Committee
Judith Sprieser (August 3, 1953) is a U.S. national.
She was first appointed to the Supervisory Board
on May 18, 2006, and she will step down from
the Supervisory Board following our 2015 annual
General Meeting of Shareholders. Judith is former
CEO of Transora Inc., which she founded in 2000.
Prior to that, she was executive vice president and
CFO of Sara Lee Corporation. She is the managing
director of Warrenton Advisors LLC and a director
of Allstate Corporation, Reckitt Benckiser plc.,
Jimmy Choo plc., Intercontinental Exchange Inc.
and Experian plc.
Stephanie Shern (January 7, 1948) is a U.S. national.
She was first appointed to the Supervisory Board
on May 18, 2005, and her term runs until 2017.
Stephanie was with Ernst & Young for over 30 years,
most recently as vice chairman and global director
of retail and consumer products and a member of
Ernst & Young’s U.S. Management Committee. She is
the lead director and chair of the audit committee of
Gamestop and a member of the board and audit
committee of Abercrombie & Fitch. Stephanie is also
a member of the advisory board of Pennsylvania
State University’s accounting major program and a
founding member of the Lead Director Network and
of the Southwest Region of the United States Audit
Committee Network, both organized by Tapestry
Networks in the United States.
Chairman of the Selection and
Appointment Committee
Rob van den Bergh (April 10, 1950) is a Dutch
national. He was appointed to the Supervisory
Board on April 20, 2011, and his term runs until
2015. Rob was designated as interim Chairman
of the Supervisory Board on June 14, 2014, to
temporarily replace Jan Hommen in view of his
appointment as CEO of KPMG the Netherlands.
Rob is former CEO of VNU N.V. Prior to that, he held
various other executive positions within VNU and was
a member of the executive board from 1992 until
his appointment as CEO in 2000. Rob is currently
chairman of the supervisory boards of Stichting Isala
Klinieken and N.V. Deli Maatschappij, from which
latter board Rob will step down as of April 1, 2015.
Rob is a member of the advisory boards of CVC
Capital Partners and Pon Holdings B.V.
Board diversity
Gender
2
Female
Nationality
6
Male
3
USA
5
Netherlands
41
Jan Hommen (April 29, 1943) is a Dutch national.
He was appointed to the Supervisory Board at
the General Meeting of Shareholders on April 17,
2013. His term runs until 2017. Jan was previously
Vice Chairman of Ahold’s Supervisory Board and
served as Chairman of the Audit Committee from
2003 to 2007. He is the former CEO of ING Group
N.V., former CFO and vice chairman of the board
of management of Royal Philips Electronics N.V.
and former CFO of Aluminum Company of America.
He has held chairman positions on the supervisory
boards of TNT N.V. and Reed Elsevier N.V. and was
a member of the board of Campina. Currently he
is the CEO of KPMG the Netherlands, chairman of
Brabantse Ontwikkelings Maatschappij Holding B.V.
and a member of the supervisory board of PSV N.V.
He is also chairman of the board of trustees of Tilburg
University and a member of the board of trustees of
the Royal Concertgebouw Orchestra.
Ahold at a glance
Business review
Governance
Financials
Investors
Supervisory Board (continued)
Ahold
Annual Report 2014
42
Derk Doijer
Mark McGrath
Ben Noteboom
René Hooft Graafland
Derk Doijer (October 9, 1949) is a Dutch national.
He was first appointed to the Supervisory Board on
May 18, 2005, and his term runs until 2017. Derk is
a former member of the executive board of directors
of SHV Holdings N.V. and, prior to that, held several
executive positions in the Netherlands and South
America. He is chairman of the supervisory board of
Lucas Bols N.V.
Mark McGrath (August 10, 1946) is a U.S. national.
He was appointed to the Supervisory Board on
April 23, 2008, and his term runs until 2016. Mark is
a director emeritus of McKinsey & Company. He led
the firm’s Americas’ Consumer Goods Practice from
1998 until 2004, when he retired from the company.
Mark is a former director of GATX and Aware, Inc.
He is advisory board chairman of the University of
Notre Dame’s Kellogg International Studies Institute.
He also serves on the advisory councils of the
University of Chicago’s Booth Graduate School of
Business and Notre Dame’s Kroc International Peace
Studies Institute. Mark is a trustee and serves on
the executive committee of the Chicago Symphony
Orchestra Association.
Ben Noteboom (July 4, 1958) is a Dutch national.
He was appointed to the Supervisory Board on
April 28, 2009, and his term runs until 2017. Ben is
former CEO and chairman of the executive board of
Randstad Holding N.V., to which he was appointed
in 2001. He had first joined Randstad in 1993 and
held various senior management positions during
his time with the company. Ben is a member of the
boards of the Holland Festival Foundation and the
Cancer Center Amsterdam.
René Hooft Graafland (September 24, 1955)
is a Dutch national. He was appointed to the
Supervisory Board on April 16, 2014, with effect
from January 1, 2015, and his term runs until
2018. René currently holds the position of CFO
and member of the executive board of Heineken
N.V., from which position he will step down in
April 2015. Before being appointed member of
Heineken’s executive board in 2002, he held various
international management positions with the company
in Europe, Asia and Africa. René is member of the
supervisory board of Wolters Kluwer N.V. and, as of
May 1, 2015, of the supervisory board of Koninklijke
FrieslandCampina N.V. He is also chairman of
the supervisory board of Royal Theatre Carré
and member of the board of the Stichting African
Parks Foundation.
Ahold at a glance
Business review
Governance
Financials
Investors
Corporate governance
Ahold is committed to a corporate
governance structure that best supports
its business and meets the needs of
its stakeholders and that complies
with relevant rules and regulations.
This section contains an overview of our
corporate governance structure and includes
information required under the Dutch Corporate
Governance Code.
Governance structure
Koninklijke Ahold N.V. (the Company) is a public
company under Dutch law with a two-tier board
structure. Our Management Board has ultimate
responsibility for the overall management of Ahold.
We also have an Executive Committee comprised
of our Management Board as well as certain key
officers of the Company. The Executive Committee is
led by the Chief Executive Officer and is accountable
to the Management Board. The Management Board
is supervised and advised by a Supervisory Board.
The Management Board and the Supervisory Board
are accountable to Ahold’s shareholders.
Our Company is structured to effectively execute our
strategy and to balance local, continental and global
decision-making. It is comprised of a Corporate
Center and three platforms: Ahold USA, Ahold The
Netherlands and Ahold Czech Republic, each of
which contains a number of businesses.
The following diagram shows Ahold’s governance
structure. A list of subsidiaries, joint ventures and
associates is included in Note 36 to the consolidated
financial statements.
Management Board and
Executive Committee
The Executive Committee manages our general
affairs and ensures that we can effectively
implement our strategy and achieve our objectives.
The Management Board is ultimately responsible for
the actions and decisions of the Executive Committee,
and the overall management of Ahold. For a more
detailed description of the responsibilities of the
Executive Committee and the Management Board,
please refer to the rules of procedure in the corporate
governance section of Ahold’s public website at
www.ahold.com.
Governance structure
General Meeting of Shareholders
Audit Committee
Supervisory Board
Remuneration Committee
Management Board
Selection and Appointment Committee
Executive Committee
Ahold
USA
Ahold
The Netherlands
43
Ahold
Annual Report 2014
Composition
According to our Articles of Association, the
Management Board must consist of at least three
members. The current members of the Management
Board are: Dick Boer, President and Chief Executive
Officer; Jeff Carr, Executive Vice President and
Chief Financial Officer; Lodewijk Hijmans van den
Bergh, Executive Vice President and Chief Corporate
Governance Counsel; and James McCann,
Executive Vice President and Chief Operating Officer
Ahold USA. The current members of the Executive
Committee are the members of the Management
Board plus Hanneke Faber, Chief Commercial
Officer; Wouter Kolk, Chief Operating Officer Ahold
Netherlands and Chief Executive Officer Albert Heijn;
Abbe Luersman, Chief Human Resources Officer and
Jan Ernst de Groot, Chief Legal Officer. In October
2014, we announced that Lodewijk Hijmans van den
Bergh, Chief Corporate Governance Counsel and
member of the Management Board and Executive
Committee, would step down. This will take effect
as of March 1, 2015. The size and composition of
our Management Board and Executive Committee
and the combined experience and expertise of their
members should reflect the best fit for Ahold’s profile
and strategy. This aim for the best fit, in combination
with the availability of qualifying candidates, has
resulted in Ahold, as of March 1, 2015, having a
Management Board in which all three members
are male and an Executive Committee in which five
members are male and two are female. In order
to increase gender diversity of the Management
Board, in accordance with article 2:276 section 2
of the Dutch Civil Code, we pay close attention
to gender diversity in the process of recruiting and
Corporate Center
Appointment, suspension and dismissal
The General Meeting of Shareholders can appoint,
suspend, or dismiss a Management Board member
by an absolute majority of votes cast, upon a
proposal made by the Supervisory Board. If another
party makes the proposal, an absolute majority of
votes cast, representing at least one-third of the issued
share capital, is required. If this qualified majority is
not achieved, but a majority of the votes exercised
was in favor of the proposal, then a second meeting
may be held.
In the second meeting, only a majority of votes
exercised, regardless of the number of shares
represented at the meeting, is required to adopt
the proposal. Management Board members
are appointed for four-year terms and may be
reappointed for additional terms not exceeding
four years. The Supervisory Board may at any
time suspend a Management Board member.
Remuneration
On April 17, 2013, Ahold’s General Meeting of
Shareholders adopted our current remuneration policy
for Management Board members. You can find
details of this policy in Remuneration. For detailed
information on the individual remuneration of
Management Board members, see Notes 31
and 32 to the consolidated financial statements.
Possible reappointment schedule of Management Board
Name
Ahold
Czech Republic
appointing new Management Board members.
In addition, we continuously recruit female executives,
as demonstrated by the appointment of two women
to the Executive Committee. We also encourage the
professional development of female associates, which
has already led to the promotion of several women to
key leadership positions across the Group.
Dick Boer
Jeff Carr
Lodewijk Hijmans van den Bergh
James McCann
Date of birth
Date of
first appointment
August 31, 1957
September 17, 1961
September 16, 1963
October 4, 1969
May 3, 2007
April 17, 2012
April 13, 2010
April 17, 2012
* Lodewijk Hijmans van den Bergh will step down from the Management Board as of March 1, 2015.
Date of possible
reappointment
2015
2016
NA*
2016
Ahold at a glance
Business review
Governance
Financials
Investors
Corporate governance (continued)
Supervisory Board
The Supervisory Board is responsible for supervising
and advising our Management Board and
overseeing the general course of affairs and strategy
of the Company. The Supervisory Board is guided
in its duties by the interests of the Company and
the enterprise connected with the Company, taking
into consideration the overall good of the enterprise
and the relevant interests of all its stakeholders.
The Supervisory Board is responsible for monitoring
and assessing its own performance. Ahold’s Articles
of Association require the approval of the Supervisory
Board for certain major resolutions proposed to be
taken by the Management Board, including:
aa Issuance of shares
aa Acquisitions, redemptions, repurchases of
shares, and any reduction in issued and
outstanding capital
aa Allocation of duties within the Management Board
and the adoption or amendment of the Rules of
Procedure of the Executive Committee and the
Management Board
aa Significant changes in the identity or the nature
of the Company or its enterprise
Appointment
The General Meeting of Shareholders can appoint,
suspend or dismiss a Supervisory Board member by
an absolute majority of votes cast, upon a proposal
made by the Supervisory Board. If another party
makes the proposal, an absolute majority of votes
cast, representing at least one-third of the issued share
capital, is required. If this qualified majority is not
achieved but a majority of the votes exercised was
in favor of the proposal, then a second meeting may
be held. In the second meeting, only a majority of
votes exercised, regardless of the number of shares
represented at the meeting, is required. A Supervisory
Board member is appointed for a four-year term
and is eligible for reappointment. However, a
Supervisory Board member may not serve for more
than 12 years.
You can find more detailed information on the
Supervisory Board in the Supervisory Board report.
The Rules of Procedure of the Supervisory Board
can be found in the corporate governance section
of Ahold’s public website at www.ahold.com.
The composition of the Supervisory Board, including
its members’ combined experience and expertise,
independence, and diversity of age and gender,
should reflect the best fit for Ahold’s profile and
strategy. This aim for the best fit, in combination with
the availability of qualifying candidates, has resulted
in Ahold currently having a Supervisory Board in
which two members are female and six members
are male. In order to increase gender diversity in
the Supervisory Board in accordance with article
2:276 section 2 of the Dutch Civil Code, we pay
close attention to gender diversity in the process
of recruiting and appointing new Supervisory
Board candidates.
Conflict of interest
Each member of the Management Board is required
to immediately report any potential conflict of interest
to the Chairman of the Supervisory Board and
to the other members of the Management Board
and provide them with all relevant information.
Each member of the Supervisory Board is required
to immediately report any potential conflict of
interest to the Chairman of the Supervisory Board
and provide him or her with all relevant information.
The Chairman determines whether there is a conflict
of interest. If a member of the Supervisory Board
or a member of the Management Board has a
conflict of interest with the Company, the member
may not participate in the discussions and / or
decision-making process on subjects or transactions
relating to the conflict of interest. The Chairman of the
Supervisory Board will arrange for such transactions
to be disclosed in the Annual Report. No such
transaction occurred in 2014. In accordance with
best practice provision III.6.4 of the Dutch Corporate
Governance Code, Ahold reports that no transactions
between the Company and legal or natural persons
who hold at least 10% of the shares in the Company
occurred in 2014.
Ahold
Annual Report 2014
Shares and shareholders’ rights
General Meeting of Shareholders
Ahold shareholders exercise their rights through
annual and extraordinary General Meetings of
Shareholders. We are required to convene an
annual General Meeting of Shareholders in the
Netherlands each year, no later than six months
after the end of the Company’s financial year.
Additional extraordinary General Meetings of
Shareholders may be convened at any time by the
Supervisory Board, the Management Board, or
by one or more shareholders representing at least
10% of the issued share capital. The agenda for
the annual General Meeting of Shareholders must
contain certain matters as specified in Ahold’s Articles
of Association and under Dutch law, including
the adoption of our annual financial statements.
Shareholders are entitled to propose items for the
agenda of the General Meeting of Shareholders
provided that they hold at least 1% of the issued
share capital or the shares that they hold represent
a market value of at least €50 million. The adoption
of such a proposal requires a majority of votes
cast at the General Meeting of Shareholders
representing at least one-third of the issued shares.
If this qualified majority is not achieved but a
majority of the votes exercised was in favor of the
proposal, then a second meeting may be held. In the
second meeting, only a majority of votes exercised
is required to adopt the proposal, regardless of
the number of shares represented at the meeting
(unless the law or Articles of Association provide
otherwise). Proposals for agenda items for the
General Meeting of Shareholders must be submitted
at least 60 days prior to the date of the meeting.
The General Meeting of Shareholders is also entitled
to vote on important decisions regarding Ahold’s
identity or character, including major acquisitions
and divestments.
Dutch law prescribes a record date to be set 28
days prior to the date of the General Meeting of
Shareholders to determine whether a person may
attend and exercise the rights relating to the General
44
Meeting of Shareholders. Shareholders registered
at that date are entitled to attend and to exercise
their rights as shareholders in relation to the General
Meeting of Shareholders, regardless of a sale of
shares after the record date. Shareholders may be
represented by written proxy.
We encourage participation in Ahold’s General
Meetings of Shareholders. We use Deutsche Bank
Trust Company Americas, the Depositary for the
Company’s ADR facility, to enable ADR holders to
exercise their voting rights, which are represented by
the common shares underlying the ADRs.
Voting rights
Each common share entitles its holder to cast one
vote. Subject to certain exceptions provided by Dutch
law or our Articles of Association, resolutions are
passed by a majority of votes cast. A resolution to
amend the Articles of Association that would change
the rights vested in the holders of a particular class
of shares requires the prior approval of a meeting
of that particular class. A resolution to dissolve
the Company may be adopted by the General
Meeting of Shareholders following a proposal of the
Management Board made with the approval of the
Supervisory Board. Any proposed resolution to wind
up the Company must be disclosed in the notice
calling the General Meeting of Shareholders at which
that proposal is to be considered.
Neither Ahold nor any of its subsidiaries may cast
a vote on any share they hold in the Company.
These shares are not taken into account for the
purpose of determining how many shareholders
are represented or how much of the share capital is
represented at the General Meeting of Shareholders.
Holders of depositary receipts of cumulative
preferred financing shares may attend the General
Meeting of Shareholders. The voting rights on
the underlying shares may be exercised by the
Stichting Administratiekantoor Preferente Financierings
Aandelen Ahold (SAPFAA), a foundation organized
under the laws of the Netherlands.
Ahold at a glance
Business review
Governance
Financials
Investors
Corporate governance (continued)
Cumulative preferred financing shares
All outstanding cumulative preferred financing
shares have been issued to SAPFAA. Holders of
depositary receipts can obtain proxies from SAPFAA.
In accordance with its articles, the board of SAPFAA
consists of three members: one A member, one
B member and one C member. The A member is
appointed by the general meeting of depositary
receipt holders, the B member is appointed by the
Company and the C member is appointed by a
joint resolution of the A member and the B member.
As of February 25, 2015, the members of the board
of SAPFAA are:
Member A:
Member B:
Member C:
J.L. van der Giessen
C.W. de Monchy
H.J. Baeten, Chairman
Ahold pays a mandatory annual dividend on
cumulative preferred financing shares, which is
calculated in accordance with the provisions of
article 39.4 of the Company’s Articles of Association.
For further details on cumulative preferred financing
shares and the related voting rights, see Note 22 to
the consolidated financial statements.
Cumulative preferred shares
No cumulative preferred shares are currently
outstanding. We entered into an option agreement
with the Dutch foundation Stichting Ahold Continuïteit
(SAC) designed to exercise influence in the event of
a potential change of control over the Company.
The purpose of SAC, according to its articles of
association, is to safeguard the interests of the
Company and all its stakeholders and to resist, to the
best of its ability, influences that might conflict with
those interests by affecting the Company’s continuity,
independence or identity.
Ahold
Annual Report 2014
As of February 25, 2015, the members of the board
of SAC are:
Name
Principal or former occupation
W.G. van Hassel,
Chairman
Former lawyer and
former chairman
Dutch Bar Association
Former President and
CEO of ANWB
Former CFO Océ
CEO APM Terminals Europe
G.H.N.L. van Woerkom
J. van den Belt
B. Vree
SAC is independent from the Company. For details
on Ahold’s cumulative preferred shares, see Note 20
to the consolidated financial statements.
Issue of additional shares and preemptive rights
Shares may be issued following a resolution by the
General Meeting of Shareholders on a proposal of
the Management Board made with the approval
of the Supervisory Board. The General Meeting of
Shareholders may resolve to delegate this authority
to the Management Board for a period of time not
exceeding five years. A resolution of the General
Meeting of Shareholders to issue shares, or to
authorize the Management Board to do so, is also
subject to the approval of each class of shares whose
rights would be adversely affected by the proposed
issuance or delegation. The General Meeting of
Shareholders approved a delegation of this authority
to the Management Board, relating to the issuance
and / or granting of rights to acquire common shares
up to a maximum of 10% of the issued common
shares through October 16, 2015, and subject to
the approval of the Supervisory Board.
Upon the issuance of new common shares, holders
of Ahold’s common shares have a preemptive right
to subscribe to common shares in proportion to the
total amount of their existing holdings of Ahold’s
common shares. According to the Company’s Articles
of Association, this preemptive right does not apply
to any issuance of shares to Ahold associates.
The General Meeting of Shareholders may decide
to restrict or exclude preemptive rights. The General
Meeting of Shareholders may also resolve to
designate the Management Board as the corporate
body authorized to restrict or exclude preemptive
rights for a period not exceeding five years.
The General Meeting of Shareholders has delegated
to the Management Board, subject to the approval
of the Supervisory Board, the authority to restrict or
exclude the preemptive rights of holders of common
shares upon the issuance of common shares and / or
upon the granting of rights to subscribe for common
shares through October 16, 2015.
Repurchase by Ahold of its own shares
Ahold may only acquire fully paid shares of any
class in its capital for a consideration following
authorization by the General Meeting of Shareholders
and subject to certain provisions of Dutch law and
the Company’s Articles of Association, if:
1. Shareholders’ equity minus the payment required
to make the acquisition is not less than the sum
of paid-in and called-up capital and any reserves
required by Dutch law or Ahold’s Articles of
Association; and
2. Ahold and its subsidiaries would not, as a result,
hold a number of shares exceeding a total
nominal value of 10% of the issued share capital.
The Management Board has been authorized
to acquire a number of common shares in the
Company or depository receipts for shares, as
permitted within the limits of the law and the
Articles of Association and subject to the approval
of the Supervisory Board. Such acquisition of
shares, at the stock exchange or otherwise,
will take place at a price between par value
and 110% of the opening price of the shares
at Euronext Amsterdam by NYSE Euronext on
the date of their acquisition. The authorization
takes into account the possibility to cancel the
repurchased shares. This authorization is valid
through October 16, 2015. Ahold may acquire
shares in its capital for no consideration or for the
purpose of transferring these shares to associates
through share plans or option plans, without
such authorization.
45
Major shareholders
Ahold is not directly or indirectly owned or controlled
by another corporation or by any government.
The Company does not know of any arrangements
that may, at a subsequent date, result in a change
of control, except as described under “Cumulative
preferred shares” above.
Significant ownership of voting shares
According to the Dutch Financial Markets Supervision
Act, any person or legal entity who, directly or
indirectly, acquires or disposes of an interest in
Ahold’s capital or voting rights must immediately
give written notice to the Netherlands Authority for
the Financial Markets (Autoriteit Financiële Markten
or AFM) if the acquisition or disposal causes the
percentage of outstanding capital interest or voting
rights held by that person or legal entity to reach,
exceed or fall below any of the following thresholds:
3% 5% 10%15%20%
25%30%40%50%60%
75%95%
The obligation to notify the AFM also applies when
the percentage of capital interest or voting rights
referred to above changes as a result of a change
in Ahold’s total outstanding capital or voting rights.
In addition, local rules may apply to investors.
The following table lists the shareholders on record
in the AFM register on February 25, 2015, that hold
an interest of 3% or more in the share capital of the
Company. For details on the number of outstanding
shares, see Note 20 to the consolidated financial
statements. For details on capital structure, listings,
share performance and dividend policy in relation
to Ahold’s common shares, see Investors.
The following disclosures were on record in the AFM
register on February 25, 2015, of shareholders that
hold an interest of 3% or more in the share capital of
the Company1.
Ahold at a glance
Business review
Governance
Financials
Investors
Corporate governance (continued)
aa Silchester International Investors LLP – 2.99% shareholding (3.58% voting rights) disclosed on
January 21, 2015
aa Blackrock, Inc – 2.88% shareholding (4.35% voting rights) disclosed on September 5, 2014
aa Mondrian Investment Partners Limited – 4.26% shareholding (4.99% voting rights) disclosed on
September 27, 2012
aa ING Groep N.V. – 9.26% shareholding (4.92% voting rights) disclosed on April 8, 20082
aa DeltaFort Beleggingen I B.V. – 11.23% shareholding (3.82% voting rights) disclosed on August 23, 2007 2
aa Stichting Administratiekantoor Preferente Financieringsaandelen Ahold – 20.19% shareholding (6.55% voting
rights) disclosed on July 13, 20123
1 In accordance with the filing requirements, the percentages shown include both direct and indirect capital interests and
voting rights and both real and potential capital interests and voting rights. Further details can be found at www.afm.nl.
2 The interest on record for ING Groep N.V. and DeltaFort Beleggingen B.V. includes both the direct and real interest from
the common shares as well as the indirect and / or potential interest from the depository receipts.
3 SAPFAA holds all outstanding cumulative preferred financing shares and it issued corresponding depository receipts to
investors that were filed under ING Group N.V. and DeltaFort Beleggingen B.V. Therefore, in relation to the outstanding
cumulative preferred financing shares, disclosures are made by both SAPFAA (for the shares) and by ING Group N.V.
and DeltaFort Beleggingen B.V. (for the corresponding depository receipts).
Articles of Association
Our Articles of Association outline certain of the
Company’s basic principles relating to corporate
governance and organization. The current text
of the Articles of Association is available at the
Trade Register of the Chamber of Commerce and
Industry for Amsterdam and on our public website
at www.ahold.com.
The Articles of Association may be amended by the
General Meeting of Shareholders. A resolution to
amend the Articles of Association may be adopted
by an absolute majority of the votes cast upon a
proposal of the Management Board. If another party
makes the proposal, an absolute majority of votes
cast representing at least one-third of the issued share
capital, is required. If this qualified majority is not
achieved but a majority of the votes is in favor of the
proposal, then a second meeting may be held. In the
second meeting, only a majority of votes, regardless
of the number of shares represented at the meeting,
is required. The prior approval of a meeting of
holders of a particular class of shares is required for
a proposal to amend the Articles of Association that
makes any change in the rights that vest in the holders
of shares of that particular class.
Auditor
The General Meeting of Shareholders appoints the
external auditor. The Audit Committee recommends
to the Supervisory Board the external auditor to be
proposed for (re)appointment by the General Meeting
of Shareholders. In addition, the Audit Committee
evaluates and, where appropriate, recommends the
replacement of the external auditors. On April 16,
2014, the General Meeting of Shareholders appointed
PricewaterhouseCoopers Accountants N.V. as external
auditor for the Company for the financial year 2014.
Decree Article 10 EU Takeover Directive
According to the Decree Article 10 EU Takeover
Directive, we have to report on, among other things,
our capital structure, restrictions on voting rights and
the transfer of securities, significant shareholdings
in Ahold, the rules governing the appointment and
dismissal of members of the Management Board
and the Supervisory Board and the amendment
of the Articles of Association, the powers of the
Management Board (in particular the power to
issue shares or to repurchase shares), significant
agreements to which Ahold is a party and which are
put into effect, changed or dissolved upon a change
Ahold
Annual Report 2014
of control of Ahold following a takeover bid, and
any agreements between Ahold and the members
of the Management Board or associates providing
for compensation if their employment ceases because
of a takeover bid.
The information required by the Decree Article 10
EU Takeover Directive is included in this Corporate
governance section and under Investors, and the
notes referred to in these sections or included in the
description of any relevant contract.
Compliance with Dutch Corporate
Governance Code
We apply the relevant principles and best practices
of the Dutch Corporate Governance Code
applicable to the Company, to the Management
Board and to the Supervisory Board, in the manner
set out in the Governance section, as long as it
does not entail disclosure of commercially sensitive
information, as accepted under the code. The Dutch
Corporate Governance Code was last amended
on December 10, 2008, and can be found at
www.commissiecorporategovernance.nl.
Our shareholders consented to apply the
Dutch Corporate Governance Code during the
Extraordinary General Meeting of Shareholders
on March 3, 2004. Ahold continues to seek ways
to improve its corporate governance by measuring
itself against international best practice.
Following Jan Hommen’s appointment as CEO of
KPMG the Netherlands, the Supervisory Board
designated Rob van den Bergh as interim Chairman
of the Supervisory Board to temporarily replace Jan
Hommen as Chairman of the Supervisory Board
as of June 14, 2014. Given his experience, Rob
van den Bergh was the most obvious choice for the
position, although his designation was in deviation
from best practice III.5.11 of the Dutch Corporate
Governance Code. The Supervisory Board
endeavors to resolve this temporary non-compliance
with section III.5.11 of the Dutch Corporate
Governance Code shortly and with due care to the
interests of the Company.
46
Corporate Governance statement
The Dutch Corporate Governance Code requires
companies to publish a statement concerning their
approach to corporate governance and compliance
with the Code. This is referred to in article 2a of
the decree on additional requirements for annual
reports “Vaststellingsbesluit nadere voorschriften
inhoud jaarverslag” last amended on January 1,
2010 (the Decree). The information required to be
included in this corporate governance statement as
described in articles 3, 3a and 3b of the Decree,
which are incorporated and repeated here by
reference, can be found in the following sections
of this Annual Report:
aa The information concerning compliance with the
Dutch Corporate Governance Code (published
at www.commissiecorporategovernance.nl),
as required by article 3 of the Decree, can be
found in the section Compliance with the Dutch
Corporate Governance Code.
aa The information concerning Ahold’s risk
management and control frameworks relating
to the financial reporting process, as required by
article 3a sub a of the Decree, can be found in
the relevant section under How we manage risk.
aa The information regarding the functioning of
Ahold’s General Meeting of Shareholders and
the authority and rights of Ahold’s shareholders,
as required by article 3a sub b of the Decree,
can be found in the relevant sections under
Shares and shareholders’ rights.
aa The information regarding the composition and
functioning of Ahold’s Management Board
and the Company’s Supervisory Board and its
committees, as required by article 3a sub c of
the Decree, can be found in the relevant sections
under Corporate governance.
aa The information concerning the inclusion of the
information required by the Decree Article 10
EU Takeover Directive, as required by article
3b of the Decree, can be found in the section
Decree Article 10 EU Takeover Directive.
Governance
Financials
Investors
Supervisory Board report
Induction
Ongoing education is an important part of good governance. New members of our Supervisory Board attend a multiple-day induction program at our businesses
in the U.S. and the Netherlands and at Corporate Center in Zaandam at which they are briefed on their responsibilities and informed by senior management on the
financial, social, corporate responsibility, human resources, governance, legal and reporting affairs of our Company and businesses. Throughout the year, all members
of our Supervisory Board visit several of our businesses, operations and other parts of the Company to gain greater familiarity with senior management and to develop
deeper knowledge of local operations, opportunities and challenges.
The Rules of Procedure of the Supervisory Board
state that if a member is concurrently a member of
another company’s Supervisory Board, the main
duties arising from and / or the number and nature
of any other supervisory board memberships must
not conflict or interfere with that person’s duties as a
member of Ahold’s Supervisory Board. On April 16,
2014, the General Meeting of Shareholders
appointed René Hooft Graafland as a member of
the Supervisory Board with effect from January 1,
2015, and reappointed Judith Sprieser for a third
term. On April 15, 2015, Rob van den Bergh will
be nominated for reappointment.
•
•
•
•
•
•
•
•
•
•
•
•
•
•
•
•
•
•
•
•
•
•
•
•
Gender
•
•
•
•
Disclosure /
communication
•
•
•
CR
•
•
•
•
•
•
•
•
Social /
employment
•
•
•
Finance
Date of birth
April 10, 1950
August 3, 1953
January 7, 1948
April 29, 1943
October 9, 1949
August 10, 1946
July 4, 1958
September 24, 1955
Food
industry
Name
Rob van den Bergh
Judith Sprieser
Stephanie Shern
Jan Hommen
Derk Doijer
Mark McGrath
Ben Noteboom
René Hooft Graafland
Retail
Ahold’s Supervisory Board determines the
number of its members. The Supervisory Board
profile is published on Ahold’s public website at
www.ahold.com. The composition of the Supervisory
Board should match this profile in terms of combined
experience and expertise, independence, and variety
of ages and genders. The Supervisory Board is of the
opinion that its composition is currently in accordance
with the profile. The Supervisory Board profile is
updated regularly.
International
experience
Composition of the Supervisory Board
Netherlands
Diversity profile Supervisory Board
American
The Supervisory Board is an independent
corporate body responsible for supervising and
advising our Management Board and overseeing
the general course of affairs and strategy of the
Company. The Supervisory Board is guided in
its duties by the interests of the Company and the
enterprise connected with the Company, taking into
consideration the overall good of the enterprise and
the relevant interests of all its stakeholders.
47
Ahold
Annual Report 2014
Management
experience
Business review
Marketing
Ahold at a glance
•
•
•
•
•
•
•
•
M
F
F
M
M
M
M
M
Retirement and reappointment schedule
Name
Rob van den Bergh
Judith Sprieser
Stephanie Shern
Jan Hommen
Derk Doijer
Mark McGrath
Ben Noteboom
René Hooft Graafland (effective January 1, 2015)
Date of initial appointment
April 20, 2011
May 18, 2006
May 18, 2005
April 17, 2013
May 18, 2005
April 23, 2008
April 28, 2009
April 16, 2014
*Judith Sprieser will step down from the Supervisory Board following our 2015 annual General Meeting of Shareholders.
**Jan Hommen will not be available for reappointment in 2017.
Date of reappointment
April 16, 2014
April 17, 2013
April 17, 2013
April 17, 2012
April 17, 2013
Date of possible reappointment
2015
2018*
—
2017**
—
2016
2017
2018
Ahold at a glance
Business review
Governance
Financials
Investors
Supervisory Board report (continued)
Meetings and activities of the
Supervisory Board
In 2014, the Supervisory Board held six meetings
in person and four meetings by conference call.
The Chief Executive Officer, Chief Financial Officer
and Chief Corporate Governance Counsel attended
the meetings. The other members of the Executive
Committee as well as other senior corporate,
continental and local management were regularly
invited to be present. The Supervisory Board held
several private meetings without other attendees to
independently review certain issues and to discuss
matters related to the functioning of the Management
and Supervisory Boards. The external auditor at the
time attended the meeting on February 25, 2014,
at which the 2013 Annual Report and financial
statements were recommended for adoption by
the annual General Meeting of Shareholders.
The Supervisory Board assessed its own performance
over 2014, that of its committees and its individual
members, as well as the performance of the
Management Board and its individual members
through a survey, followed by one-on-one meetings
with the Chairman and a private meeting (partly)
attended by the CEO. The Supervisory Board
was positive, overall, about its own performance
as well as the performance of its committees and
the Management Board. As part of the outcome
of the assessment, the Supervisory Board will
closely monitor the succession planning of both the
Supervisory Board and the Executive Committee.
The members of the Supervisory Board have regular
contact with the members of the Management
Board and other Company management outside
of the scheduled meetings of the Supervisory
Board. These informal consultations ensure that the
Supervisory Board remains well-informed about the
running of the Company’s operations.
During 2014, the Supervisory Board reviewed
matters related to all significant aspects of Ahold’s
activities, results, strategies and management.
During its meetings throughout the year, the
Supervisory Board reviewed reports from its various
committees and regularly assessed the functioning of
the Management Board, the organizational strategy,
talent management and succession planning.
aa In January 2014, the Supervisory Board
held two conference calls: one to discuss the
FY / Q4 2013 Trading Statement and the
organizational changes in Ahold’s European
business and one to discuss and approve an offer
to acquire SPAR’s business in Czech Republic.
aa In February 2014, the Supervisory Board met to
discuss the FY / Q4 2013 results and the 2013
Annual Report and financial statements, including
related reports from the internal and external
auditors and a report from the Management
Board on the Company’s internal control
system. The Supervisory Board supported the
dividend proposal and approved the agenda
and explanatory notes for the annual General
Meeting of Shareholders in April 2014, including
the proposal to appoint René Hooft Graafland
as member of the Supervisory Board and the
proposal for the nomination of the external
auditor. The Supervisory Board established the
annual compensation of the Management Board
members in accordance with the Company’s
remuneration policy and with the assistance of the
Remuneration Committee.
aa Also in February 2014, the Supervisory Board
appointed Judith Sprieser as Vice Chairman
of the Supervisory Board and adopted the
Rules of Procedure of the Supervisory Board
as a replacement for the former charters of the
Supervisory Board and its committees. The Board
also reviewed Ahold’s responsible retailing
initiatives and approved its 2013 Responsible
Retailing Report. Furthermore, the Supervisory
Board received updates on the U.S., Netherlands,
and Czech businesses, the functioning of
Ahold
Annual Report 2014
IT systems, the enterprise risk management of the
Group and major legal proceedings with potential
impact on Ahold.
aa The successive 2014 quarterly results and related
reports and updates were discussed in May,
August and November 2014, respectively.
Prior to
the annual General Meeting of Shareholders on
April 16, 2014, the Supervisory Board met to
review updates on the Dutch and U.S.businesses
and, in particular, Albert Heijn’s strategic initiatives.
aa In May, the Supervisory Board held a conference
call to further discuss the intended settlement in the
Waterbury class action in the U.S.
aa Also in May, the Supervisory Board appointed
Rob van den Bergh as interim Chairman of the
Supervisory Board effective June 14, 2014,
temporarily replacing Jan Hommen, in view of his
appointment as CEO of KPMG the Netherlands.
48
aa In July, the Supervisory Board met in the U.S.
to visit the Ahold USA divisions and to review the
Company’s strategy as part of the annual strategic
planning cycle, including specific reviews of
several strategic initiatives.
aa The Supervisory Board visited Ahold’s Czech
business during its meeting in August 2014.
aa The Supervisory Board members attended the
Company’s leadership development program in
the U.S. in October 2014 and held a meeting
at which they reviewed strategic initiatives and
market developments in Ahold’s businesses
in the U.S. and the Netherlands, including its
online businesses.
aa The Supervisory Board also reviewed and
approved the Company’s long-term business and
finance plans.
aa In November 2014, the Supervisory Board met to
discuss and approve the annual budget for 2015
and to review annual updates on responsible
retailing and product integrity.
Attendance, independence
Except on three occasions, and for valid reasons, all Supervisory Board members attended all Supervisory
Board meetings in 2014. All Supervisory Board members made adequate time available to give sufficient
attention to matters concerning Ahold. The Supervisory Board confirms that as of February 25, 2015, all
Supervisory Board members are independent within the meaning of provision III.2.2 of the Dutch Corporate
Governance Code.
Board Attendance
Rob van den Bergh
Judith Sprieser
Stephanie Shern
Jan Hommen
Derk Doijer
Mark McGrath
Ben Noteboom
Number of
meetings held
Number of
meetings attended
6
6
6
6
6
6
6
6
5
5
6
6
6
5
Ahold at a glance
Business review
Governance
Financials
Investors
Supervisory Board report (continued)
Ahold
Annual Report 2014
Remuneration
The annual remuneration of the members of the Supervisory Board was determined by the General Meeting
of Shareholders on April 16, 2014. Remuneration is subject to an annual review by the Supervisory Board.
Chairman Supervisory Board
Vice Chairman Supervisory Board
Member Supervisory Board
Chairman Audit Committee
Member Audit Committee
Chairman Remuneration Committee
Member Remuneration Committee
Chairman Selection and Appointment Committee
Member Selection and Appointment Committee
Travel compensation intercontinental
Travel compensation continental
€95,000
€75,000
€65,000
€17,500
€12,000
€12,000
€9,000
€12,000
€9,000
€7,500
€2,500
Travel compensation per round trip air travel.
Committees of the Supervisory Board
The Supervisory Board has three permanent committees to which certain tasks are assigned. The committees
provide the Supervisory Board with regular updates on their meetings. The Chairman of the Supervisory Board
attends all committee meetings. The composition of each committee is detailed in the following table.
Rob van den Bergh, Chairman
Judith Sprieser, Vice Chairman
Stephanie Shern
Jan Hommen
Derk Doijer
Mark McGrath
Ben Noteboom
René Hooft Graafland
Audit
Committee
Remuneration
Committee
Selection and
Appointment Committee
Member
Member
Chairman
Chairman
Member
Member
Member
Member
Member
Member
Chairman
Member
Member
Member
Member
Audit Committee
The Audit Committee assists the Supervisory Board
in its responsibility to oversee Ahold’s financing,
financial statements, financial reporting process
and system of internal business controls and risk
management. The Chief Executive Officer, Chief
Financial Officer, Chief Corporate Governance
Counsel, Senior Vice President Internal Audit, Senior
Vice President Accounting, Reporting, Risks & Controls
and representatives of the external auditor are invited
to and also attend the Audit Committee meetings.
Other members of senior staff are invited when the
Audit Committee deems it necessary or appropriate.
The Audit Committee determines how the external
auditor should be involved in the content and
publication of financial reports other than the financial
statements. The Management Board and the Audit
Committee report to the Supervisory Board annually
on their dealings with the external auditor, including
the auditor’s independence. The Supervisory Board
takes these reports into account when deciding on
the nomination for the appointment of an external
auditor that is submitted to the General Meeting
of Shareholders.
In 2014, the Audit Committee held six meetings
in person and one conference call to review the
publication of quarterly results.
Throughout the year, the Audit Committee
closely monitored the financial closing process.
Updates on internal controls were provided
during all Audit Committee meetings. The Audit
Committee was informed regularly on compliance
and reviewed and received regular updates on
Ahold’s whistleblower program.
The Audit Committee was closely involved in the
evaluation of Ahold’s external auditor, in accordance
with provision V.2.3 of the Dutch Corporate
Governance Code.
49
The Audit Committee further discussed items including:
aa Quarterly interim reports
aa 2013 Annual Report including the
financial statements
aa Review and approval of the internal audit plan
aa Review of and discussions on the findings in the
internal audit letter and the management letter
of the external auditor
aa Ahold’s finance structure
aa Treasury
aa Tax
aa Pensions
aa Guarantees
aa Insurance
aa Appointment of the external auditor
aa Code of Conduct
The Audit Committee and the Chairman of the Audit
Committee also held private individual meetings with
the Chief Financial Officer, Senior Vice President
Internal Audit and external auditor.
In a separate private meeting, the Audit Committee
carried out a self-evaluation on the basis of written
questionnaires, which provided the framework for
discussions on its own functioning as well as that of
its individual members. This review concluded that the
Audit Committee’s composition, its work processes,
the scope and depth of its activities, its interfaces with
the Management Board and the Supervisory Board,
and the personal contribution of each individual
committee member are satisfactory and adequately
serve the Company’s needs.
The Supervisory Board has determined that Stephanie
Shern, Judith Sprieser and René Hooft Graafland
are “Audit Committee Financial Experts” within the
meaning of the Dutch Corporate Governance Code.
Ahold at a glance
Business review
Governance
Financials
Investors
Supervisory Board report (continued)
Selection and Appointment Committee
In 2014, the Selection and Appointment Committee
held four meetings, all of which the Chief Executive
Officer was invited to attend. The Committee’s
main areas of focus were long-term succession
planning for the Supervisory Board and management
development. It was also involved in organizational
and management changes at Ahold Netherlands
and Ahold USA and discussed overall succession
and management development processes at
Ahold. During one of its meetings, the Selection
and Appointment Committee evaluated its own
functioning and concluded that its composition and
activities are satisfactory and adequately serve the
Company’s needs.
Remuneration Committee
The main responsibilities of the Remuneration
Committee include:
aa Preparing proposals for the Supervisory Board
on the remuneration policy for the Management
Board, to be adopted by the General Meeting
of Shareholders
aa Preparing proposals on the remuneration of
individual members of the Management Board
aa Advising on the level and structure of
compensation for senior personnel other than
members of the Management Board
In 2014, the Remuneration Committee held three
meetings, all of which the Chief Executive Officer
was invited to attend. For more information on the
remuneration policy, see Remuneration. During one
of its meetings, the Remuneration Committee
evaluated its own functioning and concluded that
its composition and activities are satisfactory and
adequately serve the Company’s needs.
Conclusion
The Supervisory Board is of the opinion that during
the year 2014, its composition, mix and depth of
available expertise; working processes; level and
frequency of engagement in all critical Company
activities; and access to all necessary and relevant
information and the Company’s management and
staff were satisfactory and enabled it to carry out
its duties towards all the Company’s stakeholders.
The Supervisory Board would like to thank Sander
van der Laan and Lodewijk Hijmans van den Bergh
for their highly valued contributions to the Company.
The Supervisory Board would like to thank Ahold’s
shareholders for the trust they have put in the
Company and its management. The Supervisory
Board also wishes to express its appreciation for the
continued dedication and efforts of the Management
Board and all Ahold’s associates.
Supervisory Board
Zaandam, the Netherlands
February 25, 2015
Ahold
Annual Report 2014
50
Ahold at a glance
Business review
Governance
Financials
Investors
How we manage risk
Having a structured and consistent
approach to managing risks and
uncertainties is key to being able to
fulfill our stakeholders’ expectations.
In order to meet our Reshaping Retail objectives,
Ahold needs to be agile and entrepreneurial to
respond quickly and effectively to rapid changes in
the retail landscape. Having a well-established and
embedded risk management approach benefits our
decision making processes to create and preserve
value. Managing risks and unpredictable conditions
in a timely way increases the likelihood that we
will achieve our business objectives, while ensuring
compliance with internal and external requirements.
Ahold strives for a culture of openness and
transparency in which identified risks are disclosed
proactively and unexpected events are reported as
soon as they occur. Risk management is an integral
part of responsible leadership.
Ahold
Annual Report 2014
Risk management and internal control
Enterprise risk management
Ahold’s enterprise risk management program is
designed to provide executive management with
an understanding of the Company’s key business
risks and associated risk management practices.
Within each business, management identifies the
principal risks to the achievement of important
business objectives and the actions needed to
mitigate these risks. Senior executives periodically
review these risks and the related mitigation practices.
The findings are aggregated into an enterprise
risk management report that is presented to the
Executive Committee and the Supervisory Board.
Executive management is required to review the
principal risks and risk management practices with
the Executive Committee as a regular part of the
business planning and performance cycle. In turn, the
Executive Committee provides complementary insights
into existing and emerging risks that are subsequently
included in the program. Ahold’s enterprise risk
management program influences the formation of
controls and procedures, the scope of internal audit
activities and the focus of the business planning and
performance process.
Risk appetite
Risk boundaries are set through our strategy, Code
of Conduct, bill of authority, budgets and policies.
Our risk appetite differs by objective category:
aa Strategic
In pursuing our strategic ambition to grow, Ahold
is prepared to take risks in a responsible way that
takes our stakeholders’ interests into account.
aa Operational
The core promise of our Company: “better every
day,” applies to the day-to-day running of our
businesses and describes our commitment to be a
better place to shop, a better place to work, and
a better neighbor. Risks related to our promises
should be in balance with the related rewards.
aa Financial
With respect to financial risks, Ahold has a
prudent financing strategy, including a balanced
combination of self-insurance and commercial
insurance coverage. The Company is committed to
maintaining an investment grade credit rating.
aa Compliance
At Ahold, an essential part of responsible retailing
is behaving according to our values. One of
Ahold’s values is “Doing what’s right,” which
means that the Company and all its employees
are responsible for acting with honesty, integrity,
and respect for others. We strive to comply with
applicable laws and regulations everywhere we
do business.
51
Control framework
We maintain the Ahold Business Control Framework
(ABC Framework), which incorporates risk
assessment, control activities and monitoring into
our business practices at entity-wide and functional
levels. The aim of the ABC Framework is to provide
reasonable assurance that risks to achieving important
objectives are identified and mitigated. The ABC
Framework is based on the recommendations of
the Committee of Sponsoring Organizations of the
Treadway Commission (COSO ERM).
We have developed uniform governance and
control standards in areas such as ethical conduct,
agreements, accounting policies and product
integrity. These and other policies and procedures
are incorporated into the ABC Framework as
mandatory guidelines for all of Ahold’s consolidated
entities. Local management is responsible for business
operations, including risk mitigation and compliance
with laws and regulations. Authority limits have
been established to ensure that all expenditures and
decisions are approved by the appropriate levels
of management.
Ahold at a glance
Business review
Governance
Financials
Investors
How we manage risk (continued)
Our key control requirements are documented in
Ahold Control Memoranda (ACMs). Compliance with
the ACMs is mandatory for all of Ahold’s fully-owned
entities. The ACMs cover controls relating to financial
reporting and various other business processes.
They include the requirement for management
to assess the operating effectiveness of all ACM
key controls.
Our Global Code of Conduct (the “Code”) focuses
on Ahold’s core value “Doing what’s right” and
establishes Group-wide principles and rules with
regard to employee conduct. It is intended to help
each employee understand and follow relevant
compliance and integrity rules and know when
and where to ask for advice or report a breach of
the Code. The principles of the Code apply to all
employees of Ahold and its operating companies.
Employees of defined grade levels have been trained
and acknowledge compliance with the Code on
an annual basis. The full Code is available in the
corporate governance section of Ahold’s public
website at www.ahold.com.
Monitoring and assurance
We use a comprehensive business planning
and performance review process to monitor the
Company’s performance. This process covers the
adoption of strategy, budgeting and the reporting
of current and projected results. We assess business
performance according to both financial and nonfinancial targets. In order to meet business needs and
the requirements of the Dutch Corporate Governance
Code, we have a Group-wide management
certification process in place, which requires that the
executive management team members at each of our
reporting entities send letters of representation to the
Chief Corporate Governance Counsel on a quarterly
basis. These letters confirm whether the reporting
Ahold
Annual Report 2014
52
entities are in compliance with Ahold’s global
Code of Conduct, policies on fraud prevention and
detection, accounting and internal control standards,
and disclosure requirements. Compliance with
Ahold’s responsible retailing standards is confirmed
through bi-annual letters of representation. Both our
Internal Control and Internal Audit functions help to
ensure that we maintain and improve the integrity and
effectiveness of our system of risk management and
internal control. Internal Audit undertakes regular riskbased, objective and critical audits. These functions
also monitor the effectiveness of corrective actions
undertaken by management, including significant
audit findings.
Declaration
Risk factors
Annual declaration on risk management and
control systems regarding financial reporting risks
Ahold supports the Dutch Corporate Governance
Code and makes the following declaration in
accordance with best practice provision II.1.5:
The principal risk factors that may impede the
achievement of Ahold’s objectives with respect to
strategy, operations, financial and compliance matters
are described in the following section. The enterprise
risk management system, the governance and control
standards incorporated within our ABC Framework,
and the monitoring systems described above are
the principal means by which we identify and
manage these risks. Management is not aware
of any important failings in these systems as of
year‑end 2014.
Governance, Risk management and
Assurance Committee
An ExCo sub-committee, the Governance,
Risk management and Assurance (GRA) Committee,
oversees governance, risk management and
assurance processes. The GRA Committee is chaired
by the Chief Corporate Governance Counsel and
(i) advises the Executive Committee on matters
concerning the GRA Framework, including an overall
GRA vision and strategy, (ii) oversees activities
to develop and maintain a fit-for-purpose GRA
Framework and (iii) engages with Ahold’s senior
management on important developments in the
context of GRA.
With respect to financial reporting, management
has assessed whether the risk management and
control systems provide reasonable assurance that
the 2014 financial statements do not contain any
material misstatements. This assessment was based
on the criteria set out in COSO: Internal Control –
Integrated Framework. It included tests of the design
and operating effectiveness of entity level controls,
transactional controls at significant locations, and
relevant general computer controls. Any control
weaknesses not fully remediated at year end were
evaluated. Based on this assessment, management
determined that the Company’s financial reporting
systems are adequately designed and operated
effectively in 2014 and provide reasonable
assurance that the financial statements are free of
material misstatement.
During 2014, the GRA Committee met three times.
In addition to Ahold’s Chief Corporate Governance
Counsel (Chairman), the Chief Financial Officer sits
on the GRA Committee, along with the heads of
Finance of our main businesses and other members
of management responsible for governance, risk
management, compliance and assurance functions.
The Management Board is responsible for
establishing and maintaining adequate internal risk
management and control systems. Such systems are
designed to manage rather than eliminate the risk
of failure to achieve important business objectives,
and can only provide reasonable and not absolute
assurance against material misstatement or loss.
The following overview of risks relating to Ahold
should be read carefully when evaluating the
Company’s business, its prospects and the forwardlooking statements contained in this Annual Report.
Any of the following risks could have a material
adverse effect on Ahold’s financial position, results
of operations and liquidity or could cause actual
results to differ materially from the results contemplated
in the forward-looking statements contained in this
Annual Report.
The risks described below are not the only risks the
Company faces. There may be additional risks that
we are currently unaware of or risks that management
believes are immaterial or otherwise common to
most companies, but which may in the future have a
material adverse effect on Ahold’s financial position,
results of operations, liquidity and the actual outcome
of matters referred to in the forward-looking statements
contained in this Annual Report. For additional
information regarding forward-looking statements,
see the Cautionary notice.
Ahold at a glance
Governance
Business review
Financials
Investors
How we manage risk (continued)
Ahold
Annual Report 2014
53
Ahold’s principal risks and uncertainties
Description of risk
Strategy
Key risk drivers
Risk mitigating actions
Potential consequence
Business continuity (O)
Better place to shop
– Dependency on IT systems
– Business continuity governance structure
– Dependency on supply chain
– Business continuity strategic guidelines and
tactical policy
While Ahold continues to maintain and invest in
business continuity management plans, business
interruptions could have a material adverse effect
on the Company’s financial position, results
of operations, liquidity, customer perception
and reputation.
Disruption of critical business processes may result
in non-availability of products for customers
– Centralized facilities
– Dependency on logistics service providers
– Business continuity framework with guidance,
procedures and document templates
– Dependency on suppliers of strategic
own-brand products and services
– Business continuity management plans
– Cyber threats
Collective bargaining (O)
Ahold‘s businesses might not be able to negotiate
extensions or replacements on acceptable terms,
which could result in work stoppages
Competitive advantage and economic
conditions (S)
A weak macro-economic climate and changes to
the competitive landscape without appropriate
response could threaten Ahold’s ability to achieve
its strategic business plan
Better place to work
– Insurance program
– Expiring collective bargaining agreements
– Contract negotiation process
– Relationships with the relevant trade unions
– Human Resource functions to support
relationships with trade unions
– Contingency plans
Business model
A work stoppage due to the failure of one or
more of Ahold’s businesses to renegotiate a
collective bargaining agreement, or otherwise,
could be disruptive to our business, lead to
adverse publicity and have a material adverse
effect on the Company’s results of operations and
financial position.
– Research and monitoring of consumer behavior Ahold is focused on the execution of its strategic
pillars and promises. Unforeseen effects could
– Price benchmarking competition
– Consumer confidence and unemployment
impair the effectiveness of Ahold’s strategy
and reduce the anticipated benefits of its
– Analysis of economic developments
– Consumers’ purchasing power under pressure
price repositioning and cost savings programs
– Promotional activities
– Changes in the retail landscape and
or other strategic initiatives. These factors
competition
may have a material adverse effect on the
– Building more personalized customer
Company’s financial position, results of operations
relationships
– Lack of distinctiveness
and liquidity.
– Inflationary forces impacting cost of goods sold – Strengthening own brands
For more information see Business review.
– Price perception
1 Risk objectives: strategic (S), operational (O), financial (F) and compliance (C) risks listed in alphabetical order.
Ahold at a glance
Governance
Business review
Financials
Investors
How we manage risk (continued)
Ahold
Annual Report 2014
54
Ahold’s principal risks and uncertainties
Description of risk
Strategy
Key risk drivers
Risk mitigating actions
Potential consequence
Information security (O)
Better place to shop
– Consumer confidence
– Strategic and tactical information security
policy and guidelines
Ahold’s business operations generate and
maintain confidential commercial and personal
information concerning customers, employees,
suppliers and the Company. Disclosure of
confidential information to unintended third
parties may negatively impact Ahold’s corporate
reputation and competitive position or result
in litigation or regulatory action. This could
have a material adverse effect on Ahold’s
financial position.
A lack of security around, or non-compliance
with, privacy requirements for customer data
might negatively impact strategic initiatives
relating to customer loyalty
– Sensitivity of data
– Changing privacy regulations
– Use of third parties to process and store data
– Global security threats
– Growth of online sales
– Information security governance
– Control standards for information management
and security
– Payment Card Industry (PCI) and privacy
compliant control framework
– Information security capabilities
– Information security awareness program
– Cyber insurance coverage
Legislative and regulatory environment (C)
A changing legislative and regulatory
environment increases the cost of doing business,
tax levels and the complexity of our operations
Simplicity
– Compliance deadlines
– Knowledge and awareness of regulations
– Increased and targeted enforcement
– Monitoring, review and reporting on changes
– Government budget deficits
– Operational procedures and guidance
– Public opinion / pressure
– International Tax Developments
(e.g. OECD and EU regulations)
Product safety (O, C)
The consumption of own-brand products or other
food or non-food products, or food fraud in the
supply chain could result in our customers’ injury,
illness or death
Responsible retailing
– Internationalization of the supply chain
– Product safety policies
– Incidents across the world
– Control standards for food and
non-food products
– Increased number of own-brand products
– Speed of communications (social media)
– Standard operating procedures
– Dedicated product integrity departments
at Group level and in the business
– Monitoring of performance in the business
– Third-party certification
1 Risk objectives: strategic (S), operational (O), financial (F) and compliance (C) risks listed in alphabetical order.
Ahold’s activities are subject to various laws
and regulations in each local market where it
operates. The cost of compliance with any of
these laws could impact Ahold’s operations and
reduce its profitability. See further discussion of
consequences of the legislative and regulatory
risks below.
Though it has mitigating actions in place,
Ahold may face product safety problems,
including disruptions to the supply chain caused
by food-borne illnesses and negative consumer
reaction to incidents, which may have a material
adverse effect on the Company’s reputation,
results of operations and financial position.
Ahold at a glance
Governance
Business review
Financials
Investors
How we manage risk (continued)
Ahold
Annual Report 2014
55
Ahold’s principal risks and uncertainties
Description of risk
Strategy
Key risk drivers
Risk mitigating actions
Potential consequence
Pension plan funding (F)
Business model
– Insolvency or bankruptcy of MEP participants
– Governance structure
– Decreasing interest rates
– Yearly MEP risk assessment study
– Poor stock market performance
– Monitoring MEPs / participants
A decrease in equity returns or interest rates may
negatively affect the funding ratios of Ahold’s
pension funds, which could lead to higher
pension charges and contributions payable.
According to Dutch law and / or contractually
agreed funding arrangements, Ahold may
be required to make additional contributions
to its pension plans in case minimum funding
requirements are not met. In addition, a significant
number of union employees in the United
States are covered by MEPs. An increase in the
unfunded liabilities of these MEPs may result in
increased future payments by Ahold and the
other participating employers. The bankruptcy
of a participating MEP employer could result in
Ahold assuming a larger proportion of that plan’s
funding requirements.
Ahold is exposed to the financial consequences
of a number of defined benefit pension plans
covering a large number of its employees in the
Netherlands and in the United States, as well
as multi-employer plans (MEP) covering both
pensions and other benefits
– Changing pension laws
– Longevity
– Increasing U.S. healthcare costs
In addition, Ahold may be required to pay
significantly higher amounts to fund U.S.
employee healthcare plans in the future.
Significant increases in healthcare and pension
funding requirements could have a material
adverse effect on the Company’s financial
position, results of operations and liquidity.
For additional information, see Note 23 to the
consolidated financial statements
Strategic projects (S)
Activities are increasingly undertaken in the form
of projects. Ahold might not be able to deliver
on the objectives of its strategic projects
Our promises
and pillars
– Changing retail environment
– Dependencies between projects and
operational activities
– Availability of required capabilities
– Ahold’s Executive Committee (ExCo)
governance structure
Ahold is continuing with its strategy to reshape
the way we do business and drive growth.
– Program and project management
If the Company is not able to deliver on the
objectives of its underlying strategic projects, the
realization of key elements of its strategy may be
at risk. This could have a material adverse effect
on Ahold’s financial position, results of operations
and liquidity.
– Promises reporting
– Embedding pillars and promises in
the business
1 Risk objectives: strategic (S), operational (O), financial (F) and compliance (C), risks listed in alphabetical order.
Ahold at a glance
Business review
Governance
Financials
Investors
How we manage risk (continued)
In addition to the principal risks and uncertainties
as linked to our strategy above, the Company has
risks in the following areas:
Responsible retailing (S, O)
Increased regulatory demands, stakeholder
awareness and the growing sentiment that large
retailers must address sustainability issues across
the entire supply chain mean that Ahold’s brands
and reputation may suffer if it does not adequately
address relevant corporate responsibility issues
affecting the food retail industry. Ahold has integrated
responsible retailing into its Reshaping Retail strategy
to ensure that responsible retailing is part of the
daily business. For more information see Ahold’s
Responsible Retailing Report 2014.
Insurance programs (F)
Ahold manages its insurable risks through a
combination of self-insurance and commercial
insurance coverage. Our U.S. operations are selfinsured for workers’ compensation, general liability,
vehicle accident and certain health care-related
claims. Self-insurance liabilities are estimated based
on actuarial valuations. While we believe that the
actuarial estimates are reasonable, they are subject
to changes caused by claim reporting patterns,
claim settlement patterns, regulatory economic
conditions and adverse litigation results. It is possible
that the final resolution of some claims may require
us to make significant expenditures in excess of our
existing reserves. In addition, third-party insurance
companies that provide the fronting insurance that
is part of our self-insurance programs require us
to provide certain collateral. We take measures
to assess and monitor the financial strength and
credit-worthiness of the commercial insurers from
which we purchase insurance. However, we remain
exposed to a degree of counterparty credit risk with
respect to such insurers. If conditions of economic
distress were to cause the liquidity or solvency of our
counterparties to deteriorate, we may not be able to
recover collateral funds or be indemnified from the
insurer in accordance with the terms and conditions
of our policies.
Other financial risks (F)
Other financial risks include foreign currency
translation risk, credit risk, interest rate risk, liquidity
risk and contingent liabilities to third parties relating
to lease guarantees.
For information relating to these financial risks,
see Note 30 and Note 34 to the consolidated
financial statements.
Unforeseen tax liabilities (C)
Because Ahold operates in a number of countries,
its income is subject to taxation in differing jurisdictions
and at differing tax rates. Significant judgment is
required in determining the consolidated income tax
position. We seek to organize our affairs in a taxefficient and balanced manner, taking into account
the applicable regulations of the jurisdictions in which
we operate. As a result of Ahold’s multi-jurisdictional
operations, it is exposed to a number of different tax
risks including, but not limited to, changes in tax laws
or interpretations of such tax laws. The tax authorities
in the jurisdictions where Ahold operates may audit
the Company’s tax returns and may disagree with the
positions taken in those returns. An adverse outcome
resulting from any settlement or future examination of
the Company’s tax returns may result in additional
tax liabilities and may adversely affect its effective
tax rate, which could have a material adverse effect
on Ahold’s financial position, results of operations
and liquidity. In addition, any examination by the
tax authorities could cause Ahold to incur significant
legal expenses and divert management’s attention
from the operation of its business.
Ahold
Annual Report 2014
Risks related to the legislative and
regulatory environment and litigation (C)
Ahold and its businesses are subject to various
federal, regional, state and local laws and
regulations in each country in which they operate,
relating to, among other areas: zoning; land use;
antitrust restrictions; work place safety; public health
including food and non-food safety; environmental
protection; alcoholic beverage, tobacco and
pharmaceutical sales; and information security.
Ahold and its businesses are also subject to a variety
of laws governing the relationship with employees,
including but not limited to minimum wage, overtime,
working conditions, health care, disabled access and
work permit requirements. The cost of compliance
with, or changes in, any of these laws could
impact the operations and reduce the profitability
of Ahold or its businesses and thus could affect
Ahold’s financial condition or results of operations.
Ahold and its businesses are also subject to a variety
of antitrust and similar laws and regulations in the
jurisdictions in which they operate, which may impact
or limit Ahold’s ability to realize certain acquisitions,
divestments, partnerships or mergers.
56
From time to time, Ahold and its businesses are
parties to legal and regulatory proceedings in a
number of countries, including the United States.
Based on the prevailing regulatory environment
or economic conditions in the markets in which
Ahold businesses operate, litigation may increase in
frequency and materiality. These legal and regulatory
proceedings may include matters involving personnel
and employment issues, personal injury, antitrust
claims, franchise claims and other contract claims
and matters. We estimate our exposure to these
legal proceedings and establish accruals for the
estimated liabilities where it is reasonably possible to
estimate and where the potential realization of a loss
contingency is more likely than not.
The assessment of exposures and ultimate outcomes
of legal and regulatory proceedings involves
uncertainties. Adverse outcomes of these legal
proceedings, or changes in our assessments of
proceedings, could potentially result in material
adverse effects on our financial results. For further
information, see Note 34 to the consolidated
financial statements.
Ahold at a glance
Business review
Governance
Financials
Investors
Remuneration
Ahold
Annual Report 2014
57
Ahold’s remuneration policy is prepared
in accordance with the Dutch Corporate
Governance Code and was adopted at
the General Meeting of Shareholders
on April 17, 2013.
Total Direct Compensation
Benchmark
Base salary
Three elements of remuneration – a base salary, an
annual cash incentive and a long-term equity-based
component – are collectively referred to as Total
Direct Compensation.
The level of the base salary of the members of the
ExCo is derived from the benchmarking of Total
Direct Compensation. Adjustment of the base salary
is at the discretion of the Supervisory Board.
Remuneration policy
Although an important component of the overall
remuneration package, the pension benefit is not
part of Total Direct Compensation. Further details on
Ahold’s pension benefit are outlined in the chapter
Pensions and other contract terms.
The competitiveness of the Management
Board remuneration is benchmarked annually.
The remuneration packages are benchmarked
against the same peer group used to benchmark the
performance of Ahold (see table below).
Ahold’s remuneration policy aims to attract, motivate
and retain the best-qualified workforce, in a costeffective way. The policy is reviewed annually.
The current policy, which was adjusted to be simpler
and more transparent than the previous policy, was
submitted and approved in the 2013 annual General
Meeting of Shareholders. It aligns with our Reshaping
Retail strategy and better supports the Company’s
pay-for-performance culture.
Further details on the Management Board members’
employment agreements, individual remuneration,
pension, shares, and other interests in Ahold are
outlined in Notes 31 and 32 to the consolidated
financial statements.
5.0
4.0
3.0
2.0
1.0
1
2
CFO
CCGC
(GRO)2
Costco
Kroger
Target
Safeway
Supervalu
Delhaize Group
Staples
The peer group reflects Ahold’s geographic
operating areas and the markets most relevant to
the recruitment and retention of top management.
In addition, AEX market practice in the Netherlands
is also taken into consideration. In addition to the
level of overall remuneration, Ahold evaluates the
composition of the Total Direct Compensation,
including the risk profile and the level of fixed (base
salary) and variable (annual and long-term incentives)
components, on an annual basis.
Total Direct Compensation
€ million
CEO
Wal-Mart Stores
Carrefour
Metro
Tesco
Global Reward Opportunity
ExCo Incentive Plan1
Base salary 2014
Bonuses represent at - target opportunity.
“GRO” represents the at - target value award.
COO
The target Total Direct Compensation level is typically
around the median of the peer group.
In anticipation of potential changes to the peer
group due to de-listing, mergers and / or other
extraordinary circumstances, the Supervisory Board
has defined a short list with substitutes. At the
Supervisory Board’s discretion, companies in the
main peer group can be replaced by companies
from the substitute list. In general, geographical
spread is leading so, if a U.S.-based peer drops out,
it is replaced by a U.S.-based company from the
substitute list. For benchmarking purposes, from 2015
onwards, Casino will be the substitute for Safeway in
the Ahold peer group. For relative TSR measurement,
this substitution comes into effect for all unvested and
to-be-granted GRO performance shares.
Base salary
€ million
1.0
0.8
0.6
0.4
0.2
CEO
Base salary 2012
Base salary 2013
Base salary 2014
CFO
CCGC
COO
Ahold at a glance
Governance
Business review
Financials
Investors
Remuneration (continued)
Ahold
Annual Report 2014
Annual cash Plan; ExCo Incentive Plan
The Management Board members participate in the
ExCo Incentive Plan (EIP). The EIP uses three equally
weighted financial measures: net sales growth
(30%), operating margin (30%) and operating cash
flow (30%) and one non-financial performance
measure (10%) that relates to Responsible Retailing as
described below.
The at - target payout of the EIP as a percentage of
base salary is 100%, contingent on full achievement
of the objectives, with a cap at 150% of the
base salary.
Actual EIP
€ million
Ahold does not disclose the actual targets per
performance measure, as this is considered
commercially sensitive information.
The EIP also includes a non-financial performance
measure in addition to the quantitative financial
performance measures. This non-financial measure
relates to our Responsible Retailing strategic
ambitions. Targets set under this non-financial
performance measure are qualitative. The score
under the non-financial component is linked to the
performance of the financial components. If the
financial multiplier is zero, the score on the nonfinancial component will also be zero (regardless of
the achieved score on the non-financial component),
resulting in no payout.
2014 EIP Performance measures
%
1.0
30%
Operating
0.8
margin
0.6
Global Reward Opportunity (GRO) is Ahold’s broadbased, long-term equity incentive program, offered to
approximately 5,000 associates globally. Under the
GRO program, shares are granted through a threeyear program. Participants in the GRO program
benefit when the value they have created is reflected
in the Company’s share price.
Under the GRO program, three types of shares are
granted: one type of conditional share and two types
of performance shares.
2014 Management Board GRO Grant Value
€ million
2.0
30%
Operating
cash flow
0.4
Equity-based program: Global Reward
Opportunity (GRO)
0.2
1.6
1.772
1.2
1.181
0.8
0.951
0.4
CEO
CFO
CCGC
COO
Actual EIP 2012
Actual EIP 2013
Actual EIP 20141
12014 EIP represents accrued bonuses to be paid in 2015
and subject to shareholder approval.
30%
Net sales
growth
10%
Responsible
retailing
CEO
CFO
0.786
CCGC
COO
The 2014 GRO grant value consists of a one-third conditional
grant value with an 89% multiplier plus the at - target RoC and
TSR performance grants.
58
Conditional shares are shares awarded with a
performance hurdle at grant and no performance
hurdle at vesting. Performance shares are awarded
with either a Return on Capital performance hurdle
at vesting or with a Total Shareholder Return hurdle
at vesting.
The at - target value of the shares to be granted is
divided by the average share price over the six-month
period preceding the grant date to calculate the
number of shares to be granted.
Scenario analyses are prepared regularly to estimate
possible future payout levels.
Ahold at a glance
Business review
Governance
Financials
Investors
Remuneration (continued)
Conditional share grant
The target value to be granted under the conditional share grant component for the Management Board is
50% of base salary. The actual value of the conditional share grant is subject to a performance condition at
grant. The performance condition is the EIP multiplier of the preceding year (with a range between 0% and a
maximum of 150%). The maximum conditional share grant value is 75% of base salary.
Timeline for 2014 conditional GRO grant
Performance period for EIP
April grant
2013
2014
59
Ahold
Annual Report 2014
April vesting
2015
2016
2017
Performance share grant
The target value to be granted under the performance share grant is different for each Management Board
position to align this component with market practice. For the CEO and the U.S.-based COO, the target
grant value is 135% of base salary and for the CFO and the CCGC the grant value is 100% of base salary.
The vesting of the performance shares is subject to a performance hurdle at vesting after a performance period
of three years.
Half of the performance share grant is linked to a three-year return on capital target. The number of shares that
eventually vest depends on RoC performance and can range between 0% and a maximum of 150% of the
number of shares granted.
For the other half of the performance grant, the performance at vesting is measured using relative total
shareholders return (TSR). Relative TSR measures share price growth plus dividends paid over the performance
period benchmarked against the TSR performance of Ahold’s peer group (see table under Benchmarking).
The number of shares that will vest depends on Ahold’s relative ranking in the peer group. An independent
external advisor determines the ranking. The table below indicates the percentage of performance shares that
will vest based on Ahold’s ranking. No shares will vest to Management Board members if Ahold ranks below
the sixth position.
2013-2014 GRO program rank
Percentage of performance
shares vesting
1
2
3
4
5
6
7
8
9
10
11
12
175% 150% 125% 100% 75% 50%
0%
0%
0%
0%
0%
0%
Ahold at a glance
Governance
Business review
Financials
Investors
Remuneration (continued)
Ahold
Annual Report 2014
At - target grant and maximum vesting (conditional and performance shares)
The at - target grant and maximum vesting (conditional and performance shares) per Management Board
member can be summarized as follows:
At - target grant
conditional
shares
At - target grant performance shares
RoC
Total
at - target grant
conditional and
TSR
performance
Maximum
vesting
conditional
shares
Maximum
vesting
performance
shares
Total
maximum
vesting
CEO
CFO
50%
50%
67.5%
50.0%
67.5%
50.0%
185%
150%
75%
75%
219.37%
162.50%
294.37%
237.50%
CCGC
COO
50%
50%
50.0%
67.5%
50.0%
67.5%
150%
185%
75%
75%
162.50%
219.37%
237.50%
294.37%
All percentages constitute a percentage of base salary.
2014 GRO share grant calculation
CEO example1
Grant conditional shares
Grant performance shares (RoC)
Grant performance shares (TSR)
Totals
At - target
share grant
(% of base salary)
Multiplier
(conditional
shares only)
50.0%
67.5%
67.5%
185.0%
89%
NA
NA
Grant value
(base salary x
at - target grant x
multiplier)
Number of shares
granted (award
value divided by
six-month average)
€439,299
€666,352
€666,352
€1,772,002
32,860
49,844
49,844
132,548
1 Base salary €987,188
Six-month average share price preceding the date of grant of €13.37
Annual incentive multiplier for the preceding year of 0.89
CFO example2
At - target
share grant
(% of base salary)
Multiplier
(conditional
shares only)
Grant value
(base salary x
at - target grant x
multiplier)
Number of shares
granted (award
value divided by
six-month average)
Grant conditional shares
Grant performance shares (RoC)
50%
50%
89%
NA
€292,866
€329,063
21,907
24,614
Grant performance shares (TSR)
Totals
50%
150%
NA
€329,063
€950,991
24,614
71,135
2Base salary €658,125
Six-month average share price preceding the date of grant of €13.37
Annual incentive multiplier for the preceding year of 0.89
History of grant vesting
Analysis shows that the GRO program rewards “pay
for performance,” as the value of the grants increased
in the case of an above-target performance and
decreased in the case of a below-par performance.
Before 2013, the EIP multiplier was applied over
the total GRO grant. A low EIP multiplier resulted
in a lower GRO grant, a higher multiplier resulted
in a higher GRO grant. The EIP multiplier had an
amplifying effect on the total GRO grant.
Under the new program, introduced in 2013, the EIP
multiplier is only applied over the conditional shares;
the performance shares are granted at target. As a
result, the amplifying effect of the EIP multiplier has
been reduced.
60
Share holding requirements and ownership guidelines
Management Board members must retain the shares
awarded under the GRO program for a period of
at least five years from the grant date. A portion
of the shares is allowed to be sold to finance tax
payable at the date of vesting. All members of the
Management Board are required to hold shares in
the Company with a value equal to 150% of their
base salary before they are allowed to sell shares
(other than for paying for taxes due). The holding
may be built up by retaining all after-tax shares
from the GRO program and does not require
additional purchases. The year-end shareholdings
of the Management Board are summarized in the
paragraph Shares and other interests in Ahold in
Note 31.
Claw-back
A claw-back clause is applicable to the
Management Board members’ annual cash incentive
plan and GRO program.
Ahold at a glance
Business review
Governance
Financials
Investors
Remuneration (continued)
Pension and other contract terms
Pension
The pension plan for Management Board members
is identical to that of all other Ahold associates in
the Netherlands and is referred to as a defined
benefit plan, based on career average salary (at
Ahold). From January 1, 2015 onwards, the normal
retirement age is 67 (previously 65). Under this plan,
each Management Board member pays a pension
premium contribution of approximately 4.2% (2014)
of his or her pension-bearing salary. The pension
accrual for future benefits has been lowered from
2.25% to 2% as of January 1, 2014; contributions
from participants will be gradually increased and the
income offset component will be gradually lowered.
The employer contribution and the conditional
additional funding rules remained the same.
As of January 1, 2015, the pensionable salary has
been capped at €96,500 and the income offset
component has been lowered again. For salaries
over €96,500, a new arrangement will be
implemented, which is currently under discussion.
Ahold
Annual Report 2014
Loans
Ahold does not provide loans or advances to
members of the Management Board or the
Supervisory Board. There are no loans or advances
outstanding. Ahold does not issue guarantees to the
benefit of members of the Management Board or
the Supervisory Board. There have been no such
guarantees issued.
Additional arrangements
In addition to the remuneration of the Management
Board members, a number of additional
arrangements apply. These include expense
allowances, medical insurance and accident
insurance, and are in line with standard practice in
the Netherlands.
Employment agreements
The term of appointment for all Management
Board members is four years, while the term of
employment is indefinite. If the Company terminates
the employment agreement of any member of the
Management Board, the severance payment is
limited to one year’s base salary. The same applies if
an initial employment agreement for four years is not
continued because the Management Board member
is not reappointed. The employment agreements
may be terminated by Ahold with a notice period of
12 months and by the Management Board member
with a notice period of six months.
Future outlook
For 2015, no adjustments to the remuneration policy
are expected.
Vesting of shares under the GRO plan
On April 16, 2015, a maximum of 0.2 million
conditional shares granted in 2012 to members of the
Management Board under the mid-term component
of the GRO plan and 0.1 million performance shares
granted in 2010 to members of the Management
Board under the long-term component of the GRO
plan are expected to vest with continuing and retired
Board members who received the grants. Except to
finance tax due on the vesting date, members of the
Management Board cannot sell shares for a period
of at least five years following the grant date, or until
the end of their employment, if this period is shorter.
On February 27, 2015, a maximum of 2.6 million
conditional shares granted in 2012 to Ahold
associates under the mid-term component of the
Global Reward Opportunity (GRO) equity-based
long-term incentive plan, 1.2 million performance
shares granted in 2010 to Ahold associates under
the long-term component of the GRO plan, and
40,000 matching shares granted in 2010 to Ahold
associates under the mid-term component of the
GRO plan are expected to vest. Vesting is subject
to the participant being employed by the Company
on the applicable vesting date. On the vesting date,
participants are allowed to sell all or part of the
shares vested.
The Company will use treasury shares for delivery of
the vested shares.
61
Ahold at a glance
Business review
Governance
Financials
Investors
Declarations
Ahold
Annual Report 2014
Introduction
Declarations
This 2014 Ahold Annual Report dated February 25,
2015, (the Annual Report) comprises regulated
information within the meaning of sections 1:1 and
5:25c of the Dutch Act on Financial Supervision
“Wet op het financieel toezicht.”
The members of the Management Board as required
by section 5:25c, paragraph 2, under c of the
Dutch Act on Financial Supervision confirm that
to the best of their knowledge:
For the consolidated and the parent company’s 2014
financial statements “jaarrekening” within the meaning
of section 2:361 of the Dutch Civil Code, please
refer to Financials. The members of the Management
Board and the Supervisory Board have signed the
2014 financial statements pursuant to their obligation
under section 2:101, paragraph 2 of the Dutch Civil
Code. The following sections of this Annual Report
together form the management report “jaarverslag”
within the meaning of section 2:391 of the Dutch
Civil Code: Ahold at a glance, Our strategy, Our
performance, How we manage risk, Our leadership,
Corporate governance, Remuneration and the
subsection Remuneration included in the Supervisory
Board report.
For other information “overige gegevens” within the
meaning of section 2:392 of the Dutch Civil Code,
please refer to subsection Other information under
Financials, and to the section Investors.
aa The 2014 financial statements included in this
Annual Report give a true and fair view of the
assets, liabilities, financial position and profit
or loss of the Company and the undertakings
included in the consolidation taken as a whole.
aa The management report included in this Annual
Report gives a true and fair view of the position
of the Company and the undertakings included
in the consolidation taken as a whole as of
December 28, 2014, and of the development
and performance of the business for the financial
year then ended.
aa The management report includes a description
of the principal risks and uncertainties that the
Company faces.
Management Board
Supervisory Board
Dick Boer
Rob van den Bergh (Chairman)
Judith Sprieser (Vice Chairman)
Stephanie Shern
Jan Hommen
Derk Doijer
Mark McGrath
Ben Noteboom
Jeff Carr
Lodewijk Hijmans
van den Bergh
James McCann
President and
Chief Executive Officer
Executive Vice President and
Chief Financial Officer
Executive Vice President and
Chief Corporate Governance
Counsel
Executive Vice President and
Chief Operating Officer,
Ahold USA
This Annual Report, including the 2014
financial statements, which are audited by
PricewaterhouseCoopers Accountants N.V., has
been presented to the Supervisory Board. The 2014
financial statements and the independent auditor’s
report relating to the audit of the 2014 financial
statements were discussed with the Audit Committee
in the presence of the Management Board and the
external auditor. The Supervisory Board recommends
that the General Meeting of Shareholders adopts
the 2014 financial statements included in this Annual
Report and recommends the proposal to pay a cash
dividend for the financial year 2014 of €0.48 per
common share.
62
Ahold at a glance
Financials
Business review
Governance
Financials
Investors
Ahold
Annual Report 2014
63
Financials
Financial statements
64
Consolidated income statement
65
Consolidated statement of
comprehensive income
66
Consolidated balance sheet
67
Consolidated statement
of changes in equity
68
Consolidated statement
of cash flows
69
Notes to the consolidated
financial statements
70
Parent company
financial statements
142
Notes to the parent company
financial statements
144
Other information
152
Ahold at a glance
Business review
Governance
Financials
Investors
Ahold
Annual Report 2014
Consolidated income statement
Consolidated statement of comprehensive income
Consolidated balance sheet
Consolidated statement of changes in equity
Consolidated statement of cash flows
Notes to the consolidated financial statements
  1 The Company and its operations
  2 Basis of preparation
  3 Significant accounting policies
  4 Acquisitions
  5 Assets and liabilities held for sale and discontinued operations
  6 Segment reporting
  7 Net sales
  8 Expenses by nature
  9 Net financial expenses
10 Income taxes
11 Property, plant and equipment
12 Investment property
13 Intangible assets
14 Investments in joint ventures and associates
15 Other non-current financial assets
16 Inventories
17 Receivables
18 Other current financial assets
19 Cash and cash equivalents
20 Equity attributable to common shareholders
21 Loans and credit facilities
22 Other non-current financial liabilities
23 Pensions and other post-employment benefits
24 Provisions
25 Other non-current liabilities
26 Other current financial liabilities
27 Other current liabilities
28 Cash flow
29 Earnings per share
30 Financial risk management and financial instruments
31 Related party transactions
32 Share-based compensation
33 Operating leases
34 Commitments and contingencies
35 Subsequent events
36 List of subsidiaries, joint ventures and associates
Parent company financial statements
Income statement
Balance sheet
Notes to the parent company financial statements
  1 Significant accounting policies
  2 Employees
  3 Auditor fees
  4 Intangible assets
  5 Financial assets
  6 Receivables
  7 Other current financial assets
  8 Shareholders’ equity
  9 Provisions
10 Loans
11 Other non-current liabilities
12 Current liabilities
13 Derivatives
14 Related party transactions
15 Commitments and contingencies
64
Ahold at a glance
Business review
Governance
Financials
Investors
Consolidated income statement
€ million, except per share data
Net sales
Cost of sales
Gross profit
Selling expenses
General and administrative expenses
Total operating expenses
Ahold
Annual Report 2014
Note
32,615
(23,933)
8,682
(6,424)
(1,012)
(7,436)
(6,293)
(1,150)
(7,443)
1,250
1,239
6
(212)
(16)
(13)
(235)
7
(225)
(24)
(49)
(291)
1,015
948
10
14
(248)
24
791
(153)
10
805
5
(197)
594
1,732
2,537
0.68
0.67
2.48
2.39
0.90
0.88
0.79
0.77
879
924
1,021
1,072
8
23
9
Income before income taxes
Income taxes
Share in income of joint ventures
Income from continuing operations
Income (loss) from discontinued operations
Net income attributable to common shareholders
Earnings per share
Net income per share attributable to common shareholders
Basic
Diluted
Income from continuing operations per share attributable to common shareholders
Basic
Diluted
Weighted average number of common shares outstanding (in millions)
Basic
Diluted
The accompanying notes are an integral part of these consolidated financial statements.
2013
32,774
(24,088)
8,686
7
8
Operating income
Interest income
Interest expense
Net interest expense on defined benefit pension plans
Other financial expenses
Net financial expenses
2014
65
29
Ahold at a glance
Business review
Governance
Financials
Investors
Consolidated statement of comprehensive income
Ahold
Annual Report 2014
66
2014
2013
594
2,537
(25)
21
(4)
230
(83)
147
5
10
389
—
—
—
(149)
30
(82)
1
10
(76)
9
16
(10)
70
(15)
—
338
9
(146)
Total other comprehensive income
334
1
Comprehensive income attributable to common shareholders
928
2,538
Attributable to:
Continuing operations
Discontinued operations
Comprehensive income attributable to common shareholders
1,125
(197)
928
849
1,689
2,538
€ million
Note
Net income attributable to common shareholders
Remeasurements of defined benefit pension plans
Remeasurements before taxes – income (loss)
Income taxes
Other comprehensive income (loss) that will not be reclassified to profit or loss
Currency translation differences in foreign interests:
Currency translation differences before taxes from:
Continuing operations
Discontinued operations
Cumulative translation differences from divestments transferred to net income
Income taxes
Cash flow hedges:
Fair value result in the year
Transfers to net income
Income taxes
Other comprehensive income of joint ventures – net of income taxes:
Other comprehensive loss transferred to net income
Other comprehensive income (loss) reclassifiable to profit or loss
The accompanying notes are an integral part of these consolidated financial statements.
23
10
5
Ahold at a glance
Business review
Governance
Financials
Investors
Consolidated balance sheet
€ million
Assets
Property, plant and equipment
Investment property
Intangible assets
Investments in joint ventures and associates
Other non-current financial assets
Deferred tax assets
Other non-current assets
Total non-current assets
Assets held for sale
Inventories
Receivables
Other current financial assets
Income taxes receivable
Other current assets
Cash and cash equivalents
Total current assets
Total assets
Equity and liabilities
Equity attributable to common shareholders
Loans
Other non-current financial liabilities
Pensions and other post-employment benefits
Deferred tax liabilities
Provisions
Other non-current liabilities
Total non-current liabilities
Liabilities related to assets held for sale
Accounts payable
Other current financial liabilities
Income taxes payable
Provisions
Other current liabilities
Total current liabilities
Total equity and liabilities
The accompanying notes are an integral part of these consolidated financial statements.
Ahold
Annual Report 2014
Note
11
12
13
14
15
10
5
16
17
18
19
20
21
22
23
10
24
25
5
26
24
27
67
December 28,
2014
December 29,
2013
6,150
560
1,763
206
482
494
35
9,690
7
1,589
728
323
59
118
1,624
4,448
14,138
5,712
543
1,563
197
415
411
33
8,874
28
1,450
665
1,520
11
98
2,496
6,268
15,142
4,844
1,410
2,039
290
150
663
276
4,828
—
2,655
280
22
240
1,269
4,466
14,138
6,520
1,307
1,882
348
123
585
235
4,480
48
2,387
262
97
191
1,157
4,142
15,142
Ahold at a glance
Business review
Governance
Financials
Investors
Consolidated statement of changes in equity
€ million
Balance as of December 30, 2012
Net income
Other comprehensive income (loss)
Total comprehensive income (loss)
Dividends
Share buyback
Share-based payments
Balance as of December 29, 2013
Net income
Other comprehensive income (loss)
Total comprehensive income (loss)
Dividends
Capital repayment
Share buyback
Cancellation of treasury shares
Share-based payments
Balance as of December 28, 2014
1 Other reserves include the remeasurements of defined benefit plans.
The accompanying notes are an integral part of these consolidated financial statements.
Ahold
Annual Report 2014
Note
20
20
Share
capital
Additional
paid-in
capital
318
—
—
—
—
—
—
318
—
—
—
—
(308)
—
(1)
—
9
8,713
—
—
—
—
—
—
8,713
—
—
—
—
(809)
—
(1,060)
—
6,844
Currency
translation
reserve
(292)
—
(200)
(200)
—
—
—
(492)
—
389
389
—
—
—
—
—
(103)
Cash flow
hedging
reserve
(126)
—
45
45
—
—
—
(81)
—
(51)
(51)
—
—
—
—
—
(132)
Other reserves
including
accumulated
deficit1
(3,467)
2,537
156
2,693
(457)
(768)
61
(1,938)
594
(4)
590
(414)
109
(1,232)
1,061
50
(1,774)
68
Equity
attributable
to common
shareholders
5,146
2,537
1
2,538
(457)
(768)
61
6,520
594
334
928
(414)
(1,008)
(1,232)
—
50
4,844
Ahold at a glance
Business review
Governance
Financials
Investors
Consolidated statement of cash flows
€ million
Operating income
Adjustments for:
Depreciation, amortization, write-downs and impairments
Gains on the sale of assets / disposal groups held for sale
Share-based compensation expenses
Operating cash flows before changes in operating assets and liabilities
Changes in working capital:
Changes in inventories
Changes in receivables and other current assets
Changes in payables and other current liabilities
Changes in other non-current assets, other non-current liabilities and provisions
Cash generated from operations
Income taxes paid – net
Operating cash flows from continuing operations
Operating cash flows from discontinued operations
Net cash from operating activities
Purchase of non-current assets
Divestments of assets / disposal groups held for sale
Acquisition of businesses, net of cash acquired
Divestment of businesses, net of cash divested
Changes in short-term deposits and similar instruments
Dividends received from joint ventures
Interest received
Other
Investing cash flows from continuing operations
Investing cash flows from discontinued operations
Net cash from investing activities
Interest paid
Repayments of loans
Repayments of finance lease liabilities
Dividends paid on common shares
Share buyback
Capital repayment
Other cash flows from derivatives
Other
Financing cash flows from continuing operations
Financing cash flows from discontinued operations
Net cash from financing activities
Net cash from operating, investing and financing activities
The accompanying notes are an integral part of these consolidated financial statements.
Ahold
Annual Report 2014
Note
28
28
14
20
20
20
28
69
2014
2013
1,250
1,239
910
(20)
43
2,183
916
(28)
43
2,170
1
(33)
146
(135)
2,162
(269)
1,893
(17)
1,876
(732)
77
(190)
(291)
1,222
18
6
(1)
109
—
109
(207)
(24)
(80)
(414)
(1,232)
(1,008)
(20)
(3)
(2,988)
(2)
(2,990)
(1,005)
(13)
73
(21)
(42)
2,167
(116)
2,051
(16)
2,035
(811)
52
(9)
2,352
(1,472)
27
6
(1)
144
135
279
(216)
(21)
(73)
(457)
(768)
—
(19)
(75)
(1,629)
(4)
(1,633)
681
Ahold at a glance
Business review
Governance
Financials
Investors
Notes to the consolidated financial statements
Ahold
Annual Report 2014
1 The Company and its operations
The principal activity of Koninklijke Ahold N.V. (Ahold or the Company or Group or Ahold group), a public
limited liability company with its registered seat in Zaandam, the Netherlands, is the operation of retail stores
in Europe and the United States through subsidiaries and joint ventures. Ahold’s significant subsidiaries, joint
ventures and associates are listed in Note 36.
2 Basis of preparation
These financial statements have been prepared in accordance with International Financial Reporting Standards
(IFRSs) as adopted by the European Union (EU) and also comply with the financial reporting requirements
included in Part 9 of Book 2 of the Dutch Civil Code. As the financial data of Koninklijke Ahold N.V. (the
parent company) are included in the consolidated financial statements, the income statement in the parent
company financial statements is presented in condensed form (in accordance with section 402, Book 2 of the
Dutch Civil Code).
70
time. The Company must also estimate the amount of related product that has been sold and the amount that
remains in ending inventories and allocate the allowance to cost of sales or inventories accordingly.
Income taxes (Notes 3 and 10)
The ultimate tax effects of transactions may be uncertain for a considerable period of time, requiring
management to estimate the related current and deferred tax positions. The Company recognizes liabilities for
uncertain tax positions when it is more likely than not that additional tax will be due, Judgment is required in
determining whether deferred tax assets are realizable.
Intangible assets (Note 3)
Intangible assets acquired in a business acquisition are stated at fair value, as determined at the date of the
acquisition. To determine the fair value at the acquisition date, judgments and estimates are required.
Historical cost is used as the measurement basis unless otherwise indicated.
Leases and sale and leaseback transactions (Note 3)
The classification of leases as finance leases or operating leases requires judgments about the fair value of the
leased asset, the split of the fair value between land and buildings, the economic life of the asset, whether or
not to include renewal options in the lease term and the appropriate discount rate to calculate the present value
of the minimum lease payments.
Ahold’s financial year is a 52- or 53-week period ending on the Sunday nearest to December 31.
Financial year 2014 consisted of 52 weeks and ended on December 28, 2014. The comparative financial
year 2013 consisted of 52 weeks and ended on December 29, 2013.
Revenue recognition with respect to sale and leaseback transactions depends on whether the Company
transfers all risks and rewards to the buyer, does not maintain (or maintains only minor) continuing involvement
in the property other than the lease payments and whether the transaction is established at fair value.
These consolidated financial statements are presented in euros (€). The following exchange rates of the
euro against the U.S. dollar ($) and the Czech crown (CZK) have been used in the preparation of these
financial statements:
Impairments (Note 3)
Judgments and estimates are required, not only to determine whether there is an indication that an asset may
be impaired, but also whether indications exist that impairment losses previously recognized may no longer
exist or may have decreased (impairment reversal).
2014
2013
U.S. dollar
Average exchange rate
Year-end closing exchange rate
0.7529
0.8213
0.7533
0.7277
Czech crown
Average exchange rate
Year-end closing exchange rate
0.0363
0.0360
0.0385
0.0365
The preparation of financial statements requires management to make a number of estimates and assumptions
that affect the reported amounts of assets and liabilities, revenues and expenses, and the disclosure of
contingent assets and liabilities. All assumptions, expectations and forecasts used as a basis for certain
estimates within these financial statements represent good faith assessments of Ahold’s future performance for
which management believes there is a reasonable basis. They involve risks, uncertainties and other factors that
could cause the Company’s actual future results, performance and achievements to differ materially from those
forecasted. The estimates, assumptions and judgments that management considers most critical relate to:
Vendor allowances (Note 3)
The Company must estimate the allowances that are earned based on fulfillment of its related obligations,
many of which require management to estimate the volume of purchases that will be made during a period of
Company and multi-employer pension obligations (Note 23)
The present value of the pension obligations depends on a number of assumptions that are determined on an
actuarial basis. The assumptions used in determining the net cost (income) for pensions include the discount rate
that should be used to determine the present value of estimated future cash outflows expected to be required
to settle the pension obligations. Other key assumptions comprise longevity and future salary and pension
increases. Additional information is disclosed in Note 23.
Provisions and contingencies (Notes 24 and 34)
The recognition of provisions requires estimates and judgment regarding the timing and the amount of outflow
of resources. The main estimates are as follows:
aa Self-insurance program: estimates and assumptions include an estimate of claims incurred but not yet
reported, historical loss experience, projected loss development factors, estimated changes in claim
reporting patterns, claim settlement patterns, judicial decisions and legislation.
aa Loyalty programs: estimated cost of benefits to which customers participating in the loyalty program are
entitled, which includes assumptions on redemption rates.
aa Claims and legal disputes: management, supported by internal and external legal counsel, where
appropriate, determines whether it is more likely than not that an outflow of resources will be required to
settle an obligation. If this is the case, the best estimate of the outflow of resources is recognized.
Ahold at a glance
Business review
Governance
Financials
Investors
Notes to the consolidated financial statements
2 Basis of preparation (continued)
aa Restructuring: the provisions are based on formal and approved plans using the best information available at
the time. The amounts that are ultimately incurred may change as the plans are executed.
aa Onerous contracts: mainly relate to unfavorable lease contracts and include the excess of the unavoidable
costs of meeting the obligations under the contracts over the benefits expected to be received under
such contracts.
Fair value measurements
For financial reporting purposes, fair value measurements are categorized into Level 1, 2 or 3 based on the
degree to which the inputs to the fair value measurements are observable and the significance of the inputs to
the fair value measurement in its entirety, which are described as follows:
aa Level 1 inputs are quoted prices (unadjusted) in active markets for identical assets or liabilities that the entity
can access at the measurement date.
aa Level 2 inputs are inputs, other than quoted prices included within Level 1, that are observable for the asset
or liability, either directly (i.e., as prices) or indirectly (i.e., derived from prices).
aa Level 3 inputs are unobservable inputs for the asset or liability.
3 Significant accounting policies
Consolidation
The consolidated financial statements incorporate the financial figures of the Company and its subsidiaries.
Subsidiaries are entities over which the Company has control. The Company controls an entity when it is
exposed to, or has rights to, variable returns from its involvement with the entity and has the ability to affect
those returns through its power over the entity. Subsidiaries are fully consolidated from the date that control
commences until the date that control ceases. All intra-group transactions, balances, income and expenses
are eliminated upon consolidation. Unrealized losses on intra-group transactions are eliminated, unless the
transaction provides evidence of an impairment of the assets transferred.
Non-controlling interests are recorded, as appropriate, on the consolidated balance sheet, in the consolidated
income statement, and in the consolidated statement of comprehensive income for the non-controlling
shareholders’ share in the net assets and the income or loss of subsidiaries. Non-controlling shareholders’
interest in an acquired subsidiary is initially measured at the non-controlling interest’s proportion of the net fair
value of the assets, liabilities and contingent liabilities recognized.
Foreign currency translation
The financial statements of subsidiaries, joint ventures and associates are prepared in their functional currencies,
which are determined based on the primary economic environment in which they operate. Transactions in
currencies other than the functional currency are recorded at the rates of exchange prevailing on the transaction
dates. At each balance sheet date, monetary items denominated in foreign currencies are translated into the
Ahold
Annual Report 2014
71
entity’s functional currency at the then prevailing rates. Exchange differences arising on the settlement and
translation of monetary items are included in net income for the period. Goodwill and fair value adjustments
arising on the acquisition of a foreign entity are considered as assets and liabilities denominated in the
functional currency of the foreign entity.
Upon consolidation, the assets and liabilities of subsidiaries with a functional currency other than the euro are
translated into euros using the exchange rates prevailing at the balance sheet date. Income and expense items
are translated at the average exchange rates for the respective periods. Exchange rate differences arising
during consolidation and on the translation of investments in subsidiaries are included in other comprehensive
income and in equity, in the currency translation reserve. Intercompany loans to and from foreign entities for
which settlement is neither planned nor likely to occur in the foreseeable future are considered to increase or
decrease the net investment in that foreign entity; therefore the exchange rate differences relating to these loans
are also included in other comprehensive income and in equity, in the currency translation reserve.
On the disposal of a foreign operation resulting in loss of control, loss of joint control or loss of significant
influence, the related cumulative exchange rate difference that was included in equity is transferred to the
consolidated income statement.
Segmentation
Ahold’s operating segments are its retail operating companies that engage in business activities from
which they earn revenues and incur expenses and whose operating results are regularly reviewed by the
Management Board to make decisions about resources to be allocated to the segments and to assess their
performance. In establishing the reportable segments, certain operating segments with similar economic
characteristics have been aggregated.
The segments’ performance is evaluated against several measures, of which operating income is the most
important. Intersegment sales are executed under normal commercial terms and conditions that would also
be available to unrelated third parties. Net sales are attributed to geographic regions based on the location
of stores.
Net sales
Ahold generates and recognizes net sales to retail customers at the point of sale in its stores and upon
delivery of goods through the online channel. Ahold also generates revenues from the sale of products to
retail franchisees that are recognized upon delivery. Ahold recognizes franchise fees as revenue when all
material services relating to the contract have been substantially performed. Revenue from the sale of gift cards
and gift certificates is recognized when the gift card or gift certificate is redeemed by the retail customer.
Future discounts earned by customers in connection with bonus or loyalty cards and other company-sponsored
programs are deferred on the balance sheet at the time of the sale and subsequently recognized in the income
statement when redeemed.
Generally, net sales and cost of sales are recorded based on the gross amount received from the customer for
products sold and the amount paid to the vendor for products purchased, excluding sales taxes and valueadded taxes. However, for certain products or services, such as sales through its online Plaza platform, the
sale of lottery tickets, third-party prepaid phone cards, stamps and public transportation tickets, Ahold acts as
an agent and consequently records the amount of commission income in its net sales.
Ahold at a glance
Business review
Governance
Financials
Investors
Notes to the consolidated financial statements
3 Significant accounting policies (continued)
Cost of sales
Cost of sales includes the purchase price of the products sold and other costs incurred in bringing the
inventories to the location and condition ready for sale. These costs include costs of purchasing, storing, rent,
depreciation of property, plant and equipment, salaries, and transporting products to the extent that it relates to
bringing the inventories to the location and condition ready for sale.
Vendor allowances
Ahold receives various types of vendor allowances. The most common allowances vendors offer are (i) volume
allowances, which are off-invoice or amounts billed back to vendors based on the quantity of products sold
to customers or purchased from the vendor and (ii) promotional allowances, which relate to cooperative
advertising and market development efforts. Volume allowances are recognized as a reduction of the cost of
the related products as they are sold. Promotional allowances are recognized as a reduction of the cost of
the related products when the Company has performed the activities specified in the contract with the vendor.
If the contract does not specify any performance criteria, the allowance is recognized over the term of the
contract. Vendor allowances are generally deducted from cost of sales, unless there is clear evidence that they
should be classified as revenue or a reimbursement of costs. Ahold recognizes vendor allowances only where
there is evidence of a binding arrangement with the vendor, the amount can be estimated reliably and receipt
is probable.
The accounting for vendor allowances requires a number of estimates. First, the Company must estimate
the allowances that are earned based on the fulfillment of its related obligations, many of which require
management to estimate the volume of purchases that will be made during a period of time. Second, the
Company needs to estimate the amount of related product that was sold and the amount that remains in
ending inventories and accordingly allocate the allowance to cost of sales or inventories. Management makes
this estimate based on the turnover of the inventories and allocates a portion of the related vendor allowance
to ending inventories until such product is estimated to have been sold to customers.
Selling expenses
Selling expenses relate to our store and online operations and consist of employees’ salaries and wages,
store expenses, rent income and rent expense or depreciation related to stores, advertising costs and other
selling expenses.
General and administrative expenses
General and administrative expenses consist of support office employees’ salaries and wages, rent and
depreciation of support offices, impairment losses and reversals, gains and losses on the sale of non-current
assets and disposal groups held for sale, restructuring costs, and other general and administrative expenses.
Share-based compensation
The grant date fair value of equity-settled share-based compensation plans is expensed, with a corresponding
increase in equity, on a straight-line basis over the vesting periods of the grants. The cumulative expense
recognized at each balance sheet date reflects the extent to which the vesting period has expired and the
Ahold
Annual Report 2014
72
Company’s best estimate of the number of shares that will eventually vest. No expense is recognized for
awards that do not ultimately vest, except for awards where vesting is conditional upon a market condition
(e.g., total shareholder return). Those are treated as vested irrespective of whether or not the market condition is
ultimately satisfied, provided that all non-market conditions (e.g., continued employment) are satisfied.
Income taxes
Income tax expense represents the sum of current and deferred tax. Income tax is recognized in the income
statement except to the extent that it relates to items recognized directly in equity or other comprehensive
income. Current tax expense is based on the best estimate of taxable income for the year, using tax rates
that have been enacted or substantively enacted at the balance sheet date and adjustments for current
taxes payable (receivable) for prior years. Deferred tax is the tax expected to be payable or recoverable on
differences between the carrying amounts of assets and liabilities and the corresponding tax basis used in the
computation of taxable income. Deferred tax assets and liabilities are generally recognized for all temporary
differences. However, deferred tax liabilities are not recognized if they arise from the initial recognition of
goodwill. Deferred income tax is not accounted for if it arises from initial recognition of an asset or liability in a
transaction other than a business combination that, at the time of the transaction, affects neither accounting nor
taxable profit or loss. Deferred tax is calculated at the tax rates that are expected to apply in the period when
the liability is settled or the asset is realized.
Deferred tax assets, including deferred tax assets for tax loss carryforward positions and tax credit
carryforward positions, are recognized to the extent that it is probable that future taxable income will be
available against which temporary differences, unused tax losses or unused tax credits can be utilized.
The carrying amount of deferred tax assets is reviewed at each balance sheet date and reduced to the extent
that it is no longer probable that sufficient taxable income will be available to allow all or part of the assets to
be recovered.
Deferred tax assets and liabilities are not discounted. Deferred income tax assets and liabilities are offset
on the balance sheet when there is a legally enforceable right to offset current tax assets against current tax
liabilities and when the deferred income taxes relate to income taxes levied by the same fiscal authority.
Current income tax assets and liabilities are offset on the balance sheet when there is a legally enforceable
right to offset and when the Company intends either to settle on a net basis or to realize the asset and settle the
liability simultaneously.
The ultimate tax effects of some transactions can be uncertain for a considerable period of time, requiring
management to estimate the related current and deferred tax positions. The Company recognizes liabilities
for uncertain tax positions when it is more likely than not that additional taxes will be due. These liabilities are
presented as current income taxes payable, except in jurisdictions where prior tax losses are being carried
forward to be used to offset future taxes that will be due; in these instances the liabilities are presented as a
reduction to deferred tax assets.
Non-current assets held for sale and discontinued operations
Non-current assets and disposal groups are classified as held for sale if their carrying amount will be recovered
through a sale transaction rather than through continuing use. For this to be the case the asset (or disposal
group) must be available for immediate sale in its present condition and its sale must be highly probable. Noncurrent assets (or disposal groups) classified as held for sale are measured at the lower of the asset’s carrying
Ahold at a glance
Business review
Governance
Financials
Investors
Notes to the consolidated financial statements
Ahold
Annual Report 2014
3 Significant accounting policies (continued)
amount and the fair value less costs of disposal. Depreciation or amortization of an asset ceases when it is
classified as held for sale. Equity accounting ceases for an investment in a joint venture or associate when it is
classified as held for sale; instead, dividends received are recognized in the consolidated income statement.
A discontinued operation is a component of the Company that either has been disposed of or is classified
as held for sale, and represents a separate major line of business or geographical area of operations or is
part of a single coordinated plan to dispose of a separate major line of business or geographical area of
operations. Results from discontinued operations that are clearly identifiable as part of the component disposed
of and that will not be recognized subsequent to the disposal are presented separately as a single amount in
the consolidated income statement. Results and cash flows from discontinued operations are reclassified for
prior periods and presented in the financial statements so that the results and cash flows from discontinued
operations relate to all operations that have been discontinued as of the balance sheet date for the latest
period presented.
Property, plant and equipment
Items of property, plant and equipment are stated at cost less accumulated depreciation and impairment
losses. Cost includes expenditures that are directly attributable to the acquisition or construction of an asset and
borrowing costs incurred during construction. Where applicable, estimated asset retirement costs are added
to the cost of an asset. Subsequent expenditures are capitalized only when it is probable that future economic
benefits associated with the item will flow to the Company and the costs can be measured reliably. All other
subsequent expenditures represent repairs and maintenance and are expensed as incurred.
Depreciation is computed using the straight-line method based on the estimated useful lives of the items of
property, plant and equipment, taking into account the estimated residual value. Where an item of property,
plant and equipment comprises major components having different useful lives, each such part is depreciated
separately. The assets’ useful lives are reviewed, and adjusted, if appropriate, at each balance sheet date.
The estimated useful lives of property, plant and equipment are:
Land
Buildings
Material handling systems (in warehouses)
Building components
Machinery and equipment
Other
indefinite
30-40 years
20-30 years
7-20 years
5-12 years
3-10 years
Depreciation of assets subject to finance leases and leasehold improvements is calculated on a straightline basis over either the lease term (including renewal periods when renewal is reasonably assured) or the
estimated useful life of the asset, whichever is shorter.
Investment property
Investment property consists of land and buildings held by Ahold to earn rental income or for capital
appreciation, or both. These properties are not used by Ahold in the ordinary course of business. Ahold often
73
owns (or leases under a finance lease) shopping centers containing both an Ahold store and third-party retail
units. In these cases, the third-party retail units generate rental income, but are primarily of strategic importance
for operating purposes to Ahold in its retail operations. Ahold recognizes the part of an owned (or leased
under a finance lease) shopping center that is leased to third-party retailers as investment property, unless it
represents an insignificant portion of the property. Land and buildings leased to franchisees are not considered
to be investment property as they contribute directly to Ahold’s retail operations. Investment property is
measured on the same basis as property, plant and equipment.
Leases and sale and leaseback transactions
Leases
Ahold is a lessee of land, buildings and equipment under operating and finance lease arrangements.
Ahold classifies its leases as finance leases when the lease agreement transfers substantially all of the risks
and rewards of ownership to Ahold. For leases determined to be finance leases, the asset and liability are
recognized based on their values at the inception of the lease at an amount equal either to the fair value
of the leased asset or the present value of the minimum lease payments during the lease term, whichever is
lower. Lease payments are apportioned between interest charges and a reduction of the lease liability so
as to achieve a constant rate of interest on the remaining liability balance. Contingent rentals are expensed
as incurred.
Leases that do not qualify as finance leases are classified as operating leases, and the related lease payments
are expensed on a straight-line basis over the lease term, including, as applicable, any rent-free period during
which Ahold has the right to use the asset. Payments made to Ahold representing incentives to sign a new
lease or representing reimbursements for leasehold improvements are deferred and recognized on a straightline basis over the term of the lease as reductions to rental expense.
For leases with renewal options where the renewal is reasonably assured, the lease term used to (i) determine
the appropriate lease classification, (ii) compute periodic rental expense and (iii) depreciate leasehold
improvements (unless their economic lives are shorter) includes the periods of expected renewals.
Determining whether a lease agreement is a finance or an operating lease requires judgment on various
aspects. These include the fair value of the leased asset, the economic life of the leased asset, whether or not
to include renewal options in the lease term and the determination of an appropriate discount rate to calculate
the present value of the minimum lease payments.
Sale and leaseback
The gain or loss on sale and operating leaseback transactions is recognized in the income statement
immediately if (i) Ahold does not maintain or maintains only minor continuing involvement in these properties,
other than the required lease payments, and (ii) these transactions occur at fair value. Any gain or loss on
sale and finance leaseback transactions is deferred and amortized over the term of the lease. In classifying
the leaseback in a sale and leaseback transaction, similar judgments have to be made as described above
under Leases.
In some sale and leaseback arrangements, Ahold sells a property and only leases back a portion of that
property. These properties generally involve shopping centers that contain an Ahold store as well as other
stores leased to third-party retailers. In such situations, Ahold recognizes a sale and the resulting profit on the
portion of the shopping center that is not leased back to the extent that (i) the property is sold for fair value and
(ii) the risks and rewards of owning stores that are not leased back to Ahold have been fully transferred to the
Ahold at a glance
Business review
Governance
Financials
Investors
Notes to the consolidated financial statements
3 Significant accounting policies (continued)
buyer. The leaseback of the Ahold store and any gain on the sale of the Ahold store is accounted for under
the sale and leaseback criteria described above.
In some sale and leaseback arrangements, Ahold subleases the property to third parties (including franchisees)
or maintains a form of continuing involvement in the property sold, such as earn-out provisions or obligations
or options to repurchase the property. In such situations, the transaction generally does not qualify for sale and
leaseback accounting, but rather is accounted for as a financing transaction (financing). The carrying amount
of the asset remains on the balance sheet and the sale proceeds are recorded as a financing obligation.
The financing obligation is amortized over the lease term. Once Ahold’s continuing involvement ends, the sale
is accounted for under the sale and leaseback criteria described above.
Intangible assets
Goodwill and impairment of goodwill
Goodwill arises on the acquisition of subsidiaries and represents the excess of the consideration transferred
over the Company’s interest in the net fair value of the identifiable assets, liabilities and contingent liabilities at
the date of acquisition, and is carried at cost less accumulated impairment losses. Goodwill on acquisitions of
joint ventures and associates is included in the carrying amount of the investment.
For the purposes of impairment testing, goodwill is allocated to each of the cash-generating units (or groups
of cash-generating units) that is expected to benefit from the synergies of a business combination. Goodwill is
allocated to a cash-generating unit (or group of cash-generating units) representing the lowest level within the
Company at which the goodwill is monitored for internal management purposes and is never larger than
an operating segment before aggregation. Cash-generating units to which goodwill has been allocated are
tested for impairment annually, or more frequently when there is an indication that the cash-generating unit
may be impaired. Goodwill on acquisitions of joint ventures and associates is assessed for impairment as
part of the investment whenever there is an indication that the investment may be impaired. An impairment
loss is recognized for the amount by which the cash-generating unit’s carrying amount exceeds its recoverable
amount. The recoverable amount is the higher of a cash-generating unit’s fair value less cost to sell and its
value in use. An impairment loss is allocated first to reduce the carrying amount of the goodwill and then to the
other assets of the cash-generating unit pro-rata on the basis of the carrying amount of each asset in the cashgenerating unit. An impairment loss recognized for goodwill is not reversed in subsequent periods.
On the partial or complete disposal of an operation, the goodwill attributable to that operation is included in
the determination of the gain or loss on disposal.
Other intangible assets
Separately acquired intangible assets and internally developed software are carried at cost less accumulated
amortization and impairment losses. Intangible assets acquired in a business combination are recognized at
fair value at the date of acquisition (which is regarded as their cost).
Customer relationships acquired in business acquisitions are stated at fair value determined using an income
approach. Direct costs related to the development of software for internal use are capitalized only if the
costs can be measured reliably, technological feasibility has been established, future economic benefits
are probable, and the Company intends to complete development and to use the software. All other costs,
Ahold
Annual Report 2014
74
including all overhead, general and administrative, and training costs, are expensed as incurred. Lease-related
intangible assets, consisting primarily of favorable operating lease contracts acquired in business acquisitions,
are measured at the present value of the amount by which the contract terms are favorable relative to market
prices at the date of acquisition.
Amortization is computed using the straight-line method based on estimated useful lives, which are as follows:
Customer relationships
Software
Lease-related intangibles
Brand names
Other
7-25 years
3-10 years
remaining expected duration of the lease
indefinite
5-indefinite
The useful lives are reviewed, and adjusted if appropriate, at each balance sheet date.
Investments in joint arrangements and associates
Investments in joint arrangements are classified as either joint operations or joint ventures depending on the
contractual rights and obligations each investor has rather than the legal structure of the joint arrangement.
Joint operations arise where Ahold has rights to the assets and obligations relating to the arrangement and
therefore accounts for its share of assets, liabilities, revenue and expenses. Joint ventures arise where Ahold has
rights to the net assets of the arrangement and therefore equity accounts for its interest.
Associates are entities over which Ahold has significant influence but not control, generally accompanying a
shareholding of between 20% and 50% of the voting rights. Significant influence is the power to participate in
the financial and operating policy decisions of the entity but is not control or joint control over those policies.
Associates are accounted for using the equity method.
Under the equity method, investments in joint ventures and associates are measured initially at cost and
subsequently adjusted for post-acquisition changes in Ahold’s share of the net assets of the investment (net of
any accumulated impairment in the value of individual investments). Where necessary, adjustments are made
to the financial figures of joint ventures and associates to ensure consistency with the accounting policies of
the Company.
Unrealized gains on transactions between Ahold and its joint ventures and associates are eliminated to
the extent of Ahold’s stake in these investments. Unrealized losses are also eliminated unless the transaction
provides evidence of an impairment of the assets transferred.
Impairment of non-current assets other than goodwill
Ahold assesses on a quarterly basis whether there is any indication that non-current assets may be impaired.
If indicators of impairment exist, Ahold estimates the recoverable amount of the asset. If it is not possible
to estimate the recoverable amount of an individual asset, Ahold estimates the recoverable amount of the
cash-generating unit to which it belongs. Individual stores are considered separate cash-generating units for
impairment testing purposes.
Ahold at a glance
Business review
Governance
Financials
Investors
Notes to the consolidated financial statements
3 Significant accounting policies (continued)
The recoverable amount is the higher of an asset’s fair value less cost to sell and the asset’s value in use.
In assessing value in use, the estimated future cash flows are discounted to their present value using a pre-tax
discount rate that reflects current market assessments of the time value of money and the risks specific to the
asset. An impairment loss is recognized in the income statement for the amount by which the asset’s carrying
amount exceeds its recoverable amount.
In subsequent years, Ahold assesses whether indications exist that impairment losses previously recognized
for non-current assets other than goodwill may no longer exist or may have decreased. If any such indication
exists, the recoverable amount of that asset is recalculated and, if required, its carrying amount is increased to
the revised recoverable amount. The increase is recognized in operating income as an impairment reversal.
An impairment reversal is recognized only if it arises from a change in the assumptions that were used to
calculate the recoverable amount. The increase in an asset’s carrying amount due to an impairment reversal is
limited to the depreciated amount that would have been recognized had the original impairment not occurred.
Inventories
Inventories are stated at the lower of cost or net realizable value. Cost consists of all costs of purchase, cost
of conversion, and other costs incurred in bringing the inventories to their present location and condition, net
of vendor allowances attributable to inventories. For certain inventories, cost is approximated using the retail
method, in which the sales value of the inventories is reduced by the appropriate percentage of gross margin.
The cost of inventories is determined using either the first-in, first-out (FIFO) method or the weighted average cost
method, depending on their nature or use. Net realizable value is the estimated selling price in the ordinary
course of business, less the estimated marketing, distribution and selling expenses.
Financial instruments
Financial assets and liabilities
Financial assets and liabilities are recognized when the Company becomes a party to the contractual
provisions of a financial instrument. Financial assets are derecognized when the rights to receive cash flows
from the financial assets expire, or if the Company transfers the financial asset to another party and does not
retain control or substantially all risks and rewards of the asset. Financial liabilities are derecognized when the
Company’s obligations specified in the contract expire or are discharged or cancelled. Purchases and sales
of financial assets in the normal course of business are accounted for at settlement date (i.e., the date that the
asset is delivered to or by the Company).
At initial recognition, management classifies its financial assets as either (i) at fair value through profit or loss,
(ii) loans and receivables, (iii) held to maturity or (iv) available for sale, depending on the purpose for which
the financial assets were acquired. Financial assets are initially recognized at fair value. For instruments not
classified as at fair value through profit or loss, any directly attributable transaction costs are initially recognized
as part of the asset value. Directly attributable transaction costs related to financial assets at fair value through
profit or loss are expensed when incurred.
The fair value of quoted investments is based on current bid prices. If the market for a financial asset is
not active, or if the financial asset represents an unlisted security, the Company establishes fair value using
valuation techniques. These include the use of recent arm’s-length transactions, reference to other instruments
Ahold
Annual Report 2014
75
that are substantially the same, and discounted cash flow analysis, making maximum use of market inputs.
Subsequent to initial recognition, financial assets are measured as described below. At each balance sheet
date, the Company assesses whether there is objective evidence that a financial asset or a group of financial
assets is impaired.
Investments at fair value through profit or loss
Investments at fair value through profit or loss are those investments that are either held for trading or designated
as such by the Company. A financial asset is classified as held for trading if it is acquired principally for the
purpose of selling in the short term. Derivatives are classified as held for trading unless they are designated as
hedges. Financial instruments held for trading are measured at fair value and changes therein are recognized
in the income statement.
Loans and receivables
Loans and receivables are non-derivative financial assets with fixed or determinable payments that are not
quoted in an active market. They are carried at amortized cost using the effective interest method, less any
impairment losses. They are included in current assets, except for loans and receivables with maturities greater
than 12 months after the balance sheet date.
Held to maturity financial assets
Held to maturity financial assets are non-derivative financial assets with fixed or determinable payments and
a fixed maturity that the Company has the positive intention and ability to hold to maturity. They are carried
at amortized cost using the effective interest method, less any impairment losses. They are included in current
assets, except for held to maturity financial assets with maturities greater than 12 months after the balance
sheet date.
Available-for-sale financial assets
Available-for-sale financial assets are non-derivative financial assets that are either designated in this category
of financial assets or not classified in any of the other categories. They are measured at fair value based on
quoted market prices with changes therein recognized directly in equity until the investment is derecognized
or determined to be impaired, at which time the cumulative gain or loss previously recorded in equity is
transferred to the income statement. Investments in equity instruments that do not have a quoted market price
and whose fair value cannot be reliably measured are carried at cost. Available-for-sale financial assets are
included in non-current assets unless management intends to dispose of the investment within 12 months after
the balance sheet date.
Cash and cash equivalents
Cash and cash equivalents include all cash-on-hand balances, checks, debit and credit card receivables,
short-term highly liquid cash investments, and time deposits with original maturities of three months or less.
Time deposits and similar instruments with original maturities of more than three months but less than 12 months
are classified as other current financial assets. Bank overdrafts are included in short-term borrowings.
Loans and short-term borrowings
Loans and short-term borrowings are recognized initially at fair value, net of transaction costs incurred.
Loans and short-term borrowings are subsequently stated at amortized cost, unless they are designated as
fair value hedges. Any difference between the proceeds and redemption value is recognized in the income
statement over the period of the loans and short-term borrowings using the effective interest method. Loans are
classified as current liabilities unless the Company has an unconditional right to defer settlement of the liability
for at least 12 months after the balance sheet date.
Ahold at a glance
Business review
Governance
Financials
Investors
Notes to the consolidated financial statements
3 Significant accounting policies (continued)
Derivative financial instruments
All derivative financial instruments are initially recognized at fair value at the date the derivative contracts
are entered into and are subsequently remeasured to their fair value at the end of each reporting period.
Gains and losses resulting from the fair value remeasurement are recognized in the income statement as
fair value gains (losses) on financial instruments, unless the derivative qualifies and is effective as a hedging
instrument in a designated hedging relationship. In order for a derivative financial instrument to qualify as a
hedging instrument for accounting purposes, the Company must document (i) at the inception of the transaction,
the relationship between the hedging instrument and the hedged item, as well as its risk management
objectives and strategy for undertaking various hedging transactions and (ii) its assessment, both at hedge
inception and on an ongoing basis, of whether the derivative that is used in the hedging transaction is highly
effective in offsetting changes in fair values or cash flows of hedged items. Derivatives that are designated as
hedges are accounted for as either cash flow hedges or fair value hedges.
The effective portion of changes in the fair value of derivatives that are designated and qualify as cash flow
hedges is recognized initially in the cash flow hedging reserve, a separate component of equity. The gain or
loss relating to the ineffective portion is recognized immediately in the income statement. Amounts accumulated
in equity are reclassified into the income statement in the same period in which the related exposure impacts the
income statement. When a cash flow hedge no longer meets the criteria for hedge accounting, any cumulative
gain or loss existing in equity at that time remains in equity and is recognized when the forecasted transaction is
ultimately recognized in the income statement. When a forecasted transaction is no longer expected to occur,
the cumulative gain or loss existing in equity is immediately recognized in the income statement.
Ahold
Annual Report 2014
Cumulative preferred financing shares
Cumulative preferred financing shares, for which dividend payments are not at the discretion of the Company,
are classified as non-current financial liabilities and are stated at amortized cost. The dividends on these
cumulative preferred financing shares are recognized as interest expense in the income statement, using
the effective interest method. From the date when Ahold receives irrevocable notification from a holder of
cumulative preferred financing shares to convert these shares into common shares, the cumulative preferred
financing shares are classified as a separate class of equity.
Pension and other post-employment benefits
The net assets and net liabilities recognized on the consolidated balance sheet for defined benefit plans
represent the actual surplus or deficit in Ahold’s defined benefit plans measured as the present value of the
defined benefit obligations less the fair value of plan assets. Any surplus resulting from this calculation is limited
to the present value of available refunds and reductions in future contributions to the plan.
Defined benefit obligations are actuarially calculated on the balance sheet date using the projected unit
credit method. The present value of the defined benefit obligations is determined by discounting the estimated
future cash outflows using market yields on high-quality corporate bonds (i.e., bonds rated AA or higher)
denominated in the currency in which the benefits will be paid, and that have an average duration similar to
the expected duration of the related pension liabilities.
Defined benefit costs are split into three categories:
aa Service cost, past service cost, gains and losses on curtailment and settlements
aa Net interest expense or income
Fair value changes of derivative instruments that qualify for fair value hedge accounting treatment are
recognized in the income statement in the periods in which they arise, together with any changes in fair value
of the hedged asset or liability. If the hedging instrument no longer meets the criteria for hedge accounting, the
adjustment to the carrying amount of the hedged item is amortized in the income statement over the remaining
period to maturity of the hedged item.
aa Remeasurement
Reinsurance assets and liabilities
Under Ahold’s self-insurance program, part of the insurance risk is ceded under a reinsurance treaty, which is a
pooling arrangement between unrelated companies. Reinsurance assets include estimated receivable balances
related to reinsurance contracts purchased by the Company. Reinsurance liabilities represent the expected
insurance risks related to reinsurance contracts sold by the Company. Reinsurance assets and liabilities are
measured on a discounted basis using accepted actuarial methods.
Past service years within the Dutch pension fund are calculated based upon a methodology that uses the
maximum past service years based on accrued benefits or a participant’s actual date of hire.
Financial guarantees
Financial guarantees are recognized initially as a liability at fair value. Subsequently, the liability is measured
at the higher of the best estimate of the expenditure required to settle the obligation and the amount initially
recognized less cumulative amortization.
Equity
Equity instruments issued by the Company are recorded at the value of proceeds received. Own equity
instruments that are bought back (treasury shares) are deducted from equity. Incremental costs that are directly
attributable to issuing or buying back own equity instruments are recognized directly in equity, net of the related
tax. No gain or loss is recognized in the income statement on the purchase, sale, issuance or cancellation of
the Company’s own equity instruments.
76
The first category is presented as labor costs within operating earnings. Past-service costs are recognized
in the income statement in the period of plan amendment. Results from curtailments or settlements are
recognized immediately.
Net interest is calculated by applying the discount rate to the net defined benefit liability or asset and is
presented within net financial expenses.
Remeasurements, comprising actuarial gains and losses, the effect of the asset ceiling (if applicable) and the
return on plan assets (excluding interest) are recognized immediately in the balance sheet with a charge or
credit to other comprehensive income in the period in which it occurs. Remeasurements recorded in other
comprehensive income are not recycled to the income statement.
Contributions to defined contribution plans are recognized as an expense when employees have rendered
service entitling them to the contributions. Post-employment benefits provided through industry multi-employer
plans, managed by third parties, are generally accounted for under defined contribution criteria.
For other long-term employee benefits, such as long-service awards, provisions are recognized on the basis of
estimates that are consistent with the estimates used for the defined benefit obligations, however discounted
Ahold at a glance
Business review
Governance
Financials
Investors
Notes to the consolidated financial statements
3 Significant accounting policies (continued)
using Ahold’s cost of debt rate. For these all actuarial gains and losses are recognized in the income
statement immediately.
Provisions
Provisions are recognized when (i) the Company has a present (legal or constructive) obligation as a result of
past events, (ii) it is more likely than not that an outflow of resources will be required to settle the obligation, and
(iii) the amount can be reliably estimated. The amount recognized is the best estimate of the expenditure required
to settle the obligation. Provisions are discounted whenever the effect of the time value of money is significant.
The provision for the Company’s self-insurance program is recorded based on claims filed and an estimate of
claims incurred but not yet reported. The provision includes expenses incurred in the claim settlement process
that can be directly associated with specific claims. Other expenses incurred in the claim settlement process
are expensed when incurred. The Company’s estimate of the required liability of such claims is recorded on a
discounted basis, utilizing an actuarial method based upon various assumptions that include, but are not limited
to, historical loss experience, projected loss development factors and actual payroll costs.
Restructuring provisions are recognized when the Company has approved a detailed formal restructuring plan
and the restructuring has either commenced or has been announced to those affected by it. Onerous contract
provisions are measured at the amount by which the unavoidable costs to fulfill agreements exceeds the
expected benefits from such agreements.
New accounting policies effective for 2014
Investment Entities (Amendments to IFRS 10, IFRS 12 and IAS 27)
These amendments provide an exception to the consolidation requirement for entities that meet the definition of
an investment entity under IFRS 10 Consolidated Financial Statements. The exception to consolidation requires
investment entities to account for subsidiaries at fair value through profit or loss. These amendments have no
impact on the Group, since none of the entities in the Group qualify to be an investment entity under IFRS 10.
Offsetting Financial Assets and Financial Liabilities – Amendments to IAS 32
These amendments clarify the meaning of “currently has a legally enforceable right to set-off” and the criteria
for non-simultaneous settlement mechanisms of clearing houses to qualify for offsetting. These amendments have
no impact on the Group.
Novation of Derivatives and Continuation of Hedge Accounting – Amendments to IAS 39
These amendments provide relief from discontinuing hedge accounting when novation of a derivative
designated as a hedging instrument meets certain criteria. These amendments have no impact on the Group
as the Group has not novated its derivatives during the current or prior periods.
Recoverable Amount Disclosures for Non-Financial Assets – Amendments to IAS 36
These amendments remove the unintended consequences of IFRS 13 Fair Value Measurement on the
disclosures required under IAS 36 Impairment of Assets. In addition, these amendments require disclosure
of the recoverable amounts for the assets or cash-generating units (CGUs) for which an impairment loss has
been recognized or reversed during the period. The Group early adopted these disclosure requirements in the
annual consolidated financial statements for the year ended December 29, 2013.
Ahold
Annual Report 2014
77
New accounting policies not yet effective for 2014
The IASB issued several standards, or revisions to standards that are not yet effective for 2014, but will become
effective in coming years.
IFRS 9, “Financial instruments,” addresses the classification, measurement and recognition of financial
assets and financial liabilities. The IASB is adding to the standard as it completes the various phases of
its comprehensive project on financial instruments that are to eventually form a complete replacement for
IAS 39 “Financial Instruments: Recognition and Measurement.” Based on Ahold’s current financial position,
the Company anticipates that the application of IFRS 9 in the future may have an impact on amounts reported
in respect of the Company’s financial assets and financial liabilities. However, it is not practicable to provide a
reasonable estimate of the effect of IFRS 9 until a detailed review has been completed. IFRS 9, as amended in
July 2014, is effective for annual periods beginning on or after January 1, 2018.
Narrow scope amendments to IAS 19, “Employee Benefits,” entitled “Defined Benefit Plans: Employee
Contributions (Amendments to IAS 19),” apply to contributions from employees or third parties to defined
benefit plans. The objective of the amendments is to simplify the accounting for contributions that are
independent of the number of years of employee service, for example, employee contributions that
are calculated according to a fixed percentage of salary. The amendments became effective for the
Company as of July 1, 2014, however EU endorsement had not been received as of the balance sheet
date. The adjustment will result in an increase of the defined benefit obligation and a decrease in other
comprehensive income. When IAS 19R became effective for the Company in 2012, the amount relating to
this amendment was €26 million. However, it is not practicable to provide a reasonable estimate of the effect
of the amendment upon adoption date until a detailed calculation has been completed.
IFRS 15, “Revenue from Contracts with Customers,” establishes a single comprehensive model for entities to use
in accounting for revenue from contracts with customers. IFRS 15 will supersede the current revenue recognition
guidance including IAS 18 “Revenue,” IAS 11 “Construction Contracts,” and the related Interpretations when
it becomes effective for annual periods beginning on or after January 1, 2017. Under IFRS 15, an entity
recognizes revenue when (or as) a performance obligation is satisfied, i.e., when “control” of the goods or
services underlying the particular performance obligation is transferred to the customer. More prescriptive
guidance has been added in IFRS to deal with specific scenarios. Furthermore, extensive disclosures are
required by IFRS 15. The Company is in the process of evaluating the full impact of IFRS 15.
Amendments to IFRS 11, “Accounting for Acquisitions of Interests in Joint Operations,” provide guidance
on how to account for the acquisition of a joint operation that constitutes a business as defined in
IFRS 3 “Business Combinations.” Specifically, the amendments state that the relevant principles on accounting
for business combinations in IFRS 3 and other standards should be applied. The amendments to IFRS 11 apply
prospectively for annual periods beginning on or after January 1, 2016. Based on Ahold’s current financial
position, the Company does not anticipate that the application of these amendments to IFRS 11 will have a
significant effect on the future consolidated financial statements.
Amendments to IAS 16 and IAS 38, “Clarification of Acceptable Methods of Depreciation and Amortization,”
prohibit entities from using a revenue-based depreciation method for items of property, plant and equipment
and introduce a rebuttable presumption that revenue is not an appropriate basis for amortization of an
intangible asset. Currently the Company uses the straight-line method for depreciation and amortization of
Ahold at a glance
Business review
Governance
Financials
Investors
Notes to the consolidated financial statements
3 Significant accounting policies (continued)
property, plant and equipment, and intangible assets, respectively. The Company believes that the straight-line
method is the most appropriate method to reflect consumption of economic benefits in the respective assets
and accordingly does not anticipate that the application of these amendments will have a significant effect on
the future consolidated financial statements.
Narrow scope amendments to IAS 27, “Equity Method in Separate Financial Statements,” will allow entities to
use the equity method to account for investments in subsidiaries, joint ventures and associates in their separate
financial statements. The amendments are effective for annual periods beginning on or after January 1, 2016,
and are to be applied retrospectively. Based on Ahold’s current financial position, these amendments will not
have an effect on the future consolidated financial statements.
Narrow scope amendments to IFRS 10 and IAS 28, “Sale or Contribution of Assets between an Investor and
its Associate or Joint Venture,” clarified an inconsistency between these standards with regards to the sale or
contribution of assets between an investor and its associate or joint venture. Following the amendments, a full
gain or loss is recognized when a transaction involves a business (whether it is housed in a subsidiary or
not). A partial gain or loss is recognized when a transaction involves assets that do not constitute a business,
even if these assets are housed in a subsidiary. The Company has yet to assess the amendments’ full impact.
The amendments will be effective for annual periods commencing on or after January 1, 2016.
Annual improvements to IFRSs 2010-2012 Cycle made a number of amendments to various IFRSs, which,
based on Ahold’s current financial position, the Company anticipates will not have a significant effect on the
future consolidated financial statements. The amendments are summarized as follows:
aa The amendments to IFRS 2, “Share-based Payment,” changed the definitions of “vesting conditions” and
“market condition” and added definitions for “performance condition” and “service condition,” which were
previously included within the definition of “vesting condition.”
aa The amendments to IFRS 3, “Business Combinations,” clarify that contingent consideration that is classified
as an asset or a liability should be measured at fair value at each reporting date with changes in fair value
(other than measurement period adjustments) being recognized in profit and loss.
aa The amendments to IFRS 8, “Operating Segments,” require an entity to disclose the judgments made
by management in applying the aggregation criteria to operating segments. They also clarify that a
reconciliation of the total of the reportable segments’ assets to the entity’s assets should only be provided if
the segment assets are regularly provided to the chief operating decision-maker.
aa The amendments to the basis for conclusions on IFRS 13, “Fair Value Measurement,” clarify that the issuance
of IFRS 13, and subsequent amendments to IAS 39 and IFRS 9, did not remove the ability to measure shortterm receivables and payables with no stated interest rate at their invoice amounts without discounting, if the
effect of discounting is immaterial.
aa The amendments to IAS 16, “Property, Plan and Equipment,” and IAS 38 “Intangible Assets,” remove
perceived inconsistencies in the accounting for accumulated depreciation / amortization when an item of
property, plant and equipment or an intangible asset is revalued.
Ahold
Annual Report 2014
78
aa The amendments to IAS 24, “Related Party Disclosures,” clarify that a management entity providing key
management personnel services to a reporting entity is a related party of the reporting entity. Consequently,
the reporting entity should disclose as related party transactions the amounts incurred for the service paid or
payable to the management entity for the provision of key management personnel services.
Annual improvements to IFRSs 2011-2013 Cycle made a number of amendments to various IFRSs, which,
based on Ahold’s current financial position, the Company anticipates will not have a significant effect on the
future consolidated financial statements. The amendments are summarized as follows:
aa The amendments to IFRS 3, “Business Combinations,” clarify that the standard does not apply to the
accounting for the formation of all types of joint arrangements in the financial statements of the joint
arrangement itself.
aa The amendments to IFRS 13, “Fair Value Measurement,” clarify that the scope of the portfolio exception
for measuring the fair value of a group of financial assets or financial liabilities on a net basis includes all
contracts that are within the scope of, and accounted for in accordance with, IAS 39 or IFRS 9, even if
those contracts do not meet the definitions of financial assets or financial liabilities within IAS 32.
aa The amendments to IAS 40, “Investment Property,” clarify that IAS 40 and IFRS 3 are not mutually exclusive
and application of both standards may be required. Consequently, an entity acquiring investment property
must determine whether the property meets the definition of investment property and whether the transaction
meets the definition of a business combination.
Annual improvements to IFRSs 2012-2014 Cycle made a number of amendments to various IFRSs, which,
based on Ahold’s current financial position, the Company anticipates will not have a significant effect on the
future consolidated financial statements. The amendments are summarized as follows:
aa The amendments to IFRS 5, “Non-current Assets Held for Sale and Discontinued Operations,” added
specific guidance for cases in which an entity reclassifies an asset from held for sale to held for distribution
to shareholders or vice versa and cases in which held-for-distribution accounting is discontinued.
aa The amendments to IFRS 7, “Financial Instruments: Disclosures,” include a description of the term
“continuing involvement” for the purpose of the transfer disclosures.
aa The amendments to IAS 19, “Employee Benefits,” clarify that the high-quality corporate bonds used in
estimating the discount rate for post-employment benefits should be denominated in the same currency as
the benefits to be paid.
IFRIC 21 addresses the issue of when to recognize a liability to pay a levy imposed by a government.
The interpretation defines a levy and specifies that the obligating event that gives rise to the liability is the
activity that triggers the payment of the levy, as identified by legislation. The Interpretation provides guidance
on how different levy arrangements should be accounted for. In particular, it clarifies that neither economic
compulsion nor the going concern basis of financial statements preparation implies that an entity has a present
obligation to pay a levy that will be triggered by operating in a future period. IFRIC 21 was endorsed by the
EU on June 13, 2014, and is effective for annual periods beginning on or after June 17, 2014. The adoption
of IFRIC 21 is not expected to have any financial effect on the consolidated financial statements of the Group.
There are no other IFRSs or IFRIC interpretations that have been issued but are not yet effective that are
expected to have a material effect on the future consolidated financial statements.
Ahold at a glance
Business review
Governance
Financials
Investors
Notes to the consolidated financial statements
Ahold
Annual Report 2014
79
4 Acquisitions
2014 acquisitions
SPAR in the Czech Republic
On August 1, 2014, Ahold announced that it had successfully completed the acquisition of SPAR’s business in the Czech Republic. The purchase consideration was CZK 5,170 million (€187 million) payable in cash for 100%
of the voting equity interest, subject to finalization of the purchase price. With this transaction, Ahold acquired 49 stores, of which 35 are compact hypers and 14 are supermarkets, as well as a location which is still under
development. Goodwill recognized in the amount of CZK 2,783 million (€100 million), which will not be deductible for tax purposes, represents expected synergies from the combination of operations.
As of the acquisition date, SPAR contributed €177 million to 2014 net sales and lowered net income by €13 million in 2014. The impact excludes €4 million in transaction costs related to the acquisition, that is included in
general and administrative expenses. Had the acquisition occurred on December 30, 2013, Ahold’s pro-forma net sales through December 28, 2014, would have been approximately €33,016 million. The pro-forma net
income would have been approximately €572 million, due to the SPAR acquisition.
Jumbo
On August 14, 2012, Ahold announced that its Albert Heijn division had completed the acquisition of 78 C1000 and four Jumbo stores from Jumbo for €290 million in cash, with €266 million paid by December 28, 2014
(2014: €2 million, 2013: credit €1 million and 2012: €265 million), and the remaining amount to be settled as agreements are reached with the franchisees. As of December 28, 2014, Ahold had reached agreement
with 58 franchisees, related to which 54 stores have been converted and opened under the Albert Heijn banner by the end of 2014. Agreements with the franchisees for the remaining 24 stores are yet to be reached and
these stores are to be converted to the Albert Heijn banner over a period of time. In 2014, Ahold recognized an €8 million impairment loss of prepaid consideration. Goodwill recognized in the amount of €174 million by
December 28, 2014 (2014: €45 million, 2013: €76 million and 2012: €53 million), which will not be deductible for tax purposes, represents expected synergies from the combination of operations, as well as the ability to
expand Ahold’s geographic reach.
The 54 stores that were converted to the Albert Heijn banner have contributed €278 million to 2014 net sales (2013: 39 stores, €149 million) and €7 million to 2014 net income (insignificant amount to 2013 net income). It is
not practicable to provide the 2014 and 2013 pro-forma effect on Ahold’s net sales and net income.
Other 2014 acquisitions
During 2014, Ahold completed several minor store acquisitions in the Netherlands, Belgium, and the U.S. for a combined purchase consideration of €21 million.
All acquisitions were accounted for using the acquisition method of accounting.
The allocation of the fair value of the net assets acquired and the goodwill arising from the acquisitions during 2014 is as follows:
€ million
Property, plant and equipment and investment property
Goodwill
Other intangible assets
Reversal of other intangible assets
Deferred tax asset
Current assets
Non-current liabilities
Current liabilities
Total purchase consideration
Cash acquired
Consideration payable
Acquisition of business, net of cash acquired
SPAR
123
100
2
—
32
63
(64)
(69)
187
(18)
(2)
167
Jumbo
—
45
—
(43)
—
—
—
—
2
—
—
2
Other
6
19
1
—
—
1
(6)
—
21
—
—
21
Total
129
164
3
(43)
32
64
(70)
(69)
210
(18)
(2)
190
Ahold at a glance
Business review
Governance
Financials
Investors
Notes to the consolidated financial statements
Ahold
Annual Report 2014
80
5 Assets and liabilities held for sale and discontinued operations
Assets and liabilities held for sale
December 28,
2014
December 29,
2013
Non-current assets and disposal groups held for sale
Assets held for sale from discontinued operations
Total assets held for sale
7
—
7
3
25
28
Liabilities related to assets held for sale from discontinued operations
—
48
December 28,
2014
December 29,
2013
Non-current assets
Current assets
Total assets held for sale from discontinued operations
—
—
—
1
24
25
Non-current liabilities
Current liabilities
Total liabilities related to assets held for sale from discontinued operations
—
—
—
25
23
48
€ million
2014
2013
Slovakia
ICA
Other
Operating results from discontinued operations1
U.S. Foodservice
Slovakia
ICA
Various2
Results on divestments3
Income (loss) from discontinued operations, net of income taxes
(2)
—
(1)
(3)
(194)
(1)
—
1
(194)
(197)
€ million
The non-current assets and disposal groups held for sale consisted primarily of property, plant and equipment.
At year-end 2013, the assets held for sale and liabilities related to assets held for sale from discontinued operations consisted of the carrying value of the Slovakian disposal group as presented below:
€ million
Discontinued operations
Income (loss) from discontinued operations is specified as follows:
1 Operating results from discontinued operations are after net income tax benefits of €2 million and €8 million in 2014 and 2013, respectively.
2 Includes adjustments to the results on various other past divestments.
3 Results on divestments are after net income tax benefits of €28 million and €9 million in 2014 and 2013, respectively.
See Note 28 for the reconciliation between results on divestments of discontinued operations and cash received.
(3)
137
2
136
(10)
(20)
1,614
12
1,596
1,732
Ahold at a glance
Business review
Governance
Financials
Investors
Notes to the consolidated financial statements
Ahold
Annual Report 2014
81
5 Assets and liabilities held for sale and discontinued operations (continued)
Slovakia
On November 14, 2013, it was announced that Ahold had reached an agreement with Condorum regarding the sale of Ahold’s Slovakian business. Upon the sale agreement, Ahold Slovakia qualified as held for sale and
discontinued operation. On April 15, 2014, it was announced that the transaction was completed.
The 2014 operating results of Ahold Slovakia as included in the operating results from discontinued operations were a loss of €2 million (2013: €3 million). The condensed income statement for the Slovakian business is
as follows:
€ million
Net sales
Cost of sales
Gross profit
Total operating expenses
Operating loss
Net financial expenses
Loss before income taxes
Income taxes1
Operating results from discontinued operations, net of income taxes
2014
29
(22)
7
(9)
(2)
—
(2)
—
(2)
2013
139
(105)
34
(44)
(10)
(2)
(12)
9
(3)
1 Included in income tax benefits of 2013 was a €6 million deferred tax asset recognized for 2012 operating losses which was not recognized in the respective period as it was assessed to be not recoverable unless Ahold was to cease operating in Slovakia.
Upon the divestment in the first quarter of 2014, Ahold recorded a loss of €2 million, offset by a net tax benefit of €1 million as presented below. In 2013, in connection with this divestment Ahold had recorded a loss of
€29 million, offset by a net tax benefit of €9 million. Included in the loss on divestment recorded in 2013 were impairment loss on the measurement to fair value less cost of disposal of €16 million and an onerous contract
provision of €12 million.
€ million
Proceeds net of cost of disposal
Net liabilities divested
Use of provision on loss on divestment
Recognition of financial guarantee
Result on divestment before income taxes
Income taxes
Result on divestment of Slovakia
U.S. Foodservice
In connection with the settlement agreement Ahold signed to settle a class action relating to pricing practices of Ahold’s former subsidiary, Ahold recorded a net provision in the amount of €187 million net of income tax
benefits of €28 million. See Note 34 for a description of U.S. Foodservice – Waterbury litigation. Also included in results from divestments in 2014 were legal costs of €7 million (2013: €10 million).
ICA
On February 10, 2013, Ahold reached a sale agreement with Hakon Invest regarding its 60% holding in ICA for proceeds of SEK 20 billion. Upon the sale agreement, Ahold’s investment in ICA was classified as a
discontinued operation and the transaction was completed on March 27, 2013.
2014
(34)
21
12
(1)
(2)
1
(1)
Ahold at a glance
Business review
Governance
Financials
Investors
Notes to the consolidated financial statements
Ahold
Annual Report 2014
82
5 Assets and liabilities held for sale and discontinued operations (continued)
The 2013 operating results from discontinued operations included Ahold’s proportionate share in ICA’s operating results for the month of January 2013 of a €2 million loss, as well as a dividend of SEK 1.2 billion (€142 million)
received from ICA. The expected cash flows from the receipt of the dividend were subject to a cash flow hedge and, consequently, Ahold recognized €139 million of dividend income (€142 million dividend receivable at the
date of recognition less the effect of the cash flow hedge of €3 million).
Ahold recorded a gain of €1,614 million as a result on divestment of ICA as presented below:
€ million
2013
Proceeds net of cost of disposal
Net assets divested
Results on divestment before recycling of currency exchange differences and other items
Currency exchange differences transferred from equity
Other items previously recognized in other comprehensive income
Results on divestments before income taxes
Income taxes
Result on divestment of ICA
2,368
(828)
1,540
82
(9)
1,613
1
1,614
6 Segment reporting
Reportable segments
Ahold’s retail operations are presented in three reportable segments. In addition, Other retail, consisting of Ahold’s unconsolidated joint venture JMR, and Ahold’s Corporate Center are presented separately. The accounting
policies used for the segments are the same as the accounting policies used for the consolidated financial statements as described in Note 3.
Reportable segment
Included in the Reportable segment
Ahold USA
The Netherlands
Czech Republic
Stop & Shop New England, Stop & Shop New York Metro, Giant Landover, Giant Carlisle and Peapod
Albert Heijn, Albert Heijn Belgium, Albert Heijn Germany, Etos, Gall & Gall, bol.com and Albert Heijn Online
Albert
Other
Included in Other
Other retail
Corporate Center
Unconsolidated joint venture JMR (49%)
Corporate Center staff (the Netherlands, Switzerland and the United States)
Net sales
€ million
Ahold USA
The Netherlands
Czech Republic
Ahold group
2014
2013
19,557
11,696
1,521
32,774
19,676
11,494
1,445
32,615
Ahold at a glance
Business review
Governance
Financials
Investors
Notes to the consolidated financial statements
Ahold
Annual Report 2014
83
6 Segment reporting (continued)
Operating income
€ million
Ahold USA
The Netherlands
Czech Republic
Corporate Center
Ahold group
2014
727
584
13
(74)
1,250
2013
663
612
31
(67)
1,239
Additions to property, plant and equipment, investment property, and intangible assets (including assets acquired through business combinations)
2014
2013
390
332
263
21
1,006
519
289
34
1
843
€ million
2014
2013
Ahold USA
The Netherlands
Czech Republic
Corporate Center
Ahold group
566
269
42
2
879
544
245
35
1
825
2014
2013
€ million
Ahold USA
The Netherlands
Czech Republic (and Slovakia, prior to classification as discontinued operation)
Corporate Center
Ahold group
Depreciation and amortization of property, plant and equipment, investment property, and intangible assets
Net impairments of property, plant and equipment, investment property, intangible assets, and write-downs of intangible assets under development
€ million
Ahold USA
The Netherlands
Czech Republic
Ahold group
10
21
—
31
83
9
(1)
91
Ahold at a glance
Business review
Governance
Financials
Investors
Notes to the consolidated financial statements
Ahold
Annual Report 2014
84
6 Segment reporting (continued)
Non-current assets (property, plant and equipment, investment property, and intangible assets)
€ million
Ahold USA
The Netherlands
Czech Republic
Corporate Center
Ahold group
2014
2013
5,419
2,435
598
21
8,473
5,005
2,428
382
3
7,818
Additional segment information
Segment results do not include significant non-cash items other than depreciation, amortization, write-downs, and impairment losses and reversals. For more information on write-downs of intangible assets under development,
see Note 13.
Segment information joint ventures – Other retail (JMR)
The information with respect to JMR is presented in Note 14.
7 Net sales
€ million
Sales to retail customers
Sales to franchisees and franchise fees
Online sales
Other sales
Net sales
2014
2013
28,882
2,529
1,267
96
32,774
29,005
2,421
1,086
103
32,615
8 Expenses by nature
The aggregate of cost of sales and operating expenses is specified by nature as follows:
€ million
Cost of product
Labor costs
Other operational expenses
Depreciation and amortization
Write-down of intangible assets under development (Note 13)
Rent expenses and income – net
Impairment losses and reversals – net
Gains on the sale of assets – net
Total
2014
23,009
4,637
2,473
879
—
515
31
(20)
31,524
2013
22,912
4,705
2,334
825
8
537
83
(28)
31,376
Ahold at a glance
Business review
Governance
Financials
Investors
Notes to the consolidated financial statements
Ahold
Annual Report 2014
85
9 Net financial expenses
€ million
2014
2013
Interest income
Interest expense
Net interest expense on defined benefit pension plans
6
(212)
(16)
7
(225)
(24)
(15)
7
(5)
(13)
(8)
(22)
(19)
(49)
(235)
(291)
Losses on foreign exchange
Fair value gains (losses) on financial instruments
Other
Other financial expenses
Net financial expenses
Interest income mainly relates to interest earned on cash and cash equivalents and short-term cash deposits and similar instruments.
Interest expense primarily relates to financial liabilities measured at amortized cost (mainly loans, finance lease liabilities, financing obligations and cumulative preferred financing shares) and interest accretions to provisions.
At year end 2014 as well as 2013, substantially all pension plans were in a liability position. Consequently, during both years, the net interest component of pension expense resulted in interest expense.
Foreign exchange results on financial assets and liabilities are presented as part of net financial expenses, within losses on foreign exchange. The losses on foreign exchange in 2014 mainly resulted from the foreign exchange
translation of the remaining GBP 250 million of the original GBP 500 million notes. Foreign exchange results arising from the purchase of goods for sale or goods and services consumed in Ahold’s operations are included
in cost of sales or in the appropriate element of operating expenses, respectively. In 2014, the Company recorded a net exchange loss (including impact of foreign exchange hedging instruments) of €2 million in operating
income (2013: loss of €1 million).
In 2014 fair value gains (losses) on financial instruments primarily resulted from the derivatives related to the remaining GBP 250 million notes (an interest rate and a U.S. dollar cross-currency swap), which do not qualify for
hedge accounting treatment.
For more information on financial instruments, see Note 30.
“Other” included in “Other financial expenses” in 2013 primarily comprised of €11 million relating to the change in discount rate used for a multi-employer pension plan withdrawal liability.
Ahold at a glance
Business review
Governance
Financials
Investors
Notes to the consolidated financial statements
Ahold
Annual Report 2014
86
10 Income taxes
Income taxes on continuing operations
The following table specifies the current and deferred tax components of income taxes on continuing operations in the income statement:
€ million
Current income taxes
Domestic taxes (the Netherlands)
Foreign taxes
United States
Europe – Other
Total current tax expense
Deferred income taxes
Domestic taxes (the Netherlands)
Foreign taxes
United States
Europe – Other
Total deferred tax expense
Total income taxes on continuing operations
2014
2013
(107)
(103)
(95)
(10)
(212)
(26)
4
(125)
(4)
(18)
(30)
(2)
(36)
(248)
(18)
8
(28)
(153)
Effective income tax rate on continuing operations
Ahold’s effective tax rate in its consolidated income statement differed from the Netherlands’ statutory income tax rate of 25.0%. The following table reconciles the statutory income tax rate with the effective income tax rate in
the consolidated income statement:
2014
€ million
Income before income taxes
Income tax expense at statutory tax rate
Adjustments to arrive at effective income tax rate:
Rate differential (local rates versus the statutory rate of the Netherlands)
Deferred tax income (expense) related to recognition of deferred tax assets-net
Reserves, (non-) deductibles and discrete items
Total income taxes
%
1,015
2013
€ million
%
948
(254)
25.0%
(237)
25.0%
(23)
(6)
35
(248)
2.3%
0.6%
(3.5)%
24.4%
(38)
40
82
(153)
4.0%
(4.2)%
(8.7)%
16.1%
“Rate differential” indicates the effect of Ahold’s taxable income being generated and taxed in jurisdictions where tax rates differ from the statutory tax rate in the Netherlands. “Reserves, (non-) deductibles and discrete items”
include one-time transactions. During 2013, a tax benefit of €37 million was recognized from movements in income tax contingency reserves.
Ahold at a glance
Business review
Governance
Financials
Investors
Notes to the consolidated financial statements
87
Ahold
Annual Report 2014
10 Income taxes (continued)
Income taxes on discontinued operations
Current and deferred income tax related to discontinued operations amounted to a €30 million benefit in 2014 and a €17 million benefit in 2013 and has been included within the result from discontinued operations.
The 2014 current and deferred income tax benefit on discontinued operations is mainly related to the U.S. The 2013 current and deferred income tax benefit on discontinued operations is mainly related to Slovakia. For further
information, see Notes 5 and 34.
Deferred income tax
The significant components and annual movements of deferred income tax assets and liabilities as of December 28, 2014, and December 29, 2013, are as follows:
€ million
December 30,
2012
Recognized in
income statement
Other
December 29,
2013
Recognized in
income statement
Other
December 28,
2014
Leases and financings
Pensions and other post-employment benefits
Provisions
Derivatives and loans
Interest
Other
Total gross deductible temporary differences
Unrecognized deductible temporary differences
Total recognized deductible temporary differences
237
305
114
24
57
78
815
(56)
759
5
(7)
20
5
(29)
(39)
(45)
3
(42)
(19)
(88)
21
(14)
(1)
(11)
(112)
49
(63)
223
210
155
15
27
28
658
(4)
654
1
(27)
(26)
4
(11)
(5)
(64)
—
(64)
37
35
(11)
15
2
10
88
—
88
261
218
118
34
18
33
682
(4)
678
Tax losses and tax credits
Unrecognized tax losses and tax credits
Total recognized tax losses and tax credits
179
(44)
135
(15)
43
28
(1)
(34)
(35)
163
(35)
128
(4)
(8)
(12)
113
(72)
41
272
(115)
157
Total net deferred tax asset position
894
(14)
(98)
782
(76)
129
835
Property, plant and equipment and intangible assets
Inventories
Other
Total deferred tax liabilities
Net deferred tax assets
(364)
(111)
(5)
(480)
414
(14)
1
(1)
(14)
(28)
(5)
5
—
—
(98)
(383)
(105)
(6)
(494)
288
49
(8)
(1)
40
(36)
(25)
(12)
—
(37)
92
(359)
(125)
(7)
(491)
344
The column “Other” in the table above includes amounts recorded in equity, the effects of acquisitions, divestments and exchange rate differences, as well as reclassifications between deferred tax components and the
application of tax losses and tax credits against current year income tax payables.
Ahold at a glance
Business review
Financials
Governance
Investors
Notes to the consolidated financial statements
88
Ahold
Annual Report 2014
10 Income taxes (continued)
Deferred income tax assets and liabilities are offset on the balance sheet when there is a legally enforceable right to offset current tax assets against current tax liabilities and when the deferred income taxes relate to income
taxes levied by the same fiscal authority. The deferred tax assets and liabilities are presented as non-current assets and liabilities on the balance sheet as follows:
December 28,
2014
€ million
December 29,
2013
494
(150)
344
Deferred tax assets
Deferred tax liabilities
Net deferred tax assets
411
(123)
288
As of December 28, 2014, Ahold had operating and capital loss carryforwards of a total nominal amount of €1,949 million, mainly expiring between 2019 and 2034 (December 29, 2013: €1,239 million). The following
table specifies the years in which Ahold’s operating and capital loss carryforwards and tax credits are scheduled to expire:
2015
2016
2017
2018
2019
2020-2024
2025-2029
After 2029
Does not
expire
Total
Operating and capital losses (nominal value)
48
21
40
51
391
515
375
469
39
1,949
Operating and capital losses (tax value)
Tax credits
Tax losses and tax credits
9
7
16
5
6
11
10
6
16
14
5
19
89
5
94
49
4
53
21
—
21
27
—
27
9
6
15
233
39
272
Unrecognized tax losses and tax credits
(9)
(4)
(2)
(3)
(73)
(7)
(4)
(9)
(4)
(115)
Total recognized tax losses and tax credits
7
7
14
16
21
46
17
18
11
157
€ million
Operating and capital loss carryforwards related to one jurisdiction may not be used to offset income taxes in other jurisdictions. Of the loss carryforwards, €1,480 million relates to U.S. state taxes, for which a weighted
average tax rate of 5.59% applies.
The majority of the above mentioned deferred tax assets relate to tax jurisdictions in which Ahold has suffered a tax loss in the current or a preceding period. Significant judgment is required in determining whether deferred
tax assets are realizable. Ahold determines this on the basis of expected taxable profits arising from the reversal of recognized deferred tax liabilities and on the basis of budgets, cash flow forecasts and impairment models.
Where utilization is not considered probable, deferred tax assets are not recognized.
Income taxes in equity
Current and deferred income taxes recognized in and transferred from equity are as follows:
€ million
Share-based compensation
Cash flow hedges
Currency translation differences in foreign interest
Remeasurement of defined benefit pension plans
Total
2014
6
16
—
21
43
2013
12
(15)
1
(83)
(85)
Ahold at a glance
Business review
Governance
Financials
Investors
Notes to the consolidated financial statements
Ahold
Annual Report 2014
89
11 Property, plant and equipment
Buildings and land
€ million
As of December 30, 2012
At cost
Accumulated depreciation and impairment losses
Carrying amount
Year ended December 29, 2013
Additions
Transfers from under construction
Acquisitions through business combinations
Depreciation
Impairment losses
Impairment reversals
Assets classified to held for sale or sold
Other movements
Exchange rate differences
Closing carrying amount
As of December 29, 2013
At cost
Accumulated depreciation and impairment losses
Carrying amount
Year ended December 28, 2014
Additions
Transfers from under construction
Acquisitions through business combinations
Depreciation
Impairment losses
Impairment reversals
Assets classified to held for sale or sold
Other movements
Exchange rate differences
Closing carrying amount
As of December 28, 2014
At cost
Accumulated depreciation and impairment losses
Carrying amount
Stores
Other
Furnishings, machinery
and equipment
Other
Under
construction
Total
7,067
(2,902)
4,165
563
(198)
365
4,080
(2,831)
1,249
113
(56)
57
202
—
202
12,025
(5,987)
6,038
74
233
—
(346)
(55)
1
(18)
(23)
(139)
3,892
33
47
—
(21)
—
—
—
(1)
(12)
411
94
251
4
(342)
(15)
1
(5)
(3)
(35)
1,199
17
3
—
(11)
(1)
—
(1)
—
(3)
61
489
(534)
—
(1)
—
—
—
(1)
(6)
149
707
—
4
(721)
(71)
2
(24)
(28)
(195)
5,712
6,879
(2,987)
3,892
617
(206)
411
4,052
(2,853)
1,199
120
(59)
61
149
—
149
11,817
(6,105)
5,712
59
191
79
(369)
(8)
3
(11)
(30)
371
4,177
5
26
—
(25)
—
—
(1)
(2)
28
442
159
215
45
(345)
(6)
1
(2)
3
101
1,370
7
4
—
(11)
—
—
—
2
6
69
376
(436)
—
—
—
—
(7)
(1)
11
92
606
—
124
(750)
(14)
4
(21)
(28)
517
6,150
7,810
(3,633)
4,177
703
(261)
442
4,510
(3,140)
1,370
143
(74)
69
92
—
92
13,258
(7,108)
6,150
Ahold at a glance
Business review
Governance
Financials
Notes to the consolidated financial statements
Investors
Ahold
Annual Report 2014
90
11 Property, plant and equipment (continued)
Buildings and land includes improvements to these assets. “Other” buildings and land mainly includes distribution centers and warehouses. “Other” property, plant and equipment mainly consists of trucks, trailers and other
vehicles. Assets under construction mainly consists of stores.
In 2014, Ahold recognized net impairment losses of €10 million for property, plant and equipment (2013: €69 million). These were mainly related to Ahold USA (2014: €7 million; 2013: €66 million). In 2013, Stop &
Shop closed six stores and three gas stations in the New Hampshire area, as announced on August 6, 2013. Ahold recognized $24 million (€18 million) of impairments related to these stores based on the exit assumption.
The remainder of the net impairment losses in 2013 related to various other operating and closed stores.
The higher of the value in use or fair value less cost of disposal represents an asset’s recoverable amount. The value-in-use method involves estimating future cash flows. The present value of estimated future cash flows has been
calculated using pre-tax discount rates ranging between 6.8% and 13.1% (2013: 6.4%-12.8%). Fair value represents the price that would be received to sell an asset in an orderly transaction between market participants and
has generally been measured by using discounted cash flow projections based on the assets’ highest and best use from the market participants’ perspective. In 2014, there was no impairment loss recorded based on fair value
less cost of disposal measurement. In 2013, the fair value less cost of disposal was the recoverable amount in the determination of €15 million of the impairment losses.
The additions to property, plant and equipment include capitalized borrowing costs of €2 million (2013: €2 million). Generally, the capitalization rate used to determine the amount of capitalized borrowing costs is a weighted
average of the interest rate applicable to the respective operating companies. This rate ranged between 2.9% and 4.2% (2013: 3.6%-7.5%).
Other movements mainly include transfers to investment property and from lease-related intangible assets.
The carrying amount of land and buildings includes amounts related to assets held under finance leases and financings of €843 million and €211 million, respectively (December 29, 2013: €808 million and €163 million).
In addition, the carrying amount of machinery and equipment and other includes an amount of €4 million (December 29, 2013: €4 million) relating to assets held under finance leases. Ahold does not have legal title to these
assets. Company-owned property, plant and equipment with a carrying amount of €44 million (December 29, 2013: €48 million) has been pledged as security for liabilities, mainly for loans.
12 Investment property
€ million
2014
2013
At the beginning of the year
At cost
Accumulated depreciation and impairment losses
Carrying amount
863
(320)
543
876
(311)
565
Additions
Acquisitions through business combinations
Depreciation
Impairment losses and reversals – net
Assets classified to held for sale or sold
Transfers from property, plant and equipment and lease-related intangibles
Exchange rate differences
Closing carrying amount
11
5
(25)
(9)
(38)
28
45
560
16
—
(22)
(7)
(18)
26
(17)
543
At the end of the year
At cost
Accumulated depreciation and impairment losses
Carrying amount
893
(333)
560
863
(320)
543
Ahold at a glance
Business review
Governance
Financials
Investors
Notes to the consolidated financial statements
Ahold
Annual Report 2014
91
12 Investment property (continued)
A significant portion of Ahold’s investment property is comprised of shopping centers containing both an Ahold store and third-party retail units. The third-party retail units generate rental income, but are primarily of strategic
importance to Ahold in its retail operations. Ahold recognizes the part of a shopping center leased to a third-party retailer as investment property, unless it represents an insignificant portion of the property.
In 2014, Ahold recognized net impairment losses of €9 million. These were related to Ahold USA (€3 million) and the Netherlands (€6 million).
The carrying amount of investment property includes an amount related to assets held under finance leases and financings of €29 million and €48 million (December 29, 2013: €33 million and €44 million), respectively.
Ahold does not have legal title to these assets. Company-owned investment property with a carrying amount of €75 million (December 29, 2013: €65 million) has been pledged as security for liabilities, mainly for loans.
The fair value of investment property as of December 28, 2014, amounted to approximately €744 million (December 29, 2013: €715 million). Fair value represents the price that would be received to sell an asset in an
orderly transaction between market participants and has generally been measured by using discounted cash flow projections based on the assets’ highest and best use from the market participants’ perspective. Ahold’s fair
value measurements are primarily categorized within Level 2. The most significant input into this valuation approach are observable market retail yields and tenant rents to calculate the fair value. An insignificant portion of the
fair value measurement is based on the Company’s own valuation methods, which are categorized within level 3. For mixed use properties and properties held for strategic purposes, Ahold cannot determine the fair value of
the investment property reliably. In such cases, the fair value is assumed to be equal to the carrying amount.
Rental income from investment property included in the income statement in 2014 amounted to €66 million (2013: €63 million). Direct operating expenses (including repairs and maintenance but excluding depreciation
expense) arising from rental-income-generating and non-rent-generating investment property in 2014 amounted to €30 million (2013: €30 million).
Ahold at a glance
Business review
Governance
Financials
Investors
Notes to the consolidated financial statements
Ahold
Annual Report 2014
92
13 Intangible assets
€ million
Goodwill
Lease-related
intangibles
Software
Customer
relationships
Brand names
Other
Under
development
Total
As of December 30, 2012
At cost
Accumulated amortization and impairment losses
Carrying amount
772
(3)
769
254
(156)
98
714
(532)
182
121
(44)
77
86
—
86
379
(77)
302
55
—
55
2,381
(812)
1,569
Year ended December 29, 2013
Additions
Transfers from under development
Acquisitions through business combinations
Amortization
Impairments and write-downs
Assets classified to held for sale or sold
Other movements
Exchange rate differences
Closing carrying amount
—
—
81
—
(1)
—
—
(12)
837
—
—
—
(10)
(3)
(1)
—
(4)
80
16
49
—
(56)
—
(1)
1
(1)
190
1
—
—
(7)
(1)
—
—
—
70
—
—
—
—
—
—
—
—
86
20
2
(77)
(11)
(4)
—
1
(3)
230
75
(51)
—
—
(8)
—
—
(1)
70
112
—
4
(84)
(17)
(2)
2
(21)
1,563
As of December 29, 2013
At cost
Accumulated amortization and impairment losses
Carrying amount
841
(4)
837
239
(159)
80
680
(490)
190
119
(49)
70
86
—
86
320
(90)
230
70
—
70
2,355
(792)
1,563
Year ended December 28, 2014
Additions
Transfers from under development
Acquisitions through business combinations
Amortization
Impairments
Assets classified to held for sale or sold
Exchange rate differences
Closing carrying amount
—
—
164
—
(4)
—
34
1,031
—
—
2
(9)
—
—
9
82
45
71
—
(78)
—
—
4
232
1
—
—
(5)
—
—
1
67
—
—
—
—
—
—
—
86
14
15
(42)
(12)
(8)
(2)
9
204
76
(86)
—
—
—
—
1
61
136
—
124
(104)
(12)
(2)
58
1,763
As of December 28, 2014
At cost
Accumulated amortization and impairment losses
Carrying amount
1,039
(8)
1,031
268
(186)
82
828
(596)
232
127
(60)
67
86
—
86
306
(102)
204
61
—
61
2,715
(952)
1,763
Ahold at a glance
Business review
Governance
Financials
Investors
Notes to the consolidated financial statements
Ahold
Annual Report 2014
93
13 Intangible assets (continued)
Goodwill recognized on acquisitions in 2014 relates mainly to the acquisition of SPAR in the Czech Republic and C1000 stores (see Note 4 for more details). Goodwill recognized on acquisitions in 2013 relates mainly to the
acquisition of C1000 stores.
Goodwill acquired in business combinations is allocated, at acquisition, to the cash-generating units (CGUs) or groups of CGUs expected to benefit from that business combination.
The carrying amounts of goodwill allocated to CGUs within Ahold’s reportable segments are as follows:
€ million
Reportable segment
Ahold USA
The Netherlands
Czech Republic
Ahold group
Cash-generating unit
Stop & Shop New England
Stop & Shop New York Metro
Giant Carlisle
Giant Landover
Peapod
Albert Heijn
bol.com
Etos
Gall & Gall
Czech Republic
December 28,
2014
December 29,
2013
15
25
235
8
21
393
201
8
1
124
1,031
12
22
209
7
19
335
201
7
1
24
837
CGUs to which goodwill has been allocated are tested for impairment annually or more frequently if there are indications that a particular CGU might be impaired. The recoverable amount of each CGU is determined based
on value-in-use calculations. Value-in-use is determined using discounted cash flow projections that generally cover a period of five years and are based on the financial plans approved by the Company’s management.
Due to the expected continuation of high growth in the relevant online retail markets, we project cash flow for bol.com and Peapod over 10-year periods to better reflect the growth expectations in sales, profitability and cash
generation after the first five-year projection period. The key assumptions for the value-in-use calculations relate to discount rate, sales growth and operating margin. The post-tax rates used to discount the projected cash flows
reflect specific risks relating to relevant CGUs and are 6.0% for Ahold USA, 5.9% for the Netherlands, 10.6% for bol.com and 6.6% for the Czech Republic. The sales growth rates and operating margins used to estimate
future performance are based on past performance and our experience of growth rates and operating margins achievable in Ahold’s main markets. The average annual compound sales growth rates applied in the projected
period ranged between 13.8% and 14.0% for the CGUs of our online business and ranged between 1.3% and 5.0% for the other CGUs. The average operating margins applied in the projected period ranged between
1.2% and 2.0% for the CGUs of our online business and ranged between 3.0% and 6.1% for the other CGUs. Growth rates used to extrapolate cash flows beyond the explicit forecast period are set such that the return on
invested capital never exceeds the weighted average cost of capital of the CGUs.
The sensitivity analyses indicated that the recoverable amounts of the CGUs would still be in excess of the carrying amounts with sufficient and reasonable headroom if the relevant discount rates for the CGUs were higher by
2% or the sales growth rates in the projected period were lower by 2%. Should the operating margin of bol.com be reduced by approximately 95 basis points in the projected period, the carrying value of this CGU would
equal the recoverable amount.
Lease-related intangible assets consist primarily of favorable operating lease contracts acquired in business acquisitions. Customer relationships consist primarily of pharmacy scripts and customer lists recognized through the
acquisition of bol.com in 2012. Brand names include the name “bol.com.” Ahold expects that bol.com will play an important role in its business strategy and believes there is currently no foreseeable limit to the period over
which the brand is expected to generate net cash inflows. Therefore the brand is assessed to have an indefinite useful life. The asset is tested for impairment in accordance with the policies as stated in Note 3. “Other” mainly
includes intangible assets related to location development rights, deed restrictions and similar assets. Included in “Other” is an intangible asset allocated to Stop & Shop New England with an indefinite useful life and a carrying
value of €28 million (2013: €25 million). The useful life of this asset is assessed to be indefinite since it relates to the land portion of an owned location. Also included in 2014 is the prepaid purchase consideration for the
transfer of C1000 stores of €74 million (2013: €127 million). The amount will be reallocated to the appropriate intangible assets (mainly goodwill) as agreements are reached with the franchisees. In 2014, Ahold recognized
an €8 million impairment loss for the prepaid consideration.
Intangible assets under development relate mainly to software development. Amortization of software in 2014 includes €10 million of accelerated amortization that resulted from a re-evaluation of the useful lives. In 2013, there
was a €8 million write-down of capitalized software development costs.
Ahold at a glance
Business review
Governance
Financials
Investors
Notes to the consolidated financial statements
94
Ahold
Annual Report 2014
14 Investments in joint ventures and associates
On February 10, 2013 Ahold reached a sale agreement with Hakon Invest regarding its 60% holding in ICA for SEK 20 billion. The transaction was completed on March 27, 2013. For a description of the result on the
divestment of ICA, see Note 5.
In 1992, Ahold partnered with Jerónimo Martins, SGPS, S.A. in the joint venture JMR – Gestão de Empresas de Retalho, SGPS S.A. (JMR). Ahold holds 49% of the shares in JMR and shares equal voting power on JMR’s
board of directors with Jerónimo Martins, SGPS, S.A. JMR operates food retail stores in Portugal under the brand name Pingo Doce. JMR is a joint venture and is accounted for using the equity method. There is no quoted
market price available.
Ahold is also a partner in various smaller joint arrangements and associates that are individually not material to the Group. Ahold does not have subsidiaries with non-controlling interests that are material to the Group.
Changes in the carrying amount of Ahold’s interest in joint ventures and associates are as follows:
€ million
JMR
2014
Beginning of the year
Share in income of joint ventures
Share in income of joint ventures classified as discontinued operations
Dividend
Investments classified from / (to) held for sale or sold
Other changes in equity of joint ventures
Exchange rate differences
End of the year
167
22
—
(17)
—
1
—
173
Other
2014
30
2
—
(1)
—
—
2
33
Total
2014
JMR
2013
ICA
2013
197
24
—
(18)
—
1
2
206
184
9
—
(26)
—
—
—
167
803
—
(2)
—
(828)
—
27
—
Share in profit from continuing operations for Ahold’s interests in all individually immaterial joint ventures was €2 million (2013: €1 million) and nil for individually immaterial associates (2013: nil).
Other
2013
30
1
—
(1)
—
—
—
30
Total
2013
1,017
10
(2)
(27)
(828)
—
27
197
Ahold at a glance
Business review
Governance
Financials
Investors
Notes to the consolidated financial statements
Ahold
Annual Report 2014
95
14 Investments in joint ventures and associates (continued)
Set out below is the summarized financial information for JMR (on a 100% basis).
€ million
Summarized balance sheet
Current
Cash and cash equivalents
Other current assets
Total current assets
Financial liabilities (excluding trade payables)
Other current liabilities
Total current liabilities
Non-current
Assets
Financial liabilities
Other liabilities
Total non-current liabilities
Net assets
Net assets attributable to JMR
Net assets attributable to non-controlling interest
€ million
Summarized statement of comprehensive income
Net sales
Depreciation and amortization
Interest income
Interest expense
Income tax expense
Profit from continuing operations
Net income
Net income attributable to JMR
Net income attributable to non-controlling interest
Other comprehensive income
Total comprehensive income attributable to JMR
1 Comparative figures for JMR have been adjusted to reflect changes in presentation within the joint venture. There is no impact on net income attributable to JMR.
JMR
2014
JMR1
2013
74
312
386
(250)
(879)
(1,129)
106
297
403
(151)
(832)
(983)
1,121
—
(29)
(29)
349
354
(5)
1,171
(228)
(25)
(253)
338
341
(3)
JMR
2014
3,565
(100)
—
(13)
(19)
44
44
46
(2)
1
47
JMR1
2013
3,499
(102)
1
(23)
(26)
17
17
18
(1)
1
19
Ahold at a glance
Business review
Governance
Financials
Investors
Notes to the consolidated financial statements
Ahold
Annual Report 2014
96
14 Investments in joint ventures and associates (continued)
The information presented below represents a reconciliation of the summarized financial information presented above to the carrying amount of JMR.
€ million
JMR
2014
JMR
2013
Opening net assets attributable to JMR
Net income
Other comprehensive income
Dividend
Closing net assets attributable to JMR
Interest in joint venture
Carrying value
341
46
1
(34)
354
49%
173
375
18
1
(53)
341
49%
167
Commitments and contingent liabilities in respect of joint ventures and associates
There are no contingent liabilities or significant restrictions relating to the Company’s interest in the joint ventures and associates. The commitments are presented in Note 31.
15 Other non-current financial assets
€ million
Derivative financial instruments
Defined benefit asset
Reinsurance assets
Loans receivable
Other
Total other non-current financial assets
December 28,
2014
December 29,
2013
310
5
117
36
14
482
278
5
89
32
11
415
For more information on derivative financial instruments and fair values, see Note 30.
The defined benefit asset represents defined benefit pension plans for which the fair value of plan assets exceeds the present value of the defined benefit obligations. For more information on defined benefit plans,
see Note 23.
Of the non-current loans receivable, €18 million matures between one and five years and €18 million after five years (December 29, 2013: €17 million between one and five years and €15 million after five years). The current
portion of loans receivable of €4 million is included in other receivables (December 29, 2013: €5 million).
Part of the self-insured risk is ceded under a reinsurance treaty, which is a pooling arrangement between unrelated companies. At the same time, Ahold assumes a share of the reinsurance treaty risks that is measured by
Ahold’s participation percentage in the treaty. The participation percentage is the ratio of premium paid by Ahold to the total premium paid by all treaty members. In connection with this pooling arrangement, the Company
recognizes reinsurance assets and reinsurance liabilities (see also Notes 18, 22 and 26) on its balance sheet. There were no significant gains or losses related to this pooling arrangement during 2014 or 2013.
Ahold at a glance
Business review
Governance
Financials
Investors
Notes to the consolidated financial statements
Ahold
Annual Report 2014
97
16 Inventories
€ million
Finished products and merchandise inventories
Raw materials, packaging materials, technical supplies and other
Total inventories
December 28,
2014
December 29,
2013
1,543
46
1,589
1,410
40
1,450
In 2014, €664 million has been recognized as a write-off of inventories in the income statement (2013: €644 million). The write-off of inventories is Ahold’s best estimate based on significant assumptions applied to certain
products measured using the retail method.
17 Receivables
December 28,
2014
€ million
390
203
155
748
(20)
728
Trade receivables
Vendor allowance receivables
Other receivables
Provision for impairment
Total receivables
December 29,
2013
358
191
135
684
(19)
665
The receivable balances are presented net of accounts payable subject to an enforceable netting arrangement between the Company and the counterparty. The total effect of netting as of December 28, 2014 is €136 million
(December 29, 2013: €136 million, adjusted from last year’s disclosure of €114 million).
At December 28, 2014, the aging analysis of receivables was as follows:
Past due
€ million
Trade receivables
Vendor allowance receivables
Other receivables
Provision for impairment
Total receivables
Total
390
203
155
748
(20)
728
Not past
due
288
173
94
555
—
555
Receivables that were past due but not impaired relate to a number of independent customers for whom there is no recent history of default.
0-3
months
60
25
41
126
(2)
124
3-6
months
11
3
13
27
(1)
26
6-12
months
14
1
1
16
(2)
14
> 12
months
17
1
6
24
(15)
9
Ahold at a glance
Business review
Governance
Financials
Investors
Notes to the consolidated financial statements
Ahold
Annual Report 2014
98
17 Receivables (continued)
At December 29, 2013, the aging analysis of receivables was as follows:
Past due
€ million
Trade receivables
Vendor allowance receivables
Other receivables
Provision for impairment
Total receivables
Total
358
191
135
684
(19)
665
Not past
due
282
152
84
518
—
518
0–3
months
49
35
28
112
(2)
110
3–6
months
11
3
13
27
(1)
26
6–12
months
> 12
months
4
1
5
10
(2)
8
12
—
5
17
(14)
3
The concentration of credit risk with respect to receivables is limited, as the Company’s customer base and vendor base are large and unrelated. The Company does not hold any significant collateral on its receivables.
Management believes there is no further credit risk provision required in excess of the normal individual and collective impairment, based on the aging analysis performed as of December 28, 2014. For more information
about credit risk, see Note 30.
The changes in the provision for impairment were as follows:
€ million
Beginning of the year
Released / (charged) to income
Used
Exchange rate differences
End of the year
2014
(19)
(8)
7
—
(20)
2013
(17)
(9)
6
1
(19)
18 Other current financial assets
€ million
Short-term deposits and similar instruments
Reinsurance assets – current portion (see Note 15)
Other
Total other current financial assets
December 28,
2014
December 29,
2013
262
60
1
323
1,467
47
6
1,520
As per December 28, 2014, short-term deposits and similar instruments included short-term investments with a maturity at acquisition of between three and twelve months.
Of the short-term deposits and similar instruments as of December 28, 2014, €16 million was restricted (December 29, 2013: €15 million). This primarily consisted of investments held for insurance purposes for U.S. workers’
compensation and general liability programs.
Other mainly consists of the current portion of the derivative financial instruments. For more information on financial instruments and fair values, see Note 30.
Ahold at a glance
Business review
Governance
Financials
Investors
Notes to the consolidated financial statements
99
Ahold
Annual Report 2014
19 Cash and cash equivalents
€ million
Cash in banks and cash equivalents
Cash on hand
Total cash and cash equivalents
December 28,
2014
December 29,
2013
1,281
343
1,624
2,206
290
2,496
Of the cash and cash equivalents as of December 28, 2014, €9 million was restricted (December 29, 2013: €4 million). This primarily consisted of cash held in escrow accounts mainly related to pending litigations and
construction activities.
Ahold’s banking arrangements allow the Company to fund outstanding checks when presented to the bank for payment. This cash management practice may result in a net cash book overdraft position, which occurs when
the total issued checks exceed available cash balances within the Company’s cash concentration structure. Such book overdrafts are classified in accounts payable and amounted to €184 million and €166 million as of
December 28, 2014, and December 29, 2013, respectively. No right to offset with other bank balances exists for these book overdraft positions.
20 Equity attributable to common shareholders
Shares and share capital
Authorized share capital is comprised of the following classes of shares as of December 28, 2014:
€ million
Common shares (2014: 1,700,000,000 of €0.01 par value each, 2013: 1,700,000,000 of €0.30 par value each)
Cumulative preferred shares (2014: 43,520 of €500 par value each, and 2013: 1,250,000 of €500 par value each)
Total authorized share capital
2014
2013
17
22
39
510
625
1,135
In addition, Ahold has cumulative preferred financing shares outstanding. These cumulative preferred financing shares are considered debt under IFRSs until the date that Ahold receives irrevocable notification from a holder
of cumulative preferred financing shares to convert these shares into common shares. Upon this notification, the cumulative preferred financing shares are classified as a separate class of equity since they no longer meet the
definition of a liability. For disclosures regarding Ahold’s cumulative preferred financing shares, see Note 22.
Common shares and additional paid-in capital
Changes in the number of common shares and the number of treasury shares were as follows:
Number of common
shares issued and fully
paid (x1,000)
Balance as of December 30, 2012
Share buyback
Share-based payments
Balance as of December 29, 2013
Share buyback
Reverse stock split
Cancellation of treasury shares
Share-based payments
Balance as of December 28, 2014
1,060,988
—
—
1,060,988
—
(81,615)
(85,000)
—
894,373
Number of treasury
shares (x 1,000)
22,481
61,009
(4,995)
78,495
92,485
(7,999)
(85,000)
(6,205)
71,776
Number of common
shares outstanding
(x 1,000)
1,038,507
(61,009)
4,995
982,493
(92,485)
(73,616)
—
6,205
822,597
Ahold at a glance
Business review
Governance
Financials
Notes to the consolidated financial statements
Investors
Ahold
Annual Report 2014
100
20 Equity attributable to common shareholders (continued)
Dividends on common shares
On April 16, 2014, the General Meeting of Shareholders approved the dividend over 2013 of €0.47 per common share (€414 million in the aggregate). This dividend was paid on May 2, 2014. The Management Board,
with the approval of the Supervisory Board, proposes that a dividend of €0.48 per common share be paid in 2015 with respect to 2014. This dividend is subject to approval by the General Meeting of Shareholders and has
not been included as a liability on the consolidated balance sheet as of December 28, 2014. The payment of this dividend will not have income tax consequences for the Company.
Share buyback
On December 12, 2014, Ahold completed its share buyback program initially announced as €500 million on February 28, 2013, and subsequently increased to €2 billion on June 4, 2013. Under this program,
153,494,149 of the Company’s own shares were repurchased and delivered in 2013 and 2014 (2013: 61,008,851 and 2014: 92,485,298) for a total consideration of €2 billion (2013: €768 million and
2014: €1,232 million), at an average price of €13.03 (2013: €12.58 and 2014: €13.32).
Of the total shares repurchased, 85,000,000 were canceled on June 20, 2014.
Capital repayment and reverse stock split
On January 21, 2014, a capital repayment and reverse stock split was approved at an Extraordinary General Meeting of Shareholders. On March 28, 2014, the reverse stock split became effective. Every 13 existing shares
with a nominal value of €0.30 each were consolidated into 12 new shares with a nominal value of €0.01 each. The capital repayment of €1.14 per remaining share, €1,007 million in the aggregate (excluding transaction
costs), took place on April 3, 2014. The capital reduction attributable to treasury shares, which was €109 million in the aggregate, is reported in Other reserves.
Share-based payments
Share-based payments recognized in equity in the amount of €50 million (2013: €61 million) relate to the 2014 GRO share-based compensation expenses of €43 million (2013: €43 million), see Note 32; the stock options
exercised of €1 million (2013: €6 million); and the current and deferred income taxes recognized in and transferred from equity relating to share-based compensation of €6 million (2013: €12 million), see Note 10.
Cumulative preferred shares
The Company’s Articles of Association provide for the possible issuance of cumulative preferred shares. The Company believes that its ability to issue this class of shares could prevent, or at least delay, an attempt by a
potential bidder to make a hostile takeover bid. Moreover, outside the scope of a public offer, but also in other circumstances, this ability may safeguard the interests of the Company and all stakeholders in the Company and
resist influences that might conflict with those interests by affecting the Company’s continuity, independence or identity. No cumulative preferred shares were outstanding as of December 28, 2014, or during 2014 and 2013.
In March 1989, the Company entered into an agreement with Stichting Ahold Continuïteit (SAC) as amended and restated in April 1994, March 1997, December 2001, and December 2003 (the Option Agreement).
Pursuant to the Option Agreement, SAC was granted an option for no consideration to acquire cumulative preferred shares from the Company, from time to time until December 2018, up to a total par value that is equal to the
total par value of all issued and outstanding shares of Ahold’s share capital, excluding cumulative preferred shares, at the time of exercising the option. In case the authorized share capital of the Company is amended during
the term of the option, the Option Agreement provides for a corresponding change of the total par value of cumulative preferred shares under option. The holders of the cumulative preferred shares are entitled to 50,000 votes
per share and a cumulative dividend expressed as a percentage of the amount called-up and paid-in to purchase the cumulative preferred shares. The percentage to be applied is the sum of (1) the average basic refinancing
transaction interest rate as set by the European Central Bank – measured by the number of days during which that rate was in force in the fiscal year over which the dividend is paid – plus 2.1%, and (2) the average interest
surcharge rate – measured by the number of days during which that rate was in force in the fiscal year over which the dividend is paid – that would be charged by the largest credit institution in the Netherlands (based on the
balance sheet total as of the close of the fiscal year immediately preceding the fiscal year over which the dividend is paid). The minimum percentage to be applied is 5.75%. Subject to limited exceptions, any potential transfer
of cumulative preferred shares requires the approval of the Management Board. Cumulative preferred shares can only be issued in a registered form. The Company may stipulate that only 25% of the par value will be paid
upon subscription to cumulative preferred shares until payment in full is later required by the Company. SAC would then only be entitled to a market-based interest return on its investment.
SAC is a foundation organized under the laws of the Netherlands. Its statutory purpose is to safeguard the interests of the Company and all stakeholders in the Company and to resist, to the best of its ability, influences that
might conflict with those interests by affecting the Company’s continuity, independence or identity. In the case of liquidation, the SAC board of directors will decide on the use of any remaining residual assets. The SAC board
of directors has four members, who are appointed by the board of SAC itself.
Legal reserves
In accordance with the Dutch Civil Code and statutory requirements in other countries, legal reserves have to be established in certain circumstances. Legal reserves are not available for distribution to the Company’s
shareholders. The currency translation reserve, cash flow hedging reserve and other reserves include non-distributable amounts. Of the total equity as per December 28, 2014, of €4,844 million, an amount of €219 million is
non-distributable (December 29, 2013: €513 million out of total equity of €6,520 million). See Note 8 to the parent company financial statements for more detail on the legal reserves.
Ahold at a glance
Business review
Governance
Financials
Investors
Notes to the consolidated financial statements
Ahold
Annual Report 2014
101
21 Loans and credit facilities
The notes in the table below were issued by Ahold or one of its subsidiaries, the latter of which are guaranteed by Ahold unless otherwise noted. All related swap contracts have the same maturity as the underlying debt unless
otherwise noted.
€ million
Notional redemption amounts
GBP 500 notes 6.50%, due March 20171
USD 94 indebtedness 7.82%, due January 20202
USD 71 indebtedness 8.62%, due January 2025
USD 500 notes 6.875%, due May 2029
JPY 33,000 notes LIBOR plus 1.5%, due May 20313
Deferred financing costs
Total notes
Other loans
Financing obligations4
Mortgages payable5
Total loans
Current
portion
within
1 year
—
8
—
—
—
—
8
—
20
2
30
Non-current portion
Between
1 to 5 years
310
31
—
—
—
(1)
340
1
92
2
435
After
5 years
—
—
58
411
225
(2)
692
2
275
6
975
Total
December 28,
2014
310
39
58
411
225
(3)
1,040
3
387
10
1,440
Current
portion
within
1 year
Non-current portion
Between
1 to 5 years
—
6
—
—
—
—
6
—
14
2
22
288
29
—
—
—
(1)
316
2
64
3
385
After
5 years
—
6
52
364
228
(2)
648
1
268
5
922
Total
December 29,
2013
288
41
52
364
228
(3)
970
3
346
10
1,329
1 During 2005, Ahold bought back GBP 250 million of the notes. The remaining notional redemption amount of GBP 250 million (€319 million) has been netted with €9 million as per December 28, 2014, (December 29, 2013: €12 million) representing an amount, amortized over the remaining terms
of the notes, that relates to a hedging instrument that stopped qualifying for fair value hedge accounting. The remaining notional amount of the GBP 250 million was swapped to U.S. dollars (see Note 30 for additional information).
2 As of December 28, 2014, $47 million has been repaid since inception.
3 Notes were swapped to €299 million at an interest rate of 7.065% (see Note 30 for additional information related to the JPY cross-currency swap).
4 The weighted average interest rate for the financing obligations amounted to 7.7% in 2014 (2013: 7.9%).
5 Mortgages payable are collateralized by buildings and land. The weighted average interest rate for these mortgages payable amounted to 5.6% in 2014 (2013: 5.9%).
The fair values of financial instruments, corresponding derivatives, and the foreign exchange and interest rate risk management policies applied by Ahold are disclosed in Note 30.
The Company has a Euro Medium Term Note (EMTN) program that had an aggregate of €544 million of outstanding notes as of December 28, 2014. The notes issued under the program include the remaining outstanding
balances of GBP 500 million and JPY 33,000 million notes, maturing in 2017 and 2031, respectively. The notes issued under the EMTN program contain customary restrictive covenants. During 2014, Ahold was in
compliance with these covenants.
Credit facilities
Ahold has access to a €1.2 billion unsecured, committed, multi-currency and syndicated credit facility that was refinanced in June 2011 and will mature in 2018. This credit facility may be used for working capital and for
general corporate purposes and provides for the issuance of letters of credit to an aggregate maximum amount of $550 million (€452 million). A bilateral facility for standby Letter of Credit was signed in 2014 for a total
amount of $218 million (€179 million), and was fully used per December 28, 2014.
The €1.2 billion facility contains customary covenants and is subject to a financial covenant that requires Ahold not to exceed a maximum leverage ratio, as defined in the facility agreement, of 4.0:1. During 2014, Ahold was
in compliance with these covenants. As of December 28, 2014, there were no outstanding borrowings under the facility other than letters of credit to an aggregate amount of $16 million (€13 million). In the beginning of 2015,
Ahold issued a request to our relationship banks to amend the facility by extending it through 2020 and reducing the amount from €1.2 billion down to €1 billion. Ahold expects to close the process during the first quarter
of 2015.
Ahold also has access to various uncommitted credit facility lines serving working capital needs that, as of December 28, 2014, totaled €219 million. As of December 28, 2014, €0.3 million was drawn under these credit
facility lines.
Ahold at a glance
Business review
Governance
Financials
Investors
Notes to the consolidated financial statements
Ahold
Annual Report 2014
102
22 Other non-current financial liabilities
€ million
Finance lease liabilities
Cumulative preferred financing shares
Derivative financial instruments
Reinsurance liabilities
Other
Total other non-current financial liabilities
December 28,
2014
December 29,
2013
1,125
497
250
126
41
2,039
1,069
497
182
100
34
1,882
For more information on derivative financial instruments and fair values, see Note 30.
The Company recognizes reinsurance liabilities on its balance sheet in connection with a pooling arrangement between unrelated companies. For more information, see Note 15.
Other mainly consists of a pre-tax liability for the discounted amount of the remaining settlement liability of $34 million (€28 million) relating to an agreement with the New England Teamsters and Trucking Industry Pension Fund
(NETTI) to settle Stop & Shop’s pension liabilities in the fund, see Note 23.
Ahold at a glance
Business review
Governance
Financials
Investors
Notes to the consolidated financial statements
Ahold
Annual Report 2014
103
22 Other non-current financial liabilities (continued)
Finance lease liabilities
Finance lease liabilities are payable as follows:
December 28, 2014
December 29, 2013
Future
minimum
lease
payments
Interest
portion
Present
value of
minimum
lease
payments
Within one year
Between one and five years
After five years
Total
179
681
1,003
1,863
91
284
275
650
88
397
728
1,213
162
629
1,011
1,802
87
281
274
642
75
348
737
1,160
Continuing operations
Discontinued operations
Total
1,863
—
1,863
650
—
650
1,213
—
1,213
1,779
23
1,802
636
6
642
1,143
17
1,160
€ million
Current portion finance lease liabilities (see Note 26)
Current portion finance lease liabilities included in
“liabilities related to assets held for sale” (see Note 5)
Non-current portion finance lease liabilities included in
“liabilities related to assets held for sale” (see Note 5)
Non-current portion finance lease liabilities
Future
minimum
lease
payments
Interest
portion
Present
value of
minimum
lease
payments
88
74
—
1
—
1,125
16
1,069
Finance lease liabilities are principally for buildings. Terms range primarily from 10 to 25 years and include renewal options if it is reasonably certain, at the inception of the leases, that they will be exercised. At the time of
entering into a finance lease agreement, the commitment is recorded at its present value using the interest rate implicit in the lease, if this is practicable to determine; if not, the operating company-specific interest rate applicable
for long-term borrowings is used. As of December 28, 2014, the finance lease liabilities are recorded at their present value at a weighted average interest rate of 7.7% (December 29, 2013: 7.8%).
Certain store leases provide for contingent additional rentals based on a percentage of sales and consumer price indices. Substantially all of the store leases have renewal options for additional terms. None of Ahold’s leases
impose restrictions on Ahold’s ability to pay dividends, incur additional debt or enter into additional leasing arrangements.
During 2014, interest expense on finance lease liabilities was €90 million (2013: €95 million), of which nil related to discontinued operations (2013: €2 million). Total future minimum sublease income expected to be received
under non-cancelable subleases as of December 28, 2014, is €107 million (December 29, 2013: €116 million). The total contingent rent expense recognized during the year on finance leases was €2 million income
(2013: €4 million expense).
Ahold at a glance
Business review
Governance
Financials
Notes to the consolidated financial statements
Investors
Ahold
Annual Report 2014
104
22 Other non-current financial liabilities (continued)
Cumulative preferred financing shares
Issued cumulative preferred financing shares (€0.01 par value each)
Authorized cumulative preferred financing shares (€0.01 par value each)
€ million
Paid-in capital issued cumulative preferred financing shares
Additional paid-in capital cumulative preferred financing shares
Balance as of year-end
Number
of shares
(x 1,000)
€ million
268,415
477,581
3
5
December 28,
2014
December 29,
2013
3
494
497
81
416
497
On January 21, 2014, a reduction in the nominal value of the cumulative preferred financing shares (from €0.30 to €0.01) was approved at an Extraordinary General Meeting of Shareholders. The amount related to this
reduction has not been paid back in cash to the holders of these shares, but has been added to the additional paid-in capital. The reduction in nominal value per share resulted in a decrease in the total nominal value of the
issued cumulative preferred financing shares of €78 million to €3 million and a decrease of the total nominal value of the authorized cumulative preferred financing shares of €138 million to €5 million.
The paid-in capital for the issued cumulative preferred financing shares decreased by €78 million from €81 million to €3 million and the additional paid-in capital related to the cumulative preferred financing shares increased
by €78 million from €416 million to €494 million. The aggregate of the paid-in capital for issued cumulative preferred financing shares and the related additional paid-in capital remained unchanged at €497 million.
This amount is presented under “other non-current financial liabilities” in the consolidated balance sheet as these cumulative preferred financing shares are considered debt under IFRS.
The cumulative preferred financing shares were issued in four tranches. Dividends are paid on each preferred financing share at a percentage (financing dividend percentage) that differs per tranche. When a period of
10 years has lapsed after the issue date of a tranche, and every 10 years thereafter (reset date), the financing dividend percentage is reset. The current financing dividend percentage is 5.93% per year for the shares issued
in June 1996, 6.08% per year for the shares issued in August 1998, 3.85% per year for the shares issued in October 2000, and 3.35% per year for the shares issued in December 2003. The nominal value plus additional
paid-in capital per tranche is €71 million (June 1996 tranche), €46 million (August 1998 tranche), €320 million (October 2000 tranche) and €60 million (December 2003 tranche); in the aggregate €497 million.
The total number of votes that can be exercised by the cumulative preferred financing shares is approximately 75 million. This represents approximately 8% of the total number of votes that can be cast (this total being calculated
as the sum of the outstanding cumulative preferred financing shares and the outstanding common shares).
The cumulative preferred financing shares are convertible into common shares. The conversion conditions have been set so as to avoid any transfer of value from the common shares to the cumulative preferred financing shares.
The maximum number of common shares to be received upon conversion of all outstanding cumulative preferred financing shares is approximately 90 million. The conversion features are similar for all tranches. Conversion is
allowed for all shares in one tranche held by one investor but not for fractions of tranches held by one investor. Upon conversion, the holders of (depositary receipts of) cumulative preferred financing shares will receive a
number of common shares that is calculated by dividing the value of the cumulative preferred financing shares on the day before the conversion date by the average share price of Ahold common shares on the five trading
days preceding the notification date, on the notification date, and on the four trading days following the notification date. The value of the cumulative preferred financing shares will be considered, for this purpose, to be equal
to the lower of the nominal value plus the additional paid-in capital of the cumulative preferred financing shares (par value) or to the present value of the remaining preferred dividends until the first reset date plus the present
value of the par value at the first reset date.
Subject to the approval of the General Meeting of Shareholders, the Company can redeem the cumulative preferred financing shares of a certain tranche, but not fractions of a tranche. Redemption of a tranche is subject to
the approval of the holders of depositary receipts of that tranche, unless all (remaining) cumulative preferred financing shares are redeemed. Redemption takes place at the higher of the par value or the present value of the
remaining preferred dividends plus the present value of the par value at the reset date.
Ahold at a glance
Business review
Governance
Financials
Investors
Notes to the consolidated financial statements
Ahold
Annual Report 2014
105
23 Pensions and other post-employment benefits
Defined benefit plans
Ahold has a number of defined benefit pension plans covering a substantial number of employees, former employees and retirees in the Netherlands and the United States. Generally, the plans are career average or final pay
defined benefit plans. In addition, Ahold provides additional pension benefits for certain company executives and life insurance and medical care benefits for certain retired employees meeting age and service requirements at
its U.S. subsidiaries, all of which the Company funds as claims are incurred.
The pension plans expose the Company to actuarial risks such as: longevity risk, interest rate risk, currency risk, salary risk and investment risk. Longevity risk relates to the mortality assumptions used to value the defined
benefit obligation, where an increase in participants’ life expectancies will increase a plan’s liability. Interest rate risk relates to the discount rate used to value the defined benefit obligation, where a decrease in the discount
rate will increase a plan’s liability; however this will be partially offset by an increase in the return on a plan’s investments in debt instruments. The pension plans may mitigate interest rate risk by entering into interest rate swap
contracts. Currency risk relates to the fact that a plan holds investments that may not be denominated in the same currency as the plan’s obligations. The pension plans may mitigate currency risk by purchasing forward currency
instruments. Salary risk relates to salary increase assumptions used to value the defined benefit obligation, where an increase will result in a higher plan liability. See below for more details on the Company’s asset-liability
matching strategy employed to manage its investment risk.
Net assets relating to one plan are not offset against net liabilities of another plan, resulting in the following presentation of the pension and other post-employment benefits on the consolidated balance sheet:
€ million
Defined benefit liabilities
Defined benefit assets
Total defined benefit plans
December 28,
2014
(290)
5
(285)
December 29,
2013
(348)
5
(343)
The defined benefit assets are part of the other non-current financial assets; for more information, see Note 15.
Net defined benefit cost is comprised of the following components. The net interest (income) expense is presented within net financial expenses in the income statement and plan remeasurements are presented as other
comprehensive income. All other components of net defined benefit cost are presented in the income statement as cost of sales, selling expenses, and general and administrative expenses, depending on the functional areas of
the employees earning the benefits.
€ million
2014
2013
Service cost
Current service cost
Past service cost gain
Gain on settlement
Net interest expense
Administrative cost
Components of defined benefit cost recorded in the income statement
104
(68)
—
16
9
61
119
—
(9)
24
8
142
Remeasurements recognized:
Return on plan assets, excluding amounts included in net interest (income) / cost
Loss from changes in demographic assumptions
(Gain) loss from changes in financial assumptions
Experience gains (losses)
Components of defined benefit cost recognized in other comprehensive income
Total net defined benefit cost
(698)
53
650
20
25
86
102
13
(298)
(47)
(230)
(88)
Ahold at a glance
Business review
Governance
Financials
Investors
Notes to the consolidated financial statements
Ahold
Annual Report 2014
106
23 Pensions and other post-employment benefits (continued)
The changes in the defined benefit obligations and plan assets in 2014 and 2013 were as follows:
The Netherlands
€ million
2014
2013
United States
2014
2013
Total
2014
2013
Defined benefit obligations
Beginning of the year
Current service cost
Past service cost
Gain on settlements
Interest expense
Contributions by plan participants
Benefits paid
Settlement payments
(Gain) loss from changes in demographic assumptions
(Gain) loss from changes in financial assumptions1
Experience (gains) losses
Exchange rate differences
End of the year
3,372
87
(59)
—
124
18
(87)
—
21
527
24
—
4,027
3,433
98
—
—
125
16
(94)
—
(3)
(157)
(46)
—
3,372
1,020
17
(9)
—
52
—
(65)
—
32
123
(4)
142
1,308
1,350
21
—
(9)
49
—
(60)
(164)
16
(141)
(1)
(41)
1,020
4,392
104
(68)
—
176
18
(152)
—
53
650
20
142
5,335
4,783
119
—
(9)
174
16
(154)
(164)
13
(298)
(47)
(41)
4,392
Plan assets
Fair value of assets, beginning of the year
Interest income
Company contribution
Contributions by plan participants
Benefits paid
Settlement payments
Administrative cost
Return on plan assets, excluding amounts included in net interest (income) expense
Exchange rate differences
Fair value of assets, end of the year
3,195
115
116
18
(87)
—
(7)
643
—
3,993
3,191
114
122
16
(94)
—
(4)
(150)
—
3,195
854
45
53
—
(65)
—
(2)
55
117
1,057
972
36
61
—
(60)
(164)
(4)
48
(35)
854
4,049
160
169
18
(152)
—
(9)
698
117
5,050
4,163
150
183
16
(154)
(164)
(8)
(102)
(35)
4,049
(34)
(177)
(251)
(166)
(285)
(343)
Funded status
1 The 2014 loss of €527 million from changes in financial assumptions in the Netherlands’ plans included a €1,005 million loss resulting from a decrease in the discount rate, offset by a €474 million gain resulting from a decrease in the future pension increase assumption.
The total defined benefit obligation of €5,335 million as of December 28, 2014, includes €99 million related to plans that are wholly unfunded. These plans include other benefits (such as life insurance and medical care)
and supplemental executive retirement plans.
Ahold at a glance
Business review
Governance
Financials
Investors
Notes to the consolidated financial statements
107
Ahold
Annual Report 2014
23 Pensions and other post-employment benefits (continued)
During 2014, Ahold amended its defined benefit pension plan in the Netherlands. The plan amendments included, among other changes, raising the retirement age to 67, introducing a maximum pensionable salary limit
of €96,542, lowering the pensionable salary threshold by €1,000 and declaring that future pension increases for active participants will now be based on the price inflation instead of salary increases. The effect of all
amendments was a net past service cost gain in the income statement of €59 million.
During 2014, Ahold amended a defined benefit plan in the United States that provides medical and prescription drug benefits to retirees. The plan amendment was to convert the plan from a self-insured plan to a fully insured
employer group waiver program and to change employer subsidies. The effect of the amendment was a past service cost gain in the income statement of $12 million (€9 million).
During 2013, Ahold changed the way it accounts for the contributions it makes to prepay disbursement costs that will be incurred when future benefits are paid to beneficiaries. These costs were previously included in the
defined benefit obligation of the pension plan for the Netherlands, but are now expensed as contributions are made. This change resulted in a reduction of the 2013 year-end defined benefit obligation of €102 million,
which was treated as a remeasurement and recognized within other comprehensive income.
In 2008, the Company decided to transition its defined benefit pension plan for active salaried, non-union and certain union employees (“eligible employees”) in the United States to a defined contribution pension plan.
Eligible employees who were at least 50 years of age or had 25 or more years of service as of December 31, 2009, could choose to either stay in the defined benefit plan or transfer to a 401(k) plan. All other eligible
employees were transferred to a 401(k) plan. Accrued benefits under the defined benefit plan for employees transferred to a 401(k) plan were frozen for pay and service as of December 31, 2009 (frozen plan). The resulting
curtailment gain in 2008 was largely offset by accrued additional (transition) contributions to be made by the Company to a 401(k) plan for a period of five years (2010-2014) for employees meeting certain age or
service requirements who were transferred to a 401(k) plan. During 2012, the Company settled the frozen accrued benefits of participants who elected to receive a lump sum payout. At that time, the Company recognized
a settlement gain of €6 million. In 2013, the Company settled the remaining frozen accrued benefits by purchasing annuity contracts, which resulted in a further settlement gain of €9 million.
Cash contributions
From 2014 to 2015, Company contributions are expected to increase from €116 million to €117 million in the Netherlands and decrease from $71 million (€53 million) to $24 million (€19 million) in the United States.
As of year-end 2014, the funding ratio, calculated in accordance with regulatory requirements, of the largest Dutch plan was 117% and the U.S. pension plan was 127%. Under the financing agreement with the Dutch pension
fund, contributions are made as a percentage of employees’ salaries and shared between Ahold and the employees. The agreement also allows for a reduction in premiums if certain funding conditions are met. In addition,
Ahold can be required to contribute a maximum amount of €150 million over a five-year period if the funding ratio is below 105%. Contributions to the U.S. pension plan are required under the current funding policy if the
prior year-end funding ratio falls below 100% as measured under the Pension Protection Act in order to avoid variable Pension Benefit Guaranty Corporation (PBGC) premiums.
Actuarial assumptions
The calculations of the defined benefit obligation and net defined benefit cost are sensitive to the assumptions set out below. These assumptions require a large degree of judgment. Actual experience may differ from
the assumptions made. The assumptions required to calculate the actuarial present value of benefit obligations and the net defined benefit costs are determined per plan are as follows (expressed as weighted averages):
The Netherlands
Percent
Discount rate
Future salary increases
Future pension increases
United States
2014
2013
2014
2013
2.3
3.7
0.8
3.6
3.7
1.5
4.3
4.5
0.0
5.0
4.5
0.0
The decrease in the future pension increase assumption of the plan in the Netherlands is the result of the effect of the application of a liability ceiling to the measurement of the defined benefit obligation.
Ahold at a glance
Business review
Governance
Financials
Investors
Notes to the consolidated financial statements
Ahold
Annual Report 2014
108
23 Pensions and other post-employment benefits (continued)
Assumptions regarding longevity are based on published statistics and mortality tables. These assumptions translate into an average life expectancy in years for a pensioner retiring at age 65:
The Netherlands
Years
Longevity at age 65 for current pensioners
Male
Female
Longevity at age 65 for current members aged 50
Male
Female
United States
2014
2013
2014
2013
20.9
23.3
21.9
23.7
20.0
22.7
19.3
21.1
22.7
25.0
23.2
24.5
20.9
23.6
20.2
21.6
The following table summarizes how the effect on the defined benefit obligations at the end of the reporting period would have increased (decreased) as a result of a 0.5% change in the respective assumptions.
€ million
Discount rate
0.5% increase
0.5% decrease
Future salary increases
0.5% increase
0.5% decrease
Future pension increases
0.5% increase
0.5% decrease
Life expectancy
1 year increase at age 65
The Netherlands
United States
Total
(450)
533
(82)
92
(532)
625
62
(59)
7
(7)
69
(66)
493
(422)
N/A
N/A
493
(422)
137
41
178
The above sensitivity analyses have been based on a change in the assumption while holding all other assumptions constant. In reality one might expect interrelationships between the assumptions, especially between discount
rate and future salary increases as both depend to a certain extent on expected inflation rates. The methods and types of assumptions used in preparing the sensitivity analyses did not change compared to the previous period.
Ahold at a glance
Business review
Governance
Financials
Investors
Notes to the consolidated financial statements
Ahold
Annual Report 2014
109
23 Pensions and other post-employment benefits (continued)
Plan assets
The pension plan asset allocation differs per plan. On a weighted average basis, the allocation of plan assets was as follows:
The Netherlands
€ million
Equity instruments:
Consumer goods
Financial services
Telecommunications and information
Energy and utilities
Industry
Other
Debt instruments:
Government
Corporate bonds (investment grade)
Corporate bonds (non-investment grade)
Other
Real estate:
Retail
Offices
Residential
Other
Investment funds
Derivatives:
Interest rate swaps
Forward foreign exchange contracts
Cash and cash equivalents
Other
Total
United States
2014
2013
2014
2013
205
267
80
62
107
6
184
166
87
68
100
4
48
58
66
29
32
46
45
48
59
27
30
41
1,012
1,017
18
—
840
861
14
—
146
174
38
54
106
143
37
23
40
45
30
—
684
41
48
31
—
602
—
—
—
33
316
—
—
—
19
265
360
(45)
105
—
3,993
(22)
10
163
(2)
3,195
—
—
17
—
1,057
—
—
11
—
854
Virtually all equity and debt instruments have quoted prices in active markets. Derivatives can be classified as level 2 instruments and real estate and some investment funds as level 3 instruments based on the definitions
in IFRS 13, Fair value measurement. It is the policy of the Dutch pension plan to use interest rate swaps to hedge its exposure to interest rate risk. Foreign currency exposures are hedged by the use of forward foreign
exchange contracts.
Ahold at a glance
Business review
Governance
Financials
Investors
Notes to the consolidated financial statements
Ahold
Annual Report 2014
110
23 Pensions and other post-employment benefits (continued)
In the Netherlands, the plan assets are managed by outside investment managers following investment strategies based on the composition of the plan liabilities. With the aid of Asset Liability Management modeling,
analyses are made of possible future economic scenarios and investment portfolios. Based on these analyses, investment strategies are determined to produce optimal investment returns at acceptable funding ratio risk levels.
Less favorable years can be part of these scenarios. Currently, the strategic targets for asset allocation of the Dutch pension plan are: 40% variable yield and 60% fixed income. To partially hedge against interest rate risk
exposure on the pension liabilities, the Dutch pension plan uses interest rate swap contracts. The Dutch early retirement plan has a relatively short remaining term; therefore the plan assets are invested in short-term fixed income
securities and cash instruments only.
In the United States, the plan assets are managed by outside investment managers and rebalanced periodically. The committees for the various U.S. plans establish investment policies and strategies and regularly monitor the
performance of the assets, including the selection of investment managers, setting long-term strategic targets and monitoring asset allocations. Target allocation ranges are guidelines, not limitations, subject to variation from time
to time or as circumstances warrant. Occasionally, the committees may approve allocations above or below a target range. Pension plan assets are invested in a trust intended to comply with the Employee Retirement Income
Security Act of 1974, as amended, (ERISA) and applicable fiduciary standards. The long-term investment objective for the plan’s assets is to maintain an acceptable funding ratio between assets and plan liabilities without
undue exposure to risk. Currently, the strategic targets are: 45% equity securities, 45% debt securities and 10% other investments.
In 2014, the Dutch plans had €0.6 million of plan assets invested in Ahold’s financial instruments (2013: €3 million). In 2014 or 2013, the U.S. plans did not have any plan assets invested in Ahold financial instruments.
The actual return on plan assets in 2014 was 24.1% for the Dutch plans (2013: negative 1.0%) and 12.0% for the U.S. plans (2013: 9.2%).
Benefit maturities
The weighted average duration of the defined benefit obligations of the Dutch and U.S. plans are 25.4 and 14.1 years, respectively.
The Dutch and U.S. plans have the following expected schedule of benefit payments.
€ million
Amount due within one year
Amount due between two and five years
Amount due between six and ten years
The Netherlands
United States
Total
81
322
486
63
271
389
144
593
875
Ahold at a glance
Business review
Governance
Financials
Notes to the consolidated financial statements
Investors
Ahold
Annual Report 2014
111
23 Pensions and other post-employment benefits (continued)
Defined contribution plans
In the Netherlands, United States and Czech Republic, there are defined contribution plans principally in the form of savings, incentive compensation and bonus plans. In connection with the Company’s decision to transition
its defined benefit pension plan for active salaried, non-union and certain union employees in the United States to a defined contribution pension plan, as further described above, a new 401(k) plan was introduced as of
January 1, 2009.
During 2014 and 2013, the Company contributed €33 million and €34 million, respectively, to its defined contribution plans. These contributions were recognized as an expense in the income statement and related entirely
to continuing operations in 2014 and 2013.
Multi-employer plans
A significant number of union employees in the United States are covered by multi-employer plans based on obligations arising from collective bargaining agreements. These plans provide retirement and other benefits to
participants based on their service to contributing employers. The benefits are paid from assets held in trust for that purpose. Trustees are appointed in equal number by employers and unions and they are typically responsible
for oversight of the investment of the assets and administration of the plan. Contribution rates and benefit levels are generally determined through the collective bargaining process between the participating employers and
unions. None of the Company’s collective bargaining agreements require that a minimum funding requirement exists for these plans.
Most of these plans are defined contribution plans. All plans that are defined benefit plans, on the basis of the terms of the benefits provided, are accounted for as defined contribution plans because sufficient information is
not available to account for these plans as defined benefit plans. These plans are generally flat dollar benefit plans. Ahold is only one of several employers participating in each of these plans and there is no reliable basis to
accurately determine Ahold’s share of plan obligations and assets following defined benefit accounting principles. Furthermore, the financial statements of the multi-employer plans are drawn up on the basis of other accounting
policies than those applied by Ahold. Consequently, these multi-employer plans are not included in Ahold’s balance sheet.
The risks of participating in multi-employer plans are different from the risks of single employer plans. Ahold’s contributions may be used to provide benefits to employees of other participating employers. Ahold may become
obligated for a plan’s unfunded obligations if other participating employers cease to participate in the plan. Similarly, if a number of employers cease to have employees participating in the plan, Ahold could be responsible
for an increased share of the plan’s deficit. If Ahold withdraws from a plan, it may be required to pay the plan an amount based on the underfunded status of the plan, referred to as a withdrawal liability.
Defined benefit plans
Ahold participates in 13 multi-employer pension plans that are defined benefit plans on the basis of the terms of the benefits provided. The following table presents Ahold’s estimate of its proportionate share of each plan’s
deficit or surplus. Ahold’s participation is the relative amount of its contributions during the year in relation to the total amount of contributions made to the plan. The estimate of Ahold’s net proportionate share of the plans’
deficits is based on the latest available information received from these plans, such as the plans’ measurement of plan assets and the use of discount rates between 6.5% and 8.5%. The information received has been updated
for market trends and conditions through the end of 2014, and does not represent Ahold’s direct obligation. While this is our best estimate, based upon information available to us, it is imprecise and not necessarily reliable.
Ahold at a glance
Business review
Governance
Financials
Investors
Notes to the consolidated financial statements
Ahold
Annual Report 2014
112
23 Pensions and other post-employment benefits (continued)
€ million
FELRA & UFCW Food Pension Fund
Mid-Atlantic UFCW & Participating Employers Pension Fund
New England Teamsters & Trucking Industry Pension
UFCW Local 1262 & Employers Pension Fund
United Food & Commercial Workers Intl Union –
Industry Pension Fund
UFCW Local 1500 Pension Plan
Warehouse Employees’ Union Local 730 Pension Trust Fund
Other plans
Total
December 28, 2014
December 29, 2013
Annual
contributions
Plan
deficit /
(surplus)
Ahold’s
participation
Ahold’s
proportionate
share of
deficit /
(surplus)
Date of
latest information
Annual
contributions
Plan
deficit /
(surplus)
Ahold’s
participation
Ahold’s
proportionate
share of
deficit /
(surplus)
Jan. 1, 2014
Jan. 1, 2014
Oct. 1, 2013
Jan. 1, 2013
23
7
5
5
887
–
–
89
60.9%
64.6%
3.7%
22.9%
541
–
–
20
26
6
6
6
716
*
*
167
61.2%
*
*
22.6%
438
*
*
38
July 1, 2013
Jan. 1, 2014
Jan. 1, 2014
various
16
6
2
6
70
(553)
119
82
4,258
4,882
22.1%
27.3%
81.8%
1.2%
(122)
32
67
2
540
17
6
2
5
74
(357)
132
66
3,699
4,423
21.9%
26.8%
59.5%
1.3%
(78)
35
39
9
481
* These were new plans in 2013 and Ahold had not yet received the valuation reports from the plan administrators.
Following a restructuring of the FELRA & UFCW Food Pension Fund, the Mid-Atlantic UFCW & Participating Employers Pension Fund was created for future service accruals for active Giant Landover employees. Both plans are
funded by Ahold USA and any other participating employers. It is anticipated that the contribution levels of the Mid-Atlantic UFCW & Participating Employers Pension Fund will be sufficient to fully fund benefits earned by the
employees of Ahold USA and other participating employers.
During 2013, Stop & Shop reached an agreement with the New England Teamsters and Trucking Industry Pension Fund (NETTI) to settle Stop & Shop’s pension liabilities in the fund. This agreement followed NETTI’s
restructuring to create a new future benefit service “pool.” Employers who participate in the new pool will be responsible only for the pension benefits of their own employees, without regard to any previous fund liabilities in the
original pension pool. Under the settlement agreement, Stop & Shop has moved its employees into the new pool, effective March 31, 2013, without any loss of benefits for its employees and will settle its liability and payment
obligations in the original pension pool through the payment of $100 million (€76 million), payable in two equal installments of $50 million. The first installment was paid on June 22, 2013, and the second installment is due by
April 30, 2025.
If the underfunded liabilities of the multi-employer pension plans are not reduced, either by improved market conditions or collective bargaining changes, increased future payments by the Company and the other participating
employers may result. However, all future increases will be subject to the collective bargaining process. In 2015, the Company expects its contributions to increase to €79 million. Moreover, if the Company were to exit certain
markets or otherwise cease making contributions to these funds, the Company could trigger a substantial withdrawal liability. Any adjustment for withdrawal liability will be recorded when it is probable that a liability exists
and the amount can be reasonably estimated. Except for the NETTI withdrawal liability payment mentioned above, no other withdrawal payments were incurred or included in the 2014 and 2013 contributions disclosed
above. Ahold’s risk of increased contributions and withdrawal liabilities may be greater if any of the participating employers in an underfunded multi-employer plan withdraw from the plan or, due to insolvency, are not able to
contribute an amount sufficient to fund the underfunded liabilities associated with their participants in the plan.
Defined contribution plans
Ahold also participates in 42 multi-employer plans that are defined contribution plans on the basis of the terms of the benefits provided. The majority of these plans provide health and welfare benefits. The Company
contributed €228 million and €240 million to multi-employer defined contribution plans during both 2014 and 2013, respectively. These contributions are recognized as an expense in the consolidated income statement and
related entirely to continuing operations in 2014 and 2013. These plans vary significantly in size, with contributions to the three largest plans representing 62% of total contributions.
Ahold at a glance
Business review
Governance
Financials
Investors
Notes to the consolidated financial statements
Ahold
Annual Report 2014
113
24 Provisions
The table below specifies the changes in total provisions (current and non-current):
Selfinsurance
program
Loyalty
programs
Claims
and legal
disputes
Restructuring
Onerous
contracts
Other
Total
As of December 29, 2013
Current portion
Non-current portion
Carrying amount
122
388
510
14
33
47
5
4
9
18
52
70
26
54
80
6
54
60
191
585
776
Year ended December 28, 2014
Additions charged to income
Acquisitions through business combinations
Used during the year
Released to income
Interest accretion
Effect of changes in discount rates
Exchange rate differences
Closing carrying amount
132
—
(106)
—
6
(7)
68
603
18
—
(22)
(3)
1
1
—
42
217
—
(247)
(1)
—
—
26
4
43
—
(32)
(13)
2
—
6
76
6
63
(33)
(5)
2
—
6
119
15
—
(8)
(12)
1
—
3
59
431
63
(448)
(34)
12
(6)
109
903
As of December 28, 2014
Current portion
Non-current portion
151
452
14
28
1
3
33
43
34
85
7
52
240
663
€ million
Ahold at a glance
Business review
Governance
Financials
Investors
Notes to the consolidated financial statements
Ahold
Annual Report 2014
114
24 Provisions (continued)
Maturities of total provisions as of December 28, 2014, are as follows:
€ million
Amount due within one year
Amount due between two and five years
Amount due after five years
Total
Selfinsurance
program
Loyalty
programs
Claims
and legal
disputes
Restructuring
Onerous
contracts
Other
Total
151
305
147
603
14
28
—
42
1
2
1
4
33
29
14
76
34
49
36
119
7
14
38
59
240
427
236
903
Self-insurance program
Ahold is self-insured for certain potential losses, mainly relating to general liability, vehicle liability, workers’ compensation and property losses relating to its subsidiaries. The maximum self-insurance retention per occurrence,
including defense costs, is $2 million (€2 million) for general liability, $5 million (€4 million) for commercial vehicle liability, $5 million (€4 million) for workers’ compensation, and $17.5 million (€14 million) for property losses.
Ahold purchased a stop-loss coverage of $50 million (€41 million) for property losses to limit the aggregate exposure for named windstorms through June 1, 2015. A portion of this risk is reinsured to third parties, see Note 15.
Measurement of the provision for the self-insurance program requires significant estimates. These estimates and assumptions include an estimate of claims incurred but not yet reported, historical loss experience, projected loss
development factors, estimated changes in claim reporting patterns, claim settlement patterns, judicial decisions and legislation.
Loyalty programs
This provision relates to a third-party customer loyalty program in the Netherlands and reflects the estimated cost of benefits to which customers participating in the loyalty program are entitled.
Claims and legal disputes
The Company is a party to a number of legal proceedings arising out of its business operations. Such legal proceedings are subject to inherent uncertainties. Management, supported by internal and external legal counsel,
where appropriate, determines whether it is more likely than not that an outflow of resources will be required to settle an obligation. If this is the case, the best estimate of the outflow of resources is recognized. During 2014,
the Company received approval from the United States District Court for the District of Connecticut to settle a class action pending in the court. The Company has recorded a provision for this settlement in the amount of
€215 million ($297 million), which was settled prior to December 28, 2014. This is further described in Note 34, under the heading U.S. Foodservice – Waterbury litigation.
Restructuring
In 2014, Ahold recognized restructuring provisions totaling €28 million that related to a reorganization of the support roles at Albert Heijn and the Corporate Center. The provisions are based on formal and approved plans
using the best information available at the time. The amounts that are ultimately incurred may change as the plans are executed. The balance of the provision as of December 28, 2014, consisted of €42 million related to rent
and closing costs within U.S. operations (including provisions for Ahold’s former Tops stores of €19 million), €22 million related to the reorganization of the support roles at Albert Heijn and the Corporate Center and €12 million
for restructurings within Ahold’s Czech operations.
Onerous contracts
Onerous contract provisions mainly relate to unfavorable lease contracts and include the excess of the unavoidable costs of meeting the obligations under the contracts over the benefits expected to be received under such
contracts. Included in the balance of the provision as of December 28, 2014 were the remaining provision relating to BI-LO and Bruno’s (see Note 34) of €24 million and a provision of €59 million recognized during 2014
in connection with the acquisition of SPAR in the Czech Republic, mainly for unfavorable lease contracts.
Other
Other provisions include asset retirement obligations, provisions for environmental risks, jubilee payments, supplemental medical benefits and severance payments, other than those resulting from restructurings.
Ahold at a glance
Business review
Governance
Financials
Investors
Notes to the consolidated financial statements
Ahold
Annual Report 2014
115
25 Other non-current liabilities
€ million
Step rent accruals
Deferred income
Other
Total other non-current liabilities
December 28,
2014
December 29,
2013
234
26
16
276
201
17
17
235
December 28,
2014
December 29,
2013
88
26
47
21
65
30
3
280
74
24
52
24
52
22
14
262
Step rent accruals relate to the equalization of rent payments from lease contracts with scheduled fixed rent increases throughout the life of the contract.
Deferred income predominantly represents the non-current portions of deferred income on vendor allowances and deferred gains on sale and leaseback transactions.
26 Other current financial liabilities
€ million
Finance lease liabilities – current portion (see Note 22)
Interest payable
Short-term borrowings
Dividend cumulative preferred financing shares
Reinsurance liabilities – current portion (see Note 15)
Loans – current portion (see Note 21)
Other
Total other current financial liabilities
Other in 2013 mainly includes a multi-employer union pension withdrawal liability.
Ahold at a glance
Business review
Governance
Financials
Investors
Notes to the consolidated financial statements
Ahold
Annual Report 2014
116
27 Other current liabilities
€ million
Accrued expenses
Compensated absences
Payroll taxes, social security and VAT
Deferred income
Gift card and deposit liabilities
Other
Total other current liabilities
December 28,
2014
December 29,
2013
607
271
262
28
87
14
1,269
542
248
244
33
73
17
1,157
28 Cash flow
The following table presents the reconciliation between the statement of cash flows and the cash and cash equivalents as presented on the balance sheet:
€ million
Cash and cash equivalents at the beginning of the year
Restricted cash
Cash and cash equivalents related to discontinued operations
Cash and cash equivalents at the beginning of the year, excluding restricted cash and including cash and cash equivalents related to discontinued operations
Net cash from operating, investing and financing activities
Effect of exchange rate differences on cash and cash equivalents
Restricted cash
Cash and cash equivalents related to discontinued operations
Cash and cash equivalents of continuing operations at the end of the year
2014
2,496
(4)
5
2,497
(1,005)
123
9
—
1,624
2013
1,886
(22)
—
1,864
681
(48)
4
(5)
2,496
Ahold at a glance
Business review
Governance
Financials
Investors
Notes to the consolidated financial statements
Ahold
Annual Report 2014
117
28 Cash flow (continued)
The following table presents additional cash flow information:
2014
2013
Non-cash investing activities
Accounts payable at year-end related to purchased non-current assets
Assets acquired under finance leases from continuing operations
88
18
81
52
Non-cash financing activities
Finance lease liabilities originated from continuing operations
(18)
(52)
Acquisition of businesses
Total purchase consideration (see Note 4)
Assets given up
Cash acquired
Consideration payable
Acquisition of businesses, net of cash acquired
(210)
—
18
2
(190)
(15)
6
—
—
(9)
Divestments of businesses
U.S. Foodservice1
Proceeds from divestment of Slovakia
Proceeds from divestment of ICA
Net cash flows related to other past divestments
Divestment of business
Cash divested
Divestment of businesses, net of cash divested
(248)
(34)
—
(4)
(286)
(5)
(291)
(10)
(1)
2,368
(5)
2,352
—
2,352
Reconciliation between results on divestments of discontinued operations and cash (paid) received
Result on divestments of discontinued operations before income taxes
Net assets (liabilities) divested
Changes in accounts receivable / payable and provisions – net
Loss on fair value less cost of disposal measurement
Currency exchange differences transferred from equity
Other items previously recognized in other comprehensive income
Divestment of business
Cash divested
Divestment of businesses, net of cash divested
(222)
(21)
(43)
—
—
—
(286)
(5)
(291)
1,587
828
(6)
16
(82)
9
2,352
—
2,352
€ million
1 The cash flows from U.S. Foodservice includes settlement of Waterbury litigation of €241 million and legal fees of €7 million. See Note 34 for a further explanation.
Ahold at a glance
Business review
Governance
Financials
Investors
Notes to the consolidated financial statements
Ahold
Annual Report 2014
118
29 Earnings per share
The calculation of basic and diluted net income per share attributable to common shareholders is based on the following data:
Earnings (€ million)
Net income attributable to common shareholders for the purposes of basic earnings per share
Effect of dilutive potential common shares – reversal of preferred dividends from earnings
Net income attributable to common shareholders for the purposes of diluted earnings per share
Number of shares (in millions)
Weighted average number of common shares for the purposes of basic earnings per share
Effect of dilutive potential common shares:
Share options and conditional shares
Cumulative preferred financing shares
Weighted average number of common shares for the purposes of diluted earnings per share
2014
2013
594
22
616
2,537
25
2,562
879
1,021
11
34
924
13
38
1,072
The calculation of the basic and diluted income from continuing operations per share attributable to common shareholders is based on the same number of shares as detailed above and the following earnings data:
€ million
2014
2013
Income from continuing operations, attributable to common shareholders for the purposes of basic earnings per share
Effect of dilutive potential common shares – reversal of preferred dividends from earnings
Income from continuing operations, attributable to common shareholders for the purposes of diluted earnings per share
791
22
813
805
25
830
Basic and diluted income per share from discontinued operations attributable to common shareholders amounted to negative €0.22 and negative €0.21, respectively (2013: €1.69 basic and €1.62 diluted). They are based
on the loss from discontinued operations attributable to common shareholders of €197 million (2013: income €1,732 million) and the denominators detailed above.
Ahold at a glance
Business review
Governance
Financials
Investors
Notes to the consolidated financial statements
Ahold
Annual Report 2014
119
30 Financial risk management and financial instruments
Financial risk management
The Treasury function provides a centralized service to the Company for funding, foreign exchange, interest rate, liquidity and counterparty risk management. Treasury operates within a framework of policies and procedures
that is reviewed regularly. The Treasury function is not operated as a profit center. Treasury’s function is also to manage the financial risks that arise in relation to underlying business needs. Ahold’s Management Board has
overall responsibility for the establishment and oversight of the Treasury risk management framework. Ahold’s management reviews material changes to Treasury policies and receives information related to Treasury activities.
In accordance with its Treasury policies, Ahold uses derivative instruments solely for the purpose of hedging exposures. These exposures are mainly connected with the interest rate and currency risks arising from the Company’s
operations and its sources of finance. Ahold does not enter into derivative financial instruments for speculative purposes. The transaction of derivative instruments is restricted to Treasury personnel only and Ahold’s Internal
Control department reviews the Treasury internal control environment regularly.
Relationships with credit rating agencies and monitoring of key credit ratios are also managed by the Treasury department.
Currency risk
Ahold operates internationally and is exposed to foreign exchange risk arising from currency exposures, primarily with respect to the U.S. dollar. Since Ahold’s subsidiaries primarily purchase and sell in local currencies, the
Company’s exposure to exchange rate movements in commercial operations is naturally limited. The Company is subject to foreign currency exchange risks due to exchange rate movements in connection with the translation of
its foreign subsidiaries’ income, assets and liabilities into euros for inclusion in its consolidated financial statements. Translation risk related to Ahold’s foreign subsidiaries, joint ventures and associates is not actively hedged.
To protect the value of future foreign currency cash flows, including loan and interest payments, lease payments, dividends and firm purchase commitments, and the value of assets and liabilities denominated in foreign
currency, Ahold seeks to mitigate its foreign currency exchange exposure by borrowing in local currency and entering into various financial instruments, including forward contracts and currency swaps. It is Ahold’s policy to
cover foreign exchange transaction exposure in relation to existing assets, liabilities and firm purchase commitments.
Foreign currency sensitivity analysis
Assuming the euro had strengthened (weakened) by 10% against the U.S. dollar compared to the actual 2014 rate, with all other variables held constant, the hypothetical result on income before income taxes would have
been a decrease (increase) of €6 million (2013: €6 million, adjusted from last year’s disclosure of €32 million), as a result of foreign exchange losses on the translation of U.S. dollar denominated cash and cash equivalents.
Interest rate risk
Ahold’s interest rate risk arises primarily from its debt. To manage interest rate risk, Ahold has an interest rate management policy aimed at reducing volatility in its interest expense and maintaining a target percentage of its debt
in fixed rate instruments. Ahold’s financial position is largely fixed by long-term debt issues and the use of derivative financial instruments such as interest rate swaps and cross-currency interest rate swaps. As of December 28,
2014, after taking into account the effect of interest rate swaps and cross-currency swaps, approximately 98% of Ahold’s interest bearing debt was at fixed rates of interest (2013: 98%).
Interest rate sensitivity analysis
The total interest expense recognized in the 2014 income statement related to the variable rates of long-term debt, net of swaps, amounted to €4 million (2013: €5 million). The Company estimates that with a possible increase
(decrease) of U.S. dollar market interest rates of 25 basis points with all other variables (including foreign exchange rates) held constant, this would result in a hypothetical effect on income before income taxes of a loss (gain)
of nil (2013: nil). In addition, a hypothetical result relating to fair value movements of derivative hedges that do not qualify for hedge accounting would have been a loss of €2 million or a gain of €2 million, respectively
(2013: a loss of €2 million or a gain of €2 million, respectively).
Ahold at a glance
Business review
Governance
Financials
Investors
Notes to the consolidated financial statements
Ahold
Annual Report 2014
120
30 Financial risk management and financial instruments (continued)
The total interest income recognized in the 2014 income statement amounted to €6 million (2013: €7 million) related mainly to variable rate money market fund investments and deposits. The Company estimates that with
a possible increase (decrease) of euro and U.S. dollar market interest rates of 25 basis points with all other variables (including foreign exchange rates) held constant, this would result in a hypothetical effect on income before
income taxes of a gain of €3 million or a loss of €3 million, respectively (2013: gain of €9 million or a loss of €5 million). Due to the declining euro market interest rates, the 2013 assumption that the absolute value of the
reference interest could not decrease below 0%, has not been applied for 2014.
The cash flow hedge reserve would be impacted by interest rate movements through the JPY cross-currency swap which qualified for cash flow hedge accounting. The impact of interest rate movements related to the bond
and the swap’s variable leg are not reflected, as they offset each other. The impact of a 25-basis-point increase (25-basis-point decrease) in euro interest rates related to the remaining fair value exposure on the swap’s fixed leg
(caused by a shifted discount rate on the swap’s fixed EUR leg) is a gain of €17 million or a loss of €18 million (2013: gain of €15 million or a loss of €15 million).
The above sensitivity analyses are for illustrative purposes only as, in practice, market rates rarely change in isolation from other factors that also affect Ahold’s financial position and results.
Credit risk
Ahold has no significant concentrations of credit risk. Sales to retail customers are made in cash, checks and debit cards, or via major credit cards. Sales to franchisees are done on credit. The concentration of credit risk
with respect to receivables is limited, as the Company’s customer base and vendor base are large and unrelated. As a result, management believes there is no further credit risk provision required in excess of the normal
individual and collective impairment, based on an aging analysis performed as of December 28, 2014. For further discussion on Ahold’s receivables, see Notes 15 and 17.
Derivative counterparties and cash transactions are limited to high-credit-quality financial institutions’ products. Ahold invests in funds with a minimum rating of A- (Standard & Poor’s). With respect to credit risk, derivative contracts
with counterparties are entered into primarily under the standard terms and conditions of the International Swap and Derivatives Association. The counterparties have an externally validated investment grade credit rating.
Ahold has policies that limit the amount of counterparty credit exposure to any single financial institution or investment vehicle and continually monitors these exposures. The maximum exposure to credit risk is represented by the
carrying amounts of the financial assets on the balance sheet (refer to the table on fair values of financial instruments below in this note). The maximum exposure to a credit risk loss that Ahold would incur if financial institutions
that are parties to the derivative instruments completely failed to perform according to the terms of the contracts is €311 million as of December 28, 2014 (December 29, 2013: €284 million). Netting agreements are in place
with the financial counterparties that reduces the credit exposure (as of December 28, 2014, net exposure of €60 million).
Liquidity risk
Ahold manages its liquidity risk on a consolidated basis with cash provided from operating activities being the primary source of liquidity, in addition to debt and equity issuances in the capital markets, committed and
uncommitted credit facilities, letters of credit under credit facilities, and available cash. Ahold manages short-term liquidity based on projected cash flows over rolling periods of six months. As of December 28, 2014, Ahold
had €1.2 billion of committed undrawn bank facilities. The facilities can be drawn on for working capital and general corporate purposes and €1.9 billion of cash balances (including short-term deposits and similar instruments)
are available to manage the Company’s liquidity. In the beginning of 2015, Ahold issued a request to our relationship banks to amend the facility by extending it through 2020 and reducing the amount from €1.2 billion down
to €1 billion. Ahold expects to close the process during the first quarter of 2015.
Ahold at a glance
Business review
Governance
Financials
Investors
Notes to the consolidated financial statements
121
Ahold
Annual Report 2014
30 Financial risk management and financial instruments (continued)
Based on the current operating performance and liquidity position, the Company believes that cash provided by operating activities and available cash balances will be sufficient for working capital, capital expenditures,
interest payments, dividends and scheduled debt repayment requirements for the next 12 months and the foreseeable future.
The following tables summarize the expected maturity profile of the Company’s financial liabilities (including derivatives) as of December 28, 2014, and December 29, 2013, respectively, based on contractual
undiscounted payments.
All financial liabilities held at the reporting date, for which payments are already contractually agreed, have been included. Amounts in foreign currency have been translated using the reporting date closing rate. Cash flows
arising from financial instruments carrying variable interest payments have been calculated using the forward curve interest rates as of December 28, 2014, and December 29, 2013, respectively. Refer to Note 34 for the
liquidity risk related to guarantees.
Year ended December 28, 2014
Contractual cash flows
€ million
Non-derivative financial liabilities
Notes
Other loans
Financing obligations
Mortgages payable
Finance lease liabilities
Cumulative preferred financing shares1
Short-term borrowings
Reinsurance liabilities
Accounts payable
Other
Derivative financial liabilities
Cross-currency swaps and foreign currency derivatives
Net carrying
amount
Within
1 year
Between
1 and 5
years
After
5 years
Total
(1,040)
(3)
(387)
(10)
(1,213)
(497)
(47)
(191)
(2,655)
(43)
(68)
(2)
(48)
(4)
(179)
(21)
(47)
(67)
(2,655)
(1)
(545)
(1)
(181)
(6)
(681)
(74)
—
(110)
—
(6)
(1,051)
—
(239)
(2)
(1,003)
(32)
—
(20)
—
(52)
(1,664)
(3)
(468)
(12)
(1,863)
(127)
(47)
(197)
(2,655)
(59)
(251)
(18)
(70)
(246)
(334)
1 Cumulative preferred financing shares have no maturity. For the purpose of the table above, the future dividend cash flows were calculated until the coupon reset date of each of the four share-series (2016, 2018, 2020 and 2023). No liability redemption was assumed. Actual cash flows may differ,
see Note 22.
Ahold at a glance
Business review
Governance
Financials
Investors
Notes to the consolidated financial statements
Ahold
Annual Report 2014
122
30 Financial risk management and financial instruments (continued)
Year ended December 29, 2013
Contractual cash flows
€ million
Non-derivative financial liabilities
Notes
Other loans
Financing obligations
Mortgages payable
Finance lease liabilities
Cumulative preferred financing shares1
Short-term borrowings
Reinsurance liabilities
Accounts payable
Other
Cross-currency swaps and foreign currency derivatives
Net carrying
amount
Within
1 year
Between
1 and 5
years
After
5 years
Total
(970)
(3)
(346)
(10)
(1,143)
(497)
(52)
(152)
(2,387)
(48)
(62)
(2)
(48)
(3)
(198)
(24)
(52)
(53)
(2,387)
(14)
(528)
(2)
(165)
(7)
(670)
(79)
—
(86)
—
(5)
(1,033)
—
(185)
(2)
(801)
(48)
—
(15)
—
(47)
(1,623)
(4)
(398)
(12)
(1,669)
(151)
(52)
(154)
(2,387)
(66)
(182)
(17)
(68)
(235)
(320)
1 Cumulative preferred financing shares have no maturity. For the purpose of the table above, the future dividend cash flows were calculated until the coupon reset date of each of the four share-series (2016, 2018, 2020 and 2023). No liability redemption was assumed.
Credit ratings
S&P upgraded Ahold’s corporate credit rating to BBB with a stable outlook in June 2009 and, since then, this rating has remained unchanged. In July 2013, Moody’s affirmed Ahold’s Baa3 issuer credit rating and changed
the outlook to positive from stable. Maintaining investment grade credit ratings is a cornerstone of the Company’s strategy as they serve to lower the cost of funds and to facilitate access to a variety of lenders and markets.
Capital risk management
The Company’s primary objective in terms of managing capital is the optimization of its debt and equity balances in order to sustain the future development of the business, maintain an investment grade credit rating and
maximize shareholder value.
The capital structure of the Company consists of net lease adjusted debt, which includes borrowings, cash and cash equivalents, short-term deposits and similar instruments, equity, and the present value of the operating lease
commitments. Ahold may balance its overall capital structure in a number of ways, including through the payment of dividends, capital repayment, new share issues and share buybacks as well as the issuance of new debt or
the redemption of existing debt.
Ahold at a glance
Business review
Governance
Financials
Investors
Notes to the consolidated financial statements
Ahold
Annual Report 2014
123
30 Financial risk management and financial instruments (continued)
Financial instruments
Fair values of financial instruments
The following table presents the fair values of financial instruments, based on Ahold’s categories of financial instruments, including current portions, compared to the carrying amounts at which these instruments are included on
the balance sheet:
December 28, 2014
December 29, 2013
Carrying
amount
Fair
value
Carrying
amount
Fair
value
Loans receivable
Trade and other (non) current receivables
Reinsurance assets
Total loans and receivables
Cash and cash equivalents
Short-term deposits and similar instruments
Derivatives
Available for sale
Total financial assets
42
731
177
950
1,624
262
311
5
3,152
50
731
177
958
1,624
262
311
5
3,160
37
666
136
839
2,496
1,467
284
4
5,090
44
666
136
846
2,496
1,467
284
4
5,097
Notes
Other loans
Financing obligations
Mortgages payable
Finance lease liabilities
Cumulative preferred financing shares
Dividend cumulative preferred financing shares
Accounts payable
Short-term borrowings
Interest payable
Reinsurance liabilities
Other
Total non-derivative financial liabilities
Derivatives
Total financial liabilities
(1,040)
(3)
(387)
(10)
(1,213)
(497)
(21)
(2,655)
(47)
(26)
(191)
(43)
(6,133)
(251)
(6,384)
(1,282)
(3)
(391)
(11)
(1,574)
(564)
(21)
(2,655)
(47)
(26)
(191)
(51)
(6,816)
(251)
(7,067)
(970)
(3)
(346)
(10)
(1,143)
(497)
(24)
(2,387)
(52)
(24)
(152)
(48)
(5,656)
(182)
(5,838)
(1,169)
(4)
(356)
(12)
(1,468)
(539)
(24)
(2,387)
(52)
(24)
(152)
(54)
(6,241)
(182)
(6,423)
€ million
Ahold at a glance
Business review
Governance
Financials
Investors
Notes to the consolidated financial statements
124
Ahold
Annual Report 2014
30 Financial risk management and financial instruments (continued)
Of Ahold’s categories of financial instruments, only derivatives, assets available for sale and reinsurance assets (liabilities) are measured and recognized on the balance sheet at fair value. These fair value measurements are
categorized within Level 2 of the fair value hierarchy. The Company uses inputs other than quoted prices that are observable for the asset or liability, either directly (i.e., as prices) or indirectly (i.e., derived from prices). The fair
value of derivative instruments is measured by using either a market or income approach (mainly present value techniques). Foreign currency forward contracts are measured using quoted forward exchange rates and yield
curves derived from quoted interest rates that match the maturity of the contracts. Interest rate swaps are measured at the present value of expected future cash flows. Expected future cash flows are discounted by using the
applicable yield curves derived from quoted interest rates.
The valuation of Ahold’s derivative instruments is adjusted for the credit risk of the counterparty, called Credit Valuation Adjustment (“CVA”), and for the reporting entity’s own credit risk, called Debit Valuation Adjustment (“DVA”).
The CVA / DVA calculations have been added to the risk-free fair value of Ahold’s interest and cross-currency swaps. The valuation technique for the CVA / DVA calculation is based on relevant observable market inputs.
The carrying amount of receivables, cash and cash equivalents, accounts payable, short-term deposits and similar instruments, and other current financial assets and liabilities approximate their fair values because of the
short-term nature of these instruments and, for receivables, because of the fact that any recoverability loss is reflected in an impairment loss. The fair values of quoted borrowings are based on year-end ask-market quoted
prices. The fair value of other non-derivative financial assets and liabilities that are not traded in an active market are estimated using discounted cash flow analyses based on market rates prevailing at year-end. The fair value
calculation method and the conditions for redemption and conversion of the cumulative preferred financing shares are disclosed in Note 22. The accrued interest is included in other current financial liabilities (see Note 26)
and not in the carrying amounts of non-derivative financial assets and liabilities.
Short-term deposits and similar instruments include financial assets at fair value through profit or loss (€131 million) and loans and receivables (€131 million). Short-term deposits and similar instruments contain short-term liquid
investments that are considered part of Ahold’s cash management financial assets, as these investment products provide short-term liquidity while also providing capital preservation.
Derivatives
Fair values, notional amounts, maturities and the qualification of derivative financial instruments for accounting purposes are presented in the table below:
December 28, 2014
Fair value
€ million
Maturity
Forward foreign currency contracts1
Cross-currency swap2
Total cash flow hedges
Within 1 year
After 5 years
Interest rate swap3
Cross-currency swap3,4
Total derivatives – no hedge accounting treatment
Total derivative financial instruments
Between 1 to 5
years
Between 1 to 5
years
Assets
Liabilities
December 29, 2013
Fair value
Notional
amount
Assets
Liabilities
Notional
amount
1
—
1
(1)
(250)
(251)
95
225
320
6
—
6
—
(182)
(182)
124
228
352
38
—
319
41
—
300
272
310
311
—
—
(251)
319
319
639
237
278
284
—
—
(182)
300
300
652
1 Foreign currency forwards designated as cash flow hedges are used to hedge the future cash flows denominated in foreign currencies.
2 Cross-currency swap accounted for as a cash flow hedge used to hedge currency and cash flow risk on floating debt denominated in foreign currency, related to JPY 33,000 notes (see Note 21 for additional information).
3 Interest rate swap and cross-currency swap relate to the same notional amount of GBP 250 million.
4 As of December 28, 2014, the valuation of the GBP 250 cross-currency swap, related to the GBP 250 notes (see Note 21 for additional information) includes the impact of the mark-to-market valuation of an embedded credit clause in the amount of nil. The volatility in the financial markets resulted
in a €1 million gain related to this credit clause in the year 2014 (€4 million gain in 2013). Ahold is required under these swap contracts to redeem the U.S. dollar notional amount through semi-annual installments that commenced in September 2004. $287 million has been paid down as of
December 28, 2014.
Gains and losses recognized in cash flow hedging reserve in equity as of December 28, 2014, mainly relate to the swap on the JPY 33,000 notes and will be released to the income statement over a period lasting
until 2031.
Ahold at a glance
Business review
Governance
Financials
Notes to the consolidated financial statements
Investors
Ahold
Annual Report 2014
125
31 Related party transactions
Compensation of key management personnel
Key management personnel are those persons having authority and responsibility for planning, directing and controlling the activities of the Company as a whole. In 2013, the Company announced a new leadership
structure. A broader Executive Committee (ExCo) has been installed, replacing the Corporate Executive Board and the Ahold Executive Team. The ExCo consists of the Management Board (formerly referred to as the
Corporate Executive Board) and three other ExCo members. The Company considers all members of the ExCo and the Supervisory Board to be key management personnel as defined in IAS 24 “Related parties.”
The total compensation of key management personnel amounts to €16,456 thousand (2013: €13,755 thousand). This includes an estimate of additional wage tax on severance payments due in accordance with Dutch
tax laws in the amount of €1.2 million. The 2013 amount included a crisis levy in the Netherlands of €758 thousand following the Budget Agreement 2013 Tax Measures Implementation Act that was extended in the 2014
Tax Plan. The crisis levy was €758 thousand for members of the ExCo and nil for the members of the Supervisory Board in 2013.
Employment contracts with individual Management Board members
Dick Boer
In 2014, the Company provided Dick Boer with an annual base salary of €987,000, participation in the annual cash incentive plan and participation in the Company’s equity-based long-term incentive plan (GRO –
see Note 32). The at - target payout under the annual cash incentive plan is 100% of base salary and is capped at 150% in case of extraordinary performance. Unless Dick Boer’s employment agreement is otherwise
terminated, he will be eligible for reappointment at the annual General Meeting of Shareholders in April 2015. In the event that the Company terminates his employment agreement for reasons other than cause or because he
is not reappointed by the shareholders, Dick Boer is entitled to a severance payment equal to one year’s base salary. His employment agreement may be terminated by the Company with a notice period of 12 months and
by Dick Boer with a notice period of six months. Dick Boer participates in Ahold’s Dutch Pension Plan.
Jeff Carr
In 2014, the Company provided Jeff Carr with an annual base salary of €658,000, participation in the annual cash incentive plan and participation in the Company’s equity-based long-term incentive plan (GRO –
see Note 32). The at - target payout under the annual cash incentive plan is 100% of base salary and is capped at 150% in case of extraordinary performance. Furthermore, Jeff Carr receives a housing allowance of €7,000
net per month for the first term of four years. Unless Jeff Carr’s employment agreement is otherwise terminated, he will be eligible for reappointment at the annual General Meeting of Shareholders in April 2016. In the event
that the Company terminates his employment agreement for reasons other than cause or because he is not reappointed by the shareholders, Jeff Carr is entitled to a severance payment equal to one year’s base salary.
His employment agreement may be terminated by the Company with a notice period of 12 months and by Jeff Carr with a notice period of six months. Jeff Carr participates in Ahold’s Dutch Pension Plan.
Lodewijk Hijmans van den Bergh
In 2014, the Company provided Lodewijk Hijmans van den Bergh with an annual base salary of €544,000, participation in the annual cash incentive plan and participation in the Company’s equity-based long-term
incentive plan (GRO – see Note 32). The at - target payout under the annual cash incentive plan is 100% of base salary and is capped at 150% in case of extraordinary performance. Lodewijk Hijmans van den Bergh
participates in Ahold’s Dutch Pension Plan. On October 14, 2014 it was announced that Lodewijk Hijmans van den Bergh will step down as Chief Corporate Governance Counsel. This will take effect as of March 1, 2015
and his employment relationship with Ahold will terminate as of December 31, 2015.
James McCann
In 2014, the Company provided James McCann with an annual base salary of €658,000, participation in the annual cash incentive plan and participation in the Company’s equity-based long-term incentive plan (GRO –
see Note 32). The at - target payout under the annual cash incentive plan is 100% of base salary and is capped at 150% in case of extraordinary performance. Furthermore, James McCann receives a housing allowance
of $10,000 net per month for the first term of four years. Unless James McCann’s employment agreement is otherwise terminated, he will be eligible for reappointment at the annual General Meeting of Shareholders in April
2016. In the event that the Company terminates his employment agreement for reasons other than cause or because he is not reappointed by the shareholders, James McCann is entitled to a severance payment equal to one
year’s base salary. His employment agreement may be terminated by the Company with a notice period of 12 months and by James McCann with a notice period of six months. James McCann participates in Ahold’s Dutch
Pension Plan.
Ahold at a glance
Business review
Governance
Financials
Investors
Notes to the consolidated financial statements
Ahold
Annual Report 2014
126
31 Related party transactions (continued)
Remuneration of the Management Board by member
Direct remuneration
€ thousand
Dick Boer
2014
2013
Jeff Carr
2014
2013
Lodewijk Hijmans van den Bergh1
2014
2013
James McCann
2014
2013
Total 2014
Total 2013
Total direct
remuneration
Deferred remuneration
Share-based
compensation4
Other3
987
975
444
868
13
12
1,444
1,855
1,214
1,114
(125)
433
2,533
3,402
658
615
296
547
147
154
1,101
1,316
678
615
48
257
1,827
2,188
544
537
245
478
1,654
16
2,443
1,031
1,031
545
(48)
212
3,426
1,788
658
650
2,847
2,777
296
579
1,281
2,472
1,213
414
3,027
596
2,167
1,643
7,155
5,845
773
665
3,696
2,939
(39)
239
(164)
1,141
2,901
2,547
10,687
9,925
Base salary
Pensions5
Total
remuneration6
Bonuses2
Remuneration of the Executive Committee including Management Board
The table below specifies the remuneration of the ExCo, comprising the Management Board members as listed above and the additional ExCo members who were not part of the Management Board.
€ thousand
Base salary
Bonuses2
Other3
Share-based compensation4
Pensions5
Total remuneration6,7
2014
4,399
1,979
3,837
4,930
(747)
14,398
2013
3,183
2,821
865
3,983
1,320
12,172
1 Lodewijk Hijmans van den Bergh, Chief Corporate Governance Counsel and member of the Management Board and Executive Committee, will step down on March 1, 2015. Ahold has agreed to pay his remuneration until the end of 2015. He will receive a severance payment amounting to one
year’s base salary (€544,000), and he will remain entitled to the 2015 EIP and GRO. Outstanding shares under the GRO plan will vest over the term of employment in accordance with the applicable plan rules. An estimate of the remuneration costs relating to the period after March 1, 2015, until
December 31, 2015, has been recognized in 2014 (Other €1,641,000 and Share-Based Compensation €434,000) on the basis that he will be employed until the end of 2015. An estimate of additional wage tax of €1.2 million on severance payments due in accordance with Dutch tax laws,
calculated on the basis of employment until the end of 2015, is excluded from “Total remuneration” as presented in the tables above.
2 Bonuses represent accrued bonuses to be paid in the following year.
3 Except for the amount for Lodewijk Hijmans van den Bergh, which is described under footnote 1 above, “Other” mainly includes tax compensation (tax equalization charges for expatriates), allowances for housing expenses, relocation costs, international school fees, employer’s contributions to social
security plans, benefits in kind such as tax advice, medical expenses, and the associated tax gross up. Included in “Other” for James McCann in 2014 is tax compensation of €969,000, of which €164,000 relates to the 2013 tax year.
4 The fair value of each year’s grant is determined on the grant date and expensed on a straight-line basis over the vesting period. The expense for 2014 reflects this year’s portion of the share grants over the previous five years (2010 to 2014). The share-based compensation expense also includes the
expense related to the shares under the special purpose plan as described in Note 32. Under this program 105,000 shares were granted in 2013 to ExCo members that were not part of the Management Board, of which 35,000 shares vested in 2014 (2013: 35,000). The total share-based
compensation expense in 2014 for these ExCo members is €1,234,000 (2013: €1,044,000) of which €459,000 (2013: €792,000) relates to the special purpose plan and €775,000 (2013: €252,000) to the grants under the GRO program.
5 Pension costs are the total net periodic pension costs. During 2014, Ahold amended its pension plan in the Netherlands. For more details refer to Note 23.
6 The crisis levy of 16% of the wages from current employment (including any bonuses) that employers paid for their employees during 2013, insofar as such wages exceeded €150,000, came into effect in 2012 following the Budget Agreement 2013 Tax Measures Implementation Act and was extended
through 2013 in the 2014 Tax Plan. The total crisis levy accrued for the Management Board members in 2013 was €707,000 and is excluded from “Total remuneration” as presented in the tables above. The crisis levy was €403,000, €94,000, €189,000 and €21,000 for Dick Boer, Jeff Carr,
Lodewijk Hijmans van den Bergh and James McCann, respectively. The total crisis levy accrued for the ExCo members that were not part of the Management Board was €51,000 in 2013.
7 The ExCo became effective on September 1, 2013. On August 21, 2013, the Supervisory Board appointed Hanneke Faber and Sander van der Laan as member of the ExCo, effective September 1, 2013. The Supervisory Board appointed Abbe Luersman as member of the ExCo, effective
November 1, 2013. On January 15, 2015, it was announced that Sander van der Laan, CEO Albert Heijn and member of the Executive Committee, will step down on February 1, 2015. Wouter Kolk, currently Executive Vice President Specialty Stores and New Markets at Albert Heijn, is the successor
of Sander van der Laan as CEO of Albert Heijn, and member of the Ahold Executive Committee.
Ahold at a glance
Business review
Governance
Financials
Investors
Notes to the consolidated financial statements
Ahold
Annual Report 2014
127
31 Related party transactions (continued)
Remuneration of the Supervisory Board members
€ thousand
2014
2013
Rob van den Bergh (appointed in 2011)
Judith Sprieser (reappointed in 2014)
Stephanie Shern (reappointed in 2013)
Jan Hommen (appointed in 2013)
Derk Doijer (reappointed in 2013)
Mark McGrath (reappointed in 2012)
Ben Noteboom (reappointed in 2013)
René Dahan (resigned in October 2013)
Tom de Swaan (resigned in October 2013)
Total
128
126
118
117
108
129
99
—
—
825
104
112
98
35
100
109
101
87
79
825
Other
common
shares
Total
common
shares
214,594
9,230
—
101,538
325,362
261,176
41,276
30,252
133,584
466,288
Shares and other interests in Ahold
As of December 28, 2014, Management Board members held the following shares and other interests in Ahold:
Number of shares
Dick Boer
Jeff Carr
Lodewijk Hijmans van den Bergh
James McCann
Total
Common shares
subject to additional
holding requirement1
46,582
32,046
30,252
32,046
140,926
1 In line with best practice II.2.5 of the Dutch Corporate Governance Code, mid-term (three-year) shares granted and vested under the GRO program to Management Board members should be retained for a period of at least five years after grant, except to finance tax payable at the vesting date, or at
least until the end of a member’s employment with the Company, if this period is shorter.
As of December 28, 2014, Ben Noteboom held 16,615 Ahold common shares and Rob van den Bergh held 13,846 Ahold common shares. None of the other Supervisory Board members held Ahold shares.
Ahold does not provide loans or advances to members of the Management Board or the Supervisory Board. There are no loans or advances outstanding. Ahold does not issue guarantees to the benefit of members of the
Management Board or the Supervisory Board. No such guarantees are outstanding.
Ahold at a glance
Business review
Governance
Financials
Investors
Notes to the consolidated financial statements
Ahold
Annual Report 2014
128
31 Related party transactions (continued)
Trading transactions
Ahold has entered into arrangements with a number of its subsidiaries and affiliated companies in the course of its business. These arrangements relate to service transactions and financing agreements. Transactions were
conducted at market prices.
During 2014 and 2013, the Company entered into the following transactions with unconsolidated related parties:
For the year ended December 28, 2014
€ million
Stationsdrogisterijen
JMR
Cathedral Commons
Other
Total
Sales to
related parties
Purchases from Amounts receivable from
related parties
related parties
Amounts payable to
related parties
Commitments to
related parties
16
5
—
2
23
—
—
—
2
2
—
1
3
12
16
5
—
—
2
7
—
—
24
17
41
Sales to
related parties
Purchases from
related parties
Amounts receivable from
related parties
Amounts payable to
related parties
Commitments to
related parties
1
15
6
—
2
24
—
—
—
—
2
2
—
—
2
3
15
20
—
5
1
—
3
9
—
—
—
22
23
45
For the year ended December 29, 2013
€ million
ICA
Stationsdrogisterijen
JMR
Cathedral Commons
Other
Total
These unconsolidated related parties consist of:
aa ICA, in which Ahold divested its interest in 2013. Sales to and purchases from ICA are presented for the period ending on March 27, 2013.
aa Stationsdrogisterijen C.V., a joint venture of Ahold in the health and beauty care retail business.
aa JMR, a joint venture of Ahold in the retail business.
aa Cathedral Commons Partners, LLC, a real estate joint venture of Ahold.
aa “Other,” which includes mainly real estate joint ventures in which Ahold has an interest, holding properties operated by Ahold and Loyalty Management Nederland B.V., an associate of Ahold that renders services relating
to the management of customer loyalty programs to certain Ahold subsidiaries in the Netherlands.
Furthermore, the Company’s post-employment benefit plans in the Netherlands and the United States are considered related parties. For more information on these plans, see Note 23.
Ahold at a glance
Business review
Governance
Financials
Investors
Notes to the consolidated financial statements
129
Ahold
Annual Report 2014
32 Share-based compensation
In 2014, Ahold’s share-based compensation program consisted of a conditional share grant program called Global Reward Opportunity (GRO). This program, introduced in 2006, replaced the Company’s share option
plans. In principle, plan rules will not be altered during the term of the plans. Total 2014 GRO share-based compensation expenses were €43 million (2013: €43 million). Ahold’s share-based compensation programs are
equity-settled.
The fair value of the shares granted under the GRO program in 2014 at grant date was €47 million, of which €4 million related to Management Board members. This fair value is expensed over the vesting period of the
grants adjusted for expected annual forfeitures of 5% (2013: 5%), excluding Management Board members. For the share-based compensation expenses allocable to the individual Management Board members, see Note 31.
GRO program
Main characteristics
Under the 2006-2012 GRO program, Ahold shares were granted through a mid-term (three-year) and a long-term (five-year) program. The number of shares granted depended on the at - target value, the annual incentive
multiplier of the preceding year and the average share price for six months preceding the date of the grant. For participants other than the Management Board members, the mid-term component of the program contained a
matching share feature. For every five shares a participant holds for an additional two years after the vesting date, the participant will receive one additional share.
The shares were granted on the day after the annual General Meeting of Shareholders and vest on the day after the publication of Ahold’s full-year results in the third year (three-year programs) or fifth year (five-year program)
after the grant, provided the participant is still employed by Ahold. Shares granted to Management Board members vest on the day after the annual General Meeting of Shareholders in the third year (mid-term component)
or fifth year (long-term component) after the grant, subject to continued employment. Management Board members are not allowed to sell their shares within a period of five years from the grant date, except to finance tax
payable at the date of vesting.
Under the 2006 GRO program, the shares granted through the long-term component are subject to a performance condition. The number of shares that will ultimately vest depends on Ahold’s performance compared
to 11 other retail companies (refer to the Remuneration section for the composition of the peer group), measured over a five-year period using Total Shareholder Return (TSR), which is the sum of share price growth and
dividends paid. The table below indicates the percentage of conditional shares that could vest based on the ranking of Ahold within the peer group:
2006-2012 GRO program rank
Management Board
Other participants
1
2
3
4
5
6
7
8
9
10
11
12
150%
150%
130%
135%
110%
120%
90%
105%
70%
90%
50%
75%
25%
60%
0%
45%
0%
30%
0%
15%
0%
7.5%
0%
0%
Ahold at a glance
Business review
Governance
Financials
Investors
Notes to the consolidated financial statements
130
Ahold
Annual Report 2014
32 Share-based compensation (continued)
A revised GRO program was introduced as of the 2013 grant. Under the revised GRO program, shares are granted through a three-year program. The program consists of three components: one with a performance hurdle at
grant (conditional share grant) and two components with a performance hurdle at vesting (performance share grants). The size of the conditional share grant is subject to the Executive Committee Multiplier Incentive plan of the
preceding year for Management Board members and the Actual Multiplier of the preceding year for other employees. Half of the performance share grant is linked to a three-year return on capital (RoC) target. Dependent on
RoC performance, the number of shares that eventually vest can range between 0% and a maximum of 150% of the number of shares granted. For the other half of the grant, the performance at vesting is measured using the
TSR ranking. The table below indicates the percentage of shares with a TSR performance measure under the revised GRO program (2013 and 2014 GRO program) that could vest based on the ranking of Ahold within the
peer group:
2013-2014 GRO program rank
Vice President and up
Other participants
1
2
3
4
5
6
7
8
9
10
11
12
175%
150%
150%
135%
125%
120%
100%
105%
75%
90%
50%
75%
0%
60%
0%
45%
0%
30%
0%
15%
0%
7.5%
0%
0%
As of the end of 2014, Ahold held the fourth position with respect to the 2010 share grant, the fifth position for the 2011 grant, the fourth position for the 2012 grant, the sixth position for the 2013 grant and the sixth position
for the 2014 grant. For the 2010 share grant, the final TSR ranking is the fourth position (90% for Management Board members and 105% for other participants). The positions with respect to the 2011, 2012, 2013 and 2014
share grants are not an indication of Ahold’s final ranking at the end of the performance periods, nor do they provide any information related to the vesting of shares.
At the end of each reporting period, Ahold revises its estimates of the number of shares that are expected to vest based on the non-market vesting conditions (RoC performance). Ahold recognizes the impact of the revision
to original estimates, if any, in the income statement, with a corresponding adjustment to equity. At the end of 2014, the revised estimate of the number of shares in the 2013 grant that will vest in 2016 dependent on RoC
performance, is 51% (2013: 100%). The estimate for the 2014 grant is that 100% of the shares dependent on RoC performance will vest in 2017.
Upon termination of employment due to retirement, disability or death, the same vesting conditions as described above apply. Upon termination of employment without cause in certain circumstances (e.g., restructuring or
divestment), a pro rata part of the granted shares will vest on the date of termination of employment. For the performance shares, the most recent performance results will be applied to calculate the number of vested shares.
In addition, a limited number of shares were granted to other ExCo members and other employees in 2013 and 2014 under a special purpose plan. This program consists of unconditional and conditional shares.
The unconditional shares vest immediately on the award date. The conditional shares vest in two tranches. Half of the conditional shares vest on the day after the publication of Ahold’s full-year results in the first year and half
in the second year after the grant. Under this plan, 21,000 shares were granted in 2014 (2013: 123,000). In 2014, 48,000 shares vested (2013: 41,000). At the end of 2014, 55,000 shares were outstanding, of which
48,000 are to vest in 2015 and 7,000 in 2016.
The following table summarizes the status of the GRO program during 2014 for the individual Management Board members and for all other employees in the aggregate.
Ahold at a glance
Business review
Governance
Financials
Investors
Notes to the consolidated financial statements
Ahold
Annual Report 2014
131
32 Share-based compensation (continued)
Dick Boer
Five-year 2009 grant
Five-year 2010 grant
Three-year 2011 grant
Five-year 2011 grant
Three-year 2012 grant
Five-year 2012 grant
2013 TSR grant5
2013 RoC grant5
2013 conditional grant5
2014 TSR grant
2014 RoC grant
2014 conditional grant
Jeff Carr
Three-year 2011 grant
Five-year 2011 grant
Three-year 2012 grant
Five-year 2012 grant
2013 TSR grant
2013 RoC grant
2013 conditional grant
2014 TSR grant
2014 RoC grant
2014 conditional grant
Outstanding at
the beginning
of 2014
Granted
54,706
33,671
65,965
65,965
73,026
73,026
57,757
57,757
31,767
—
—
—
16,411
—
—
—
—
—
5,464
5,464
—
49,844
49,844
32,860
50,388
50,388
45,405
45,405
29,539
29,539
16,247
—
—
—
—
—
—
—
—
—
—
24,614
24,614
21,907
1
Forfeited
Outstanding at
the end
of 2014
71,117
—
65,965
—
—
—
—
—
—
—
—
—
—
—
—
—
—
—
—
—
6,010
—
—
—
—
33,671
—
65,965
73,026
73,026
63,221
63,221
25,757
49,844
49,844
32,860
—
—
—
—
73,026
—
—
—
25,757
—
—
32,860
—
50,506
—
98,947
73,026
109,539
110,636
94,831
25,757
87,227
74,766
32,860
7.02
7.29
8.59
6.00
9.23
7.81
7.76
10.52
10.52
11.20
12.40
12.40
50,388
—
—
—
—
—
—
—
—
—
—
—
—
—
—
—
—
—
—
—
—
50,388
45,405
45,405
29,539
29,539
16,247
24,614
24,614
21,907
—
—
45,405
—
—
—
16,247
—
—
21,907
—
75,582
45,405
68,107
51,693
44,308
16,247
43,074
36,921
21,907
8.31
5.80
9.23
7.81
7.76
10.52
10.52
11.20
12.40
12.40
Vested2
Minimum
number of
shares3
Maximum
number of
shares4
Fair value per
share at the
grant date (€)
Ahold at a glance
Business review
Governance
Financials
Investors
Notes to the consolidated financial statements
Ahold
Annual Report 2014
132
32 Share-based compensation (continued)
Lodewijk Hijmans van den Bergh6
Five-year 2010 grant
Three-year 2011 grant
Five-year 2011 grant
Three-year 2012 grant
Five-year 2012 grant
2013 TSR grant
2013 RoC grant
2013 conditional grant
2014 TSR grant
2014 RoC grant
2014 conditional grant
James McCann
Three-year 2011 grant
Five-year 2011 grant
Three-year 2012 grant
Five-year 2012 grant
2013 TSR grant5
2013 RoC grant5
2013 conditional grant5
2014 TSR grant
2014 RoC grant
2014 conditional grant
Subtotal Management Board members
Outstanding at
the beginning
of 2014
Granted
30,472
34,902
34,902
40,108
40,108
25,817
25,817
14,200
—
—
—
—
—
—
—
—
—
—
—
20,354
20,354
18,115
50,388
50,388
45,405
45,405
38,505
38,505
21,178
—
—
—
1,316,651
—
—
—
—
3,642
3,642
—
33,229
33,229
21,907
385,494
1
Forfeited
Outstanding at
the end
of 2014
—
34,902
—
—
—
—
—
—
—
—
—
—
—
—
—
—
—
—
—
—
—
—
30,472
—
34,902
40,108
40,108
25,817
25,817
14,200
20,354
20,354
18,115
—
—
—
40,108
—
—
—
14,200
—
—
18,115
45,708
—
52,353
40,108
60,162
45,179
38,725
14,200
35,619
30,531
18,115
7.29
8.59
6.00
9.23
7.81
7.76
10.52
10.52
11.20
12.40
12.40
50,388
—
—
—
—
—
—
—
—
—
272,760
—
—
—
—
—
—
4,007
—
—
—
10,017
—
50,388
45,405
45,405
42,147
42,147
17,171
33,229
33,229
21,907
1,419,368
—
—
45,405
—
—
—
17,171
—
—
21,907
372,108
—
75,582
45,405
68,107
73,757
63,220
17,171
58,150
49,843
21,907
2,015,181
8.31
5.80
9.23
7.81
7.76
10.52
10.52
11.20
12.40
12.40
Vested2
Minimum
number of
shares3
Maximum
number of
shares4
Fair value per
share at the
grant date (€)
1 Represents the number of shares originally granted for the 2014 grant. For the five-year 2009 grant, the number of shares allocated in 2014 represents the additional number of shares allocated based on the final TSR ranking.
2 The vesting date of the five-year 2009 grant and the three-year 2011 grant was on April 17, 2014. The Euronext closing share price was €14.00 on April 17, 2014.
3 For the three-year grants under the 2006-2012 GRO program and the conditional shares under the 2013-2014 GRO program, the minimum number of shares that could potentially vest equals the number of outstanding shares. For the five-year grants, the minimum number of shares that could potentially
vest would be nil if Ahold’s ranking was eight or lower. For the 2013 and 2014 TSR grants, the minimum number of shares that could potentially vest would be nil if Ahold’s ranking was seventh or lower. For the 2013 and 2014 RoC grants, the minimum number of shares that could potentially vest equals
nil (as explained in the section Main characteristics above).
4 For the three-year grants under the 2006-2012 GRO program and the conditional shares under the 2013-2014 GRO program, the maximum number of shares that could potentially vest equals the number of outstanding shares. For the five-year grants, the maximum number of shares that could potentially
vest equals 150% of outstanding shares if Ahold’s ranking is one. For the 2013 and 2014 TSR grants, the maximum number of shares that could potentially vest equals 175% of outstanding shares if Ahold’s ranking is one. For the 2013 and 2014 RoC grants, the maximum number of shares that could
potentially vest equals 150% of outstanding shares (as explained in the section Main characteristics above).
5 The shares granted and forfeited for the 2013 grants for Dick Boer and James McCann represent a correction to the original grant.
6 In accordance with the GRO plan rules and his separation agreement (also refer to Note 31) a pro rata part of the outstanding shares will vest for Lodewijk Hijmans van den Bergh on the date of termination of employment.
Ahold at a glance
Business review
Governance
Financials
Investors
Notes to the consolidated financial statements
Ahold
Annual Report 2014
133
32 Share-based compensation (continued)
Other employees
2009 grant
2010 grant
2011 grant
2012 grant
2013 grant4
2014 grant5
Subtotal Management Board members
Total number of shares
Outstanding at
the beginning
of 2014
Granted
2,223,039
1,233,914
4,680,301
5,407,439
4,339,430
—
1,316,651
19,200,774
874,544
—
—
—
—
3,502,264
385,494
4,762,302
1,3
Vested2
3,096,752
64,740
2,398,151
217,092
95,511
14,037
272,760
6,159,043
Forfeited
Outstanding at
the end
of 2014
831
34,573
118,042
269,829
270,850
135,243
10,017
839,385
—
1,134,601
2,164,108
4,920,518
3,973,069
3,352,984
1,419,368
16,964,648
1 Represents the number of shares originally granted for the 2014 grant. For the five-year 2009 grant, the number of shares allocated in 2014 represents the additional number of shares allocated based on the final TSR ranking and the actual number of matching shares related to the 2009 grant.
2 The vesting date of the five-year 2009 grant, the matching shares related to the 2009 grant and the three-year 2011 grant was February 28, 2014. The Euronext closing share price was €13.52 on February 28, 2014.
3 The grant date fair value of the matching shares is expensed over the five-year vesting period. In this table the matching shares are presented as awarded in the year of vesting. The total number of matching shares granted up to and outstanding at the end of the 2014 is 169,496 (2013: 192,034).
4 The 2013 grant includes the new program as described above. Under this new program 123,000 shares were granted in 2013, of which 41,000 vested in 2013 and 41,000 in 2014. At the end of 2014, 41,000 shares under this program were outstanding, and will vest in 2015.
5 The 2014 grant includes the new program as described above. Under this new program 21,000 shares were granted in 2014, of which 7,000 vested in the same year. At the end of 2014, 14,000 shares under this program were outstanding, of which 7,000 will vest in 2015 and 7,000 in 2016.
Valuation model and input variables
The weighted average fair value of the shares granted in 2014, for all eligible participants including Management Board members, amounted to €12.41, €11.80 and €12.41 per share for the conditional shares, TSR
performance shares and RoC performance shares, respectively (2013: €10.66, €8.72 and €10.64, respectively). The fair values of the conditional shares and the RoC performance shares are based on the Black-Scholes
model. The fair values of the TSR performance shares are determined using a Monte Carlo simulation model. The most important assumptions used in the valuations of the fair values were as follows:
Opening share price at grant date
Risk-free interest rate
Volatility
Assumed dividend yield
Expected volatility has been determined based on historical volatilities for a period of three years.
2014
2013
13.96
0.4%
19.3%
3.9%
11.95
0.3%
17.6%
4.2%
Ahold at a glance
Business review
Governance
Financials
Investors
Notes to the consolidated financial statements
Ahold
Annual Report 2014
134
32 Share-based compensation (continued)
Share option plans
After the introduction of GRO in 2006, options were discontinued as a remuneration component. All options vested by the end of 2009. No options were outstanding for individual Management Board members during
2014. The following table summarizes the status of the share option plans during 2014 for all other employees in the aggregate.
Description of grant
Ten-year
Total options
Weighted average exercise price
Weighted average share price at date of exercise
Outstanding at
the beginning
of 2014
36,000
36,000
6.36
Exercised
Forfeited
Expired
Outstanding at
the end
of 2014
36,000
36,000
6.36
14.10
—
—
—
—
—
—
Exercise price
Expiration date
6.36
04/03/2015
33 Operating leases
Ahold as lessee
Ahold leases a significant number of its stores, as well as distribution centers, offices and other assets, under operating lease arrangements. The aggregate amounts of Ahold’s minimum lease commitments payable to third
parties under non-cancelable operating lease contracts are as follows:
€ million
Within one year
Between one and five years
After five years
Total
December 28,
2014
December 29,
2013
768
2,457
2,564
5,789
687
2,155
2,409
5,251
Certain store leases provide for contingent additional rentals based on a percentage of sales and consumer price indices. Substantially all of the store leases have renewal options for additional terms. None of Ahold’s leases
impose restrictions on Ahold’s ability to pay dividends, incur additional debt or enter into additional leasing arrangements. The annual costs of Ahold’s operating leases from continuing operations, net of sublease income,
are as follows:
€ million
2014
2013
Minimum rentals
Contingent rentals
Sublease income
Total
690
20
(113)
597
705
21
(111)
615
During the fourth quarter of 2013, Ahold closed six stores and three gas stations in the New Hampshire area. In the annual costs relating to minimum rentals for 2013, costs are included for the provision to cover the lease
exposure for the closed locations.
In addition to the operating lease commitments disclosed above, Ahold has signed lease agreements for properties under development of which it has not yet taken possession. The total future minimum lease payments for
these agreements amount to approximately €195 million (2013: €184 million). These lease contracts are subject to conditions precedent to the rent commencement date.
Ahold at a glance
Business review
Governance
Financials
Investors
Notes to the consolidated financial statements
Ahold
Annual Report 2014
135
33 Operating leases (continued)
Ahold as lessor
Ahold rents out its investment properties (mainly retail units in shopping centers containing an Ahold store) and also (partially) subleases various other properties that are leased by Ahold under operating leases. The aggregate
amounts of the related future minimum lease and sublease payments receivable under non-cancelable lease contracts are as follows:
€ million
Within one year
Between one and five years
After five years
Total
December 28,
2014
December 29,
2013
197
514
323
1,034
180
474
353
1,007
The total contingent rental income recognized during the year on all leases where Ahold is the lessor was €2 million (2013: €2 million).
34 Commitments and contingencies
Capital investment commitments
As of December 28, 2014, Ahold had outstanding capital investment commitments for property, plant and equipment and investment property, and for intangible assets of approximately €119 million and €8 million,
respectively (December 29, 2013: €126 million and €6 million, respectively). Ahold’s share in the capital investment commitments of its unconsolidated joint venture JMR amounted to €6 million as of December 28, 2014
(December 29, 2013: €6 million).
Purchase commitments
Ahold enters into purchase commitments with vendors in the ordinary course of business. Ahold has purchase contracts with some vendors for varying terms that require Ahold to buy services and predetermined volumes of
goods and goods not-for-resale at fixed prices. As of December 28, 2014, the Company’s purchase commitments were approximately €859 million (December 29, 2013: €1,220 million). The decrease in 2014 is primarily
due to the expiry of a single purchase commitment with a three-year term. Not included in the purchase commitments are those purchase contracts for which Ahold has received advance vendor allowances, such as up-front
signing payments in consideration of its purchase commitments. These contracts generally may be terminated without satisfying the purchase commitments upon the repayment of the unearned portions of the advance vendor
allowances. The unearned portion of these advance vendor allowances is recorded as a liability on the balance sheet.
Contingent liabilities
Guarantees
Guarantees to third parties issued by Ahold can be summarized as follows:
€ million
Lease guarantees
Lease guarantees backed by letters of credit
Corporate and buyback guarantees
Loan guarantees
Total
December 28,
2014
December 29,
2013
499
68
34
—
601
491
67
46
3
607
The amounts included in the table above are the maximum undiscounted amounts the Group could be forced to settle under the arrangement for the full guaranteed amount, if that amount is claimed by the counterparty to the
guarantee. As part of the divestment of U.S. Foodservice in 2007, Ahold received an irrevocable standby letter of credit for $216 million (€163 million), which was reduced to $83 million (€68 million) as of December 28, 2014
(2013: $93 million (€67 million)).
Ahold at a glance
Business review
Governance
Financials
Investors
Notes to the consolidated financial statements
136
Ahold
Annual Report 2014
34 Commitments and contingencies (continued)
Ahold is contingently liable for leases that have been assigned to third parties in connection with facility closings and asset disposals. Ahold could be required to assume the financial obligations under these leases if any
of the assignees are unable to fulfill their lease obligations. The lease guarantees are based on the nominal value of future minimum lease payments of the assigned leases, which extend through 2040. The amounts of the
lease guarantees exclude the cost of common area maintenance and real estate taxes; such amounts may vary in time, per region, and per property. Of the €499 million in the undiscounted lease guarantees, €221 million
relates to the BI-LO / Bruno’s divestment and €173 million to the Tops divestment. On a discounted basis the lease guarantees amount to €434 million and €424 million as of December 28, 2014, and December 29, 2013,
respectively.
On February 5, 2009, and March 23, 2009, Bruno’s Supermarkets, LLC and BI-LO, LLC, respectively, filed for protection under Chapter 11 of the U.S. Bankruptcy Code (the filings). As a result of the filings, Ahold has made
an assessment of its potential obligations under the lease guarantees based upon the remaining initial term of each lease, an assessment of the possibility that Ahold would have to pay under a guarantee and any potential
remedies that Ahold may have to limit future lease payments. Consequently, in 2009, Ahold recognized provisions of €109 million and related tax benefit offsets of €47 million within results on divestments.
On May 12, 2010, the reorganized BI-LO exited bankruptcy protection and BI-LO assumed 149 operating locations that are guaranteed by Ahold. During the BI-LO bankruptcy, BI-LO rejected a total of 16 leases which are
guaranteed by Ahold and Ahold also took assignment of 12 other BI-LO leases with Ahold guarantees. Based on the foregoing developments, Ahold recognized a reduction of €23 million in its provision, after tax, within
results on divestments in the first half of 2010. Since the end of the second quarter of 2010, Ahold has entered into settlements with a number of landlords relating to leases of former BI-LO or Bruno’s stores that are guaranteed
by Ahold.
At the end of 2014, the remaining provision relating to BI-LO and Bruno’s was €24 million (2013: €25 million) with a related tax benefit offset of €10 million (2013: €11 million). This amount represents Ahold’s best estimate of
the discounted aggregate amount of the remaining lease obligations and associated charges, net of known mitigation offsets, which could result in cash outflows for Ahold under the various lease guarantees. Ahold continues
to monitor any developments and pursue its mitigation efforts with respect to these lease guarantee liabilities.
Ahold has provided corporate guarantees to certain suppliers of Ahold’s franchisees or non-consolidated entities. Ahold would be required to perform under the guarantee if the franchisee or non-consolidated entity failed to
meet its financial obligations, as described in the guarantee. Buyback guarantees relate to Ahold’s commitment to repurchase stores or inventory from certain franchisees at predetermined prices. The buyback guarantees reflect
the maximum committed repurchase value under the guarantees. The last of the corporate and buyback guarantees expire in 2023.
Loan guarantees relate to the principal amounts of certain loans payable by Ahold’s franchisees, non-consolidated real estate development entities and joint ventures. The term of most guarantees is equal to the term of the
related loan, the last of which matures in 2016. Ahold’s maximum liability under the guarantees equals the total amount of the related loans plus, in most cases, reasonable costs of enforcement of the guarantee.
Representations and warranties as part of the sale of Ahold’s operations
Ahold has provided, in the relevant sales agreements, certain customary representations and warranties including, but not limited to, completeness of books and records, title to assets, schedule of material contracts and
arrangements, litigation, permits, labor matters, and employee benefits and taxes. These representations and warranties will generally terminate, depending on their specific features, a number of years after the date of the
relevant transaction completion date.
Contingent liability cap
Closing date
Disco1
BI-LO / Bruno’s
Tops Markets
Tops’ Wilson Farms / Sugarcreek
November 1, 2004
January 31, 2005
December 3, 2007
December 3, 2007
Local currency
million
€ million
€15
$33
$70
$5
15
27
57
4
1 Ahold assesses the likelihood to be liable up to the amount of the contingent liability cap to be remote. The cap does not include Ahold’s indemnification obligation relating to the litigation described below.
The most significant sales of operations are described below. In addition, specific, limited representations and warranties exist for certain of Ahold’s smaller divestments in 2004, 2005, 2007, 2012, 2013 and 2014.
The aggregate impact of a claim under such representations and warranties is not expected to be material.
Ahold at a glance
Business review
Governance
Financials
Notes to the consolidated financial statements
Investors
Ahold
Annual Report 2014
137
34 Commitments and contingencies (continued)
Bradlees
In 1992, Stop & Shop spun off Bradlees Stores, Inc. (Bradlees) as a public company (the Bradlees Spin-off). In connection with the Bradlees Spin-off, Stop & Shop assigned to Bradlees certain commercial real property
leases. Pursuant to a 1995 reorganization of Bradlees and a subsequent wind-down and liquidation of Bradlees following a bankruptcy protection filing in 2000 (collectively, the Bradlees Bankruptcies), a number of such real
property leases were assumed and assigned to third parties. Pursuant to applicable law, Stop & Shop may be contingently liable to landlords under certain of the leases assigned in connection with the Bradlees Spin-off and
subsequently assumed and assigned to third parties in connection with the Bradlees Bankruptcies.
Disco
Ahold is required to indemnify the buyers of Disco S.A. (Disco) and Disco for certain claims made by alleged creditors of certain Uruguayan and other banks. For additional information, see the Uruguayan litigation described
in the Legal proceedings section of this Note. Ahold’s indemnification obligation relating to this litigation is not capped at a certain amount nor restricted to a certain time period.
BI-LO / Bruno’s
In connection with the sale of BI-LO and Bruno’s, Ahold may be contingently liable to landlords under guarantees of some 200 BI-LO or Bruno’s operating or finance leases that existed at the time of the sale in the event
of a future default by the tenant under such leases. As a result of the bankruptcy filings by BI-LO and Bruno’s during 2009, a provision was recognized in 2009. BI-LO exited bankruptcy in May 2010 and the Company has
re-evaluated its estimate of liability. For more information, refer to the Guarantees section of this Note.
U.S. Foodservice
In connection with the sale of U.S. Foodservice, which closed on July 3, 2007 (the Completion), Ahold indemnified U.S. Foodservice against damages incurred after the Completion relating to matters including the putative
class actions filed in 2006 and 2007 and referred to under Waterbury litigation in this Note and any actions that might be brought by any current or former U.S. Foodservice customers that concern the pricing practices at
issue in such litigation for sales made by U.S. Foodservice prior to the Completion. See Legal proceedings section on U.S. Foodservice below.
Tops Markets, LLC
In connection with the sale of Tops in 2007, Ahold has certain post-closing indemnification obligations under the sale agreement that Ahold believes are customary for transactions of this nature. Ahold retained certain liabilities
in the sale, including contingent liability for 45 leases that carry Ahold guarantees. Additionally, Ahold retained liabilities related to stores previously sold, including guarantees on five Tops stores in eastern New York state,
as well as liabilities related to the Tops convenience stores and the stores in northeast Ohio as outlined under Tops convenience stores.
Tops convenience stores
Pursuant to applicable law, Tops may be contingently liable to landlords under 186 leases assigned in connection with the sale of the Tops’ Wilson Farms and Sugarcreek convenience stores in the event of a future default
by the tenant under such leases. Ahold may be contingently liable to landlords under the guarantees of 77 of these leases in the same event.
Tops northeast Ohio stores
Tops closed all of its locations in northeast Ohio prior to year-end 2006. As of January 1, 2015, 34 of the total 55 closed locations in northeast Ohio have been sold, subleased or partially subleased. An additional
19 leases have been terminated or have terms due to expire within one year. Two stores continue to be marketed. In connection with the store sales, Tops and Ahold have certain post-closing indemnification obligations under
the sale agreements, which Ahold believes are customary for transactions of this nature. Pursuant to applicable law, Ahold may be contingently liable to landlords under guarantees of 13 of such leases in the event of a future
default by the tenant under such leases. If Ahold is able to assign the leases for the remaining northeast Ohio stores, then pursuant to applicable law, Ahold also may be contingently liable to landlords under guarantees of
certain of such remaining leases in the event of a future default by the tenant under such leases.
Ahold at a glance
Business review
Governance
Financials
Investors
Notes to the consolidated financial statements
Ahold
Annual Report 2014
138
34 Commitments and contingencies (continued)
Legal proceedings
Ahold and certain of its former or current subsidiaries are involved in a number of legal proceedings, which include litigation as a result of divestments, tax, employment, and other litigation and inquiries. The legal proceedings
discussed below, whether pending, threatened or unasserted, if decided adversely or settled, may result in liability material to Ahold’s financial condition, results of operations or cash flows. Ahold may enter into discussions
regarding settlement of these and other proceedings, and may enter into settlement agreements, if it believes settlement is in the best interests of Ahold’s shareholders. In accordance with IAS 37 “Provisions, Contingent
Liabilities, and Contingent Assets,” Ahold has recognized provisions with respect to these proceedings, where appropriate, which are reflected on its balance sheet.
Albert Heijn Franchising
The Vereniging Albert Heijn Franchisenemers (an association of Albert Heijn franchisees or VAHFR) has asserted claims against an Ahold subsidiary, Albert Heijn Franchising BV (AHF), for the years 2008 through 2012,
the alleged value of which in aggregate exceeds €200 million. AHF and the VAHFR have for a number of years had ongoing discussions about the resolution of certain cost items under individual franchise agreements.
On December 24, 2014, AHF and other legal entities within the Ahold Group of companies received a writ in which VAHFR and 239 individual claimants initiate proceedings as of April 15, 2015 before the District Court of
Haarlem with respect to these discussions. While repeating the previous quantification of the total value of their claims for the period 2008-2012, VAHFR and the individual claimants do not specify or seek payment for any
specific amount by the defendants in the litigation.
AHF believes that the position of the VAHFR and individual claimants as expressed in the writ of summons lacks substance and is without merit. AHF and its affiliates will vigorously defend their interests in the legal proceedings. The claims period covers the years 2008 and 2009, even though these years have already been settled. While it cannot be ruled
out that individual franchisees have claims for the years 2010-2012, such claims have not been specifically and individually asserted let alone confirmed as valid based on an analysis on merit and amounts involved.
Notwithstanding the foregoing, the years from 2010 onwards are still to be settled. Ahold has an existing provision of €17 million with regard to the settlement of costs with individual franchisees for the entire period up to
and including 2014.
U.S. Foodservice – Waterbury litigation
In October 2006, a putative class action was filed against U.S. Foodservice by Waterbury Hospital, Cason Inc. and Frankie’s Franchise Systems Inc. with the United States District Court for the District of Connecticut in
relation to certain U.S. Foodservice pricing practices (the Waterbury Litigation). Two additional putative class actions were filed in 2007 by customers of U.S. Foodservice, Catholic Healthcare West and Thomas & King
Inc., in the U.S. District Courts for the Northern District of California and the Southern District of Illinois, respectively. These two new actions involved the same pricing practices as those in the Waterbury Litigation. The new
actions also named Ahold and two individuals as defendants. In accordance with the decision of the Judicial Panel on Multidistrict Litigation, in 2008 the actions were consolidated with the Waterbury litigation before the
U.S. District Court in Connecticut. Ahold was (among other parties) named as defendant. In July 2009, the Plaintiffs filed a motion to certify a Plaintiff class in the action. Both Ahold and U.S. Foodservice filed a motion to
dismiss against the complaint and also filed motions opposing the certification of a class in the action. In December 2009, the Court in Connecticut granted Ahold’s motion to dismiss, as a result of which Ahold was no
longer party in the proceedings. U.S. Foodservice’s motion to dismiss was partially rejected by the Court, as a result of which U.S. Foodservice remained defendant in the ongoing proceedings.
On November 30, 2011, the U.S. District Court granted the Plaintiffs’ motion to certify a class in the action certifying a class consisting of any person in the United States who purchased products from
U.S. Foodservice pursuant to an arrangement that defined a sale price in terms of a cost component plus a markup (“cost-plus contract”), and for which U.S. Foodservice used a so-called “Value Added Service Provider” or
“VASP” transaction to calculate the cost component. On August 30, 2013, the U.S. Court of Appeals for the Second Circuit (“Second Circuit”) affirmed the decision of the U.S. District Court. The effect of the District Court’s
class certification order, if it were not reversed, vacated or otherwise modified, was to increase the potential liability exposure because it allowed the named Plaintiffs to litigate breach of contract claims and claims under the
Racketeer Influenced and Corrupt Organizations Act (RICO) on behalf of all Class Members. A RICO claim, if it were to be successful, could have led to an award to the plaintiffs of three times their compensatory damages.
On May 21, 2014, Ahold announced that it had signed a term sheet agreeing in principle to settle the Waterbury Litigation. Subsequently, the parties entered into a long-form settlement agreement (the “Settlement Agreement”)
setting forth the entirety of the parties’ agreement.
Under the Settlement Agreement, Ahold agreed to make a payment of $297 million (equivalent to €215 million at the end of Q1 2014) into a settlement fund in return for a release from all claims from all participating class
members in relation to the challenged pricing practices. The amount paid in December 2014 to satisfy the claim was equivalent to €241 million.
The settlement was subject to approval by the U.S. District Court, which preliminarily approved the Settlement Agreement on July 16, 2014, and issued an Order granting final approval on December 9, 2014. Ahold made the
$297 million payment to the settlement fund on December 19, 2014. The appeal period relating to the U.S. District Court’s final approval Order expired on January 8, 2015, with no appeal having been filed. Accordingly,
the settlement is now final and the potential liability for Ahold in this class action litigation has been resolved.
Ahold had recorded a net provision in the amount of €187 million in Q1 2014 (€215 million net of an estimated tax recovery of €28 million).
Ahold at a glance
Business review
Governance
Financials
Investors
Notes to the consolidated financial statements
Ahold
Annual Report 2014
139
34 Commitments and contingencies (continued)
Uruguayan litigation
Ahold, together with Disco and Disco Ahold International Holdings N.V. (DAIH), is a party to legal proceedings in one lawsuit in Uruguay related to Ahold’s 2002 acquisition of Velox Retail Holdings’ shares in the capital of
DAIH. The two other related lawsuits in Uruguay have been finally decided in favor of Ahold in 2013. The damages alleged by the plaintiffs, alleged creditors of certain Uruguayan and other banks, amount to approximately
$62 million (€51 million) plus interest and costs. As part of the sale of Disco to Cencosud in 2004, Ahold indemnified Cencosud and Disco against the outcome of these legal proceedings. The proceedings in the one
remaining lawsuit are ongoing. Ahold continues to believe that the plaintiffs’ claims are without merit and will continue to vigorously oppose such claims.
Other legal proceedings
In addition to the legal proceedings described previously in this Note, Ahold and its former or current subsidiaries are parties to a number of other legal proceedings arising out of their business operations. Ahold believes
that the ultimate resolution of these other proceedings will not, in the aggregate, have a material adverse effect on Ahold’s financial position, results of operations or cash flows. Such other legal proceedings, however, are
subject to inherent uncertainties and the outcome of individual matters is unpredictable. It is possible that Ahold could be required to make expenditures, in excess of established provisions, in amounts that cannot reasonably
be estimated.
35 Subsequent events
New share buyback program
On February 26, 2015, Ahold announced its decision to return €500 million to its shareholders by way of a share buyback program, to be completed over the next 12 months.
Ahold at a glance
Business review
Governance
Financials
Investors
Notes to the consolidated financial statements
Ahold
Annual Report 2014
140
36 List of subsidiaries, joint ventures and associates
The following are Ahold’s significant subsidiaries, joint ventures and associates as of December 28, 2014:
Consolidated subsidiaries
Unless otherwise indicated, these are, directly or indirectly, wholly or virtually wholly-owned subsidiaries. Subsidiaries not important to providing an insight into the Ahold group as required under Dutch law are omitted from this
list. With respect to the separate financial statements of the Dutch legal entities included in the consolidation, the Company availed itself of the exemption laid down in section 403, subsection 1 of Book 2 of the Dutch Civil
Code. Pursuant to said section 403, Ahold has assumed joint and several liabilities for the debts arising out of the legal acts of a number of subsidiaries in the Netherlands, which form part of the consolidation. The names of
the subsidiaries for which Ahold has issued 403 declarations are open for inspection at the trade register as managed by the Netherlands Chamber of Commerce.
Retail trade Europe
Albert Heijn B.V., Zaandam, the Netherlands
Albert Heijn Franchising B.V., Zaandam, the Netherlands
Gall & Gall B.V., Zaandam, the Netherlands
Etos B.V., Zaandam, the Netherlands
bol.com B.V., Utrecht, the Netherlands
AHOLD Czech Republic a.s., Prague, Czech Republic
Albert Heijn België N.V., Schoten, Belgium
Ahold Germany GmbH, Mettmann, Germany
Retail trade United States
The Stop & Shop Supermarket Company LLC, Boston, Massachusetts
Giant Food Stores LLC, Carlisle, Pennsylvania
Giant of Maryland LLC, Landover, Maryland
Peapod LLC, Skokie, Illinois
Ahold at a glance
Business review
Governance
Financials
Investors
Notes to the consolidated financial statements
36 List of subsidiaries, joint ventures and associates (continued)
Other
Ahold Coffee Company B.V., Zaandam, the Netherlands
Ahold Nederland B.V., Zaandam, the Netherlands
Ahold Europe Real Estate & Construction B.V., Zaandam, the Netherlands
Ahold Finance U.S.A. LLC, Zaandam, the Netherlands
Ahold Financial Services LLC, Carlisle, Pennsylvania, United States
Ahold Information Services Inc., Greenville, South Carolina, United States
Ahold International Sàrl, Zug, Switzerland
Ahold Lease U.S.A. Inc., Boston, Massachusetts, United States
Ahold Licensing Sàrl, Geneva, Switzerland
Ahold U.S.A. Inc., Boston, Massachusetts, United States
American Sales Company LLC, Lancaster, New York, United States
MAC Risk Management Inc., Boston, Massachusetts, United States
The MollyAnna Company, Montpelier, Vermont, United States
Ahold Insurance N.V., Willemstad, Curaçao
Ahold Finance Company N.V., Zug, Switzerland
Joint ventures and associates (unconsolidated)
JMR – Gestão de Empresas de Retalho SGPS, S.A., Lisbon, Portugal (49% owned by Ahold’s subsidiary Ahold International Sàrl)
Jerónimo Martins Retail Services S.A., Klosters, Switzerland (49% owned by Ahold’s subsidiary Ahold International Sàrl)
Ahold
Annual Report 2014
141
Ahold at a glance
Business review
Governance
Parent company financial statements
Financials
Investors
Ahold
Annual Report 2014
142
Income statement
€ million
2014
Income from subsidiaries and investments in joint ventures after income taxes
Other gains and losses after income taxes
Net income
647
(53)
594
2013
2,524
13
2,537
Ahold at a glance
Business review
Governance
Financials
Investors
Parent company financial statements
Ahold
Annual Report 2014
143
Balance sheet
Before appropriation of current year result.
€ million
Assets
Property, plant and equipment
Intangible assets
Deferred tax assets
Financial assets
Total non-current assets
Receivables
Other current financial assets
Cash and cash equivalents
Total current assets
Total assets
Note
4
5
6
7
December 28,
2014
December 29,
2013
—
20
45
9,447
9,512
35
131
199
365
9,877
1
—
26
11,867
11,894
19
1,265
1,020
2,304
14,198
318
8,713
(492)
(81)
195
(4,670)
2,537
6,520
Liabilities and shareholders’ equity
Issued and paid-in share capital
Additional paid-in capital
Currency translation reserve
Cash flow hedging reserve
Reserve participations
Accumulated deficit
Net income
Shareholders’ equity
8
9
6,844
(103)
(132)
210
(2,578)
594
4,844
Provisions
9
24
42
10
10
11
871
497
561
1,929
3,080
9,877
2,174
497
460
3,131
4,505
14,198
Loans
Cumulative preferred financing shares
Other non-current liabilities
Total non-current liabilities
Current liabilities
Total liabilities and shareholders’ equity
The accompanying notes are an integral part of these parent company financial statements.
12
Ahold at a glance
Business review
Governance
Financials
Investors
Notes to the parent company financial statements
Ahold
Annual Report 2014
144
1 Significant accounting policies
Basis of preparation
The parent company financial statements of Ahold have been prepared in accordance with Part 9, Book 2 of the Dutch Civil Code. In accordance with subsection 8 of section 362, Book 2 of the Dutch Civil Code, the
recognition and measurement principles applied in these parent company financial statements are the same as those applied in the consolidated financial statements (see Note 3 to the consolidated financial statements).
Investments in subsidiaries, joint ventures and associates
Investments in subsidiaries, joint ventures and associates are accounted for using the accounting policies as described in Note 3 to the consolidated financial statements.
2 Employees
The average number of employees of Koninklijke Ahold N.V. in full-time equivalents during 2014 was 169 (2013: 161). Salaries, social security charges and pension expenses amounted to €40 million and €2 million
expenses and €5 million income, respectively, for 2014 (2013: expenses of €32 million, €3 million and €4 million, respectively).
For information on the parent company’s defined benefit pension plan, the remuneration of the Management Board and the Supervisory Board and the parent company’s share-based compensation plans, see Notes 23,
31 and 32, respectively, to the consolidated financial statements.
The net pension liability and the net pension expense are calculated on the basis of the parent company’s active employees only.
3 Auditor fees
Expenses for services provided by the parent company’s independent auditor, PricewaterhouseCoopers Accountants N.V. (“PwC”) and its member firms and / or affiliates to Ahold and its subsidiaries in 2014 and in 2013,
are specified as follows:
€ thousand
Audit fees
Audit-related fees
Tax advisory fees
Total
PwC
Member
firms /
affiliates
Total 2014
2,221
225
106
2,552
1,951
—
118
2,069
4,172
225
224
4,621
PwC
Member
firms /
affiliates
Total 2013
2,106
223
252
2,581
1,938
—
198
2,136
4,044
223
450
4,717
Ahold at a glance
Business review
Governance
Financials
Notes to the parent company financial statements
Investors
Ahold
Annual Report 2014
145
4 Intangible assets
€ million
As of December 29, 2013
At cost
Accumulated amortization and impairment losses
Carrying amount
Software
1
(1)
—
Year ended December 28, 2014
Additions
Amortization
Closing carrying amount
22
(2)
20
As of December 28, 2014
At cost
Accumulated amortization and impairment losses
Carrying amount
23
(3)
20
Ahold at a glance
Business review
Governance
Financials
Investors
Notes to the parent company financial statements
Ahold
Annual Report 2014
146
5 Financial assets
€ million
Investments in subsidiaries
Loans receivable from subsidiaries
Other derivatives external
Deferred financing cost
Total financial assets
December 28,
2014
December 29,
2013
8,876
258
310
3
9,447
10,591
994
278
4
11,867
For more information on derivatives, see Note 13 to these parent company financial statements.
Investments in subsidiaries and joint ventures
€ million
Beginning of year
Share in income
Dividends
Intercompany transfers
Share of other comprehensive income (loss) and other changes in equity
Transfers (to) / from loans receivable
Transfers (to) / from provisions
Other comprehensive income (loss) transferred to net income
Exchange rate differences
End of year
2014
10,591
647
(3,327)
619
(30)
8
(20)
—
388
8,876
2013
8,068
2,524
(2,085)
2,074
163
(10)
29
(73)
(99)
10,591
Intercompany transfers include capital contributions and capital repayments. For a list of subsidiaries, joint ventures and associates, see Note 36 to the consolidated financial statements.
Loans receivable
€ million
2014
Beginning of year
Issued – net
Intercompany transfers
Transfers from / (to) investments
Exchange rate differences
End of year
Current portion
Non-current portion of loans
994
—
(728)
(8)
—
258
—
258
The loans receivable are related to loans with subsidiaries. On June 17, 2013, the parent company assigned the subordinated loan facility to Ahold Finance U.S.A. LLC.
2013
2,797
145
(1,936)
10
(22)
994
—
994
Ahold at a glance
Business review
Governance
Financials
Investors
Notes to the parent company financial statements
147
Ahold
Annual Report 2014
6 Receivables
€ million
Receivables from subsidiaries
Receivables from joint ventures
Prepaid expenses
Income tax receivable
Other receivables
Total receivables
December 28,
2014
December 29,
2013
25
1
7
1
1
35
15
2
1
—
1
19
December 28,
2014
December 29,
2013
130
—
1
131
1,263
1
1
1,265
7 Other current financial assets
€ million
Short-term deposits and similar instruments
Hedging derivatives intercompany
Other
Total other current financial assets
As per December 28, 2014, short-term deposits and similar instruments included short-term investments with a remaining maturity at acquisition between three and twelve months.
8 Shareholders’ equity
The shareholders’ equity in the parent company financial statements equals the shareholders’ equity presented in the consolidated financial statements, except that legal reserve participations and accumulated deficit are
presented separately.
The currency translation reserve, cash flow hedging reserve and legal reserve participations are legal reserves that are required by Dutch law. The legal reserve participations include the increases in net asset value of
joint ventures and associates since their first inclusion, less any amounts that can be distributed without legal restrictions.
If the currency translation reserve or the cash flow hedging reserve has a negative balance, distributions to the Company’s shareholders are restricted to the extent of the negative balance. Of the total equity as per
December 28, 2014, €4,844 million, an amount of €219 million is non-distributable (December 29, 2013: €513 million out of total equity of €6,520 million). For more information on the dividends on common shares,
see Note 20 to the consolidated financial statements.
Ahold at a glance
Business review
Governance
Financials
Investors
Notes to the parent company financial statements
Ahold
Annual Report 2014
148
8 Shareholders’ equity (continued)
The movements in equity can be specified as follows:
Legal reserves
€ million
Share
capital
Additional
paid-in
capital
Balance as of December 30, 2012
Net income
Other comprehensive income (loss)
Total comprehensive income (loss)
Dividends
Share buyback
Share-based payments
Other changes in reserves
Balance as of December 29, 2013
Net income
Other comprehensive income (loss)
Total comprehensive income (loss)
Dividends
Capital repayment
Share buyback
Cancellation of treasury shares
Share-based payments
Other changes in reserves
Balance as of December 28, 2014
318
—
—
—
—
—
—
—
318
—
—
—
—
(308)
—
(1)
—
—
9
8,713
—
—
—
—
—
—
—
8,713
—
—
—
—
(809)
—
(1,060)
—
—
6,844
Currency
translation
reserve
(292)
—
(200)
(200)
—
—
—
—
(492)
—
389
389
—
—
—
—
—
—
(103)
Cash flow
hedging
reserve
(126)
—
45
45
—
—
—
—
(81)
—
(51)
(51)
—
—
—
—
—
—
(132)
Reserve participations
326
—
—
—
—
—
—
(131)
195
—
—
—
—
—
—
—
—
15
210
Other reserves
including
accumulated
deficit1
(3,793)
2,537
156
2,693
(457)
(768)
61
131
(2,133)
594
(4)
590
(414)
109
(1,232)
1,061
50
(15)
(1,984)
Equity
attributable
to common
shareholders
5,146
2,537
1
2,538
(457)
(768)
61
—
6,520
594
334
928
(414)
(1,008)
(1,232)
—
50
—
4,844
1 Accumulated deficit includes the remeasurements of defined benefit plans.
9 Provisions
€ million
Provision for negative equity subsidiaries
Other provisions
Total provisions
As of December 28, 2014, €3 million is expected to be utilized within one year (December 29, 2013: €2 million).
December 28,
2014
December 29,
2013
14
10
24
36
6
42
Ahold at a glance
Business review
Governance
Financials
Investors
Notes to the parent company financial statements
Ahold
Annual Report 2014
149
10 Loans
December 28, 2014
€ million
JPY 33,000 notes LIBOR plus 1.5%, due May 2031
Loans from subsidiaries
Total loans
December 29, 2013
Non-current
portion
Current
portion
Non-current
portion
Current
portion
225
646
871
—
1,300
1,300
228
1,946
2,174
—
—
—
The loans from subsidiaries mature in 2015 (€1,300 million), 2017 (€125 million), 2018 (€50 million) and 2022 (€471 million). For more information on the external loans, see Note 21 to the consolidated financial statements.
For information on the cumulative preferred financing shares, see Note 22 to the consolidated financial statements.
11 Other non-current liabilities
€ million
Hedging derivatives external
Other derivatives intercompany
Total other non-current liabilities
December 28,
2014
December 29,
2013
251
310
561
182
278
460
December 28,
2014
December 29,
2013
1,731
1,300
21
—
2
2
1
23
3,080
4,414
—
24
32
2
2
1
30
4,505
For more information on derivatives, see Note 13 to these parent company financial statements.
12 Current liabilities
€ million
Short-term borrowings from subsidiaries
Loans – current portion
Dividend cumulative preferred financing shares
Income tax payable
Payables to subsidiaries
Payables to joint ventures
Interest payable
Other current liabilities
Total current liabilities
The current liabilities are liabilities that mature within one year.
Ahold at a glance
Business review
Governance
Financials
Investors
Notes to the parent company financial statements
Ahold
Annual Report 2014
150
13 Derivatives
The parent company regularly enters into derivative contracts with banks to hedge foreign currency and interest exposures of the parent company or its subsidiaries. Derivative contracts that are entered into to hedge exposures
of subsidiaries are generally mirrored with intercompany derivative contracts with the subsidiaries that are exposed to the hedged risks on substantially identical terms as the external derivative contracts. In these parent company
financial statements, the external derivative contracts and the intercompany derivative contracts are presented separately on the balance sheet. In situations where the external derivative contract qualifies for hedge accounting
treatment in the consolidated financial statements, the external derivative contract and the intercompany derivative contract are presented as “Hedging derivatives external” and “Hedging derivatives intercompany,” respectively.
In situations where the external derivative contract does not qualify for hedge accounting treatment in the consolidated financial statements, the external derivative contract and the intercompany derivative contract are presented
as “Other derivatives external” and “Other derivatives intercompany,” respectively.
Fair value movements of external derivative contracts that were entered into to hedge the exposures of subsidiaries are recorded directly in income, where they effectively offset the fair value movements of the mirroring
intercompany derivatives that are also recorded directly in income. Details of these derivative contracts, other financial instruments and the parent company’s risk management strategies are included in Note 30 to the
consolidated financial statements and in the tables presented below.
Non-current hedging derivatives – assets
€ million
2014
2013
Beginning of year
Fair value changes
End of year
278
32
310
280
(2)
278
Non-current hedging derivatives – liabilities
€ million
Beginning of year
Fair value changes
End of year
Hedging
derivatives
external
Other
derivatives
intercompany
2014
2013
182
69
251
278
32
310
460
101
561
455
5
460
Fair value changes include exchange rate differences and installments paid on a cross-currency swap that was entered into on behalf of one of the parent company’s subsidiaries.
14 Related party transactions
Koninklijke Ahold N.V. has entered into arrangements with a number of its subsidiaries and affiliated companies in the course of its business. These arrangements relate to service transactions and financing agreements and
were conducted at market prices.
Ahold at a glance
Business review
Governance
Financials
Notes to the parent company financial statements
Investors
Ahold
Annual Report 2014
151
15 Commitments and contingencies
Notes and loans issued by certain subsidiaries are guaranteed by the parent company, as disclosed in Note 21 to the consolidated financial statements. The parent company also guarantees certain lease obligations
and other obligations of subsidiaries. Guarantees issued by the parent company regarding the financial obligations of third parties and non-consolidated entities amount to €561 million as of December 28, 2014
(December 29, 2013: €554 million).
As part of the divestment of U.S. Foodservice in 2007, Ahold received an irrevocable standby letter of credit for $216 million (€163 million), which was reduced to $83 million (€68 million) as of December 28, 2014.
Under customary provisions, the parent company guarantees certain representations and warranties made in agreements of asset disposals. Guarantees and legal proceedings are further disclosed in Note 34 to the
consolidated financial statements. The parent company forms a fiscal unity with Ahold’s major Dutch and certain other subsidiaries for Dutch corporate income tax and Dutch VAT purposes and, for that reason, it is jointly and
severally liable for the Dutch corporate income tax liabilities and Dutch VAT liabilities of the whole fiscal unity. Assumptions of liability pursuant to section 403, Book 2 of the Dutch Civil Code are disclosed in Note 36 to the
consolidated financial statements.
Zaandam, the Netherlands
February 25, 2015
Management Board
Dick Boer
Jeff Carr
Lodewijk Hijmans van den Bergh
James McCann
Supervisory Board
Rob van den Bergh (Chairman ad interim)
Judith Sprieser (Vice Chairman)
Stephanie Shern
Jan Hommen
Derk Doijer
Mark McGrath
Ben Noteboom
Ahold at a glance
Business review
Governance
Financials
Investors
Other information
Ahold
Annual Report 2014
152
Independent auditor’s report
To: the general meeting and supervisory board of Koninklijke Ahold N.V.
Report on the financial statements for the year ended December 28, 2014
Our opinion
In our opinion:
aa the consolidated financial statements give a true and fair view of the financial position of Koninklijke Ahold N.V. and its subsidiaries (“the group”) as at December 28, 2014 and of their result and cash flows for the year then
ended in accordance with International Financial Reporting Standards as adopted by the European Union (EU-IFRS) and with Part 9 of Book 2 of the Dutch Civil Code; and
aa the company financial statements give a true and fair view of the financial position of Koninklijke Ahold N.V. as at December 28, 2014 and of its result for the year then ended in accordance with Part 9 of Book 2 of the
Dutch Civil Code.
What we have audited
We have audited the financial statements for the year ended December 28, 2014 of Koninklijke Ahold N.V., Zaandam (“the company”). The financial statements include the consolidated financial statements and the company
financial statements.
The consolidated financial statements comprise:
aa the consolidated balance sheet as at December 28, 2014;
aa the following statements for the year ended December 28, 2014: the consolidated income statement and the consolidated statements of comprehensive income, changes in equity and cash flows; and
aa the notes, comprising a summary of significant accounting policies and other explanatory information.
The company financial statements comprise:
aa the company balance sheet as at December 28, 2014;
aa the company income statement for the year ended December 28, 2014; and
aa the notes, comprising a summary of the accounting policies and other explanatory information.
The financial reporting framework that has been applied in the preparation of the financial statements is EU-IFRS and the relevant provisions of Part 9 of Book 2 of the Dutch Civil Code for the consolidated financial statements
and Part 9 of Book 2 of the Dutch Civil Code for the company financial statements.
The basis for our opinion
We conducted our audit in accordance with Dutch law, including the Dutch Standards on Auditing. Our responsibilities under those standards are further described in the “Our responsibilities for the audit of the financial
statements” section of our report.
We are independent of Koninklijke Ahold N.V. in accordance with the “Verordening inzake de onafhankelijkheid van accountants bij assurance-opdrachten” (ViO) and other relevant independence requirements in the
Netherlands. Furthermore, we have complied with the “Verordening gedrags- en beroepsregels accountants” (VGBA).
We believe that the audit evidence we have obtained is sufficient and appropriate to provide a basis for our opinion.
Ahold at a glance
Business review
Governance
Financials
Investors
Other information
Ahold
Annual Report 2014
153
Our audit approach
Overview
We designed our audit by determining materiality and assessing the risks of material misstatement in the financial statements. In particular, we looked at where the Management Board made subjective judgements, for
example in respect of significant accounting estimates that involved making assumptions and considering future events that are inherently uncertain. Apart from the key audit matters, which will be explained in the table below,
other points of focus in our audit included the valuation of investment property, inventory valuation, lease accounting and disclosures for stores and distribution centers, goodwill and other intangible assets impairment testing,
derivatives valuation and hedge accounting, uncertain tax positions and the estimates for loyalty programs and self-insurance liabilities. As in all of our audits, we also addressed the risk of management override of internal
controls, including evaluating whether there was evidence of bias by the Management Board that may represent a risk of material misstatement due to fraud.
Materiality
aa Overall materiality: €45 million which represents 4.5% of profit before tax.
Audit scope
aa Our audit covered all significant reporting units within the company.
aa Each significant reporting unit is audited by component teams, based in the United States, the Netherlands, the Czech Republic and Portugal.
aa The group engagement team audited amongst others the company financial statements, the consolidation, financial statement disclosures and complex or significant accounting
positions taken by the company.
aa In addition, the group engagement team reviewed the quality and execution of the work performed by the component teams through a review of periodic reports and site visits.
Key audit matters
aa Recognition of vendor allowances.
aa SPAR acquisition – purchase price allocation.
aa Impairment testing of store assets.
aa Contingent liabilities relating to legal matters.
aa Employee benefit plan measurement.
Ahold at a glance
Business review
Governance
Financials
Investors
Other information
Ahold
Annual Report 2014
154
Materiality
The scope of our audit is influenced by the application of materiality. Our audit opinion aims to provide reasonable assurance as to whether the financial statements are free from material misstatement. Misstatements may arise
due to fraud or error. They are considered to be material if, individually or in the aggregate, they could reasonably be expected to influence the economic decisions of users taken on the basis of the financial statements.
We set certain quantitative thresholds for materiality. These, together with qualitative considerations, helped us to determine the nature, timing and extent of our audit procedures and to evaluate the effect of identified
misstatements on our opinion.
Based on our professional judgment, we determined materiality for the financial statements as a whole as follows:
Overall group materiality
How we determined it
Rationale for benchmark applied
€45 million (2013: €46 million).
4.5% of profit before tax.
We have applied this benchmark, a generally accepted auditing practice, based on our analysis of the common information needs of users of the financial statements.
On this basis we believe that profit before tax is an important metric for the financial performance of the company.
We also take misstatements and/or possible misstatements into account that, in our judgment, are material for qualitative reasons.
We agreed with the Supervisory Board that we would report to them misstatements identified during our audit above €2.3 million (2013: €2.3 million) as well as misstatements below that amount that, in our view, warranted
reporting for qualitative reasons.
The scope of our group audit
Koninklijke Ahold N.V. is the parent of a group of entities. The financial information of this group is included in the consolidated financial statements of Koninklijke Ahold N.V.
We tailored the scope of our audit to ensure that we performed enough work to be able to give an opinion on the financial statements as a whole, taking into account: the geographic and management structure of the
group; the accounting processes and controls; and the markets in which the group operates through its retail channels. The group’s financial statements are a consolidation of its world-wide reporting units, comprising its retail
operations and centralised functions.
In establishing the overall group audit strategy and plan, we determined the type of work that needed to be performed at the reporting units by the group engagement team and by component auditors from other PwC
network firms. Where the work was performed by component auditors, we determined the level of involvement we needed to have in the audit work at those reporting units so as to be able to conclude whether sufficient
appropriate audit evidence had been obtained as a basis for our opinion on the consolidated financial statements as a whole. For each reporting unit we determined whether we required an audit of their complete financial
information or whether higher level procedures would be sufficient. Those where a complete audit was required included the three largest reporting units (the United States, the Netherlands and Czech Republic). We included
one reporting unit to have audit coverage on the group’s investments in joint ventures with unrelated parties (Portugal), and performed specified procedures on two other reporting units (in the United States and Curaçao) in order
to obtain sufficient coverage of specific financial statement line items in the consolidated financial statements. In addition, we performed higher level procedures with respect to the remaining reporting units.
The group consolidation, financial statement disclosures and a number of complex items were audited by the group engagement team at the company’s head office. These include derivative financial instruments, goodwill
impairment testing, share based payments, the purchase price allocation of the SPAR acquisition in the Czech Republic and judgemental accounting positions. The group engagement team also visited the businesses in the
United States, the Netherlands and the Czech Republic to direct the planning, review the work undertaken and assess the findings. Taken together, and excluding our higher level procedures, our audit work performed at
individual component locations and at the head office addressed 100% of group net sales.
By performing the procedures above at components, combined with additional procedures at group level, we have obtained sufficient and appropriate audit evidence regarding the financial information of the group to
provide a basis for our opinion on the consolidated financial statements.
Ahold at a glance
Business review
Governance
Financials
Investors
Other information
Ahold
Annual Report 2014
155
Key audit matters
Key audit matters are those matters which, in our professional judgment, were of most significance in the audit of the financial statements. We have communicated the key audit matters to the Supervisory Board, but they are
not a comprehensive reflection of all matters that were identified by our audit and that we discussed. We described the key audit matters and included a summary of the audit procedures we performed on those matters.
The key audit matters were addressed in the context of our audit of the financial statements as a whole, and in forming our opinion thereon. We do not provide a separate opinion on these matters.
Key audit matter
Recognition of vendor allowances
The group receives various types of vendor allowances, as further discussed in Note 3 of the financial statements.
These allowances are a significant component in the cost of sales. The majority of vendor allowances are settled
during the financial year. The vendor allowance receivable at December 28, 2014 amounted to €203 million
(Note 17).
We focused on this area because the recognition of vendor allowance income and receivables requires, to some
extent, judgment from management, for example concerning the nature and level of fulfilment of the company’s
obligations under the vendor agreements, estimates with respect to purchase or sales volumes to support income
recognition and the allocation of vendor allowance income between inventory and cost of sales.
SPAR acquisition – purchase price allocation
The group acquired SPAR’s business in the Czech Republic in 2014, as disclosed in Note 4. The purchase
consideration for the 49 stores and one location under construction amounted to €187 million and the goodwill
recognized was €100 million. The accounting for this acquisition required a significant amount of management
estimation. The key judgments relate to the allocation of the purchase price to the assets and liabilities acquired and
adjustments made to align accounting policies.
How our audit addressed the matter
Our procedures included understanding and testing management’s controls around the completeness and accuracy of
the contractual agreements recognized in the accounting systems. We also agreed the recorded amounts during the
year to contractual evidence on a sample basis. For the vendor allowance receivable at December 28, 2014,
amounts are either confirmed by vendors, recalculated by us based on contractual terms confirmed by vendors or
reconciled to post year-end settlements in cash. In addition, to evaluate the reliability of management’s estimates, we
performed a retrospective review of subsequent collections on prior year vendor allowance receivables. Finally we
tested cut-off through assessing the obligation fulfilment of vendor allowance income recorded during a period shortly
before and after year-end.
In evaluating the company’s purchase price allocation for SPAR, we tested the identification and valuation of the
(in)tangible assets and liabilities assumed against available market data, in particular for the acquired real estate and
(un)favourable rental contracts. We evaluated the competency and objectivity of the external appraiser engaged by
the company and involved our internal valuation experts to support us in our audit work. We also involved our internal
tax experts to assess the recognition and valuation of deferred tax assets and liabilities.
We also reviewed the work of SPAR’s predecessor auditor to obtain comfort on the closing balance and, on a
sample basis, attended stock counts close to the acquisition date. Finally we conducted additional audit procedures
to assess other aspects of the accounting including the adjustments made to align accounting policies with those of
the group and the disclosures made in Note 4.
Impairment testing of store assets
The group operates retail stores in Europe and the United States. The associated store assets are important to our audit
due to the size of the store asset carrying value of €4,177 million as well as the judgment involved in the assessment
of the recoverability of the invested amounts. Such judgment focuses predominantly on future store performance,
which is, amongst others, dependent on the expected store traffic, basket size and the competitive landscape in local
markets. Management assesses, on a quarterly basis, whether there are triggering events indicating potential
impairment. In 2014 management recognized a net impairment charge of €5 million. We refer to Note 11 of the
financial statements.
Contingent liabilities relating to legal matters
The group is involved in various legal matters. We refer to Note 34 of the financial statements for further details. We
focused on this area because of the potential significance of these commitments and contingencies (in particular as
they relate to the asserted claim from the Vereniging Albert Heijn Franchisenemers). The assessment as to whether or
not a liability should be recognized and whether amounts can be reliably estimated includes, to a certain extent,
judgment from management.
Our audit procedures included, amongst others, an evaluation of the group’s policies and procedures to identify
triggering events for potential impairment of assets related to underperforming stores. We challenged management’s
main cash flow assumptions and corroborated them by comparing them to internal forecasts and long term and
strategic plans that were approved by senior management as well as historic trend analyses. We also involved our
valuation experts to evaluate the applied WACC calculated by the group.
Our procedures included, amongst others, an assessment of the legal advice obtained by the group as well as
periodic meetings with management and review of board minutes to discuss developments in legal proceedings and
(un)asserted claims. We also obtained confirmations from the group’s external legal counsels in order to compare their
expert opinions to management’s position on measurement and/or disclosures for each of the material contingencies.
Ahold at a glance
Business review
Governance
Financials
Investors
Other information
Ahold
Annual Report 2014
156
Employee benefit plan measurement
The group has defined benefit plans in the Netherlands and the United States, giving rise to defined benefit
obligations of €4 billion and €1.3 billion, respectively (Note 23). This area was important to our audit because of the
magnitude of the amounts, the judgment involved (for example concerning salary increases, inflation, discount rates
and mortality) and technical expertise required to determine these amounts and the impact of the plan amendments
discussed in Note 23.
Our procedures included, amongst others, evaluating the actuarial and demographic assumptions and valuation
methodologies used by the group to assess the company’s various pension obligations. We assessed whether the key
actuarial assumptions are reasonable and fall within an acceptable bandwidth. We validated that assumptions are
consistently applied and that changes to the Dutch pension plan, as disclosed in Note 23 are appropriately
accounted for. We involved our pension experts to assist us in these procedures. We tested management’s controls
over payroll data and reconciled the membership census data used in the actuarial models to the payroll data of the
The group also has a significant number of union employees in the United States whose pension benefits are covered
group. We also assessed the accounting for the plan amendments and disclosures.
by multi-employer plans (we also refer to the risk factor on pension plan funding on page 55 of the annual report).
In addition, we evaluated the adequacy of the disclosed proportionate share of the total net deficit or surplus under
In Note 23 the group disclosed an overview of its possible proportionate share of the total net deficit or surplus in
the multi-employer plans in the United States. We reconciled the related inputs of this disclosure to supporting
these plans.
documentation such as audited plan information and actuarial calculations.
Responsibilities of the Management Board and the Supervisory Board
The Management Board is responsible for:
aa the preparation and fair presentation of the financial statements in accordance with EU-IFRS and with Part 9 of Book 2 of the Dutch Civil Code, and for the preparation of the Management Report in accordance with Part 9
of Book 2 of the Dutch Civil Code; and for
aa such internal control as the Management Board determines is necessary to enable the preparation of financial statements that are free from material misstatement, whether due to fraud or error.
As part of the preparation of the financial statements, the Management Board is responsible for assessing the company’s ability to continue as a going concern. Based on the financial reporting frameworks mentioned, the
Management Board should prepare the financial statements using the going concern basis of accounting unless the Management Board either intends to liquidate the company or to cease operations, or has no realistic
alternative but to do so. The Management Board should disclose events and circumstances that may cast significant doubt on the company’s ability to continue as a going concern in the financial statements.
The Supervisory Board is responsible for overseeing the company’s financial reporting process.
Our responsibilities for the audit of the financial statements
Our responsibility is to plan and perform an audit engagement to obtain sufficient and appropriate audit evidence to provide a basis for our opinion. Our audit has been performed with a high but not absolute level of
assurance which makes it possible that we did not detect all frauds or errors.
A more detailed description of our responsibilities is set out in the appendix to our report.
Report on other legal and regulatory requirements
Our report on the Management Report and the other information
Pursuant to the legal requirements of Part 9 of Book 2 of the Dutch Civil Code (concerning our obligation to report about the Management Report and other information):
aa We have no deficiencies to report as a result of our examination whether the Management Report, to the extent we can assess, has been prepared in accordance with Part 9 of Book 2 of this Code, and whether the
information as required by Part 9 of Book 2 of the Dutch Civil Code has been annexed.
aa We report that the Management Report, to the extent we can assess, is consistent with the financial statements.
Our appointment
We were appointed as auditors of Koninklijke Ahold N.V. by the Supervisory Board following the passing of a resolution by the shareholders at the general meeting held on April 17, 2013.
Amsterdam, February 25, 2015
PricewaterhouseCoopers Accountants N.V.
P.J. van Mierlo RA
Ahold at a glance
Business review
Governance
Financials
Investors
Other information
Ahold
Annual Report 2014
157
Appendix to our auditor’s report on the financial statements for the year ended December 28, 2014 of Koninklijke Ahold N.V.
In addition to what is included in our auditor’s report we have further set out in this appendix our responsibilities for the audit of the financial statements and explained what an audit involves.
The auditor’s responsibilities for the audit of the financial statements
We have exercised professional judgment and have maintained professional scepticism throughout the audit in accordance with Dutch Standards on Auditing, ethical requirements and independence requirements.
Our objectives are to obtain reasonable assurance about whether the financial statements as a whole are free from material misstatement, whether due to fraud or error. Our audit consisted, among others of:
aa Identifying and assessing the risks of material misstatement of the financial statements, whether due to fraud or error, designing and performing audit procedures responsive to those risks, and obtaining audit evidence that is
sufficient and appropriate to provide a basis for our opinion. The risk of not detecting a material misstatement resulting from fraud is higher than for one resulting from error, as fraud may involve collusion, forgery, intentional
omissions, misrepresentations, or the intentional override of internal control.
aa Obtaining an understanding of internal control relevant to the audit in order to design audit procedures that are appropriate in the circumstances, but not for the purpose of expressing an opinion on the effectiveness of the
company’s internal control.
aa Evaluating the appropriateness of accounting policies used and the reasonableness of accounting estimates and related disclosures made by the management.
aa Concluding on the appropriateness of the management’s use of the going concern basis of accounting, and based on the audit evidence obtained, concluding whether a material uncertainty exists related to events and/
or conditions that may cast significant doubt on the company’s ability to continue as a going concern. If we conclude that a material uncertainty exists, we are required to draw attention in our auditor’s report to the related
disclosures in the financial statements or, if such disclosures are inadequate, to modify our opinion. Our conclusions are based on the audit evidence obtained up to the date of our auditor’s report and are made in the
context of our opinion on the financial statements as a whole. However, future events or conditions may cause the company to cease to continue as a going concern.
aa Evaluating the overall presentation, structure and content of the financial statements, including the disclosures, and evaluating whether the financial statements represent the underlying transactions and events in a manner that
achieves fair presentation.
We communicate with the Supervisory Board regarding, among other matters, the planned scope and timing of the audit and significant audit findings, including any significant deficiencies in internal control that we identify
during our audit.
We provide the Supervisory Board with a statement that we have complied with relevant ethical requirements regarding independence, and to communicate with them all relationships and other matters that may reasonably
be thought to bear on our independence, and where applicable, related safeguards.
From the matters communicated with the Supervisory Board, we determine those matters that were of most significance in the audit of the financial statements of the current period and are therefore the key audit matters.
We describe these matters in our auditor’s report unless law or regulation precludes public disclosure about the matter or when, in extremely rare circumstances, not communicating the matter is in the public interest.
Ahold at a glance
Business review
Governance
Financials
Investors
Other information
Ahold
Annual Report 2014
158
Appendix
Responsibilities of the Management Board and the Supervisory Board for the financial statements
The Management Board is responsible for the preparation and fair presentation of these financial statements in accordance with EU-IFRS and with Part 9 of Book 2 of the Dutch Civil Code and for the preparation of the
management report in accordance with Part 9 of Book 2 of the Dutch Civil Code. Furthermore the Management Board is responsible for such internal control as it determines is necessary to enable the preparation of financial
statements that are free of material misstatement, whether due to fraud or error. The Supervisory Board is responsible for overseeing the Company’s financial reporting process.
Our responsibilities for the audit of the financial statements
The objectives of our audit are to obtain reasonable assurance about whether the financial statements as a whole are free from material misstatement, whether due to fraud or error, and to issue an auditor’s report that
includes our opinion. Reasonable assurance is a high level of assurance, but is not a guarantee that an audit conducted in accordance with Dutch Standards on Auditing will always detect a material misstatement when it
exists. Misstatements can arise from fraud or error and are considered material if, individually or in the aggregate, they could reasonably be expected to influence the economic decisions of users taken on the basis of these
financial statements.
As part of an audit in accordance with Dutch Standards on Auditing, we exercise professional judgement and maintain professional scepticism throughout the planning and performance of the audit. We also:
aa Identify and assess the risks of material misstatement of the financial statements, whether due to fraud or error, design and perform audit procedures responsive to those risks, and obtain audit evidence that is sufficient and
appropriate to provide a basis for our opinion. The risk of not detecting a material misstatement resulting from fraud is higher than for one resulting from error, as fraud may involve collusion, forgery, intentional omissions,
misrepresentations, or the override of internal control.
aa Obtain an understanding of internal control relevant to the audit in order to design audit procedures that are appropriate in the circumstances, but not for the purpose of expressing an opinion on the effectiveness of the
entity’s internal control.
aa Evaluate the appropriateness of accounting policies used and the reasonableness of accounting estimates and related disclosures made by management.
aa Evaluate the overall presentation, structure and content of the financial statements, including the disclosures, and whether the financial statements represent the underlying transactions and events in a manner that achieves
fair presentation.
aa Obtain sufficient appropriate audit evidence regarding the financial information of the Group and business activities within the Group to express an opinion on the financial statements. We are responsible for the direction,
supervision and performance of the Group audit. We remain solely responsible for our audit opinion.
Ahold at a glance
Business review
Governance
Financials
Investors
Other information
Ahold
Annual Report 2014
159
Distribution of profit
Articles of Association provisions governing the distribution of profit
The holders of common shares are entitled to one vote per share and to participate in the distribution of dividends and liquidation proceeds. Pursuant to section 39 of the Articles of Association, a dividend will first be declared
out of net income on cumulative preferred shares and cumulative preferred financing shares. Any net income remaining after reservations deemed necessary by the Supervisory Board, in consultation with the Management
Board, will then be available for distribution to the common shareholders subject to approval at the General Meeting of Shareholders. The Management Board, with the approval of the Supervisory Board, may propose
that the General Meeting of Shareholders make distributions wholly or partly in the form of common shares. Amounts of net income not paid in the form of dividends will be added to the accumulated deficit. In the financial
statements, the dividend on cumulative preferred financing shares is included in the income statement. Consequently, net income according to the parent company income statement is fully attributable to common shareholders.
Distribution of profit
The Management Board, with the approval of the Supervisory Board, proposes that a final dividend of €0.48 per common share be paid in 2015 with respect to 2014 (2013: €0.47).
Subsequent events
For information regarding subsequent events, see Note 35 to the consolidated financial statements.
Ahold at a glance
Business review
Governance
Financials
Investors
Investors
Ahold
Annual Report 2014
160
Investors
Share performance
161
Shareholder structure
162
Shareholder returns
164
Key dates
165
Five-year overview
166
Contact information
168
Cautionary notice
170
Ahold at a glance
Business review
Governance
Financials
Investors
Share performance
Ahold
Annual Report 2014
161
The case for investing in Ahold
By purchasing Ahold shares, investors gain a stake in an international retailing group with strong local consumer brands in the United States and Europe with:
aa A workforce of 227,000 employees
aa A strong balance sheet and capital discipline
aa Market leading positions
aa Attractive shareholder returns
aa Focus on profitable growth, cash generation and value creation
Share performance in 2014
On December 24, 2014, the closing price of Ahold’s ordinary share on Euronext Amsterdam was €14.66, an 11% increase compared to €13.22 one year earlier. During the same period, the STOXX Europe Consumer
Services 600 index increased by 5% and AEX index increased by 6%.
In 2014, Ahold shares traded on Euronext Amsterdam at an average closing price of €13.38 and an average daily trading volume of 3.3 million shares. Ahold’s market capitalization was €12 billion at year-end 2014.
The highest closing price for Ahold’s shares during 2014 in Amsterdam was €14.75 on December 23, 2014, and the lowest was €11.76 on October 16, 2014.
On December 26, 2014, the closing price of Ahold’s ADR was $17.87, 2% lower than the closing price on December 27, 2013 ($18.21). In the same period the Dow Jones index increased by 10%. In 2014, the average
daily trading volume of Ahold American Depository Receipts (ADRs) was 95,186.
Ahold share price
in EUR, NYSE Euronext Amsterdam
2010
2011
2012
2013
2014
7
8
9
10
11
12
13
14
15
Range
Year-end price
Performance of Ahold’s common shares on Euronext Amsterdam
Closing common share price at year-end (in €)
Average closing common share price (in €)
Highest closing common share price (in €)
Lowest closing common share price (in €)
Average daily trading volume
Market capitalization (€ million)
Source: Euronext
2014
2013
14.66
13.38
14.75
11.76
3,347,398
12,059
13.22
12.22
14.10
10.14
3,167,996
12,989
Ahold at a glance
Business review
Governance
Financials
Investors
Shareholder structure
Ahold
Annual Report 2014
162
Share capital
During 2014, Ahold’s issued share capital decreased by approximately 160 million common shares to 823 million common shares. The reasons for this decrease were the 92 million shares Ahold acquired, pursuant to the
€2 billion share repurchase program and the impact of the reverse stock split of 74 million shares, offset by the use of 6 million treasury shares for the GRO program. The common shares issued decreased by 167 million to
894 million at the end of 2014. The reasons for this decrease were the impact of the reverse stock split of 82 million shares and the cancellation of 85 million shares on June 20, 2014.
As of December 28, 2014, there were 72 million shares held in treasury, the majority held by Ahold to cover the equity-based long-term incentive plan for employees.
Ahold’s authorized share capital as of December 28, 2014, was comprised of the following:
aa 1,700,000,000 common shares at €0.01 par value each
aa 477,580,949 cumulative preferred financing shares at €0.01 par value each
aa 43,520 cumulative preferred shares at €500 par value each
Shareholders by region2:
Percent
UK / Ireland
North America
Rest of Europe
The Netherlands1
France
Rest of the world
Germany
Switzerland
Undisclosed1
February 2015
February 2014
22.8
20.6
8.1
7.1
4.9
3.9
3.8
1.8
27.0
19.3
23.5
7.2
7.8
5.1
3.5
3.6
2.1
27.9
1 The Netherlands excludes the percentage of shareholdings of all retail holdings and treasury shares, which are included in Undisclosed.
2 Source: CMi2i.
For additional information about Ahold’s share capital, see Notes 20 and 22 to the consolidated financial statements. Ahold is a public limited liability company registered in the Netherlands with a listing of shares
(symbol: AH) on Euronext’s Amsterdam Stock Exchange (AEX).
Ahold at a glance
Business review
Governance
Financials
Investors
Shareholder structure
Ahold
Annual Report 2014
163
American Depositary Receipts (ADRs)
Ahold’s shares trade in the United States on the over-the-counter (OTC) market (www.otcmarkets.com) in the form of American Depositary Receipts (ADRs) (ticker: AHONY). The ratio between Ahold ADRs and the ordinary
Netherlands (euro denominated) shares is 1:1, i.e., one ADR represents one Ahold ordinary share.
Deutsche Bank Trust Company Americas (the Depositary) acts as depositary bank for Ahold’s ADR program. Ahold has been informed by the Depositary that as of December 28, 2014, there were 38,166,087 ADRs
outstanding in the United States, compared with 36,818,201 as of December 29, 2013.
Please also see Contact information for details on how to contact Deutsche Bank regarding the ADR program.
Security codes
Common shares:
Bloomberg code: AH NA
ISIN code: NL0010672325
Common code: 104822215
Sedol code: BKWP5S5
American Depositary Receipts (ADR):
Ticker: AHONY
Bloomberg code: AHONY US
ISIN code: US5004671054
Sedol code: 2037813 US
CUSIP: 500467105
Structure: Sponsored Level I ADR
Exchange: OTC
Ratio (DR:ORD): 1:1
Other codes:
Reuters code: AHLN.AS
Ahold at a glance
Business review
Governance
Financials
Investors
Shareholder returns
Ahold
Annual Report 2014
164
For the 2013 financial year, a cash dividend of €0.47 per common share was approved by the annual General Meeting of Shareholders on April 16, 2014, and paid on May 2, 2014.
The announced common stock dividend of €0.48 for the financial year 2014 is up 2% from last year and will be proposed to shareholders at the annual General Meeting of Shareholders to be held on April 15, 2015.
The payout ratio of 51% is slightly higher than our dividend policy range of 40-50% of adjusted income from continuing operations.
Shareholders KPIs 2010-2014
2014
Dividend per common share
Dividend yield
Payout ratio
Total shareholder return
0.48*
3.3%
51%
6.4%
2013
2012
2011
2010
0.47
3.6%
51%
35.8%
0.44
4.3%
50%
13.8%
0.40
3.8%
47%
(5.4)%
0.29
2.9%
39%
17.2%
*Subject to the approval of the annual General Meeting of Shareholders.
Dividends on cumulative preferred financing shares
Ahold paid an annual dividend on cumulative preferred financing shares in 2014 and plans to pay dividends on these shares in 2015 as required by the terms of the shares.
Share buyback
On February 28, 2013, Ahold announced its decision to return €500 million to its shareholders by way of a share buyback program, to be completed over a 12-month period. Subsequently, on June 4, 2013, Ahold
announced an extension to this program of an additional €1.5 billion, for a total share buyback of €2 billion, expected to be completed by the end of 2014. By the end of 2014, Ahold had completed 100% of the €2 billion
share buyback program, which lowered the number of outstanding common shares by 92,485,298 in 2014.
As of December 28, 2014, there were 71,775,672 shares held in treasury, the majority held by Ahold to cover long-term incentive and employee stock purchase plans.
Capital repayment and reverse stock split
On January 21, 2014, a capital repayment and reverse stock split was approved at an Extraordinary General Meeting of Shareholders. On March 28, 2014, the reverse stock split became effective. Every 13 existing shares
with a nominal value of €0.30 each were consolidated into 12 new shares with a nominal value of €0.01 each. The capital repayment of €1.14 per remaining share, €1,007 million in the aggregate (excluding transaction
costs), took place on April 3, 2014. The capital reduction attributable to treasury shares, €109 million in the aggregate, is reported in Other reserves.
Ahold at a glance
Business review
Governance
Financials
Investors
Key dates
Ahold
Annual Report 2014
Key dates 2015
Annual General Meeting of Shareholders
April 15
Ex-dividend date
April 17
Dividend record date
April 20
Payment date
April 30
Announcement of first quarter 2015 results
May 27
Announcement of half-year 2015 results
August 20
Announcement of third quarter 2015 results
November 11
AGM 2015
This year’s annual General Meeting of Shareholders (AGM) will be held at the Muziekgebouw aan ‘t IJ in Amsterdam, the Netherlands, on April 15, 2015.
The meeting will start at 2.00 pm (CET).
165
Ahold at a glance
Business review
Governance
Financials
Investors
Five-year overview
Ahold
Annual Report 2014
166
Results, cash flow and other information
€ million, except per share data
2014
2013
2012
2011
2010
32,774
0.8%
1,250
3.9%
(222)
791
(197)
594
32,615
2.0%
1,239
4.2%
(242)
805
1,732
2,537
32,682
3.6%
1,336
4.3%
(207)
869
46
915
30,098
5.5%
1,351
4.6%
(223)
914
103
1,017
29,353
4.6%
1,341
4.7%
(268)
837
16
853
0.68
0.67
0.90
0.88
0.48
2.48
2.39
0.79
0.77
0.47
0.88
0.85
0.84
0.81
0.44
0.92
0.89
0.82
0.80
0.40
0.73
0.72
0.72
0.70
0.29
Free cash flow
Net cash from operating, investing and financing activities
1,055
(1,005)
1,109
681
1,051
(511)
845
(226)
1,029
(157)
Capital expenditures (including acquisitions)2
Capital expenditures as % of net sales
1,005
3.1%
843
2.6%
1,876
5.7%
880
2.9%
1,104
3.8%
Regular capital expenditures
Regular capital expenditures as % of net sales
740
2.3%
830
2.5%
929
2.8%
807
2.7%
846
2.9%
0.7529
0.7533
0.7782
0.7189
0.7555
Net sales
Net sales growth at constant exchange rates1
Operating income
Underlying operating margin
Net interest expense
Income from continuing operations
Income (loss) from discontinued operations
Net income
Net income per common share (basic)
Net income per common share (diluted)
Income from continuing operations per common share (basic)
Income from continuing operations per common share (diluted)
Dividend per common share
Average exchange rate (€ per $)
1 Net sales growth in 2010 is adjusted for the impact of week 53 in 2009.
2 The amounts represent additions to property, plant and equipment, investment property and intangible assets. The amounts include assets acquired through business combinations and exclude discontinued operations.
Ahold at a glance
Business review
Governance
Financials
Investors
Five-year overview
Ahold
Annual Report 2014
167
Balance sheet and other information
December 28,
2014
December 29,
2013
December 30,
2012
January 1,
2012
January 2,
2011
4,844
3,197
6,520
3,021
5,146
3,246
5,810
3,680
5,910
3,561
1,886
1,311
14,138
3,963
(942)
15,142
1,886
1,360
14,572
2,592
1,088
15,228
2,824
737
14,725
3,206
3,131
3,074
3,008
2,970
126
123
125
121
128
227
222
225
218
213
823
14.66
982
13.22
1,039
10.16
1,060
10.41
1,145
9.88
Market capitalization2
12,059
12,989
10,551
11,033
11,314
Year-end exchange rate (€ per $)
0.8213
0.7277
0.7566
0.7724
0.7474
€ million
Equity2
Gross debt
Cash, cash equivalents, and short-term deposits and similar instruments
Net debt
Total assets
Number of stores1
Number of employees (in thousand FTEs)1
Number of employees (in thousands
headcount)1
Common shares outstanding (in millions)2
Share price at Euronext (€)
1 The number of stores and employees include discontinued operations (Slovakia).
2 In 2014, €1,232 million was returned to shareholders through a share buyback (2013: €768 million, 2012: €277 million, 2011: €837 million and 2010: €386 million) and €1,007 million as a result of the capital
repayment (see Note 20).
Ahold at a glance
Business review
Governance
Financials
Investors
Contact information
Ahold
Annual Report 2014
168
Contact information
Ahold proactively maintains an open dialogue with shareholders, providing accurate information in a timely and consistent way. The Company does this through press releases, the Annual Report, presentations, webcasts, and
regular briefings with analysts, fund managers and shareholders.
Ahold is covered by approximately 30 analysts who frequently issue reports on the Company.
Corporate website
Whether you want to view the Company’s latest press releases or learn more about our local brands and heritage, our commitment to being a responsible retailer, or our approach to corporate governance, Ahold’s corporate
website provides a wealth of information for shareholders. If you have a general question about your shareholding, the “Financial information” section of our corporate website can help, as it contains much of the information
that is most frequently requested from our shareholder helpline. Investors are also encouraged to sign up to receive emailed news alerts, which include all financial news releases throughout the year. You can access the
corporate website at www.ahold.com
The Company is responsible for the maintenance and integrity of the financial information on our website. This information has been prepared under the relevant accounting standards and legislation.
Electronic communication
In recent years, changes in legislation have removed the requirement for companies to mail large quantities of paper communications to shareholders. Instead, companies are choosing to communicate with their shareholders
via the internet, because of its speed and environmental benefits, and to save costs. Ahold actively encourages shareholders to sign up to receive electronic communications, as part of our commitment to being a responsible
retailer. For information about how to register to receive electronic communications, please visit the “Contact us” section of our corporate website.
How to get in touch
Group Communications
Marike Westra
SVP Group
Communications
[email protected]
Investor Relations
Media Relations
Tim van der Zanden
Head of External Communications
[email protected]
+31 88 659 51 34
Investor Relations
Henk Jan ten Brinke
VP Investor Relations
Kim Verdouw-Essebaggers
Senior Manager Investor Relations
[email protected]
[email protected]
+31 88 659 52 13
+31 88 659 52 13
Ahold at a glance
Business review
Contact information
General information
Ahold Group Communications
Provincialeweg 11
1506 MA Zaandam
The Netherlands
Telephone: +31 88 659 5100
Email: [email protected]
www.ahold.com
Trade Register No. 35000363
Shareholder information
Ahold Investor Relations
Provincialeweg 11
1506 MA Zaandam
The Netherlands
Telephone: +31 88 659 5213
Email: [email protected]
Visiting address
Ahold Corporate Center
Provincialeweg 11
1506 MA Zaandam
The Netherlands
ADR information
Deutsche Bank Trust Company Americas
c/o American Stock Transfer & Trust Company
Peck Slip Station
P.O. Box 2050
New York, NY 10272-2050
Email: [email protected]
Shareholder Service (toll-free) Tel. (866) 706-0509
Shareholder Service (international) Tel. (718) 921-8124
http://www.amstock.com
Governance
Financials
Investors
Ahold
Annual Report 2014
169
Ahold at a glance
Business review
Cautionary notice
Governance
Financials
Investors
Ahold
Annual Report 2014
170
This Annual Report contains forward-looking statements, which do not refer to historical facts but refer to expectations based on management’s current views and assumptions and involve known and unknown risks and
uncertainties that could cause actual results, performance, or events to differ materially from those included in such statements.
Many of these risks and uncertainties relate to factors that are beyond Ahold’s ability to control or estimate precisely, including but not limited to, Ahold’s ability to successfully implement and complete its plans and strategies
and to meet its targets, the benefits from Ahold’s plans and strategies being less than anticipated, the effect of general economic or political conditions, Ahold’s ability to retain and attract employees who are integral to the
success of the business, business and IT continuity, collective bargaining, distinctiveness, competitive advantage and economic conditions, information security, legislative and regulatory environment and litigation risks, product
safety, pension plan funding, strategic projects, responsible retailing, insurance, unforeseen tax liabilities and other factors discussed in this Annual Report, in particular the paragraphs on How we manage risk and in Ahold’s
other public filings and disclosures. Readers are cautioned not to place undue reliance on these forward-looking statements, which speak only as of the date of this Annual Report. Ahold does not assume any obligation to
update any public information or forward-looking statement in this Annual Report to reflect events or circumstances after the date of this Annual Report, except as may be required by applicable laws.
Outside the Netherlands, Ahold presents itself under the name of “Royal Ahold” or simply “Ahold.” For the reader’s convenience, “Ahold,” “the Company,” “the company,” “Ahold group,” or “the Group” is also used throughout
this Annual Report. The Company’s registered name is “Koninklijke Ahold N.V.”
Nielsen’s information as included in this Annual Report does not constitute a reliable independent basis for investment advice or Nielsen’s opinion as to the value of any security or the advisability of investing in, purchasing or
selling any security.

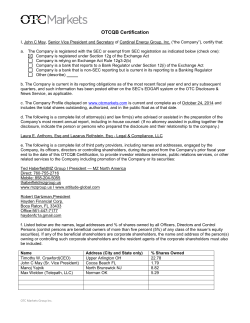


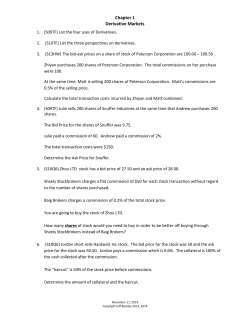


© Copyright 2026