
NMR Characterization of Changes in the Apparent Diffusion Coefficient of Water
NMR Characterization of Changes in the
Apparent Diffusion Coefficient of Water
Following Transient Cerebral Ischemia
A dissertation submitted to the faculty of
Worcester Polytechnic Institute
In partial fulfillment of the requirements for the degree of
Doctor of Philosophy in Biomedical Engineering
_______________________________
Matthew D. Silva
February, 2002
Approved:
_______________________________
Christopher H. Sotak, Ph.D.
Professor and Head, Major Advisor
Biomedical Engineering Department
Worcester Polytechnic Institute
_______________________________
_______________________________
Karl G. Helmer, Ph.D
Research Assistant Professor
Biomedical Engineering Department
Worcester Polytechnic Institute
Fuhai Li, M.D.
Research Assistant Professor
Neurology Department
UMass Memorial Healthcare and the
University of Massachusetts Medical School
_______________________________
_______________________________
Alexander J. de Crespigny, Ph.D.
Associate Physicist
Instructor, Department of Radiology
Massachusetts General Hospital
Robert A. Peura, Ph.D.
Professor
Biomedical Engineering Department
Worcester Polytechnic Institute
Dedicated to my wife and baby. . .
Acknowledgements
I would like to thank my advisor, Chris Sotak, who has always encouraged exploration
and free thinking. Chris was patient during my most confused times and congratulatory during my successes. He has set a mark as a scientist that I can only hope to achieve.
I would like to thank Karl Helmer. Karl always encouraged discussions that made me
feel that I was able to contribute to his work; however, I could never repay the assistance and
confidence that he has given me.
I would like to thank Fuhai Li. The bulk of my work was a joint venture between Fuhai
and myself, and I would not have had such success without him. Beyond his skills as a scientist and a physician, Fuhai is a great friend.
I would like to thank Rick Carano. Rick gave me guidance from the first day that I arrived at WPI, and he has returned every call I’ve placed to him since. I look forward to working with Rick in the future.
I would like to thank Marc Fisher for surrounding the NMR group with the personnel
and resources to contribute to the field of stroke research. Also, Marc gave unrelenting enthusiasm and energy to every study. Thanks to Tsuyoshi, Xiangjun, Wolf, Katsumi, Pierre,
Erdem, and Magdi: I wish you all continued success.
Our lab has always been entertaining, and I’m thankful that I’ve been able to spend the
past few years with Jeremy Wellen. Sometimes it was the misery that loved the company, but
mostly it was nice to have a friend who understood. Thanks to Mark Kazemi for his brief and
entertaining stay. Special thanks to Sam, Mike, and Katariina for all their help and guidance
during the early years. Additional thanks to Orna, Alicia, Erica, and Deirdre for our productive collaborations and entertaining conversations during the later years. Lastly, thanks to
Larry and Bernie for their inspiration.
Most gratefully, I would like to thank my wife, Alicia, who often asked me, “Is there
anything I can do to help?” I would laugh and decline, but in truth I not would have succeeded without her.
Table of Contents
Abstract
v
1
1.1
1.1.1
1.1.2
1.1.3
1.1.4
1.1.5
1.1.6
1.1.7
1.2
1.2.1
1.2.2
1.3
1.3.1
1.3.2
1.3.3
1.3.4
1.4
1.4.1
1.4.2
1.4.3
1.4.4
1.4.5
Introduction
Basic Concepts in Nuclear Magnetic Resonance
Nuclear Magnetic Moment and Angular Momentum
Quantum Mechanical Restriction of µ and ρ
Nuclear Energy States
Classical Description of NMR
Free Induction Decay
The Spin Echo
The Bloch Equations
Nuclear Magnetic Relaxation
T1 Relaxation
T2 Relaxation
Principles of Molecular Diffusion in NMR
Self-diffusion of Molecules
Restricted Molecular Diffusion
Anisotropic Diffusion
Spin Labeling with Magnetic Field Gradients
Principles of Magnetic Resonance Imaging
Slice Selection
Frequency Encoding
Phase Encoding
Mapping k-Space
Diffusion-weighted EPI
2
2
3
5
8
10
12
13
15
15
17
20
20
22
24
25
28
29
31
33
35
37
2
2.1
2.2
2.3
2.4
2.4.1
2.4.2
MRI of Cerebral Ischemia
Introduction
Normal Cerebral Cellular Physiology
Etiology and Pathophysiology of Ischemic Stroke
Diffusion-weighted MRI of Cerebral Ischemia
DWI of Transient Cerebral Ischemia
MR Changes of Intra- and Extracellular Water
40
40
41
43
45
51
3–9
3
Research Papers
Temporal Evolution of Ischemic Injury Evaluated with
Diffusion-, Perfusion-, and T2-weighted MRI
Preface
Abstract
Introduction
Materials and Methods
Animal preparation
Focal ischemia induction
59
60
61
62
62
62
3.1
3.2
3.3
3.4
3.4.1
3.4.2
i
3.4.3
3.4.4
3.4.5
3.4.6
3.5
3.6
3.7
MRI measurements
Data analysis
In vivo lesion size calculation and post mortem evaluation
Statistical analysis
Results
Discussion
Acknowledgements
63
66
67
68
69
73
79
4
Transient and Permanent Resolution of Ischemic Lesions on
Diffusion-Weighted Imaging After Brief Periods of Focal
Ischemia in Rats: Correlation with Histopathology
Preface
Abstract
Introduction
Materials and Methods
Animal preparation
Focal cerebral ischemia
MRI measurements
Analysis of the region of interest
Histopathological evaluation
Statistical analysis
Results
Physiological variables
MRI findings
Histological outcomes
Discussion
Ischemic and post-ischemic changes on PWI and DWI
Tissue damage
Detection of incomplete infarction by other imaging techniques
Clinical implications
Acknowledgements
80
81
82
83
83
83
84
87
88
89
89
89
89
92
95
95
97
98
99
100
Secondary Decline in the Apparent Diffusion Coefficient and
Neurological Outcomes After a Short Period of Focal Brain
Ischemia in Rats
Preface
Abstract
Introduction
Materials and Methods
Surgical preparation and focal brain ischemia
MRI measurements
Region-of-interest analysis and in vivo lesion size calculation
Evaluation of neurological outcomes
Evaluation of tissue injury
Statistical evaluation
Results
101
102
103
104
104
105
107
107
108
109
110
4.1
4.2
4.3
4.4
4.4.1
4.4.2
4.4.3
4.4.4
4.4.5
4.4.6
4.5
4.5.1
4.5.2
4.5.3
4.6
4.6.1
4.6.2
4.6.3
4.6.4
4.7
5
5.1
5.2
5.3
5.4
5.4.1
5.4.2
5.4.3
5.4.4
5.4.5
5.4.6
5.5
ii
5.5.1
5.5.2
5.5.3
5.6
5.6.1
5.6.2
5.7
MRI study
Neurological function
Histological outcomes
Discussion
ADC changes over time
Recovery of neurological deficits
Acknowledgements
110
114
115
116
116
119
120
6
Comparison of the Temporal and Spatial Evolution of the
Water Apparent Diffusion Coefficient and T2 Following
Transient Middle Cerebral Artery Occlusion in Rats
Preface
Abstract
Introduction
Methods
Transient Middle Cerebral Artery Occlusion
MRI Methods
Data analysis
Results
Discussion
121
122
123
125
125
126
128
130
135
Acute Post-Ischemic Renormalization of the Apparent Diffusion
Coefficient of Water is not Associated with Reversal of
Astrocytic Swelling and Neuronal Shrinkage
Preface
Abstract
Introduction
Methods
Animal preparation and induction of focal brain ischemia
MRI measurements
Analysis of CBF index and ADC values
Histopathological evaluation
Statistical analysis
Results
Cerebral blood perfusion
ADC changes
Histological outcomes
Discussion
Acute ADC declines and morphological changes
Acute ADC renormalization and cellular injury
Histopathological features of secondary ADC declines
Conclusion
Acknowledgements
140
141
142
143
143
144
146
147
149
149
149
149
150
155
156
157
159
159
159
6.1
6.2
6.3
3.4
6.4.1
6.4.2
6.4.3
6.5
6.6
7
7.1
7.2
7.3
7.4
7.4.1
7.4.2
7.4.3
7.4.4
7.4.5
7.5
7.5.1
7.5.2
7.5.3
7.6
7.6.1
7.6.2
7.6.3
7.7
7.8
iii
8
Deconvolution of Compartmental Water Diffusion Coefficients
in Yeast-cell Suspensions Using Combined T1 and Diffusion
Measurements
Preface
Abstract
Introduction
Theory
Methods
Yeast preparation
NMR experiments
Data analysis
Results
Discussion and Conclusions
Acknowledgements
160
161
162
165
167
167
168
169
172
181
188
9.1
9.2
9.3
9.4
9.4.1
9.4.1.1
9.4.1.2
9.4.2
9.4.3
9.4.4
9.4.5
9.4.6
9.4.7
9.5
9.5.1
9.5.2
9.5.3
9.6
9.6.1
9.6.2
9.6.3
9.6.4
9.7
Separating MR Changes of Intra- and Extracellular Water in
Focal Cerebral Ischemia in the Rat Brain
Preface
Abstract
Introduction
Methods
Animal preparation
CR infusion procedure
Focal ischemia
MR methods
CR steady-state equilibrium and stability
Volume-localized DW-IRSE spectroscopy
DW-IRSE sequence
DW-EPI
Experimental protocols
Data analysis
CR steady-state equilibrium and stability
Experimental data modeling
ROI analysis of ADCz and ADCav maps
Results
CR steady-state equilibrium and stability
TE-dependence of IR curves
Spectroscopic experiments
Imaging experiments
Discussion
189
190
191
195
195
195
196
197
197
198
198
200
200
202
202
203
206
206
206
207
211
212
213
10
Summary
228
References
Curriculum Vitae
240
256
8.1
8.2
8.3
3.4
8.5
8.5.1
8.5.2
8.5.3
8.6
8.7
8.8
9
iv
Abstract
Magnetic resonance imaging (MRI) is a valuable research and clinical imaging modality
for the non-invasive detection and characterization of cerebral ischemia. Specifically, diffusion-weighted imaging (DWI), which derives image contrast based on the diffusion of endogenous water molecules, is sensitive to cerebral ischemia within minutes of the onset of
stroke. In combination with perfusion-weighted imaging (PWI) and T2-weighted imaging
(T2WI), DWI can be used to characterize the temporal and spatial evolution of cerebral
ischemia. The primary role of this dissertation is to outline several studies that investigate
DWI, PWI, and T2WI changes in a rat stroke model of transient cerebral ischemia. Secondarily, this dissertation will introduce the method and results of an experiment designed to elucidate the relative roles of the intracellular (IC) or extracellular (EC) spaces to the water diffusion coefficient changes that occur as a result of cerebral ischemia.
The use of MRI to detect cerebral ischemia is well established; however, the ability to
distinguish between reversibly and irreversibly damaged tissues is limited. It has been shown
in temporary focal ischemia models that the DWI abnormality (manifested as an image hyperintensity in the DWI) can be resolved if reperfusion is performed soon after the onset of
the stroke. Initial studies suggested that the renormalization of water diffusion was associated
with permanent restoration of cellular function (i.e., infarction was prevented). However,
subsequent studies demonstrated that the disappearance of the acute ischemic lesion following reperfusion is not necessarily permanent and is related to the duration of the transient insult. Following short occlusions [e.g., 10 minutes in a rat middle cerebral artery occlusion
v
(MCAO) model], there is complete tissue renormalization and restoration of normal neurological function. In contrast, following long periods of occlusion (e.g., 90 minutes), there are
areas of the brain that do not recover and progress to infarction without delay. Intermediate
durations of occlusion (e.g., 30 minutes) exhibit complete renormalization in all regions of
ischemia; however, following several hours there is a gradual, secondary decline of the water
diffusion coefficient values within the regions initially defined as abnormal. In this dissertation, the significant temporal and spatial heterogeneity in the secondary diffusion changes
will be described and evaluated. Ultimately, MR techniques may provide valuable information regarding the response of tissue to transient ischemia as well as potential avenues for
therapeutic intervention, which would have major clinical benefit.
The significant changes in the apparent diffusion coefficient (ADC) of water that occur
in ischemic brain are still not well understood. The leading hypothesis suggests that cellular
swelling associated with the failure of the ionic gradient across the cell membrane results in
an increase in EC tortuosity of the diffusion paths. Another theory suggests that the influx of
fast-diffusing EC water, that occurs during cellular swelling, increases the proportion of water in the IC space, which is more restricted and viscous than the EC space. The final experiment presented herein demonstrates that significant cellular swelling remains in the regions
of renormalized of ischemic ADC values that occur following reperfusion in transient ischemia. In short, the changes in the ADC values are not only the result of cellular swelling.
Since conventional MR data contains the combined signals from the IC and EC spaces, it is
difficult to determine the separate roles of these two compartments to the overall changes in
water ADC. In the first research study, a method for separating the NMR signals is introduced using a yeast-cell model. This method utilizes differences in the compartmental relaxa-
vi
tion properties to isolate the MR signals from IC and EC spaces, and then secondarily the
diffusion coefficients can be calculated. Using a modified version of this method, the experiment was performed in normal and ischemic rat brain. Intracerebroventricular (ICV) infusion of an MR contrast reagent (CR) was used to isolate IC T1, T2, and ADC values in vivo
in normal and middle cerebral artery occluded (MCAO) rats using volume-localized, diffusion-weighted inversion-recovery spin-echo (DW-IRSE) spectroscopy and diffusionweighted echo-planar imaging (DW-EPI). The presence of the EC contrast reagent (CR) selectively enhances the relaxation of water in the EC space and allows the IC and EC signal
contributions to be separated based on T1-relaxation time differences between the two compartments. The results presented in this dissertation suggest that the IC ADC value is the major determinant of the overall ADC value measured in the normal rat brain. Further, the data
suggests that the ADC decline experienced during acute ischemia is dictated largely by
changes in the IC ADC, possibly due to failure of energy-dependent IC microcirculation (cytoplasmic streaming).
The complexity of these studies requires the expertise and coordination of researchers
with MRI skills as well as animal modeling and histology experience. Due to my own significant contributions to the research presented herein, this dissertation has been submitted in
partial fulfillment of my doctorate. Specifically, in the transient ischemia studies (Chapters
3−5 and 7), it was my responsibility to collaborate on experimental design, operate and maintain the NMR instrument, optimize pulse sequences, process and analyze the acquired data,
and contribute to the writing of the manuscript. The study presented in Chapter 6 introduced
a novel data analysis approach extended from the transient ischemia studies. The goal was to
determine if acute ADC and T2 values were predictive of secondary ADC and T2 values and
vii
infarction. My contributions to this study included extensive computer programming for image reconstruction, analysis, and statistical evaluation and principle authorship of the manuscript. The studies in Chapters 8 and 9 present a method and its application for measuring
compartmental water diffusion coefficients with the aid of a contrast reagent (CR) to separate
the intracellular (IC) and extracellular (EC) 1H2O signals via differences in their respective
longitudinal (T1) relaxation times. First, the method was evaluated using a yeast-cell suspension model (Chapter 8). My contributions to this work were development of the NMR pulse
sequences, performance of the NMR experiments, theoretical modeling, C and IDL programming for spectroscopic and image data analysis and statistical evaluation of the biexponential methods, yeast-cell suspension preparation, and principle authorship on the manuscript. Second, in Chapter 9, the application of the method is demonstrated for the measurement of IC and EC ADC values in the in vivo rat brain. Intracerebroventricular infusion of an
MR contrast reagent allowed for the separation of the IC and EC 1H2O signals as introduced
in Chapter 8. Intracellular water T1, T2, and ADC values were measured in vivo in normal
and middle cerebral artery occluded (MCAO) rats using volume-localized, diffusionweighted inversion-recovery spin-echo (DW-IRSE) spectroscopy and diffusion-weighted
echo-planar imaging (DW-EPI). My contributions to this work were development of the
NMR pulse sequences, performance of the NMR experiments, theoretical modeling, C and
IDL programming for spectroscopic and image data analysis and statistical evaluation, and
principle authorship on the manuscript.
viii
Chapter 1
Introduction to NMR Theory
1.1 Basic Concepts in Nuclear Magnetic Resonance
The goal of this section is to described the physics of nuclear behavior in an electromagnetic
(EM) environment that give rise to the nuclear magnetic resonance (NMR) phenomenon. The
explanation of NMR principles can use either classical physics or quantum mechanics to arrive at descriptions of nuclear response to a static, external magnetic field and applied radio
frequency (RF) radiation. NMR experiments include spectroscopy, where the NMR frequency reflects the location of nuclei in molecules, and imaging, where the measured NMR
frequency is proportional to the position of nuclei in space. This section will outline the origin of the NMR signal and the basic fundamentals of signal detection.
1.1.1 Nuclear Magnetic Moment and Angular Momentum
Nuclei are charged particles with rotational and magnetic properties. The motions of nuclei
are comprised of both orbital and spin components, which together yield the total nuclear angular momentum. The nucleus is viewed typically as the stationary center of an atom; however, the nucleus possesses an orbital angular momentum about its center of mass that is proportional to its mass, velocity, and orbital radius. Also, from a classical physics perspective,
the spinning of a particle (or the entire nucleus) on its rotational axis results in spin angular
momentum. The total nuclear angular momentum, ρ , is a vector quantity that describes the
direction and magnitude resulting from the cumulative effects of orbital and spin angular
momenta. Further, a charged nucleus possessing spin and orbital rotational motions (angular
momentum) will generate a local magnetic field. The direction and magnitude of this magnetic field is termed the nuclear magnetic dipole moment, µ . The relationship between the
nuclear magnetic moment, µ , and its angular momentum, ρ , is given by
2
µ = γρ ,
[1.1]
where γ is the nuclear magnetogyric (or gyromagnetic) ratio, a nucleus-specific parameter
equal to the charge-to-mass ratio of the nucleus, ez m , where z is the atomic number. In the
sections to follow the quantum mechanics and classical physics governing µ and ρ in the
presence of in a static, external magnetic field (the B0 field) and following applied RF radiation (the B1 field) will be discussed.
1.1.2 Quantum Mechanical Restrictions on µ and ρ
Classical physics would suggest that there are no specific orientation requirements of the µ
and ρ vectors. However, on the atomic level, quantum mechanics indicate that these vectors
may take only certain discrete or quantized values. This quantization is specified based on
the structure of the nucleus and can be characterized by the nuclear spin quantum number, I.
Nuclei with an odd number of protons and/or neutrons have a non-zero value of I, which may
be an integer or a half-integer depending on the isotope. The most widely exploited nucleus
in biological NMR studies is the 1H isotope due to the high concentration of water and lipids
in biological samples. The 1H isotope is comprised of only a single proton, and I equals ½;
hence 1H is referred to as a spin-½ nucleus. The spin angular momentum is quantized based
on the value I, therefore the magnitude of ρ is limited to discrete values according to
[1.2]
ρ = h[I(I + 1)] 2 ,
1
where ħ is Planck’s constant (h) divided by 2π. Another quantum number, m—termed the
magnetic spin quantum number—defines all possible states that the nuclei can occupy, where
m = −I, −I+1, · · ·, I−1, I. If the external magnetic field (B0) is taken to be oriented along the
3
z-axis of a cartesian coordinate frame, then the component ρz of the angular momentum (i.e.,
the component of ρ coincident with B0) can be used to specify the orientation of ρ and is
related to m by
[1.3]
ρ z = hm .
For a spin-½ nucleus, I = ½ and m = ± ½, indicating only two possible orientations of ρz. The
relationship between µ and ρ defined in Eq. [1.1] states that the quantization of ρ forces the
quantization of µ . The magnitude of the µ and ρ vectors for the spin-½ nucleus are
ρ=
[1.4a,b]
h 3
γh 3
and µ =
.
2
2
The z-components of the µ and ρ vectors coincident with the B0 field have respective magnitudes of
ρ± z = ±
h
γh
and µ ± z = ± .
2
2
[1.5a,b]
The quantum mechanical restrictions on µ prevent the nuclei from aligning exactly along the
direction of the B0 field, such that the magnitude of µ ≠ µ z . The direction of the µ and ρ
vectors is defined by the offset angle, θ , with respect to the B0 axis by
cos(θ ) =
m
[I(I + 1)] 2
1
[1.6]
.
For a spin-½ nucleus, θ equals 54.7º. Figure 1.1 illustrates that the two possible orientations
of µ and ρ for a spin-½ nucleus are parallel (spin-up) and anti-parallel (spin-down) relative
to the B0 field. Figure 1.1 also shows the angle, θ , between µ and ρ and the B0 field (oriented upward in the figure).
4
ρz =
h
2
µz =
γh
2
ρ
θ
µ
Β0
Figure 1.1 The quantum mechanical view of the µ and ρ vectors
orientations for a spin-½ system. The magnitudes of the vector projections along the z-axis are shown as ρz and µz.
1.1.3 Nuclear Energy States
The interaction between µ and the B0 field give rise to a potential energy, E, given by
[1.7]
E = −µ ⋅ B 0 = −µ z B 0 ,
For a spin-½ nucleus there are two possible orientations of the nuclear magnetic moment and,
consequently, two corresponding energy states. The potential energy of each state, as given
by Eq. [1.7], is dependent on the external field strength, as illustrated in Fig. 1.2. The parallel
orientation has a lower energy state, E1, than nuclear spins oriented anti-parallel to B0, which
occupy a higher energy state, E2.
Without the influence of the B0 field, the nuclear spins have no prefered orientation;
however the interaction of the external magnetic field forces spin-½ nuclei to be distributed
into either the lower or higher energy state. The equilibrium distribution of nuclei in a particular energy state is mathematically described by the Boltzmann Law:
N I = e (− E I
kT )
[1.8]
,
5
E2 =
γhB 0
2
E1, E2
B0 [T]
E1 = −
γhB 0
2
Figure 1.2 B0 field dependence of nuclear energy states, E1 and E2,
for a spin-½ system. E1 is the lower energy state, parallel to the B0
field; whereas, the higher energy state, E2, is anti-parallel to B0.
where NI is the number of nuclei in spin state I, T is temperature in degrees Kelvin (°K), and
k is the Boltzmann constant (1.38 × 10⁻²³ Joules/°K). The NMR signal is proportional to the
population difference between the lower and higher energy states, which is given by
∆n =
[1.9]
N T γhB 0
,
2kT
where ∆n is the population difference between the energy states and NT is the total number of
nuclei being considered. Equation [1.9] demonstrates the dependence of an NMR measurement on the total number (concentration) of spins, the nucleus of interest, the external magnetic field, and the temperature. The population difference can also be related to the total
magnetization within the sample. In other words, the summation of all the individual magnetic moments equals the total magnetization, M0:
M0 =
I
∑N
m
[1.10]
µ z ,m .
m=− I
For a spin-½ system, the net magnetization is related to the population difference by
6
M0 =
γh (∆n )
.
2
[1.11]
Combining Eqs. [1.9] and [1.11], the dependence of M0 on the total number (concentration)
of spins, the nucleus of interest, the external magnetic field, and the temperature is given by
[1.12]
N T γ 2h 2B 0
M0 =
.
4kT
At the Boltzmann equilibrium, the number of nuclear spins oriented parallel to the external
magnetic field (lower energy state) will always be greater in number than those in the higher
energy state. Consequently, M0 is oriented parallel to B0. M0 will be described in more detail
in the following section.
When EM radiation with frequency that matches the energy level difference between the
spin states (resonance condition) of the nuclei is applied to a spin system (at equilibrium in
an external magnetic field), the nuclei will transition between energy levels (i.e., perturbing
the Boltzmann equilibrium). The EM radiation (in the RF range of the EM spectrum) will
cause the nuclei to absorb energy and transition from the lower to the higher energy state.
The difference in the energy, ∆E, is function of the gyromagnetic ratio and the external magnetic field:
[1.13]
∆E = E 2 − E1 = hγB 0 .
Further, ∆E is also a function of the frequency, υ, of the applied RF radiation:
∆E = hυ .
[1.14]
Equating Eqs. [1.13] and [1.14] and subsequent simplification yields
υ=
γ
B0 ,
2π
[1.15]
which specifies the frequency of EM radiation that satisfies the resonance condition.
7
1.1.4 Classical Description of NMR
The NMR experiment involves placing nuclei in a static, external magnetic field, B0. From a
classical point of view, B0 exerts a force (torque) on the magnetic dipole moment of the nuclei. Since the nuclear magnetic moment is inclined at an angle with respect to B0, the interaction of µ and B0 results in a precessional motion of µ about B0. The classical physics
equation that describes this motion is the cross product of the vector quantities µ and B and
is given by
L=
[1.16]
dρ
= µ×B ,
dt
where L is torque and B consists of both the static, external magnetic field, B0, and the magnetic field of the applied RF radiation, B1. When multiplied by γ, Eq. [1.16] becomes nucleus-specific:
[1.17]
dµ
dρ
=γ
= γµ × B .
dt
dt
Without the applied RF energy (i.e., B1 equals zero), the nuclei respond only to the B0 field,
and the B in Eqs. [1.16] and [1.17] is written as only B0. The precessional frequency of the
nuclei about B0 is defined by the Larmor equation:
[1.18]
ω = − γB 0 (rad/sec).
Notice that Eq. [1.18] yields the same result as Eq. [1.14], which is in terms of frequency
units (Hz). Consequently, RF radiation applied at the Larmor frequency will satisfy the resonance condition and perturb the system away from the Boltzmann equilibrium.
Equations [1.10]–[1.12] define the net magnetization, M0, as the sum of the individual zcomponents of µ ( µ z ) associated with the population difference between the spin states.
From a classical point of view, it is also convenient to move beyond the view of individual
8
magnetic moments and invoke the net magnetization vector, M. First, it is important to elucidate the distinction between the net magnetization, M0, and the net magnetization vector, M,
which is the intensity of the magnetization or the magnetic moment per unit volume. Accordingly, Eq. [1.17] can be rewritten to characterize the effect of the B0 and B1 magnetic fields
on M according to classical principles:
dΜ
= γΜ × B .
dt
[1.19]
The net magnetization, M0, is the component of the M vector that is coincident with the external B0 field. Referring to Fig. 1.3: NMR convention defines the cartesian coordinate axis
such that the B0 field points along the z-axis; M has the same precessional properties as the
vector sum of the individual magnetic moments; The longitudinal component of the M vector, Mz, is equal to the net magnetization, M0, which was mathematically defined in Eqs.
[1.10]–[1.12].
The leftmost illustration in Fig. 1.3 shows a small number of magnetic moments oriented
according to the Boltzmann distribution (for a spin-½ nucleus) in the presence of the B0 field.
The precession of the nuclei about B0 is indicated by the arrow. The middle illustration demonstrates that nuclei in the parallel orientation with the B0 field are in excess of nuclei in the
anti-parallel orientation. The vector sum of the numerical difference between the two orientations is the net magnetization vector (M), which is shown in the rightmost illustration. In the
same manner as described for the individual nuclei, the external magnetic field (subsummed
into B in Eq. [1.19]) will cause the precession of M about B0.
9
1.1.5 Free Induction Decay
In the NMR experiment, the sample of interest is surrounded by an RF resonant circuit and is
placed within the external magnetic field (i.e., the B0 field of the NMR magnet). The role of
the RF circuit is to apply alternating current at the Larmor frequency and (in the usual case)
to detect the subsequent time-dependent changes in the NMR magnetization. For example,
consider the RF resonant circuit to be a coil of wire (solenoid) wound about the sample. The
current passed through the coil will generate a magnetic field within the wire coil, which is
oriented such that the generated RF magnetic field (the B1 field) is perpendicular to the external (B0) field. When the resonance condition is met, the nuclei respond to the influence of
the B1 field. As illustrated in Fig. 1.4, M0 at equilibrium is parallel to the B0 field, which is
oriented along the positive z-axis of a cartesian coordinate frame. A second RF magnetic
field, B1, applied at the resonance frequency in the transverse (x-y) plane causes M0 to precess or “tip” into the transverse plane. The angle of rotation, θ , is given by Eq. [1.20].
B0
B0
B0
M0
M
Figure 1.3 Left: Distribution and precession of nuclei of a spin-½
system in the presence of an external magnetic (B0) field. The arrows
indicate individual magnetic moments. Middle: The excess of nuclei
that are parallel with the B0 field. Right: The vector sum of all the
individual magnetic moments is expressed as the net magnetization
vector, M, which has the same precessional properties as the
individual nuclear magnetic moments. The z-component of M (Mz)
is the longitudinal magnetization, M0.
10
[1.20]
θ = γB1 τ ,
where θ is the tip angle and τ is the duration of the B1 field application. Typically, RF pulses
are applied to tip the magnetization either completely into the transverse plane ( θ = 90° or a
90° pulse) or onto the negative z-axis ( θ = 180° or a 180° pulse).
As the relaxation processes return the spin system to the Boltzmann equilibrium, the
NMR signal is detected in the x-y (tranverse) plane, and the signal decays exponentially by
T2* relaxation. T2* relaxation is a combinations of the intrinsic T2 relaxation of the nuclei and
contributions from magnetic susceptibilities, field inhomogeneities, and molecular diffusion.
(T2 and T2* relaxation will be further discussed in Section 1.2.) The precessing transverse
magnetization induces a sinusoidally oscillating, exponentially decaying NMR signal in the
RF coil and is termed the free induction decay (FID). The left side of Fig. 1.5 shows that the
FID (▬) is the convolution of a sinusoid (---) and a decaying exponential (—). The Fourier
pair of the FID is a Lorentzian function, which is shown on the right side of Fig. 1.5. T2* is
z
B0
θ
M0
y
B1
x
Figure 1.4 The B1 field from the RF radiation that satisfies the
resonance condition of the nuclei is applied perpendicular to the B0
field. M0 precesses about the B1 field, and coherently tips the
magnetization into the transverse plane at an angle θ, which is
dependent on the strength and duration of the B1 field excitation.
11
1
1
0
0.5
-1
0
υ½
Figure 1.5 Left: The FID (? ) is the convolution of a sinusoid (---)
and a decaying exponential (—). Right: The Fourier transform of the
FID is the Lorentzian function. The width of the Lorentzian at the
half maximum, υ½, (indicated by the arrows) is related to T2* by Eq.
[1.21].
the FID decay time constant, and the associated T2* feature of the Lorentzian function is the
full width at half maximum, υ½, which is equal to
υ1 =
2
[1.21]
1
.
πT2*
1.1.6 The Spin Echo
In 1950, Erwin Hahn detailed the existence of the spin echo, which is best described by referring to Fig. 1.6. Following a 90º pulse, during which the magnetization had been coherently
tipped into the transverse plane, the FID signal decays away due to the dephasing of the x-y
magnetization vector. The dephasing results from the inhomogeneity of precessional frequencies in the ensemble of nuclei. (The processes governing spin dephasing are discussed in
detail in Section 1.2.2). In general, due to local magnetic field differences, some nuclei precess faster than the Larmor frequency and some slower—this feature is demonstrated in the
lower diagrams of the magnetization in Fig. 1.6. After some finite period of time, τ, a 180º
RF pulse is applied such that the spins rotate about the y-axis and the relative positions of the
12
90ox
τ
180oy
τ
Figure 1.6 Diagram of the formation of the spin echo. Following a
90º pulse, the FID signal decays away due to the dephasing of the
transverse magnetization—some nuclei precess faster than the
Larmor frequency and some slower. A 180º RF pulse reverses the
relative positions of the fast and slow spins. The NMR signal is reestablished as the fast-precessing spins catch up with the slowprecessing spins and converge on the y-axis.
fast and slow spins are reversed. The NMR signal is re-established after a second τ period as
the fast-precessing spins catch up with the slow-precessing spins and converge on the y-axis.
This process is the formation of the spin echo.
1.1.7 The Bloch Equations
The net magnetization responds dynamically to the presence of the static, external magnetic
field, B0, the subsequent application of RF radiation, and the effects of nuclear relaxation
processes. This dynamic behavior is described mathematically by the Bloch equations
(Bloch, 1946). The Bloch differential equations describe the behavior of the constituent components {Mx, My, and Mz} of the magnetization vector, M, in the presence the B0 and B1
fields and nuclear relaxation.
dM x
M
= γB 0 M y + γB 1 M z sin (ωt ) − x
dt
T2
13
[1.22]
dM y
dt
= − γB 0 M x + γB 1 M z cos(ωt ) −
My
T2
M − M0
dM z
= − γB 1 M z sin (ωt ) + M y cos(ωt ) − z
dt
T1
[
]
[1.23]
[1.24]
The terms in Eqs. [1.22] and [1.23] containing a B0 term are the Larmor precession terms, as
a result of the torque exerted by the external field on the transverse components of the magnetization resulting in the precessing about the field. In a frame of reference rotating at the
Larmor frequency, the B0 terms in Eqs. [1.22] and [1.23] go to zero. The B1 terms in the
Bloch equations describe the change in magnetization resulting from applied RF radiation.
Figure 1.4 previously illustrated the behavior of M0 during the application of a B1 field in the
rotating frame of reference.
Lastly, following the termination of the B1 field, the system subsequently returns to the
Boltzmann equilibrium. The T1 and T2 terms in Eqs. [1.22]–[1.24] are the time constants associated with the equilibration of the net magnetization and are referred to as longitudinal
and transverse relaxation, respectively. A review of the mechanisms governing T1 and T2 relaxation will be covered in Section 1.2; however, the mathematics will be first introduced
below. In the absence of the B1 field, the B1 terms in Eqs. [1.22]–[1.24] go to zero. Following
this modification, the Bloch equations describe the change in the net magnetization towards
the Boltzmann equilibrium. Without the effects of the B1 field and considering the system in
a reference frame rotating at the Larmor frequency (in which case B0 is effectively equal to
zero), Eqs. [1.22]–[1.24] can be rewritten as
dM xy
dt
=−
[1.25]
M xy
T2
and
14
dM z
M − M0
=− z
.
dt
T1
[1.26]
In Eq. [1.25], the transverse components of the magnetization, Mx and My in Eqs. [1.22] and
[1.23], are combined in. The solutions to Eqs. [1.25] and [1.26] are
M xy (τ ) = M 0 e − τ T2
[1.27]
and
(
)
M z (τ ) = M 0 1 − αe − τ T1 ,
[1.28]
where α in Eq. [1.28] equals 1 or 2 for a 90º or 180º pulse, respectively.
1.2 Nuclear Magnetic Relaxation
The two main nuclear relaxation mechanisms are spin-lattice (T1) relaxation and spin-spin
(T2) relaxation. Nuclei in various tissues often have intrinsically different relaxation time
constants, thus allowing T1 and T2 to be used to generate contrast in MRI applications. The
following sections describe T1 (1.2.1) and T2 (1.2.2).
1.2.1 T1 Relaxation
Spin-lattice relaxation, also called T1 or longitudinal relaxation, is the relaxation process that
occurs due to energy dissipation between a proton and the surrounding molecular and atomic
environment (the lattice). The most efficient T1 relaxation occurs when a molecule is rotating
or translating at a rate close to the Larmor frequency. Free water exhibits extremely inefficient (i.e., long) T1 relaxation due to its small molecular size and fast rotational rate (or short
correlation time). According to the Larmor equation (Eqs. [1.15] and [1.18]), the 1H resonance frequency in a 2 Tesla (T) magnetic field is 85.57 MHz. The correlation of free water
equates to a rotational frequency of approximately 100,000 MHz, which is significantly
15
higher than the Larmor frequency and accounts for the inefficient T1 relaxation. In a biological system, water may transiently bind to larger molecules, which will slow the average rotational correlation time of the water molecules closer to the Larmor frequency and thus significantly shortening the T1 value.
Figure 1.7 illustrates the inversion recovery (IR) pulse sequence commonly used for the
measurement of T1 relaxation and an illustration of the behavior of the magnetization vector,
M. A 180° RF pulse is applied at the Larmor frequency, with the B1 field perpendicular to
the direction of the main magnetic field, B0, and perturbs the system away from the Boltzmann equilibrium. After the termination of the B1 field, the protons will dissipate energy via
thermal interaction with the lattice and return to Boltzmann equilibrium. This energy dissipation results in the return of M to the equilibrium position aligned parallel with the B0 field.
As introduced in Eq. [1.24], the time constant associate with the return to equilibrium of the
longitudinal (or z) magnetization is the T1 relaxation time constant. In the IR sequence shown
in Fig. 1.7, the time interval TI is commonly referred to as the inversion time. Figure 1.8
shows the normalized change in the measured magnetization for an example data set for a
180
o
x
TI
90ox
RF
M
Figure 1.7 Top: IR pulse sequence for the measurement of T1
relaxation. Bottom: The changes in the magnetization, M, are
illustrated by the arrows.
16
1
Signal Intensity [a.u.]
0.8
0.6
0.4
0.2
0
-0.2 0
-0.4
100
200
300
400
500
600
700
800
900
TI [ms]
-0.6
-0.8
-1
Figure 1.8 Normalized signal intensity change as a function of
inversion time (TI) for nuclei with a 100 millisecond T1 relaxation
time constant.
nuclei with a 100 millisecond T1 relaxation time constant. Fitting the data in Fig. 1.8 to Eq.
[1.28] allows the T1 relaxation time to be calculated.
1.2.2 T2 Relaxation
T2 relaxation, the relaxation time constant associated with spin dephasing in the transverse
plane, is also called spin-spin or transverse relaxation. Following application of a 90º RF
pulse, the net magnetization in the sample begins to precess coherently into the transverse
plane. Transverse relaxation is facilitated by any process that results in a loss of phase coherence between the individually precessing nuclear magnetic moments. The most efficient
transverse relaxation occurs in the presence of static or slowly fluctuating local magnetic
fields within a sample. As nuclei experience a transient change in their local magnetic field,
the nuclei temporarily resonate at the frequency of the local field, which may be slightly
slower or faster than the Larmor frequency. This transient field alteration results in a phase
shift and an overall decrease in the phase field coherence of the transverse magnetization.
17
Large, rigid molecules (e.g., proteins, phospholipids, and polysaccharides) have exceedingly
slow molecular mobility and motion, which results in very short T2 relaxation times. In fact,
as molecular motions become truly static as in a solid (e.g., ice), the molecular motions are
extraordinarily limited and T2 relaxation is extremely efficient and reduces the NMR “visibility” of these nuclei. Conversely, spins with high molecular mobility and fast correlation
times effectively average out the local field inhomogeneities resulting in long T2 relaxation
times. Free (unbound) water exhibits inefficient T2 relaxation due to the small molecular size
and fast tumbling rate. In biological systems, water molecules transiently bind with large
molecules. As described above, these large molecules have slow molecular mobility, and
while the water is associated with these molecules, the measured 1H2O T2 time constant becomes shorter. Therefore, T2 relaxation is in direct correlation with the average molecular
mobility in a sample.
Figure 1.9 shows a Hahn spin-echo pulse sequence used for the measurement of T2 relaxation and an illustration of the behavior of the magnetization vector, M. Following the application of a 90° RF pulse, with the B1 field perpendicular to the direction of the external
magnetic field in the rotating frame of reference, the magnetization coherently tips into the
transverse plane. When the B1 field is removed, the nuclei precess about the B0 field. The
protons also experience the minute magnetic field produced by neighboring protons and
magnetic field distortions locally caused by B0 field inhomogeneities and sample susceptibility. The heterogeneity within the sample and the spin-spin interactions causes the nuclei to
precess at different frequencies about the B0 field. Some nuclei precess faster than the Larmor frequency, some slower than the Larmor frequency, and some at the Larmor frequency
(i.e., there is a distribution of precessional frequencies). As shown in Fig. 1.9 (in the rotating
18
frame of reference), the loss of phase coherence is depicted as a fanning out of the transverse
magnetization. After some period of time, the composite vector of magnetization in the
transverse plane is completely dephased. The time constant associated with the dephasing of
spins in the transverse plane is the T2* relaxation, which was introduced in Section 1.1.4 as
the decay constant of the FID. T2* relaxation is related to the T2 relaxation by
[1.29]
1
1
1
1
1
=
+
+
+
,
*
T2 T2 T2(sus ) T2(in hom) T2( diff )
where T2(sus) is the transverse relaxation due to susceptibility, T2(inhom) is the transverse relaxation due to B0 field inhomogeneities, and T2(diff) is the transverse relaxation due to molecule
diffusion. If a 180º RF pulse is applied, the relative positions of the individual magnetic moments are reversed. After a period of time equal to the time allowed for dephasing, the precessing nuclei will converge and the net magnetization will be reformed to give a spin echo.
The spin echo removes the confounding static susceptibility and inhomogeneity effects, and
the decay in the measured magnetization results exclusively from T2. Referring to Eq. [1.25],
the time interval τ is commonly referred to as the echo time (TE). A plot of signal intensity
90ox
TE/2
180oy
TE/2
RF
M
Figure 1.9 Top: Spin-echo pulse sequence for the measurement of
T2 relaxation. Bottom: The changes in the magnetization, M, are
illustrated by the arrows. The thin arrows in the magnetization
diagram around the 180° RF pulse indicate the dephasing and
rephasing of the signal.
19
Signal Intensity [a.u.]
1
0.8
0.6
0.4
0.2
0
0
100
200
300
400
500
600
700
800
900
TE [ms]
Figure 1.10 Normalized signal intensity change as a funtion of echo
time (TE) for a species with a 100 millisecond T2 relaxation time
constant.
versus time for a sample with a 100 millisecond T2 relaxation time constant is shown in Fig.
1.10. Fitting the data in Fig. 1.10 to Eq. [1.27] allows the T2 relaxation time to be calculated.
1.3 Principles of Molecular Diffusion in NMR
1.3.1 Self-diffusion of Molecules
The random translational motion of molecules or ions is driven by internal kinetic (thermal)
energy, known as Brownian motion. The rate of translation is the diffusion coefficient, D, is
described by the Stokes-Einstein equation:
D=
[1.30]
kT
kT
=
,
f
6πηrs
where k is the Boltzmann constant, T is the temperature, f is the friction coefficient (which is
proportional to the Stokes radius of the molecule, rs), and η is the viscosity of the solution. In
reality, molecular size and shape is far more complex and is affected by factors such as hydration, which also may contribute to the diffusion coefficient. Despite these deviations, the
20
Stokes-Einstein relation is a convenient simplification. The quantification of the diffusion
coefficient in NMR is related to the self diffusion of the molecule and mathematically can be
described using theory based on the change in molecular concentration along a diffusion gradient as described by Fick’s Laws.
According to Fick’s 1st Law, the flux (or movement) of a particle within a sample region
is in an attempt to equilibrate a concentration gradient within the sample, and the flux is defined as
J (r, t ) = − D∇c(r, t ) .
[1.31]
The flux, J(r,t), is equal to the gradient of concentration, c(r,t), at some diffusion coefficient,
D, in the direction of larger to smaller concentration (indicated by the negative sign). Within
the sample space, the number of molecules is conserved as stated by the law of conservation
of mass. The continuity theorem states that the change in concentration is the difference between the influx and efflux of particles from a given point and is mathematically represented
as
∂c(r, t )
= −∇ ⋅ J (r, t ) .
∂t
[1.32]
Fick’s 2nd Law of diffusion is the combination of Equations [1.31] and [1.32]:
∂c(r, t )
= ∇ ⋅ (D∇c(r, t )),
∂t
[1.33]
which states that the change in concentration, c(r,t), is equal to the dot product of divergence
of the concentration and the diffusion coefficient. The solution to Fick’s 2nd Law in an isotropic, homogeneous medium can be shown as a Gaussian probability function:
P(r0 , r1 , t ) = (4πDt )
−3
2
(r1 − r0 )2
exp−
.
4Dt
[1.34]
21
where r0 and r1 are the initial and final spatial positions of a diffusing molecule, respectively.
Equation [1.34] states that the probability that a molecule will diffuse a given distance is not
dependent on the starting position (r0) but rather on the net displacement (r1-r0) of the molecules during the diffusion time (t). Thus diffusion can be measured as a function of the net
displacements of a large number of molecules. In the case of free diffusion, the Einstein
equation describes the relationship between the molecular displacement and the diffusion coefficient:
(r1 − r0 )2
[1.35]
= nDt ,
where n is 2, 4, or 6 for one-, two-, or three-dimensional diffusion, respectively. The Einstein
equation states that the mean-squared displacement of a molecule is linear with time for free
(i.e., unrestricted) diffusion. Using NMR, the displacement of molecules is measured, which
is proportional to the diffusion coefficient.
1.3.2 Restricted Molecular Diffusion
The Einstein equation assumes no interference to diffusion that may be introduced due to the
environment. However, biological tissue contains structures and complex geometries that
impede free diffusion. Due to the environmental effects, the diffusion coefficient measured
by NMR is usually smaller than the bulk value and is thus termed the apparent diffusion coefficient (ADC). Specifically, the “apparent” nature refers to the fact that the diffusion coefficient is measured in the presence of structural barriers that interfere with the free translation
of molecules. (It is important to note that additional factors such as bulk or micromotion and
background magnetic susceptibility also affect the measured ADC value.) Restricted diffu-
22
κ
D
a
D
κ
D
Figure 1.11 Crick model of restricted diffusion: molecules diffusing
at rate D experience restricting barriers of permeability κ and
separation a that inhibit the free diffusion of water.
sion alters the linearity of the Einstein equation, and the measured ADC value is often a function of the diffusion time, the diffusion coefficient, and the geometry of the restrictive space.
A simple model of restricted diffusion is the Crick model (1970), which describes molecular diffusion in the space between two parallel barriers as illustrated in Fig. 1.11. In this
one dimensional model, molecules are diffusing perpendicular to the orientation of the restricting barriers with permeability κ and separation a. At very short diffusion times (i.e., t
<< κa), the majority of the diffusing molecules do not experience the effects of the barriers;
thus the measured diffusion coefficient nearly is equal to the bulk value, D. At longer diffusion times, the molecules are allowed to randomly translate throughout the space during
which they may reflect from or diffuse through the barriers, in both cases experiencing some
change in the free translational displacement that could have occurred in the absence of the
barriers. In this case, the measure diffusion coefficient is the effective diffusion coefficient,
Deff, given by:
[1.36]
1
1
1
= +
.
D eff D κa
23
Deff includes the contributions of D and the restrictions to diffusion, which reduce the displacement of the diffusing molecules as predicted by the Einstein equation. The measured
diffusion coefficient (Deff) is an apparent value of the self-diffusion value and, hence is synonymous with the ADC. Similar models have also been developed for 2- and 3-dimensional
geometries, as well as for special cases, such as anisotropic diffusion.
1.3.3 Anisotropic Diffusion
Anisotropy is a specific case of restricted diffusion that states that the molecular ADC value
may differ depending upon the direction in which diffusion is measured (Moseley et al.,
1991; Sotak and Li, 1992). Nerves, for example, are anisotropic structures, which could be
visualized as an array of cylinders. Molecules diffusing along the long axis of the nerve (or
cylinder) will experience relatively fewer restrictions than molecules diffusing perpendicular
to the direction of the long axis. Thereby, diffusion measurements made along each independent axis will yield different ADC values. To characterize the directional dependence of
diffusion, the isotropic case introduced previously must be expressed in tensor form with
nine diffusion coefficients grouped in a second-rank tensor, ADC (Basser et al., 1994).
ADC xx
ADC = ADC yx
ADC zx
ADC xy
ADC yy
ADC zy
[1.37]
ADC xz
ADC yz .
ADC zz
For isotropic diffusion, all elements of the diffusion tensor will be equal; however, this is not
the case for anisotropic diffusion. In many cases, the effects of anisotropy can be minimized
by measuring the average diffusivity, ADC , which can be calculated from the trace of the
diffusion tensor (van Gelderen et al., 1994):
24
ADC =
ADC xx + ADC yy + ADC zz
3
[1.38]
.
Lastly, an anisotropic sample can be characterized by its degree of directionality termed the
fractional anisotropy (FA) (Basser and Pierpaoli, 1996). The FA is a measure of the deviation
of a sample from isotropic diffusion, and is defined mathematically as
FA =
3
2
(ADC
xx
) + (ADC
2
− ADC
yy
− ADC
2
) + (ADC
2
2
ADC xx + ADC yy + ADC zz
2
zz
− ADC
)
[1.39]
2
.
1.3.4 Spin Labeling with Magnetic Field Gradients
The Larmor equation describes the relationship between the precession frequency of the nuclei and the gyromagnetic ratio and the static, external magnetic field (Eqs. [1.15] and
[1.18]). Since B0 is usually spatially homogeneous, a spatially-varying, linear magnetic field
gradient, g, can be superimposed on B0 such that the precessional frequency, ω, becomes
spatially dependent:
ωeff = ω + γ (g ⋅ r ) ,
[1.40]
where r is the spatial position of a molecule relative to the applied gradient. The change in
local magnetic field induces a spatially-dependent phase shift of the nuclear spins that is cumulatively defined by:
[1.41]
t
Φ(t ) = γB 0 t + γ ∫ g (t ′) ⋅ r (t ′)dt ′ .
0
In the rotating frame of reference, the static term of Eq. [1.41] (containing the B0 term) goes
to zero. The accumulated phase, Φ(t), during the application of a magnetic field gradient can
be used to spatially label the position of nuclei. Equation [1.34] however introduced the con-
25
cept that the diffusion process is random and is described by a Gaussian probability function;
therefore, a nucleus is equally likely to accumulate positive or negative phase during the diffusion period. The ensemble average of a large number of nuclei in the sample will result in
phase cancellations due to the summation of positive and negative phase shifts accumulated
during the diffusion process. The cumulative phase cancellations will result in an attenuation
of the NMR signal that is proportional to the diffusion coefficient, the area under the curve of
the diffusion-sensitive gradient pulse, and the diffusion time.
The pulsed-field gradient (PFG) pulse sequence first described by Stejskal and Tanner
(1956) is a simple modification of the spin-echo pulse sequence (Hahn, 1950). The PFG sequence, shown in Fig. 1.12, uses diffusion-sensitizing magnetic field gradients to spatially
label and unlabel molecules after some diffusion period. Figure 1.12 introduces some common NMR nomenclature: The duration of the magnetic field gradient pulses is denoted δ; the
separation of the magnetic field gradients is ∆; and the diffusion time, tdiff (t in Eq. [1.35]), is
proportional to the δ and ∆ intervals and the shape of the gradients pulses.
TE/2
90ox
TE/2
180
o
y
RF
Gdiffusion
g
δ
∆
Receiver
Figure 1.12 Pulsed-field gradient (PFG) NMR pulse sequence
described by Stejskal and Tanner for the measurement of molecular
diffusion. The duration of the magnetic field gradients is denoted δ;
the separation of the magnetic field gradients is ∆; the strength of the
magnetic field gradients is g.
26
During the first diffusion-gradient pulse, the spins accumulate phase according to
[1.42]
δ
Φ 1 = γz 1 ∫ gdt = γz1gδ .
0
Equation [1.41] is derived from the generic form shown in Eq. [1.41] for a rectangular pulse
with the following modifications: (1) the B0 term is removed for the rotating-frame case; and
(2) diffusion is measured along a single direction, which is the z-axis in this case. Similarly,
during application of the second diffusion gradient pulse, the spins again accumulate phase;
however, the polarity of the gradient pulse is effectively reversed due to the 180º RF pulse. In
other words, the second gradient pulse attempts to restore the phase imparted by the first gradient pulse. If a molecule is stationary, the net phase shift imposed by the two gradient pulses
will be zero and there will be no attenuation of the NMR signal. If, however, the nuclei have
diffused during ∆, the nuclei will experience a different magnetic field during the second period, resulting in a residual net phase shift and attenuation of the resulting spin-echo signal.
The expression for the phase accumulation during the second diffusion-gradient pulse is
Φ 2 = γz 2
[1.43]
∆+δ
∫ gdt = γz 2 gδ ,
∆
and the net phase shift during the entire experiment is equal to the difference between the
phase shifts imparted by the first and second diffusion-gradient pulses,
Φ = Φ 2 − Φ 1 = γgδ(z 2 − z 1 ) .
[1.44]
The final NMR signal attenuation resulting from molecular diffusion must include the
cumulative residual phase shifts and the probability function derived from Fick’s 2nd Law,
which describes the random diffusion process. For unrestricted diffusion, the resulting expression for the NMR signal is
27
[1.45]
M
δ
2
= exp− (γgδ ) D ∆ − ,
M0
3
where the diffusion coefficient, D, may also be expressed as the ADC (in the presence of reδ
strictions). Futher, ∆ − is the diffusion time for rectangular diffusion gradient pulses of
3
finite duration (i.e., non-delta functions). Using the PFG sequence, the diffusion coefficient
can be calculated by varying either g or δ, and calculating the change in M as a function of
δ
2
the term (γgδ ) ∆ − , which is commonly called the b-value (Le Bihan et al., 1986; Le
3
Bihan, 1991).
1.4 Principles of Magnetic Resonance Imaging
Magnetic resonance imaging (MRI) encodes spatial information into the frequency and phase
of the NMR signal. In the following sections, the components of two-dimensional (2D) Fourier transform (FT) MRI will be described. Figure 1.13 illustrates the fundamental aspects of
Image
Slice
Phase
Dimension
Frequency Dimension
Figure 1.13 Magnetic field gradients are used to isolate a slice of a
sample, which is encoded spatially in 2D using the frequency and
phase components of the NMR signal.
28
this procedure. From a sample (dotted box), a slice of interest is selected (solid crosssection), and the spatial information in the imaging slice is encoded into the phase and frequency of the NMR signal using magnetic field gradients.
1.4.1 Slice Selection
Two-dimensional (planar) MRI requires spatial encoding in a third dimension to select a volume of interest for imaging. In other words, each pixel of a 2-dimensional image contains
signal acquired over the thickness of the imaging slice. The selective excitation of a slice of
the sample is accomplished by imposing a linear magnetic field gradient perpendicular to the
chosen slice plane. The imposed gradient causes a linear variation of the local magnetic field,
which is alters the resonance frequencies of the nuclei along that axis. Figure 1.14 diagrams
how a linear magnetic field gradient can be used to correlate spatial position with frequency.
For slice selection, a narrow bandwidth of frequencies, corresponding to a narrow spatial dis-
> ω0
RF bandwidth
Resonance
Frequency
(ω0)
Resonating
protons
< ω0
– cm
+ cm
0
Position in slice plane
Figure 1.14 Slice-selective excitation is performed using a narrow
bandwidth RF pulse in combination with a linear magnetic field
gradient.
29
τ
τ
τ
FT
∆F =
1
2τ
Figure 1.15 The sinc pulse (left) and its rectangular Fourier
counterpart (right).
tribution of nuclei with the sample, must be excited. Restricting the bandwidth of the RF
pulse is most easily achieved using a
sin (x )
-shaped RF pulse [a sin c(x ) function], which
x
yields a rectangular RF power spectrum. As illustrated in Fig. 1.15, the Fourier pair of the
sinc function (left) is a rectangle (right).
For the sections to follow, a standard spin-echo imaging sequence will be introduced and
expanded to describe image acquistion. Figure 1.16 illustrates the spin-echo pulse sequence
showing only the slice-selective RF pulses, slice-selection gradients, and receiver portions of
90°
TE/2
180°
TE/2
RF
Gslice
Receiver
Figure 1.16 Spin-echo pulse sequence with 90º and 180º RF pulses,
slice-selection magnetic field gradients, and receiver channels.
30
the pulse sequence.
The thickness of the imaging slice, dsl, achieved using the above pulse sequence is determined by the gradient strength (g) and the RF bandwidth (∆F) according to:
d sl =
∆F
.
γg
[1.46]
For example, if a RF pulse with a 1064.5 Hz bandwidth is applied in conjunction with a gradient amplitude of 1 G/cm for a sample of 1H protons (γ/2π = 4258 Hz/G), the slice thickness
(dsl) is 0.25 cm. The thickness of the slice can be altered either by changing the bandwidth of
the RF pulse or the amplitude of the gradient. This example describes the parameters for an
imaging slice at the isocenter of the magnetic, which corresponds to the zero position in the
slice plane on Fig. 1.14; however, Fig. 1.14 also implies that the imaging slice can be offset
in the slice plane. The slice offset can be altered by changing the center frequency of the RF
pulse. Continuing with the previous example, if the desired offset of a 0.25 cm slice thickness
is 1 cm (doff), the change in the center frequency of the RF pulse is given by
∆F0 =
[1.47]
d off ∆F
,
d sl
and ∆F0 equals 4258 Hz.
1.4.2 Frequency Encoding
Spatial information in one of the two in-plane dimensions is encoded in the frequency of the
acquired NMR signal. Frequency encoding is performed via application of a linear magnetic
field gradient along one of the imaging axes during acquisition of the NMR signal. As described for slice selection, the imposition of the gradient results in a linear variation in the
precessional frequencies of the nuclei that is proportional to the relationship between the gra-
31
90°
TE/2
180°
TE/2
RF
Gslice
Gfrequency
Receiver
Figure 1.17 Spin-echo pulse sequence with 90º and 180º RF pulses,
slice-selection magnetic field gradients, freqency-encoding magnetic
field gradients, and the receiver channel.
dient strength and the spatial position of the nuclei. Figure 1.17 diagrams the spin-echo imaging pulse sequence with both slice-selection and frequency-encoding gradients. Further, Fig.
1.18 illustrates that the application of this sequence on a sample (A) will have a frequency
profile represented in B. Following 1-D FT, the frequency encoded information yields a projection of the sample (C).
B
C
Amplitude
A
Frequency
Figure 1.18 A sample, shown in panel A, will have a NMR signal
amplitude frequency profile represented in panel B. Following 1-D
FT, the frequency encoded information yields a projection of the
sample (panel C).
32
The field-of-view along the frequency encoding dimension (FOVf) is defined by the amplitude of the gradient (Gf) and the bandwidth of the receiver (BW):
FOVf =
BW
.
γG f
[1.48]
Nf
,
t
[1.49]
The receiver bandwidth is
BW =
where Nf is the number of data points used to digitize the NMR signal during the acquisition
time, t. For example, 256 complex points acquired in 8 msec would equate to a total BW of
25,600 Hz (±12,800 Hz). If the sample in Figure 1.20A is a sphere with diameter of 1 cm and
a FOVf of 2 cm is used, the required gradient amplitude, Gf, is
Gf =
BW
± 12,800Hz
=
= 1.5 G
cm
γFOVf (4258 Hz G )(2cm )
1.4.3 Phase Encoding
The second dimension of the image is spatially encoded in the phase of the NMR signal using magnetic field gradients. The spin-echo imaging sequence illustrated in Figs. 1.16 and
1.17, is expanded in Fig. 1.19 to include the phase-encoding gradient.
In application, the phase-encoding gradient is incremented in successive steps in the
MRI pulse sequence to vary the phase inparted to the NMR signal between –180° and +180°.
As introduced in Eq. [1.41] (Section 1.3), the phase imparted to the transverse magnetization
by a gradient is mathematically expressed as
[1.50]
t
γ
Φ(t ) = ∫ G p xdt ,
2π
0
33
where Φ(t) is the imparted phase, Gp is the strength of the gradient, x is the spatial position,
and t is the duration of the gradient pulse. For the square-shaped pulse shown in Fig. 1.19,
Eq. [1.50] simplifies to
[1.51]
γ
Φ(t ) = G p xt .
2π
The incrementation of the phase-encoding gradient is dependent on the desired FOV in the
phase-encoding direction (FOVp), which is equal to
FOVp =
1
γG p, min t
[1.52]
,
where Gp,min is the minimum gradient increment required for the desired FOVp and the duration of gradient application (t). Further, from FOVp and the number of phase-encoding steps
(Np), the minimum and maximum gradient values can be determined by:
90°
TE/2
180°
TE/2
RF
Gslice
Gfrequency
Gphase
Receiver
Figure 1.19 Spin-echo imaging pulse sequence with 90º and 180º
RF pulses; slice-selection, frequency-encoding and phase-encoding
magnetic field gradients; and the receiver channel.
34
[1.53]
Np −1
G p ,min .
G p ,range = ±
2
If, as in the example above, a 2 cm FOVp is desired and 128 phase-encoding gradient pulses
of 5.0 ms duration are used, Gp,min and Gp,range are
G p ,min =
1
= 0.0235 G
cm
γ (2cm )(0.005s )
and
(
)
128 − 1
G p ,range = ±
0.0235 G cm = ±1.49 G cm .
2
In other words, incrementing the phase-encoding gradient in 0.0235 G/cm steps from –1.49
G/cm to +1.49 G/cm, will provide the desired spatial information for the second dimension
of the 2D MR image.
1.4.4 Mapping k-Space
The 2D frequency-phase space is commonly referred to as k-space. Figure 1.20 illustrates
two schemes for mapping phase and frequency information. Figure 1.20a (left) demonstrates
the spin-warp method previously described, where the phase-encoding gradient is incremented in separate steps (i.e., in separate, sequential acquisitions). Another scheme, diagrammed in Fig. 1.20b (right), shows all the frequency and phase information being collected
in a single shot. This method is called echo-planar imaging (EPI).
In the case of spin-warp imaging, the final image is reconstructed by 2D FT of the discrete frequency and phase information. In light of previous examples, if 128 complex data
points are acquired in the frequency-encoding (υ) direction and 128 phase-encoding (Φ)
steps are used, the final image matrix will be 128 pixels × 128 pixels. Further if FOVp and
35
a
b
Φ
υ
Figure 1.20 Spin-warp (a) and echo-planar (b) k-space mapping
schemes. The spin-warp technique involves incrementing the phaseencoding gradient in separate acquistions. In contrast, the echoplanar technique utilizes an oscillating frequency-encoding gradient
simultaneously with a constant phase-encoding gradient. The
frequency-encoding gradient serves to refocus the echo train while
the phase-encoding gradient linearly advances the phase of the NMR
signal.
FOVf equal 2 cm, the in-plane pixel resolution will be 0.0156 cm × 0.0156 cm (156 µm ×
156 µm).
As mentioned, the benefit of the EPI pulse sequence (illustrate in Fig. 1.21) is fast image
acquisition; however, special gradient coils is required to oscillate the frequency-encoding
gradient and ramp the phase-encoding gradient fast enough to sample the entire k-space in a
short amount of time. Otherwise, without the correct hardware, the EPI scheme cannot be
properly implemented, and the NMR signal will experience significant decay by T2*. Similarly, the center of k-space is typically reached after half of the frequency-encoding gradient
oscillations, thus the TE of the pulse sequence must be sufficiently long to coincide the formation of the spin echo at the center (or near center) of the acquisition window. Further, the
scheme illustrated in Figure 1.20b (only one of many k-space mapping techniques), requires
some interpolation of the acquired data points from the off-rectangular to the rectangular kspace grid, which may introduce an additional factor to degrade the image.
36
90ox
TE/2
180oy
TE/2
RF
Gslice
Gfrequency
Gphase
Receiver
Figure 1.21 Echo-planar imaging (EPI) pulse sequence. The oscillating frequency-encoding gradient (also illustrated in Fig. 1.20b) refocuses a train of gradient-recalled echoes during the data acquisition
(i.e., receiver) period. Simultaneously, a constant gradient is applied
to linearly advance the phase of the signal during the same acquistion
period.
1.4.5 Diffusion-weighted EPI
The spin-warp imaging method, whereby each line of k-space is sampled in separate acquisitions, may require several minutes to obtain the full set of data required to reconstruct the
image. Diffusion-weighted imaging (DWI) can add further time contraints given: (1) that the
separation time between diffusion-gradient pulses (defined as ∆ in Section 1.3) must be accounted for; (2) that several gradient values (b-values) must be acquired to accurately calculate apparent diffusion coefficient (ADC) maps of the sample; (3) diffusion-weighting may
be performed along three or more different diffusion-gradient directions to account for the
sample microstructure. For these reasons high-speed acquisitions methods, such as the
aforementioned EPI scheme, are advantageous when performing DWI. Turner and Le Bihan
37
TE/2
90ox
TE/2
180oy
Spin Echo
RF
Gslice
Gfrequency
Gdiffusion
g
δ
g
∆
δ
Gphase
Figure 1.22 Diffusion-weighted, spin-echo echo-planar (DW-EPI)
NMR imaging pulse sequence. The receiver channel in Figs. 1.16,
1.17, 1.19, 1.21 has been replaced with an illustration of the
formation of the spin echo. Diffusion-weighting is accomplished
with the diffusion-sensitizing gradients (shown along the frequencyencoding direction), where g is the diffusion-gradient pulse strength,
δ is the duration of the diffusion-gradient pulse, and ∆ is the
separation between the two diffusion-gradient pulses.
(1990) demonstrated the adaptations to the standard EPI pulse sequence required to add diffusion-weighting, and the DW-EPI NMR pulse sequence is shown in Fig. 1.22. As described
in Section 1.3, the ADC value is calculated from the signal attenuation as a function of the bvalue (see Section 1.3 and Eq. [1.45]). Calculated ADC images (commonly called maps) are
produced by fitting the natural logarithm of the signal attenuation as a function of b-value on
a pixel-by-pixel basis using linear least-squares regression.
38
Chapter 2
MRI of Cerebral Ischemia
2.1 Introduction
Stroke is caused by a reduction or termination in cerebral blood flow (perfusion) that starves
tissue of essential nutrients and oxygen, inhibiting normal physiological function of cells and
ultimately resulting in tissue death. Stroke is the third leading cause of death and the leading
cause of disability in the United States. According to the American Heart Association (AHA)
and National Stroke Association (NSA), about 600,000 people suffer a new or recurrent
stoke each year, resulting in nearly 160,000 deaths (statistic from 1998). It is also estimated
that approximately 3.5 million stroke survivors currently live in the United States. At this
point, the only FDA approved stroke treatment is the administration of tissue plasminogen
activator (tPA). tPA is a thrombolytic drug that attempts to restore blood flow via dissolution
of the clot; however, its use is limited to specific cases due to possible hemorrhagic complications. In this section, the physiology of normal and ischemic cerebral tissue will be discussed, and the following sections will address some specific MR stroke studies.
2.2 Normal Cerebral Cellular Physiology
For all tissues, blood supplies the essential nutrients and oxygen to maintain normal cell
function. Homeostatic conditions in cerebral tissue are highly regulated and extremely sensitive to changes in nutrient supply. The cerebral circulation supplies the neural and supporting
tissues with oxygen and glucose. The glucose reserve in the brain is negligible; therefore,
maintenance of normal perfusion is crucial. In normal cells, mitochondria use the rich supply
of oxygen to create adenosine triphosphate (ATP) via aerobic respiration. To support cell
functions, the ATP is metabolized, releasing energy by breaking the phosphate bonds. Along
with other functions, energy is required to maintain the sodium-potassium pump (Na+–K+–
40
ATPase), which maintains the normal ion gradient across the cellular membrane. Specifically, under homeostatic conditions, the intracellular level of K+ far exceeds the extracellular
concentration, and Na+ and calcium (Ca2+) dominate the extracellular space.
2.3 Etiology and Pathophysiology of Ischemic Stroke
Stroke is a cerebrovascular disease caused by a disruption in normal cerebral perfusion due to
either occlusion of a blood vessel (ischemic stroke) or vessel rupture (hemorrhagic stroke).
Ischemic stroke is caused by cerebral thrombosis or embolic clot and is the most common
type, accounting for 80% of stroke cases. Cerebral thrombi are blood clots that form within
the cerebrovasculature created by the aggregation of platelets and fibrin in response to an
atherosclerotic lesion or vessel injury. Continued irritation of the atherosclerotic lesion results in increased growth of the thrombus, which eventually disrupts blood flow causing a
stroke. In contrast, embolic clots are formed outside the brain, typically in the heart or carotid
artery, by platelet aggregation and fibrin activation. If dislodged, the embolus is transported
in the bloodstream, into the cerebrovasculature until the embolus is too large to pass through
the arterial vessel.
The interruption of normal cerebral perfusion initiates a cascade of biochemical events
detrimental to the normal function of cells. First, the reduction in blood flow quickly reduces
the available oxygen supply and normal aerobic respiration cannot continue. In an attempt to
maintain the required supply of ATP, the anaerobic (glycolitic) cycle begins the metabolism
of glucose. The limited reserve supply of glucose in the brain is quickly depleted, and the anaerobic metabolism results in an accumulation of lactic acid, which compromises neuronal
integrity. In ischemic tissue, the lack of energy prohibits cells from maintaining the cell
41
membrane ion gradient. In response to the anoxic depolarization of the cellular membrane,
K+ leaves the cell and Na+, Ca2+, and chloride move into the cell. The change in the ionic distribution disrupts the tissue water equilibrium, causing an influx of extracellular water to the
intracellular space, which results in cellular swelling (cytotoxic edema). The release of excitatory amino acids (neurotransmitters) is also stimulated, which further activates Ca2+ and
Na+ ion channels in the cellular membrane (Hossmann K-A, 1985). Activation of the Nmethyl-D-aspartate (NMDA) Ca2+ channel results in excessive levels of intracellular Ca2+,
which in turn activates enzyme systems (e.g., proteases, lipases, and nucleases). These enzymes begin the destruction of cellular structures and materials. The metabolic products of
the enzyme activity, including nitrogen and oxygen free radicals, eicosanoids, and leukotrienes, increase the rate of cellular breakdown. The increased presence of free radicals and other
reactive chemical species and decreased activity of enzymes that typically inactivate free
radicals mediate cellular destruction. Ironically, free radical damage of cellular components,
such as DNA, activates repair proteins that further deplete the energy supplies of the cell
(specifically NAD+).
Coupled with the oxidative stresses on ischemic tissue, it is widely theorized that cells
initiate defensive mechanisms in an attempt to survive the ischemic incident. Also, it is possible that a cell might respond to ischemia by activating intracellular mechanisms resulting in
the autodeletion or suicide of the cell, which may aide the survival of neighboring cells. In
general, the ability of the cell to ward off death is directly dependent on the duration and severity of the ischemic insult. The mechanisms initiated by the cells in response to ischemic
conditions may include the up-regulation of defensive genes and proteins during the processes of programmed cell death (PCD) and/or apoptosis. PCD refers to the physiological de-
42
letion of cells during normal development. Apoptosis is an active, complex set of events classified by morphological cell changes that occur following PCD in response to ischemia or
injury. Apoptotic death is distinct from necrosis, which is an abrupt and uncontrolled cell
death. Recent research has suggested that ischemia may activate genes that regulate PCD,
which may eventually lead to apoptosis. However, the true mechanism(s) of cellular death
during ischemia are still the subject of debate.
2.4 Diffusion-weighted MRI of Cerebral Ischemia
Le Bihan et al. in 1986 demonstrated that diffusion-sensitization can be incorporated into imaging sequences to probe the spatial heterogeneity of diffusion in a biological sample. This
application was further advanced into the study of cerebral ischemia by Moseley et al. in
1990, who demonstrated in a cat stroke model that diffusion-weighted magnetic resonance
imaging (DWI) is a better indicator of injury in the acute ischemic phase of stroke than conventional T1-, T2-, or M0-weighted (proton density) imaging. Subsequent animal studies confirmed Moseley’s initial findings (Mintorovich et al., 1991; Benveniste et al., 1992; Minematsu et al., 1992; van Gelderen et al., 1994). In 1992, Warach et al. demonstrated that DWI
could also be used to identify acute ischemic lesions in humans.
The reduction of the cerebral blood flow during stroke results in metabolic energy failure,
which, as aforesaid, results in cessation of the energy dependent cellular processes (Busza et
al., 1992). These disruptions ultimately result in cytotoxic edema (Hossmann K-A, 1985),
which has been shown to coincide and correlate with ADC changes in the acute ischemic regions (Busza et al., 1992; Mancuso et al., 1995; Verhuel et al., 1994; van Lookeren Campagne et al., 1994; van der Toorn et al., 1996). However, the mechanisms governing the
43
changes in diffusion properties in ischemic tissue are not well understood. If the characteristics and mechanisms of the water ADC decline were better understood it might allow for the
information obtained using DWI to be more useful than only as a tool for the visualization of
the ischemic lesion. One current area of research is focused on the finding that the region of
abnormality detectible using DWI is sometimes smaller than the abnormality defined by
cerebral perfusion deficit detected using perfusion-weighted MRI (PWI) during the early periods following stroke onset (Mancuso et al., 1995). This so-called diffusion/perfusion mismatch is typically resolved in rat stroke models 2–3 hours following the initiation of the
stroke (Roussel et al., 1994); however, it is hypothesized that the region of mismatch, often
referred to as the “penumbra”, represents potentially salvageable tissue. The tissues in the
penumbral region have only moderately reduced perfusion and ADC values due to the presence of collateral cerebral circulation, and the water ADC values in the ischemic core and
penumbra have been described previously (Mancuso et al., 1995; Carano et al., 2000). Diffusion/perfusion mismatch has also been observed in human studies of acute cerebral ischemia,
and remains a target for potential clinical treatment and evaluation (Warach et al., 1996). Beyond the classification of mismatch, several research efforts have attempted to evaluate the
use of DWI [in some case combined with perfusion-weighted imaging (PWI) and T2weighted imaging (T2WI)] to identify potentially salvageable tissues in cases of rat (Hasegawa et al., 1994; Mancuso et al., 1995; Mancuso et al., 1997; van Dorsten et al., 2002), pig
(Sakoh et al., 2001), and human stroke (Oppenheim et al., 2000; Baird et al., 2001; Desmond
et al., 2001).
44
2.4.1 DWI of Transient Cerebral Ischemia
During focal cerebral ischemia, a perfusion deficit is localized to a particular region of the
brain. For example, a widely used rat stroke model is the middle cerebral artery occlusion
(MCAO) model, typically performed using the intraluminal suture technique (Koizumi et al.,
1986), which blocks blood flow to brain areas supplied by the MCA. Many original studies
utilized this animal model to create a permanent MCAO. In later studies, the suture was removed after a finite occlusion time, and it was demonstrated that an initially decreased ADC
could revert to normal, if interrupted cerebral blood flow is restored quickly after the onset of
ischemia (Mintorovitch et al., 1991; Minematsu et al., 1992; Davis et al., 1994; Li et al.,
1999). Recent studies (some included in this dissertation), further showed that renormalization of ADC values after reperfusion might be transient and a secondary decline in ADC values could be detected when DWI was repeated at 12 hours following 30 minutes of transient
focal ischemia via MCAO (Chapter 3, Li et al., 2000a) or at 24 hours following 20 minutes
of unilateral hypoxia-ischemia (Dijkhuizen et al., 1998). In fact, Chapter 5 contains a more
detailed study by Li et al. (2000c) that demonstrated that secondary ADC reduction may begin as early as 2.5 hours after reperfusion and are not associated with secondary changes in
cerebral perfusion (i.e., following reperfusion, the blood flow to the tissue returned to normal
and remained normal). The research papers contained in this dissertation describe several experiments designed to characterize MR and histological changes in the rat brain following
transient periods of ischemia.
The reversibility of abnormalities on DWIs following reperfusion, although noted in
early studies (Mintorovitch et al., 1991; Minematsu et al., 1992; Davis et al., 1994; Pierpaoli
et al., 1996), was not clearly examined during chronic time points (i.e., several hours to days
45
following reperfusion). To elucidate the tissue changes following reperfusion, we studied
eight rats that were subjected to 30 minutes of MCAO, and this study is presented in Chapter
3. DWI, PWI, and T2-weighted MRI (T2WI) were performed during occlusion, immediately
after reperfusion, 30, 60, 90 minutes, and 12, 24, 48 and 72 hours after reperfusion. The purposes of this study were (1) to determine whether secondary ADC declines occur after recovery of initially decreased ADC values, (2) to characterize the temporal and spatial evolution
of the in vivo ischemic lesions, and (3) to determine if secondary cerebral hypoperfusion contributes to the secondary ADC declines. Both the cerebral blood flow index (CBFi) ratio
(measured from PWIs) and ADC values declined significantly in the two regions-of-interest
examined during occlusion. The CBFi ratio recovered immediately after reperfusion and remained unchanged over 72 hours. However, ADC values returned to normal at 60 to 90 minutes and secondarily decreased at 12 hours after reperfusion as compared with those in the
contralateral hemisphere. The extent of the in vivo ischemic lesions as determined by T2WI
maximized at 48 hours and was highly correlated with histologically-derived lesion size [via
postmortem triphenyltetrazolium chloride (TTC) staining]. The results of this study further
demonstrated that ADC recovery following 30 minutes of arterial occlusion is transient and
that secondary ADC reduction may occur following reperfusion, a finding consistent with
other recent studies (Dijkhuizen et al., 1998; Thornton et al., 1998; van Bruggen et al.,
1998). The renormalization of ADC values is suggestive of the restoration of energy metabolism. First, it has previously been shown that 30 minutes of transient ischemia does not impair mitochondrial function, which remains normal (Schutz et al., 1973; Rehncrona et al.,
1979). Second, other studies have shown that Na+-K+ ATPase is reactivated after reperfusion
and the water and ionic homeostasis is restored (Hossmann et al., 1977; Eleff et al., 1991).
46
Third, Hossmann et al. (1994) further demonstrated that brain regions with renormalized
ADC values after reperfusion had complete recovery of ATP production; in contrast, tissues
without recovery of ADC values (following reperfusion) exhibited depletion of ATP.
Along with contributing to the available MR data on transient ischemia in rats, the findings of the study in Chapter 3 have clinical relevance to human stroke. First, an early reduction or resolution of the DWI hyperintensity after thrombolytic therapy in stroke patients may
not indicate ultimate brain tissue salvage from chronic ischemic injury. Therefore, classification of early reversibility by DWI in human cases of stroke treated with thrombolytics should
be interpreted judiciously and cautiously (i.e., follow-up imaging studies should be performed for confirmation). Second, thrombolytic treatment alone may not entirely salvage
ischemic brain tissue, as delayed ischemic injury may occur. Accordingly, other therapeutic
strategies directed against delayed ischemic injury may be desirable in combination with
thrombolytic therapy. These strategies might include scavenging free radicals, inhibiting excitotoxicity and calcium accumulation, targeting the apoptosis-inducing genes, preventing
release of the mitochondrial apoptogens, blocking mitochondrial permeability transition pore
(Fiskum et al., 1999), and restoring function of the endoplasmic reticulum (Paschen and
Doutheil, 1999).
In a follow-up study (Chapter 4), our previous experiments [Li et al., 2000a (Chapter 3);
Li et al., 1999] were extended to evaluate ischemic progression following different durations
of transient ischemia using MRI (i.e., DWI, PWI, and T2WI) and histological analysis. Sixteen rats were subjected to 10 minutes (n=7) or 30 minutes (n=7) of temporary MCAO. Imaging was performed during occlusion, immediately after reperfusion, 0.5, 1.0, 1.5, 12, 24,
48 and 72 hours after reperfusion. Following the last MRI time point, the brains were fixed,
47
sectioned, stained with hematoxylin & eosin staining, and evaluated for neuronal necrosis.
The novel findings in this study are (1) the resolution of initial DWI lesions is permanent following 10 minutes of transient ischemia, while the resolution of initial DWI lesions is transient following 30 minutes of transient ischemia, and secondary DWI lesions develops later
on, and (2) permanent reversibility of initial DWI lesions does not indicate a normal histological outcome. Conversely, selective neuronal necrosis is seen in regions where the initial
DWI lesions disappear permanently after reperfusion in both the 10- and 30-minute animal
groups. As in the previous study (Chapter 3), it was concluded that renormalization of DWI
hyperintensity is not necessarily permanent and does not necessarily correlate with complete
tissue recovery. In addition, this study suggests that DWI may not be sensitive enough to detect slight necrosis exhibited following short periods of transient ischemia, which may be due
to volume averaging of many abnormal and normal neurons in the image voxel. This finding
may help to explain neurological deficits in some patients who have normal DWI after cerebral ischemia (Ay et al., 1999) and cognitive deficit in some patients who experience transient ischemic attacks (TIA) (Hénon et al., 1999).
The data presented in Chapters 3 and 4 lacks the temporal resolution to accurately describe secondary ADC changes following 30 minutes of transient MCAO. In Chapter 5 of
this dissertation, a study is described wherein DWI, PWI, and T2WI were performed during
MCAO and every 30 minutes for a total of 12 hours after reperfusion (n=6). In another animal group, neurological outcomes were evaluated during MCAO, every 30 minutes for a total of 6 hours, and at 24 hours after reperfusion (n=8). The goal of this experiment was to
provide detailed information regarding both the temporal and spatial evolution of ADC
changes. As noted in previous studies, PWI abnormality was resolved immediately following
48
reperfusion and remained normal. Given the increased temporal resolution, we could isolate
the complete recovery of the ADC values (of regions with ADC value reduction during occlusion) to approximately 1 hour after reperfusion. Further, the renormalized ADC values
started to decrease secondarily at approximately 2.5 hours, accompanied by a delayed increase in T2 values by about 5 hours. The ADC-defined secondary lesion grew over time, and
at 12 hours the lesion size was 52% of the initial lesion (i.e., during occlusion). Further, as in
Chapter 4, histological evaluation demonstrated neuronal damage in the regions of secondary
ADC decline. Interestingly, complete resolution of neurological deficits was seen in one rat
at 1 hour, 6 rats between 2.5 and 6 hours after reperfusion, and no secondary neurological
deficits were observed at 24 hours. These data suggest that (1) a secondary ADC reduction
occurs as early as 2.5 hours after reperfusion, evolves in a slow fashion, and is associated
with neuronal injury; and (2) renormalization and secondary decline in ADC are not associated with neurological recovery and worsening, respectively.
The results presented in Chapters 3–5, as previously mentioned, suggest that recovery
following transient ischemia in rats and humans may not be permanent and may not represent
damage-free brain tissue. It is not clear why the neurological deficits improved or resolved at
the time when secondary injury, demonstrated by secondary ADC reduction, continued to
evolve. Possible explanations for this discrepancy are gradual hyperactivation of remaining
intact neurons in the ischemic region or functional substitution by other neurons in the
neighboring normal brain regions as demonstrated by functional MRI in stroke patients
(Cramer et al., 1997; Cramer et al., 2000). Our results, along with others (Nakano et al.,
1990; Garcia et al., 1995; Persson et al., 1989), also show that all rats that experienced complete resolution of their neurological deficits had some degree of neuronal injury. This sug-
49
gests that patients with prolonged TIA may have neuronal injury, as was recently documented by DWI (Kidwell et al., 1999), which may underlie the pathogenesis of gradual cognitive deficits that occurred after TIA, although the patients recovered from their neurological deficits after TIA (Hénon et al., 1999).
The ADC and T2 data acquired in the study presented in Chapter 5 were further explored
to determine if the temporal and spatial evolution of acute ADC and T2 values could be employed to predict secondary tissue changes following reperfusion. In the analysis described in
Chapter 6, the ADC and T2 data (acquired at 26 time points over a 12-hour period) was used
to generate novel, composite maps of the tissue characteristics. Using the composite maps,
statistical analysis was performed to determine if the changes in tissue ADC and T2 values
were predictive of the tissue condition at the end of the experiment. Briefly, the region originally defined as abnormal during MCAO was be divided into three groups based on the ADC
and T2 characteristics at 12 hours: no secondary ADC decline and no T2 increase, secondary
ADC decline and no T2 increase, secondary ADC decline and T2 increase. This data was used
to create the first composite map. The second composite map was comprised of pixels with
values equal to the time point (i.e., time in hours after reperfusion) at which the secondary
ADC decline became apparent. To perform statistical analysis on this data it was subdivided
into three groups: no secondary ADC decline, secondary ADC decline before 5 hours after
reperfusion, and secondary ADC decline after 10 hours after reperfusion. Each group was
compared to determine if any statistical difference in their acute ADC value could be gleaned
to predict their secondary characteristic. Ultimately, no statistical measure could be found to
accurately predict the tissue characteristics at 12 hours, and it was concluded that acute ADC
and T2 data may be limited for the prediction of infarction.
50
2.4.2 MR Changes of Intra- and Extracellular Water
The mechanisms regulating diffusion changes during cerebral ischemia are not well understood. In the brain, water diffusion is a complex process that involves passive Brownian motion and active processes (e.g., water transport, cerebral spinal fluid (CSF) pulsation, and
bulk motion). Restrictions to water diffusion (e.g., cellular membranes and intracellular
structures), macromolecular binding, and exchange between different environments further
complicate the water diffusion characteristics. Furthermore, biological tissue environments
include the intracellular (IC) and extracellular (EC) spaces as well as the relatively smaller IC
organelles, microtubules, and periplasmic spaces. It is presumed that the apparent diffusion
coefficient (ADC) of the water in the EC space is faster than the IC space, a crowded milieu
that contains many structures to restrict diffusion.
A few hypotheses regarding the mechanisms of water ADC decline in ischemic tissue
have been proposed and focus on the relative roles of water diffusion in the IC and EC
spaces. The initial hypothesis suggested that cytotoxic edema caused by disruption of the energy-dependent ionic equilibrium pumps results in an influx of fast-diffusing EC water to the
slow-diffusing IC space (Moseley et al., 1990; Benveniste et al., 1992; van Gelderen et al.,
1994; Zhong et al., 1993; Anderson et al., 1996). A second hypothesis proposed that the influx of EC water to the IC space causes a volume reduction in the EC space and a proportional increase in the restrictions to diffusion imposed by the cellular membranes (i.e., increased tortuosity) in the EC space (Sykova et al., 1994; Latour et al., 1994; Norris et al.,
1994; van der Toorn et al., 1996). More recently, it has been hypothesized that in ischemic
conditions energy-dependent IC microcirculation (cytoplasmic streaming) is halted, resulting
in a reduction in the IC water ADC (Neil et al., 1996; Wick et al., 1995; van der Toorn et al.,
51
1996; Duong et al., 1998). Although one mechanism may dominate the ADC reduction observed during ischemia, it is more likely, given the complex processes affecting the NMR
measurement diffusion, that the ADC change results from a combination of all these mechanisms (Szafer et al., 1995a).
The bridge between experiments conducted for the purpose of describing ADC changes
during transient ischemia and those conducted to explore the mechanisms governing the
ADC changes are performed in the study in Chapter 7. We performed experiments designed
to determine if reperfusion-induced renormalization of initially abnormal ADC values indicates reversal of cellular, morphological changes that occur during acute ischemia. Rats were
subjected to 30 minutes of middle cerebral artery occlusion without reperfusion (group A,
n=6), with 1.5 hours of reperfusion (group B, n=6), or with 12 hours of reperfusion (group C,
n=6). DWI and PWI were obtained at the end of occlusion (groups A, B, and C), 1.5 hours
(groups A, B, and C) and 12 hours after reperfusion (groups A and C). Immediately after the
final MRI study, the brains were fixed by cardiac perfusion with 4% paraformaldehyde. Neuronal injury was evaluated on hematoxylin-eosin stained sections, and astrocytic size was
determined by the area of glial fibrillary acidic protein (GFAP) plus S-100 expression. In
group A where ADC values decreased significantly, 47% (±12%) of the neurons were
slightly shrunken; astrocytes were moderately swollen, and the area expressing GFAP plus S100 was larger than that in the contralateral hemisphere (117±6 µm2 vs. 89±2 µm2; p<0.001).
In group B where the ADC had renormalized, most neurons were moderately shrunken, and
the frequency of such neurons was greater in group B (92%±2%) than in group A; astrocytes
were markedly swollen, and the area was larger than that in the contralateral hemisphere
(123±8 vs. 85±4 µm2). In group C where a secondary ADC decline occurred, most neurons
52
(94±3%) were severely shrunken, and some had eosinophilic cytoplasm; astrocytes were disintegrated, and the area of GFAP plus S-100 expression was reduced (78±4 vs. 90±5 µm2).
These results lead to the conclusion that reperfusion-induced acute renormalization of ADC
values is not associated with the complete reversal of neuronal shrinkage and astrocytic
swelling that occurs during ischemia. Conversely, the morphological changes of astrocytes
and neurons progressively worsened over time, although ADC values showed a biphasic
change.
The results of the study presented in Chapter 7 support the hypothesis that ischemiarelated ADC declines could be the result of the reduction of energy-dependent cytoplasmic
motion (Neil et al., 1996; Wick et al., 1995; van der Toorn et al., 1996; Duong et al., 1998;
Dijkhuizen et al., 1999). Thereby, following reperfusion, the restoration of energy production
is able to restore cytoplasmic movement results in a renormalization of ADC values. Using
phosphorus magnetic resonance spectroscopy, Lorek et al. (1994) and Blumberg et al. (1997)
have demonstrated that energy metabolism can recover to normal after initial declines in
transient hypoxia-ischemia models, and such energy restoration was associated with ADC
renormalization (Thornton et al., 1998). It is reasonable to assume that the reperfusioninduced ADC renormalization in this study is likely due to energy recovery. Further study
will be needed to demonstrate (1) if morphologically abnormal neurons and astrocytes are
able to restore energy production when blood flow is restored and (2) the dominant mechanism(s) responsible for the ADC decline during ischemia.
In Chapter 8, this dissertation demonstrates a method of NMR signal separation that was
utilized to isolate IC and EC compartmental diffusion coefficients in yeast-cell suspensions.
In this study, the goal was to develop a method that could be extended into the study of com-
53
partmental diffusion in the normal and ischemic rat brain. The method presented in Chapter 8
is based on the use of an MR contrast reagent (CR) to separate the IC and EC water proton
signals via differences in their respective longitudinal (T1) relaxation times. Discrete biexponential analysis of the NMR data using a constrained nonlinear least-squares algorithm was
used to separate the NMR signal into the respective IC and EC signal contributions (Han et
al., 1998; Silva et al., 1998). These results were comparable to previous experiments in
which T1 relaxation was used to separate the compartmental signal contributions using relaxography (Labadie et al., 1994; Han et al., 1998), which utilizes a numerical inverse
Laplace transform (ILT) (Provencher, 1982a; Provencher, 1982b; Provencher and Dovi,
1979). The biexponential model is easier to employ and can accurately find the distribution
means in the continuous relaxation time spectrum. Using CR in a yeast-cell suspension, we
successfully demonstrated that this method can be used, first, to separate the NMR signal
from IC and EC compartments based on differences in the compartmental relaxation times
and, second, to calculated the compartment ADC values of the IC and EC water. The paper
presented in Chapter 8 describes this method in great detail such that future experiments in
more complex systems (e.g., the rat brain) can be performed with clear understanding of the
experimental considerations and issues.
Since conventional MR data contain the combined signals from the IC and EC spaces, it
is difficult to determine the separate roles of these two compartments to the overall changes
in water ADC during cerebral ischemia. At the time of this dissertation, no direct MR measurements of IC and EC water diffusion have been performed in vivo. Previous attempts to
separate the IC and EC properties in normal and ischemic cerebral tissue have focused on the
use of exogenous and metabolic surrogates to gain insights about biological water diffusion
54
(Neil et al., 1996; Wick et al., 1995; van der Toorn et al., 1996; Duong et al., 1998; Duong et
al., 2001). The conclusions of these studies support the hypothesis that diffusion changes in
the IC space may dominate the reduction in ADC; however, water ADC is being inferred
from the behavior of an exogenous molecular tracer. Consequently, the interpretation of these
data must be tempered by the fact that the exogenous tracer (or metabolite) and water may
have different molecular size, diffusion coefficient temperature dependence, macromolecular
binding properties, and exchange properties both in normal and ischemic tissue.
Other attempts to isolate the IC and EC diffusion properties have employed fitting the diffusion signal attenuation curve to a sum of two decaying exponentials (biexponential model)
(Neindorf et al., 1996; Mulkern et al., 1999; Mulkern et al., 2000). The results reported in
these experiments do not agree with the known IC : EC fraction (ca 0.8 : 0.2 ), which could
be attributed to T2 relaxation time differences between IC and EC water and diffusion anisotropy (Clark and Le Bihan, 2000). Further, Mulkern et al. (2000) state that although it may be
appealing to assign non-monoexponential behavior to two independently diffusing compartments, namely IC and EC, there was not enough experimental evidence to draw such a conclusion. Also, It is important to note that non-monoexponential diffusion signal attenuation
does not necessarily imply multiple compartments (Helmer et al., 1995). In fact, the complex
diffusion process can result in non-monoexponential signal decay due to restrictions, exchange, relaxation time effects, and diffusion time selection as well as compartmental ADC
differences.
In Chapter 9, we demonstrate a method of intracerebroventricular (ICV) CR infusion to
isolate IC T1, T2, and ADC values in vivo in normal and middle cerebral artery occluded
(MCAO) rats via volume-localized, diffusion-weighted inversion-recovery spin-echo (DW-
55
IRSE) spectroscopy and diffusion-weighted echo-planar imaging (DW-EPI). This method is
derived from the experiments performed on yeast-cell suspensions and employs the use of
CR to selectively enhance relaxation of water in the EC space in order to separate the respective IC and EC signal contributions based on T1-relaxation time differences. DW-IRSE and
DW-EPI was performed in four groups (of five animals each) to study normal and ischemic
brain tissue (both with and without the infused CR). Measurements of the apparent T1, T2,
diffusion, and volume fraction of the IC space were performed; and in subsequent analysis,
the apparent T1, T2, diffusion, and volume fraction of the EC space was calculated indirectly
from the IC data. A promising result from the analysis was the calculation of the IC signal
fraction of approximately 80%, which matches the physiologically known IC fraction. The
apparent T1 and T2 values of the IC space were measured as 235 ± 10 ms and 46 ± 2 ms, respectively. The apparent T1 and T2 values of the EC water were 48 ± 8 ms and 6 ± 2 ms, respectively, in the presence of the CR.
In subsequent experiments, the echo time of the NMR pulse sequences was set to >5T2
of the EC space in order to filter the EC signal contribution and thus allow selective ADC
measurements of the IC water. In Chapter 9, the spectroscopically- and imaging-derived
ADC values of each group are described in detail. In short, the ADC value measured in normal brain (comprised of IC and EC water) and the ADC value of the CR-infused brain (comprised of only IC water) were statistically similar, suggesting that the major determinant of
the equilibrium ADC value in rat cerebral tissue is the ADC of the IC space. Furthermore,
during acute focal cerebral ischemia, the reduction of ADC measured in the CR-free brain
statistically matched the ADC value measured in the CR-infused brain. This result suggests
that diffusion-weighted contrast during acute cerebral ischemia is primarily a result of a re-
56
duction of the ADC in the IC space. This finding is consistent with previously published results using the ADC of exogenous and metabolic surrogates to model water diffusion (Neil et
al., 1996; Wick et al., 1995; van der Toorn et al., 1996; Duong et al., 1998; Duong et al.,
2001). Although it is theoretically possible for significant EC ADC reductions to occur as a
result of water loss and restriction increases (as suggested by the other noted hypotheses),
this study suggests that the larger IC volume is more likely the major determinant of acute
water ADC changes in ischemic brain tissue.
57
Chapters 3 – 9
Research Papers
Chapter 3
Temporal Evolution of Ischemic Injury Evaluated with Diffusion-,
Perfusion- and T2-weighted MRI
Fuhai Li, Matthew D. Silva, Christopher H. Sotak, Marc Fisher
From the Departments of Neurology (F.L., M.F.) and Radiology (C.H.S., M.F.), UMass
Memorial Health Care and University of Massachusetts Medical School, Worcester, MA;
Departments of Biomedical Engineering (M.D.S., C.H.S.) and Chemistry & Biochemistry
(C.H.S.), Worcester Polytechnic Institute, Worcester, MA
Published in Neurology, 2000 Feb; 54(3):689-96
3.1 Preface
Ischemic lesions seen on diffuison-weighted imaging (DWI) are reversible if reperfusion is
performed within minutes after the onset of ischemia. This study was designed to determine
if acute reversibility of DWI abnormalities is transient following brief temporary focal brain
ischemia and to characterize the temporal evolution of in vivo ischemic lesions. My contributions to this work were collection of the NMR data, C and IDL programming for image reconstruction and analysis, and participation in the writing of the manuscript.
59
3.2 Abstract
Objective and background: Ischemic lesions seen on diffuison-weighted imaging (DWI) are
reversible if reperfusion is performed within minutes after the onset of ischemia. This study
was designed to determine if acute reversibility of DWI abnormalities is transient following
brief temporary focal brain ischemia and to characterize the temporal evolution of in vivo
ischemic lesions. Methods: Eight rats were subjected to 30 minutes of temporary middle
cerebral artery occlusion and underwent diffusion-, perfusion-, and T2-weighted MRI during
occlusion, immediately after reperfusion, 30, 60, 90 minutes, and 12, 24, 48 and 72 hours after reperfusion. Average apparent diffusion coefficient (ADCav) values and the cerebral blood
flow index (CBFi) ratio were calculated in both the lateral caudoputamen and overlying cortex at each time point. The size of the in vivo ischemic abnormalities was calculated from the
ADCav and the T2 maps. Postmortem triphenyltetrazolium chloride (TTC) staining was used
to verify ischemic injury. Results: Both the CBFi ratio and ADCav values declined significantly in the two regions during occlusion. The CBFi ratio recovered immediately after reperfusion and remained unchanged over 72 hours. However, ADCav values returned to normal at
60 to 90 minutes and secondarily decreased at 12 hours after reperfusion as compared with
those in the contralateral hemisphere. The extent of the in vivo ischemic lesions maximized at
48 hours and was highly correlated with TTC-derived lesion size. Conclusions: Acute recovery of initial ADCav-defined lesions after reperfusion is transient, and secondary ADCavdefined lesions develop in a slow and delayed fashion.
60
3.3 Introduction
Diffusion-weighted magnetic resonance imaging (DWI) is widely used to investigate hyperacute and acute ischemia in both experimental stroke and stroke patients (Baird and
Warach, 1998) because of its ability to detect early ischemic hyperintense abnormalities that
are related to a reduction of the apparent diffusion coefficient (ADC) of water (Moseley et
al., 1990; Moseley et al., 1990; Minematsu et al., 1992). ADC decline is a reliable marker of
ischemic injury at the early stages of stroke, likely attributable to cytotoxic edema formation
caused by energy failure after the cessation of blood flow (Busza et al., 1992; Benveniste et
al., 1992; Mintorovitch et al., 1994). Although the precise mechanisms of ADC declines are
not fully understood, many studies have demonstrated that the regions with ADC reduction
eventually become infarcted without therapeutic intervention, while those with normal ADC
values over time do not develop infarction. Further experimental studies demonstrated that
the initial ADC declines recovered completely if the interrupted cerebral blood flow is restored within minutes after the onset of ischemia (Mintorovitch et al., 1991; Minematsu et
al., 1992; Davis et al., 1994; Pierpaoli et al., 1996), indicating that initial ischemic abnormalities demonstrated on DWI are reversible. However, little is known about whether the
reversibility of the initial ischemic lesions on DWI induced by acute reperfusion is transient
or permanent following temporary focal ischemia and how much, if any, of the region with
initial ADC decrease develops secondary ADC reduction. The purposes of the present study
were (a) to determine whether secondary ADC declines occur after recovery of initially decreased ADC values, (b) to characterize the temporal and spatial evolution of the in vivo
ischemic lesions, and (c) to determine if secondary cerebral hypoperfusion contributes to the
secondary ADC declines. We evaluated the in vivo temporal and spatial evolution of
61
ischemic changes from acute to subacute stages (72 hours) with diffusion-, perfusion- and T2weighted imaging following 30 minutes of transient middle cerebral artery occlusion
(MCAO) in the rat.
3.4 Materials and Methods
3.4.1 Animal preparation
All procedures used in this study were in accordance with our institutional guidelines (protocol A-643). Eight male Sprague-Dawley rats weighing 310 to 330 g were anesthetized with
an intraperitoneal injection of 400 mg/kg chloral hydrate. PE-50 polyethylene tubing was inserted into the left femoral artery for continuous monitoring of mean arterial blood pressure
throughout the study and for obtaining blood samples to measure pH, PaCO2, and PaO2 before occlusion, 25 minutes after occlusion and 60 minutes after reperfusion. Another silicone
rubber tube was inserted into the left femoral vein for injection of gadopentate dimeglumine
for perfusion-weighted imaging (PWI). During the surgical procedure, temperature was continuously monitored with a rectal probe and maintained at 37oC with a thermostaticallycontrolled heating lamp.
3.4.2 Focal ischemia induction
Focal brain ischemia was induced with the intraluminal suture MCAO method as initially
described by Koizumi et al. (1986) Briefly, the right common carotid artery, internal carotid
artery and external carotid artery were exposed through a midline incision of the neck. The
proximal portions of the right common carotid artery and external carotid artery were ligated
with 5-0 surgical sutures. A 4-0 monofilament nylon suture, its tip rounded by flame and
62
coated by silicone, was inserted through an arteriotomy of the right common carotid artery 3
mm below the carotid bifurcation and advanced into the internal carotid artery until a mild
resistance was felt, indicating that the occluder had entered the anterior cerebral artery and
thus blocked the blood flow from the anterior cerebral artery and the posterior cerebral artery
to the middle cerebral artery. The animals were then fixed to a head holder with a tooth-bar
and ear-bars, and quickly placed into the MRI magnet bore. Inside the magnet, anesthesia
was maintained with 1.0% isoflurane delivered in air at 1.0 L/min. Body temperature was
continuously monitored using a rectal probe and was maintained at 37o C by means of a
thermostatically-regulated heated-air flow system. The rats were reperfused in the magnet
bore by withdrawing the occluder 30 minutes after MCAO.
3.4.3 MRI measurements
The MRI studies were performed in a GE CSI-II 2.0T/45 cm imaging spectrometer (GE
NMR Instruments, Fremont, CA) operating at 85.56 MHz for 1H and equipped with ±20
G/cm self-shielding gradients. Multislice, diffusion-weighted spin-echo echo-planar imaging
(EPI) (Turner and Le Bihan, 1990) was used to map the ADC of brain water. Eight contiguous, coronal, 2-mm-thick slices, were acquired with a field of view (FOV) = 25.6×25.6 mm2,
pixel resolution = 64×64, repetition time (TR) = 5 s, echo time (TE) = 74 ms, EPI data acquisition time = 65 ms, number of excitations (NEX) = 2, diffusion-sensitive-gradient pulse
width (δ) = 7 ms, and diffusion-gradient separation time (∆) = 35 ms. The first slice was a
scout image and was then used to adjust the brain position so that the second slice started
from the frontal pole of the brain. Half-sine-shaped diffusion-sensitive gradient pulses were
applied along one of the three orthogonal gradient axes (x, y, or z). In separate experiments,
63
nine b values, ranging from 18 to 1552 s/mm2, were used to measure the ADC of water along
each of the three diffusion-gradient directions. Using a linear least-squares regression, the
natural logarithm of the signal intensity was fitted to the b values, where the slope of the fitted line is proportional to the ADC. The average ADC (ADCav) map was calculated by averaging the three orthogonal ADC values on a pixel-by-pixel basis (van Gelderen et al., 1994).
The center four slices of the diffusion data (at levels from 2 to 10 mm from the frontal pole)
were used for lesion volume calculation.
T2-weighted EPI was employed to perform dynamic contrast-enhanced perfusion imaging (Wendland et al., 1991) for documenting successful occlusion and reperfusion at acute
stage and demonstrating microcirculatory perfusion at subacute stages. Four contiguous, coronal, 2-mm-thick slices, which correspond to the center four DWI slices, were acquired with
FOV = 25.6×25.6 mm2 and pixel resolution = 64×64. A total of 40 spin-echo EPIs (TR =
900 ms, TE = 74 ms, EPI data acquisition time = 65 ms, NEX = 1) was obtained for each
slice. A bolus injection of 0.25 ml of gadopentate dimeglumine was administered following
acquisition of the 15th image. The PWI data were processed to obtain an estimate of the
cerebral blood flow index (CBFi) as previously described (Hamberg et al., 1993). The change
in the T2 rate, ∆R2(t), was obtained from the change in signal intensity based on the following
relationship:
∆R2 (t ) = −
S (t )
1
× ln
TE
S0
[3.1]
where S(t) is the signal intensity at time t during bolus passage of the contrast agent, S0 is the
baseline value of the precontrast signal intensity. For this study, only relative changes in
cerebral blood volume were evaluated, and thus knowledge of the tissue contrast agent concentration and the arterial input function were not required. The relative cerebral blood vol64
ume (rCBV) was determined by numerical integration of the ∆R2(t) versus time curve. An
estimate of the vascular transit time (VTT) was obtained from the first moment of the ∆R2(t)
versus time curve. The estimate of VTT was used in conjunction with the value for rCBV to
calculate CBFi based on the central volume principle (Meier et al., 1954):
CBFi =rCBV/VTT
[3.2]
where CBFi was determined for each pixel. The accuracy of the CBFi calculation was challenged as the VTT derived from the first moment of the residue curve is not the true mean
transit time (MTT) and actually overestimates the MTT, thus giving rise to an underestimate
of CBF changes (Hamberg et al., 1993; Weisskoff et al., 1993). However, studies have demonstrated that the VTT can be used as a relative estimate of regional flow (Weisskoff et al.,
1993) and the CBFi measurement is able to reflect regional flow changes during ischemia and
after reperfusion(Hamberg et al., 1993; Wittlich et al., 1995). Moreover, the CBFi ratio calculated from the two regions with relatively similar vascular physiology as we used in this
study is likely to better estimate the relative flows (Weisskoff et al., 1993).
A multislice, double spin-echo EPI pulse sequence was used to map the transverse relaxation time, T2, of the brain. T2-weighting imaging (T2WI) was achieved by varying the
echo time for the first echo. T2 maps were constructed from nine T2-weighted EPIs with TR
= 5s, NEX = 4, and TE1 values between 20 and 110 ms. The echo time for the second echo
was the same as the echo time for the DWI and PWI sequences (TE2 = 74 ms). This ensured
that the diffusion, perfusion, and T2 maps all contained the same EPI spatial distortions.
Eight contiguous, coronal, 2-mm-thick slices, which correspond to the eight DWI slices,
were acquired with FOV = 25.6×25.6 mm2 and pixel resolution=64×64. Using a linear leastsquares regression, the natural logarithm of the signal intensity was fitted to the TE values,
65
where the slope of the fitted line is proportional to the T2 value.
PWI, T2WI and DWI were acquired during occlusion (just before reperfusion), immediately after reperfusion, and 30, 60, 90 minutes, and 12, 24, 48, and 72 hours after reperfusion.
For the subacute time points, a scout image was taken to position the rat brain so that the
second slice started from the frontal pole of the brain. By doing this, the brain slices obtained
at different time points were well-matched.
3.4.4 Data Analysis
Two ROIs (3×3 pixels each in size), one in the lateral caudoputamen and the other in the
frontoparietal cortex (Fig. 3.1, A1 and B1) in the optic chiasm slice, were chosen to measure
C2
C1
B2
B1
A2
A1
Figure 3.1. A schematic diagram showing regions of interest (3×3
pixels in size) chosen for data analysis. CBF index, average ADC
and T2 values were measured in the lateral caudoputamen (A1 and
A2) and overlying frontoparietal cortex (B1 and B2) of both
hemispheres. CBF index was also measured in the cortex of anterior
cerebral artery territory of both hemispheres (C1 and C2).
66
ADCav, CBFi and T2 values on the corresponding maps. These three parameters were also
measured in the homologous regions of the contralateral hemisphere (Fig. 3.1, A2 and B2).
In addition, CBFi values were measured in the normal region of the anterior cerebral artery
territory of the ipsilateral hemisphere and in the homologous region of the contralateral hemisphere (Fig. 3.1, C1 and C2). A CBFi ratio was calculated by dividing the ipsilateral CBFi
values by the contralateral CBFi values. The ADCav and T2 values in the contralateral hemisphere and the CBFi ratio in the anterior cerebral artery territory were used as controls.
3.4.5 In vivo lesion size calculation and post mortem evaluation
Using a computer software program (Interactive Data Language, Research Systems, Boulder,
Colorado), the brain pixels were classified into normal and abnormal clusters based on visual
abnormalities on the ADCav and T2 maps. The total number of the pixels defined as abnormal
during acute time points was determined by the ADCav maps alone since the T2 maps were
normal. At subacute time points, however, the pixels having abnormal ADCav values or abnormal T2 values were classified as abnormal. Therefore, composite maps were then developed to define the total number of pixels that were abnormal on the ADCav maps or on the T2
maps. The number of abnormal pixels was divided by the total number of pixels in the ipsilateral hemisphere from the center four slices to yield percent hemisphere lesion volume
(%HLV) to compensate for brain edema at each time point. In order to evaluate the spatial
evolution of individual ischemic lesion sizes, up to a ±15% difference was allowed (Sorensen
et al., 1999) when the comparison was made between pre- and post-reperfusion size, namely,
post-reperfusion size was considered to be identical with pre-reperfusion size when it was
85%–115% of the pre-reperfusion size. This consideration takes into account calculation er-
67
rors and slight difference in the position of brain slices at different time points.
Following the last MRI protocol, the rats were anesthetized with an intraperitoneal injection of 400mg/kg chloral hydrate, and one PE-50 tubing was cannulated into right femoral
artery for measuring mean arterial blood pressure and for obtaining blood sample to analyze
pH, PaCO2, and PaO2. The rats were then decapitated. The brains were removed and coronally sectioned into six, 2-mm-thick slices starting from the frontal pole. The brain slices were
incubated for 30 minutes in a 2% solution of triphenyltetrazolium chloride (TTC) at 37o C
and fixed by immersion in a 10% buffered formalin solution (Bederson et al., 1986). Then
the brain slices were photographed using a CCD camera. Using an imaging analysis program
(Bio Scan OPTIMAS, Edmonds, WA), the volumes of the infarcted region and the ipsilateral
hemisphere were calculated (Li et al., 1997) for each of the center four brain slices (at levels
from 2 to 10 mm from the frontal pole). The TTC-derived %HLV was calculated by dividing
the volume of the infarcted region by the total volume of the ipsilateral hemisphere. The center four TTC slices corresponded to the center four DWI slices. An exact match is, however,
not likely as TTC stains the surface of brain slices, while DWI provides overlap with 2-mmthick slice.
3.4.6 Statistical analysis
Data are presented as mean ± SD. Statistical analyses of physiological variables were
performed using one-way analysis of variance. An unpaired t test was used to compare the
parametric variables. A linear regression analysis was used to correlate the in vivo %HLV at
48 and 72 hours with TTC-derived %HLV. A two-tailed value of p<0.05 was considered
significant.
68
3.5 Results
The physiological variables such as body temperature, mean arterial blood pressure, pH,
PaCO2 and PaO2 were within the normal range and did not significantly change throughout
experiment (data not shown).
Perfusion deficits documented by PWI were seen in the entire right MCA territory during occlusion and disappeared after reperfusion. Fig. 3.2 shows the changes of the CBFi ratio
over time in the subcortical and cortical ROIs. The CBFi ratio in normal regions of the anterior cerebral artery territory was constant (~1) throughout the observation period. The CBFi
ratio declined in both the lateral caudoputamen (0.51±0.12, p<0.01) and the frontoparietal
cortex (0.59±0.13, p<0.01) during occlusion as compared with that in the normal region, then
recovered to normal values immediately after reperfusion (1.04±0.11 in the caudoputamen
1.4
CBF index ratio
1.2
1.0
0.8
0.6
0.4
ACA
Cortex
Caudo
0.2
0.0
Pre-rep
Rep
30 min 60 min 90 min
12 h
24 h
48 h
72 h
Time points
Figure 3.2. The changes of CBF index (CBFi) ratio (ipsilateral
CBFi/contralateral CBFi) over time. The CBFi ratio in the normal
cortex of the anterior cerebral artery territory (ACA) was normal
throughout observation. However, the CBFi ratio in both lateral
caudoputamen and frontoparietal cortex decreased during occlusion
(p<0.001), recovered to normal level immediately after reperfusion,
and remained unchanged up to 72 hours after reperfusion.
69
and 1.07±0.21 in the cortex), and remains unchanged until 72 hours after reperfusion.
DWI hyperintensity was observed in the right MCA region during occlusion, mainly involving the lateral caudoputamen and overlying cortex. DWI abnormalities gradually disappeared between 60 to 90 minutes after reperfusion, and reappeared at the 12-hour observation
point. The temporal evolution of ADCav changes in both the lateral caudoputamen and frontoparietal cortex is shown in Fig. 3.3. In the contralateral nonischemic hemisphere, the ADCav values in the two ROIs were stable over time (62-65×10-5 mm2/s). However, in the ipsilateral ischemic hemisphere, the ADCav values decreased during occlusion in both the lateral
caudoputamen (43±3×10⁻⁵ mm2/s, p<0.001) and the frontoparietal cortex (46±5×10⁻⁵ mm2/s,
p<0.001), compared with those in the contralateral regions (62±3×10⁻⁵ mm2/s in the caudopu-
ADCav values (x10-5 mm2/s)
80
70
60
50
40
30
Cortex-ischemia
Caudo-ischemia
Cortex-normal
Caudo-normal
20
10
0
Pre-rep
Rep
30 min 60 min 90 min
12 h
24 h
48 h
Time points
Figure 3.3. Temporal evolution of average ADC (ADCav) values in
the ischemic and nonischemic hemispheres following 30 minutes of
transient middle cerebral artery occlusion. In the caudoputamen and
cortex of the nonischemic hemisphere, the ADCav values were stable.
However, in both the caudoputamen and cortex of the ischemic
hemisphere, the ADCav values decreased during occlusion (p<0.001),
recovered completely at 60 to 90 minutes after reperfusion, declined
secondarily at 12 hours (p<0.001), and started to pseudonormalize at
24 to 48 hours after reperfusion.
70
72 h
tamen and 64±3×10⁻⁵ mm2/s in the cortex). The ADCav values fully recovered between 60 to
90 minutes in both regions (64±3 ×10⁻⁵ mm2/s in the caudoputamen and 65±3×10⁻⁵ mm2/s in
the cortex), secondarily declined at 12 hours (44±6×10⁻⁵ mm2/s in the caudoputamen and
47±8×10⁻⁵ mm2/s in the cortex, p<0.001, compared with homologous contralateral values),
and began to increase (50±5×10⁻⁵ mm2/s in the caudoputamen and 49±8×10⁻⁵ mm2/s in the
cortex) at 48 hours after reperfusion.
The T2 changes over time are shown in Fig. 3.4. During the acute time periods, the T2
values were within normal ranges in both hemispheres. However, the T2 values in the two
ROIs of the ischemic hemisphere significantly increased (98±11 vs 69±3 ms in the caudoputamen and 90±19 vs 70±5 ms in the cortex) at 12 hours after reperfusion as compared with
those of the contralateral hemisphere, and peaked at 48 hours after reperfusion.
140
T2 values (ms)
120
100
80
60
Cortex-ischemia
Caudo-ischemia
Cortex-normal
Caudo-normal
40
20
0
Pre-rep
Rep
30 min
60 min
90 min
12 h
24 h
48 h
72 h
Time points
Figure 3.4. The T2 changes over time in the two ROIs of both the
ischemic and normal hemispheres. The T2 values in the normal
hemisphere were stable throughout the experiment, while the T2 values in the ischemic hemisphere were within normal ranges during
acute time points, significantly elevated at 12 hours after reperfusion
and peaked at 48 hours after reperfusion (p<0.005).
71
The extent of normalized ischemic lesions defined by ADCav and T2 abnormalities is shown
in Fig. 3.5, demonstrating that the in vivo lesions during arterial occlusion almost disappeared
within 60 to 90 minutes after reperfusion, secondarily occurred at 12 hours, and maximized
at 48 hours after reperfusion. Compared with the initial ADCav-defined lesions, the extent of
the lesions determined by secondary ADCav decline and T2 abnormalities was smaller in two
rats, identical in four rats, and larger in two rats (Table 3.1). Further spatial comparison between the initial ADCav-defined lesions and secondary ADCav-defined lesions demonstrated
that the secondary ADCav-defined lesions may in part spare in regions with initial ADCavdefined lesions (Fig. 3.6A), can closely match the initial ADCav-defined lesions in size and
location (Fig. 3.6B), or can even develop in regions where the ADCav values were normal
Normalized leison volume (%)
before reperfusion (Fig. 3.6C). The ischemic injury was verified by postmortem TTC stain-
140
120
100
80
60
40
20
0
-20
Prerep
Rep
30 min 60 min 90 min 12 h
24 h
48 h
72 h
TTC
Time points
Figure 3.5. Temporal evolution of normalized lesion volume. The
ischemic lesions defined by visual abnormalities on the ADCav and
T2 maps decreased to almost zero at 90 minutes after reperfusion,
secondarily occurred at 12 hours and maximized at 48 hours after
reperfusion. Note that the lesion volume is normalized by the
prereperfusion percent hemisphere lesion volume.
72
ing, and the in vivo lesion size at 48 and 72 hours after reperfusion was comparable to TTCdefined lesion size (Fig. 3.6). A significant correlation was achieved between the in vivo (48
and 72 hours after reperfusion) and postmortem ischemic lesion size (r=0.96, p=0.0001).
Rat No.
1
2
3
4
5
6
7
8
Mean±SD
Initial %HLV
25.8
37.1
8.2
26.6
49.5
26.6
25.6
39.0
29.8±12.2
Secondary %HLV
17.4
21.8
8.7
24.6
48.4
27.0
34.3
49.5
29.0±14.4
Changes (%)
-32.6
-41.8
+6.1
-7.5
-2.2
+1.5
+34.0
+26.9
TTC (%HLV)
15.0
17.7
10.5
24.1
49.7
23.6
29.5
45.2
26.9±14.0
Table 3.1. Comparison between the initial ADCav-defined lesions
during ischemia and secondary ADCav-defined lesions at 48 hours after reperfusion. The ischemic lesions are expressed as percent hemisphere lesion volume (%HLV). Secondary ADCav-defined lesions are
considered to be identical with initial ADCav-defined lesions when
changes are within ±15%, smaller when changes < -15%, and larger
when changes > +15%.
3.6 Discussion
Prior experiments demonstrated that initially decreased ADC values can revert to normal if
successful reperfusion is performed within minutes of stroke onset in both the global and focal ischemia animal models (Mintorovitch et al., 1991; Minematsu et al., 1992; Davis et al.,
1994; Pierpaoli et al., 1996). Complete recovery of initially decreased ADC values in a patient with transient ischemic attack was also documented recently (Lecouvet et al., 1999). A
recent study showed that delayed neuronal death or pannecrosis might develop in the regions
with complete reversal of the initially decreased ADC values (Li et al., 1998). The present
study further demonstrates that ADC recovery following 30 minutes of arterial occlusion is
transient, and secondary ADC reduction occurs later on, which is consistent with recent
73
Pre-rep
Rep
30 m
60 m
90 m
12 h
24 h
48 h
72 h
TTC
A
B
C
Figure 3.6. Representative ADCav maps showing that initial ADCavdefined lesions occurring during occlusion gradually disappear after
reperfusion and secondary ADCav-defined lesions develop later on.
The secondary ADCav-defined lesions may be smaller (A), identical
(B), or larger (C) as compared with initial ADCav-defined lesions.
Secondary ADCav-defined lesions (arrowheads) even develop in the
prereperfusion normal regions (arrow). The TTC-determined
ischemic injury is comparable to the in vivo lesion size at 48 and 72
hours. Note that ADCav values pseudonormalize in some regions at
48 and 72 hours after reperfusion.
studies (Dijkhuizen et al., 1998; Thornton et al., 1998; van Bruggen et al., 1998). This finding may help to explain the dissociation between the early reversal of ADC values and delayed neuronal abnormalities documented by histology.
In this study, we classify the ischemic hyperintensities on DWI during ischemia as initial
ADC-defined lesions. The initial ADC-defined lesions following 30 minutes of ischemia
were reversible after reperfusion and the recurrence of ischemic changes identified by the
secondary reduction of the ADC values in this study is therefore classified as secondary
ADC-defined lesions or delayed ischemic lesions. Prior studies demonstrated that the pathophysiological processes occurring during ischemia, such as an increase in calcium and glutamate, inhibition of protein synthesis, disturbance of metabolites, depolarization, and mitochondrial dysfunction, might be reversible if reperfusion occurred rapidly (Lorek et al., 1994;
74
Siesjö et al., 1995; Abe et al., 1995; Kristián and Siesjö, 1998; Fiskum et al., 1999). The
acute normalization of ADC values after reperfusion in this study may indicate full restoration of energy metabolism and secondary ADC declines suggest secondary energy failure, as
ADC values are closely related to energy metabolism (Busza et al., 1992; Benveniste et al.,
1992; Mintorovitch et al., 1994). It is less likely that acute ADC normalization is an epiphenomenon related to reperfusion in an irreversibly damaged region, since delayed (>45 minutes) complete restoration of the cerebral blood flow does not normalize the initially depressed ADC values (Minematsu et al., 1992; Hasegawa et al., 1994). Further studies are
needed to determine whether the reperfusion-induced normalization of the ADC values indicates complete recovery of the cellular and biochemical cascades induced by ischemia and
what the secondary ADC abnormalities actually mean.
Previous studies demonstrated that the ischemic lesions on DWI are fully developed approximately 2 to 3 hours after permanent MCAO (Dardzinski et al., 1993; Li et al., 1997).
The present study shows that secondary ADCav-defined lesions occur as early as 12 hours
after reperfusion, then gradually increase in size, and maximize 48 hours after reperfusion,
indicating that the ischemic lesions defined by secondary ADCav reduction develop in a slow
and delayed fashion, consistent with a previous report (Du et al., 1996). The extent of secondary ADCav-defined lesions is variable from animal to animal, and it may be identical,
smaller or larger, when compared with the initial ADCav-defined lesions. This suggests that
reperfusion may reduce initial ADCav-defined lesions in some animals (Fig. 3.6A). However,
reperfusion after 30 minutes of temporary focal ischemia fails to salvage brain tissue from
ischemic injury in most cases (Fig. 3.6B). Interestingly, secondary ADCav-defined lesions
can even develop in the prereperfusion ADCav-defined normal regions and lead to delayed
75
ischemic lesions larger than the initial ischemic lesions (Fig. 3.6C). Although it is not known
why secondary ADCav-defined lesions are variable, the present study clearly demonstrates
that reperfusion alone can not fully salvage brain tissue from ischemic injury and can only
reduce initial ADCav-defined lesions in a few cases (2/8) following 30 minutes of ischemia in
this rat model. A recent study demonstrated that 28% (57/206) of stroke patients who received recombinant tissue plasminagen activator (r-tPA) within 6 hours after the onset of
stroke had a significant increase in ischemic abnormalities defined by CT at day 7 when
compared to day 1 (24 to 36 hours) (Pantano et al., 1999). The delayed increase in CT abnormalities might be due to that r-tPA administration failed to fibrinolyse clots or initiation
of the treatment was beyond the therapeutic time windows, but delayed ischemic lesions
shown in this study may be another factor to compromise the ischemic injury in some patients whose occluded arteries were successfully recanalized by r-tPA.
The mechanisms responsible for the delayed ischemic lesions observed in this study are
still unclear. The first possible explanation is that secondary energy failure gives rise to the
delayed ischemic injury and subsequent necrosis (Kristián and Siesjö, 1998; Siesjö et al.,
1999; Murphy et al., 1999). The secondary ADC reductions seen in the present study suggest
a delayed failure of energy metabolism. Secondary energy failure was also documented recently following transient hypoxia-ischemia (Dijkhuizen et al., 1998; van Bruggen et al.,
1998; Blumberg et al., 1997). It is unlikely that secondary energy failure is due to depressed
arterial blood pressure or decreased arterial oxygen tension, since these physiological variables remained normal throughout the observation period. Although postischemic hypoperfusion may result in secondary energy disruption (Levy et al., 1979), the present study did not
document microcirculatory hypoperfusion by perfusion imaging. Secondary mitochondrial
76
injury that may be triggered by disturbance of mitochondrial gene expression (Abe et al.,
1995), secondary overload of calcium (Kristián and Siesjö, 1998; Fiskum et al., 1999), lactic
acidosis (Fiskum et al., 1999), mitochondrial permeability transition pore opening (Siesjö et
al., 1999), excitotoxicity (Murphy et al., 1999), or reperfusion-induced free radical production (Siesjö et al., 1989), is potentially responsible for the secondary energy failure and delayed necrosis. In addition, calcium accumulation (Kristián and Siesjö, 1998), free radical
formation (Siesjö et al., 1989; Kitagawa et al., 1990), and glutamate release (Choi, 1992) can
also lead to late degradation of cytoskeleton and ensuing necrosis. The second possible explanation is that apoptosis may play a role in the delayed ischemic injury. Several studies
demonstrated that apoptotic cells and DNA fragmentation occur early in ischemic brain tissues and persist for days after permanent (Linnik et al., 1993; Tominaga et al., 1993) or transient focal brain ischemia (Charriaut-Marlangue et al., 1996; Li et al., 1995a; Li et al.,
1995b). Du et al. (1996) further demonstrated that infarction develops in a delayed pattern
following mild focal ischemia as compared to severe focal brain ischemia and that positive
TUNEL staining and a ladder pattern of DNA fragmentation by agarose gel electrophoresis
occur at the margin of the infarct. Moreover, the protein synthesis inhibitor, cycloheximide,
significantly reduced the ischemic infarct volume (Du et al., 1996; Linnik et al., 1993).
These experimental findings suggest that apoptosis likely contributes to the delayed development and expansion of the ischemic infarct in our study. It is still uncertain what induces
apoptosis although glutamate exposure (Siesjö et al., 1999; Choi, 1992), calcium accumulation (Murphy et al., 1999), gene expression (MacManus and Linnik, 1997), oxidative stress
(MacManus and Linnik, 1997), mitochondrial dysfunction (release of cytochrome c and other
apoptogenic factors) (Siesjö et al., 1999; Murphy et al., 1999; Green and Reed, 1998), or en-
77
doplasmic reticulum dysfunction (Paschen and Doutheil, 1999) are potential factors. However, secondary energy failure and accompanying cellular swelling reflected by the secondary ADC declines cast some doubt on the role apoptosis plays in this delayed ischemic injury, since apoptotic cells do not have failure of energy metabolism and subsequent cellular
swelling (Abe et al., 1995; Murphy et al., 1999). It is likely that there is a coexistence of necrotic and apoptotic processes causing the delayed injury or that some cells undergo apoptosis followed by necrosis in an appropriate environment. Evidence has shown that factors
that trigger apoptosis can also induce necrosis (Siesjö et al., 1999; Murphy et al., 1999), and
there is a continuum between apoptosis and necrosis (Fiskum et al., 1999; Murphy et al.,
1999). Further studies are needed to elucidate the potential mechanisms underlying the delayed ischemic lesions seen in the present study.
The findings in the present study are clinically relevant. Firstly, an early reduction or
resolution of DWI hyperintensity after thrombolytic therapy in stroke patients may not, at
least in some cases, indicate ultimate brain tissue salvage from ischemic injury, since reversibility of initial ADCav-defined lesions may be transient and secondary ADCav-defined
lesions may develop in a delayed fashion. Therefore, caution should be taken in interpreting
the early reversibility of DWI lesions induced by reperfusion, and a follow-up DWI study
may be required. Secondly, thrombolytic treatment alone even instituted at an early time may
not entirely salvage ischemic brain tissue, as delayed ischemic injury may occur. Accordingly, therapeutic strategies directed against delayed ischemic injury may be desirable in
combination with thrombolytic therapy. Based on the aforementioned potential mechanisms,
these strategies might include scavenging free radicals, inhibiting excitotoxicity and calcium
accumulation, targeting the apoptosis-inducing genes, preventing release of the mitochon-
78
drial apoptogens, blocking mitochondrial permeability transition pore (Fiskum et al., 1999),
and restoring function of the endoplasmic reticulum (Paschen and Doutheil, 1999).
3.7 Acknowledgments
This study was in part supported by a Research Fellowship Award from the National Stroke
Association (F. L.). Additional funding provided by a US Department of Education GAANN
Fellowship (M.D.S.). Part of this study was performed during the tenure of an Established
Investigatorship from the American Heart Association (C.H.S.).
79
Chapter 4
Transient and Permanent Resolution of Ischemic Lesions on Diffusionweighted Imaging after Brief Periods of Focal Ischemia in Rats:
Correlation with Histopathology
Fuhai Li, Kai-Feng Liu, Matthew D. Silva, Tsuyoshi Omae, Christopher H. Sotak,
Joseph D. Fenstermacher, Marc Fisher
From the Departments of Neurology (F.L., T.O., M.F.) and Radiology (C.H.S., M.F.), UMass
Memorial Health Care and University of Massachusetts Medical School, Worcester, MA;
Departments of Pathology (Neuropathology) (K-F.L.) and Anesthesiology (J.D.F.), Henry
Ford Hospital, Detroit, MI; and Departments of Biomedical Engineering (M.D.S., C.H.S.)
and Chemistry & Biochemistry (C.H.S.), Worcester Polytechnic Institute, Worcester, MA,
USA
Published in Stroke, 2000 Apr; 31(4): 946-954
4.1 Preface
The early ischemic lesions demonstrated by diffusion-weighted imaging (DWI) are potentially reversible. The purposes of this study were to determine whether resolution of initial
DWI lesions is transient or permanent following different brief periods of focal brain ischemia and to evaluate histological outcomes. My contributions to this work were collection of
the NMR data, C and IDL programming for image reconstruction and analysis, and participation in the writing of the manuscript.
80
4.2 Abstract
Background and Purpose: The early ischemic lesions demonstrated by diffusion-weighted
imaging (DWI) are potentially reversible. The purposes of this study were to determine
whether resolution of initial DWI lesions is transient or permanent following different brief
periods of focal brain ischemia and to evaluate histological outcomes. Methods: Sixteen rats
were subjected to 10 minutes (n=7) or 30 minutes (n=7) of temporary middle cerebral artery
occlusion or sham operation (n=2). DWI, perfusion-weighted imaging (PWI), and T2weighted imaging (T2WI) were obtained during occlusion, immediately after reperfusion, 0.5,
1.0, 1.5, 12, 24, 48 and 72 hours after reperfusion. After the last MRI study, the brains were
fixed, sectioned, stained with hematoxylin & eosin staining, and evaluated for neuronal necrosis. Results: No MRI or histological abnormalities were observed in the sham rats. In both
the 10-min and 30-min groups, the perfusion deficits and DWI hyperintensities occurring
during occlusion disappeared shortly after reperfusion. The DWI, PWI and T2WI remained
normal thereafter in the 10-min group, while secondary DWI hyperintensity and T2 abnormalities developed at the 12-hour observation point in the 30-min group. Histological examinations demonstrated neuronal necrosis in both groups, but the number of the necrotic
neurons was significantly higher in the 30-min group (95±4%) than in the 10-min group
(17±10%, p<0.0001). Conclusions: Transient or permanent resolution of initial DWI lesions
depends on the duration of ischemia. Transient resolution of DWI lesions is associated with
widespread neuronal necrosis; moreover, permanent resolution of DWI lesions does not necessarily indicate complete salvage of brain tissue from ischemic injury.
81
4.3 Introduction
Studies in both experimental stroke models (Moseley et al., 1990a; Moseley et al., 1990b;
Minematsu et al., 1992) and stroke patients (Rordorf et al., 1998; Marks et al., 1996; Lutsep
et al., 1997; van Everdingen et al., 1998; González et al., 1999) have demonstrated that diffusion-weighted imaging (DWI) is superior to conventional magnetic resonance imaging
(MRI) in detecting early ischemic changes. The ischemic hyperintensity on DWI can be detected as early as 3 minutes (Davis et al., 1994; Pierpaoli et al., 1996; Li et al., 1998) after the
onset of ischemia and is due to a reduction of the apparent diffusion coefficient (ADC) of water, presumably related to water movement from the extracellular space to the intracellular
spaces caused by energy failure after disturbance of blood flow (Busza et al., 1992; Benveniste et al., 1992; Mintorovitch et al., 1994). The ischemic hyperintensity demonstrated by
DWI is reversible, if the interrupted blood flow is restored rapidly (Davis et al., 1994; Pierpaoli et al., 1996; Mintorovitch et al., 1991; Minematsu et al., 1992). A recent study showed
that resolution of DWI lesions is transient after 30 minutes of transient focal ischemia (Li et
al., 2000). However, it has not been reported whether transient or permanent resolution of
DWI lesions after reperfusion depends on the duration of ischemia, and whether these two
events, if any, reflect different histopathological changes within tissue. Repeated measurements of DWI following brief periods of focal ischemia could, thus, provide useful information about neurological outcome and treatment strategies for stroke patients.
The goals of the present study were to investigate the time course of ischemic changes on
DWI following different periods of transient focal brain ischemia and to determine the histopathological outcomes in the regions where DWI abnormalities are permanently or transiently
reversible. To accomplish this, diffusion-, perfusion- and T2-weighted MRI were repeatedly
82
measured in the rat from acute to subacute (72 hours) time points following either 10 or 30
minutes of transient middle cerebral artery (MCA) occlusion, and histological brain tissue
damage was assessed after 72 hours of reperfusion.
4.4 Materials and Methods
4.4.1 Animal preparation
All procedures used in this study were performed in accordance with our institutional guidelines (Protocol A-643). Sixteen male Sprague-Dawley rats weighing 300 to 340 g were anesthetized with an intraperitoneal injection of 400 mg/kg chloral hydrate. PE-50 polyethylene
tubing was inserted into the left femoral artery for continuous monitoring of mean arterial
blood pressure and for obtaining blood samples for the determination of pH, PaCO2, and
PaO2 before occlusion, 90 minutes and 72 hours after reperfusion. Another silicone rubber
tube was inserted into the left femoral vein for injection of gadopentetate-dimeglumine for
perfusion-weighted imaging (PWI) to estimate blood flow. During the surgical procedure,
temperature was continuously monitored with a rectal probe and maintained at 37oC with a
thermostatically controlled heating lamp.
4.4.2 Focal cerebral ischemia
The intraluminal MCA suture model (Koizumi et al., 1986) was used to produce focal cerebral ischemia. Fourteen rats were subjected to either 10 or 30 minutes of transient MCA occlusion (n=7 per group), and two other rats underwent sham operation. In all animals, the
right common carotid artery (CCA), internal carotid artery (ICA), and external carotid artery
(ECA) were exposed through a midline incision of the neck. The proximal portions of the
right CCA and ECA were ligated with 5-0 surgical sutures. The animal’s head was then fixed
83
in a holder with a tooth-bar and ear-bars.
In the 10-min group, the rats were occluded within the magnet unit using an in-bore suture MCA occlusion method described by Li and his colleagues (Li et al., 1998) because of
time limitations. After the occluding device consisting of supporting tubing, intra-arterial tubing, a driving line, and a piece of 4-0 silicone-coated nylon suture was set up, the rats were
then placed into the bore of the magnet. Inside the magnet, anesthesia was maintained with
1.0% isoflurane delivered in air at 1.0 L/min. Body temperature was maintained at 37o C with
a thermostatically-regulated, heated-air flow system. Arterial occlusion was achieved within
the bore of the magnet by advancing the end of the driving line until resistance was felt, indicating that the occluding filament was properly positioned in the right anterior cerebral artery
and thus blocked the flow of blood into the root of the MCA. In the 30-min group, a 4-0 silicone-coated nylon suture attached to a driving line within a support tubing was inserted
through a small incision in the right CCA 3 mm below the carotid bifurcation and advanced
into the ICA until resistance was felt. The rats were then quickly placed into magnet bore. In
the sham-operated rats, the occluding filament was inserted only 7 mm above the carotid bifurcation. Reperfusion was accomplished by gently withdrawing the occluding filament about
10 mm while the animal was still within the magnet.
4.4.3 MRI measurements
The MRI measurements were performed in a GE CSI-II 2.0T/45 cm imaging spectrometer
(GE NMR Instruments, Fremont, CA) operating at 85.56 MHz for 1H and equipped with ±20
G/cm self-shielding gradients. Multislice, diffusion-weighted spin-echo echo-planar imaging
(EPI) was used to map the ADC of brain water (Turner and Le Bihan, 1990). Eight contigu-
84
ous, coronal, 2-mm-thick slices were acquired with a field-of-view (FOV) = 25.6×25.6 mm2,
pixel resolution = 64×64, repetition time (TR) = 5 sec, echo time (TE) =74 ms, EPI data acquisition time = 65 ms, number of excitations (NEX) = 2, diffusion-sensitive-gradient pulse
width (δ) = 7 ms, and diffusion-gradient separation time (∆) = 35 ms. The first slice was a
scout image and was used to adjust the brain such that the second slice started from the frontal pole of the brain. Half-sine-shaped diffusion-sensitive gradient pulses were applied along
one of the three orthogonal gradient axes (x, y, or z). In separate experiments, nine b values
ranging from 18 to 1552 s/mm2 were used to measure the ADC of water along each of the
three diffusion-gradient directions. Using a linear least-squares regression, the natural logarithm of the signal intensity was fit to the b values; the slope of this regression line is proportional to ADC. The mean ADC (ADCav) was calculated by averaging the three orthogonal
ADC values on a pixel-by-pixel basis (van Gelderen et al., 1994), and was used to generate
ADC maps.
T2-weighted EPI was employed to perform dynamic contrast-enhanced PWI for determining cerebral perfusion (Wendland et al., 1991). Four contiguous, coronal, 2-mm-thick
slices, which corresponded to the four center diffusion slices, were acquired with FOV =
25.6×25.6 mm2 and pixel resolution = 64×64. A total of 40 spin-echo EPIs (TR = 900 ms, TE
= 74 ms, EPI data acquisition time = 65 ms, NEX = 1) was obtained for each slice. A bolus
injection of 0.25 ml of gadopentetate-dimeglumine was administered following acquisition of
the 15th image. The PWI data were processed to obtain an estimate of the cerebral blood flow
index (CBFi) as previously described (Hamberg et al., 1993). The change in the T2 rate,
∆R2(t), was obtained from the change in signal intensity based on the following relationship:
85
∆R2 (t ) = −
S (t )
1
× ln
TE
S0
[4.1]
where S(t) is the signal intensity at time t during passage of the contrast agent, S0 is the baseline value of the pre-contrast signal intensity. For this study, only relative changes in cerebral
blood volume were evaluated, and thus knowledge of the tissue contrast agent concentration
and the arterial input function were not required. The relative cerebral blood volume (rCBV)
was determined by numerical integration of the ∆R2(t) versus time curve. An estimate of the
vascular transit time (VTT) was obtained from the first moment of the ∆R2(t) versus time
curve. The estimates of VTT and rCBV were used to calculate CBFi with the equation of the
central volume principle:
CBFi =rCBV/VTT
[4.2]
where CBFi was determined for each pixel. Studies have demonstrated that CBFi measurement is able to reflect regional blood flow changes during ischemia and after reperfusion
(Hamberg et al., 1993; Wittlich et al., 1995). Moreover, the CBFi ratio calculated from the
two regions with relatively similar vascular physiology as we used in this study is likely to
better estimate the relative blood flow (Weisskoff et al., 1993).
A multislice, double spin-echo EPI pulse sequence was used to map the transverse relaxation time (T2) of the brain. T2-weighting imaging (T2WI) was achieved by varying the
echo time for the first echo. T2 maps were constructed from nine T2-weighted EPIs with TR =
5s, NEX = 4, and TE1 values between 20 and 110 ms. The echo time for the second echo was
the same as the echo time for the DWI and PWI sequences (TE2 = 74 ms). This ensured that
the diffusion, perfusion, and T2 maps all contained the same EPI spatial distortions. Eight
contiguous, coronal, 2-mm-thick slices, which corresponded to the eight DWI slices, were
86
acquired with FOV = 25.6×25.6 mm2 and pixel resolution = 64×64. Using a linear leastsquares regression, the natural logarithm of the signal intensity was fit to the TE values; the
slope of the best-fit line is proportional to the T2 value.
PWI, T2WI and DWI were acquired before occlusion (only in the 10-min group), during
occlusion (no T2WI in the 10-min group because of time limitations), immediately after
reperfusion, 0.5, 1.0, 1.5, 12, 24, 48, and 72 hours after reperfusion. For the 12-72 hour
measurements, a scout image was taken to position the rat brain such that the second slice
started from the frontal pole of the brain. This ensured that the brain slices obtained at different time points were well-matched.
4.4.4. Analysis of the region of interest
One region of interest (ROI), 4×4 pixels in size, located in the center of the ischemic lesion
(lateral caudoputamen) at the level of the anterior commissure (slice 4), was chosen to measure ADCav, CBFi and T2 values on corresponding maps. These three parameters were also
measured in the homologous region of the contralateral hemisphere. In addition, CBFi values
were measured in the frontoparietal cortex perfused by the anterior cerebral artery and presumed to be normal in both the ipsilateral and contralateral hemispheres. A CBFi ratio was
calculated by dividing the ipsilateral CBFi values by the contralateral CBFi values. The ADCav and T2 values in the lateral caudoputamen of the contralateral hemisphere and the CBFi
ratio in the normal frontoparietal cortex were used as controls.
4.4.5 Histopathological evaluation
Seventy-two hours after MCA occlusion, the rats were re-anesthetized by an intraperitoneal
injection of chloral hydrate (400 mg/kg) and transcardially perfused with 250 ml of
heparinized saline followed by 250 ml of phosphate buffered 4% paraformaldehyde (Garcia
87
et al., 1995). The rats were decapitated, and the severed heads were allowed to fix overnight
in 4o C in the same paraformaldehyde solution. The next day, the brains were removed from
the skull and cut into seven 2 mm thick coronal slices starting from the frontal pole of the
brain. The slices were labeled A (frontal) through G (occipital) and embedded in paraffin.
Histological sections, 6 µm in thickness, were obtained from each paraffin block and stained
with hematoxylin-eosin. One section from slice C at the level of the anterior commissure,
matching slice 4 of the ADCav maps, was used for histological evaluation. A co-registration
method was used to localize the same region on the histology section as on the ADC maps by
using a previously described method (Li et al., 1999). Briefly, a grid consisting of 5×5
squares (1.5×1.5 mm2 in each square) was overlaid on the ADCav maps to localize the labeled
ROI. In the same manner, the grid was then used to pinpoint the corresponding site of the labeled ROI on the histological section. Histological images were electronically collected via a
Global Lab image analysis system (Data Translation Incorporated, Marlboro, MA) connected
to a Sony video camera interfaced with an Olympus microscope system. At high (600×) magnification, the intact and necrotic neurons were counted in five non-overlapping fields in each
ROI by an investigator (K-F. L.) blinded to the MRI data. As previously described (Garcia et
al., 1995; Garcia et al., 1997), neurons were classified as necrotic if they exhibited either
pyknosis, karyorrhexis, karyolysis, cytoplasmic eosinophilia (“red neuron”) or loss of affinity
for hematoxylin (“ghost neuron”). The number of necrotic neurons was divided by the total
number of intact plus necrotic neurons to derive a percentage. The percentage of necrotic
neurons was recorded as 100% when pannecrosis (death of all types of cells including glia
and microvessel) was observed.
88
4.4.6 Statistical analysis
All data are presented as the mean±SD. Statistical analyses of the physiological variables
were performed using two-way repeated measure analysis of variance. An unpaired t test was
used to compare the parametric variables. A two-tailed value of p<0.05 was considered
significant.
4.5 Results
4.5.1 Physiological variables
The weights of the rats in the two ischemic groups were not significantly different (329±7 vs.
320±10 g). Body temperature, mean arterial blood pressure, pH, PaCO2, and PaO2 were normal before ischemia and throughout the reperfusion period and were not significantly different between the two ischemic groups (Table 4.1).
4.5.2 MRI findings
In the two sham-operated rats, the PWI, DWI and T2WI data were normal in both hemispheres throughout the period of observation. In both 10-min and 30-min groups, perfusion
deficits demonstrated by PWI were seen in the right MCA territory during occlusion and
completely disappeared after reperfusion. Blood flow as reflected by CBFi in the ipsilateral
caudoputamen dropped to about 50% to 60% of the contralateral flow during occlusion (Fig.
4.1) but returned to control (specifically, equality with the contralateral side) upon reperfusion and remained normal thereafter. The drop in the CBFi ratio in the ischemic region during
occlusion was significant (p<0.01) when compared with that in the normal region. Although
it rose slightly upon reperfusion suggesting some increase in blood flow, the CBFi ratio in the
89
o
Temperature, C
MABP, mmHg
pH
PCO2, mmHg
PO2, mmHg
10-min group
37.0±0.0
37.0±0.1
37.2±0.3
96±13
105±17
107±13
7.36±0.03
7.35±0.03
7.37±0.04
40±5
36±6
41±6
90±7
85±5
87±7
Baseline
90 minutes
72 hours
Baseline
90 minutes
72 hours
Baseline
90 minutes
72 hours
Baseline
90 minutes
72 hours
Baseline
90 minutes
72 hours
30-min group
37.0±0.0
37.0±0.1
36.9±0.1
95±22
96±15
102±17
7.38±0.03
7.38±0.03
7.40±0.06
40±4
38±3
38±4
85±5
94±11
98±15
Table 4.1. Physiological Variables: MABP indicates mean arterial
blood pressure. Values are mean ± SD (n=7 per group). There was no
significant difference between two groups for all parameters.
frontoparietal cortex perfused by the anterior cerebral artery, the internal control region, was
approximately 1.0 during the entire experimental observation period (Fig. 4.1).
DWI hyperintensity was observed in the right MCA region during occlusion, mainly involving the lateral caudoputamen and overlying cortex (Fig. 4.2). In the 10-min group, DWI
abnormalities in all rats gradually disappeared between 30 to 60 minutes after reperfusion and
no rats developed secondary DWI abnormalities during the 72-hour observation period after
reperfusion (Fig. 4.2). In the 30-min group, DWI abnormalities gradually reverted to normal
between 60 to 90 minutes after reperfusion, while secondary DWI hyperintensities appeared
at the 12-hour observation point in all rats (Fig. 4.2). The temporal evolution of ADCav
changes in both groups is shown in Fig. 4.3. In the contralateral nonischemic hemisphere, the
ADCav values in both groups were in the normal range over time (62-65×10-5 mm2/s). In the
90
1.4
CBFi ratio
1.2
1.0
0.8
0.6
Ischemia-10 min
Ischemia-30 min
Normal-10 min
Normal-30 min
0.4
0.2
0.0
Preocc
Occ
Rep
0.5 h 1.0 h 1.5 h
12 h
24 h
48 h
72 h
Time points
Figure 4.1. Time course of the ipsilateral CBFi/contralateral CBFi (CBFi
ratio) in the 10-min and 30-min occlusion groups. Blood flow in the
lateral caudoputamen dropped during occlusion but fully recovered after
reperfusion and remained normal up to 72 hours thereafter in both
groups. Blood flow in ipsilateral normal cortex perfused by the anterior
cerebral artery territory was stable throughout reperfusion in both groups.
ipsilateral ischemic hemisphere, the ADCav values decreased significantly during occlusion
(p<0.001) as compared with those in the contralateral regions and fully recovered after reperfusion in both groups. The ADCav values remained normal thereafter in the 10-min group, but
secondarily declined at 12 hours after reperfusion in the 30-min group.
No abnormal signals on T2WI were seen in the 10-min group, while hyperintensity on
T2WI occurred in the 30-min group at the 12-hour observation point (Fig. 4.2). The changes
of T2 values over time are shown in Fig. 4.4. The T2 values were within the normal range in
both hemispheres in the 10-min group, but significantly increased (p<0.005) in the ipsilateral
caudoputamen at 12 hours after reperfusion in the 30-min group as compared with those of
the contralateral hemisphere, and peaked at 48 hours after reperfusion.
4.5.3 Histological outcomes
91
No histological abnormalities were demonstrated in the contralateral caudoputaminal regions
of the ischemic rats and in the two hemispheres of the sham rats. Individual or isolated necrotic neurons surrounded by a microgliosis (selective neuronal necrosis) was seen in the selected ROI of lateral caudoputamen of the seven rats undergoing 10 minutes of transient
MCA occlusion; the percentage of necrotic neurons in this ROI was 17±10% (4-28%). Widespread neuronal necrosis was seen in the selected ROI of lateral caudoputamen in four of the
seven rats undergoing 30 minutes of transient arterial occlusion and pannecrosis was found in
the remaining three. The percentage of necrotic neurons was 95±4% (88-100%) in the 30-min
group and was significantly higher than in the 10-min group (p<0.0001). Representative photomicrographs are shown in Fig. 4.5.
Occ
90 min
12 hr
24 hr
48 hr
72 hr
DWI
10 min
T2WI
DWI
30 min
T2WI
Figure 4.2. Representative diffusion-weighted images (DWI) and T2-weighted
images (T2WI) in both 10-min and 30-min occlusion groups at different time
points. DWI hyperintensity is seen during occlusion in the lateral caudoputamen
and overlying cortex and completely disappears 1.5 hours after reperfusion in both
groups. The DWI and T2WI were normal thereafter in the 10-min group, but
secondary DWI lesions (arrow), accompanied by hyperintensity on T2WI
(arrowhead), occurred in the 30-min group at 12 hours after reperfusion. Note the
secondary DWI lesions first developed in the caudoputamen and then gradually
spread to the cortex (Occ indicates during occlusion).
92
-5
2
ADCav (x10 mm /s)
80
70
60
50
Ischemia-10 min
Ischemia-30 min
Normal-10 min
Normal-30 min
40
30
20
Preocc
Occ
Rep
0.5 h
1.0 h
1.5 h
12 h
24 h
48 h
72 h
Time points
Figure 4.3. The time course of ADCav values in the ischemic and nonischemic
hemispheres following 10 and 30 minutes of transient middle cerebral artery occlusion. In the contralateral (normal) caudoputamen, the ADCav values were normal. In
the ipsilateral (ischemic) caudoputamen, however, the ADCav values decreased significantly (p<0.001) during occlusion, recovered completely at 60 minutes after
reperfusion in both groups, but declined secondarily in the 30-min group at 12 hrs after reperfusion. Pseudonormalization of the ADCav values started at 24 to 48 hrs.
T2 values (msec)
140
Ischemia-10 min
Ischemia-30 min
Normal-10 min
Normal-30 min
120
100
80
60
40
20
0
Preocc/Occ
Rep
0.5 h
1.0 h
1.5 h
12 h
24 h
48 h
72 h
Time points
Figure 4.4. The T2 changes over time in both normal and ischemic hemispheres. In
the 10-min occlusion group, T2 values were stable in both normal and ischemic hemisphere throughout the experiment, while in the 30-min group, T2 values in the
ischemic hemisphere were significantly elevated at 12 hrs and peaked at 48 hrs after
reperfusion.
93
Figure 4.5. Histological photomicrographs (H&E stain, original magnification 200×). A:
normal appearance of brain tissue; B: individual or isolated necrotic neurons showing
pyknosis of nuclei and eosinophilia of cytoplasm (arrows) are nearby normal neurons (N)
following 10 minutes of transient ischemia (from the same rat as in Fig. 4.2-10 min); C:
Most neurons undergo necrosis (arrows) following 30 minutes of transient ischemia (from
the same rat as in Fig. 4.2-30 min). Note one normal neuron exists in the lesion region;
and D: All neurons are necrotic (arrows), and only the inflammatory cells (arrowhead)
preserve normal stainability to hematoxylin following 30 minutes of transient ischemia.
94
4.6 Discussion
We have previously demonstrated that delayed neuronal damage develops in regions where
complete acute reversal of initially decreased ADC values occurs after short periods of focal
ischemia (8 to 30 minutes) (Li et al., 1999) and that acute normalization of ADC values induced by reperfusion is transient and secondary ADC declines occur later on after 30 minutes
of transient focal ischemia (Li et al., 2000). The present study extended our previous experiments (Li et al., 2000a; Li et al., 1999) by evaluating the longer time course of DWI lesions
after different short periods of ischemia and the histological status in the same regions. The
novel findings in this study are (1) the resolution of initial DWI lesions is permanent following 10 minutes of transient ischemia, while the resolution of initial DWI lesions is transient
following 30 minutes of transient ischemia, and secondary DWI lesions develops later on,
and (2) permanent reversibility of initial DWI lesions does not indicate a normal histological
outcome. Conversely, selective neuronal necrosis is seen in regions where the initial DWI
lesions disappear permanently after reperfusion.
4.6.1 Ischemic and post-ischemic changes on PWI and DWI
PWI has been widely used to demonstrate cerebral perfusion during and after ischemia (Baird
et al., 1998). The CBFi calculated from PWI data reflect relative CBF changes during ischemia and after reperfusion (Hamberg et al., 1993; Wittlich et al., 1995). However, it may not
be sensitive to quantitatively estimate CBF reductions during ischemia, as one study demonstrated (Wittlich et al., 1995). This observation was further confirmed by the present study,
since the CBFi ratio demonstrated only a 40-50% reduction, a value that is unlikely to induce
substantial ischemic injury. The normalization and maintenance of a normal CBF following
95
short periods of ischemia is in agreement with previous studies (Li et al., 2000; Li et al.,
1999; Dijkhuizen et al., 1998), suggesting that post-ischemic injury may not be due to secondary compromise of CBF.
DWI is able to detect ischemic changes within minutes after the onset of ischemia and
the hyperintense regions demonstrated by DWI eventually become infarcted without therapeutic intervention (Moseley et al., 1990a; Moseley et al., 1990b; Minematsu et al., 1992).
Evidence has shown that the ischemic hyperintensity is potentially reversible if reperfusion is
performed quickly after ischemia (Davis et al., 1994; Pierpaoli et al., 1996; Mintorovitch et
al., 1991; Minematsu et al., 1992). Studies with rat stroke models indicate the dependency of
this reversal on the duration of ischemia or, conversely, the time of reperfusion. Reperfusion
does not reduce the extent of initial DWI hyperintensity when it is performed two hours after
focal ischemia in rats (Minematsu et al., 1992; Müller et al., 1995), can partially reduce initial DWI lesions after 45 to 60 minutes of transient ischemia (Minematsu et al., 1992; Müller
et al., 1995; Hasegawa et al., 1994), and can fully revert the DWI lesions within 30 minutes
after the onset of ischemia (Mintorovitch et al., 1991; Li et al., 2000; Li et al., 1999). The
present study further demonstrates that the complete resolution of initial DWI lesions after
reperfusion may be transient or permanent, depending on the duration of ischemia, and secondary DWI lesions may develop thereafter, accompanied by T2 abnormalities (Fig. 4.2). Secondary DWI lesions have also been reported recently in a hypoxia-ischemia model
(Dijkhuizen et al., 1998). Such secondary changes on DWI were thought to be caused by a
delayed or secondary energy failure resulting from mitochondrial damage (Abe et al., 1995;
Siesjö and Kristián, 1999) since ADC reduction has been shown to be closely related to reduced energy metabolism (Busza et al., 1992; Benveniste et al., 1992; Mintorovitch et al.,
96
1994).
4.6.2 Tissue damage
In the ipsilateral lateral caudoputamen three days after 30 minutes of transient focal ischemia,
widespread neuronal necrosis was seen in four rats, and pannecrosis was found in the remaining three rats. Clearly, the secondary DWI lesions seen in this study are associated with severe brain tissue damage, and the short-term resolution of DWI lesions does not necessarily
indicate tissue salvage from ischemia. This argues for follow-up MRI measurements after
resolution of DWI lesions in stroke patient to more completely assess tissue damage.
After 10 minutes of transient focal ischemia, selective neuronal necrosis was consistently
observed in regions where blood flow, ADC and T2 remained normal throughout the reperfusion period. Accordingly, normal blood flow, ADC, and T2 detected by MRI following a brief
period of focal ischemia may be misleading and miss evolving tissue damage including neuronal death. To be more specific about the latter point, the degree of selective neuronal necrosis seen on day 3 ranged from 4% to 28% of the neurons in the lateral caudoputamen,
seemingly a level of tissue damage not severe enough to cause DWI and T2WI signal abnormalities. Obviously some subtle changes that are not detectable by current MRI measurements but lead to neuronal death are initiated after only a few minutes of markedly reduced
blood flow and quick reperfusion cannot stop or can not completely reverse such processes.
Selective neuronal necrosis following a short period of focal ischemia has been documented in a previous study (Garcia et al., 1997) and been referred to as “incomplete infarction” because glial cells, microvessels, and tissue architecture were preserved (Garcia et al.,
1997; Lassen et al., 1982; Garcia et al., 1996). Garcia and colleagues have demonstrated that
97
the number of necrotic neurons increases as the duration of ischemia is prolonged (Garcia et
al., 1995). Early reperfusion, thus seems to shift ischemic damage from pannecrosis to incomplete infarction.
It is possible that the difference in the ability of MRI to detect tissue damage is a matter
of extent of injury and not difference in the pathological processes between the 10-min and
30-min occlusion groups. The MRI data are gathered over a 2-mm-thick slice of brain tissue.
The amount of tissue injury engendered by 10 minutes of transient focal ischemia may be
small and be lost among the “normal” cells in that slice but become prominent enough to be
detectable by MRI after 30 minutes of reduced blood flow.
4.6.3 Detection of incomplete infarction by other imaging techniques
There are some imaging techniques that have potential to detect incomplete infarction. Investigations in baboons and cats in which benzodiazepine receptors were mapped by positron
emission tomography have shown that an increase in peripheral-type receptor activity and a
decrease in the central-type receptor activity suggest selective neuronal loss indirectly and
directly, respectively (Sette et al., 1993; Heiss et al., 1997). In a study of stroke patients, Nakagawara and his colleagues (1997) found a decrease in the central-type benzodiazepine receptor concentration in reperfused cortex that was structurally normal and suggested that
incomplete infarction can be detected by quantifying benzodiazepine receptor activity. Because of the relatively low resolution of positron emission tomography or single photon emission computed tomography and the low concentration of benzodiazepine receptors in the
caudoputamen, the use of these imaging modalities may be limited.
Recently, Fujioka and his colleagues demonstrated that incomplete infarction caused by a
98
short period of ischemia is detectable by conventional MRI after one week (Fujioka et al.,
1999a; Fujioka et al., 1999b). In patients with transient hemispheric ischemia caused by cardiogenic emboli (Fujioka et al., 1999a) and in rats undergoing 15 minutes of transient MCA
occlusion (Fujioka et al., 1999b), T1-weighted (T1WI) hyperintensity and T2WI hypointensity
were observed seven days after the onset of ischemia. Selective neuronal death and gliosis
with preservation of tissue structure (incomplete infarction) was seen in histological sections
of rat brain from the regions that showed this combination of delayed hyper- and hypointensity. Since delayed T1WI hyperintensity and T2WI hypointensity did not occur in the
ischemic regions where pannecrosis was seen (Fujioka et al., 1999b), such novel signal
changes on conventional MRI at delayed time points may prove to be important diagnostic
signs of incomplete infarction.
4.6.4 Clinical implications
The experimental findings in this study may provide clinicians with at least two pieces of important information. First, complete resolution of DWI lesions has recently been reported in
patients with transient ischemic attacks (Lecouvet et al., 1999; Kidwell et al., 1999), but the
resolution of DWI lesion in some patients may be transient as our study suggests. A series of
follow-up MRI measurements may, thus, be required to monitor the time course of ischemic
changes. Second, negative MRI (DWI and T2WI) after an ischemia episode may not indicate
normal tissue status, since the region with the permanent resolution of DWI ischemic lesions
may suffer from incomplete infarction as demonstrated by this study. This may help to explain neurological deficits in some patients who have normal DWI after cerebral ischemia
(Ay et al., 1999) and cognitive deficit in some patients who experience transient ischemic
99
attacks (Hénon et al., 1999).
In conclusion, the present study demonstrates that transient or permanent resolution of
initial lesions documented by DWI depends on the duration of ischemia and that normal MRI
(DWI and T2WI) following short periods of focal ischemia does not necessarily indicate full
tissue recovery from ischemic injury.
4.7 Acknowledgments
This study was supported in part by a Research Fellowship Award from the National Stroke
Association (F.L.) and by NIH/NIDS grants ROI-NS31631-05 (J.H.G.), and POI-NS23393
(J.D.F.). Additional funding provided by a US Department of Education GAANN Fellowship
(M.D.S.). Part of this study was performed during the tenure of an Established Investigatorship from the American Heart Association (C.H.S.).
100
Chapter 5
Secondary Decline in Apparent Diffusion Coefficient and Neurological
Outcomes After A Short Period of Focal Brain Ischemia in Rats
Fuhai Li, Matthew D. Silva, Kai-Feng Liu, Karl G. Helmer, Tsuyoshi Omae,
Joseph D. Fenstermacher, Christopher H. Sotak, Marc Fisher
From the Departments of Neurology (F.L., T.O., M.F.) and Radiology (C.H.S., M.F.), UMass
Memorial Health Care and University of Massachusetts Medical School, Worcester, MA;
Departments of Biomedical Engineering (M.D.S., K.G.H., C.H.S.) and Chemistry &
Biochemistry (C.H.S.), Worcester Polytechnic Institute, Worcester, MA; Departments of
Pathology (Neuropathology) (K-F.L.) and Anesthesiology (J.D.F.), Henry Ford Hospital,
Detroit, MI; USA.
Published in Annals Neurology, 2000 Aug; 48(2): 236–244
5.1 Preface
Ischemic lesions seen on diffuison-weighted imaging (DWI) are reversible if reperfusion is
performed within minutes after the onset of ischemia. This study was designed to characterize the initial and secondary changes of the apparent diffusion coefficient (ADC) of water
with high temporal-resolution measurements of ADC values and to correlate ADC changes
with functional outcomes. My contributions to this work were collection of the NMR data, C
and IDL programming for image reconstruction and analysis, and participation in the writing
of the manuscript.
101
5.2 Abstract
This study was designed to characterize the initial and secondary changes of the apparent diffusion coefficient (ADC) of water with high temporal-resolution measurements of ADC values and to correlate ADC changes with functional outcomes. Fourteen rats underwent 30
minutes of temporary middle cerebral artery occlusion (MCAO). Diffusion-, perfusion-, and
T2-weighted images were performed during MCAO and every 30 minutes for a total of 12
hours after reperfusion (n=6). Neurological outcomes were evaluated during MCAO, every
30 minutes for a total of 6 hours, and at 24 hours after reperfusion (n=8). The decreased cerebral blood flow during MCAO returned to normal after reperfusion and remained unchanged
thereafter. The decreased ADC values during occlusion completely recovered at 1 hour after
reperfusion. The renormalized ADC values started to decrease secondarily at 2.5 hours, accompanied by a delayed increase in T2 values. The ADC-defined secondary lesion grew over
time and was 52% of the ADC-defined initial lesion at 12 hours. Histological evaluation
demonstrated neuronal damage in the regions of secondary ADC decline. Complete resolution of neurological deficits was seen in one rat at 1 hour, 6 rats between 2.5 and 6 hours after
reperfusion, and no secondary neurological deficits were observed at 24 hours. These data
suggest that (1) a secondary ADC reduction occurs as early as 2.5 hours after reperfusion,
evolves in a slow fashion, and is associated with neuronal injury; and (2) renormalization and
secondary decline in ADC are not associated with neurological recovery and worsening, respectively.
102
5.3 Introduction
A reduction of the apparent diffusion coefficient (ADC) of water in ischemic brain can be
detected by diffusion-weighted magnetic resonance imaging (DWI) early after the onset of
ischemia (Moseley et al., 1990a; Moseley et al., 1990b; Minematsu et al., 1992) and is presumably related to water shifts from the extracellular to the intracellular space (cytotoxic
edema) because of ATP pump failure (Buzsa et al., 1992; Benveniste et al., 1992). It was
demonstrated that an initially decreased ADC could revert to normal, if interrupted cerebral
blood flow is restored quickly after the onset of ischemia (Mintorovitch et al., 1991; Minematsu et al., 1992; Davis et al., 1994; Li et al., 1999). Recent studies further showed that renormalization of ADC values after reperfusion might be transient and a secondary decline in
ADC values could be detected when DWI was repeated at 12 hours following 30 minutes of
transient focal ischemia (Li et al., 2000a) or at 24 hours following 20 minutes of unilateral
hypoxia-ischemia (Dijkhuizen et al., 1998). However, it is not known when the secondary
ADC reduction starts and how the ADC-defined secondary lesion evolves. Furthermore, it
has not been determined if acute renormalization of ADC values after reperfusion is accompanied by recovery of functional deficits occurring during ischemia and if secondary ADC
decline is associated with secondary neurological deficits.
The objectives of the present study were to characterize the temporal and spatial evolution of secondary ADC decline by means of high temporal-resolution measurements of ADC
values after 30 minutes of transient middle cerebral artery occlusion (MCAO), and to determine whether the temporal profile of neurological function is reflected by ADC changes.
103
5.4 Materials and Methods
5.4.1 Surgical preparation and focal brain ischemia
All procedures used in this study were approved by our institutional Animal Research Committee and were conducted in accordance with the United States Public Health Service’s Policy on Human Care and Use of Laboratory Animals. Fourteen male Sprague-Dawley rats
weighing 300 to 350 g were anesthetized with 2.5% isoflurane delivered in air at 1.0 L/min.
PE-50 polyethylene tubing was inserted into the left femoral artery for continuous monitoring
of mean arterial blood pressure throughout the study and for obtaining blood samples to
measure pH, PaCO2, and PaO2. Another PE-50 polyethylene tubing was inserted into the left
femoral vein for injection of gadopentetate dimeglumine for perfusion-weighted imaging
(PWI). During the surgical procedure, rectal temperature was maintained at 37oC with a
thermostatically-controlled heating lamp.
Focal brain ischemia was induced with the intraluminal suture MCAO method as initially described by Koizumi et al. (1986). Briefly, the proximal portions of the right common
carotid artery and external carotid artery were ligated with 5-0 surgical sutures. A 4-0 monofilament nylon suture, its tip rounded by flame and coated by silicone, was inserted through
an arteriotomy of the right common carotid artery below the carotid bifurcation and advanced
into the internal carotid artery until a mild resistance was felt, indicating that the occluder had
entered the anterior cerebral artery and thus blocked the blood flow to the middle cerebral
artery. Thirty minutes after MCAO, the rats were reperfused by withdrawing the occluder under anesthesia with 1-2% isoflurane delivered in air at 1.0 L/min.
104
5.4.2 MRI measurements
Animals (n=6) were fixed to a head holder with a tooth-bar and ear-bars and quickly placed
into the MRI magnet bore after MCAO. Inside the magnet, anesthesia was maintained with
1.0% isoflurane delivered in air at 1.0 L/min. Rectal temperature was maintained at 37oC by
means of a thermostatically-regulated heated-air flow system.
The MRI studies were performed using a GE CSI-II 2.0T/45 cm imaging spectrometer
(GE NMR Instruments, Fremont, CA) operating at 85.56 MHz for 1H and equipped with ±20
G/cm self-shielding gradients. Half-sine-shaped diffusion-sensitive gradient pulses were applied along each of the three orthogonal gradient axes (x, y, or z). Eight contiguous, coronal,
2-mm-thick slices, were acquired with diffusion-weighted spin-echo echo-planar imaging
(EPI) (Turner and Le Bihan, 1990). The imaging offset in the coronal plane was adjusted
such that the second slice started from the frontal pole of the brain. For each slice, nine bvalues, ranging from 18 to 1552 s/mm2, were used to measure the ADC of water along each
of the three diffusion-gradient directions. The MRI parameters are: field of view (FOV) =
25.6×25.6 mm2, pixel resolution=64×64, repetition time (TR) = 5 s, echo time (TE) = 74 ms,
EPI data acquisition time = 65 ms, number of excitations (NEX) = 2, diffusion-sensitivegradient pulse width= 7 ms, and diffusion-sensitive-gradient separation time = 35 ms. Using
a linear least-squares regression, the natural logarithm of the signal intensity was fitted to the
b-values, where the slope of the fitted line is proportional to the ADC. The trace ADC map
was calculated by averaging the three orthogonal ADC values on a pixel-by-pixel basis (van
Gelderen et al., 1994).
T2-weighted EPI was employed to perform dynamic contrast-enhanced PWI for demonstrating arterial occlusion and reperfusion (Wendland et al., 1991). Four contiguous, coronal,
105
2-mm-thick slices, which corresponded to the center four diffusion slices, were acquired with
FOV = 25.6×25.6 mm2 and pixel resolution = 64×64. A total of 40 spin-echo EPIs (TR = 900
ms, TE = 74 ms, EPI data acquisition time = 65 ms, NEX = 1) was obtained for each slice. A
bolus injection of 0.25 ml of gadopentetate dimeglumine was administered following acquisition of the 15th image. The CBF index (CBFi) was calculated from the PWI data to reflect
successful occlusion and reperfusion as described by Hamberg and colleagues (Hamberg et
al., 1993).
A multislice, double spin-echo EPI pulse sequence that contains a Hahn spin-echo preparation pulse sequence followed by a spin-echo echo-planar acquisition sequence was used to
acquire T2-weighted imaging (T2WI). Eight contiguous, coronal, 2-mm-thick slices, which
corresponded to the eight DWI slices, were acquired with a FOV = 25.6×25.6 mm2, pixel
resolution = 64×64, TR = 5 s, TE1 (first echo) = 20-110 ms, TE2 (second echo) = 74 ms, and
NEX = 4. T2 maps were constructed from nine T2-weighted EPIs. Using a linear least-squares
regression, the natural logarithm of the signal intensity was fitted to the TE values, where the
slope of the fitted line is inversely proportional to the T2 value.
DWI, T2WI and PWI were acquired during occlusion (just before reperfusion), immediately after reperfusion, and then every half an hour (T2WI and DWI) or every two hours
(PWI) for a total of 12 hours after reperfusion. The effect of repeated injection of contrast
agent on T2 is likely minimal, because contrast agent washes out within seconds after a bolus
injection (Rosen et al., 1990; Warach et al., 1992; Tzika et al., 1993; Moseley et al., 1991).
106
5.4.3 Region-of-interest analysis and in vivo lesion size calculation
Two regions of interest (ROI), 4×4 pixels each in size, one in the lateral caudoputamen labeled (+) and the other in the frontoparietal cortex labeled (-) at the level of the optic chiasm
(slice 4), were chosen to measure ADC, CBFi, and T2 values on the corresponding maps.
These three parameters were also measured in the homologous regions of the contralateral
hemisphere. CBFi was also measured in the frontoparietal cortex perfused by the anterior
cerebral artery (assumed to be normal) in both hemispheres. A CBFi ratio was calculated by
dividing the ipsilateral CBFi by the contralateral CBFi. The ADC and T2 values in the contralateral hemisphere and CBFi ratio in the normal territory of the anterior cerebral artery were
used as controls.
In vivo lesion size was calculated by tracing the boundary of visual abnormalities on the
ADC maps using a NIH image program (NIH IMAGE 1.55, National Institutes of Health,
Bethesda, MD). The lesion volume was calculated by multiplying the total lesion area from
the center four slices by the slice thickness. The ischemic lesion volume at each time point
was normalized by the initial ischemic lesion volume acquired during occlusion and expressed as a percentage of the initial lesion volume.
5.4.4 Evaluation of neurological outcomes
In order to investigate if changes in ADC values are associated with changes in neurological
function, rats (n=8) were subjected to 30 minutes of transient MCAO and were neurologically evaluated by an investigator (T.O.) who was blinded to the experimental protocol (i.e.,
duration of ischemia, MCAO time, and reperfusion time). Animals were allowed to recover
from anesthesia and neurological evaluation was performed during MCAO (20-25 minutes
107
after MCAO), every half an hour for a total of 6 hours, and at 24 hours after reperfusion with
the use of following scoring scale (Longa et al., 1989): 0, full extension of both forepaws; 1,
failure to extend the left forepaw or abduction of the left forepaw; 2, circling to left side; 3,
falling to left side; and 4, without spontaneous walk.
5.4.5 Evaluation of tissue injury
Hematoxylin-eosin (H&E) staining was used to determine whether a secondary ADC decline
was associated with tissue damage. After the MRI protocol was completed, the rats were immediately subjected to cardiac perfusion-fixation with 200 ml of phosphate buffered 4%
paraformaldehyde (Garcia et al., 1997), and the heads were fixed overnight in the same paraformaldehyde solution. Each brain was cut into seven 2-mm-thick coronal slices starting from
the frontal pole of the brain, and labeled A (frontal) through G (occipital). One section (6 µm
in thickness) obtained from slice C at the level of the optic chiasm that precisely matched
slice 4 of the ADC maps, was stained with H&E and used for histological evaluation. A coregistration method was used to localize the same ROIs on the histology section as labeled
(+) and (–) on the ADC maps using a previously described method (Li et al., 1999). A global
Lab image analysis system (Data Translation Incorporated, Marlboro, MA) was used for
quantitation by collecting images through a Sony video camera interfaced with an Olympus
microscope system. Under a light microscope at ×600 magnification, 5 non-overlapping
fields in each selected ROI were examined, and following four-point histological score was
used to semiquantitatively evaluate the astrocytic swelling, neuronal shrinkage and necrosis,
and sponginess of neuropil by one investigator (K-F. L.) who was blinded to the MRI data:
108
1. Swollen astrocyte: 0, normal; 1, <2 swollen astrocytes per field; 2, 2-5 swollen astrocytes
per field; and 3, >5 swollen astrocytes per field.
2. Shrunken or necrotic (red) neurons: 0, normal; 1, <10% per field; 2, 10-50% per field;
and 3, >50% per field. The shrunken and necrotic neurons were identified as previously
described (Garcia et al., 1999).
3. Spongy neuropil: 0, normal; 1, focal sponginess; 2, moderately diffuse sponginess; and 3,
severely diffuse sponginess.
TTC staining was used to determine tissue injury in the eight animals undergoing the neurological function assessment. The rats were reanesthetized with intraperitoneal injection of
chloral hydrate (400mg/kg) and decapitated. The brains were removed, cut into six coronal,
2-mm-thick slices and stained with a 2% of TTC solution at 37oC for 30 minutes (Bederson
et al., 1986). The brain slices were then photographed using a couple-charged device camera.
Using an image analysis program (Bio Scan OPTIMAS, Edmonds, WA), the direct volumes
of the injured region were calculated for each of the center four brain slices (Li et al., 1997).
5.4.6 Statistical analysis
Data are presented as mean ± standard error of mean (SEM). The parametric variables were
analyzed by using one-way analysis of variance (ANOVA), two-way repeated ANOVA, an
unpaired or paired t-test. Wilcoxon signed rank test was used to compare nonparametric variables such as neurological score and histology score. A two-tailed value of p<0.05 was considered significant.
109
5.5 Results
The physiological variables such as body temperature, mean arterial blood pressure, pH,
PaCO2 and PaO2 were within the normal range throughout the experiment and did not differ
at the different time points (Table 5.1).
Variables
Temperature (oC)
MABP (mmHg)
pH
PCO2 (mmHg)
PO2 (mmHg)
Baseline
37.0±0.03
99±6
7.34±0.01
40±1
86±3
0.5 hr
37.0±0.03
99±7
7.33±0.01
37±2
88±5
6 hr
37.0±0.03
111±10
7.35±0.01
41±1
92±4
10 hr
36.9±0.06
107±7
7.36±0.01
39±1
87±2
Table 5.1. Physiological Variables: Data are expressed as mean±SE
(n=6). There is no significant difference at different time points for each
parameter (p>0.19, one-way analysis of variance). MABP = mean arterial blood pressure.
5.5.1 MRI study
Perfusion deficits documented by PWI were seen in the right middle cerebral artery territory
during occlusion and disappeared in all animals after reperfusion. The CBF values represented by the CBFi ratio between the ischemic and normal hemispheres in both the lateral
caudoputamen and frontoparietal cortex reverted to normal after reperfusion and remained
unchanged during the 12-hour reperfusion period.
Figure 5.1 shows the ADC changes over time. Overall analysis shows that ADC values
were significantly different between the ipsilateral and contralateral homologous ROIs
(p<0.0001, two-way repeated ANOVA). In the contralateral non-ischemic hemisphere, the
ADC values in both the caudoputamen and cortex were normal throughout the observation
period, and no difference was seen between the caudoputamen and cortex at each time point
(p>0.18, unpaired t-test). In the ipsilateral ischemic hemisphere, however, the ADC values in
110
the two ROIs decreased significantly during occlusion (p<0.0001, unpaired t-test) as compared with those in the contralateral homologous regions. The decreased ADC values recovered fully at 60 minutes after reperfusion (p>0.11, unpaired t-test). The renormalized ADC
values started to decrease secondarily at 2.5 hours after reperfusion, and a significant reduction occurred in the lateral caudoputamen at 3 hours (p<0.007, unpaired t-test) and in the
frontoparietal cortex at 4 hours (p<0.02, unpaired t-test) when compared with values in con-
70
ADC (x10-5mm2/s)
65
60
55
50
45
Caudo-ischemia
Cortex-ischemia
Caudo-normal
Cortex-normal
40
OccRep 0.5 1 1.5 2 2.5 3 3.5 4 4.5 5 5.5 6 6.5 7 7.5 8 8.5 9 9.5 10 10.5 11 11.5 12
Time points (hours)
Figure 5.1. Changes of apparent diffusion coefficient (ADC) values
over time in the ischemic and non-ischemic hemispheres following
30 minutes of transient middle cerebral artery occlusion
(mean±SEM, n=6). In the lateral caudoputamen and frontoparietal
cortex of the non-ischemic hemisphere, the ADC values were
constant. However, in both caudoputamen and cortex of the ischemic
hemisphere, the ADC values decreased significantly (p<0.001,
unpaired t-test) during occlusion, recovered completely at 60 minutes
after reperfusion, and started to decrease secondarily at 2.5 hours
after reperfusion. Significant secondary reduction in ADC values
occurred in the lateral caudoputamen at 3 hours (p<0.007, unpaired ttest) and in the frontoparietal cortex at 4 hours after reperfusion
(p<0.02, unpaired t-test).
111
tralateral homologous regions. At 12 hours, the secondarily decreased ADC values were almost the same as the initially reduced ADC values during occlusion in both the lateral caudoputamen (46.3±0.7×10⁻⁵mm2/s vs 44.9±0.9×10⁻⁵mm2/s, p=0.31, paired t-test) and the frontoparietal cortex (51.9±1.9×10⁻⁵mm2/s vs 47.0±2.5×10⁻⁵mm2/s, p=0.17, paired t-test). However, the secondary ADC reduction was more severe in the lateral caudoputamen than in the
frontoparietal cortex at 12 hours after reperfusion (46.3±0.7×10⁻⁵mm2/s vs 51.9±1.9×10⁻⁵
mm2/s, p=0.034, unpaired t-test).
The temporal evolution of T2 values is shown in Fig. 5.2. The T2 values in the contralateral non-ischemic hemisphere remained constant over time. A significant increase in T2 val-
95
90
85
T2 (ms)
80
75
70
65
60
55
50
Caudo-ischemia
Cortex-ischemia
Caudo-normal
Cortex-normal
45
OccRep 0.5 1 1.5 2 2.5 3 3.5 4 4.5 5 5.5 6 6.5 7 7.5 8 8.5 9 9.5 10 10.5 11 11.5 12
Time points (hours)
Figure 5.2. The T2 changes over time in both the normal and
ischemic hemispheres (mean±SEM, n=6). In the normal hemisphere,
the T2 values were stable throughout the experiment. In the ischemic
hemisphere, the T2 values significantly increased in the lateral
caudoputamen at 4 hours (p=0.044, unpaired t-test) and in the
frontoparietal cortex at 5 hours (p=0.017, unpaired t-test) after
reperfusion.
112
ues was detected in the lateral caudoputamen at 4 hours (p=0.044, unpaired t-test) and in the
frontoparietal cortex at 5 hours (p=0.017, unpaired t-test) as compared with contralateral homologous regions.
The volume of the ADC-defined initial lesion was 139±24 mm3 during occlusion. The
ADC-defined secondary lesion was first seen in the lateral caudoputamen at 2.5 hours after
A
B
Occ
Rep
0.5
1.0
1.5
2.0
2.5
3.0
3.5
4.0
4.5
5.0
5.5
6.0
6.5
7.0
7.5
8.0
8.5
9.0
9.5
10.0
10.5
11.0
11.5
12.0
255
0
(×10-5 mm2/s)
Figure 5.3. Representative apparent diffusion coefficient (ADC) maps and the photomicrograph
from the same rat undergoing 30 minutes of transient focal ischemia. A: ADC maps show that the
ADC-defined initial lesion occurred in both the
caudoputamen and overlying frontoparietal cortex
during occlusion and disappeared completely at 1
hour after reperfusion. The ADC-defined secondary lesion developed first in the lateral caudoputamen at 2.5 hours after reperfusion (arrowheads),
then gradually grew, and spread to the frontoparietal cortex. B: A photomicrograph shows astrocytic
swelling (a), neuronal shrinkage and necrosis (arrow), and neuropil sponginess (*) in the caudoputamen at 12 hours after reperfusion.
113
reperfusion, gradually grew over time, and then spread to the frontoparietal cortex (Fig.
5.3A). The volume of the ADC-defined secondary lesion was 69±12 mm3 at 12 hours after
reperfusion. The growth rate (volume divided by time elapsed) of the ADC-defined secondary lesion was significantly smaller than that of the ADC-defined initial lesion (0.12±0.02
mm3/min vs 4.62±0.79 mm3/min, p<0.0002, paired t-test). Figure 5.4 shows the temporal
evolution of the normalized ischemic lesion. The ADC-defined secondary lesion at 12 hours
after reperfusion was 52±7 % of the ADC-defined initial lesion occurring during occlusion.
Normalized lesion volume (%)
100
80
60
40
20
0
OccRep 0.5 1 1.5 2 2.5 3 3.5 4 4.5 5 5.5 6 6.5 7 7.5 8 8.5 9 9.5 10 10.5 11 11.5 12
Time points (hour)
Figure 5.4. Temporal evolution of lesion volume determined by
visual abnormalities on apparent diffusion coefficient (ADC) maps is
shown (mean±SEM, n=6). The ADC-defined initial lesion decreased
to almost zero at 60 minutes after reperfusion. The ADC-defined
secondary lesion grew in a slow fashion and reached 52% of the
ADC-defined initial lesion at 12 hours after reperfusion. The lesion
volume at each time point is normalized by intra-ischemic lesion
volume.
114
5.5.2 Neurological function
After discontinuation of isoflurane, the rats fully recovered from anesthesia over 5 to 10 minutes. All rats presented appropriate paresis of the left forepaw during MCAO. A significant
improvement of neurological score was seen at 60 minutes after reperfusion when compared
with the neurological score during occlusion (0.9±0.4 vs 1.6±0.2, p<0.004). One of the eight
rats completely recovered from the left forepaw paresis at 1 hour after reperfusion, and six
rats recovered from the paresis between 2.5 to 6 hours after reperfusion. No secondary neurological deficits were found in these seven rats at the 24-hour examination time point. The remaining one rat did not recover from the initial neurological deficit during the 24-hour reperfusion period.
5.5.3 Histological outcomes
All rats undergoing the MRI study showed varying degrees of astrocytic swelling, neuronal
shrinkage and necrosis, and neuropil sponginess in both the lateral caudoputamen and the
frontoparietal cortex (Fig. 5.3B). The neuronal necrosis was more severe in the caudoputamen than in the cortex (Fig. 5.5, p<0.03). The astrocytic swelling, neuronal shrinkage, and
neuropil sponginess tended to be milder in the cortex than in the caudoputamen although not
different statistically (Fig. 5.5).
For rats undergoing neurological evaluation, ischemic injury demonstrated as pink regions on TTC staining was seen in the lateral caudoputamen of all eight rats and in the overlying frontoparietal cortex of four rats. The lesion volume was 77±11 mm3.
115
3.5
Figure 5.5. Histology scores for
astrocytic swelling, neuronal
shrinkage and necrosis, and neuropil sponginess in both the lateral
caudoputamen (black) and the
frontoparietal cortex (white) at 12
hours after 30 minutes of transient
focal ischemia (mean±SD, n=6).
The neuronal necrosis is more severe in the caudoputamen than in
the cortex (*p<0.03, Wilcoxon
signed rank test).
Histology Score
3
2.5
2
1.5
1
0.5
0
Astrocytic
swelling
Neuronal
shrinkage
Neuronal
necrosis
Neuropil
sponginess
5.6 Discussion
The novel findings in the present study are (1) ADC-defined secondary lesions occur as early
as 2.5 hours after reperfusion and evolve in a slow fashion, and (2) ADC changes are not
concordant with functional outcomes after a short period of focal ischemia. Like other anesthetics, isoflurane was shown to have neuroprotective effects (Kirsch and Traystman, 1998).
However, whether and how the prolonged use of isoflurane in this study affects the ADC
changes and histopathological outcomes is not known.
5.6.1 ADC changes over time
Although the precise mechanisms of the ADC decline are not fully understood, studies have
shown that a decrease in ADC values is coincident with the development of cytotoxic edema
caused by ischemia (Busza et al., 1992; Benveniste et al., 1992; Mintorovitch et al., 1994) or
by non-ischemic events such as inhibiting ATPase (Benveniste et al., 1992), injection of excitotoxic neurotransmitter (Benveniste et al., 1992; Verheul et al., 1993), hyponatremia
116
(Sevick et al., 1992), and hypoglycemia (Hasegawa et al., 1996). ADC declines may also be
related to a reduction of intracellular water movement (Wick et al., 1995; Dijkhuizen et al.,
1999), and/or extracellular water movement (Duong et al., 1998). The cellular edema after
focal ischemia is due to energy failure, and thus the ADC decline after ischemia may indirectly reflect energy failure (Busza et al., 1992; Back et al., 1994). It is believed that the energy failure occurring during ischemia is caused by an insufficient supply of oxygen and
glucose.
Decreased ADC values can recover to normal if reperfusion occurs within 30 minutes
after ischemia (Mintorovitch et al., 1991; Minematsu et al., 1992; Davis et al., 1994; Li et
al., 1999; Li et al., 2000a). In this study, complete renormalization of ADC values occurred
at 1 hour after reperfusion, and was then maintained for 1.5–2 hours. The renormalization of
ADC values after reperfusion likely indicates restoration of energy metabolism. This
hypothesis can be supported by several observations. First, complete recovery of energy
metabolism is possible since mitochondrial function is still normal after 30 minutes of
transient ischemia (Schutz et al., 1973; Rehncrona et al., 1979). Second, studies have shown
that Na+-K+ ATPase is reactivated after reperfusion and disturbance of water and ion
homeostasis is subsequently restored (Hossmann et al., 1977; Eleff et al., 1991). Third, one
study (Hossmann et al., 1994) demonstrated that animals with renormalized ADC values
after reperfusion had complete recovery of ATP production, while animals without recovery
of ADC values exhibited depletion of ATP. It can therefore be presumed that acute ADC
renormalization after reperfusion suggests resolution of cellular swelling and restoration of
the shrunken extracellular space. However, further studies will be needed to confirm this
assumption.
117
Acute renormalization of ADC values induced by reperfusion may be transient, and a
secondary ADC drop may develop later on. Zarow et al. (1995) observed that the decreased
signal intensity ratio after reperfusion could increase again at 24 hours. Studies showed that
secondary ADC decline was detected at 24 hours following 20 minutes of unilateral cerebral
hypoxia ischemia (Dijkhuizen et al., 1998) or following 30 to 45 minutes of focal ischemia
induced by clipping the middle cerebral artery (van Lookeren Campagne et al., 1999). We
recently demonstrated that a secondary ADC decline occurs in all rats at 12 hours after 30
minutes of transient MCAO induced by the intraluminal suture method (Li et al., 2000a). The
present study further confirms that a secondary ADC reduction following 30 minutes of focal
ischemia induced by the intraluminal suture method can be seen as early as 2.5 hours after
reperfusion, accompanied by a delayed T2 elevation. The occurrence of a secondary ADC reduction was shown to be related to the duration of ischemia in rat (van Lookeren Campagne
et al., 1999; Li et al., 2000b) and was also documented recently in stroke patients (Kidwell et
al., 2000). However, the time course of ADC changes may be different in different species.
The secondary ADC decline likely indicates secondary energy failure. Using phosphorus
magnetic resonance spectroscopy, Lorek et al. (1994) and Blumberg et al. (1997) demonstrated secondary energy failure after recovery of energy metabolism in transient hypoxiaischemia models. Furthermore, the secondary energy failure was accompanied by a secondary
ADC decline (Thornton et al., 1998). It seems that the mechanism of secondary energy failure is different from that of initial energy failure during ischemia because cerebral blood flow
demonstrated by perfusion imaging remained normal after reperfusion, and the arterial blood
pressure and arterial oxygen tension were also within the normal range. Although we did not
measure blood glucose levels, it is not likely that glucose significantly decreased after reper-
118
fusion in this study as blood glucose did not change in previous studies where the same
stroke model was used (Memezawa et al., 1992; Tsuchidate et al., 1997). Studies have shown
that secondary energy failure may result from delayed mitochondrial dysfunction (Abe et al.,
1995; Kuroda et al., 1996; Siesjö et al., 1999). Possible factors that trigger mitochondrial
dysfunction include calcium overload, free radical formation, and lactic acidosis (Fiskum et
al., 1999; Murphy et al., 1999).
In this study, the secondary ADC reduction was first seen in the caudoputamen and then
spread to the cortex. Compared with the initial ADC decline during occlusion, this secondary
ADC decline occurred in a much slower fashion both temporally and spatially. For example,
it took about 10 hours for the magnitude of the ADC values during the secondary ADC decline to reach almost the same values as occurred initially (Fig. 5.1), and the extent of secondary ADC decline that developed in 10 hours was just half of that occurred initially over 30
minutes (Fig. 5.4). In addition, our study also showed that the more severe the secondary
ADC decline, the more severe the neuronal injury, indicating that ADC-defined secondary
lesions are likely in vivo signs representing post-ischemic secondary injury. Therefore, preventing secondary ADC decline could be an effective therapeutic approach to reduce neuronal injury, which may be achieved by improving mitochondrial metabolism (Fiskum et al.,
1999). The slow evolution of the secondary ADC decline may provide clinicians with more
opportunity to treat such post-ischemic secondary lesions.
5.6.2 Recovery of neurological deficits
Only one of the eight rats had complete resolution of the neurological deficits between 1 to 2
hours after reperfusion during which time complete renormalization of previously decreased
119
ADC values was seen, indicating that renormalization of ADC values does not necessarily
correlate with full recovery of neuronal function. Furthermore, six rats had complete resolution of their neurological deficits between 2.5 to 6 hours after reperfusion when secondary
decline in ADC values was ongoing as demonstrated by MRI. This implies that the secondary
ADC decline does not exacerbate neurological function. Complete resolution of the neurological deficits was also reported in previous studies after 30 minutes of transient focal
ischemia (Nakano et al., 1990; Garcia et al., 1995). It is not clear why the neurological deficits improved or resolved at the time when secondary injury, demonstrated by secondary
ADC reduction, was worsening. Possible explanations for this discrepancy are gradual hyperactivation of remaining intact neurons in the ischemic region or functional substitution by
other neurons in the neighboring normal brain regions as demonstrated by functional MRI in
stroke patients (Cramer et al., 1997; Cramer et al., 2000). Our results, along with others (Nakano et al., 1990; Garcia et al., 1995; Persson et al., 1989), also show that all rats that experienced complete resolution of their neurological deficits had some degree of neuronal injury.
This suggests that patients with prolonged transient ischemic attacks (TIA) may have neuronal injury, as was recently documented by DWI (Kidwell et al., 1999), which may underlie
the pathogenesis of gradual cognitive deficits that occurred after TIA, although the patients
recovered from their neurological deficits after TIA (Hénon et al., 1999).
5.7 Acknowledgements
This study was supported in part by a Research Fellowship Award from the National Stroke
Association (F.L.) and a USDE GAANN Fellowship (M.D.S.) and was performed during the
tenure of an Established Investigatorship from the American Heart Association (C.H.S.).
120
Chapter 6
Comparison of the Temporal and Spatial Evolution of the Water Apparent
Diffusion Coefficient and T2 Following Transient Middle Cerebral Artery
Occlusion in Rats
Matthew D. Silva, Fuhai Li, Karl G. Helmer, Marc Fisher, Christopher H. Sotak
From the Departments of Neurology (F.L., M.F.) and Radiology (C.H.S., M.F.), UMass
Memorial Health Care and University of Massachusetts Medical School, Worcester, MA;
Departments of Biomedical Engineering (M.D.S., K.G.H., C.H.S.) and Chemistry &
Biochemistry (C.H.S.), Worcester Polytechnic Institute, Worcester, MA
6.1 Preface
Ischemic lesions as seen on diffusion–weighted imaging (DWI) are reversible if reperfusion
is performed within minutes after the onset of ischemia. This study was designed to characterize the initial and secondary changes of the apparent diffusion coefficient (ADC) of water
and T2 with high temporal–resolution measurements and to correlate ADC and T2 changes at
different experimental time points to assess the predictability of acute data on chronic outcomes. My contributions to this work were collection of the NMR data, C and IDL programming for image reconstruction, additional IDL programming for image analysis and statistical
evaluation, and principle authorship of the manuscript.
121
6.2 Abstract
Acute changes in the water diffusion properties within ischemic brain can be visualized using
diffusion-weighted magnetic resonance imaging (DWI). It has been shown in temporary, focal ischemia models that the DWI hyperintensity can be resolved if reperfusion is performed
soon after the onset of the stroke. Complete reperfusion after 30 minutes of occlusion results
in a renormalization of the apparent diffusion coefficient (ADC) values by 1–2 hours after
reperfusion, however, this effect may not be permanent. Shortly following the ADC renormalization, a secondary reduction in the ADC values occurs that is not associated with a reduction in tissue perfusion. The temporal and spatial evolution of ADC and T2 values in a 30minute, transient MCAO rat stroke model was studiedwith the goal of assessing the reliability
of ADC and T2 to predict secondary tissue changes following reperfusion was addressed.
ADC and T2 data acquired at 26 time points over a 12-hour period was used to generate composite maps of the tissue characteristics. Statistical analysis was performed to determine if the
changes in tissue ADC and T2 values were predictive of the tissue condition at 12 hours. In
general, regions with early secondary ADC decline experience an increase in T2 before 12
hours. In contrast, regions exhibiting a late secondary ADC change did not have an increase
in T2. Secondary ADC characteristics were subdivided into three groups: no secondary ADC
decline, secondary ADC decline before 5 hours after reperfusion, and secondary ADC decline
at 10 or more hours after reperfusion. The groups were compared to determine if their acute
ADC values were predictive of their secondary ADC behavior. It was concluded that no statistical measure could be found to accurately predict the tissue characteristics at 12 hours;
and, further, the data suggests that acute ADC and T2 data may be limited for the prediction
of infarction.
122
6.3 Introduction
Acute changes in perfusion associated with ischemic stroke illicit a cascade of cellular events
that result in changes in the water diffusion properties within the diseased regions that can be
visualized using magnetic resonance imaging (MRI). The decline in the apparent diffusion
coefficient (ADC) of water in ischemic cerebral tissue results in a significant hyperintensity
on diffusion–weighted images (DWI), making DWI techniques an important research and
clinical tool for the detection of stroke (Moseley et al., 1990; Mintorovich et al., 1991; Benveniste et al., 1992; Minematsu et al., 1992; van Gelderen et al., 1994; Warach et al., 1996).
Although the pathophysiology of stroke is largely known, the driving mechanism(s) causing
the ADC decline are still under investigation. Despite the controversies regarding these
mechanisms, the temporal and spatial changes of the water ADC values in ischemic tissue
have been described in detail. In fact, studies have delineated two main regions of ischemic
tissue: the core region representing severely compromised tissue and the penumbra, which
surrounds the core and may represent potentially salvageable tissue (Memezawa et al., 1992).
It is commonly hypothesized that tissues with only moderately reduced ADC values may represent regions with a moderate amount of blood flow that may sustain the tissue for longer
than the severely compromised tissues (Warach et al., 1996); however, this conclusion has
not been unambiguously validated.
In early experiments, animals (typically rats or cats) were subjected to permanent occlusion to induce stroke. Moseley et al. (1990) demonstrated that the DWI contrast occurred almost immediately after occlusion and ultimately matched the area of infarct as compared to
post-mortem histological staining. In rats, the most common stroke model is the permanent
middle cerebral artery occlusion (MCAO) model induced via the introduction of an intralu123
minal suture (occluder) into the cerebral vasculature (Koizumi et al., 1986). In this model, the
hyperintense region on a DWI acquired approximately 2–3 hours after the initiation of the
occlusion is highly correlated with the histologically-defined region of infarct. It also has
been shown in temporary MCAO models that the DWI hyperintensity can be resolved if
reperfusion is performed soon after the onset of the stroke (Mintorovitch et al., 1991; Minematsu et al., 1992; Davis et al., 1994; Li et al., 1999). Li et al. (2000b) reported from transient MCAO experiments that if complete reperfusion is performed 10 minutes after the initial stroke, the ADC values completely renormalize and the tissue is saved from infarction (as
confirmed by post-mortem histological analysis). Interestingly, if reperfusion is performed 30
minutes after occlusion, the renormalization of the ADC values, which was observed by 1–2
hours after reperfusion, was not permanent (van Bruggen et al., 1998; Li et al., 2000a; Li et
al., 2000b; Li et al., 2000c). Shortly following the ADC renormalization, a gradual, secondary reduction in the ADC values, that is not associated with a reduction in tissue perfusion,
occurs (i.e., following reperfusion, the blood flow to the tissue is normal and remains normal). With the secondary ADC decline the hyperintensity on the DWIs returns, and the tissues progress towards infarction.
The ability to correlate ischemic ADC values (and other MR parameters) with the probability that a region (or pixel) will go to infarction may have major clinical significance. Specifically, if the noninvasive evaluation of pathophysiology by MRI can lead to reliable predictors of disease progression, MRI could potentially be used to dictate treatment approaches. In
fact, several groups have attempted to evaluate the use of DWI [in some case combined with
perfusion–weighted imaging (PWI)] to identify potentially salvageable tissues in cases of rat
(Hasegawa et al., 1994; Mancuso et al., 1995; Mancuso et al., 1997; van Dorsten et al.,
124
2002), pig (Sakoh et al., 2001), and human stroke (Oppenheim et al., 2000; Baird et al.,
2001; Desmond et al., 2001). In this paper, we will further the study of the temporal and spatial evolution of ADC and T2 in a 30-minute, transient MCAO rat stroke model and address
the reliability of ADC and T2 to predict secondary tissue changes following reperfusion. ADC
and T2 data acquired at 26 time points over a 12-hour period were used to generate composite
maps of the tissue characteristics. Lastly, statistical analysis was performed to determine if
the changes in tissue ADC and T2 values are predictive of the tissue condition at the end of
the experiment.
6.4 Methods
6.4.1 Transient Middle Cerebral Artery Occlusion
All procedures used in this study were approved by our institutional Animal Research Committee and were conducted in accordance with the United States Public Health Service’s Policy on Human Care and Use of Laboratory Animals. Fourteen male Sprague–Dawley rats
weighing 300 to 350 g were anesthetized with 2.5% isoflurane delivered in air at 1.0 L/min.
PE–50 polyethylene tubing was inserted into the left femoral artery for continuous monitoring of mean arterial blood pressure throughout the study and for obtaining blood samples to
measure pH, PaCO2, and PaO2. Another PE-50 polyethylene tubing was inserted into the left
femoral vein for injection of gadopentetate dimeglumine for perfusion–weighted imaging
(PWI). During the surgical procedure, rectal temperature was maintained at 37oC with a thermostatically–controlled heating lamp.
Focal brain ischemia was induced with the intraluminal suture MCAO method as initially described by Koizumi et al. (1986). Briefly, the proximal portions of the right common
125
carotid artery and external carotid artery were ligated with 5-0 surgical sutures. A 4-0 monofilament nylon suture, its tip thermally-rounded and silicone-coated, was inserted through an
arteriotomy of the right common carotid artery below the carotid bifurcation and advanced
into the internal carotid artery until a mild resistance was felt. The resistance indicated that
the occluder had entered the anterior cerebral artery and thus blocked the blood flow to the
middle cerebral artery. Thirty minutes after MCAO, the rats were reperfused in the magnet by
withdrawing the occluder.
6.4.2 MRI Methods
Immediately following surgery, the animals were secured in a head holder with tooth– and
ear–bar restraints and placed into the magnet. Inside the magnet, anesthesia was maintained
with 1.0% isoflurane delivered in air at 1.0 L/min. Rectal temperature was maintained at
37oC by means of a thermostatically-regulated heated-air flow system.
The MRI studies were performed using a GE CSI–II 2.0T/45 cm imaging spectrometer
(GE NMR Instruments, Fremont, CA) operating at 85.56 MHz for 1H and equipped with ±20
G/cm self-shielding gradients. Half-sine-shaped diffusion-sensitive gradient pulses were applied along each of the three orthogonal gradient axes (x, y, or z). Eight contiguous, coronal,
2-mm-thick slices, were acquired with diffusion-weighted, spin-echo echo-planar imaging
(EPI). The imaging offset in the coronal plane was adjusted such that the second slice started
from the frontal pole of the brain. For each slice, nine b-values, ranging from 18 to 1552
s/mm2, were used to measure the ADC of water along each of the three diffusion-gradient
directions. The MRI parameters were: field of view (FOV) = 25.6 mm × 25.6 mm, pixel resolution = 64 × 64, repetition time (TR) = 5 s, echo time (TE) = 74 ms, EPI data acquisition
126
time = 65 ms, number of excitations (NEX) = 2, diffusion-sensitive-gradient pulse width (δ)
= 7 ms, and diffusion-sensitive-gradient separation time (∆) = 35 ms. Using a linear leastsquares regression, the natural logarithm of the signal intensity was fitted to the b-values,
where the slope of the fitted line is proportional to the ADC. The trace ADC map was calculated by averaging the three orthogonal ADC values on a pixel-by-pixel basis.
A multislice, double spin-echo EPI pulse sequence that contained a spin-echo preparation pulse sequence for T2-weighting followed by a spin-echo echo-planar acquisition sequence was used for T2-weighted imaging (T2WI). Eight contiguous, coronal, 2-mm-thick
slices, which corresponded to the positions of the eight DWI slices, were acquired with a
FOV = 25.6 mm × 25.6 mm, pixel resolution = 64 × 64, TR = 5 s, TE1 (first echo) = 20−110
ms, TE2 (second echo) = 74 ms, and NEX = 4. T2 maps were constructed from nine T2weighted EPIs. Using a linear least-squares regression, the natural logarithm of the signal intensity was fitted to the TE values, where the slope of the line is inversely proportional to the
T2 value.
T2-weighted EPI was employed to perform dynamic contrast-enhanced PWI for demonstrating arterial occlusion and reperfusion. Four contiguous, coronal, 2-mm-thick slices,
which corresponded to the positions of the center four DWI slices, were acquired with FOV =
25.6 mm × 25.6 mm and pixel resolution = 64 × 64. A total of 40 spin–echo EPIs (TR = 900
ms, TE = 74 ms, EPI data acquisition time = 65 ms, NEX = 1) was obtained for each slice. A
bolus injection of 0.25 ml of gadopentetate dimeglumine (Gd-DTPA2-) was administered following acquisition of the 15th image. The CBF index (CBFi) was calculated from the PWI
data to reflect successful occlusion and reperfusion as described by Hamberg and colleagues
(1993). Seven male Sprague-Dawley rats were subjected to 30 minutes of transient MCAO as
127
described above. DWI, T2WI, and PWI were acquired during occlusion (just before reperfusion), immediately after reperfusion, and then every half hour (T2WI and DWI) or every two
hours (PWI) for a total of 12 hours after reperfusion. The effect of repeated injection of contrast agent on T2 is likely minimal, because the contrast agent washes out within seconds after
injection (Rosen et al., 1990; Warach et al., 1992; Tzika et al., 1993; Moseley et al., 1991).
6.4.3 Data Analysis
The time course of ADC, perfusion, and T2 changes in the MCA region following 30 minutes
of transient occlusion has been detailed by Li et al. (2000a, 2000b, 2000c). From the seven
animals observed in this study, the ischemic lesion as defined by ADC maps was visible before reperfusion and was renormalized by 1.5 hours after occlusion (1 hour after reperfusion).
Because ADC values change over the temporal evolution of an ischemic lesion in the acute
phase, there is no absolute or percent-change threshold that defines the ischemic territory and
also corresponds to the region of infarct on TTC histology at 24 hours. In this paper, abnormality on the ADC maps acquired during the occlusion period was defined empirically as a
15% reduction in a pixel ADC value in the ischemic region as compared to the spatially corresponding contralateral, normal pixel. The 15% threshold was chosen because it is sufficiently strict to avoid the normal fluctuations (ca 3% for these methods) and sensitive enough
to detect primary ADC declines and secondary changes in the ADC. Secondary changes on
the ADC and T2 maps were defined on a pixel–by–pixel basis to determine the time point at
which the pixel value changed by 15% relative to the contralateral pixel. For this analysis,
PWI was only used to confirm occlusion and subsequent reperfusion.
128
Each pixel that was initially defined as abnormal (i.e., exhibited a 15% ADC decline)
was examined at all time points following ADC renormalization for the time point at which
the ADC value secondarily declined by 15% and the T2 increased by 15%. The time point
corresponding to the 15% change was noted, and the pixel was classified into one of three
groups: (i) no secondary ADC decline and no T2 increase (–SADC/–T2); (ii) secondary ADC
decline and no T2 increase (+SADC/–T2); (iii) secondary ADC decline and T2 increase
(+SADC/+T2). (In no case was it observed that the T2 increased without a secondary ADC
decline.) From these data, two descriptive maps were generated. The first is a map of the secondary ADC and T2 characteristics at 12 hours. Specifically, the map delineates cerebral spinal fluid (CSF) regions, normal tissue, and abnormal tissues subdivided into –SADC/–T2,
+SADC/–T2, and +SADC/+T2 regions. The second map is a time-to-secondary-ADC map,
where the value of a pixel is equal to the time point at which the ADC declined below the
15% threshold.
Statistical analysis was performed on the data to determine if the ADC characteristics
during the acute ischemic phase were predictive of the secondary ADC characteristics. Specifically, pixels exhibiting no secondary ADC decline (–SADC) were compared to pixels experiencing secondary ADC decline. Further, the secondary ADC group was further subdivided into pixels experiencing the secondary change before 5 hours post reperfusion
[+SADC(<5hr)] or after 10 hours post reperfusion [+SADC(>10hr)]. The following questions
were addressed based on t-test statistical analysis: 1) Does the absolute change in the ADC
value during the initial ischemic period, relative to the contralateral normal ADC value, predict if the pixel will have a secondary decline in ADC? 2) Does the percent change (relative
to normal) in ADC value during ischemia predict the secondary changes? 3) Is there a statis-
129
tical difference in the absolute or percent change (relative to normal) in ADC values of
ischemic pixels as compared to pixels that exhibit a secondary reduction in ADC before 5
hours and pixels that decline later than 10 hours after occlusion? 4) Is there a statistically significant difference in the absolute or percent change (relative to normal) in ADC values during the acute ischemic period between pixels that demonstrate a secondary decline in ADC
from pixels that do not have a secondary decline in ADC?
6.5 Results
During MCAO as demonstrated by Li et al. (2000c), the water ADC values within the MCA
territory declined appreciably; however, following complete reperfusion, the ADC values
within this same region renormalize. After several hours, the ADC values begin to exhibit
secondary decline. This decrease, however, is not in response to a perfusion deficit. The occlusion and reperfusion was verified using PWI (results not shown). During occlusion the
hyperintensity on the PWIs matched the region of abnormality on the DWIs. Following reperfusion, there was no detectable region of low perfusion (i.e., normal perfusion was re–
established in all brain areas). There was no significant heterogeneity on the PWIs that compelled further analysis of this data.
The characteristics of each pixel at 12 hours are shown in Fig. 6.1. The orange regions
correspond to normal brain tissue and the yellow to CSF spaces. The inner purple region corresponds to pixels that were initially defined as abnormal during the acute phase and then exhibited a secondary 15% change in ADC and T2 values by the 12 hour time point
(+SADC/+T2). The mid region of blue pixels define the region initially abnormal that experience a secondary 15% decline in their ADC values and no 15% increase in T2 by 12 hours
130
(+SADC/–T2). The outer green pixels correspond to the pixels that do not have a secondary
change in ADC or in T2 by 12 hours (–SADC/–T2). Every pixel initially defined as abnormal
during the acute ischemic phase was included in this analysis, therefore, the total area defined
by the purple (+SADC/+T2), blue (+SADC/–T2), and green (–SADC/–T2) pixels equals the
size of the initial acute abnormality.
The time-to-secondary-ADC map is shown in Fig. 6.2. The value of each pixel corresponds to the time point at which the ADC pixel-value declined below the 15% ADC threshold. As in Fig. 6.1, the orange and yellow pixels in Fig. 6.2 correspond to normal tissue and
CSF regions, respectively. Pixels assigned to the +SADC/+T2 and +SADC/–T2 groups (purple and blue, respectively, in Fig. 6.1) have values in Fig. 6.2 equal to the time point of secondary ADC decline mapped to an arbitrary color scale with earlier time points shown as
dark colors (blues). The inset of Fig. 6.2 shows a magnified region of the subcortical tissues
central to the initial insult (also where the secondary ADC declines first appear); however,
the magnification was also chosen to show both +SADC/+T2 and +SADC/–T2 groups.
Figures 6.3–6.5 plot the temporal evolution of pixels initially defined as abnormal during
the acute phase based on their ADC characteristic at 12 hours: no secondary ADC decline
(–SADC); secondary ADC decline before 5 hours [+SADC(<5hr)]; secondary ADC decline
after 10 hours [+SADC(>10hr)]. In Fig. 6.3, the mean and standard deviation (σ) of the absolute ADC values over the time course of the experiment are shown. In Fig. 6.4, the mean and
σ of the percent-of-normal ADC value relative to the contralateral normal value over the time
course of the experiment are shown. In Fig. 6.5, the mean and σ of the percent ADC change
relative to the average renormalized ADC value over the time course of the experiment are
shown. Statistical analysis was performed on the data groups using two-tailed t-test (p < 0.05
131
for significance). There was no statistically significant change in T2 values during the
ischemic period. The Table lists the mean and standard deviation (σ) of the different pixel
groups, highlighting the important data shown in Figs. 6.3–6.5, where the superscript letters
indicate significant differences (described in the Table caption).
Figure 6.1. ADC and T2 characteristics in a representative slice at 12
hours. Orange = normal tissue; Yellow = CSF; Purple = +SADC/+T2;
Blue = +SADC/–T2; Green = –SADC/–T2.
9.0
7.0
7.5
5.5
5.5
8.5
9.0
6.5
5.0
5.5
5.5
5.5
11.0
7.5
5.0
5.0
5.5
4.5
7.0
8.0
10.5
8.0
6.5
4.5
5.5
7.0
7.0
11.0
8.0
7.0
7.0
7.0
8.0
9.0
8.0
8.0
9.0
8.0
8.5
11.0
11.0 10.5 10.0
10.5
Figure 6.2. Time–to–secondary ADC map (left) and an expansion of a region
of the map. Pixel values equal the time point at which the ADC value
secondarily declined by 15% relative to its contralateral, homologous pixel.
132
0.85
ADC [x10-3 mm2/s]
0.8
0.75
0.7
0.65
0.6
0.55
0.5
SADC < 5 hours
0.45
SADC > 10 hours
0.4
No SADC
0.35
O R
1
2
3
4
5
6
7
8
9
10
11
12
Time after reperfusion [hours]
Figure 6.3. The mean and σ of the absolute ADC values over the
time course of the experiment. (O = occlusion, R = reperfusion)
1.1
% of Normal ADC
1
0.9
0.8
0.7
SADC < 5 hours
SADC > 10 hours
0.6
No SADC
0.5
O R
1
2
3
4
5
6
7
8
9
10
11
Time after reperfusion [hours]
Figure 6.4. The mean and σ of the percent-of-normal ADC value
relative to the contralateral (normal) value over the time course of
the experiment. (O = occlusion, R = reperfusion)
133
12
% Change in ADC relative to
renormalization time point
0.1
0.05
0
-0.05
-0.1
-0.15
-0.2
-0.25
SADC < 5 hours
-0.3
SADC > 10 hours
-0.35
No SADC
-0.4
O R
1
2
3
4
5
6
7
8
9
10
11
12
Time after reperfusion [hours]
Figure 6.5. The mean and σ of the percent ADC change relative to
the average renormalized ADC time point over the time course of the
experiment (1 hour after reperfusion, indicated by the star). (O =
occlusion, R = reperfusion)
Time point
Pixel Group
–SADC
Normal ADC
+SADC(<5hr)
+SADC(>10hr)
–SADC
MCAO ADC
+SADC(<5hr)
+SADC(>10hr)
–SADC
Renormalization
+SADC(<5hr)
ADC
+SADC(>10hr)
Absolute ADC
% Normal ADC
70 ± 4a
65 ± 3a
67 ± 6
49 ± 4a
52 ± 5a,c
49 ± 4c
70 ± 6
68 ± 5
69 ± 6
—
—
—
70 ± 7a,b
81 ± 7a,c
74 ± 6b,c
100 ± 7a
105 ± 9a
102 ± 6
% Decline from
Renormalized ADC
—
—
—
-29 ± 5a
-23 ± 7a,c
-28 ± 7c
—
—
—
Table 6.1. Highlights features of Figs. 6.3–6.5. The normal (contralateral), MCAO, and renormalized ADC values are shown in absolute (×10-3 mm2/s), percent of normal, and percent declined from the
renormalized ADC units. The ‘—‘ indicates incomparable parameters. Statistically significance (2-tailed t-test, p < 0.05) between the
groups is indicated by the superscript letters, where a compares –
SADC to +SADC(<5hr), b compares –SADC to +SADC(>10hr), and
c
compares +SADC(<5hr) to +SADC(>10hr).
134
6.6 Discussion
Transient MCAO was performed in a rat stroke model to study the temporal and spatial
evolution of secondary lesion development. In this study, the ADC decline during the occlusion is resolved by 1 hour after complete reperfusion. After 6 hours, a secondary ADC decline is noted in the regions of the initial ischemic insult, and the secondary lesion development is more pronounced by 12 hours. Although no T2 changes are apparent during the acute
ischemic phase, increases in the T2 values begin 5–6 hours after reperfusion in the tissue regions that experience a secondary decline in the ADC value. In Fig. 6.1, it can be seen that at
12 hours the region once defined as lesion during the ischemic phase can be characterized in
three ways in terms of ADC and T2 values. First, there is a region in the subcortical space that
experiences a secondary decrease in ADC values and an increase in T2 values by 12 hours
(+SADC/+T2, purple in Fig. 6.1). Second, an intermediate region exhibited a secondary ADC
decline but no change in T2 by 12 hours (+SADC/–T2, blue in Fig. 6.1). Third, a cortical region of pixels experienced no ADC decrease or T2 increase by 12 hours despite being classified as abnormal during the acute ischemic phase (–SADC/–T2, green in Fig. 6.1). Each pixel
exhibiting a secondary ADC change was classified by the time point at which the change became significant (15% decline from normal). In Fig. 6.2, each pixel classified as +SADC
(purple and blue in Fig. 6.1) has the value of the time point at which the significant change
was established. In the figure insert, a magnification of map demonstrates that a central region of secondary ADC decline time points (e.g., 4–6 hours after reperfusion) are surrounded
by regions that experienced a secondary ADC decline at later time points (e.g., 9–11 hours
after reperfusion).
135
Figures 6.1 and 6.2 serve to describe the spatial evolution of ADC and T2 changes following transient cerebral ischemia with respect to time. This data is most efficiently examined with the temporal profile of the ADC changes, which are plotted in Figs. 6.3–6.5. These
plots illustrate that there is a significant ADC decline during ischemia, a renormalization of
ADC values following reperfusion, and a dispersion of secondary characteristics, which Figs.
6.1 and 6.2 suggest is somehow related to the spatial location of the initial lesion in the rat
brain. Specifically, in the subcortical regions—the core of the MCAO lesion—there is a relatively rapid secondary development of the lesion. In tissues of the cortical rat brain, the occurrence of secondary ADC changes at 12 hours are less prominent. Between these two regions, the secondary ADC decline is delayed (relative to the central region). Using statistical
analysis, the significant differences between the three groups were examined, and are summarized in the Table. Interestingly, the regions not experiencing a secondary ADC decline by 12
hours after reperfusion (–SADC) exhibited a greater absolute and percent decline during
ischemia than the regions experiencing secondary ADC decline before 5 hours after reperfusion [+SADC(<5hr)]. This finding is thought to be due to the intrinsic heterogeneity of ADC
values in the rat brain, which is illustrated in Fig. 6.6.
In the normal hemisphere (Fig. 6.6, left), the water ADC values range from 0.61 – 0.75 ×
10-3 mm2/s, and different regions of the rat brain possess different ADC values with small
deviation within each region. In contrast, although there is a significant decline in ADC values in all regions of the brain (Fig. 6.6, right), there is less heterogeneity as compared to the
normal hemisphere. Interestingly, the absolute and percent change in the water ADC value of
the subcortical region (-0.13 × 10⁻³ mm2/s and -21%) is substantially less than the change in
the cortical region (-0.22 × 10⁻³ mm2/s and -31%) after 30 minutes of MCAO. (It is important
136
to note that the regions selected in Fig. 6.6 do not correspond to regions of secondary ADC
decline or T2 increase; they were chosen arbitrarily and serve to highlight regional ADC differences.) Given that the regions exhibiting secondary ADC changes following transient occlusion typically reside in the subcortical regions, the data presented herein suggests that regions of the rat brain with the larger change in ADC value are less likely to experience a secondary decline in ADC value by 12 hours post reperfusion, which is entirely contrary to intuition. In fact, there was no combination of ADC and T2 data that could serve as a predictor of
secondary lesion development.
Previous attempts to describe the value of diffusion characteristics during acute cerebral
0.53±0.05
0.66±0.01
0.61±0.01
0.48±0.01
0.70±0.02
0.48±0.02
0.49±0.02
0.75±0.01
Normal Hemisphere
Abnormal Hemisphere
Figure 6.6 ADC mean and σ values (× 10-3 mm2/s) in selected
regions (indicated by the boxes) in normal and ischemic hemispheres
of the rat brain following 30 minutes of MCAO.
137
ischemia to predict regions of reversible and irreversible injury have resulted in somewhat
mixed results. Hasegawa et al. (1994) reported that regions of mild ADC reduction during
ischemia (pre-reperfusion) exhibited no infarct as defined by post mortem histology 70% of
the time. Mancuso et al. (1995) evaluated transient ischemia of 30 or 90 minutes in a rat
model and reported that regions of significantly reduced ADC values (85% of normal) at 30
and 90 minutes represented 53% and 74% of tissues at risk for infarction, respectively. In
1997, Mancuso and his colleagues report results that support the findings herein. Specifically,
significant variability was noted in rats subjected to 30 minutes of transient occlusion. Further, regions of substantially reduced ADC values (up to 45%) often fully recovered (as determined by histology performed at 72 hours), whereas regions defined as normal during the
ischemic episode exhibited infarct post mortem. Mancuso et al. (1997) also reported that the
regions of the caudate-putamen often exhibited significant ADC changes as well as infarct.
This finding, complemented by the data provided in this study, could suggest that different
brain tissue respond differently to ischemia and reperfusion. In a more recent study, van Dorsten et al. (2000) probed the prognostic value of ADC in combination with T2 and perfusion
in 60 and 90 minute transient ischemia in rats. Specifically, these authors were interested in
determining if acute MR parameter values could predict tissue recovery following reperfusion as opposed to predicting secondary lesion development, which was our focus. In our
study, all regions of the brain exhibited renormalization of the ADC values following reperfusion after 30 minutes of occlusion; however, van Dorsten et al. report that there was only
limited recovery following 60 and 90 minutes of occlusion. These authors suggest that the
probability of recovery trends with the severity of the ADC decline, i.e., lower ischemic ADC
values indicate tissue with less likelihood of recovery following reperfusion. Considering that
138
we report ADC changes consistent with the values reported by van Dorsten et al., it seems
more likely that the probability of tissue recovery following reperfusion depends more on the
duration of the ischemic insult rather than the ADC value. Regardless, the results presented
herein coincide with the conclusions of these previous studies to confirm that the use of acute
ADC values to predict chronic tissue state is limited.
In conclusion, ADC data (and hence DWI) is reliable for the detection of cerebral ischemia; however, the classification of potentially salvageable tissues may be beyond the reach of
this parameter alone. More appropriately, analyses may be short-sighted without acknowledgement of the intrinsic heterogeneity of water ADC values in the rat brain. The fact that the
ADC values converge to similar values during occlusion despite significant spatial differences in normal brain (Fig. 6.6) suggests that these tissue may respond somewhat differently
to the ischemic insult. Further, it could be speculated that different regions of the rat brain
may react differently to reperfusion. For instance, studies have demonstrated the potential
neuroprotective effect of transient occlusion (David et al., 1996), and it could be possible that
different brain regions utilize this benefit differently. Significant future research is required to
demonstrate if the intrinsic ADC heterogeneity of normal rat brain tissue is functionally significant and if these characteristics could improve the use of water ADC analysis of cerebral
ischemia to predict potentially salvageable tissues.
139
Chapter 7
Acute post-ischemic renormalization of the apparent diffusion
coefficient of water is not associated with reversal of astrocytic
swelling and neuronal shrinkage
Fuhai Li, Kai-Feng Liu, Matthew D. Silva, Xiangjun Meng, Tibo Gerriets,
Karl G. Helmer, Joseph D. Fenstermacher, Christopher H. Sotak, Marc Fisher
From the Departments of Neurology (F.L., X.M., T.G., M.F.) and Radiology (C.H.S., M.F.),
UMass Memorial Health Care and University of Massachusetts Medical School, Worcester,
MA; Departments of Biomedical Engineering (M.D.S., K.G.H., C.H.S.) and Chemistry &
Biochemistry (C.H.S.), Worcester Polytechnic Institute, Worcester, MA; and Departments of
Pathology (Neuropathology) (K-F.L.) and Anesthesiology (J.D.F.), Henry Ford Hospital,
Detroit, MI, USA.
Published in Amer. J. Neurorad. (AJNR), 2001, in press.
7.1 Preface
Initially decreased apparent diffusion coefficient (ADC) values are reversible if reperfusion is
rapidly performed following focal brain ischemia. This study was designed to determine if
reperfusion-induced renormalization of initially abnormal values indicates reversal of cellular, morphological changes that occur during acute ischemia. My contributions to this work
were collection of the NMR data, C and IDL programming for image reconstruction and
analysis, and participation in the writing of the manuscript.
140
7.2 Abstract
Background and purpose: Initially decreased apparent diffusion coefficient (ADC) values are
reversible if reperfusion is rapidly performed following focal brain ischemia. This study was
designed to determine if reperfusion-induced renormalization of initially abnormal values
indicates reversal of cellular, morphological changes that occur during acute ischemia.
Methods: Sprague-Dawley rats underwent 30 minutes of middle cerebral artery occlusion
without reperfusion (group A, n=6), with 1.5 hours of reperfusion (group B, n=6), or with 12
hours of reperfusion (group C, n=6). Diffusion- and perfusion-weighted images were
obtained at the end of occlusion, 1.5 hours and 12 hours after reperfusion. Immediately after
the final MRI study, the brains were fixed by cardiac perfusion with 4% paraformaldehyde.
Neuronal injury was evaluated on hematoxylin-eosin stained sections, and astrocytic size was
determined by the area of glial fibrillary acidic protein (GFAP) plus S-100 expression.
Results: In group A where ADC values decreased significantly, 47% (±12%) of the neurons
were slightly shrunken; astrocytes were moderately swollen, and the area expressing
GFAP+S100 was larger than that in the contralateral hemisphere (117±6 µm2 vs 89±2 µm2;
p<0.001). In group B where ADC had renormalized, most neurons were moderately
shrunken, and the frequency of such neurons was greater in group B (92%±2%) than in group
A (p<0.001); astrocytes were markedly swollen, and the area was larger than that in the
contralateral hemisphere (123±8 vs 85±4 µm2, p<0.001). In group C where a secondary ADC
decline occurred, most neurons (94±3%) were severely shrunken, and some had eosinophilic
cytoplasm; astrocytes were disintegrated, and the area of GFAP plus S-100 expression was
reduced (78±4 vs 90±5 µm2, p<0.01). Conclusion: Reperfusion-induced acute re-
141
normalization of ADC values is not associated with the reversal of neuronal shrinkage and
astrocytic swelling that occur during ischemia. Conversely, the morphological changes of
astrocytes and neurons progressively worsened over time, although ADC values showed a
biphasic change.
7.3 Introduction
Although diffusion-weighted magnetic resonance imaging (DWI) has been used increasingly
in delineating ischemic stroke, the mechanisms of decrease in the apparent diffusion coefficient (ADC) of water that is used to generate contrast on DWI are not well understood. Previous evidence suggested that ADC declines are likely related to cellular swelling that is
caused by shifts of water from the extracellular space to the intracellular space where water
movement is more restricted (Moseley et al., 1990a; Moseley et al., 1990b; Busza et al.,
1992; Benveniste et al., 1992; Sevick et al., 1992). Recent experimental studies demonstrated
that initially reduced ADC values that occur during ischemia can renormalize with rapid restoration of cerebral blood flow (Mintorovitch et al., 1991; Minematsu et al., 1992; Davis et
al., 1994; Li et al., 1999) and that such renormalized ADC values can secondarily decrease
(Dijkhuizen et al., 1998; van Lookeren Campagne et al., 1999; Li et al., 2000a; Li et al.,
2000b; Li et al., 2000c; Neumann-Haefelin et al., 2000; Olah et al., 2000). However, it has
not been determined whether changes of ADC values (i.e., initial decline, renormalization
and secondary decline) are associated with corresponding changes in cellular morphology
(such as cellular swelling) after a short period of focal brain ischemia.
The purposes of the present study were to determine (1) if the initial ADC declines following focal cerebral ischemia are accompanied by perturbations and abnormalities in cellu142
lar morphology; (2) if acute renormalization of ADC values induced by early reperfusion indicates resolution of cellular perturbations and abnormalities that arose during ischemia; and
(3) if similar values of ADC during the initial and secondary decline reflect similar histopathological abnormalities. To achieve these goals, DWI was performed in animals undergoing
30 minutes of middle cerebral artery occlusion (MCAO) with immediate sacrifice and tissue
fixation, 30 minutes of transient MCAO followed by 90 minutes of reperfusion and immediate fixation, and 30 minutes of transient MCAO followed by 12 hours of reperfusion and
brain fixation (n=6 per group). With the fixed tissue sections, neuronal injury was determined
by hematoxylin-eosin (H&E) staining and changes of astrocytic expression of glial fibrillary
acidic protein (GFAP) plus S-100 nuclear protein were assessed by immunohistochemistry.
To gain further insight into the degree of injury, the ultrastructural changes of representative
astrocytes and neurons were investigated by electron microscopy (EM). Subsequently, the
changes of ADC values in each group were correlated with these indices of neuronal and astrocytic injury.
7.4 Methods
7.4.1 Animal preparation and induction of focal brain ischemia
All experimental procedures were approved by our institutional Animal Research Committee.
Eighteen male Sprague-Dawley rats weighing 300 to 350 g were anesthetized with 2.0%
isoflurane delivered in air at 1.0 L/min. PE-50 polyethylene tubing was inserted into the left
femoral artery for continuous monitoring of mean arterial blood pressure throughout the
study and for obtaining blood samples to measure pH, PaCO2, and PaO2. Another piece of
PE-50 polyethylene tubing was inserted into the left femoral vein for injection of gadopen143
tetate dimeglumine for perfusion-weighted imaging (PWI). During the surgical procedure,
temperature was continuously monitored with a rectal probe and maintained at 37oC with a
thermostatically-controlled heating lamp.
Focal brain ischemia was induced with the intraluminal suture MCAO method as initially described by Koizumi et al. (1986). Briefly, the right common carotid artery, internal
carotid artery, and external carotid artery were exposed through a midline incision of the
neck. The proximal portions of the right common carotid artery and external carotid artery
were ligated with 5-0 surgical sutures. A 4-0 monofilament nylon suture, its tip rounded by
flame and coated by silicone, was inserted through an arteriotomy of the right common carotid artery 3 mm below the carotid bifurcation and advanced into the internal carotid artery
until a mild resistance was felt, indicating that the occluder had entered the anterior cerebral
artery and thus blocked the blood flow to the middle cerebral artery.
Animals were subjected to 30 minutes of MCAO with immediate sacrifice (group A,
n=6), 30 minutes of transient MCAO followed by 90 minutes of reperfusion (group B, n=6),
and 30 minutes of transient MCAO followed by 12 hours of reperfusion (group C, n=6). The
rats in the group B and group C were reperfused in the MRI magnet bore by withdrawing the
occluder.
7.4.2 MRI measurements
Animals were fixed to a head holder with a tooth-bar and ear-bars and quickly placed into the
MRI magnet bore after MCAO. Inside the magnet, anesthesia was maintained with 1.0%
isoflurane delivered in air at 1.0 L/min. Body temperature was maintained at 37oC by means
of a thermostatically-regulated heated-air flow system.
144
The MRI studies were performed in a GE CSI-II 2.0T/45 cm imaging spectrometer (GE
NMR Instruments, Fremont, CA) operating at 85.56 MHz for 1H and equipped with ±20
G/cm self-shielding gradients. Half-sine-shaped diffusion-sensitive gradient pulses were applied along each of the three orthogonal gradient axes (x, y, and z). Eight contiguous, coronal,
2-mm-thick slices were acquired with diffusion-weighted spin-echo echo-planar imaging
(EPI) (Turner and Le Bihan, 1990), and nine b-values, ranging from 18 to 1552 s/mm2, were
used to measure the ADC of water along each of the three diffusion-gradient directions for
each slice. The imaging offset in the coronal plane was adjusted such that the second slice
started from the frontal pole of the brain. The MRI parameters were: a field-of-view (FOV) =
25.6mm × 25.6mm, pixel resolution=64 × 64, repetition time (TR) = 5 s, echo time (TE) = 74
ms, EPI data acquisition time = 65 ms, number of excitations (NEX) = 2, diffusionsensitizing-gradient pulse width (δ) = 7 ms, and diffusion-sensitizing-gradient separation
time (∆) = 35 ms. The natural logarithm of the signal intensity was plotted versus b-value,
and the slope of the resulting line was extracted to yield ADC by using linear least-squares
regression. The ADC map was calculated by averaging the three orthogonal ADC values on a
pixel-by-pixel basis (van Gelderen et al., 1994).
T2-weighted spin-echo EPI was employed to perform dynamic contrast-enhanced PWI
for demonstrating arterial occlusion and reperfusion (Wendland et al., 1991). Four contiguous, coronal, 2-mm-thick slices, which corresponded to the center four diffusion slices, were
acquired with FOV = 25.6 mm × 25.6 mm and pixel resolution = 64 × 64. A total of 40 spinecho EPIs (TR = 900 ms, TE = 74 ms, EPI data acquisition time = 65 ms, NEX = 1) was obtained for each slice. A bolus injection of 0.25 ml of gadopentetate dimeglumine was administered following acquisition of the 15th image. A cerebral blood flow (CBF) index was de145
rived from PWI data to quantitatively estimate the change of CBF during occlusion and after
reperfusion as previously described (Li et al., 2000b).
DWI and PWI were acquired at 25 minutes after MCAO in all groups, at 90 minutes after reperfusion in groups B and C, and at 12 hours in group C.
7.4.3 Analysis of CBF index and ADC values
On the CBF index maps or ADC maps at the level of the optic chiasm (slice 4), one region of
interest (ROI) in the lesion center of the ipsilateral caudoputamen (10×10 pixels on CBF index maps and 4×4 pixels on ADC maps) and the other in the homologous region of the contralateral hemisphere were selected for the measurement of CBF index or ADC values. The
percent changes of the CBF index in the ipsilateral hemisphere in comparison with the CBF
Occlusion
1.5 hr
12 hr
(10-5 mm2/s)
255
Group A
Group B
Group C
0
Figure 7.1. Representative apparent diffusion coefficient (ADC)
maps from each group. Regions of interest ( ) in the lesion center of
the ipsilateral ischemic hemisphere and in a homologous region of
the contralateral non-ischemic hemisphere were chosen for
measurement of ADC values and labeled for histological analysis.
146
index in the contralateral hemisphere were used to estimate CBF changes during occlusion
and after reperfusion. The two ROIs on the ADC maps were labeled for histological analysis
as shown in Fig. 7.1.
7.4.4 Histopathological evaluation
After the MRI protocol was completed, the rats were immediately subjected to cardiac perfusion-fixation with 200 ml of phosphate buffered 4% paraformaldehyde (Garcia et al., 1997).
The rats were decapitated, and the heads were fixed overnight in the same paraformaldehyde
solution. The next day, the brains were removed from the skull. Each brain was cut into seven
2-mm-thick coronal slabs starting from the frontal pole of the brain, and labeled A (frontal)
through G (occipital). Sections from the posterior surface of slab C and the anterior surface of
slab D at level of the optic chiasm that precisely matched slice 4 on the ADC maps were used
for the following histological evaluation. The corresponding ROI on the histology sections
was matched to that on the ADC maps by using a previously described coregistration method
(Li et al., 1999). All histological analyses were performed by one investigator who was
blinded to the animal groups.
Neuronal analysis: The first 6 µm-thick section from the posterior surface of slab C was
stained with H&E for evaluation of neuronal injury. A global Lab image analysis system
(Data Translation Incorporated, Marlboro, MA) was used for quantitation by collecting images through a Sony video camera interfaced with an Olympus microscope system. Under a
light microscope at ×400 magnification, 10 non-overlapping fields in each selected ROI were
examined to determine the number of intact neurons and injured neurons. Injured neurons
included both the shrunken neurons that exhibited condensed neuronal perikarya surrounded
147
by swollen cellular process and necrotic (red) neurons that exhibited nuclear pyknosis and
cytoplasmic eosinophilia (Garcia et al., 1995b). The percentage of injured neurons was obtained by dividing the number of injured neurons by the total number of intact and injured
neurons.
Astrocytic analysis: The second 6 µm-thick section from the posterior surface of slab C
was obtained for astrocytic staining. Immunohistochemical probes for GFAP and S-100 protein (Dako Corporation, Carpenteria, CA) were used to detect astrocytes by double staining.
Both antigens were demonstrated by the avidin-biotin peroxidase system. The GFAP in both
perikaryal cytoplasm and processes of astrocytes was stained brown with diaminobenzidine
(DAB) substrate. On the same section, S-100 protein within the nuclei of astrocytes was
stained purple with the Vector VIP substrate kit (Vector Lab Inc, Burlingame, CA). Using the
imaging system indicated above, 10 non-overlapping fields in each selected ROI were examined to determine the number of astrocytes co-expressing GFAP and S-100 and the areas of
their co-expression.
Electron microscopy (EM) analysis: Slab D was cut into 8 pieces that included the entire
surface of each hemisphere, and these tissues were postfixed in 3% glutaraldehyde and osmium tetroxide, and embedded in araldite. One micron-thick section stained with toluidine
blue was obtained from each block to identify the selected ROI. The ultrathin sections were
stained with lead citrate and uranyl acetate and examined with a Philips electron microscope
to evaluate the ultrastructure of the normal and abnormal neurons and astrocytes (Garcia et
al., 1993).
148
7.4.5 Statistical analysis
Data are presented as mean ± standard deviation (SD). The parametric variables were analyzed by using one-way analysis of variance (ANOVA), two-way repeated ANOVA, or an
unpaired or paired t-test. A two-tailed value of p<0.05 was considered significant.
7.5 Results
Physiological variables such as body temperature, mean arterial blood pressure, pH, PaCO2
and PaO2 were within the normal range throughout experiment in each group (data not
shown).
7.5.1 Cerebral blood perfusion
During occlusion, the CBF index in the ipsilateral ROI decreased approximately by 50%
(54±6% in group A, 51±5% in group B, and 53±10% in group C) in all animals, compared
with the CBF index in the contralateral homologous ROI, indicating successful MCAO. After
reperfusion, the CBF index returned to normal (104±13% in group B and 101±10% in group
C at 90 minutes after reperfusion), indicating successful reperfusion.
7.5.2 ADC changes
At the end of 30 minutes after MCAO, ADC values were about 25% lower in the ipsilateral
ischemic ROI than in the contralateral non-ischemic ROI in all three groups (Figs. 7.1 and
7.2), and the differences in ADC between the two sides were significant (p<0.001). Furthermore, ADC values in the ischemic ROI were almost the same in all three groups
(47.3±6.7×10⁻⁵ mm2/s in group A, 47.6±3.9×10⁻⁵ mm2/s in group B and 45.6±2.0×10⁻⁵ mm2/s
149
ADC values (x10-5mm2/s)
80
70
60
50
40
30
20
10
0
Occ
Occ 1.5 h
Occ 1.5 h 12 h
Group A
Group B
Group C
Figure 7.2. Changes of the apparent diffusion coefficient (ADC)
values over time in the lesion center of the ipsilateral hemisphere
(open) and the non-ischemic (filled) homologous region of the
contralateral hemisphere. In all groups, ADC values in the ischemic
lesion center decreased significantly (p<0.001) during 30 minutes of
ischemia, compared with the contralateral hemisphere. In group B,
the reduced ADC values during ischemia recovered to normal 90
minutes after reperfusion. In group C, the previously renormalized
ADC values declined secondarily at 12 hours after reperfusion.
in group C; p>0.5, ANOVA). In groups B and C, ADC values returned to normal at the end
of 90 minutes of reperfusion (Figs. 7.1 and 7.2). In group C, ADC values decreased secondarily when DWI was repeated at 12 hours after reperfusion (Figs. 7.1 and 7.2); ADC values at
12 hours after reperfusion were virtually identical to those observed at 30 minutes after occlusion (45.6±2.0×10⁻⁵ mm2/s vs 47.1±1.2×10⁻⁵ mm2/s, p>0.41).
7.5.3 Histological outcomes
In the contralateral non-ischemic ROI of all groups, no histological abnormalities except for a
few dark neurons were found in all groups (Fig. 7.3-A, E).
In the ischemic ROI of group A, many neurons were slightly shrunken and surrounded
by swollen cellular processes (Fig. 7.3B), and the nuclei of the shrunken neurons were often
150
triangular and darkly stained. Some microvacuolation due to dilation of the endoplasmic reticulum and mitochondria was evident in the cytoplasm of these injured neurons (Fig. 7.4A).
At the end of 30 minutes of occlusion, 47±12% of the neurons in the ischemic ROI were
shrunken (Fig. 7.5). The nuclei and cytoplasm of astrocytes were moderately swollen in the
ischemic ROI at the end of 30 minutes of MCAO (Fig. 7.3F and Fig. 7.4B). The area of
GFAP+S-100 expression (Fig. 7.6) was significantly greater in the ipsilateral ischemic ROI
(117±6 µm2) than in the contralateral non-ischemic ROI (89±2 µm2; p<0.001).
In the ischemic ROI of group B where ADC values recovered completely after 90 minutes of reperfusion, neurons were moderately shrunken, scalloped in appearance, and surrounded by swollen cellular processes (Fig. 7.3C). Both the nuclei and cytoplasm were highly
condensed (Fig. 7.4C). The percentage of injured neurons was significantly greater after 90
minutes of reperfusion (92±2%) than at the end of occlusion (47±12%; p<0.001). Both the
nuclei and cytoplasm of most astrocytes were markedly swollen and highly electron-lucent
(Fig. 7.3F and Fig. 7.4D) and vacuolation of the neuropil—indicative of swelling of dendrites
and astrocytic processes, was evident (Fig. 7.3C). In this group, the area of GFAP+S-100 expression (Fig. 7.6) was significantly greater in the ipsilateral ischemic ROI (123±8 µm2) than
in the contralateral non-ischemic ROI (85±4 µm2, p<0.001).
In the ischemic ROI of group C where secondary ADC declines occurred, most neurons
were markedly shrunken, and some had pyknotic nuclei and eosinophilic cytoplasm (Fig.
7.3D), both signs of irreversible injury. In support of this contention and further indicative of
necrosis, many neurons had fragmented nuclei, ruptured nuclear membranes, dense organelles, and patches of homogenous electron-dense material in the cytoplasm (Fig. 7.4E). The
percentage of injured neurons in this group (94±3%) was not different from that in group B
151
(92±2%, p=0.2; Fig. 7.5), but the qualitative degree of cellular injury was much greater in
group C than group B. The number of astrocytes staining positive for GFAP and S-100 was
significantly lower (p<0.03) after 12 hours of reperfusion (2.2±1.5/microscopic field) than
after 1.5 hours of reperfusion (6.5±1.5/ microscopic field). Within the neuropil, there were
many large vacuoles (Fig. 7.3D), in this instance possibly the result of both cytoxic and
vasogenic edema. In a few residual astrocytes, cytoplasmic GFAP had disintegrated, and nuclear S-100 protein was greatly reduced (Fig. 7.3H). Electron microscopy showed gaps in the
nuclear membranes of these disintegrated astrocytes (Fig. 7.4F), indicating that they were irreversibly injured. In this group, the area of GFAP+S-100 expression was significantly less
(Fig. 7.6; p<0.001) in the ipsilateral ischemic ROI (78±4 µm2) than in the contralateral nonischemic ROI (90±5 µm2).
140
Astrocytic area (µm2)
Injured neurons (%)
100
120
80
100
60
40
20
0
80
60
40
20
0
Group A Group B Group C
Figure 7.5. Percentage of injured neurons
in the ipsilateral ROI in the three groups
(Mean±SD). Group A: At end of 30 minutes
of middle cerebral artery occlusion
(MCAO). Group B: At 90 minutes of
reperfusion after 30 minutes of transient
MCAO. Group C: At 12 hours of
reperfusion after 30 minutes of transient
MCAO.
Group A
Group B
Group C
Figure 7.6. Combined area of expression of two
astrocytic proteins, GFAP and nuclear S-100 in
both ipsilateral (open) and contralateral (filled)
hemispheres of three groups (Mean±SD). Group
A: At end of 30 minutes of middle cerebral
artery occlusion (MCAO). Group B: At 90
minutes of reperfusion after 30 minutes of
transient MCAO. Group C: At 12 hours of
reperfusion after 30 minutes of transient MCAO.
152
Figure 7.3. Neuronal morphology indicated by hematoxylin-eosin staining (A-D, ×160) and
astrocytic changes by double staining of glial fibrillary acidic protein (GFAP) plus S-100 protein (E-H, ×160). A: Many normal neurons and one dark neuron with perineural vacuoles (arrow) were observed in the contralateral non-ischemic caudoputamen. B: At the end of 30 minutes of ischemia when ADC had initially fallen, some neurons showed slightly shrunken perikarya and nuclei (arrow). C: After 90 minutes of reperfusion and recovery of ADC to normal,
most neurons were moderately shrunken and surrounded by swollen cellular process and were
scalloped in appearance. The neuropil showed marked vacuolation (star), indicative of swollen
dendrites and astrocytic processes. D: After 12 hours of reperfusion and a subsequent or second decline in ADC, most neurons were severely shrunken, and the neuropil showed extensive
vacuolation, and possibly some vasogenic edema (star). E: Dark purple reaction product demarcated S-100 protein in astrocytic nuclei; brown reaction product indicated GFAP in the cytoplasm and processes of astrocytes (arrow) in the contralateral non-ischemic caudoputamen.
F: At the end of 30 minutes of ischemia, astrocytes were moderately swollen. G: After 90 minutes of reperfusion, astrocytes were severely swollen with less intranuclear S-100 reactivity
and watery appearance. H: After 12 hours of reperfusion, astrocytes had begun to disintegrate
and lose nearly all S-100 immunoreactivity within their nuclei (arrow). At this time, some
GFAP had moved into the extracellular space (arrowhead).
153
Figure 7.4. Electron micrographs of neurons (×3000) and astrocytes (×4500). A and B: At the
end of 30 minutes of ischemia. A: Shrunken neurons with condensed nuclei and cytoplasm surrounded by a ring of swollen astrocytic processes (a). B: A swollen astrocyte with clumps of
heterochromatin around the edge of its nucleus and an abnormally wide rim of watery perikaryal cytoplasm, which contained a few swollen mitochondria (m). C and D: At the end of 90
minutes of reperfusion. C: Two markedly shrunken neurons with highly condensed nuclei and
cytoplasm; these neurons were surrounded by severely swollen astrocytic processes (a). D:
Greatly swollen astrocyte with extensive and watery perikaryal cytoplasm and a few contracted
mitochondria. E and F: At the end of 12 hours of reperfusion. E: Two necrotic neurons showing cytoplasmic and nuclear disintegration with marked chromatin clumping and discontinuous
cellular membranes. F: An irreversibly injured astrocytes with breaks in the nuclear membrane
(arrow), watery cytoplasm, and severely swollen mitochondria (m).
154
7.6 Discussion
In the present study, two structural features or endpoints were quantified and assumed to be
good indicators of cellular status. First, the percentage of injured neurons that were shrunken
and/or necrotic was taken as a marker of neuronal damage. This is a standard index of neuronal injury during and following cerebral ischemia (Garcia et al., 1997; Garcia et al., 1995b;
Garcia et al., 1993), and its employment is straightforward. Second, the combined area of expression of two astrocytic proteins – GFAP within the perikaryon and cellular processes and
S-100 within the nucleus, was taken as an index of astrocytic size. GFAP and S-100 are wellknown astrocytic markers (Ludwin et al., 1976; Boyes et al., 1986), and have been used to
investigate the astrocytic changes after ischemia (Schmidt-Kastner et al., 1990; Tanaka et al.,
1992; Ingvar et al., 1994). In the shorter time groups (group A and group B) of the present
study, increase of the GFAP and S-100 positive area most likely reflects swelling of the soma
and processes of astrocytes as suggested by the electron-lucent appearance within astrocytes
and by one previous study (Schmidt-Kastner et al., 1993). After 12 hours of reperfusion
(group C), however, GFAP had begun to breakdown in the ischemic ROI, and the area of expression had decreased, indicating disintegration of astrocytes. Further electron microscopic
study demonstrated extensive vacuolation of the neuropil (representing swelling of astrocytic
processes and/or dendrites) and gaps in the nuclear membranes of these disintegrated astrocytes, suggesting that many astrocytes were irreversibly injured, either dying or already dead.
Considering these observations, the present findings demonstrate three major points.
First, neuronal shrinkage and astrocytic swelling were seen in the region where ADC declined during the first 30 minutes of ischemia. Second, acute ADC renormalization after
reperfusion was not associated with reversal of these structural abnormalities. Third, these
155
and other morphological features showed more severe structural disturbances and death of
neurons and astrocytes when ADC decreased for the second time. These results imply that the
morphological changes of astrocytes and neurons associated with ADC declines during
ischemia do not reverse and worsen over time even though ADC values recover after 30 minutes of temporary focal brain ischemia.
7.6.1 Acute ADC declines and morphological changes
DWI is a highly sensitive modality to detect early focal brain ischemia (Baird and Warach,
1998). Since the early DWI hyperintensity (ADC decline) was found to be associated with
eventual infarction at a delayed time point, such an early ADC decline is likely to be an in
vivo sign of ischemic brain injury at least in the center of ischemia after 30 minutes of focal
brain ischemia as demonstrated by a previous study (Li et al., 2000a). It is not clear, however,
what acute morphological changes are related to the lower ADC at the time of its measurement. The histopathological features appearing during the acute phase of ischemia include
both shrinkage and swelling of the neuronal soma as well as swelling of astrocytes and dendrites (Garcia et al., 1995b; Pantoni et al., 1996). Some studies have suggested that water
movement from the extracellular to intracellular space (cytotoxic edema) causes ADC to decline (Moseley et al., 1990a; Moseley et al., 1990b; Busza et al., 1992; Benveniste et al.,
1992; Sevick et al., 1992). In this study, when histological studies were performed on brain
tissues fixed immediately after DWI, the areas with ADC declines at 30 minutes after ischemia manifested neuronal shrinkage and astrocytic swelling. The possible role of neuronal
shrinkage in the fall of ADC has been, in general, overlooked. Although unclear in detail, the
current findings suggest that the early ADC decline after arterial occlusion is a complex func-
156
tion of water flow not only between the extracellular and intracellular spaces but also among
the different cellular compartments of neurons and glia.
7.6.2 Acute ADC renormalization and cellular injury
Acute reversal of ADC following rapid restoration of blood flow and the subsequent or secondary fall in ADC have been reported similarly by us and by other groups as well
(Dijkhuizen et al., 1998; van Lookeren Campagne et al., 1999; Li et al., 2000a; Li et al.,
2000b; Li et al., 2000c; Neumann-Haefelin et al., 2000; Olah et al., 2000). It is fairly clear
that the secondary reduction in ADC is associated with delayed neuronal death after a short
period of focal brain ischemia (Li et al., 1999; Li et al., 2000a; Li et al., 2000b; Li et al.,
2000c). With a cerebral ischemia hypoxia model, Miyasaka et al recently demonstrated that
acute renormalization of ADC is not associated with normal brain histology (Miyasaka et al.,
2000). It has not been demonstrated, however, whether reperfusion-induced renormalization
of ADC after transient focal brain ischemia indicates reversal of histological changes that occurs during ischemia. Furthermore, it is not known whether delayed neuronal death is truly a
secondary event or just a slow continuation of the initial changes. Presumably, ADC renormalization should indicate resolution of cellular swelling, if cellular swelling is the only reason for the decline of ADC values. Surprisingly, the present study demonstrates that ADC
renormalization after reperfusion is not associated with restoration of astrocytic size and neuronal structure. Indeed, with renormalization of ADC, not only were many neurons and astrocytes morphologically abnormal in the regions, but also the number of injured neurons and
the amount of astrocytic swelling became greater. Our findings in the present study are consistent with those of a recent study where an ischemia hypoxia model was used (Miyasaka et
157
al., 2000). Those results suggest that ADC reduction during ischemia is likely related more
than just cytotoxic edema.
Recent studies have shown that a reduction of energy-dependent cytoplasmic motion after ischemia is likely an important factor for ischemia-related ADC declines (Duong et al.,
1998; Dijkhuizen et al., 1999). Restoration of energy production is able to restore cytoplasmic movement, thus renormalizing ADC values. Using phosphorus magnetic resonance spectroscopy, Lorek et al. (1994) and Blumberg et al. (1997) have demonstrated that energy metabolism can recover to normal after initial declines in transient hypoxia-ischemia models,
and such energy restoration was associated with ADC renormalization (Thornton et al.,
1998). We therefore assume the reperfusion-induced ADC renormalization in the present
study is likely due to energy recovery. However, such an explanation contradicts the finding
in a previous study (Wick et al., 1995) where there was still decreased metabolite diffusion in
the intracellular environment early after reperfusion, although water ADC recovered completely. Moreover, further study will be needed to demonstrate if morphologically abnormal
neurons and astrocytes are able to restore energy production when blood flow is restored.
Another important finding in this study is that delayed neuronal damage associated with
secondary ADC declines demonstrated in previous studies (Li et al., 1999; Li et al., 2000a; Li
et al., 2000b; Li et al., 2000c) is likely a slow continuation of initial ischemic injury rather
than a true secondary injury, since the morphological abnormalities measured at the end of 30
minutes of focal ischemia did not return to normal after reperfusion. Although this postulation may hold for the ischemic core following 30 minutes of unilateral MCAO in SpragueDawley rats, it does not rule out the possibility that injury is reversible in the areas of less severe ischemia in this model or in other models of ischemia.
158
7.6.3 Histopathological features of secondary ADC declines
The findings herein show that the initial and secondary ADC declines, although similar in
severity, have different histopathological features. During the initial fall in ADC, neurons
were slightly shrunken and surrounded by swollen cellular process. After 12 hours of reperfusion and with secondary ADC decline, cellular injury was much more severe—neurons had
become necrotic, and astrocytes disintegrated and decreased in number. We have recently
demonstrated that the extent of neuronal damage is correlated with the severity of initial
ADC reduction (Li et al., 1999; Liu et al., 2001) and now report that the initial and secondary
ADC declines have different histological features. Because the secondary decline is probably
indicative of untreatable injury, distinguishing the initial from the secondary ADC decline
may be of clinical importance.
7.7 Conclusion
In summary, it has been shown for this model of reversible focal ischemia that the initial drop
in ADC is accompanied by neuronal shrinkage and astrocytic swelling and that acute renormalization of ADC values after reperfusion does not indicate reversal of these cellular abnormalities. Indeed, despite the rapid restoration of CBF flow and renormalization of ADC,
the state of astrocytes and neurons worsen over time.
7.8 Acknowledgements
We thank Dr. Turgut Tatlisumak for his valuable comments.
159
Chapter 8
Deconvolution of Compartmental Water Diffusion Coefficients In
Yeast-cell Suspensions Using Combined T1 and Diffusion Measurements
Matthew D. Silva, Karl G. Helmer, Jing-Huei Lee, Sam S. Han,
Charles S. Springer, Jr., Christopher H. Sotak
From the Departments of Biomedical Engineering (M.D.S., K.G.H., S.S.H., C.H.S.) and
Chemistry & Biochemistry (C.H.S.), Worcester Polytechnic Institute, Worcester, MA;
Department of Chemistry (J-H.L., C.S.S.), Brookhaven National Laboratory, Upton, NY;
Department of Chemistry (C.S.S.), State University of New York, Stony Brook, NY;
Department of Radiology (C.H.S.), The University of Massachusetts Medical School,
Worcester, MA 01655
Submitted to Journal of Magnetic Resonance, 2001 (in review)
8.1 Preface
This paper presents a method for measuring compartmental water diffusion coefficients with
the aid of a contrast reagent (CR) to separate the intracellular (IC) and extracellular (EC)
1
H2O signals via differences in their respective longitudinal (T1) relaxation times. This ap-
proach is based on relaxography, which can utilize a numerical inverse Laplace transform
(ILT) or discrete biexponential fitting of longitudinal relaxation data in order to differentiate
compartmental signals on the basis of T1 differences. My contributions to this work were development of the NMR pulse sequences, C and IDL programming for spectroscopic and image data analysis and statistical evaluation of the biexponential methods, yeast-cell suspension preparation, performance of the NMR experiments, and principle authorship on the
manuscript.
160
8.2 Abstract
This paper presents a method for measuring compartmental water diffusion coefficients
with the aid of a contrast reagent (CR) to separate the intracellular (IC) and extracellular
(EC) 1H2O signals via differences in their respective longitudinal (T1) relaxation times. This
approach is based on relaxography, which can utilize a numerical inverse Laplace transform
(ILT) or discrete biexponential fitting of longitudinal relaxation data in order to differentiate
compartmental signals on the basis of T1 differences. The technique was validated using
yeast-cell suspensions that had wet/dry mass ratios of 3.25:1.0. The suspension medium was
3 mM in Gd-DTPA2-. Two-dimensional NMR data sets were acquired at 2.0T using a diffusion-weighted inversion-recovery spin-echo (DW-IRSE) pulse sequence in which the inversion time (TI) and diffusion-attenuation gradient amplitude (g) values were varied systematically. The resulting data were analyzed in three different ways. I.) An entire 2D data set (TI
and g incrementations) was submitted for a 2D numerical ILT analysis using the program
CONTIN to produce a 2D contour plot with T1 for one dimension and the diffusion coefficient (D) for the other. II.) Sequential 1D analysis was performed where the TI recovery at
each g value was subjected to an independent numerical ILT analysis to yield a stacked plot
of longitudinal relaxograms with g as the vertical dimension. Subsequent 1D analysis of the
diffusion-attenuation dimension with ILT yielded D values associated with the respective T1
components. III.) Sequential 1D analysis was performed in which each TI recovery was subjected to discrete biexponential fitting to yield the apparent equilibrium magnetizations of the
two T1 components for a given g value. Subsequent 1D analysis of the g-dependence of these
magnetizations yielded the D values associated with the respective T1 components. For a representative yeast-cell preparation, the 2D numerical ILT analyses (I) shows two major peaks
161
whose T1:D coordinates are 326 ms:0.208 × 10⁻⁵ cm2/s (79%) for the IC component and 48
ms:3.18 × 10⁻⁵ cm2/s (21%) for the EC component. The sequential 1D numerical ILT method
(II) yielded T1:D values of 307 ms:0.032 × 10⁻⁵ cm2/s (46%) and 64 ms:1.29 × 10⁻⁵ cm2/s
(54%) for the IC and EC components, respectively. The sequential 1D discrete biexponential
fitting method (III) yielded T1:D values of 304 ms:0.023 × 10⁻⁵ cm2/s (47%) and 65
ms:1.24 × 10⁻⁵ cm2/s (53%) for the IC and EC components, respectively. Differences in the
T1:D values between the 2D ILT method (I) and both sequential 1D analyses (II and III) were
attributed to limitations in the 2D ILT analysis vis-à-vis the insufficient diffusion attenuation
of the 1H2O signal from the highly restricted IC space. Consequently, it seems that the use of
the CR to separate the respective contributions of the IC and EC spaces, based on 1H2O T1
differences, significantly improves the accuracy of the IC D value estimate obtained using
pulsed-field gradient methods.
8.3 Introduction
Andrasko (1976) considered the idea that an NMR signal arising from biological tissue
can be a mixture of signals from water or metabolite molecules exchanging between the intracellular (IC) and extracellular (EC) spaces. Therefore, the signal measured by standard
NMR techniques may contain information that is weighted by NMR (e.g., relaxation times)
and physical (e.g., diffusion coefficients) parameters of the two compartments. To better understand changes of these parameters in response to pathology, it would be useful to separate
the contributions from each compartment, IC and EC, and determine if contributions from
one or both are responsible for any overall NMR signal change.
162
Application of diffusion-weighted NMR techniques to in vivo systems was first demonstrated by Wesbey et al. (1984) and Le Bihan et al. (1986). Moseley et al. (1990) demonstrated a decline in the apparent diffusion coefficient (ADC) of cerebral tissue water during
ischemia, and this discovery has established ADC measurement as an effective technique for
detecting acute stroke. However, the mechanism of this change is not yet fully understood
and it is unclear whether the ADC decrease during ischemia is related to changes in the IC
space, EC space, or both. Previous studies have shown that water ADC changes in biological
systems can result from changes in the cellular membrane permeability, relative changes in
the volume fractions of the IC and EC spaces, or combinations of these (Latour et al., 1994;
van Gelderen et al., 1994). Recent studies have also suggested that IC molecular diffusion in
cerebral tissue also may be dependent on cytosolic streaming, an energy-dependent process
that is retarded during ischemia (Duong et al., 1998).
This paper presents a method for distinguishing compartmental diffusion coefficients
based on the use of a contrast reagent (CR) to separate the IC and EC water proton signals
via differences in their respective longitudinal (T1) relaxation times. In previous experiments,
T1 relaxation was used to separate the compartmental signal contributions using relaxography
(Labadie et al., 1994; Han et al., 1998). This method can utilize a numerical inverse Laplace
transform (ILT) (Provencher, 1982a; Provencher, 1982b; Provencher and Dovi, 1979) of longitudinal relaxation data in order to differentiate the compartments on the basis of T1 differences. This can be combined with other types of NMR measurements [e.g., image spatial encoding (Labadie et al., 1994)] to acquire additional information from the separate compartmental signals. The result of the ILT is a distribution of relaxation times that can be multimodal, depending on the number of populations in the sample. If this so-called relaxogram
163
displays two distinct relaxation time peaks, a discrete ILT regression converges on the continuous distribution means. Comparable results can be obtained by fitting the data to a biexponential function using a constrained nonlinear least-squares algorithm (Han et al., 1998;
Silva et al., 1998). In this case, the biexponential model can accurately find the distribution
means in the continuous relaxation time spectrum.
In an analogous manner, diffusion-encoding gradient pulses can be used to determine the
decay of magnetization in b-space, where b is the diffusion-weighting parameter defined below. The appropriate numerical ILT of such data can also produce a multimodal ADC distribution [a diffusigram (Vétek et al., 1994)] that can facilitate discrimination of compartmental
signals (Vétek et al., 1994; Pfeuffer et al., 1999). Alternatively, those data could also be subjected to discrete exponential analysis. The earlier 1D diffusigraphic results were encouraging in that, for cell suspensions, the differences in diffusion may be sufficient to allow discrimination without the necessity for CR (Vétek et al., 1994). However, most intact tissue
has a considerably higher cell density than can be generally achieved with suspensions of
cells. We suspect that the presence of CR will be necessary in vivo in order to reduce ADC
assignment ambiguity, and we show here that it is necessary to increase ADC quantitation
accuracy, especially for small D values.
The method presented herein demonstrates that separation of compartmental relaxation
characteristics via biexponential fitting of inversion-recovery spin-echo (IRSE) data can advantageously isolate IC and EC compartmental 1H2O signals from yeast cell suspensions. By
appropriate incrementation of diffusion gradients in the IRSE pulse sequence, each IR curve
becomes differently diffusion-weighted. The data attain a two-dimensional nature. They can
be subjected to a 2D ILT analysis to produce a relaxo-diffusigram. Or, they can be subjected
164
to sequential 1D analyses, numerical ILT or discrete exponential. If the longitudinal relaxation dimension is analyzed first, the water ADC can then be accurately calculated for each
compartment from the second 1D analysis. The validity of this method is demonstrated here.
8.4 Theory
Figure 8.1 shows a diffusion-weighted, inversion-recovery spin-echo (DW-IRSE) pulse
sequence. The dependence of the nuclear magnetization on the T1 and T2 relaxation times
and the diffusion coefficient (D) for the spin-bearing molecule in a homogenous sample excited by the DW-IRSE pulse sequence can be derived from the Bloch equations:
TI
−
− TE
2 2 2
T1
M (T1 , T2 , D ) = M 0 1 − 2αe
e T2 e − γ δ g D [∆ −(δ / 3 )] ,
[8.1]
where M(T1, T2, D) is the magnetization measured at a particular inversion time (TI), echo
time (TE), diffusion gradient pulse separation (∆), diffusion gradient strength (g), and diffusion gradient duration (δ). The equilibrium magnetization is denoted by M0; α (ranging from
0 to 1) is the efficiency of the inversion pulse; and γ is the gyromagnetic ratio.
For measurements made at a constant TE, Eq. [8.1] can be rewritten to express M with the
constant T2 relaxation effects being subsumed with M0, giving M ′0 :
TI
−
222
M (T1 , D ) = M ′0 1 − 2αe T1 e − γ δ g D [∆ −(δ / 3 )].
[8.2]
When the IR data are collected at a given TE and diffusion-weighting, the T1 relaxation
time and equilibrium magnetization can be calculated by fitting with:
TI
−
M (T1 ) = M ′0′ 1 − 2αe T1 ,
[8.3]
165
where M ′0′ contains the effects of both transverse relaxation and diffusion. To measure the
molecule's D value, the IR data collection must be repeated at different diffusion g values at
constant TE. At each constant g value, the DW-IRSE data set is then fitted with Eq. [8.3] for
M ′0′ , T1, and α. The value of D can be calculated from the dependence of M ′0′ on γ2δ2g2[∆(δ/3)].
For a sample containing two components in exchange equilibrium, for example signals
from the IC and EC compartments having different relaxation times and self-diffusion coefficients, Eq. [8.1] can be modified to include the signals arising from each component:
TI
−
− TE 2 2 2
M (T1a , T1b , T2 a , T2 b , D a , D b ) = M 0 a 1 − 2αe T1a e T2 a e − γ δ g Da [∆ −(δ / 3 )] +
TI
−
− TE 2 2 2
M 0 b 1 − 2αe T1b e T2 b e − γ δ g D b [∆ −(δ / 3 )] ,
[8.4]
where M 0 a and M 0 b are the apparent equilibrium magnetizations of components a and b,
respectively, and T1a and T1b are the respective apparent longitudinal relaxation time values.
The respective apparent transverse relaxation times are given by T2a and T2b, while Da and Db
are the respective component apparent diffusion coefficients. The inversion efficiency, α, is
assumed to be the same for both components.
As shown in Eq. [8.2], experiments conducted at a constant TE can be rewritten to express
M with the constant transverse relaxation effects as:
TI
−
222
M (T1a , T1b , D a , D b ) = M ′0a 1 − 2αe T1a e − γ δ g Da [∆ −(δ / 3 )] +
TI
−
222
M ′0 b 1 − 2αe T1b e − γ δ g D b [∆ −(δ / 3 )].
166
[8.5]
For DW-IRSE experiments conducted with constant diffusion-weighting as well as TE,
the respective T1 relaxation times and component magnetizations can be determined from a
biexponential fitting of the data with:
TI
−
T
M (T1a , T1b ) = M ′0′a 1 − 2αe 1a
TI
−
T
+ M ′′ 1 − 2αe 1b
0b
[8.6]
and solving for M ′0′a , M ′0′b , T1a, T1b, and α. Then, as shown previously, the component diffusion coefficients (Da and Db) can be calculated from the dependence of M ′0′a and M ′0′b on
γ2δ2g2[∆-(δ/3)]. The fraction of the signal from component a, fa, and component b, fb, can be
calculated from the magnetizations at g = 0, M′0′a (0) and M′0′b (0) , that is, when no diffusionweighting is applied:
fa =
M′0′a (0)
M′0′b (0 )
and f b =
.
M′0′a (0 ) + M′0′b (0 )
M′0′a (0 ) + M′0′b (0 )
[8.7a, 8.7b]
This two-site approximation assumes that components a and b are the only signal sources in
the sample (i.e., fa + fb = 1).
8.5 Methods
8.5.1 Yeast Preparation
Approximately 1.5 g of common dry baking yeast (Saccharomyces cerevisiae,
Fleishmann’s Yeast, Inc., Oakland, CA) was rehydrated at room temperature in a 50 mL centrifuge tube with 35 mL of distilled H2O. The yeast suspension was bubbled with medicalgrade air, and, after a starving period of three hours, the suspension was centrifuged for eight
minutes at 3500 rpm (IEC-Centra8 Centrifuge, International Equipment Company, USA).
The supernatant was discarded, and the packed yeast cells were resuspended in a solution of
167
3 mM gadopentate dimeglumine (Gd-DTPA2-, Magnevist®, Berlex, Wayne, NJ) and centrifuged. The cells were washed three times with the 3 mM Gd-DTPA2- solution. After the final
washing, the packed yeast cell pellet was weighed and the wet/dry mass ratio adjusted to
3.25:1.0 with an additional amount of the 3 mM Gd-DTPA2- solution. Preliminary experiments indicated that this ratio value yielded a cell suspension with nearly a 1:1 IC:EC 1H2O
apparent magnetization ratio (fb:fa) and was viscous enough to remain suspended (i.e., there
was no settling) during the experiment. After wet/dry mass ratio adjustment, the cells were
re-suspended with agitation. Approximately 0.2 mL of the Gd-doped yeast-cell suspension
was then transferred to a standard 1.0 mL syringe and placed in a radio frequency (RF) coil
and positioned in the magnet. Experiments were performed on seven separate yeast-cell
preparations. For comparison, a single experiment was conducted on a yeast-cell sample
without CR. The procedure for sample preparation was the same except the yeast cells were
washed and resuspended (wet/dry mass ratio adjusted to 3.25:1.0) with distilled H2O.
8.5.2 NMR Experiments
All data were acquired with a GE CSI-II 2.0T/45 cm imaging spectrometer operating at
85.56 MHz for 1H and equipped with ± 20 G/cm self-shielded gradients. NMR measurements
were performed on the entire yeast sample using a 7.25 mm diameter, 8-turn solenoid transceiver RF coil. The magnet-bore temperature was 17º C. NMR data were acquired using an
inversion-recovery pulse sequence with diffusion-weighted spin-echo detection (Fig. 8.1).
Thirty-two inversion times (TI), with logarithmic temporal spacing (TI = TI0*an-1, TI0 = 5.0
ms, a = 1.257, n = 32) and two signal averages, were used to measure each T1-relaxation
curve. Other acquisition parameters were ∆ = 46.5 ms, δ = 6.0 ms, TR = 6.1 s, and TE = 55.0
168
ms. Diffusion-weighting was accomplished using half-sine-shaped magnetic field gradient
pulses simultaneously applied in three orthogonal directions with effective amplitudes (g) of
2.6 to 31.18 G/cm, incremented in steps of 2.6 G/cm (12 diffusion gradient strengths). The
use of half-sine-shaped diffusion gradient pulses requires a modification to the equations
shown in the Theory section. In this case, the diffusion-weighting term, the b-value (Le Bihan, 1991), was modified from γ2δ2g2[∆-(δ/3)] to γ2δ2(2/π)2g2[∆-(δ/4)] to account for the
three simultaneously applied, orthogonal, half-sine-shaped diffusion-gradient pulses. Halfechoes were acquired with a spectral width of ± 5 kHz and 8,192 data points.
TI
180 o
TE
90 o
180o
ACQ
RF
g
G
δ
∆
Figure 8.1. Diffusion-weighted inversion-recovery spin-echo (DWIRSE) pulse sequence. T1-weighting is performed by varying the inversion time (TI) and maintaining a constant echo time (TE). For the
isotropic yeast-cell suspension sample, diffusion gradients were applied simultaneously along three orthogonal gradient directions (Gx,
Gy, Gz). The diffusion gradient pulse parameters are: diffusion gradient separation (∆), diffusion gradient strength (g), diffusion gradient
duration (δ).
8.5.3 Data Analysis
Raw DW-IRSE data were transferred to a PC and processed using software written in the
C programming language (Borland International, Inc., Scotts Valley, CA). The phase169
corrected water resonance in each spectrum was fitted to a Lorentzian function and the peak
height was extracted. The resulting data were analyzed in several different ways. I.) An entire
2D data set (TI and g incrementations) from a preparation was submitted for a 2D numerical
ILT analysis using the program CONTIN (Labadie et al., 1994; Han et al., 1998; Provencher,
1982a; Provencher, 1982b; Provencher and Dovi, 1979; Vétek et al., 1994; Pfeuffer et al.,
1999; Lee et al., 1993). This produced a 2D contour plot (Lee et al., 1993) with T1 for one
dimension and D for the other. II.) Alternatively, the TI recovery at each g value was subjected to an independent numerical ILT analysis. This yielded a stacked plot of longitudinal
relaxograms with g as the vertical dimension (Han et al., 1998). III.) In a third alternative, the
IR curve obtained at each diffusion gradient value was separately fitted with both the monoexponential (Eq. [8.3]) and biexponential (Eq. [8.6]) models using 3- and 5-parameter (respectively) constrained, nonlinear least-squares Levenberg-Marquardt fitting algorithms written in the Interactive Data Language (IDL, Research Systems, Inc., Boulder, CO) (Han et al.,
1998; Silva et al., 1998). Fitting constraints were defined such that no fitted relaxation time
parameter could be negative or greater than twice the bulk water relaxation time constant.
Data were separately fitted with both the monoexponential and biexponential equations because at high diffusion weighting the signal contribution of the fast-relaxing component becomes negligible and the composition of the IR curve changes from two components to one
(Han et al., 1998).
To determine this transition, both discrete exponential models were tested on every data
set. To determine the most appropriate model to describe the IR data at each diffusiongradient value, F-statistics were calculated. The F-statistic is a measure of model appropriateness based on the ratio of the sum of residual squares of the fitted data of each model
170
weighted by the number of degrees of freedom for the model. In general, if two distribution
variables U and V have independent χ2 with degrees of freedom νU and νV, respectively, the
F-statistic is the distribution of the random variable F, which is defined as
F=
U νU
.
V νV
[8.8]
For this application, the F-statistic was used to test the hypothesis that the biexponential
model is statistically different than the monoexponential model. Equation [8.8] was modified
to:
F=
SSE ν E
,
SSF ν F
[8.9]
where SSF is the sum of residual squares and νF is the number of degrees of freedom for the
biexponential model in Eq. [8.6], the full model. SSE is the sum of residual squares and νE is
the number of degrees of freedom for the extra terms of the biexponential model as compared to the monoexponential model in Eq. [8.3] (SSE = SSmono – SSF). As the IR data sets
change from biexponential to monoexponential, the F-statistic (F in Eqs. [8.8] and [8.9]) approaches zero, indicating that the monoexponential model is statistically equal to the biexponential model; therefore, the biexponential hypothesis is not true and the monoexponential
model is the most appropriate. The output of the fitting program was: (1) M ′0′ , T1, and α from
a single-component fitting with Eq. [8.3]; (2) M ′0′a , M ′0′b , T1a, T1b, and α from a twocomponent fitting with Eq. [8.6]; and (3) the F-statistic.
Finally, the natural logarithms of the fitted M ′0′a and M ′0′b values were plotted versus the
γ2δ2(2/π)2g2[∆-(δ/4)] values, and Da and Db were calculated using a non-weighted, linear
least-squares regression fit to the equation:
171
M
= − γ 2δ2 (2 π )2 g 2 [∆ − (δ 4)]Di ,
ln
M′0′i
[8.10]
where subscript “i” denotes “a” or “b”. Assuming the two components are the only sources of
signal, M ′0′a and M ′0′b were used to calculate the normalized fractional contributions. The
fractional contributions of components a and b are denoted fa and fb, respectively, and were
calculated as the ratio of M ′0′a or M ′0′b to the total signal when g = 0 according to Eqs. [8.7a]
and [8.7b]. For consistency, signal “a” is equated with the fast relaxation component and signal “b” with the slow component. We refer to this third method as sequential 1D analyses
(longitudinal relaxation analysis followed by diffusion decay analysis).
8.6 Results
A set of DW-IRSE curves from a representative preparation (#6) is shown in Fig. 8.2, with
signal intensity plotted versus inversion time, TI, for 12 diffusion gradient strengths (g) ranging from 2.6 to 31.18 G/cm (b-values of 3,172, 12,688, 28,549, 50,754, 79,303, 114,196,
155,434, 203,016, 256,942, 317,212, 383,827, and 456,786 s/cm2, respectively). Notice that
the dynamic range (i.e., 2M0) of the data decreases with increasing gradient strength. This is
because the signal from the faster diffusing component is being more rapidly attenuated by
the diffusion gradient compared with that from the slower diffusing component (Han et al.,
1998). Above some b-value, the fast-diffusing component will be completely attenuated before the signal acquisition, and the inversion recovery curve will be best described by the
single component model. Since the exact b-value at which the fast-diffusing component becomes quenched is unknown, the IR data set at every gradient value will be separately fitted
with both the bi- and monoexponential models (see below) to determine the transition from
172
two- to one-component recovery. Further, note that the g-induced change in signal intensity
at a given TI is not uniform (i.e., the spacing between data points becomes closer at high gradient strengths).
Countour plots in Fig. 8.3 presents results from 2D numerical ILT analyses. The vertical,
relaxographic dimensions measure the logarithm of T1 with units of ms. The horizontal, diffusigraphic dimensions measure the logarithm of D with units of cm2/s. The top panel presents the results from a preparation with [CR] = 0 mM. It shows two major peaks whose
T1:D coordinates are 509 ms:0.27 × 10⁻⁵ cm2/s (49%) and 496 ms:2.2 × 10⁻⁵ cm2/s (51%),
50000
2.6 G/cm
40000
Signal Intensity [a.u.]
30000
31.18 G/cm
20000
10000
0
-10000
-20000
0
1000
2000
3000
4000
5000
6000
Inversion Time, TI [msec]
-30000
-40000
-50000
Figure 8.2. DW-IRSE data set for a representative yeast-cell
suspension with signal intensity plotted versus inversion time, TI,
logarithmically spaced from 5.0 to 6002.9 ms for 12 diffusion
gradient strengths ranging from 2.6 to 31.18 G/cm (b-values of
3,172, 12,688, 28,549, 50,754, 79,303, 114,196, 155,434, 203,016,
256,942, 317,212, 383,827, and 456,786 s/cm2, respectively). As the
diffusion-weighting is increased, the asymptote (M0) of the measured
signal intensity decreases. At high diffusion-weighting, the
asymptotes (M0) of the measured signal intensity curves become
closer together as the recovery changes from a two- to oneexponential time function due to quenching of the fast-diffusing
component by the strong diffusion gradients.
173
respectively. If one conducts a 1D diffusigraphic analysis of the b-space decay ignoring any
T1-weighting (say, by using a set of fully-recovered data analogous to that at the largest TI
value (6000 ms) in Fig. 8.2), one obtains two diffusigraphic peaks. If one conducts a 1D diffusigraphic analysis of the b-space decay of data that had no T1-weighting, one obtains similar results (Vétek et al., 1994). The bottom panel presents the results from a preparation (#6)
with [CR] = 3 mM. It shows two major peaks whose T1:D coordinates are 326 ms:0.208 ×
10-5 cm2/s (79%) and 48 ms:3.18 × 10⁻⁵ cm2/s (21%), respectively. Though, as expected
(Labadie et al., 1994), both peaks are shifted to smaller T1 values by the CR, which acts as a
shift reagent in relaxographic space, it is quite clear that it is the peak with the larger D value
that is significantly more shifted. Since Gd-DTPA2- is known to be restricted to the extracellular space (Labadie et al., 1994), it is clear that this peak should be assigned to the EC signal. This confirms ones intuition with regard to the compartmental water D values in cell
suspensions. However, since tissue has a higher cell density than cell suspensions, one's intuition might not be so accurate, and this might be a useful analysis for tissue data. We will
show below, however, that the D positions of the peaks seem to be shifted from accurate
values.
Figure 8.4 shows the results if only the numerical ILT relaxographic analysis is performed
on the same 3 mM CR preparation (#6) as in the bottom panel of Fig. 8.3. It presents a
stacked plot of the longitudinal relaxograms (the abscissa measures the logarithm of T1, in
ms) obtained for different b-values. These range from b-value = 3,172 s/cm2 at the top to bvalue = 456,786 s/cm2 at the bottom, with the incrementation listed above. It has been thoroughly demonstrated that the peak at smaller T1 represents the EC signal (Labadie et al.,
1994). Thus, Fig. 8.4 shows very clearly that it is the EC signal that is attenuated with in-
174
creasing b-value, as we reported earlier with a preliminary version of Fig. 8.4 (Han et al.,
1998). The average positions (and areas) of the EC and IC peaks are: 64 ms (54% @ b = 0)
and 307 ms (46% @ b = 0), respectively. If a subsequent numerical ILT diffusigraphic analysis is conducted on the areas of the Fig. 8.4 EC and IC peaks, one obtains D values of
1.29 × 10⁻⁵ cm2/s and 0.032 × 10⁻⁵ cm2/s, respectively. Though the EC D value is reduced by
a factor of ~2 from that of the 2D plot, the IC D value is reduced by almost an order of magnitude. This is significant, and will be discussed below.
Figure 8.4. A stacked plot of longitudinal relaxograms obtained at different bvalues. These result from the 1D numerical ILT of the inversion recovery data for the
system in Fig. 8.3, bottom. The abscissa measures the logarithm of T1, in ms. The bvalues range from 3,172 s/cm2 (top) to 456,786 s/cm2 (bottom). The incrementation
is given in the text.
175
Figure 8.3. Contour plots of the relaxo-diffusigrams resulting from 2D numerical ILT analyses
of data sets of the type seen in Fig. 8.2: Top, from a preparation without extracellular shift reagent (i.e., [GdDTPA2-] = 0 mM; Bottom, from a preparation with extracellular [GdDTPA2-] = 3
mM. The ordinates measure the logarithm of T1, in ms. The abscissae measure the logarithm of
D, in cm2/s. The mean value of each peak in the contour plots (i.e., the center of mass) may not
necessarily coincide with the position of the apex of the peak due to asymmetry in the peak shape.
176
For the data shown in Figs. 8.2−8.4 (preparation #6), let us illustrate the sequential 1D
analyses using discrete exponential fittings. Figure 8.5 shows a comparison of the bi- and
monoexponential fittings for the data acquisitions with the 2.6 G/cm and 31.18 G/cm diffusion-gradient pulses. The natural logarithm of the magnetization function is shown for easier
visualization of the data nature. The IR data acquired at a diffusion-weighting of 2.6 G/cm
(z) are fitted with both the biexponential () and monoexponential (---) models. The biexponential fitting is clearly more appropriate for these data and this is statistically supported
with an F-statistic >> 0. Also in Fig. 8.5, the IR data acquired at the much larger diffusionweighting of 31.18 G/cm (×
×) are fitted with both the biexponential () and monoexponential
models. For this data set, the monoexponential fitting (---) is not visible because it is coincident with the biexponential fitting. In this case, the monoexponential model is more appropriate (F-statistic ~ 0).
Each Fig. 8.2 data set was fitted with the biexponential model to determine M ′0′a , M ′0′b ,
T1a, T1b, and α, and also with the monoexponential model to determine M ′0′ , T1, and α. The
fitting of each of the twelve recoveries was performed independently (fitting constraints and
initial parameters were the same for each iteration). For this representative preparation, the
average calculated fast-relaxing T1 value (T1a) was 65 ± 2 ms and the average slow-relaxing
T1 value (T1b) was 304 ± 5 ms. As we saw in Fig. 8.4, with increasing diffusion-weighting,
the fast-relaxing (which is also the fast-diffusing) component is increasingly quenched by the
strong gradient. It is important to note that the average T1b (the slow-relaxing, slow-diffusing
component of the two-component signal) is 304 ± 5 ms, which statistically matches the T1
measured, 306 ± 1 ms, from the monoexponential model at high g values. Since the system is
well-described with one component at high diffusion-gradient strengths, the fact that these T1
177
0
ln[(M0 - Mz)/(2M0)]
-1
-2
-3
-4
-5
-6
0
200
400
600
800
1000
1200
1400
1600
TI [ms]
Figure 8.5. Biexponential () and monoexponential (---) model
fittings to IR data sets obtained with diffusion-weighted gradient
amplitudes of 2.6 G/cm (z) and 31.18 G/cm (×
×) for a representative
yeast-cell sample. The natural logarithm of the relaxation functions
(19) is shown to aid in visualizing the data characters. The 2.6 G/cm
data set (z) is best described by the biexponential model; note the
monoexponential fit (dashed line) markedly deviates from the
experimental points. The monoexponential model and the
biexponential model match the IR data for the set acquired at a
diffusion-weighting of 31.18 G/cm (×
×), which indicates that the
biexponential model “over fits” this data set and the
monoexponential model is most appropriate.
values are the same gives confidence that the same water population is being measured for
both cases.
From the model fittings, M ′0′ , M ′0′a , and M ′0′b were extracted at each g value and plotted
versus the b-value. Fig. 8.6 shows the natural logarithm of M ′0′ , M ′0′a , and M ′0′b (arbitrary
units) derived from the data of the representative preparation used for Figs. 8.2−8.5. The triangles (▲) and the open circles ({) are the calculated magnetization values for the fastrelaxing ( M ′0′a ) and the slow-relaxing ( M ′0′b ) components, respectively, from the biexponen-
178
M0, M0a, M0b [norm. arb. units]
1
0.9
0.8
0.7
0.6
0.5
0.4
0.3
0.2
0.1
0
0
50000 100000 150000 200000 250000 300000 350000 400000 450000 500000
b-value [s/cm2]
Figure 8.6. The natural logarithm of the calculated M ′0′a , M ′0′b , and
M ′0′ values for the representative data set shown in Fig. 2. The triangles (? ) and the open circles ({) are the fast-relaxing M ′0′a and
slow-relaxing M ′0′b components calculated using the biexponential
model. The solid circles (z) are the M ′0′ values calculated using the
monoexponential model. Note that M ′0′ itself is nonmonoexponential and approaches the slow-relaxing, slow-diffusing
component (IC) described by M ′0′b .
tial model. The closed circles (z) are the fitted M ′0′ values from the monoexponential model.
Note that as the b-value is increased, the contribution of the fast-relaxing component ( M ′0′a )
vanishes, and the fitted M ′0′ values asymptotically approach M ′0′b . Fitting errors are apparent
in the biexponential model for b-values greater than 300,000 s/cm2, and these points have
been omitted from Fig. 8.6.
Each curve in Fig. 8.6 was fitted using Eq. [8.10] to calculate the fractional contributions
(at g = 0) and the component diffusion coefficients. For these data, the fractional contribution
of the fast-relaxing component, fa, was 0.53, and the fractional contribution of the slow-
179
relaxing component, fb, was 0.47. The diffusion coefficient of the fast-relaxing component,
Da, is 1.24 × 10⁻⁵ cm2/s, and the diffusion coefficient of the slow-relaxing component, Db, is
0.023 × 10⁻⁵ cm2/s. The R2 linear regression coefficients (Eq. [8.10]) for Da and Db were 0.80
and 0.99, respectively. Note that the D values are very similar to those resulting from the
diffusigraphic analyses of the Fig. 8.4 data, and (again) different from those in the Fig. 8.3
2D plot.
Table 8.1 contains the results from sequential 1D analyses (exponential) of the experiments on the seven different yeast-cell preparations. The T1 values are presented as the
means and standard deviations (σ), which were calculated within each preparation, and over
all preparations. Almost identical results are obtained if numerical ILT analyses replace the
Da
Db
fa (g = 0)
T1a (σ
σ) T1b (σ
σ)
fb (g = 0)
Preparation [ms]
[ms]
[unitless]
[unitless]
[×
×10-5 cm2/s]
[×
×10-5 cm2/s]
1
1
4
5
65 (2) 291 (4)
1.22
0.026
0.54
0.46
1
67 (1) 301 (3)
1.26
0.026
0.53
0.47
2
67 (2) 289 (3)
1.11
0.024
0.54
0.46
3
65 (3) 292 (2)
1.22
0.021
0.54
0.46
4
64 (2) 294 (3)
1.20
0.020
0.59
0.41
5
65 (2) 304 (5)
1.24
0.023
0.53
0.47
6
65 (2) 294 (4)
1.10
0.021
0.51
0.49
7
2
2
3
3
3
65 (2) 295 (6) 1.19 (0.06) 0.023 (0.002) 0.54 (0.02) 0.46 (0.02) 3
Overall
Table 8.1. Apparent compartmental relaxation times (T1a and T1b)
with standard deviations (σ), diffusion coefficients (Da and Db), and
fractional contributions (fa and fb) without diffusion attenuation (i.e., g
= 0) from experiments on seven separate yeast-cell suspensions
determined with sequential 1D analysis.
1
The intra-experiment σ is from the T1a and T1b values obtained from
the nine (out of a total of 12) DW-IR data sets fitted to the
biexponential model (Eq. [8.6]).
2
σ is calculated from the means and σ of the experiments on the 7
preparations.
3
σ is calculated from the means of the experiments on the 7
preparations.
4
Linear regression R2 > 0.80 for fit of M ′0′a versus b-value.
5
Linear regression R2 > 0.98 for fit of M ′0′b versus b-value.
180
discrete exponential analyses in the sequential 1D analyses. Further, given the significant difference in Da and Db, discrete biexponential analysis of the diffusion attenuation curve was
also tested. Magnetization values at the longest TI value were fitted versus the b-value, and
the results were very similar to the results presented in Table 8.1: Da = 1.17 ± 0.003 × 10⁻⁵
cm2/s (56 ± 3%) and Db = 0.017 ± 0.004 × 10⁻⁵ cm2/s (44 ± 3%).
8.7 Discussion and Conclusions
Using a yeast-cell suspension as a model system, this paper presents a method for evaluating
apparent diffusion coefficients for water in the IC and EC spaces via differences in their respective 1H2O NMR T1 relaxation times. The intrinsic IC and EC 1H2O T1 values by themselves are not sufficiently different to allow discrimination of these compartments, especially
given the facile equilibrium transcytolemmal exchange of water (Labadie et al., 1994). However, by the natural restriction of CR to the EC space, the T1 relaxation time of the EC compartment 1H2O can be decreased such that the relaxation time constants of the IC and EC
space 1H2O signals differ by more than a factor of three. Simulations have shown that this is
the minimum necessary to deconvolve correctly a sum of exponentials with a signal-to-noise
ratio (SNR) ~50 by fitting with a biexponential model (Silva et al., 1998). The addition of 3
mM CR to the suspension reduced the apparent EC 1H2O T1 to 65 ± 2 ms, giving approximately a factor of five between the apparent 1H2O T1 relaxation times of the signals from the
two compartments. Lastly, diffusion measurements made on homogeneous water phantoms
doped with different CR concentrations indicate that the presence of CR does not by itself
alter the diffusion coefficient of water molecules (unpublished results); in this case, diffusion
measurements made in CR-adjusted homogeneous samples match diffusion measurements
181
made in the equivalent homogenous CR-free sample. This will not necessarily hold true for
all cell suspensions, however. The susceptibility differences caused by the presence of the
paramagnetic Gd-DTPA2- in only one compartment can affect the T2 and T2* values of each
compartment, even in the absence of exchange, and could alter the diffusion coefficients
measured using a pulsed-field gradient (PFG) method.
Separation of the IC and EC compartments on the basis of the apparent 1H2O T1 relaxation
times allows the water diffusion coefficients in the IC (slow-relaxing) and EC (fast-relaxing)
spaces to be measured with greater accuracy. The D of the IC space is 0.023 ± 0.002 × 10⁻⁵
cm2/s with an apparent fractional contribution of 0.46. At the cell density used here, the D of
the EC space is 1.19 ± 0.06 × 10⁻⁵ cm2/s, which is considerably greater than for the IC D. The
intracellular water apparent D is theorized to be much smaller than the EC water apparent D
due to the diffusion restrictions imposed by the small size of the tiny yeast cells, which we
estimated using a standard light microscope to be ~7 µm in diameter. Assuming a spherical
shape, the intracellular diameter (dIC) of the yeast cell can be estimated from the apparent diffusion coefficient and the diffusion time, as shown by Tanner (1983):
d IC = 20Dt diff .
[8.11]
Using values for tdiff of 45 ms [which is ∆-(δ/4) in these studies] and for D of 0.023 × 10⁻⁵
cm2/s, Eq. [8.11] yields a dIC value of 4.6 µm, which is in good agreement with the value of
4.0 µm reported by Tanner (1983). Further, the pre-exchange intracellular lifetime of a water
molecule in suspensions of this strain of yeast cells has been estimated at 672 ms (Labadie et
al., 1994), which indicates that for these preparations the yeast cell membrane is relatively
impermeable (Landis et al., 1999), and the cell suspension NMR system is in the slowexchange-regime. From the analysis of the relaxographic peak areas (by numerical ILT),
182
similar yeast-cell suspensions doped with 3 mM CR were found to be in the slow-exchangeregime, but 3 mM CR was not sufficient for the system to reach the slow-exchange-limit
(Labadie et al., 1994; Landis et al., 1999), where fa would be ~0.62 for the cell density used
here. In the slow-exchange-regime, exchange affects the values of T1a, T1b, fa, and fb, and
also, to some extent, the measured apparent diffusion coefficients (Da and Db) (Landis et al.,
1999). However, in cell suspensions, water diffusing in the EC environment should have a D
value closer to that of free water. At our magnet bore temperature of 17° C, the diffusion coefficient of bulk water is approximately 1.8 × 10⁻⁵ cm2/s. The reduction in the EC water D
relative to the diffusion coefficient of free water is presumably caused by restrictions in this
concentrated cellular suspension due to the close proximity of the external surfaces of cell
membranes. Also, in this particular case, EC water includes water in the periplasmic spaces,
which are quite confined (Landis et al., 1999). Given the effects of the restrictions and the
exchange, the measured EC diffusion coefficient deviates from the self-diffusion coefficient,
D, of the water molecules.
The method described in this paper is based on relaxography, Labadie et al. (1994), which
uses T1 relaxation time differences to separate the compartmental signal contributions. As
originally implemented, relaxography used a numerical ILT analysis (Provencher, 1982a;
Provencher, 1982b; Provencher and Dovi, 1979) to calculate the continuous relaxation time
distribution of the signals from a sample. One disadvantage of this method is that the ILT
method requires very large TI values to estimate the total M0 of the sample. Fitting the IR
data with the 5-parameter biexponential model does not require an M0 estimate since it is a
fitted parameter, thus allowing smaller TI values to be used, resulting in shorter experiment
times. Another aspect of the numerical ILT method is that the width of the relaxographic
183
peak representing a given compartment can be significantly affected by user-supplied input
parameters to the fitting and inappropriate choices may interfere with the separation of peaks
from different compartments. The biexponential fitting relaxographic method avoids this
limitation as it fits for the means of the relaxation time distributions determined by the ILT
method (Labadie et al., 1994). We have explored the limitations of the biexponential fitting
method through data simulation. For a two compartment system, the optimal data conditions
call for: signal contributions (M0a and M0b) in a ratio of 1:1, a T1 relaxation time difference of
at least three (T1b > 3T1a), and a signal-to-noise ratio (SNR) greater than 20 (Silva et al.,
1998). The data presented in this paper exceeds these criteria: The fractional signal contribution (M0a:M0b) was 0.54:0:46 or 1.2:1.0; T1b was 4.5 times T1a; and the SNR for a 0.2 mL
sample exceeded 500. Extension of this method to an in vivo biological system would require
careful experimentation to establish the appropriate CR concentrations and SNR conditions
to ensure reliable results using this approach.
Other NMR methods have attempted to separate the IC and EC water diffusion coefficients in in vitro and in vivo biological samples. Early experiments by Andrasko (1976) and
Tanner (1983) suggested that the non-monoexponential behavior of the diffusion attenuation
curve in human red blood cell and yeast-cell preparations resulted from two water populations with different diffusion coefficients. However, non-monoexponential attenuation also
may arise from restricted diffusion, as an alternative to multiple compartments with different
diffusion coefficients, or some combination of both (Helmer et al., 1995); and in all cases,
water exchange between compartments can further complicate the diffusion measurement.
Previous work analyzing rat brain 1H2O signals attempted to fit diffusion attenuation curves
to biexponential models that represent the water diffusion coefficients in IC and EC spaces
184
(Pfeuffer et al., 1999; Neindorf et al., 1996). However, when the diffusion coefficients of the
two spaces were considered in the absence of exchange and restrictions, the fitted volume
fractions did not agree with the known compartmental fractions (Neindorf et al., 1996;
Trouard et al., 1997). Because non-monoexponential attenuation curves have been found in
single compartment systems with barriers to diffusion (Helmer et al., 1995), the presence of
restricting barriers in tissue must also be considered in any successful model.
It is generally true that the numerical ILT approach gives results consistent with the discrete exponential analysis. The quantitative failure in the numerical diffusigraphic analysis in
the 2D ILT (Fig. 8.3), and in the 1D evaluation of data obtained with no CR and no T1weighting (Vétek et al., 1994), is therefore probably attributable to some other aspect. We
suspect that it has primarily to do with the very small IC D value here, caused by the tiny size
(reported above) of the yeast cells. This value of D is so small (~2 × 10⁻⁷ cm2/s) that it is very
difficult to experimentally reach b-values that cause much decay in the signal arising from
this space. Thus, it seems that the use of the CR to separate the respective contributions of
the IC and EC spaces, based on 1H2O T1 differences, significantly improves the accuracy of
the IC D value estimate obtained using PFG methods. Though mammalian cells are larger
than yeast cells (Landis et al., 1999), they are still small, and this feature could prove invaluable for in vivo studies.
Recent work has demonstrated some success with analytical models of water dynamics in
red blood cell suspensions and in simulations that includes 1H2O relaxation, tortuosity, restricted diffusion, compartmental exchange (membrane permeability), and cell geometry
(Stanisz et al., 1998; Szafer et al., 1995b). These and other studies have used combined T2relaxation and diffusion methods to describe biological tissue using the two-compartment (IC
185
and EC) model (Neindorf et al., 1996; Trouard et al., 1997; Stanisz et al., 1998; Szafer et al.,
1995b). The disadvantages of T2-relaxation time methods are that T2 is sensitive to bulk
magnetic susceptibility effects and exchange effects, both of which contribute to the miscalculation of the volume fractions (Neindorf et al., 1996). Given that in the slow-exchangeregime the T1 relaxation time of the water signals from the IC space will be only slightly altered by the presence of CR in the EC space, methods based on CR-enhanced T1-relaxation
separation do not have the same drawbacks and ensure the more accurate measurements of
compartment relaxation times, diffusion coefficients, and volume fractions if equilibrium
transcytolemmal water exchange is properly accounted for.
Studies by Labadie et al. (1994) and Stanisz et al. (1998) have shown the efficacy of using
MR CRs to discriminate between the IC and EC water signals in a biological sample by virtue of their relaxation time differences. These studies demonstrated that the addition of the
CR alters the relaxation time constants (T1 and T2) of the EC water; and, due to the molecular
size, hydrophilicity, and electrical charge of the Gd-DTPA2- anion, it remains in the EC
space. Facile (equilibrium) exchange of water molecules between the IC and the EC environments complicates the measurement of the absolute (i.e., exchange-less) compartmental
T1-relaxation times because mixing of the compartmental water increases the number of
molecules that contact the CR. However, it has been shown that the addition of a sufficient
concentration of CR can move the system from a fast-exchange-regime toward a slowexchange-regime (Labadie et al., 1994; Landis et al., 1999; Herbst and Goldstein, 1989;
Donahue et al., 1994) by reducing the relaxation time of the signal from the EC space water,
thereby reducing the exchange effects. Another reason for selecting the yeast-cell strain used
in these experiments is that the transmembrane exchange is relatively slow as compared to
186
other biological systems (Labadie et al., 1994), such as red blood cell suspensions (Latour et
al., 1994), and even other yeast strains (Labadie et al., 1994; Landis et al., 1999). In this
study, confidence that the yeast-cell suspension was in the slow-exchange-regime was supported by the F-statistic analysis method, which determined that the biexponential model
most appropriately described the data for small diffusion gradient values. Further, a slowexchange condition is defined as the compartmental exchange rate constant being much less
than the difference between the relaxation rate constants for the signals from the two compartments (Labadie et al., 1994; Landis et al., 1999; Herbst and Goldstein, 1989). It was reported by Labadie et al. (1994) that the measured exchange rate constant in a yeast-cell suspension was ~2.3 s-1. The difference in apparent T1 relaxation rate constants between the IC
and the EC spaces for the present experiments is 12 s-1, which further supports the contention
that the yeast-cell NMR system is in the slow-exchange-regime when the extracellular concentration of CR is 3 mM.
Using CR in a yeast-cell suspension, we have successfully demonstrated a method for deconvolving compartmental apparent diffusion coefficients based on differences in the respective T1 relaxation times of the two compartmental 1H2O signals. The application of this
method to an animal model could be used to study the in vivo compartmental (IC and EC)
relaxation time constants and ADCs of tissue such as muscle or brain. Further, tissue changes
resulting from injury or disease could be measured with respect to each compartment individually. Specifically, since Moseley et al. (1990) demonstrated a decline in the ADC of
cerebral tissue water after cerebral ischemia resulting from stroke, there has much speculation regarding the mechanisms causing the ADC decline. If CR could be successfully used to
alter the relaxation time constants of the cerebral EC compartment, it should be possible to
187
employ this method to assign the observed ADC components, determine the cerebral IC and
EC apparent 1H2O T1 relaxation times, and the water ADC values. This could lead to better
understanding of the underlying mechanism responsible for the water ADC changes during
cerebral ischemia.
8.8 Acknowledgements
We thank Gabor Vétek and Ildiko Palyka for help with initial experiments, and Christian
Labadie for help with the 2D ILT. We thank the NIH (RO1 GM32125) and the DOE (Contract AC02-98CH10884) for partial support of this work. Additional funding provided by a
US Department of Education GAANN Fellowship (M.D.S.).
188
Chapter 9
Separating MR Changes of Intra- and Extracellular Water in Focal
Cerebral Ischemia in the Rat Brain
Matthew D. Silva, Tsuyoshi Omae, Karl G. Helmer, Fuhai Li,
Marc Fisher, and Christopher H. Sotak
Departments of Biomedical Engineering (M.D.S., K.G.H., and C.H.S.) and Chemistry and
Biochemistry (C.H.S.), Worcester Polytechnic Institute, Worcester, MA; Departments of
Neurology (T.O., F.L., and M.F.) and Radiology (M.F. and C.H.S.), UMass Memorial Health
Care and the University of Massachusetts Medical School
Magnetic Resonance Medicine, 2002, in press
9.1 Preface
The reason for the apparent diffusion coefficient (ADC) of water decline in cerebral ischemia
is still not well understood, and in these experiments the relative roles of the intra- and extracellular spaces are isolated via intracerebroventricular infusion of an MR contrast reagent.
Intracellular water T1, T2, and ADC values were measured in vivo in normal and middle
cerebral artery occluded (MCAO) rats using volume-localized, diffusion-weighted inversionrecovery spin-echo (DW-IRSE) spectroscopy and diffusion-weighted echo-planar imaging
(DW-EPI). My contributions to this work were development of the NMR pulse sequences, C
and IDL programming for spectroscopic and image data analysis and statistical evaluation,
performance of the NMR experiments, and principle authorship on the manuscript.
189
9.2 Abstract
Diffusion-weighted imaging (DWI) is an accepted tool for detection of acute cerebral ischemia due to the significant changes in the apparent diffusion coefficient (ADC) of water that
occur in ischemic brain tissue; however, the reason for the ADC decline (and hence DWI
contrast) is still not well understood. Since conventional MR data contains the combined signals from the intracellular (IC) and extracellular (EC) spaces, it is difficult to determine the
separate roles of these two compartments to the overall changes in water ADC. Consequently, this study proposes a method of separating the NMR signals from IC and EC water
to gain an understanding of the ADC changes that occur during acute cerebral ischemia. Intracerebroventricular (ICV) infusion of an MR contrast reagent (CR) was used to isolate IC
T1, T2, and ADC values in vivo in normal and middle cerebral artery occluded (MCAO) rats
using volume-localized, diffusion-weighted inversion-recovery spin-echo (DW-IRSE) spectroscopy and diffusion-weighted echo-planar imaging (DW-EPI). The presence of the EC
contrast reagent (CR) selectively enhances the relaxation of water in the EC space and allows
the IC and EC signal contributions to be separated based on T1-relaxation time differences
between the two compartments.
DW-IRSE and DW-EPI was performed in four groups (of five animals each) to study
normal and ischemic brain tissue (both with and without the infused CR). Measurements of
the apparent T1, T2, diffusion, and volume fraction of the IC space were performed. Information about the EC space was calculated indirectly from the IC data. In the CR-infused, normal rat brain, the IC water was found to comprise 80% of the measure signal and had T1 and
T2 values of 235 ± 10 ms and 46 ± 2 ms, respectively. The T1 and T2 values of the EC water
were 48 ± 8 ms and 6 ± 2 ms, respectively, in the presence of the CR.
190
In subsequent experiments, the echo time of the NMR pulse sequences was set to >5T2 of
the EC space in order to filter the EC signal contribution and thus allow selective ADC
measurements of the IC water. In normal brain tissue (i.e., no ischemia or CR), the spectroscopic ADC value was 0.90 ± 0.02 (all ADC values ×10-3 mm2/s). Following infusion of the
CR, the measured ADC value (presumed to be the IC ADC value only) was 0.81 ± 0.05. In
the ischemic rat brain, the ADC values in the CR-free and CR-infused groups were 0.51 ±
0.02 and 0.53 ± 0.07, respectively. DW-EPI experiments were performed using diffusion coefficients measured along the z-axis direction and as well as averaged over the x-, y-, and zaxis directions (i.e., the average diffusivity or the trace of the diffusion tensor). In the z-axis
direction, the ADC values were 0.81 ± 0.03, 0.75 ± 0.05, 0.51 ± 0.04, and 0.52 ± 0.05 for the
normal, CR-infused, ischemic, and ischemic/CR-infused rat brains, respectively. The average
diffusivity values for the same groups were 0.70 ± 0.05, 0.69 ± 0.06, 0.45 ± 0.06, and 0.44 ±
0.06, respectively. These results suggest that the IC ADC value measured from the CRinfused group was the major determinant of the overall ADC value measured from the normal group. Further, the statistical similarity between the ischemic and ischemic/CR-infused
groups suggests that the ADC decline experienced during acute ischemia is dictated largely
by changes in the IC ADC.
9.3 Introduction
Diffusion-weighted magnetic resonance imaging is sensitive to changes in tissue water diffusion properties that occur during ischemia (Moseley et al., 1990; Benveniste et al., 1992; van
Gelderen et al., 1994), however, the mechanisms of these changes are not well understood. In
cerebral tissue, water diffusion is a complex process that involves passive Brownian motion
191
and active processes (e.g., water transport, cerebral spinal fluid (CSF) pulsation, and bulk
motion). Restrictions to water diffusion (e.g., cellular membranes and intracellular structures), macromolecular binding, and exchange between different environments further complicate the water diffusion characteristics. Furthermore, biological tissue environments include the intracellular (IC) and extracellular (EC) spaces as well as the relatively smaller IC
organelles, microtubules, and periplasmic spaces. It is presumed that the apparent diffusion
coefficient (ADC) of the water in the EC space is faster than the IC space, a crowded milieu
that contains many structures to restrict diffusion.
A few hypotheses regarding the mechanisms of water ADC decline in ischemic tissue
have been proposed and focus on the relative roles of water diffusion in the IC and EC
spaces. The initial hypothesis suggested that cytotoxic edema (cellular swelling) caused by
disruption of the energy-dependent ionic equilibrium pumps results in an influx of fastdiffusing EC water to the slow-diffusing IC space (Moseley et al., 1990; Benveniste et al.,
1992; van Gelderen et al., 1994; Zhong et al., 1993; Anderson et al., 1996). A second hypothesis proposed that the influx of EC water to the IC space causes a volume reduction in
the EC space and a proportional increase in the restrictions to diffusion imposed by the cellular membranes (i.e., increased tortuosity) in the EC space (Sykova et al., 1994; Latour et al.,
1994; Norris et al., 1994; van der Toorn et al., 1996). More recently, it has been hypothesized that in ischemic conditions energy-dependent IC microcirculation (cytoplasmic streaming) is halted, resulting in a reduction in the IC water ADC (Neil et al., 1996; Wick et al.,
1995; van der Toorn et al., 1996; Duong et al., 1998). Although one mechanism may dominate the ADC reduction observed during ischemia, it is more likely, given the complex nature
192
of the diffusion process, that the ADC change results from a combination of all these mechanisms (Szafer et al., 1995a).
Attempts to separate the IC and EC properties in normal and ischemic cerebral tissue have
focused on the use of exogenous and metabolic surrogates to gain insights about biological
water diffusion (Neil et al., 1996; Wick et al., 1995; van der Toorn et al., 1996; Duong et al.,
1998; Duong et al., 2001). Neil et al. (1996) investigated in vivo diffusion properties of cesium-133 (133Cs), an intracellular potassium analog, and found that the magnitude of changes
in the 133Cs ADC were on the same order as the reduction in water ADC following ischemia.
Duong et al. (1998) introduced a compartment-specific marker, 2-[19F]luoro-2-deoxyglucose6-phosphate (2FDG-6P), that could be selectively isolated in the IC space (via intravenous
infusion) or in the EC space (via intraventricular infusion). Duong et al. found that the
changes in the IC and EC 2FDG-6P ADCs during global ischemia in a rat model were approximately equal (37% and 40%, respectively) and matched the water ADC decline of 40%.
Both studies support the hypothesis that diffusion changes in the IC space may dominate the
reduction in ADC; however, in both instances, water ADC is being inferred from the behavior of an exogenous molecular tracer. Similar results have been observed in spectroscopic
studies of cerebral metabolites. Focal ischemia in rat brain results in a significant reduction in
the ADCs of metabolites, including N-acetyl-aspartate (NAA), total creatine (tCR), choline
(Cho)—suggesting that IC diffusion properties dominate the ADC change during ischemia
(Wick et al., 1995; van der Toorn et al., 1996). The recent publication from Duong et al.
(2001) attempts to infer the ADC of EC water from ADC measurements of mannitol,
phenylphophonate, and polyethylene glycol. These results suggest that in both normal and
ischemic conditions the IC and EC ADC values are very similar, however the larger IC vol-
193
ume contributes the dominant term. Consequently, the interpretation of these data must be
tempered by the fact that the exogenous tracer (or metabolite) and water may have different
molecular size, diffusion coefficient temperature dependence, macromolecular binding properties, and exchange properties both in normal and ischemic tissue.
Other attempts to isolate the IC and EC diffusion properties have employed fitting the diffusion signal attenuation curve to a sum of two decaying exponentials (biexponential model).
Neindorf et al. (1996) first showed that using large range of b-values (up to 10,000 s/mm2)
amplified the non-monoexponential nature of the diffusion signal attenuation curve. These
investigators found that the biexponential fit of diffusion signal attenuation curves in rat
brain yielded a slow ADC value of 0.83 ± 0.03 × 10⁻³ mm2/s and a fast ADC value of 1.68 ±
0.1 × 10⁻³ mm2/s, with the fast-diffusing component accounting for 80% ± 2% of the signal.
If, as hypothesized, the EC water ADC is faster than the IC water ADC, these findings do not
agree with the known IC / EC fractions, where 80% of cerebral tissue is IC space in normal
brain tissue. Similar results have been obtained by Mulkern et al. (1999, 2000) in studies performed in human brain. In the latter study, the authors state that although it was appealing to
assign non-monoexponential behavior to two independently diffusing compartments, namely
IC and EC, there was not enough evidence to draw such a conclusion (Mulkern et al., 2000).
Other recent work, from Clark and Le Bihan (2000), suggested that bias introduced by T2
relaxation time differences between IC and EC water and diffusion anisotropy could complicate the biexponential analysis and explain some of the volume fraction discrepancies.
Lastly, more complicated diffusion analyses have involved three component exponential fitting to the diffusion signal attenuation curve (Assaf and Cohen, 1998; Pfeuffer et al., 1999),
however, it should be noted that the three exponentials from each study are not the same. In
194
short, non-monoexponential diffusion signal attenuation does not necessarily imply multiple
compartments (Helmer et al., 1995). In fact, the complex diffusion process can result in nonmonoexponential signal decay due to restrictions, exchange, relaxation time effects, and diffusion time selection as well as compartmental ADC differences.
Since conventional MR data contain the combined signals from the IC and EC spaces, it is
difficult to determine the separate roles of these two compartments to the overall changes in
water ADC during cerebral ischemia. To date, no direct MR measurements of IC and EC water diffusion have been performed in vivo. In this study, we will demonstrate a method of intracerebroventricular (ICV) contrast reagent (CR) infusion to isolate IC T1, T2, and ADC values in vivo in normal and middle cerebral artery occluded (MCAO) rats via volumelocalized, diffusion-weighted inversion-recovery spin-echo (DW-IRSE) spectroscopy (Silva
et al., in review) and diffusion-weighted echo-planar imaging (DW-EPI). This method employs the use of an MR CR to selectively enhance relaxation of water in the EC space in order to separate the respective IC and EC signal contributions based on T1-relaxation time differences.
9.4 Methods
9.4.1 Animal Preparation
9.4.1.1 CR Infusion Procedure
Intracerebroventricular infusion of CR (ProHance, Gd-HP-D03A, Bracco Diagnostics,
Princeton, NJ) was performed on male Sprague-Dawley rats (290−330 g). Anesthesia was
initiated with intraperitoneal injection of chloral hydrate (400 mg/kg). The infusion procedure followed that detailed by Duong et al. (1998). The animal was fixed in a stereotaxic
195
frame (Kopf Instruments, Inc., Tujunga, CA), and the skull was exposed with a midline incision along the top of the animal’s head. Bilateral burr holes (ca 1.5 mm ∅) positioned dorsal
to the lateral ventricles were made using a cordless rotary tool (Craftsman, Inc., USA) and a
0.635 mm bit. The positions were fixed using the stereotaxic device at 1.0 mm anterior and
1.2 mm lateral to bregma and 3.5 mm below the dura. A total volume of 20 µl (10 µl per ventricle) of 0.25 M ProHance (half dilution of stock) was infused continuously using an infusion pump (Harvard Apparatus, Inc., Holliston, MA) over a 2-hr period. Anesthesia was
maintained during the infusion using choral hydrate. Animal body temperature was continuously monitored via a rectal probe and was maintained at 37° C with regulated heat lamp.
Following the infusion period, the animal was allowed to recover from anesthesia for approximately 1 hour to minimize seizure and death.
9.4.1.2 Focal Ischemia
For two groups in this study, focal cerebral ischemia was induced with the intraluminal suture MCAO method as initially described by Koizumi et al. (1986). Briefly, the right common carotid artery, internal carotid artery and external carotid artery were exposed through a
midline incision of the neck. The proximal portions of the right common carotid artery and
external carotid artery were ligated with 5-0 surgical sutures. A 4-0 monofilament nylon suture, its tip thermally rounded and silicone coated, was inserted through an arteriotomy of the
right common carotid artery 3 mm below the carotid bifurcation. The suture occluder was
advanced into the internal carotid artery until a mild resistance was felt, indicating that the
occluder had entered the anterior cerebral artery and thus blocked the blood flow from the
196
anterior communicating artery and the posterior communicating artery to the middle cerebral
artery.
9.4.2 MR Methods
MR experiments were performed with a GE CSI-II 2.0T/45 cm imaging spectrometer (GE
NMR Instruments, Fremont, CA) operating at 85.56 MHz for 1H and equipped with ±20
G/cm self-shielding gradients. The animals were fixed in a homebuilt birdcage RF coil with
tooth- and ear-bar restraints and placed into the MRI magnet bore. Inside the magnet, anesthesia was maintained with 1.0% isoflurane delivered in air at 1.0 L/min. Body temperature
was continuously monitored using a rectal probe and was maintained at 37° C by means of a
thermostatically-regulated heated-air flow system.
9.4.3 CR Steady-State Equilibrium and Stability
Initial experiments were conducted to evaluate the quality of the ICV CR infusion method.
High-resolution T1-weighted images (T1WIs) were acquired on three animals to evaluate the
dispersion and steady-state equilibrium of the infused CR in the animal brain. Eight, 2-mmthick, coronal images centered about the optic chiasm were acquired every 30 minutes for 5
hours with TR = 300 ms and TE = 20 ms. An imaging field-of-view (FOV) of 25.6 mm ×
25.6 mm and a pixel resolution of 256 × 256 provided an in-plane resolution of 100 µm ×
100 µm.
During spectroscopic and diffusion MRI experiments, the CR infusion was evaluated using transverse relaxation time (T2) maps of the brain immediately before and after the experiment. A multislice, double spin-echo (SE), EPI pulse sequence was used to map the T2 of
197
the brain. T2-weighting EPI (T2W-EPI) was achieved by varying the echo time for the first
echo. T2 maps were constructed from nine T2-weighted EPIs with TR = 5s, NEX = 4, and
TE1 values between 20 and 110 ms. The echo time for the second echo was the same as the
echo time for the DW-EPI sequence (TE2 = 74 ms). Eight contiguous, coronal, 2-mm-thick
slices, which corresponded to the eight DW-EPI slices, were acquired with FOV = 25.6 mm
× 25.6 mm and pixel resolution = 64 × 64. Using a linear least-squares regression, maps of
the T2 values were calculated from the natural logarithm of the signal intensity versus TE
value; the slope of the best-fit line was used to calculate the T2 value.
9.4.4 Volume-localized DW-IRSE Spectroscopy
Prior to spectroscopic relaxation time and ADC measurements, scout images were acquired
to localize the 4 × 4 × 4 mm3 volume-element in the animal brain. First, a SE-EPI sequence
was used to determine the imaging offset in the coronal plane such that subsequent images
were centered about the optic chiasm. Second, a high-resolution, T1WI was acquired in the
coronal plane to determine the optimal placement of the localized voxel. Spectrometer software was used to choose a subcortical voxel (4 × 4 × 4 mm3), which did not overlap the ventricular space, from the T1WI. A T1WI image of the localized volume was acquired to validate the voxel location.
9.4.5 DW-IRSE Sequence
The DW-IRSE sequence employed a PRESS sequence that was preceded by an inversion
pulse and contained diffusion-sensitizing gradients. Primer-crusher gradients about the 180°
RF pulses were added to remove spurious out-of-voxel contamination of the signal. The ef-
198
fective diffusion-sensitizing gradient strengths (b-values) were calculated including the
cross-terms and contributions of the crusher gradients (Mattiello et al., 1994). To ensure that
the correct effective b-values were calculated, ADC measurements made using the DW-IRSE
pulse sequence and the recalculated b-values were compared with ADC measurements made
using a standard Stejskal-Tanner pulsed-field gradient (PFG) sequence on a water phantom.
Based on the high-resolution, scout T1WIs, coordinates for the localized volume were determined for the DW-IRSE sequence. For all spectroscopic experiments, thirty-two inversion
times (logarithmically spaced from 5 to 1800 ms) were acquired to calculate the T1relaxation curve. Half-echoes were acquired with a spectral width of ±1kHz and 8k data
points (TR = 4 s, NEX = 2). Spin-spin relaxation time measurements were made using the
DW-IRSE sequence by acquiring the full IR data set at a constant diffusion-gradient strength
of 4 G/cm (to serve as a primer-crusher gradient pair) and TE values of 13.6, 15, 20, 30, 50,
and 80 ms. ADC measurements were made at a constant TE value (42.8 ms) by changing the
strength of the diffusion-sensitizing gradient pulse (g) over successive experiments. Halfsine-shaped, diffusion-sensitive z-gradient pulses were used with amplitudes of 4, 5, 15, and
16 G/cm (b-values = 24.5, 36.6, 308.7, and 348.6 s/mm2, respectively). Other acquisition parameters were diffusion-sensitive gradient pulse width (δ) = 4.0 ms and diffusion-sensitive
gradient pulse separation (∆) = 30.6 ms (tdiff = 27.8 ms). Spectroscopic DW-IRSE data was
processed using custom IDL code (Interactive Data Language, RSI, Inc., Boulder, CO).
Briefly, the raw spectroscopic data was Fourier transformed, filtered using a 5-point Gaussian filter moving window, and interpolated to a Lorentzian function. The maximum amplitude of the interpolated peak height was stored as the signal intensity value for that particular
data set.
199
9.4.6 DW-EPI
Multislice, DW-EPI was used to map the ADC of brain water. Eight contiguous, coronal, 2mm-thick slices, were acquired with a FOV = 25.6 mm × 25.6 mm, pixel resolution = 64 ×
64, TR = 5 s, TE = 74 ms, EPI data acquisition time = 65 ms, NEX = 2, δ = 7 ms, and ∆ = 35
ms (tdiff = 33.25 ms). Half-sine-shaped, diffusion-sensitive gradient pulses were applied along
one of the three orthogonal gradient axes (x, y, or z). In separate experiments, nine b-values,
ranging from 19 to 1531 s/mm2, were used to measure the ADC of water along each of the
three diffusion-gradient directions (ADCx, ADCy, and ADCz). Using a linear least-squares
regression, the natural logarithm of the signal intensity was fitted to the b-values, where the
slope of the fitted line is proportional to the ADC. The average ADC (ADCav) map was calculated by averaging the three orthogonal ADC values on a pixel-by-pixel basis. The combination of the 4th and 5th imaging slices (the center slices) corresponded to the region of the
DW-IRSE spectroscopic voxel.
9.4.7 Experimental Protocols
In preliminary experiments, the stability of the CR infusion method was evaluated using
high-resolution T1WI, however, due to time constraints, this imaging protocol was not used
during the subsequent spectroscopy and imaging experiments. T2W-EPI was performed to
verify CR infusion stability for all other experiments. The T2W-EPIs of CR-enhanced brain
were compared to the T2W-EPIs of normal rat brain to verify that the CR was distributed uniformly throughout the brain. Further, T2W-EPIs acquired before diffusion measurements
were compared to T2W-EPIs acquired immediately after diffusion measurements; no change
200
in tissue T2 suggested that the CR-enhancement remained constant during the diffusion
experiments.
After the characteristics and stability of the CR-infusion were established, a series of experiments was conducted to determine the TE-dependence of the cerebral tissue T1 relaxation
time. Four male Sprague-Dawley rats received ICV CR infusion to determine the loss of EC
signal contribution due to the CR-enhanced T2 decay as a function of TE. Six TE values,
ranging from 13.6−80 ms, were employed using the DW-IRSE sequence with constant diffusion-weighting. The ultimate goal of this experiment was to find the TE value that corresponded with the loss of signal from the EC space. First, the IR data sets were fitted to both
the biexponential and monoexponential models to track the IR change from two-component
(IC and EC signals) at short TEs to one-component (only IC signal) at long TEs. Second, the
percent change in T1 was analyzed as a function of TE. At short TE values, the contribution
of the fast-relaxing EC signal would presumably reduce the overall (bulk) T1 relaxation time.
When the TE is sufficiently long to allow complete dephasing of the EC signal, only the IC
water will contribute to the measured T1 value, and the T1 will lose significant dependence on
the TE. Experiments were conducted 2−3 hours following CR infusion.
To characterize the changes in the ADC of cerebral tissue water during ischemia, 20 male
Sprague-Dawley rats were divided into four groups, each with five animals. Spectroscopic
data were collected with the volume-localized DW-IRSE sequence, and DW imaging experiments were conducted with the DW-EPI sequence. The TE values of both the spectroscopic and imaging sequences—42.8 and 74 ms, respectively—were chosen to exceed ~5
times the T2 of the CR-enhanced EC space. The DW-EPI sequence did not involve an IR
pulse; and therefore, no T1 fitting was required. In the imaging experiments, the TE was cho-
201
sen such that for the CR-enhanced animal groups, only the IC signal contributed to the measured signal, and the diffusion signal attenuation curve was fitted by a monoexponential.
The Normal animal group in the ADC experiments did not undergo any surgical procedures (i.e., neither CR infusion nor focal ischemia). The MCAO group received focal ischemia via MCA occlusion. ADCs measured in the Normal and MCAO groups represent the
standard experimental protocol, where the measured ADC is the combined ADC of the IC
and EC water. The ICV animal group received an ICV infusion of CR but no focal ischemia.
The ICV+MCAO group received both ICV infusion of CR and focal ischemia via MCA occlusion. For the CR-enhanced groups (ICV and ICV+MCAO), the measurement of the ADC
is from the IC space due to the CR-induced loss of EC signal contribution. Experiments were
conducted 2−3 hours following CR infusion.
9.5 Data Analysis
9.5.1 CR Steady-State Equilibrium and Stability
T1WIs were acquired to detail the temporal changes in cerebral-tissue signal intensity following the infusion of the CR. The mean signal intensity on the T1WIs was plotted in several regions-of-interest (ROIs) as a function of time to determine the stability of the infusion, the
time window for diffusion measurements, and the extent of CR distribution throughout the
cerebral tissue. A similar ROI analysis was performed on the T2W-EPIs.
202
9.5.2 Experimental Data Modeling
The dependence of the nuclear magnetization on the T1 and T2 relaxation times and the ADC
the spin-bearing molecule in a homogenous sample excited by the DW-IRSE pulse sequence
can be derived from the Bloch equations:
TI
−
− TE
T
1
M (T1 , T2 , ADC) = M 0 1 − 2αe e T2 e − b (ADC ) ,
[9.1]
where M(T1, T2, ADC) is the magnetization measured at a particular inversion time (TI),
echo time (TE), and b-value (b). The b-value is determined for half-sine-shaped diffusionsensitizing gradient pulses of diffusion gradient separation (∆), diffusion gradient strength
(g), and diffusion gradient duration (δ) according to: (2γδg/π)2(∆-δ/4). In MR pulse sequences with imaging or crusher gradients during the diffusion period, the b-value is modified to reflect the presence of the additional gradients (24). The equilibrium magnetization is
denoted by M0; α (ranging from 0 to 1) is the efficiency of the inversion pulse; and γ is the
gyromagnetic ratio.
For measurements made at a constant TE and diffusion-weighting, Eq. [9.1] can be rewritten to express M with the constant T2 relaxation and diffusion effects being subsumed with
M0, giving M ′0 :
TI
−
M (T1 ) = M ′0′ 1 − 2αe T1 ,
[9.2]
where M ′0′ contains the effects of both transverse relaxation and diffusion. To measure the
molecule's ADC value, the IR data collection must be repeated at different diffusion g values
at constant TE. At each constant g value, the DW-IRSE data set is then fitted with Eq. [9.2]
for M ′0′ , T1, and α. The value of ADC can be calculated from the dependence of M ′0′ on the
203
b-value. Similarly, the T2 of the sample can be measured from the change in M ′0′ as a function of TE if the data collection is performed at multiple TEs and constant b-value.
For a sample containing two components in exchange equilibrium—for example, signals
from the IC and EC compartments having different relaxation times and self-diffusion coefficients—Eq. [9.1] can be modified to include the signals arising from each component:
TI
−
− TTE − b (ADC )
T1f
f
M (T1f , T1s , T2f , T2s , ADC f , ADC s ) = M 0f 1 − 2αe
e 2f e
+
,
TI
TE
−
−
M 0s 1 − 2αe T1s e T2 s e − b (ADCs )
[9.3]
where M 0 f and M 0s are the apparent equilibrium magnetizations of the fast (f) and slow (s)
relaxing components, respectively, and T1f and T1s are the respective apparent longitudinal
relaxation time values. The respective apparent transverse relaxation times are given by T2f
and T2s, while ADCf and ADCs are the respective component apparent diffusion coefficients.
The inversion efficiency, α, is assumed to be the same for both components. Component
separation based on differences in the T1 relaxation time constants permits separation of
compartmental diffusion coefficients, even if the ADC of the components are similar. Further, if the TE of the experiment is longer than five times T2f, the contribution of the fastrelaxing component will be eliminated, and Eq. [9.3] reduces to Eq.[9.1].
As shown in Eq. [9.2], experiments conducted at a constant TE and diffusion-weighting
can be rewritten to express M with the constant transverse relaxation and diffusion effects:
TI
−
T1f
M (T1f , T1s ) = M ′0′f 1 − 2αe
TI
−
+ M ′′ 1 − 2αe T1s
0s
204
[9.4]
and solving for M ′0′f , M ′0′s , T1f, T1s, and α. Then, as shown previously, the component diffusion coefficients (ADCf and ADCs) can be calculated from the dependence of M ′0′f and M ′0′s
on the b-value. The fraction of the signal from component f, ff, and component s, fs, can be
calculated from the magnetizations at b = 0, M′0′f (0) and M ′0′s (0) , that is, when no diffusionweighting is applied:
ff =
M ′0′f
M ′0′f + M ′0′s
and f s =
M ′0′s
.
M ′0′f + M ′0′s
[9.5a, 9.5b]
This two-site approximation assumes that components f and s are the only signal sources in
the sample (i.e., ff + fs = 1).
For all spectroscopic experiments, the IR data was fitted to both the mono- and biexponential data models—Eqs. [9.2] and [9.4], respectively. To calculate the T2 or ADC from the fitted IR data, the natural logarithm of the calculated M0s was fitted to the TE- or b-values, respectively, using linear least-squares regression, where the slope of the line is proportional to
the T2 or ADC. F-statistic analysis was performed to determine the best fit model. The Fstatistic tests the hypothesis that the biexponential model is statistically different than the
monoexponential model using the relationship:
F=
SSE ν E
,
SSF ν F
[9.6]
where SSF is the sum of squares and νF is the number of degrees of freedom for the biexponential model in Eq. [9.4] (the full model). SSE is the sum of squares and νE is the number of
degrees of freedom for the extra terms of the biexponential model as compared to the monoexponential model (SSE = SSmono – SSF). As the IR data transitions from biexponential to
monoexponential, the F-statistic (F in Eq. [9.6]) approaches zero, indicating that the mono-
205
exponential model is statistically equal to the biexponential model; therefore, the above hypothesis is not true and the monoexponential model is the most appropriate model. For the
spectroscopic ADC studies, the F-statistic was used to confirm that the monoexponential
model provided the best fit of the IR data (i.e., to prove that the TE was long enough to completely eliminate the EC signal).
9.5.3 ROI analysis of ADCz and ADCav Maps
ROI analysis of the ADCz and ADCav maps was performed to (1) confirm the spectroscopic
ADC measurements and (2) to select specific tissue regions for ROI analysis. A 10 pixel × 10
pixel × 2 pixel ROI (4 × 4 × 4 mm3) with the center coordinates derived from the spectroscopic experiment was analyzed on the ADCz images. The location of the ROI was chosen to
closely match the spectroscopic volume but was not corrected for differences due to resolution changes or EPI distortions. The large ADCz ROI was compared with the ADCs measured along the z-axis using spectroscopy. ADCav data was obtained from the average ADC
values from three orthogonal gradient orientations, which minimizes the confounding effects
of diffusion anisotropy in the brain. Finally, 3 pixels × 3 pixels × 1 pixel (1.2 × 1.2 × 2 mm3)
ROIs in the subcortical region on the 4th and 5th slices of ADCav maps were analyzed. All
ROI data is presented as the mean and standard deviation (σ). Statistical significance between animals was tested using a two-tailed t-test with p-values less than 0.05 considered
significant.
9.6 Results
9.6.1 CR Steady-State Equilibrium and Stability
206
The steady-state equilibrium and stability of the CR infusion was determined using T1- and
T2-weighted imaging sequences. Figure 9.1 shows a representative T1WI and a plot of the
signal intensity over time in an ROI (denoted by the white box). The overall signal intensity
of the T1WIs decreases during the period 0.5 hours to 2 hours post infusion as the CR
redistributes throughout the brain. The connectivity of the cerebral ventricles and pulsations
of CSF enhance CR mixing in the brain and allow CR diffusion to occur from both the inner
regions of the brain (i.e., the lateral ventricle where the infusion is performed) as well as
from the outer subarachnoid space. The figure inset plots the percent change in signal intensity in a 7 pixel × 7 pixel ROI in the subcortical tissue—approximately in the center of the
localized-volume for diffusion measurements. As the CR in the ventricular space is redistributed into the deeper regions of the brain, the signal intensity measured with the ROI decreases until it finally achieves a steady-state at approximately 3 hours.
Following the 2-hour infusion and 30 minute imaging preparation periods, significant dispersion of the CR may have already occurred; therefore, the infusion method was also evaluated by measuring the cerebral tissue T2 relaxation time from T2W-EPI in normal and ICVinfused animals. The normal T2 in subcortical ROIs measured from T2W-EPI was 75 ± 6 ms.
Two hours after ICV infusion of CR, the T2 measured from the same region of the brain was
58 ± 7 ms. Four hours after the infusion, following T2 and ADC spectroscopy and imaging,
the measured T2 within the ROI was 59 ± 7 ms.
9.6.2 TE-dependence of IR Curves
Localized DW-IRSE spectroscopy was performed on three animals to determine the TEdependence of the IR curves. In separate experiments, IR data were acquired at TE values of
207
13.6, 15, 20, 30, 50, and 80 ms at a constant diffusion-weighting. Each IR data set was fitted
with the mono- and biexponential equations, Eqs. [9.2] and [9.4], respectively, and F-statistic
analysis was performed to determine the most appropriate model for the data. The IR data
sets acquired at TE values equal to 13.6, 15, and 20 ms were best described mathematically
by the biexponential model (Eq. [9.4]). The data sets acquired at 30, 50, and 80 ms were most
appropriately fitted with the monoexponential model (Eq. [9.2]). This finding suggests that
using this infusion protocol, the relaxation times of the water in EC space have been sufficiently shortened such that, for echo times greater than 30 ms, the signal from the EC space
is sufficiently attenuated that it does not contribute significantly to the NMR signal. Figure
9.2 is a semi-log plot of the a representative set of IR data versus TE to compare the bi- and
monoexponential data models.
Percent Change in Signal Intensity
120%
100%
80%
60%
Experimental
Time Window
40%
20%
0%
0
1
2
3
Time [hours]
Figure 9.1. A representative T1WI and a plot of the signal intensity
overtime in a 7 pixel × 7 pixel subcortical ROI (denoted by the white
box). As the CR in the ventricular space is redistributed into the
deeper regions of the brain, the signal intensity measured with the
ROI decreases until it finally achieves a steady-state at
approximately 3 hours.
208
4
5
The T1 relaxation time constant measured using the monoexponential model (Eq. [9.2])
assumes a single contributing component or, more appropriately, a continuous distribution
relaxation time constants water molecules in similar environments. The change in this “bulk”
measure of T1 as a function of TE is shown in Fig. 9.3. Note that there is a significant change
in the T1 when the TE is varied from 13.6−30 ms, however, there is no significant difference
in the change in T1 measured at TEs of 30, 50, or 80 ms due to the removed contribution of
the fast-relaxing EC water.
20%
%∆T1 [%]
15%
10%
5%
0%
0
10
20
30
40
50
60
70
TE [ms]
Figure 9.3. The percent change in bulk T1 (%∆T1) as a function of
TE. There is a significant change in the T1 when the TE is varied
from 13.6−30 ms, however, there is no significant difference in the
change in T1 measured at TEs of 30, 50, or 80 ms. At short TEs, the
fast-relaxing EC water contributes significantly to the measured T1
value, which is the sum of the IC and EC signal components; however, as the TE is increased, the contribution the faster relaxing EC
water becomes increasingly attenuated.
209
80
TI [ms]
0
100
200
300
400
500
600
400
500
600
ln((M0-Mz)/2M0) [unitless]
0
-0.5
-1
-1.5
0
10 20 30 40 50
-2
-2.5
-3
-0.05
-0.15
-3.5 -0.25
-4 -0.35
TI [ms]
0
100
200
300
ln((M0-Mz)/2M0) [unitless]
0
-0.5
-1
0
-1.5
-2
10 20 30 40 50
0
-0.05
-0.1
-2.5
-3
-0.15
-0.2
Figure 9.2. Semi-log plots of the IR data fitted to the biexponential and monoexponential models. (a)
The DW-IRSE data set acquired at TE of 13.6 ms is best described by the biexponential model ().
The monoexponential model (· · ·) poorly describes the overall curvature, which indicates an error in
fitting for the relaxation time constant, and also increasingly deviates as the TI increases, which indicates a misestimation of M0. (b) The bi- and monoexponential fitted models ( and · · ·, respectively)
of the DW-IRSE data set acquired at TE of 80 ms are highly similar and overlap on the plot. In this
case, the biexponential model over fits the data, and the monoexponential model is most appropriate.
210
Table 9.1 summarizes the apparent values of T1, T2, and fractional contribution from the IR
data sets. The apparent T1 values calculated from the biexponential model are 48 ± 8 ms for
water in the fast-relaxing EC space and 235 ± 10 ms for water in the slow-relaxing IC space
(T1f and T1s in Eq. [9.4]). Changes in M ′0′f and M ′0′s from Eq. [9.4] plotted versus TE can be
used to estimate T2f and T2s, which were found to be 6 ± 2 ms and 46 ± 2 ms, respectively. It
is important to note that an EC T2 time constant, T2f, of 6 ms is consistent with the contention
that the EC signal is attenuated completely for TEs greater than 30 ms. Lastly, the fractional
contributions of M ′0′f and M ′0′s to the measured signals were calculated from Eq. [9.5]. The
fraction of the fast-relaxing EC signal, ff, was 0.20 ± 0.08, and thus the slow-relaxing IC signal, fs, fraction was 0.80 ± 0.08. These values correspond well with the known 0.8:0.2 ratio
of IC volume to EC volume in normal cerebral tissue.
T1 [ms]
T2 [ms]
Fraction [unitless]
IC space
235 ± 10
46 ± 2
0.80 ± 0.08
EC space
48 ± 8
6±2
0.20 ± 0.08
Table 9.1. The apparent values of T1, T2, and fractional contribution
from the DW-IRSE data sets. The apparent T1 values are calculated
from the biexponential model (T1f and T1s in Eq. [4]). Changes in
M ′0′f and M ′0′s from Eq. [9.4] plotted versus TE were used to
estimate T2f and T2s. The fractional contributions of M ′0′f and M ′0′s
to the measured signals were calculated from Eq. [9.5] and
correspond well with the known IC / EC volume fraction in normal
cerebral tissue.
9.6.3 Spectroscopic Experiments
Localized DW-IRSE spectroscopy was performed on four groups of five animals each to determine the ADC in normal rat brain, CR-enhanced rat brain, ischemic rat brain, and CR-
211
enhanced, ischemic rat brain. Table 9.2 contains the result of the spectroscopic experiments.
The ADC measured in the normal rat brain (Normal) from the subcortical volume was 0.90 ±
0.02 × 10⁻³ mm2/s. The ADC measured in the CR-enhanced rat brain (ICV) was 0.81 ± 0.05 ×
10-3 mm2/s. The ADC measured in the ischemic rat brain (MCAO) was 0.51 ± 0.02 × 10⁻³
mm2/s. The ADC measured in the CR-enhanced, ischemic rat brain (ICV+MCAO) was 0.53
± 0.07 × 10⁻³ mm2/s.
9.6.4 Imaging Experiments
Results of the DW-EPI are also shown in Table 9.2. 10 pixel × 10 pixel ROIs (4 × 4 mm2)
were chosen from the 4th and 5th slices (each 2 mm thick) of the calculated ADCz maps in the
same coordinate locations used for the localized spectroscopy. The ADCz measured in the
normal rat brain (Normal) from the volume was 0.81 ± 0.03 × 10⁻³ mm2/s. The ADCz measured in the CR-enhanced rat brain (ICV) was 0.75 ± 0.05 × 10⁻³ mm2/s. The ADCz measured
in the ischemic rat brain (MCAO) was 0.51 ± 0.04 × 10⁻³ mm2/s. The ADCz measured in the
CR-enhanced, ischemic rat brain (ICV+MCAO) was 0.52 ± 0.05 × 10⁻³ mm2/s.
Table 9.2 also shows the results of ROI analysis on ADCav maps using smaller ROIs (3
pixels × 3 pixels × 1 pixel or 1.2 × 1.2 × 2 mm3). The ADCav measured in the normal rat
brain (Normal) from the volume was 0.70 ± 0.05 × 10⁻³ mm2/s. The ADCav measured in the
CR-enhanced rat brain (ICV) was 0.69 ± 0.06 × 10⁻³ mm2/s. The ADCav measured in the
ischemic rat brain (MCAO) was 0.45 ± 0.06 × 10⁻³ mm2/s. The ADCav measured in the CRenhanced, ischemic rat brain (ICV+MCAO) was 0.44 ± 0.06 × 10⁻³ mm2/s.
212
Spectroscopic ADCz
[×
×10-3 mm2/s]
Imaging ADCz
[×
×10-3 mm2/s]
Imaging ADCav
[×
×10-3 mm2/s]
Normal Group
0.90 ± 0.02
0.81 ± 0.03
0.70 ± 0.05
ICV Group
0.81 ± 0.05
0.75 ± 0.05
0.69 ± 0.06
MCAO Group
0.51 ± 0.02
0.51 ± 0.04
0.45 ± 0.06
ICV+MCAO Group
0.53 ± 0.07
0.52 ± 0.05
0.44 ± 0.06
Table 9.2. Localized DW-IRSE spectroscopy and imaging ADC
values from four groups of five animals: normal rat brain (Normal),
CR-enhanced rat brain (ICV), ischemic rat brain (MCAO), and CRenhanced, ischemic rat brain (ICV+MCAO). In the spectroscopic experiments, the ADCz was calculated from the dependence of the
magnetization extracted from a series of inversion-recovery experiments on the b-value. In the imaging experiments, ADCz and ADCav
were calculated directly from the dependence of the magnetization
on the b-value.
9.7 Discussion
Since conventional MR data contains the combined signals from the IC and EC spaces, the
unique classification of IC and EC water characteristics is challenging. In this study, the apparent T1, T2, fractional contributions, and diffusion values in the IC and EC spaces of normal and ischemic rat brain were measured via selective reduction of the EC water signal by
ICV CR infusion. Direct infusion of the CR into the ventricular space was required because
CR injected intravascularly does not cross the blood-brain barrier into the EC space due to
the size and hydrophilicity of the Gd-HP-D0H3A complex. These features ensure that, once
in the EC space, the infused CR will remain in the EC space (i.e., it will not cross the cell
membrane into the IC space nor will it be cleared by the vasculature). Previously, we have
performed studies in a model yeast-cell system that demonstrate the use of CR-enhanced, dif-
213
fusion-weighted, inversion-recovery NMR for the separation of IC and EC apparent T1, T2,
fractional contributions, and diffusion values (Silva et al., in review).
The stability of the CR infusion was assessed in an initial study of three animals and during all subsequent experiments. During the initial experiments, high-resolution T1-weighted
imaging was performed in an attempt to correlate CR dispersion with signal intensity
changes on the images. Changes in tissue T1 following infusion of CR are consistent with the
isolation of CR to the EC space because intravascular CR (e.g., used for cerebral perfusion
studies) does not produce substantial changes in tissue T1. The initial studies indicated that
there was a sufficient time window of CR-stability during which other measurements could
be made. During all subsequent experiments, the presence and stability of the CR was assessed using T2W-EPI, which was performed immediately before and after T1 and diffusion
measurements. The T2W-EPIs of CR-enhanced brain were compared to the T2W-EPIs of
normal rat brain to verify that the CR was distributed uniformly throughout the brain. Further, T2W-EPIs acquired before diffusion measurements were compared to T2W-EPIs acquired immediately after diffusion measurements; no change in tissue T2 was used to confirm
that the CR-enhancement (and hence concentration) remained constant during the diffusion
experiments.
Classification of the acquired DW-IRSE data as either two- or one-compartment was
based on the results of F-statistic analysis and changes in the measured T1 relaxation time as
a function of TE. DW-IRSE data acquired at a TE greater than 30 ms were statistically best
described by the monoexponential model; whereas at shorter TEs, the data were best described by the biexponential (two-component) model. The measured data transitioned from
biexponential to monoexponential as the TE was increased as a result of T2-attenuation of the
214
fast-relaxing (CR-enhanced) EC NMR-visible water signal. In the semi-log plot of Fig. 9.2,
the IR data was fitted to both the biexponential and monoexponential models. The DW-IRSE
data set acquired at TE of 13.6 ms (•) was best described by the biexponential model ().
By contrast, the monoexponential model (· · ·) poorly described the overall curvature, indicating an error in fitting for the relaxation time constant, and increasing deviations with increasing TI, indicating a misestimation of M0. The bi- and monoexponential fitted models ( and
· · ·, respectively) of the DW-IRSE data set acquired at TE of 80 ms (×) were identical and
overlap on the plot. In this case, the biexponential model over fits the data, and the monoexponential model is most appropriate. As previously noted, for TE > 30 ms, the fast-relaxing
EC water signal was eliminated by T2, leaving only signal from the slower-relaxing IC space
to contribute to the measured NMR signal. A simple test of this hypothesis is that the slowrelaxing T1 (T1s) measured using the biexponential fit at short TEs (i.e., TE < 30 ms) should
match the T1 measured from the monoexponential fit at the longer TEs. In other words, when
the EC signal is sufficiently attenuated, the measured T1 should be statistically similar to T1s,
which we contend is the apparent IC T1 relaxation time. This contention was substantiated by
the result that the apparent T1s ( 235 ± 10 ms) was statistically identical to the monoexponentially fitted T1 value of 233 ± 21 ms.
The second method used to determine the TE-dependence of the DW-IRSE data sets was
to characterize the change in the T1 value fitted from the monoexponential model (Eq. [9.2])
as a function of TE. It was hypothesized that if the IR data sets were fitted to the monoexponential model regardless of the number of contributing components (i.e., measuring the
“bulk” T1), the contribution of the fast-relaxing EC water to the measured magnetization
would diminish as the TE increased due to T2 relaxation. At short TEs, the fast-relaxing EC
215
water contributes significantly to the measured T1 value, which is the sum of the IC and EC
signal components; however, as the TE is increased, the contribution of the faster relaxing
EC water becomes increasingly attenuated. At some TE value, the EC water would no longer
significantly contribute to the measured signal and the fitted bulk T1 value would no longer
exhibit a TE dependence. As seen in Fig. 9.3, the fitted T1 value increased (resulting in a
positive percent change) with increasing TE value due to the loss of signal from the fastrelaxing EC space. Data acquired at TE values less than 30 ms were significantly different (ttest, p < 0.05) from data acquired at TE values greater than 30 ms. Further, there was no statistical change in the data as the TE was changed from 30 to 80 ms. In other words, individually and collectively, all three animals showed significant T1 changes between TEs of 13.6
and 30 ms, but not between 30 and 80 ms. The increase in the variance of the percent change
in T1 at increasing TE values can be attributed to differences in the tissue CR concentration
for different animals. If the concentration of CR in the EC space is relatively high in one
animal, the percent change of T1 as a function of TE will be lower than the change in an animal with a relatively lower CR concentration. The change in T1 is a function of the initial
concentration of the CR in the tissue, which cannot be controlled; therefore, the variance increase is not unexpected. In each individual case, there was an appreciable change in T1 as a
function of TE with no change for TEs greater than 30 ms. We conclude from the information gathered from the F-statistic analysis and the percent change in T1 value that (for this
experimental protocol) the data acquired at a TE value greater than 30 ms consists of signal
only from IC water.
It is important to note that the values reported in Table 9.1 are apparent measures of the
actual T1, T2, and fractional contribution values, which are calculated in the presence of CR
216
and exchange, neither of which can be ignored. A recent study has suggested that the mean
intra- and extracellular pre-exchange lifetimes of water in rat cerebral tissue are 667 ms and
125 ms, respectively, which are longer than the timescale of these measurements, suggesting
that the effects of compartmental exchange are small (Quirk et al., 2001). The apparent T1
values of the EC (T1f) and IC (T1s) spaces (48 ± 8 ms and 235 ± 10 ms, respectively) are considerably shorter than the normal brain T1 values of 1040 ± 42 ms, which were measured
from the inversion-recovery data on normal rat brain. If, as hypothesized, the EC space contains primarily mobile water, it is not unreasonable to speculate that the IC T1 could be significantly shorter than the T1 of the EC space. However, the short extra-to-intracellular exchange time relative to the IC T1 relaxation time constant indicates that the IC T1 is coupled
to the relaxation rate of EC water and the exchange rate between the spaces. Similarly, the
apparent T2 values following ICV infusion of the CR are significantly reduced from normal
(Table 9.1). The apparent T2 of the EC space (T2f) was calculated from a 3-point fit of the
calculated magnetization ( M ′0′f ) from Eq. [9.4] to the 13.6, 15, and 20 ms TEs. Interestingly,
the F-statistic and percent change in T1 analyses suggest that the EC signal contribution is
attenuated by 30 ms, which is five times the T2f value of 6 ms.
The apparent T2 of the IC space (T2s) is significantly less than the normal T2 value in cerebral tissue, which was reported herein as approximately 75 ms. It is not surprising that the IC
value of T2 would be lower than the volume-averaged value given the high concentration of
macromolecules, the crowded cytoplasmic milieu, and the extensive cytoskeletal structure.
Water molecules experiencing the slowly fluctuating magnetic fields associated with these
structures would have an efficient T2 relaxation rate relative to the T2 of the EC space, which
contains primarily mobile water. Although the characteristics of MR CR are well described
217
in biological tissue, it would be difficult to estimate the specific relaxivity of the CR in the
EC, the concentration of the CR in the EC, or the intrinsic T2 of water in the EC space.
Therefore, from the data in this study, it would be imprudent to speculate on a true EC T2
value. Finally, it is important to note that the apparent fractional contributions of the IC space
accounts for 80% of the signal, which matches the known IC volume fraction of the normal
brain. Specifically, volume fraction measurements in rat brain have been performed using
ionopheric (Sykova et al., 1994) and electrical impedance methods (Verheul et al., 1994;
Schuier and Hossmann, 1980), and both approaches yield EC fractions of approximately 0.2
in healthy brain and 0.1 in ischemic tissue. Previous NMR attempts to separate the IC and EC
water properties, based on diffusion measurements alone, resulted in non-physiological fractional contribution estimates (Neindorf et al., 1996; Mulkern et al., 1999; Mulkern et al.,
2000). The fact that the fraction values obtained in these experiments are consistent with the
expected values adds confidence to the IC / EC compartmental assignments.
We hypothesize that sequence differences and misregistration of the ROI could account
for the ADCz value difference between the spectroscopic and imaging ADC data (0.90 ± 0.02
× 10-3 mm2/s versus 0.81 ± 0.03 × 10⁻³ mm2/s, respectively) of the Normal group (Table 9.2).
First, there could be a change in spin population between the data acquired with the DWIRSE and DW-EPI sequences due to differences in the TE (42.8 versus 74 ms, respectively).
Also, the acquisition mode of the two sequences is entirely different (half-echo spectroscopy
versus single-shot EPI) and the sensitivity of EPI to susceptibility could account for additional T2 signal loss. Lastly, the coordinates used for the imaging ROI exactly matched the
spectroscopic voxel coordinates, and no adjustments were made to the ROI location despite
differences in the sequences, resolution, acquisition method, and TE; therefore, it is not sur-
218
prising that there would be some discrepancy between the spectroscopically- and imagingderived ADCz values. Despite errors in the values, the changes in ADCz that occur between
the Normal and ICV (CR-enhanced) groups are consistent between spectroscopy and imaging
(10% and 7%, respectively). From the TE-dependence characteristics of the IR curve, we assume that the ADC values measured in the ICV group represent the ADC of water confined
to the IC space, and these results suggest that the water in the IC space is the major determinant of the overall ADC measured in cerebral tissue. Further, following ischemia, there was
no statistical difference between ADCz values in CR-free (MCAO group) and CR-enhanced
(ICV+MCAO) brains, and this conclusion is evident in both the spectroscopic and imaging
data (Table 9.2). These results are consistent with the conclusion that the ADC of the IC
space dominates the overall measure of ADC, presumably due to the significant fraction of
water within this space.
To minimize the confounding effects of anisotropy, ADCav maps were calculated and
compared to the spectroscopy and imaging ADCz results. Further, to ensure no CSF contamination from ventricular spaces and to remove comparison of different tissue types (i.e., subcortical and cortical), a 3 pixel × 3 pixel ROI in the caudoputamen was examined (results
shown in Table 9.2). The ADCav measured in the Normal and ICV groups (0.70 ± 0.05 × 10⁻³
mm2/s and 0.69 ± 0.06 × 10⁻³ mm2/s, respectively) favorably compared with previously reported ADCav values in rat brain (Benveniste et al., 1992; van Gelderen et al., 1994). Unlike
the spectroscopic and imaging ADCz diffusion measurements in this region of the brain, the
IC ADC (ICV group) matched the bulk ADC (i.e., combined IC and EC ADC). However, the
result that the IC ADC is the same as the bulk ADC continues to support the contention that
the water ADC of the IC space is the major determinate of overall ADC in rat brain tissue.
219
Lastly, there was no difference in the ADCav values in the ischemic rat brain (MCAO group)
or the CR-enhanced, ischemic rat brain (ICV+MCAO group) (Table 9.2). These data are consistent with the conclusion that the IC space dominates the overall ADC measurement and
the overall ADC change during cerebral ischemia.
Two of the three prominent theories regarding the ADC changes in cerebral tissue during
ischemia have suggested that changes in the ADC of water residing in the EC space may play
a role. Although the data presented herein suggest that the IC space is the major determinant
of the ADC characteristics, changes in the of EC water ADC may also contribute to the
measured decline in the volume-averaged ADC value. In other words, it is possible that the
EC ADC change during ischemia is significant, which is supported work by Duong et al.
(1998, 2001); however, the volume of water in the EC space is sufficiently small to limit its
contribution to the overall ADC.
Using basic assumptions, the EC ADC could be inferred from:
(ADC IC )(f IC )(%H 2 0 IC ) + (ADC EC )(f EC )(%H 2 0 EC ) = ADC ,
[9.7]
where ADC is the bulk measured ADC composed of contributions from IC ADC (ADCIC)
and EC ADC (ADCEC). Both the IC and EC spaces contribute to some fraction of the signal
(fIC and fEC, respectively) and each compartment has some percent water content (%H20IC
and %H20EC, respectively). Based on information from a standard cell physiology text, we
assumed that the IC space accounts for 80% of the tissue volume and is 70% water (of which
the remaining 30% is organelles and other microstructures) and that the EC space accounts
for the remaining 20% of the volume and is 100% water. Using the ADC values from the
ADCav imaging ROI, the EC water ADC value is calculated to be approximately 1.6 × 10⁻³
mm2/s. During ischemia, the EC ADC value can be estimate from Eq. [9.7] to be 1.3 × 10⁻³
220
mm2/s, which constitutes a 15% decline in the EC ADC value. This supports findings that
suggest that the EC ADC decline, albeit significant, does not matches the overall percent decline of the ADC measured during ischemia.
From the estimated EC ADC values, the tortuosity, λ, a parameter that describes the effect
of a restrictive environment on a diffusing species, can be calculated. The tortuosity of the
EC space can be calculated from λ2 = DEC / ADCEC, assuming the self-diffusion coefficient
(DEC) of water at 37°C is 3 × 10⁻³ mm2/s. Using an ADCEC of 1.6 × 10⁻³ mm2/s, the estimated
EC tortuosity was 1.4 for healthy brain, which corresponds reasonably to the λ values of 1.6
and 1.5 reported in the literature (Sykova et al., 1994; van der Toorn et al., 1996; Pfeuffer et
al., 1998). Specifically, van der Toorn et al. (1996) reported normal and ischemic EC
tortuosity values of 1.5 and 2.1, respectively, from 1H and 31P MR spectroscopy.
During ischemia, cytotoxic edema results in a decrease in the EC volume (i.e., fEC decreases) and a corresponding increase in the EC tortuosity. Although merely speculation, Eq.
[9.7] can be modified to reflect the tissue changes during ischemia. Following cytotoxic
edema, ionopheric and tissue resistance methods have demonstrated that the fIC:fEC changes
to approximately 0.9:0.1 (Sykova et al., 1994; Verheul et al., 1994; Schuier and Hossmann,
1980). Also, in the acute phase, the barrier function of the cellular membranes are intact, and
the EC space remains 100% water (%H20EC = 100%). Assuming that the shift of EC water to
the IC space is the only change to the IC space (i.e., there is no significant lose of cellular
materials during the acute ischemic phase), IC space water content increases linearly with the
volume increase (%H20IC ≈ 80%). From the ischemic IC and EC ADCav values and Eq. [9.7],
λ can be estimated at 1.5—lower than values reported by van der Toorn et al. (1996). The
idea that the EC ADC changes that occur in response to acute ischemia does not conflict with
221
the findings of this study, however, it may be that the considerably smaller volume of the EC
space could minimize its contribution to the overall changes.
To classify the measured ADC as the ADC of water diffusing in the IC space requires
consideration of the role of compartmental exchange and CR effects on the IC space. Twocompartment data modeling (e.g., biexponential diffusion attenuation or inversion-recovery)
implicitly assumes that the compartments are in slow exchange, i.e., during the diffusion time
the mixing between compartments is minimized. Fast (equilibrium) exchange of water molecules between the IC and the EC environments complicates the measurement of the absolute
(i.e., exchange-less) compartmental T1-relaxation times because mixing of the compartmental
water increases the number of molecules that contact the CR. Recent work by Quirk et al.
(2001) suggests (using a method similar to the one present herein) that the IC / EC water preexchange lifetime in healthy rat cerebral tissue is on the order of 100 ms, which is longer
than both the diffusion and echo times used in this study. Further, in model system studies, it
has been shown that the addition of a sufficient concentration of CR can move the system
from a fast-exchange regime toward a slow-exchange regime by reducing the relaxation time
of the signal from water in the EC space (Labadie et al., 1994; Landis et al., 1999; Donahue
et al., 1994). Although the absolute concentration of the CR in the EC space of the rat brain
following ICV infusion is difficult to estimate, the significant changes in tissue relaxation
times indicate the presence of the CR. The slow exchange condition is met when the compartmental exchange rate constant is much less than the difference between the relaxation
rate constants for the signals from the two compartments (Labadie et al., 1994; Landis et al.,
1999; Donahue et al., 1994). Quirk et al. (26) reported that the compartmental exchange rate
222
constant is less than 10 s-1, which is shorter that the apparent T1 relaxation rate constant difference of 16 s-1 between the IC and EC spaces.
Studies by Labadie et al. (1994) and Stanisz et al. (1998) have shown the efficacy of using
MR CRs to discriminate between the IC and EC water signals in a biological sample by virtue of their relaxation time differences. These studies demonstrated that the addition of the
CR alters the relaxation time constants (T1 and T2) of the EC water while remaining in the
EC space. These studies have used methods of compartmental separation based on T2 relaxation and diffusion in the presence of EC CR. Methods based on T2 are vulnerable to data artifacts caused by the sensitivity of T2 to bulk magnetic susceptibility effects and exchange effects as a result of the though-space effect of the EC CR on IC water across the cell membrane. The sensitivity of T2 in the presence of the CR may account for the non-physiological
compartmental volume fractions (Neindorf et al., 1996). Given that in the slow-exchange regime the T1 relaxation time of the water molecules in the IC space will not be altered by the
presence of CR in the EC space, methods based on CR-enhanced T1-relaxation separation do
not have the same drawbacks and should result in more accurate measurements of compartment relaxation times, diffusion coefficients, and volume fractions if water exchange is accounted for properly.
Using the nonmonoexponential behavior of the diffusion signal attenuation curve, early
work classified the two calculated diffusion coefficients to the ADC of the IC and EC spaces.
In a rat model, Neindorf et al. (1996) showed that for increasing b-values (up to 10,000
s/mm2) diffusion attenuation curves further deviated from monoexponentiality. Using a biexponential model, Neindorf et al. defined populations of fast- and slow-diffusing water molecules with ADC values of 0.83 ± 0.03 × 10⁻³ mm2/s and 1.68 ± 0.1 × 10⁻³ mm2/s, respec-
223
tively. The fast-diffusing component accounted for 80% ± 2% of the signal, which contradicts the hypothesis that the EC water ADC is considerable faster than the IC ADC. Assuming the validity of this hypothesis, Neindorf’s findings do not agree with the known IC / EC
fractions, which state that the IC space accounts for approximately 80% of cerebral tissue.
Mulkern et al. (1999, 2000) have performed several studies in human brain and have obtained similar results to Neindorf et al. Mulkern and colleagues ultimately concluded that although non-monoexponential diffusion attenuation was observed, evidence for diffusion
compartmentalization was inadequate. Clark and Le Bihan (2000) also have examined the
multi-exponential nature of the diffusion attenuation curve in human brain. These investigators demonstrated that the diffusion signal attenuation curves were more appropriately defined as biexponential rather than monoexponential using goodness-of-fit statistics. However,
the classification of non-monoexponentiality as compartmentalization rather than phenomenon is complex, especially since diffusion attenuation curves are sensitive to restrictions (tortuosity), compartmental exchange, chemical exchange (magnetization transfer), relaxation
time effects, and diffusion time. For instance, Helmer et al. (1995) demonstrated that nonmonoexponential diffusion attenuation occurs in single compartment samples (polystyrene
bead packs). Clark and Le Bihan (2000) suggested that bias introduced by T2 relaxation time
differences between IC and EC water and diffusion anisotropy could complicate the biexponential analysis and explain some of the volume fraction discrepancies. Similar discussion
can be found in Buckley et al. (1999), who performed high resolution imaging on rat hippocampal slices. These investigators quantified the ADC change following ouabain-induced
cell swelling in an attempt to model cytotoxic edema in vitro. Buckley et al. reported similar
volume fraction discrepancies, which they also suggested could be explained by T2 differ-
224
ences in the IC and EC spaces. They also noted, however, that some contribution to the volume fraction discrepancy could be attributed to partial volume effects caused by the surrounding perfusate and parameter misestimations due to the limited number of data points.
Despite the volume fraction discrepancy, Buckley et al. concluded that cellular swelling explains the reduction in the water ADC during acute cerebral ischemia. As mentioned, methods based directly on T2 and diffusion are limited by inherent sensitivities to susceptibility,
restriction, compartmental exchange, chemical exchange, relaxation time effects, and diffusion
measurement
parameters.
Separating
the
effects contributing to the non-
monoexponentiality of the diffusion signal attenuation curve from the effects contributing to
the volume fraction discrepancies would be very difficult in an experimental model wherein
all effects manifest similar behavior.
The data presented herein suggests that the majority of the ADC change observed during
acute cerebral ischemia is a result of changes in the IC space. Using 133Cs NMR, Neil et al.
(1996) concluded that changes associated with cellular injury could cause a reduction in IC
water diffusion that could account for the entire ADC change, assuming that cesium diffusion
accurately reflects intracellular diffusion. In work by Duong et al. (1998), both IC and EC
diffusion properties were evaluated with 2FDG-6P as a marker for water ADC. Assuming
that the molecular markers mimic the diffusion characteristics of water, Duong et al. concluded that both IC and EC ADCs decline by approximately 40% following permanent
global cerebral ischemia. Similarly, focal ischemia in rat brain results in a significant reduction in the ADCs of metabolites, including NAA, tCR, Cho (Wick et al., 1995; van der Toorn
et al., 1996). In this study, we have attempted to directly measure the ADC of IC water and
have arrived at the same conclusion as Neil, Duong, Wick, van der Toorn, and their associ-
225
ates: Although the ADC of EC water most likely changes as a result of water shift and increased tortuosity, the major determinate of the ADC change (and diffusion-weighted contrast) observed in cerebral ischemia is due to a reduction in the ADC of water in the IC space.
There is evidence that the IC contribution to the ADC is in part an active process. Wheatley
et al. (1985, 1991, 1993) found there exists an energy-dependent cytoplasmic streaming and
suggested that passive diffusion does not provide an adequate explanation for the complex
intracellular transport system required to maintain cell metabolic function. During ischemia,
the cascade of biochemical events may include loss of regulation of ionic pumps which in
turn cause cytotoxic edema as well as disruption of the IC cytoplasmic streaming process.
In recent work, we have also shown that the connection between ADC change and cellular
swelling may be more complex than previously theorized. In a transient ischemia rat model,
Li et al. (2002) demonstrated that the acute renormalization of ADC values is not associated
with corrected neuron and astrocyte morphology. Following 30-minutes of transient MCAO,
brain regions with significant ADC decline contained shrunken neurons and swollen astrocytes, as evaluated by hematoxylin-eosin staining. After reperfusion, the ADC renormalized
in the ischemic region, however, the cellular abnormalities were not resolved. In fact, the
percentage of abnormal neurons increased to 92 ± 2% from 47 ± 12% observed during
ischemia. Further, although the ADC in the ischemic region had returned to normal values,
both the nuclei and cytoplasm of the astrocytes were markedly swollen. This finding suggests
that the ADC change in acute ischemia may not be solely the result of cytotoxic edema,
which is consistent with the idea that the overall ADC changes are primarily associated with
changes in the ADC of the IC space.
226
In conclusion, using both spectroscopic and imaging MR techniques, we have attempted
to separate the IC and EC water diffusion coefficients based on differences in the compartmental T1 relaxation times in the presence of CR in the EC space. Based our the results, we
conclude that the major determinant of the equilibrium ADC value in rat cerebral tissue is the
water of the IC space, which accounts for approximately 80% of the tissue volume. Furthermore, during acute focal cerebral ischemia, the reduction of ADC that generates diffusionweighted contrast is primarily a result of a reduction of the ADC in the IC space. This finding
is consistent with previously published results but does conflict with other studies that have
suggested that changes in the EC space play a role in acute ADC reductions. Although it is
theoretically possible for significant EC ADC reductions to occur as a result of water loss
and restriction increases, this study suggests that the larger IC volume is more likely the major determinant of acute water ADC changes in ischemic brain tissue.
227
Chapter 10
Summary
The body of work spanned by the research in this dissertation focuses primarily on the
dynamic temporal and spatial characteristics of the apparent diffusion coefficient (ADC) of
brain water in a rat stroke model of transient ischemia. Secondarily, research efforts were
also directed towards the mechanism(s) governing cerebral water ADC changes during
ischemia. Although the use of diffusion-weighted magnetic resonance imaging (DWI) for the
detection and study of acute stroke is prevalent in the research and clinical world, there is
still substantial information to be learned about the method and the information acquired.
This dissertation aims to characterize both the progression of ischemia following temporary
occlusion via DWI, but also to employ histological techniques to further interpret the MRI
findings—specifically, towards a better understanding of ADC changes in diseased tissues.
Ultimately, it is the goal of this work and others that scientific research in animals may elucidate mechanisms of disease that can be used to detect, diagnose, evaluate, and treat human
disease.
The research presented in this dissertation demonstrates both the value and the limitations of diffusion analysis of transient cerebral ischemia. The seminal papers demonstrating
the value of DWI in animal stroke models (Moseley et al., 1990; Mintorovich et al., 1991;
Benveniste et al., 1992; Minematsu et al., 1992; van Gelderen et al., 1994) prompted similar
evaluation of human stroke (Warach et al., 1992); and, since, DWI has become a valuable
tool in stroke work. These initial studies also demonstrated that the ischemic lesion detected
by DWI is highly correlated with the tissues destined for infarction. This allows non-invasive
imaging to be used to monitor the temporal evolution of ischemia. More recent experiments
on transient ischemia in animals [which is analogous to transient ischemic attacks (TIA) in
humans] demonstrated that the evolution of the lesion as determined by DWI is dynamic and
229
complex (Mintorovitch et al., 1991; Minematsu et al., 1992; Davis et al., 1994; Li et al.,
1999). As explored by the research in this dissertation, the duration of the occlusion and the
region of brain damage significantly impact the chances of tissue survival. Further, the renormalization of ADC values following reperfusion is not necessarily permanent, and the
prediction of reversibly and irreversibly damaged pixels is limited by the intrinsic heterogeneity of water ADC values in normal rat brain.
In the study presented in Chapter 3, we studied DWI, PWI and T2 changes in eight rats
that were subjected to 30 minutes of MCAO. Imaging was performed during occlusion, immediately after reperfusion, 0.5, 1.0, 1.5, 12, 24, 48 and 72 hours after reperfusion. The goals
of this study were (1) to determine whether secondary ADC declines occur after recovery of
initially decreased ADC values, (2) to characterize the temporal and spatial evolution of the
in vivo ischemic lesions, and (3) to determine if secondary cerebral hypoperfusion contributes to the secondary ADC declines. The results presented in Chapter 3 demonstrated that
ADC recovery following 30 minutes of arterial occlusion is transient and that secondary
ADC reduction may occur following reperfusion, a finding consistent with other recent studies (Dijkhuizen et al., 1998; Thornton et al., 1998; van Bruggen et al., 1998). The transient
renormalization of ADC values is suggestive of the restoration of energy metabolism (Schutz
et al., 1973; Rehncrona et al., 1979; Hossmann et al., 1977; Eleff et al., 1991; Hossmann et
al., 1994); however, additional studies were required to better characterize the changes in the
MR parameters.
In a follow-up study (Chapter 4), our previous experiments [Li et al., 2000a (Chapter 3);
Li et al., 1999] were extended to evaluate ischemic progression following different durations
of transient ischemia using MRI (i.e., DWI, PWI, and T2WI) and histological analysis. Six-
230
teen rats were subjected to 10 minutes (n=7) or 30 minutes (n=7) of temporary MCAO, and
imaging was performed as in Chapter 3. Following the last MRI time point, the brains were
fixed, sectioned, stained with hematoxylin & eosin staining, and evaluated for neuronal necrosis. The first conclusion of this study was that the resolution of initial DWI lesions is permanent following 10 minutes of transient ischemia; however, the resolution of initial DWI
lesions is transient following 30 minutes of transient ischemia and may be followed by a secondary DWI lesion development. The second conclusion was that the permanent reversibility
of initial DWI lesions does not indicate a normal histological outcome. Conversely, selective
neuronal necrosis is seen in regions where the initial DWI lesions disappear permanently after reperfusion in both the 10- and 30-minute animal groups. As in the previous study (Chapter 3), it was concluded that renormalization of DWI hyperintensity is not necessarily permanent and does not necessarily correlate with complete tissue recovery. In addition, this study
suggests that DWI may not be sensitive enough to detect slight necrosis exhibited following
short periods of transient ischemia, which may be due to volume averaging of many abnormal and normal neurons in the image voxel. This finding may help to explain neurological
deficits in some patients who have normal DWI after cerebral ischemia (Ay et al., 1999) and
cognitive deficit in some patients who experience transient ischemic attacks (TIA) (Hénon et
al., 1999).
The data presented in Chapters 3 and 4 lacks the temporal resolution to accurately describe secondary ADC changes following 30 minutes of transient MCAO. In Chapter 5 of
this dissertation, a study is described wherein DWI, PWI, and T2WI were performed during
MCAO and every 30 minutes for a total of 12 hours after reperfusion (n=6). In another animal group, neurological outcomes were evaluated during MCAO, every 30 minutes for a to-
231
tal of 6 hours, and at 24 hours after reperfusion (n=8). The goal of this experiment was to
provide detailed information regarding both the temporal and spatial evolution of ADC
changes. As noted in previous studies, PWI abnormality was resolved immediately following
reperfusion and remained normal. Given the increased temporal resolution, we could isolate
the complete recovery of the ADC values (of regions with ADC value reduction during occlusion) to approximately 1 hour after reperfusion. Further, the renormalized ADC values
started to decrease secondarily at approximately 2.5 hours, accompanied by a delayed increase in T2 values by about 5 hours. The ADC-defined secondary lesion grew over time, and
at 12 hours the lesion size was 52% of the initial lesion (i.e., during occlusion). Further, as in
Chapter 4, histological evaluation demonstrated neuronal damage in the regions of secondary
ADC decline. Interestingly, complete resolution of neurological deficits was seen in one rat
at 1 hour, six rats between 2.5 and 6 hours after reperfusion, and no secondary neurological
deficits were observed at 24 hours. These data suggest that (1) a secondary ADC reduction
occurs as early as 2.5 hours after reperfusion, evolves in a slow fashion, and is associated
with neuronal injury; and (2) renormalization and secondary decline in ADC are not associated with neurological recovery and worsening, respectively.
The results presented in Chapters 3–5 suggest that recovery following transient ischemia
in rats and humans may not be permanent and may not represent damage-free brain tissue. It
is not clear why the neurological deficits improved or resolved at the time when secondary
injury, demonstrated by secondary ADC reduction, continued to evolve. Possible explanations for this discrepancy are gradual hyperactivation of remaining intact neurons in the
ischemic region or functional substitution by other neurons in the neighboring normal brain
regions as demonstrated by functional MRI in stroke patients (Cramer et al., 1997; Cramer et
232
al., 2000). Our results, along with others (Nakano et al., 1990; Garcia et al., 1995; Persson et
al., 1989), also show that all rats that experienced complete resolution of their neurological
deficits had some degree of neuronal injury. This suggests that patients with prolonged TIA
may have neuronal injury, as was recently documented by DWI (Kidwell et al., 1999), which
may underlie the pathogenesis of gradual cognitive deficits that occurred after TIA, although
the patients recovered from their neurological deficits after TIA (Hénon et al., 1999). Lastly,
the data presented in these chapters suggest that thrombolytic treatment alone may not entirely salvage ischemic brain tissue, as delayed ischemic injury may occur. Accordingly,
other therapeutic strategies directed against delayed ischemic injury may be desirable in
combination with thrombolytic therapy. These strategies might include scavenging free radicals, inhibiting excitotoxicity and calcium accumulation, targeting the apoptosis-inducing
genes, preventing release of the mitochondrial apoptogens, blocking mitochondrial permeability transition pore (Fiskum et al., 1999), and restoring function of the endoplasmic reticulum (Paschen and Doutheil, 1999).
In Chapter 6, the ADC and T2 data acquired in the study presented in Chapter 5 were
further explored to determine if the temporal and spatial evolution of acute ADC and T2 values could be employed to predict secondary tissue changes following reperfusion. In this
analysis, the ADC and T2 data (acquired at 26 time points over a 12-hour period) was used to
generate novel, composite maps of the tissue characteristics. Using the composite maps, statistical analysis was performed to determine if the changes in tissue ADC and T2 values were
predictive of the tissue condition at the end of the experiment. Ultimately, no statistical
measure could be found to accurately predict the tissue characteristics at 12 hours, and it was
concluded that acute ADC and T2 data may be limited for the prediction of infarction.
233
In future studies, other MR parameters could also benefit the classification of reversibly
or irreversibly damaged tissue either by the methods presented in this dissertation or using
multi-spectral MR analysis as proposed by Carano et al. (2000). One such parameter could
be the T1 relaxation time measured in the rotating frame of reference (T1ρ). Gröhn et al.
(2000) demonstrated that T1ρ values (as well as the dispersion of T1ρ values) remain elevated
despite the recovery of ADC values to normal following reperfusion in a transient occlusion
rat model. It is hypothesized that T1ρ is sensitive to the behavior of water associated with
macromolecules and that changes during acute cerebral ischemia (that are not well understood) persist despite reperfusion. It would be interesting to expand on Gröhn’s work and
evaluate the ADC and T1ρ following 30-minutes of transient cerebral ischemia to characterize
parameter changes during occlusion and following reperfusion for 12 hours to assess the T1ρ
changes during secondary ADC decline. If significant T1ρ changes can be quantified during
occlusion, it is possible that regions of T1ρ abnormality correlate with irreversibly damaged
tissues in the same way that chronic T2 elevation due to edema correlates with infarct.
Other future work could include some variation of the stroke model. For instance, David
et al. (1996) demonstrated that short periods of transient ischemia may provide some neuroprotective effect. In Chapter 4, it was shown that tissue recovery following 10 minutes of
ischemia is complete and permanent; however, 30 minutes of occlusion resulted in chronic
tissue damage. One future study could incorporate a 10-minute occlusion followed by permanent occlusion. It would be interesting to monitor the lesion progression and final lesion
volume as compared to permanent occlusion. Another study could combine two temporary
occlusion periods to determine if a short (10 minute) occlusion somehow alters the secondary
lesion development following a longer (30 minutes) period of occlusion.
234
The bridge between experiments conducted for the purpose of describing ADC changes
during transient ischemia (Chapters 3–5) and those conducted to explore the mechanisms
governing the ADC changes (Chapter 9) are performed in the study in Chapter 7. We performed experiments designed to determine if reperfusion-induced renormalization of initially
abnormal ADC values indicates reversal of cellular, morphological changes that occur during
acute ischemia. Rats were subjected to 30 minutes of middle cerebral artery occlusion without reperfusion (group A, n=6), with 1.5 hours of reperfusion (group B, n=6), or with 12
hours of reperfusion (group C, n=6). DWI and PWI were obtained at the end of occlusion
(groups A, B, and C), 1.5 hours (groups A, B, and C) and 12 hours after reperfusion (groups
A and C). Immediately after the final MRI study, the brains were fixed by cardiac perfusion
with 4% paraformaldehyde. Neuronal injury was evaluated on hematoxylin-eosin stained
sections, and astrocytic size was determined by the area of glial fibrillary acidic protein
(GFAP) plus S-100 expression. As presented within the chapter, the results of this study lead
to the conclusion that reperfusion-induced acute renormalization of ADC values is not associated with the complete reversal of neuronal shrinkage and astrocytic swelling that occurs
during ischemia. Conversely, the morphological changes of astrocytes and neurons progressively worsened over time, although ADC values showed a biphasic change. Further, the results support the hypothesis that ischemia-related ADC declines could be the result of the reduction of energy-dependent cytoplasmic motion (Neil et al., 1996; Wick et al., 1995; van
der Toorn et al., 1996; Duong et al., 1998; Dijkhuizen et al., 1999). It is reasonable to assume that the reperfusion-induced ADC renormalization in this study is likely due to energy
recovery; therefore, following reperfusion, the restoration of energy production is able to restore cytoplasmic movement results in a renormalization of ADC values. Further study will
235
be needed to demonstrate (1) if morphologically abnormal neurons and astrocytes are able to
restore energy production when blood flow is restored and (2) the dominant mechanism(s)
responsible for the ADC decline during ischemia.
The final papers in this dissertation (Chapter 8 and 9) delve into the measurement of
compartment ADC values and the mechanisms of ADC changes during acute cerebral ischemia. The model yeast-cell suspension was used to introduce a method of NMR signal separation via differences in the relaxation properties of water in the compartments. Specifically,
extracellular (EC) water doped with an MR contrast reagent (CR) will exhibit a significant
change in its T1 and T2 relaxation times, allowing the NMR signal from the EC space to be
separated from the intracellular (IC) signal. Following signal separation, the ADC values of
these regions can be calculated independently. Using CR in a yeast-cell suspension, we successfully demonstrated that this method can be used, first, to separate the NMR signal from
IC and EC compartments based on differences in the compartmental relaxation times and,
second, to calculated the compartment ADC values of the IC and EC water. The paper presented in Chapter 8 describes this method in detail such that future experiments in more
complex systems (e.g., the rat brain experiments presented in Chapter 9) could be performed
with clear understanding of the experimental considerations and issues.
Future work should be performed in this yeast-cell model and possibly in other multicompartment models (i.e., other in vitro biological cell systems) to determine the effects of
volume fractions, contrast reagent concentration, permeability, and NMR parameters, such as
diffusion and echo times. This work would further be benefited by computer simulations of
the parameters to supplement the experimental data. We embarked on creating multi-
236
dimensional Monte-Carlo simulations of restricted, multi-compartmental diffusion, and it is
my belief that valuable data can be gleaned from continued efforts in this arena.
Since conventional MR data contain the combined signals from the IC and EC spaces, it
is difficult to determine the separate roles of these two compartments to the overall changes
in water ADC during cerebral ischemia. At the time of this dissertation, no direct MR measurements of IC and EC water diffusion have been performed in vivo. Application of the
method described in Chapter 8 to the study of rat brain, which was presented in Chapter 9 of
this dissertation, required some modifications; however, the goal was the same, to separate
the IC and EC NMR signal contributions via relaxation time differences and measure the
compartmental diffusion coefficients of these spaces. One issue encountered with the in vivo
experiments was that the small EC volume fraction contributed very little to the measured
signal, complicating the biexponential analysis. Accordingly, the NMR pulse sequence parameters were adjusted to remove the small contribution of the EC water, leaving on the IC
water. ADC, T1, T2, and fraction measurements made in these experiments, compel us to
conclude that we had isolated the IC water, from which the EC properties could be inferred.
The results of this experiment somewhat contradict the most widely accepted hypotheses for
ADC changes during cerebral ischemia: (1) cellular swelling caused by disruption of the energy-dependent ionic equilibrium pumps results in an influx of fast-diffusing EC water to the
slow-diffusing IC space (Moseley et al., 1990; Benveniste et al., 1992; van Gelderen et al.,
1994; Zhong et al., 1993; Anderson et al., 1996); and (2) cellular swelling increases the tortuosity of EC diffusion paths resulting in a decrease in the measured ADC value (Sykova et
al., 1994; Latour et al., 1994; Norris et al., 1994; van der Toorn et al., 1996). It is also interesting to note that the histological results in Chapter 7 demonstrate significant cellular swell-
237
ing while the ADC is renormalized, and suggests that the contribution of cytotoxic edema to
the overall decline in the ADC value may be small. Although one mechanism may dominate
the ADC reduction observed during ischemia, it is more likely, given the complex factors
affecting the diffusion measurement as well as the dynamic progression of water ADC
changes during ischemia (highlighted in the transient ischemia studies), that the ADC change
results from a combination of all these mechanisms (Szafer et al., 1995a). The results presented herein support the findings of other researchers who have proposed that during
ischemic conditions energy-dependent IC microcirculation (cytoplasmic streaming) is halted,
resulting in a reduction in the IC water ADC (Neil et al., 1996; Wick et al., 1995; van der
Toorn et al., 1996; Duong et al., 1998).
In the future, additional work in in vivo biological tissue would be required to confirm
the conclusions in this dissertation. One such model that we have thought to explore is the IC
/ EC diffusion characteristics in muscle. An MR contrast reagent can be introduced intravenously to nephrectomized rats (to prevent clearance) to dope the EC space of muscle with the
contrast. This method is somewhat easier to perform than the intracerebroventricular injections performed in the experiments detailed in Chapter 9. In the doped-muscle model, the effects of contrast concentration, diffusion time, echo time, and ischemia can be studied. Ultimately, however, more experiments are required in the rat brain. I would expect research to
be directed to the improvement of the imaging protocol and the characterization of more
variables, such as contrast concentration, diffusion time, and echo time. Careful MR sequence and experimental optimization could allow future researchers ample signal-to-noise
as to simultaneously measure the NMR signals of the IC and EC spaces. In addition, it would
be extremely interesting to apply the study of compartmental ADC values to transient ische-
238
mia. One would hypothesize from the results present in Chapter 9 that the ischemic and postreperfusion ADC changes would likely be isolated to IC water, however, it would be informative to track the IC and EC contributions to the secondary ADC changes.
In conclusion, the work presented in this dissertation furthers the understanding of water
ADC, perfusion, and T2 characteristics in cerebral ischemia, especially following temporary
occlusion. Continued improvements in imaging and histological techniques in the future will
increase our understanding of the disease process. These advances, in conjunction with the
emergence of genetically modified animals and drug and gene therapies, will clarify disease
management in humans and, ultimately, lead to stroke management that will benefit patients
who suffer this disease.
239
References
Abe K, Aoki M, Kawagoe J, Yoshida T, Hattori A, Kogure K, Itoyama Y. Ischemic delayed
neuronal death: A mitochondrial hypothesis. Stroke 1995;26:1478–1489.
Anderson AW, Zhong J, Petroff OAC, Szafer A, Ransom BR, Prichard JW, Gore JC. Effects
of osmotically driven cell volume changes on diffusion-weighted imaging of the rat optic
nerve. Magn Reson Med 1996;35:162–167.
Andrasko J. Water diffusion permeability of human erythrocytes studied by a pulsed gradient
NMR technique. Biochim. Biophys. Acta 1976;428:304.
Assaf Y, Cohen Y. Non-mono-exponential attenuation of water and N-acetyl aspartate signals due to diffusion in brain tissue. J Magn Reson 1998;131:69–85.
Ay H, Buonanno FS, Rordorf G, Schaefer PW, Schwamm LH, Wu O, Gonzalez RG, Yamada K, Sorensen GA, Koroshetz WJ. Normal diffusion-weighted MRI during stroke-like
deficits. Neurology 1999;52:1784–1792.
Back T, Hoehn-Berlage M, Kohno K, Hossmann K-A. Diffusion NMR imaging in experimental stroke:correlation with cerebral metabolites. Stroke 1994;25:494–500.
Baird AE, Warach S. Magnetic resonance imaging of acute stroke. J Cereb Blood Flow Metab 1998;18: 583–609.
Baird AE, Dambrosia J, Janket S, Eichbaum Q, Chaves C, Silver B, Barber PA, Parsons M,
Darby D, Davis S, Caplan LR, Edelman RE, Warach S. A three-item scale for the early prediction of stroke recovery. Lancet 2001;357:2095–2099.
Bederson JB, Pitts LH, Germano SM, Nishimura MC, Davis RL, Bartkowski HM. Evaluation of 2,3,5-triphenyltetrazolium chloride as a stain for detection and quantification of experimental cerebral infarction in rats. Stroke 1986;17:1304–1308.
Benveniste H, Hedlund LW, Johnson GA. Mechanism of detection of acute cerebral ischemia in rats by diffusion-weighted magnetic resonance spectroscopy. Stroke 1992;23:746–
754.
Blumberg RM, Cady EB, Wigglesworth JS, McKenzie JE, Edwards AD. Relation between
delayed impairment of cerebral energy metabolism and infarction following transient focal
hypoxia-ischaemia in the developing brain. Exp Brain Res 1997;113:130–137.
Boyes BE, Kim SU, Lee V, and Sung SC. Immunohistochemical co-localization of S-100b
and the glial fibrillary acidic protein in rat brain. Neuroscience 1986;17:857–865.
Buckley DL, Bui JD, Phillips MI, Zelles T, Inglis BA, Plant HD, Blackband SJ. The effect of
ouabain on water diffusion in the rat hippocampal slice measured by high resolution NMR
imaging. Magn Reson Med 1999;41:137–142.
241
Busza AL, Allen KL, King MD, van Bruggen N, Williams SR, Gadian DG. Diffusionweighted imaging studies of cerebral ischemia in gerbils: Potential relevance to energy failure. Stroke 1992;23:1602–1612.
Callaghan PT. Principles of nuclear magnetic resonance microscopy. Oxford University
Press, New York, USA 1991.
Clark CA, Le Bihan D. Water diffusion compartmentation and anisotropy at high b values in
the human brain. Magn Reson Med 2000;44:852–859.
Cramer SC, Nelles G, Benson RR, Kaplan JD, Parker RA, Kwong KK, Kennedy DN, Finklestein SP, Rosen BR. A functional MRI study of subjects recovered from hemiparetic
stroke. Stroke 1997;28:2518–2527.
Cramer SC, Moore CI, Finklestein SP, Rosen BR. A pilot study of somatotopic mapping after cortical infarct. Stroke 2000;31:668–671.
Charriaut-Marlangue C, Margaill I, Represa A, Popovici T, Plotkine M, Ben-Ari Y. Apoptosis and necrosis after reversible focal ischemia: An in situ DNA fragmentation analysis. J
Cereb Blood Flow Metab 1996;16:186–194.
Choi DW. Excitotoxic cell death. J Neurobiol 1992;23:1261–1276.
Cowen B. Nuclear Magnetic Resonance and Relaxation. Cambridge University Press, Cambridge, England 1997.
Dardzinski BJ, Sotak CH, Fisher M, Hasegawa Y, Li L, Minematsu K. Apparent diffusion
coefficient mapping of experimental focal cerebral ischemia using diffusion-weighted echoplanar imaging. Magn Reson Med 1993;30:318–325.
David CA, Prado R, Dietrich WD. Cerebral protection by intermittent reperfusion during
temporary focal ischemia in the rat. J Neurosurg 1996;85:923–928.
Davis D, Ulatowski J, Eleff S, Izuta M, Mori S, Shungu D, van Zijl PCM. Rapid monitoring
of changes in water diffusion coefficients during reversible ischemia in cat and rat brain.
Magn Reson Med 1994;31:454–460.
Desmond PM, Lovell AC, Rawlinson AA, Parsons MW, Barber PA, Yang Q, Li T, Darby
DG, Gerraty RP, Davis SM, Tress BM. The value of apparent diffusion coefficient maps in
early cerebral ischemia. Am J Neuroradiol 2001;22:1260–1267.
Dijkhuizen RM, Knollema S, Bart van der Worp H, Ter Horst GJ, De Wildt DJ, Berkelbach
van der Sprenkel JW, Tulleken KAF, Nicolay K. Dynamics of cerebral tissue injury and perfusion after temporary hypoxia-ischemia in the rat: evidence for region-specific sensitivity
and delayed damage. Stroke 1998;29:695–704.
242
Dijkhuizen RM, de Graaf RA, Tulleken KAF, Nicolay K. Changes in the diffusion of water
and intracellular metabolites after excitotoxic injury and global ischemia in neonatal rat
brain. J Cereb Blood Flow Metab 1999;19:341–349.
Donahue KM, Burstein D, Manning WJ, Gray ML. Studies of Gd-DTPA relaxivity and proton exchange rates in tissue, Magn Reson Med 1994;32:66–76.
Du C, Hu R, Csernansky CA, Hsu CY, Choi DW. Very delayed infarction after mild focal
cerebral ischemia: A role for apoptosis? J Cereb Blood Flow Metab 1996;16:195–201.
Duong TQ, Ackerman JJH, Ying HS, Neil JJ. Evaluation of extra- and intracellular apparent
diffusion in normal and globally ischemic rat brain via 19F NMR. Magn Reson Med
1998;40:1–13.
Duong TQ, Sehy JV, Yablonskiy DA, Snider BJ, Ackerman JJH, Neil JJ. Extracellular apparent diffusion in rat brain. Magn Reson Med 2001;45:801–810.
Eleff SM, Maruki Y, Monsein LH, Traystman RJ, Bryan N, Koehler RC. Sodium, ATP, and
intracellular pH transients during reversible complete ischemia of dog cerebrum. Stroke
1991;22:233–241.
Farr RF and Allisy-Roberts PJ. Physics for Medical Imaging. W.B. Saunders Co., London,
England 1997.
Farrar TC and Becker ED. Pulse and Fourier transform NMR: introduction to theory and
methods. Academic Press, NY, USA 1971.
Fiskum G, Murphy AN, Beal MF. Mitochondria in neurodegeneration: Acute ischemia and
chronic neurodegenerative diseases. J Cereb Blood Flow Metab 1999;19:351–369.
Fujioka M, Taoka T, Hiramatsu K-I, Sakaguchi S, Sakaki T. Delayed ischemic hyperintensity on T1-weighted MRI in the caudoputamen and cerebral cortex of humans after spectacular shrinking deficit. Stroke 1999;30:1038–1042. (a)
Fujioka M, Taoka T, Matsuo Y, Hiramatsu K-I, Sakaki T. Novel brain ischemic changes on
MRI: delayed ischemic hyperintensity on T1-weighted images and selective neuronal death
in the caudoputamen of rats after brief focal ischemia. Stroke;1999:1043–1046. (b)
Gadian DG. NMR and its Applications to Living Systems. Oxford University Press, Oxford,
England 1995.
Garcia JH, Yoshida Y, Chen H, Li Y, Zhang ZG, Lian J, Chen S, Chopp M. Progression
from ischemic injury to infarct following middle cerebral artery occlusion in the rat. Am J
Pathol 1993;142:623–635.
243
Garcia JH, Wagner S, Liu K-F, Hu X-J. Neurological deficit and extent of neuronal necrosis
attributable to middle cerebral artery occlusion in rats: Statistical validation. Stroke
1995;26:627–635. (a)
Garcia JH, Liu K-F, Ho K-L. Neuronal necrosis after middle cerebral artery occlusion in
Wistar rats progresses at different time intervals in the caudoputamen and the cortex. Stroke
1995;26:636–643. (b)
Garcia JH, Lassen NA, Weiller C, Sperling B, Nakagawara J. Ischemic stroke and incomplete infarction. Stroke 1996;27:761–765.
Garcia JH, Liu K-F, Ye Z-R, Gutierrez JA. Incomplete infarct and delayed neuronal death
after transient middle cerebral artery occlusion in rats. Stroke 1997;28:2303–2310.
Green DR, Reed JC. Mitochondria and apoptosis. Science 1998;281:1309–1312.
Grohn OHJ, Kettunen MI, Makela HI, Penttonen M, Pitkanen A, Lukkarinen JA, Kauppinen
RA. Early detection of irreversible cerebral ischemia in the rat using dispersion of the magnetic resonance imaging relaxation time T1ρ. J. Cereb. Blood Flow Metab. 2000;20:1457–
1466.
González RG, Schaefer PW, Buonanno FS, Schwamm LH, Budzik RF, Rordorf G, Wang B,
Sorensen AG, Koroshetz WJ. Diffusion-weighted MR imaging: Diagnostic accuracy in patients imaged within 6 hours of stroke symptom onset. Radiology 1999;210:155–162.
Hamberg LM, Macfarlane R, Tasdemiroglu E, Boccalini P, Hunter GJ, Belliveau JW,
Moskowitz MA, Rosen BR. Measurement of cerebrovascular changes in cats after transient
ischemia using dynamic magnetic resonance imaging. Stroke 1993;24:444–451.
Han SS, Vétek G, Silva MD, Springer Jr. CS, Sotak CH, Apparent diffusion coefficients of
intra- and extracellular water in yeast suspensions measured by combined diffusion and relaxography, Proc. Int. Soc. Magn. Reson. Med. 1998;6:535.
Hasegawa Y, Fisher M, Latour LL, Dardzinski BJ, Sotak CH. MRI diffusion mapping of reversible and irreversible ischemic injury in focal brain ischemia. Neurology 1994;44:1484–
1490.
Hasegawa Y, Formato JE, Latour LL, Gutierrez JA, Liu K-F, Garcia JH, Sotak CH, Fisher
M. Severe transient hypoglycermia causes reversible changes in the apparent diffusion coefficient of water. Stroke 1996;27:1648–1656.
Heiss W-D, Graf R, Fujita T, Ohta K, Bauer B, Lottgen J, Wienhard K. Early detection of
irreversibly damaged ischemic tissue by flumazenil positron emission tomography in cats.
Stroke 1997;28:2045–2052.
244
Helmer KG, Dardzinski BJ, Sotak CH, The application of porous media theory to the investigation of time-dependent diffusion in in vivo systems, 1995;8:297–306.
Hénon H, Lebert F, Durieu I, Godefroy O, Lucas C, Pasquier F, Leys D. Confusional state in
stroke: relation to preexisting dementia, patient characteristics, and outcome. Stroke
1999;30:773–779.
Herbst MD and Goldstein JH, A review of water diffusion measurement by NMR in human
red blood cells, J. Physiol. 1989;256:C1097.
Hossmann K-A, Sakaki S, Zimmermann V. Cation activities in reversible ischemia of the cat
brain. Stroke 1977;8:77–81.
Hossmann K-A, Fischer M, Bockhorst K, Hoehn-Berlage M. NMR imaging of the apparent
diffusion coefficient (ADC) for the evaluation of metabolic suppression and recovery after
prolonged cerebral ischemia. J Cereb Blood Flow Metab 1994;14:723–731.
Ingvar M, Schmidt-Kastner R, Meller D. Immunohistochemical markers for neurons and astrocytes show pan-necrosis following infusion of high-dose NMDA into rat cortex. Exp Neurol 1994;128:249–259.
Kidwell CS, Alger JR, Di Salle F, Starkman S, Villablanca P, Bentson J, Saver JL. Diffusion
MRI in patients with transient ischemia attacks. Stroke 1999;30:1174–1180.
Kidwell CS, Saver JL, Mattiello J, Starkman S, Vinuela F, Duckwiler G, Gobin P, Jahan R,
Vespa P, Kalafut M, Alger JR. Thrombolytic reversal of acute human cerebral ischemic injury shown by diffusion/perfusion magnetic resonance imaging. Ann Neurol 2000;47:462–
469.
Kirsch JR, Traystman RJ. Anesthetic influences in animal ischemia models. In: Ginsberg
MD and Bogousslavsky J (eds). Cerebrovascular disease: pathophysiology, diagnosis, and
management. Malden: Blackwell Science. 1998;1:74–89.
Kitagawa K, Matsumoto M, Oda T, Niinobe M, Hata R, Handa N, Fukunaga R, Isaka Y, Kimura K, Maeda H. Free radical generation during brief period of cerebral ischemia may trigger delayed neuronal death. Neuroscience 1990;35:551–558.
Koizumi J, Yoshida Y, Nakazawa T, Ooneda G. Experimental studies of ischemic brain edema.
I: A new experimental model of cerebral embolism in rats in which recirculation can be introduced in the ischemic area. Jpn J Stroke 1986;8:1–8.
Kristián T, Siesjö BK. Calcium in ischemic cell death. Stroke 1998;29:705–718.
Kuroda S, Katsura K-I, Tsuchidate R, Siesjö BK. Secondary bioenergetic failure after transient focal ischaemia is due to mitochondrial injury. Acta Physiol Scand 1996;156:149–150.
245
Labadie C, Lee J–H, Vétek G, Springer Jr. CS. Relaxographic imaging. J Magn Reson B
1994;105:99–112.
Landis CS, Li X, Telang FW, Molina PE, Palyka I, Vétek G, Springer Jr. CS. Equilibrium
transcytolemmal water-exchange kinetics in skeletal muscle in vivo, Magn Reson Med
1999;42:467–478.
Lassen NA. Incomplete cerebral infarction-focal incomplete ischemia tissue necrosis not
leading to emollision. Stroke 1982;13:522–523.
Latour LL, Svoboda K, Mitra PP, Sotak CH. Time-dependent diffusion of water in biological
model system. Proc Natl Acad Sci USA 1994;91:1229–1233.
Le Bihan D, Breton E, Lallemand D, Grenier P, Cabanis E, Laval Jentet M. MR Imaging of
intravoxel incoherent motions: application to diffusion and perfusion in neurologic disorders.
Radiology 1986; 161:401–407.
Le Bihan D, Molecular diffusion nuclear resonance imaging, Magn. Reson. Q. 1991;7:1–30.
Lecouvet FE, Duprez TPJ, Raymackers JM, Peeters A, Cosnard G. Resolution of early diffusion-weighted and FLAIR MRI abnormalities in a patient with TIA. Neurology
1999;52:1085–1087.
Lee J-H, Labadie C, Springer Jr. CS, Harbison GS, Two-dimensional inverse Laplace transform NMR: Altered relaxation times allow detection of exchange correlation, J. Am. Chem.
Soc. 1993;115:7761.
Levy DE, van Uitert RL, Pike CL. Delayed postischemic hypoperfusion: a potentially damaging consequence of stroke. Neurology 1979;29:1245–1252.
Li F, Irie K, Anwer MS, Fisher M. Delayed triphenyltetrazolium chloride staining remains
useful for evaluating cerebral infarct volume in a rat stroke model. J Cereb Blood Flow Metab 1997;17:1132–1135. (a)
Li F, Carano RA, Meng X, Irie K, Sotak CH, Fisher M. The ischemic lesion volume determined by tracing the hyperintense border on diffusion-weighted imaging: Correlation with
the ADC-derived lesion volume and the final infarct volume in experimental rat stroke. Radiology 1997;205(p):362. (b)
Li F, Tatlisumak T, Han S, Sotak CH, Fisher M. Apparent diffusion coefficient maps and histological analysis of varying time periods of temporary focal brain ischemia in the rat. Stroke
1998;29:329. (a)
Li F, Han S, Tatlisumak T, Carano RAD, Irie K, Sotak CH, Fisher M. A new method to improve in-bore middle cerebral artery occlusion in rats: demonstration with diffusion- and perfusion-weighted imaging. Stroke 1998;29:1715–1720. (b)
246
Li F, Han SS, Tatlisumak T, Liu K-F, Garcia JH, Sotak CH, Fisher M. Reversal of acute apparent diffusion coefficient abnormalities and delayed neuronal death following transient focal brain ischemia in rats. Ann Neurol 1999;46:333–342.
Li F, Silva MD, Sotak CH, Fisher M. Temporal evolution of ischemic injury evaluated with
diffusion-, perfusion-, and T2-weighted MRI. Neurology 2000;54:689–696. (a)
Li F, Liu K-F, Silva MD, Omae T, Sotak CH, Fenstermacher JD, Fisher M. Transient and
Permanent Resolution of Ischemic Lesions on Diffusion-weighted Imaging after Brief Periods of Focal Ischemia in Rats: Correlation with Histopathology. Stroke 2000;31:946–954. (b)
Li F, Silva MD, Liu K-F, Helmer KG, Omae T, Fenstermacher JD, Sotak CH, Fisher M.
Secondary decline in apparent diffusion coefficient and neurological outcomes after a short
period of focal brain ischemia in rats. Ann Neurol 2000;48:236–244. (c)
Li F, Liu K-F, Silva MD, Meng X, Gerriets T, Helmer KG, Fenstermacher JD, Sotak CH,
Fisher M. Acute normalization of the apparent diffusion coefficient of water is not associated
with the reversal of astrocyte swelling and neuronal shrinkage. Am J Neuroradiol 2002, in
press.
Li Y, Chopp M, Jiang N, Zhang ZG, Zaloga C. Induction of DNA fragmentation after 10 to
120 minutes of focal cerebral ischemia in rats. Stroke 1995;26:1252–1258. (a)
Li Y, Chopp M, Jiang N, Yao F, Zaloga C. Temporal profile of in situ DNA fragmentation
after transient middle cerebral artery occlusion in the rat. J Cereb Blood Flow Metab
1995;15:389–397. (b)
Linnik MD, Zobrist RH, Hatfield MD. Evidence supporting a role for programmed cell death
in focal cerebral ischemia in rats. Stroke 1993;24:2002–2009.
Liu K-F, Li F, Tatlisumak T, Garcia JH, Sotak CH, Fisher M, Fenstermacher JD.. Regional
variations in the apparent diffusion coefficient and the intracellular distribution of water in
rat brain during acute focal ischemia. Stroke 2001;32:1897–1905.
Longa EZ, Weinstein PR, Carlson S, Cummins R. Reversible middle cerebral artery occlusion without craniectomy in rats. Stroke 1989;20:84–91 .
Lorek A, Takei Y, Cady EB, Wyatt JS, Penrice J, Edwards AD, Peebles D, Wylezinska M,
Owen-Reece H, Kirkbride V, Cooper CE, Aldridge RF, Roth SC, Brown G, Delpy DT, Reynolds EOR. Delayed (“secondary”) cerebral energy failure after acute hypoxia-ischemia in
the newborn piglet: Continuous 48-hour studies by phosphorus magnetic resonance spectroscopy. Pediatr Res 1994;36:699–706.
247
Ludwin SK, Kosek JC, Eng LF. The topographical distribution of S100 and GFA proteins in
the adult rat brain: an immunohistochemical study using horseradish peroxidase-labeled antibodies. J Comp Neurol 1976;165:197–207.
Lutsep HL, Albers GW, DeCrespigny A, Kamat GN, Marks MP, Moseley ME. Clinical utility of diffusion-weighted magnetic resonance imaging in the assessment of ischemic stroke.
Ann Neurol 1997;41:574–580.
MacManus JP, Linnik MD. Gene expression induced by cerebral ischemia: An apoptotic perspective. J Cereb Blood Flow Metab 1997;17:815–832.
Mancuso A, Karibe H, Rooney WD, Zarow GJ, Graham SH, Weiner MW, Weinstein PR.
Correlation of early reduction in the apparent diffusion coefficient of water with blood flow
reduction during middle cerebral artery occlusion in rats. Magn Reson Med 1995;34:368–377
Mancuso A, Nimura T, Weinstein PR. Prediction of delayed ischemic injury with diffusionweighted MRI following temporary middle cerebral artery occlusion in rats. Brain Res
1997;760:42–51
Marks MP, de Crespigny A, Lentz D, Enzmann DR, Albers GW, Moseley ME. Acute and
chronic stroke: Navigated spin-echo diffusion-weighted MR imaging. Radiology
1996;199:403–408.
Mattiello J, Basser PJ, Le Bihan D. Analytical expressions for the b-matrix in NMR diffusion
imaging and spectroscopy. J Magn Reson 1994;108A:131–141.
Meier P, Zierler KL. On the theory of the indicator-dilution method for measurement of
blood flow and volume. J Appl Physiol 1954; 6:731–744.
Memezawa H, Minamisawa H, Smith M-L, Siesjö BK. Ischemic penumbra in a model of reversible middle cerebral artery occlusion in the rat. Exp Brain Res 1992;89:67–78.
Minematsu K, Li L, Sotak CH, Davis MA, Fisher M. Reversible focal ischemic injury demonstrated by diffusion-weighted magnetic resonance imaging in rats. Stroke 1992;23:1304–
1311. (a)
Minematsu K, Li L, Fisher M, Sotak CH, Davis MA, Fiandaca MS. Diffusion-weighted
magnetic resonance imaging: rapid and quantitative detection of focal brain ischemia. Neurology 1992;42:235–240. (b)
Mintorovitch J, Moseley ME, Chileuitt L, Shimizu H, Cohen Y, Weinstein PR. Comparison
of diffusion- and T2-weighted MRI for the early detection of cerebral ischemia and reperfusion in rats. Magn Reson Med 1991;18:39–50.
248
Mintorovitch J, Yang GY, Shimizu H, Kucharczyk J, Chan PH, Weinstein PR. Diffusionweighted magnetic resonance imaging of acute focal cerebral ischemia: Comparison of signal
intensity with changes in brain water and Na+, K+-ATPase activity. J Cereb Blood Flow Metab 1994;14:332–336.
Miyasaka N, Kuroiwa T, Zhao FY, Nagaoka T, Akimoto H, Yamada I, Kubota T, Aso T.
Cerebral ischemic hypoxia: Discrepancy between apparent diffusion coefficient and hisotologic changes in rats. Radiology 2000;215:199–204.
Moseley ME, Cohen Y, Mintorovitch J, Mintorovitch J, Chileuitt L, Shimizu H, Kucharczyk
J, Wendland MF, Weinstein PR. Early detection of regional cerebral ischemia in cats: Comparison of diffusion- and T2-weighted MRI and spectroscopy. Magn Reson Med
1990;14:330–346. (a)
Moseley ME, Kucharczyk J, Mintorovitch J, Cohen Y, Kurhanewicz J, Derugin N, Asgari H,
Norman D. Diffusion-weighted MR imaging of acute stroke: Correlation with T2-weighted
and magnetic susceptibility-enhanced MR imaging in cats. AJNR 1990;11:423–429. (b)
Moseley ME, Vexler Z, Asgari HS, Mintorovitch J, Derugin N, Rocklage S, Kucharczyk J.
Comparison of Gd- and Dy-chelate for T2* contrast-enhanced imaging. Magn Reson Med
1991;22:259–264.
Mulkern RV, Gudbjartsson H, Westin C-F, Zengingonul HP, Gartner W, Guttmann CRG,
Robertson RL, Kyriakos W, Schwartz R, Holtzman D, Jolesz FA, Maier SE. Multicomponent apparent diffusion coefficients in human brain. NMR Biomed 1999;12:51–62.
Mulkern RV, Zengingonul HP, Robertson RL, Bogner P, Zou KH, Gudbjartsson H, Guttmann CRG, Holtzman D, Kyriakos W, Jolesz FA, Maier SE. Multi-component apparent diffusion coefficients in human brain: relationship to spin-lattice relaxation. Magn Reson Med
2000;44:292–300.
Müller TB, Haraldseth O, Jones RA, Sebastiani G, Godtliebsen F, Lindboe CF, Unsgård G.
Combined perfusion and diffusion-weighted magnetic resonance imaging in a rat model of
reversible middle cerebral artery occlusion. Stroke 1995;26:451–458.
Murphy AN, Fiskum G, Beal MF. Mitochondria in neurodegeneration: Bioenergetic function
in cell life and death. J Cereb Blood Flow Metab 1999;19:231–245.
Nakagawara J, Sperling B, Lassen NA. Incomplete brain infarction of reperfused cortex may
be quantitated with iomazenil. Stroke 1997;28:124–132.
Nakano S, Kogure K, Fujikura H. Ischemia-induced slowly progressive neuronal damage in
the rat brain. Neuroscience 1990;38:115–124.
Neil JJ, Duong TQ, Ackerman JJH. Evaluation of intracellular diffusion in normal and globally-ischemic rat brain via 133Cs NMR. Magn Reson Med 1996;35:329–335.
249
Neumann-Haefelin T, Kastrup A, de Crespigny A, Yenari MA, Ringer T, Sun GH, Moseley
ME. Serial MRI after transient focal cerebral ischemia in rats: Dynamics of tissue injury,
blood-brain barrier damage, and edema formation. Stroke 2000;31:1965–1973.
Niendorf T, Dijkhuizen RM, Norris DF, van Lookeren Campagne M, Nicolay K. Biexponential diffusion attenuation in various states of brain tissue: implications for diffusion-weighted
imaging. Magn Reson Med 1996;36:847–857.
Norris DG, Niendorf T, Liebfritz D. Healthy and infarcted brain tissue studies at short diffusion times: the origins of apparent restriction and the reduction in apparent diffusion coefficient. NMR Biomed 1994;7:304–310.
Olah L, Wecker S, Hoehn M. Secondary deterioration of apparent diffusion coefficient after
1-hour transient focal cerebral ischemia in rats. J Cereb Blood Flow Metab 2000;20:1474–
1482.
Oppenheim C, Samson Y, Manai R, Lalam T, Vandamme X, Crozier S, Srour A, Cornu P,
Dormont P, Rancurel G, Marsault C. Prediction of malignant middle cerebral artery infarction by diffusion-weighted imaging. Stroke 2000;31:2175–2181.
Pantano P, Caramia F, Bozzao L, Dieler C, von Kummer R. Delayed increase in infarct volume after cerebral ischemia: Correlation with thrombolytic treatment and clinical outcome.
Stroke 1999;30:502–507.
Pantoni L, Garcia JH, Gutierrez JA. Cerebral white matter is highly vulnerable to ischemia.
Stroke 1996;27:1641–1647.
Paschen W, Doutheil J. Disturbances of the functioning of endoplasmic reticulum: A key
mechanism underlying neuronal cell injury? J Cereb Blood Flow Metab 1999;19:1–18.
Paudler WW. Nuclear Magnetic Resonance: General Concepts and Applications. John Wiley
& Sons, NY, USA 1987.
Persson L, Hårdemark H-G, Bolander HG, Hillered L, Olsson Y. Neurologic and neuropathologic outcome after middle cerebral artery occlusion in rats. Stroke 1989;20:641–645.
Pfeuffer J, Dreher W, Sykova E, Leibfritz D. Water signal attenuation in diffusion-weighted
1
H NMR experiments during cerebral ischemia: influence of intracellular restrictions, extracellular tortuosity, and exchange. Magn Reson Imag 1998;16:1023–1032.
Pfeuffer J, Provencher SW, Gruetter R, Water diffusion in rat brain in vivo as detected at
very large b values is multicompartmental, Magn. Reson. Mater. Phys. Biol. Med. 1999;8:98.
250
Pierpaoli C, Alger JR, Righini A, Mattiello J, Dickerson R, Des Pres D, Barnett A, Di Chiro
G. High temporal resolution diffusion MRI of global cerebral ischemia and reperfusion. J
Cereb Blood Flow Metab 1996;16:892–905.
Provencher SW, A constrained regularization method for inverting data represented by linear
algebraic or integral equations, Comput. Phys. Commun. 27, 213 (1982). (a)
Provencher SW, A general purpose constrained regularization program for inverting noisy
linear algebraic and integral equations, Comput. Phys. Commun. 27, 229 (1982). (b)
Provencher SW and Dovi VG, Direct analysis of continuous relaxation spectra, J. Bioch.
Biophys. Meth. 1979;1:313.
Quirk JD, Bretthorst GL, Neil JJ, Ackerman JJH. Measurement of transmembrane water exchange rate for the in situ rat brain. Proc Intl Soc Mag Reson Med 2001;9:352.
Rehncrona S, Mela L, Siesjö BK. Recovery of brain mitochondrial function in the rat after
complete and incomplete cerebral ischemia. Stroke 1979;10:437–446.
Rordorf G, Koroshetz WJ, Copen WA, Cramer SC, Schaefer PW, Budzik RF, Jr, Schwamm
LH, Buonanno F, Sorensen AG, Gonzalez G. Regional ischemia and ischemic injury in patients with acute middle cerebral artery stroke as defined by early diffusion-weighted and
perfusion-weighted MRI. Stroke 1998;29:939–943.
Rosen BR, Belliveau JW, Vevea JM, Brady TJ. Perfusion imaging with NMR contrast
agents. Magn Reson Med 1990;14:249–265.
Roussel SA, van Bruggen N, King MD, Houseman J, Williams SR, Gadian DG. Monitoring
the initial expansion of focal ischemic changes by diffusion-weighted MRI using a remote
controlled method of occlusion, NMR Biomed 1994;7:21–28.
Sakoh M, Ostergaard L, Gjedde A, Rohl L, Bestergaard-Poulsen P, Smith DF, Le Bihan D,
Sakaki S, Gyldensted C. Prediction of tissue survival after middle cerebral artery occlusion
based on changes in the apparent diffusion of water. J Neurosurg 2001;95:450–458.
Salibi N and Brown MA. Clinical MR Spectroscopy. Wiley-Liss, NY, USA 1988.
Schmidt-Kastner R, Szymas J, Hossmann KA. Immunohistochemical study of glial reaction
and serum-protein extravasation in relation to neuronal damage in rat hippocampus ischemia.
Neuroscience 1990;38:527–540.
Schmidt-Kastner R, Wietasch K, Weigel H, Eysel UT. Immunohistochemical staining for
glial fibrillary acidic protein (GFAP) after deafferentation or ischemic infarction in rat visual
system: features of reactive and damaged astrocytes. Int J Dev Neurosci 1993;11:157–174.
Schuier FJ, Hossmann K-A. Experimental brain infarcts in cats. II. Ischemic brain edema.
Stroke 1980;11:593–601.
251
Schutz H, Silverstein PR, Vapalahti M, Bruce DA, Mela L, Langfitt TW. Brain mitochondrial function after ischemia and hypoxia: I. Ischemia induced by increased intracranial pressure. Arch Neurol 1973;29:408–416.
Sette G, Baron J-C, Young AR, Miyazawa H, Tillet I, Barré L, Travère J-M, Derlon J-M,
MacKenzie ET. In vivo mapping of brain benzodiazepine receptor changes by positron emission tomography after focal ischemia in the anesthetized baboon. Stroke 1993;24:2046–2058.
Sevick RJ, Kanda F, Mintorovitch J, Arieff AI, Kucharczyk J, Tsuruda JS, Norman D, Moseley ME. Cytotoxic brain edema: assessment with diffusion-weighted MR imaging. Radiology
1992;185:687–690.
Siesjö BK, Agardh CD, Bengtsson F. Free radicals and brain damage. Cerebrovasc Brain
Metab Rev. 1989;1:165–211.
Siesjö BK, Katsura K-I, Zhao Q, Folbergrova J, Pahlmark K, Siesjo P, Smith ML. Mechanisms of secondary brain damage in global and focal ischemia: A speculative synthesis. J
Neurotrauma 1995;12:943–956.
Siesjö BK, Hu B, Kristiàn T. Is the cell death pathway triggered by the mitochondrion or the
endoplasmic reticulum? J Cereb Blood Flow Metab 1999;19:19–26.
Silva MD, Han SS, Sotak CH, Effects of signal-to-noise and parametric limitations on fitting
biexponential magnetic resonance (MR) inversion-recovery curves using a constrained
nonlinear least squares algorithm, Proc. IEEE 24th Annual Northeast Bioeng. Conf. 1998;35.
Silva MD, Helmer KG, Lee J-H, Han SS, Springer CS, Sotak CH, Deconvolution of compartmental water diffusion coefficients in yeast-cell suspensions using combined T1 and diffusion measurements, J Magn Reson 2002, in press.
Silva MD, Omae T, Helmer KG, Li F, Fisher M, Sotak CH. Separating MR Changes of Intraand Extracellular Water in Focal Cerebral Ischemia in the Rat Brain. Magn Reson Med 2002,
in press.
Slichter CP. Principles of Magnetic Resonance. Springer-Verlag, Berlin, Germany 1980.
Sorensen AG, Copen WA, Østergaard L, Buonanno FS, Gonzalez RG, Rordorf G, Rosen BR,
Schwamm LH, Weisskoff RM, Koroshetz WJ. Hyperacute stroke: Simultaneous measurement of relative cerebral blood volume, relative cerebral blood flow, and mean tissue transit
time. Radiology 1999;210:519–527.
Stanisz GJ, Li JG, Wright GA, Henkelman RM, Water dynamics in human blood via combined measurements of T2 relaxation and diffusion in the presence of gadolinium, Magn
Reson Med 1998;39:223–233.
252
Sykova E, Svoboda J, Polak J, Chvatal A. Extracellular volume fraction and diffusion
characteristics during progressive ischemia and terminal anoxia in the spinal cord of the rat. J
Cereb Blood Flow 1994;14:301–311.
Szafer A, Zhong J, Gore JC. Theoretical model for water diffusion in tissues. Magn Reson
Med 1995;33:697–712. (a)
Szafer A, Zhong J, Anderson AW, Gore JC, Diffusion weighted imaging in tissues: theoretical models, NMR Biomed. 8, 289 (1995). (b)
Tanaka H, Araki M, Masuzawa T. Reaction of astrocytes in the gerbil hippocampus following transient ischemia: immunohistochemical observations with antibodies against glial fibrillary acidic protein, glutamine synthetase, and S-100 protein. Exp Neurol 1992;116:264–
274.
Tanner JE, Intracellular diffusion of water, Arch. Biochem. Biophys. 1983;224:416.
Thornton JS, Ordidge RJ, Penrice J, Cady EB, Amess PN, Punwani S, Clemence M, Wyatt
JS. Temporal and anatomical variations of brain water apparent diffusion coefficient in perinatal cerebral hypoxic-ischemic injury: Relationships to cerebral energy metabolism. Magn
Reson Med 1998;39:920–927.
Tominaga T, Kure S, Narisawa K, Yoshimoto T. Endonuclease activation following focal
ischemic injury in the rat brain. Brain Res 1993;608:21–26.
Trouard TP, Aiken NR, McGovern KA, Correlation of extracellular volume fraction and apparent diffusion coefficient in red blood cell suspensions via DWI and 31P MRS, Proc. Int.
Soc. Magn. Reson. Med. 1997;5:1331.
Tsuchidate R, He Q-P, Smith M-L, Siesjö BK. Regional cerebral blood flow during and after
2 hours middle cerebral artery occlusion in the rat. J Cereb Blood Flow Metab
1997;17:1066–1073.
Turner R, Le Bihan D. Single-shot diffusion imaging at 2.0 Tesla. J Magn Reson 1990;86:445–
452.
Tzika AA, Massoth RJ, Ball WS, Jr, Majumdar S, Dunn RS, Kirks DR. Cerebral perfusion in
child: detection with dynamic contrast-enhanced T2*-weighted MR images. Radiology
1993;187:449–458.
van Bruggen N, van Lookeren Campagne M, Thibodeaux H, Palmer JT, Williams S-P, Thomas GR. Evidence for delayed cerebral infarction following focal ischemia in the rat: A diffusion-weighted imaging study. Proc Int Soc Magn Reson Med 1998;2:1180.
van der Toorn A, Sykova E, Dijkhuizen RM, Vorisek I, Vargova L, Skobisova E, van Lookeren Campagne M, Reese T, Nicolay K. Dynamic changes in water ADC, energy metabo-
253
lism, extracellular space volume, and tortuosity in neonatal rat brain during global ischemia.
Magn Reson Med 1996;36:52–60. (a)
van der Toorn A, Dijkhuizen RM, Tulleken CAF, Nicolay K. Diffusion of metabolites in
normal and ischemic rat brain by localized 1H MRS. Magn Reson Med 1996;36:914–922. (b)
van Dorsten FA, Olàh L, Schwindt W, Grüne M, Uhlenküken U, Pillekamp F, Hossman KA, Hoehn M. Dynamic changes of ADC, perfusion, and NMR relaxation parameters in transient focal ischemia of rat brain. Magn Reson Med 2002;47:97–104.
van Everdingen KJ, van der Grond J, Kappelle LJ, Ramos LMP, Mali WPTM. Diffusionweighted magnetic resonance imaging in acute stroke. Stroke 1998;29:1783–1790.
van Gelderen P, de Vleeschouwer MHM, DesPres D, Parker J, van Zijl PCM, Moonen CTW.
Water diffusion and acute stroke. Magn Reson Med 1994;31:154–163.
van Lookeren Campagne M, Thomas GR, Thibodeaux H, Palmer JT, Williams SP, Lowe
DG, van Bruggen N. Secondary reduction in the apparent diffusion coefficient of water, increase in cerebral blood volume, and delayed neuronal death after middle cerebral artery occlusion and early reperfusion in the rat. J Cereb Blood Flow Metab 1999;19:1354–1364.
Verheul HB, Balázs R, Berkelbach van der Sprenkel JW, Tulleken CAF, Nicolay K, van
Lookeren Campagne M. Temporal evolution of NMDA-induced excitoxity in the neonatal rat
brain measured with 1H nuclear magnetic resonance imaging. Brain Res 1993;618:203–212.
Verheul HB, Balazs R, van der Sprenkel JWB, Tulleken CAF, Nicolay K, Tamminga KS,
van Lookeren Campagne M. Comparison of diffusion-weighted MRI with changes in cell
volume in a rat model of brain injury. NMR Biomed 1994;7:96–100.
Vétek G, Palyka I, Sotak CH, Springer CS, CR-free discrimination of intra- and extracellular
H2O signals from yeast cell suspensions by diffusion-space relaxography (diffusigraphy),
Proc. Soc. Magn. Reson. 1994;2:1051.
1
Vlaardingerbroek MR, den Boer JA. Magnetic resonance imaging: theory and practice.
Springer-Verlag, Berlin, Germany 1999.
Warach S, Chien D, Li W, Ronthal M, Edelman RR. Fast magnetic resonance diffusionweighted imaging of acute human stroke. Neurology 1992; 42: 1717–1723. (a)
Warach S, Li W, Ronthal M, Edelman RR. Acute cerebral ischemia: evaluation with dynamic contrast-enhanced MR imaging and MR angiography. Radiology 1992;182:41–47. (b)
Weisskoff RM, Chesler D, Boxerman JL, Rosen BR. Pitfalls in MR measurement of tissue
blood flow with intravascular tracers: Which mean transit time? Magn Reson Med
1993;29:553–559.
254
Wendland MF, White DL, Aicher KP, Tzika AA, Moseley ME. Detection with echo-planar
MR imaging of transit of susceptibility contrast medium in a rat model of regional brain ischemia. J Magn Reson Imaging 1991;1:285–292.
Wesbey GE, Moseley ME, Ehman RH, Translational molecular self-diffusion in magnetic
resonance image II: measurement of the self-diffusion coefficient, Invest. Radiol.
1984;19:491.
Wheatley DN. Mini-review: on the possible importance of an intracellular circulation. Life
Sci 1985;36:299–307.
Wheatley DN, Redfern A, Johonson RPC. Heat-induced disturbances of intracellular movement and the consistency of the aqueous cytoplasm in HeLa S-3 cells: a laser Doppler and
proton NMR study. Physiol Chem Phys Med 1991;23:199–216.
Wheatley DN, Malone PC. Heat conductance, diffusion theory, and intracellular metabolic
regulation. Biol Cell 1993;79:1–5.
Wick M, Nagatomo Y, Prielmeier F, Frahm J. Alteration of intracellular metabolite diffusion
in rat brain in vivo during ischemia and reperfusion. Stroke 1995;26:1930–1933.
Wittlich F, Kohno K, Mies G, Norris DG, Hoehn-Berlage M. Quantitative measurement of
regional blood flow with gadolinium diethylenetriaminepentaacetate bolus track NMR imaging in cerebral infarcts in rats: validation with the iodo[14C] antipyrine technique. Proc Natl
Acad Sci USA 1995;92:1846–1850.
Zarow GJ, Graham SH, Mintorovitch J, Chen J, Yang G, Weinstein PR. Diffusion-weighted
magnetic resonance imaging during brief focal cerebral ischemia and early reperfusion: Evolution of delayed infarction in rats. Neurol Res 1995;17:449–454.
Zhong J, Petroff OAC, Prichard JW, Gore JC. Changes in water diffusion and relaxation
properties of rat cerebrum during status epilepticus. Magn Reson Med 1993;30:241–246.
255
Curriculum Vitae
56 Harvard Street Extension #2
Natick, MA 01760
(508) 647 – 0694
[email protected]
EDUCATION
B.S.
Biomedical Engineering, Boston University, College of Engineering
M.E. Biomedical Engineering, Worcester Polytechnic Institute
January, 1997
May, 2000
Ph.D. Biomedical Engineering, Worcester Polytechnic Institute
February, 2002
Dissertation: NMR Characterization of Changes in the Apparent Diffusion
Coefficient of Water Following Transient Cerebral Ischemia
PROFESSIONAL EXPERIENCE
Research Assistant, Worcester Polytechnic Institute, Worcester, MA
1997 – present
− Applied magnetic resonance imaging and spectroscopy techniques for the
evaluation of cerebral ischemia in an animal stroke model, including:
• Characterization of the temporal and spatial evolution of gradual secondary
ischemia that may result following temporary occlusion in a rat model
• Separation of the intracellular and extracellular water apparent diffusion
coefficients and relaxation time constants in normal and ischemic rat brain
− Performed preclinical testing of stroke drug therapies for pharmaceutical industry
− MR pulse programming and data acquistion on a 2T, 45 cm bore magnet using a
GE CSI-II spectrometer and a Bruker Biospec ABX
− Custom image processing and analysis software developed using Interactive Data
Language (IDL), Matlab, and C
− Additional, notable projects include
• Rat spinal cord injury and repair
• Frog kidney fat deposition monitoring
• Charactization of aliginate and alginate-chondrocyte gels
• MRS of bone cement toxicity versus cure time
• 19F MRS characterization of biocompatible flourinated alginates
Graduate Teaching Assistant, Worcester Polytechnic Institute, Worcester, MA
− Responsible for lab classes related to NMR and image processing
− Assisted with undergraduate student Major Qualifying Projects
1997 – 2001
Senior Engineering Technician, Chiron Diagnostics (now Bayer), Walpole, MA 1996 – 1997
− Support and maintenance of a development-stage blood analysis instrument
− Developed protocols to test system reliability per concerns of the development
teams
257
− Assisted design engineers with data and ideas that facilitated development advances
− Represented the support engineering team in meetings to upper management
regarding system status, development of field engineer protocols, and in training of
international support engineers
Co-op Engineer, Kendall Healthcare, Mansfield, MA
1995 – 1996
− Full-time, in-school position in a medical instrumentation division
− Performed validation and calibration testing on leg compression sleeves and devices
used for the prevention of deep venous thrombosis
RECOGNITIONS AND MEMBERSHIP
− USDE GAANN Fellowship (completed Seminar on College Teaching)
− WPI Graduate GPA: 3.8/4.0
− Member of International Society of Magnetic Resonance in Medicine
1997 – 2002
1997 – 2002
1998 – 2002
PUBLICATIONS
1. Neuroprotective Effects of a Novel Broad Spectrum Cation Channel Blocker, LOE 908
MS, on Experimental Focal Ischemia: A Multispectral Study, F. Li, R.A.D. Carano, K.
Irie, T. Tatlisumak, M.D. Silva, U. Pschorn, C.H. Sotak, M. Fisher, J. Mag. Res. Imag.,
1999 Aug; 10 (2):138-145.
2. Temporal Evolution of Ischemic Injury Evaluated with Diffusion-, Perfusion-, and T2weighted MRI, F. Li, M.D. Silva, C.H. Sotak, M. Fisher, Neurology, 2000 Feb;
54(3):689-96.
3. Transient and Permanent Resolution of Ischemic Lesions on Diffusion-Weighted
Imaging After Brief Periods of Focal Ischemia in Rats: Correlation with
Histopathology, F. Li, K-F Liu, M.D. Silva, T. Omae, C.H. Sotak, J.D. Fenstermacher,
M. Fisher, Stroke, 2000 Apr; 31(4): 946-954.
4. Secondary Decline in the Apparent Diffusion Coefficient and Neurological Outcomes
After a Short Period of Focal Brain Ischemia in Rats, F. Li, M.D. Silva, K-F Liu, K.G.
Helmer, T. Omae, J.D. Fenstermacher, C.H. Sotak, M. Fisher, Ann. Neurol., 2000 Aug;
48(2): 236-244.
5. Multispectral Analysis of the Temporal Evolution of Cerebral Ischemia in the Rat
Brain, R.A.D. Carano, F. Li, K. Irie, K.G. Helmer, M.D. Silva, M. Fisher, C.H. Sotak,
J. Mag. Res. Imag., 2000 Dec; 12 (6): 842-58.
258
6. Acute Post-Ischemic Renormalization of the Apparent Diffusion Coefficient of Water
is not Associated with Reversal of Astrocytic Swelling and Neuronal Shrinkage, F. Li,
K-F Liu, M.D. Silva, X. Meng, T. Gerriets, K.G. Helmer, J.D. Fenstermacher, C.H.
Sotak, M. Fisher, Amer. J. Neurorad., 2001, in press.
7. Deconvolution of Compartmental Water Diffusion Coefficients in Yeast-cell
Suspensions Using Combined T1 and Diffusion Measurements, M.D. Silva, K.G.
Helmer, J-H. Lee, S.S. Han, C.S. Springer, C.H. Sotak, J. Magn. Reson. Imag., 2001, in
press.
8. Separating MR Changes of Intra- and Extracellular Water in Focal Cerebral Ischemia in
the Rat Brain, M.D. Silva, T. Omae, K.G. Helmer, F. Li, M.Fisher, C.H. Sotak, Magn.
Reson. Med., 2002, in press.
9. The Macrosphere Model − Evaluation of a New Stroke Model for Permanent Middle
Cerebral Artery Occlusion in Rats, T. Gerriets, M.D. Silva, F. Li, X. Meng, M.
Brevard, C.H. Sotak, M. Fisher, submitted to Stroke, 2002.
CONFERENCE PROCEEDINGS (PRESENTATIONS)
1. Deconvolution of Restriction Effects on Compartmental Diffusion Using Combined
Relaxography and Diffusion Measurements, S.S. Han, G. Vetek, M.D. Silva, C.S.
Springer, Jr., C.H. Sotak, Poster presentation at the 39th Experimental Nuclear
Magnetic Resonance Conference, Pacific Grove, CA, 1998.
2. Effects of Signal-to-Noise and Parametric Limitations on Fitting Biexponential
Magnetic Resonance (MR) Inversion-Recovery Curves Using a Constrained Nonlinear
Least Squares Algorithm, M.D. Silva, S.S. Han, C.H. Sotak, Oral presentation at the
IEEE 24th Annual Northeast Bioengineering Conference, Hershey, PA, 1998. Also
published Proc. IEEE 24th Annual Northeast Bioeng. Conf. 1998: 35-37.
3. Apparent Diffusion Coefficient of Intra- and Extracellular Water in Yeast Suspension
Measured by Combined Diffusion and Relaxography, S.S. Han, G. Vetek, M.D. Silva,
C.S. Springer, Jr., C.H. Sotak, Oral presentation at the International Society for
Magnetic Resonance in Medicine 6th Annual Meeting, Sydney, Australia, 1998. Also
published in Proc. Int. Soc. Magn. Reson. Med. 1998; 6: 535.
4. Temporal Evolution of Secondary Ischemic Injury in Transient Focal Brain Ischemia
Evaluated with Diffusion-, Perfusion-, and T2-weighted Imaging, F. Li, M.D. Silva, M.
Fisher, C.H. Sotak, Oral presentation at the 24th American Heart Association
International Stroke Conference, Nashville, TN, 1999. Also published in Stroke 1999;
30: 267.
259
5. Deconvolution of Restriction Effects on Compartmental Diffusion Using Combined
Relaxography and Diffusion Measurements: Comparison with Diffusigraphy, K.G.
Helmer, M.D. Silva, O. Mayzel-Oreg, C.H. Sotak, Poster presentation at the 40th
Experimental Nuclear Magnetic Resonance Conference, Orlando, FL, 1999.
6. The Temporal Evolution of the Secondary Water Apparent Diffusion Coefficient
Decline Following Transient Middle Cerebral Artery Occlusion in Rats, M.D. Silva, F.
Li, M. Fisher, C.H. Sotak, Oral presentation at the International Society for Magnetic
Resonance in Medicine 7th Annual Meeting, Philadelphia, PA, 1999. Also published in
Proc. Int. Soc. Magn. Reson. Med. 1999; 7: 52.
7. Diffusion Anisotropy Changes of Cerebral White and Gray Matter after Focal Cerebral
Ischemia in Rats, W.R. Schäbitz, M.D. Silva, F. Li, K. Irie, K.G. Helmer, C.H. Sotak,
M. Fisher, J. Cereb. Blood Flow Metab., 1999; 19 (suppl.)1:528.
8. Temporal Evolution of Reversibility of Ischemic Lesions on Diffusion-Weighted
Imaging: Correlation with Histopathology, F. Li, K-F Liu, M.D. Silva, T. Omae, C.H.
Sotak, J.D. Fenstermacher, M. Fisher, Poster presentation at the 25th American Heart
Association International Stroke Conference, New Orleans, LA, 2000. Also published
in Stroke 2000; 31: 340.
9. High-Temporal-Resolution Monitoring of Secondary Apparent Diffusion Coefficient
Decline Following Mild Focal Ischemia in Rats, F. Li, M.D. Silva, K-F Liu, K.G.
Helmer, J.D. Fenstermacher, C.H. Sotak, M. Fisher, Poster presentation at the 25th
American Heart A Association International Stroke Conference, New Orleans, LA,
2000. Also published in Stroke 2000; 31: 340.
10. The Relationships Between MRI-Measured Parameters and Brain Tissue Damage Are
Not Simple in a Rat Model of Brief Focal Ischemia, K-F Liu, F. Li, M.D. Silva, C.H.
Sotak, M. Fisher, J.D. Fenstermacher, Poster presentation at the 25th American Heart
Association International Stroke Conference, New Orleans, LA, 2000. Also published
in Stroke 2000; 31: 342.
11. Investigation of Techniques to Quantify In Vivo Lesion Volume on ADCav Maps By
Comparison to Histology in Stroke Studies of Rats, M. Kazemi, M.D. Silva, O.
Mayzel-Oreg, C.H. Sotak, Oral presentation at the International Society for Magnetic
Resonance in Medicine 8th Annual Meeting, Denver, CO, 2000. Also published in
Proc. Int. Soc. Magn. Reson. Med. 2000; 8: 474.
12. Temporal Evolution of Diffusion / Perfusion Mismatch in a Rat Stroke Model, T.
Omae, M.D. Silva, O. Mayzel-Oreg, M. Kazemi, F. Li, C.H. Sotak, M. Fisher, Poster
presentation at the 26th American Heart Association International Stroke Conference,
Ft. Lauderdale, FL, 2001. Also published in Stroke 2001; 32: 351.
260
13. Prediction of Secondary Ischemic Lesions with Diffusion-Weighted Imaging After
Transient Middle Cerebral Artery Occlusion in Rats, F. Li, M.D. Silva, X. Meng, C.H.
Sotak, M. Fisher, Poster presentation at at the 26th American Heart Association
Internation Stroke Conference, Ft. Lauderdale, FL, 2001. Also published in Stroke
2001; 32: 352.
14. Growth Pattern of Ischemic Lesions with Different Initial Volumes in a Permanent
Middle Cerebral Artery Occlusion Model, X. Meng, F. Li, M.D. Silva, C.H. Sotak, M.
Fisher, Poster presentation at the 26th American Heart Association International Stroke
Conference, Ft. Lauderdale, FL, 2001. Also published in Stroke 2001; 32: 356.
15. Evaluation of Stroke and Its Treatment using NMR Diffusion Measurements, C.H.
Sotak, R.A.D. Carano, M.D. Silva, K.G. Helmer, K. Irie, F. Li, M. Fisher, Oral
presentation at the 42nd Experimental NMR Spectroscopy Conference, Pacific Grove,
CA, 2001.
16. Acute Renormalization of the Apparent Diffusion Coefficient of Water and Cellular
Morphologic Changes, F. Li, K-F Liu, M.D. Silva, X. Meng, C.H. Sotak, J.D.
Fenstermacher, M. Fisher, Oral presentation at the American Society of
Neuroradiology, Boston, MA, 2001.
17. Separating MR Changes of Intra- and Extracellular Water in Focal Cerebral Ischemia in
the Rat Brain, M.D. Silva, T. Omae, K.G. Helmer, F. Li, M. Fisher, C.H. Sotak, Oral
presentation at the International Society for Magnetic Resonance in Medicine 9th
Annual Meeting, Glasgow, Scotland, 2001. Also published in Proc. Int. Soc. Magn.
Reson. Med. 2001; 9: 457.
18. Comparison of the Temporal and Spatial Evolution of the Water Apparent Diffusion
Coefficient and T2 Following Transient Middle Cerebral Artery Occlusion in Rats,
M.D. Silva, F. Li, K.G. Helmer, M. Fisher, C.H. Sotak, Oral presentation at the
International Society for Magnetic Resonance in Medicine 9th Annual Meeting,
Glasgow, Scotland, 2001. Also published in Proc. Int. Soc. Magn. Reson. Med. 2001; 9:
459.
19. Characterization of MR Lesion Development in a Macrosphere-Induced Embolic
Stroke Model, M.D. Silva, T. Gerriets, F. Li, M. Fisher, C.H. Sotak, Oral presentation
at the International Society for Magnetic Resonance in Medicine 9th Annual Meeting,
Glasgow, Scotland, 2001. Also published in Proc. Int. Soc. Magn. Reson. Med. 2001; 9:
353.
20. Cell Adhesion to RGD-Alginate is Modulated by Substrate Rigidity, N.G. Genes, M.D.
Silva, C.H. Sotak, L.J. Bonassar, Oral presentation at the ASME 2001 International
Mechanical Engineering Congress and Expositions, New York, NY, 2001. (Ph.D.
contest finalist)
261
21. Temporal Evolution of Ischemic Lesions on Diffusion- and Perfusion-weighted
Magnetic Resonance Imaging in an Embolic Ischemia Model, X. Meng, M.D. Silva, F.
Li, C.H. Sotak, M. Fisher, Oral presentation at the 27th American Heart Association
International Stroke Conference, San Antionio, Tx, 2002. Also published in Stroke
2002; 33: 222.
22. B0 dependence of Tρ relaxation in immobilized albumine and in vivo, H.I. Mäkelä,
M.D. Silva, O.H. J. Gröhn, C. Sotak, and R.A. Kauppinen, Poster presentation at the
International Society for Magnetic Resonance in Medicine 10th Annual Meeting,
Honolulu, Hawaii, 2002. Also published in Proc. Int. Soc. Magn. Reson. Med. 2002, in
press.
23. Characterization of Biocompatible Flourinated Alginates Using 19F NMR
Spectroscopy, E.C. Henning, M.D. Silva, M. Yalpani, C.H.Sotak, Poster presentation at
the 43rd Experimental NMR Spectroscopy Conference, Pacific Grove, CA, 2002.
MANUSCRIPTS IN PROGRESS
1. Comparison of the Temporal and Spatial Evolution of the Water Apparent Diffusion
Coefficient and T2 Following Transient Middle Cerebral Artery Occlusion in Rats,
M.D. Silva, F. Li, K.G. Helmer, M. Fisher, C.H. Sotak, in preparation.
2. Investigation of Techniques to Quantify In Vivo Lesion Volume Based on Comparison
of ADC Average Maps with Histology in Focal Cerebral Ischemia Studies of Rats, M.
Kazemi, M.D. Silva, F. Li, M. Fisher, C.H. Sotak, in preparation.
262


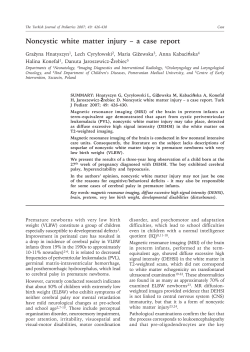


© Copyright 2026