
- Munich Personal RePEc Archive
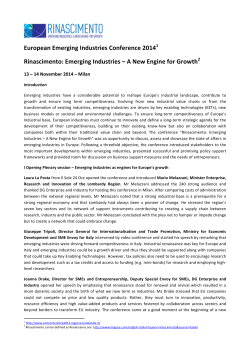
M PRA
Munich Personal RePEc Archive
The Diversification Potential Offered by
Emerging Markets in Recent Years
Silvio John Camilleri and Gabriella Galea
University of Malta
2009
Online at http://mpra.ub.uni-muenchen.de/62491/
MPRA Paper No. 62491, posted 3. March 2015 17:02 UTC
Suggested Citation:
Camilleri, S.J., and G. Galea, 2009, The Diversification Potential Offered by Emerging Markets
in Recent Years, The FEMA Research Bulletin, 1(3), 21-37.
The Diversification Potential Offered by Emerging Markets
in Recent Years
Silvio John Camilleri
Banking and Finance Department – FEMA, University of Malta
and
Gabriella Galea
Proprietary Operations Department, Bank of Valletta
The Diversification Potential Offered by Emerging Markets
in Recent Years
ABSTRACT
This paper investigates the diversification prospects which may be
reaped when investing in a mixture of emerging and developed
market assets. Given that emerging markets are somewhat distinct
from developed ones, one may expect significant diversification
potential and therefore risk reduction. Yet, the latter may be
counterbalanced by the fact that emerging markets usually present
higher risks when considered on their own; for instance higher price
volatility and fluctuating liquidity.
We use a panel data set spanning over a 10 year period and form a
number of portfolios. We find that over the sample period, emerging
market assets could be combined into efficient portfolios when
assessed in terms of risk and return. By contrast, portfolios involving
developed market assets tended to be inefficient.
We also investigate whether emerging markets have converged to
developed ones over the past years. When analysing co-movements
between indices, the correlation values suggest that emerging
markets have offered diversification potential. However we also find
evidence of features which make it more challenging to reap the
expected risk reduction benefits. The latter factors are the tendency
for emerging markets to exhibit a higher individual variability, and
the trend for markets to move more in line with each other as
suggested by convergence literature.
JEL Classification: F36, G11, G15.
Keywords: Emerging Securities Markets, Diversification, Portfolio
Selection, Volatility.
1
1. INTRODUCTION
Emerging markets continue to attract the attention of investors from all over the world.
Nowadays, many emerging market companies such as Samsung and Infosys are global players
and industry leaders. Emerging securities markets grew steadily during the last decades
witnessing increased portfolio flows, share of market capitalisation in world markets and
number of listings. Such trends are clearly visible in Asian markets (Ding and Charoenwong,
2006), and similar progress is evident in other emerging markets in Latin America, Eastern
Europe and North Africa. Portfolio investment in these markets was facilitated by the
pronounced increase in emerging country funds, fully automated trading and settlement
systems and liberalised access to foreign investors. A country is deemed “emerging” if its GDP
per capita is less than a designated threshold that is periodically revised by the World Bank.
The term conveys the idea that such economies “emerge” from less-developed status and join
the group of developed countries; a process known as convergence in development economics
(Bekaert and Harvey, 2002).
The main scope of this paper is to examine the potential for portfolio diversification when
investing in a mixture of assets from developed and emerging markets. Given that emerging
markets are somewhat distinct from developed ones, one may expect significant diversification
potential and therefore risk reduction. Yet, the latter may be counterbalanced by the fact that
emerging markets usually present higher risks when considered on their own; for instance
higher price volatility and fluctuating liquidity. This paper considers the comovements between
emerging and developed markets and delves into the risk-return combinations offered by
portfolios which include emerging market assets. We also investigate whether emerging
markets have converged to developed ones over the years. These issues are examined
through a panel data set consisting of daily index observations for eight markets: four of which
are emerging and the rest are developed ones. The data span over the 10 year period 1998 to
2007.
The rest of the paper is structured as follows. Section 2 summarises the issues relating to
diversification prospects offered by emerging markets and the risks inherent in such types of
investments. Section 3 describes the data and considers the correlations across markets.
Minimum variance portfolios are set up in Section 4. The performance of these portfolios is
analysed in terms of their risk-return trade-off. Section 5 investigates whether emerging
markets have moved more in line with developed ones in recent years, thus reducing the
diversification extent. Section 6 concludes.
2.
EMERGING MARKETS: RISKS, DIVERSIFICATION AND
INTEGRATION
The following is an overview of the literature relating to diversification through emerging
markets. Section 2.1 focuses on the risks which are typically associated with emerging
markets, whilst Section 2.2 presents basic concepts relating to diversification and how these
were investigated in the context of emerging markets. Section 3.3 tackles the issue of financial
integration and how this may affect diversification prospects.
2.1
Risks Inherent in Emerging Markets
2
One of the main advantages of investing in emerging markets is a higher return potential, on
the grounds that emerging economies tend to enjoy faster growth rates than developed ones
as outlined by Wilson (2006). Yet, high expected returns are usually associated with high risks.
Emerging market economies were subject to many crises in the past, particularly when balance
of payments problems and low international reserves made them prone to abrupt capital
outflows (White, 2007).
The risks relating to financial investment may differ in the context of emerging economies as
compared to developed ones, given that some kinds of risks may become pronounced in
emerging markets. Goriaev and Zabotkin (2006) in an empirical study of the Russian stock
market, noted that investors take account of both country and firm-specific risk, and securities
pricing is sensitive both to actual risks and to participants’ perceptions of such risks.
One salient risk relating to cross-border investment emanates from political factors. Research
shows that political risk is priced in emerging market securities (Bekaert et. al., 1997) and
emerging economies may reduce the cost of funds through reducing political risk. Whilst most
emerging economies implemented reforms to reduce political risk, other countries may still be
in need of more significant efforts to achieve this objective. For instance, Girard and Omran
(2007) considered the current state of various Arab capital markets and argued that
institutional reforms are needed to reduce political risk, such as curtailing corruption and
improving legal frameworks to ensure rule and contract enforceability. Further risks associated
with emerging market investments emanate from deficiencies of the broader legal and
regulatory setup such as lack of transparency and inadequate corporate governance practices.
The risks of emerging market investment may exacerbate during financial crises. Experience
shows that financial crises are usually caused by a variety of factors such as overvalued
exchange rates, bank balance sheets unprepared for financial or real asset volatility, and
deficiencies in financial system supervision. Emerging economies should therefore strive to
make their financial systems more resilient to external shocks through emphasising prudential
regulation and supervision and upgrading their settlement systems to make them less prone to
liquidity shocks. The former problems tend to be amplified by the tendency of portfolio
investors to withdraw funds at the first signs of financial distress, reducing liquidity in the
emerging economy and amplifying asset price volatility. In fact, Reynolds (2001) argued that
liberalisation has made emerging markets more vulnerable to global financial crises.
The overall risk of particular markets is often gauged by measuring volatility, and research has
also focused on the issue of whether liberalisation may lead to volatility changes. One may
argue that as speculative capital moves in and out of emerging markets, it may impact on
stock prices and induce higher volatility. Yet, one may also expect that as emerging markets
become integrated with their overseas counterparts, they should become more informationally
efficient, and therefore less prone to excess volatility. Research presents mixed evidence on
volatility changes following liberalisation; for instance Jayasuriya (2005) considered changes in
stock return volatility following liberalisation of eighteen emerging markets and found that
whether countries experience lower or increased volatility might depend on market
characteristics.
In particular, when markets allocate significant priorities to higher
transparency, investor protection and ancillary factors, they are likely to experience reduced
volatility. Cuñado et. al. (2006) analysed long-term time series for six emerging markets and
argued that past research might have overstated volatility changes. They concluded that
financial liberalisation might have reduced average volatility in these markets, whereas the
higher post-liberalisation volatility inferred by other researchers could have been due to
occasional large shocks.
3
2.2
Diversifying through Emerging Markets
The concept of diversification was formalised by Markowitz (1952) who published a model of
portfolio selection embodying diversification principles. The author showed that it is possible to
reduce the total risk of investment portfolios by mixing risky assets. The Markowitz (1952)
framework suggests that diversification reduces risk, except when the correlation between the
selected assets is equal to one. Despite this, if constraints are imposed on asset weightings
(e.g. they are restricted from taking negative values) it might not always be possible to obtain
a portfolio variance which is lower than that of the individual assets. In addition, subsequent
research by Fama (1965) and Samuelson (1967) shows that the risk reduction benefits of
diversification may be compromised by the characteristics of the underlying rates of return.
These authors extended the Markowitz (1952) framework to incorporate non-normal return
distributions, and obtained results which suggest that diversification may at times increase risk.
These notions are summarised in Los (2003; Chapter 12) and Los (2004).
The Markowitz (1952) framework was extended by Sharpe (1964), Lintner (1965) and Mossin
(1966) to include a risk free asset. Whilst risk-free assets are impossible to find in practice, a
short term treasury bill may be taken as an approximation. In this extension, commonly
known as the Capital Asset Pricing Model (CAPM), investors may reduce portfolio return
variability by holding a greater proportion of the risk-free asset in conjunction with a market
portfolio. The CAPM introduces an important distinction between firm-specific risks and
systematic risks. The former types of risks may be easily diversified away through a random
selection of stocks, since unsystematic risk is different across companies. Conversely,
systematic risks are common to the economy in general, and therefore may not be diversified
away given that all companies in the particular economy are exposed to such risks.
The main motive for international diversification is to take advantage of the low correlation
between stocks in different national markets. By diversifying across countries, investors may
possibly reduce their exposure to the systematic risks relating to their home economy. Such
risk reduction may be even more effective if investors diversify into countries which feature a
low correlation with the home country; and this is one main rationale behind mixing emerging
market assets with industrialised market ones. Despite this, given that some factors may
affect the global economy in general, an investor may never diversify away all risks.
Research has focused on whether holding emerging market assets in a portfolio may present
diversification benefits, given the risks which are peculiar to emerging markets discussed
above. Susmel (2001) confirmed the presence of fatter tails for Latin American market return
distribution, and this feature is particularly pronounced in case of the lower tail. This suggests
a higher tendency for large negative returns, as compared to a normal distribution. The author
found that including a portion of Latin American stocks in a US-based portfolio may reduce the
chance of the portfolio value to fall below a given value. Meyer and Rose (2003) investigated
whether diversification benefits may still be realised in the context of a financial crisis such as
the Asian crisis of the 1990s. The authors reported a tendency for increased correlations
across markets during the crisis, however diversification benefits were still attainable during the
crisis period.
Researchers have also tackled the issue that the effectiveness of diversification is typically
analysed using ex-post data whereas investors take portfolio decisions ex-ante. Shawky et. al.
(1997) noted that due to the time-changing correlations as between markets, it becomes
problematical to use past data in order to construct a suitably diversified portfolios. Fifield et.
al. (2002) investigated this issue by forming ex-ante portfolios based on forecasted
parameters, where the predictions were based on past data. Overall, the ex-ante portfolios did
not match the diversification benefits attained on the basis of ex-post data.
4
2.3
Integration of Emerging Markets with Developed Ones
Economic integration refers to decreased barriers to trading in goods and services. Financial
integration refers to reduced restrictions on capital flows and this implies that assets of
comparable risk in different countries should promise similar expected returns (Bekaert and
Harvey, 2000). In theory, liberalisation should bring about integration with the global capital
market; foreign investors bid up the prices of local stocks with diversification potential while
inefficient sectors are sidelined. This may imply changes in the cost of equity. Market
integration is a gradual process and the speed of the process is determined by the particular
circumstances of the country.
One reason why markets have become more integrated is that it is nowadays easier for
investors to purchase overseas assets, partly due to the growth in international asset
management business which was spurred by pension fund reforms. Stock market integration
implies that assets in different countries are increasingly subject to the same set of sentiments
and decisions. Higher correlations across assets may also be attributable to a new economic
environment where firms are more global and economies are more interlinked.
According to Purfield et. al. (2006), the correlation between global equity markets and Asian
ones has increased since the 1990s, and this trend seems representative of emerging markets
in general. Contrasting evidence was presented by Hunter (2006) who found no significant
evidence of integration between Latin American stock markets and international ones. The
degree of integration seems to change around crisis periods, a finding confirmed in various
papers such as Yang et. al. (2003) in the context of Asian stock markets. A detailed survey of
the theoretical and empirical literature relating to the integration of stock markets is found in
Kearney and Lucey (2004).
As markets become more integrated, the diversification prospects traditionally offered by
emerging economies may be reduced as returns become more correlated across markets.
Despite this, Li et. al. (2003) empirically found that the integration of world equity markets
does not wholly eliminate the expected benefits of diversification from the point of view of US
investors. Similar findings were reported by Miles (2005) who tested for cointegration between
US markets and emerging markets in Eastern Europe and Africa.
3. DATA DESCRIPTION
For the scope of this study we chose stock market indices representing eight countries: four of
which are emerging and the others constitute developed economies. In selecting the particular
countries, we choose indices representing various geographic regions including US, Europe,
Asia and Latin America. The choice of the specific indices was otherwise random. Data
comprises daily observations of the chosen indices for the ten-year period starting from 1st
January 1998 to 31st December 2007 – approximately 2500 observations for each index.
The selected indices are:
−
S&P 500 (United States): a capitalisation-weighted index comprising stocks of 500 largecap corporations trading on the New York Stock Exchange and Nasdaq;
5
−
−
−
−
−
−
−
FTSE 100 (United Kingdom): a capitalisation-weighted index of the largest 100
companies traded on the London Stock Exchange;
DAX (Germany): a total return index of 30 blue chip stocks traded on the Frankfurt
Stock Exchange;
Nikkei 225 (Japan): a price-weighted average of 225 top-rated Japanese companies
listed on the First Section of the Tokyo Stock Exchange;
Bovespa Index (Brazil): a volume-weighted index which includes the most liquid stocks
traded on the Sao Paulo Stock Exchange;
Shanghai SE Composite (China): a capitalisation-weighted index comprising A-shares
and B-shares listed on the Shanghai Stock Exchange;
Bolsa (Mexico): a capitalisation-weighted index of the leading stocks traded on the
Mexican Stock Exchange; and
RTS (Russia): a capitalisation-weighted index comprising fifty shares of the most highly
capitalised companies traded on the Russian Trading System.
The use of index data (rather than individual stock data) is worthy of further comment, given
that indices already represent some degree of diversification since they are comprised of a
number of stocks. In particular, one would expect that index portfolios diversify away firmspecific risks. This makes the use of index data appropriate for this research, since emerging
markets exposure may make particular sense when aiming to minimise the impacts of the
systemic risks which are common to developed economies. Theory would suggest that a
portfolio manager may easily diversify firm-specific risk by holding a random number of stocks
independent of their country of origin; thus the main aim of investing in emerging markets
would be to reduce the impact of those risks which are communal to industrialised countries.
As customary in finance research, the analysis is not conducted on the original observations
which tend to be non-stationary and may give rise to spurious regression results (Granger and
Newbold, 1974). We thus use log returns calculated as follows:
rt = log (Pt/Pt-1) = pt –pt-1
(Equation 1)
where Pt is the price level and pt = log Pt.
The mean and standard deviation values for each series are shown in Table 1 Panel A. The
standard deviations confirm that emerging markets tend to be more volatile than developed
ones. As a preliminary exercise, we also computed a correlation matrix to capture the degree
of association between the indices and gauge the extent to which the developed and emerging
markets fluctuate in the same direction. Correlation coefficients are shown in Table 1 Panel B
where the lower the correlation value, the higher the diversification opportunities between the
respective indices.
The table discloses a broad cross-section of correlation values: the highest correlation being
0.76 (FTSE and DAX) while the lowest correlations are associated with the Shanghai Index.
Most correlation values are positive (with the exception of the Shangai Index). Whilst negative
correlations present the highest diversification potential, it may not be easy to find negatively
correlated assets in practice. Despite this, positive correlations do not wipe out diversification
benefits as may be seen from the following formula of the variance of a two-asset portfolio,
which emanates from Markowitz (1952):
σ2P = a2σ2X + b2σ2Y + 2 ab ρX,Y σX σY
(Equation 2)
where σ2P is the portfolio variance, a and b are the weights invested in assets X and Y
respectively, σX is the standard deviation of asset X and ρX,Y is correlation between assets X
6
and Y. The risk of a portfolio is usually less than the risk of the individual assets since squaring
the weights will make them smaller (given that these are usually fractions of 1). Further
reduction may be obtained through the third term if the correlation is negative. In the extreme
case of a correlation value of minus one, risk may be reduced to zero by selecting the proper
asset weightings.
Table 1: Descriptive Statistics of the Sampled Indices
Panel A: Basic Statistics
Mean
Std. Devn.
DAX
FTSE
NIKKEI
S&P
BOVESPA
MEXBOL
RTS
SHANGAI
0.00025
0.016
0.00009
0.012
0.00001
0.014
0.00016
0.011
0.00073
0.022
0.00069
0.016
0.00069
0.026
0.00061
0.015
FTSE
NIKKEI
S&P
BOVESPA
MEXBOL
RTS
SHANGAI
1
0.26
0.46
0.34
0.41
0.34
-0.02
1
0.12
0.13
0.15
0.20
0.07
1
0.52
0.60
0.19
-0.02
1
0.57
0.25
0.02
1
0.27
0.00
1
0.00
1
Panel B: Correlation Matrix
DAX
FTSE
NIKKEI
S&P
BOVESPA
MEXBOL
RTS
SHANGAI
DAX
1
0.76
0.23
0.55
0.35
0.42
0.32
-0.02
The mean and standard deviation of the sampled indices are shown in Panel A.
Panel B shows the correlations among the indices. The upper shaded part represents portfolios
restricted to developed market assets (D-D). The unshaded part represents a mixture of developed
and emerging market assets (D-E). The lower shaded part represents portfolios restricted to
emerging market assets (E-E).
Taking the sampled indices into account, an investor may formulate three simple portfolio
strategies: investing exclusively in developed markets (D-D), a mixture of developed and
emerging market assets (D-E) and investing exclusively in emerging markets (E-E). As shown
in Table 1, the D-D strategy options are characterised by a maximum correlation value of 0.76
and a lowest one of 0.12. The D-E strategy presents a highest correlation value of 0.60 and a
minimum one of -0.02. In case of the E-E strategy the highest correlation value is 0.57 and
the lowest one is 0.00. This gives a preliminary indication that the emerging country indices
provided greater scope for diversification during the data period under review, although as
stated above this correlation effect may be outweighed by the tendency for emerging markets
to feature higher intrinsic volatility.
4. THE PERFORMANCE OF MINIMUM VARIANCE PORTFOLIOS
We now form minimum variance portfolios, in order to compare the risk-return characteristics
of emerging and developed market assets. For the sake of computational and interpretation
simplicity, we restrict the number of assets in each portfolio to two. Whilst such restriction
might not be realistic since fund managers typically invest in a wider range of assets, we
should keep in mind that each index comprises a number of stocks, implying that the portfolios
still represent a broad selection of assets. In addition, portfolios which involve a relatively wide
7
cross-section of markets with elaborate weighting strategies do not always present significant
diversification benefits, as reported by Kohers et. al. (1998).
Through our sample of eight indices, we may form a maximum of 28 (two-asset) portfolios: six
in the D-D category, another six in the E-E category, and a further sixteen in the D-E category.
Each possible combination is shown in Table 2. For each portfolio, the asset weightings are set
in such a way to obtain the lowest possible variance, given that one important objective behind
portfolio construction is to minimise variability. The minimum-variance portfolio weights as
given in Copeland et. al. (2005, pg117) are:
Wmin X =
σ 2Y − ρ XY σ X σ Y
σ 2 X + σ 2Y − 2 ρ XY σ X σ Y
(Equation 3)
Wmin Y = 1− Wmin X
(Equation 4)
where WminX and WminY represent the weightings allotted to assets X and Y in the minimum
variance portfolio.
The weighting to be invested in each index was restricted to take a value between zero and
one. This restriction was only necessary in the portfolio comprising FTSE and DAX where the
minimum variance weights were 1.03 and -0.03. The latter weightings imply a portfolio
strategy of shorting the DAX to invest further proceeds in FTSE. This may arise due to the
rather high correlation between the former indices. Given that fund managers do not typically
short assets (indeed they may face short-sale restrictions) the weights of this portfolio were
adjusted to a 100% investment in FTSE. The weightings for each portfolio are shown in Table
2, together with the mean daily return and standard deviation of each portfolio. For all
portfolios, the standard deviation is lower than the standard deviation of the more risky asset
in the particular portfolio.
The risk-return characteristics of each portfolio are presented in Figure 1, where the scatterplot shows that the two portfolios with the lowest variability are in the D-E category. Both of
these portfolios comprise the Shangai Index; and this may be attributed to the negative
correlation coefficients of the former index with that of the other respective indices.
As seen in Figure 1, the portfolios featuring emerging markets (D-E and E-E) have a higher
overall variability. Despite this, considering variability on its own, only tells half the story since
one should also analyse the returns realised on the portfolios. D-D portfolios offered the
lowest returns during the sample period. In this respect, if we imagine an efficient frontier
running through the upper portfolios, we note that D-D portfolios proved inefficient, and most
of the D-E portfolios proved inefficient as well. The scatter plot reveals that in our sample of
indices, investing in emerging market assets makes sense when considering risk-return
combinations (as customary in finance) however emerging market investments are not
necessarily desirable when considering risk on its own. This may be attributed to the higher
variability of the emerging market indices; volatility implies higher risk yet it also materialised in
higher returns during the sample period.
8
Table 2: Descriptive Statistics of the Minimum Variance Portfolios
Type
D-E
D-E
D-D
D-D
D-D
D-E
D-E
D-E
D-E
E-E
D-E
D-E
D-D
D-E
D-E
D-E
D-D
D-D
D-E
E-E
E-E
D-E
D-E
E-E
D-E
D-E
E-E
E-E
Component 1
Component 2
SHANGAI (0.36)
SHANGAI (0.37)
S&P (0.62)
S&P (0.52)
NIKKEI (0.37)
BOVESPA (0.28)
SHANGAI (0.46)
SHANGAI (0.51)
MEX (0.26)
SHANGAI (0.52)
RTS (0.11)
MEX (0.44)
S&P (0.18)
MEX (0.14)
BOVESPA (0.11)
BOVESPA (0.004)
NIKKEI (0.57)
FTSE (1.00)
RTS (0.05)
SHANGAI (0.68)
SHANGAI (0.25)
MEX (0.50)
RTS (0.17)
RTS (0.20)
BOVESPA (0.26)
RTS (0.18)
MEX (0.87)
RTS (0.52)
S&P (0.64)
FTSE (0.63)
NIKKEI (0.38)
FTSE (0.48)
FTSE (0.63)
NIKKEI (0.72)
NIKKEI (0.54)
DAX (0.49)
FTSE (0.74)
MEX (0.48)
S&P (0.89)
NIKKEI (0.56)
DAX (0.82)
S&P (0.86)
FTSE (0.89)
S&P (0.996)
DAX (0.43)
DAX (0.00)
FTSE (0.95)
BOVESPA (0.32)
RTS (0.75)
DAX (0.50)
NIKKEI (0.83)
MEX (0.80)
DAX (0.74)
DAX (0.82)
BOVESPA (0.13)
BOVESPA (0.48)
Mean Ret.
Std. Devn.
0.00030
0.00019
0.00004
0.00011
-0.00005
0.00017
0.00013
0.00039
0.00024
0.00057
0.00027
0.00014
0.00016
0.00016
0.00018
0.00021
0.00002
0.00009
0.00018
0.00064
0.00051
0.00046
0.00011
0.00070
0.00039
0.00035
0.00073
0.00078
0.0090
0.0091
0.0093
0.0097
0.0100
0.0101
0.0108
0.0108
0.0109
0.0110
0.0110
0.0111
0.0111
0.0112
0.0114
0.0114
0.0115
0.0116
0.0116
0.0126
0.0131
0.0132
0.0133
0.0146
0.0146
0.0150
0.0155
0.0190
The first column shows the portfolio type, and the next two columns show the
component indices of the portfolio and the respective weight of each index. The
mean and standard deviation of the daily returns of the portfolio are shown in the
subsequent columns. Portfolios are listed in ascending order of standard
deviation.
Overall, the results confirm that emerging markets are more volatile than developed ones,
since the standard deviations of D-E and E-E portfolios tend to be higher than those of D-D
ones. This limits the risk-reduction benefits which may materialise when investing in emerging
markets. The overall higher variability of emerging market assets is counterbalanced by the
fact that the developed country portfolios offered lower returns than emerging market ones.
9
Figure1: Minimum Variance Portfolios Scatter Plot
5. CHANGES IN COMOVEMENT LINKS BETWEEN MARKETS
We next inquire whether emerging markets tended to move more in line with developed ones
in recent years, as suggested by financial integration literature (Bekaert and Harvey, 1997;
Chelley-Steeley, 2005; and Purfield et. al., 2006). We investigated this issue by splitting the
sample period into two: 1998-2002 and 2003-2007. We then estimated OLS regression models
with a developed market as independent variable and an emerging market as the dependent
variable. This follows the assumption that developed markets tend to influence emerging
markets to a higher degree, as compared to the reverse relationship. (In practice one cannot
rule out the possibility that both types of markets influence each other; yet this does not affect
the inferences of our results).
We thus estimated the model:
Yi = β0 + β1Xi +ei
(Equation 5)
where Yi denotes the emerging market index, Xi is the developed market index and ei is the
error term. Combining each developed market with an emerging market in the same model,
yields 16 possible groupings. Two models were estimated with respect to each combination
(using the two sub-sample periods). Results for the 32 estimations are summarised in Table 3.
When looking at the coefficients and t-ratios for the β1 estimates, we confirm the tendency for
the markets to move more in line with each other. The only exceptions are the combinations
of: S&P500 – RTS and DAX – RTS. We also conducted a paired two sample t-test for means
on the t-ratios of β1, in order to check whether the difference between these ratios across the
periods is significant. The t-test rejected the hypothesis of no difference between the t-ratios
for the two sub periods at the 99% level of confidence, confirming a significant tendency for
markets to move more in line with each other. This suggests that the diversification prospects
which were traditionally sought through emerging markets are becoming less obvious.
10
Table 3: Summary of Regression Estimates
Dependent
Variable
Period
β0
t-ratio
Β1
t-ratio
R-Squared
0.21
2.18
0.34
2.33
0.47
3.21
-0.25
2.40
0.9066
1.2083
-0.0480
0.0566
0.8082
0.8727
0.4270
0.3451
18.67
26.93
-1.51
1.06
25.41
27.97
6.25
5.75
0.225
0.376
0.002
0.001
0.347
0.389
0.032
0.027
0.0003
0.0011
0.0001
0.0010
0.0002
0.0010
-0.0001
0.0011
0.37
2.52
0.25
2.31
0.46
3.32
-0.09
2.32
0.5802
0.7319
-0.0555
0.0660
0.5261
0.5977
0.7882
0.6724
10.94
15.27
-1.74
1.31
14.43
18.30
12.24
12.91
0.090
0.162
0.003
0.001
0.146
0.213
0.111
0.122
0.0003
0.0009
0.0001
0.0010
0.0002
0.0009
-0.0002
0.0011
0.38
2.12
0.26
2.29
0.49
3.07
-0.21
2.21
0.4440
0.5285
-0.0258
0.0399
0.3998
0.4310
0.5572
0.4051
11.55
14.96
-1.10
1.07
15.02
17.72
11.66
10.12
0.099
0.154
0.001
0.001
0.155
0.201
0.101
0.078
-0.49
2.22
0.19
2.07
-0.28
3.15
-0.25
2.36
0.1708
0.2591
0.0506
0.1717
0.1673
0.1799
0.3652
0.3320
3.78
6.58
1.86
4.56
4.97
6.48
6.27
8.05
0.012
0.036
0.003
0.018
0.020
0.034
0.032
0.052
Observations
Independent Variable: S&P 500
Bovespa
Shangai Comp
Bolsa
RTS
98-02
03-07
98-02
03-07
98-02
03-07
98-02
03-07
1202
1206
1157
1170
1219
1229
1198
1195
0.0001
0.0008
0.0001
0.0010
0.0002
0.0008
-0.0002
0.0012
Independent Variable: FTSE 100
Bovespa
Shangai Comp
Bolsa
RTS
98-02
03-07
98-02
03-07
98-02
03-07
98-02
03-07
1207
1212
1165
1179
1223
1236
1207
1204
Independent Variable: DAX
Bovespa
Shangai Comp
Bolsa
RTS
98-02
03-07
98-02
03-07
98-02
03-07
98-02
03-07
1221
1230
1168
1186
1229
1248
1211
1213
Independent Variable: NIKKEI
Bovespa
Shangai Comp
Bolsa
RTS
98-02
03-07
98-02
03-07
98-02
03-07
98-02
03-07
1172
1171
1146
1156
1189
1195
1184
1179
-0.0004
0.0010
0.0001
0.0009
-0.0001
0.0010
-0.0002
0.0012
The table summarises the results obtained when the returns of emerging market indices were regressed
on developed market returns as an independent variable. Two estimations were conducted for each
possible grouping using the sub-periods 1998-2002 and 2003-2007.
The increased comovement between emerging and developed countries may be mainly
attributed to globalisation and market integration. Lower restrictions on capital flows, more
efficient trading systems, information availability and cross-border trading are making it easier
for larger companies to cross-list abroad. Profits across countries become more highly
correlated as a result of the increase of cross-border mergers and acquisitions.
11
6. CONCLUSION
This paper investigated the diversification prospects which may be reaped when investing in a
mixture of emerging and developed market assets. The sampled emerging market indices
exhibited positive correlations with those of developed markets – the only exception being
Shangai Index which was negatively correlated with S&P500, FTSE and DAX. Whilst
diversification prospects are enhanced when correlation coefficients are negative, positive
correlations do not imply the absence of any diversification potential. We thus formed
minimum variance portfolios and found that over the sample period, emerging market assets
could be combined into two-asset portfolios which are efficient when assessed in terms of risk
and return. Most portfolios which included developed market assets proved inefficient. The
finding that emerging markets present diversification benefits becomes more significant when
we consider that this analysis was conducted on index data (rather than on individual stock
data). In particular, we may assume the absence of firm-specific risks in index data and this
suggests that the diversification obtained when forming the above portfolios, was not a mere
reduction of unsystematic risks which may be achieved through a random selection of a
number of stocks.
When splitting the sampled data into two sub-periods we confirmed the tendency for emerging
markets to move more in line with developed ones in recent years. Whilst correlation values
suggest that emerging markets have offered diversification potential, we have also shown
factors which point that the risk reduction benefits might be challenging to reap. The latter
factors are the tendency for emerging markets to exhibit a higher individual variability as
compared to developed ones and the trend for markets to move more in line with each other
as suggested by convergence literature.
We should also mention a number of limitations inherent in this analysis. Firstly, results may
be sample-specific: past relationships may not necessarily hold in subsequent periods especially
when keeping in mind that prior research indicates that financial crises may result in significant
changes in market comovements. A second limitation is that we considered portfolios
consisting of two-assets for the sake of simplicity. Whilst real-life portfolios would comprise a
higher number of assets, we do not believe that this is a significant drawback. This is due to
the fact that each index comprises a number of securities, and due to the prior research
findings suggesting that relatively broad portfolios do not necessarily present increased
diversification benefits (Kohers et. al., 1998). Thirdly, the assets included in the sampled
indices are denominated in different currencies. We do not account for currency fluctuations
on the grounds that such adjustments would also capture subsidiary variability which is
irrelevant for the scope of this analysis. Finally, when analysing stock market data which spans
over long periods of time, one should be aware that the conditions which underlie the pricing
process are likely to change due to modifications in trading procedures and regulations.
This analysis suggests further issues which may be tackled in future research, such as whether
the diversification benefits offered by emerging markets differ across bull and bear periods.
ACKNOWLEDGEMENTS
This paper is a revised version of Gabriella Galea’s M.A. (Financial Services) dissertation at the
University of Malta. The authors would like to thank an anonymous referee for helpful
comments which have improved the paper.
12
REFERENCES
Bekaert, G., & Harvey, C.R. (1997). Emerging equity market volatility. Journal of Financial
Economics, 43, 29-78.
Bekaert, G., Erb, C.B., Harvey, C.R., & Viskanta, T.E. (1997). What matters for emerging
market investments?. Emerging Markets Quarterly, 1(2), 17-46.
Bekaert, G., & Harvey, C. R. (2000).
Journal of Finance, 55(2), 565-613.
Foreign speculators and emerging equity markets,
Bekaert, G., & Harvey, C. R. (2002). Research in emerging markets finance: looking to the
future, Emerging Markets Review, 3, 429-448.
Chelley-Steeley, P.L. (2005). Modeling equity market integration using smooth transition
analysis: A study of Eastern European stock markets, Journal of International Money and
Finance, 24, 818-831.
Copeland, T.E., Weston, J.F., & Shastri, K. (2005). Financial Theory and Corporate Policy.
Boston, Massachusetts: Pearson Addison Wesley.
Cuñado, J., Biscarri, J.G., & de Gracia, F.P. (2006). Changes in the dynamic behavior of
emerging market volatility: Revisiting the effects of financial liberalization. Emerging Markets
Review, 7, 261-278.
Ding, D.K., & Charoenwong, C. (2006). Editorial: Asian market microstructure. International
Review of Financial Analysis, 15, 288-290.
Fama, E.F. (1965).
11(3), 404-419.
Portfolio Analysis in a Stable Paretian Market, Management Science A,
Fifield, S.G.M., Power, D.M. & Sinclair, C.D. (2002). Emerging stock markets: A more realistic
assessment of the gains from diversification, Applied Financial Economics, 12, 213-229.
Girard, E., & Omran, M. (2007). What are the risks when investing in thin emerging equity
markets: Evidence from the Arab world. International Financial Markets, Institutions and
Money, 17, 102-123.
Goriaev, A., & Zabotkin, A. (2006). Risks of investing in the Russian stock market: Lessons of
the first decade. Emerging Markets Review, 7, 380-397.
Granger C.W.J., & Newbold, P.
(1974). Spurious Regressions in Econometrics, Journal of
Econometrics, 2, 111-120.
Hunter, D. (2006). The evolution of stock market integration in the post-liberalization period:
A look at Latin America. Journal of International Money and Finance, 25, 795-826.
Jayasuriya, S. (2005). Stock market liberalization and volatility in the presence of favorable
market characteristics and institutions. Emerging Markets Review, 6, 170-191.
Kearney, C., & Lucey, B.M. (2004). International equity market integration: Theory, evidence
and implications. International Review of Financial Analysis, 13, 571-583.
13
Kohers, T., Kohers, G., & Pandey, V. (1998). The contribution of emerging markets in
international diversification strategies, Applied Financial Economics, 8, 445-454.
Li, K., Sarkar, A., & Wang, Z. (2003). Diversification benefits of emerging markets subject to
portfolio constraints, Journal of Empirical Finance, 10, 57-80.
Lintner, J. (1965). The valuation of risk assets and the selection of risky investments in stock
portfolios and capital budgets, Review of Economics and Statistics, 20, 13-37.
Los, C.A. (2003). Financial Market Risk: Measurement and Analysis, Routledge/Taylor and
Francis Group, London and New York.
Los, C.A. (2004). When to put all your eggs in one basket...? When diversification increases
portfolio risk!, Unpublished manuscript. College of Business Administration & Graduate School
of Management, Kent State University, Kent.
Markowitz, H.M. (1952). Portfolio Selection, Journal of Finance, 7(1), 77-91.
Meyer, T.O. & Rose, L.C. (2003). The persistence of international diversification benefits
before and during the Asian crisis, Global Finance Journal, 14, 217-242.
Miles, W. (2005). Do Frontier Equity Markets Exhibit Common Trends and Still Provide
Diversification Opportunities?, International Economic Journal, 19(3), 473-482.
Mossin, J. (1966). Equilibrium in a capital market, Econometrica, 40, 768-783.
Purfield, C., Hiroko, O., Kramer, C., & Jobst, A.
opportunities, and challenges. IMF Working Paper.
Reynolds, C.
(2001).
(2006).
Asian equity markets: Growth,
A conceptual model of global business growth in Southeast Asia.
Journal of the Asia Pacific Economy, 6, 76-98.
Samuelson, P.A. (1967). Efficient Portfolio Selection for Pareto-Lévy Investments, Journal of
Financial and Quantitative Analysis, 2(2), 107-122.
Sharpe, W.F. (1964). Capital asset prices: a theory of market equilibrium under conditions of
risk, Journal of Finance, 19, 425-442.
Shawky, H.A., Kuenzel, R., & Mikhail, A.D. (1997). International portfolio diversification: a
synthesis and an update, Journal of International Financial Markets, Institutions and Money, 7,
303-327.
Susmel, R. (2001). Extreme observations and diversification in Latin American emerging
equity markets, Journal of International Money and Finance, 20, 971-986.
White, W.R. (2007). Emerging market finance in good times and bad: Are emerging market
economies financial crises a thing of the past?, Bank of International Settlements, www.bis.org.
Wilson, S. (2006). How to invest in emerging markets, www.moneyweek.com.
Yang, J., Kolari, J.W., & Min, I. (2003). Stock market integration and financial crises: The
case of Asia. Applied Financial Economics, 13, 477-486.
14


© Copyright 2026