
Annual Report and Accounts 2014
Charles Taylor plc Annual Report and Accounts 2014
Charles Taylor
Professional Services
for the global insurance market
Annual Report and Accounts 2014
1
Charles Taylor plc is a leading provider of professional services to clients across the global insurance market. We have been
providing such services since 1884 and today we employ over 1,200 permanent and contract staff in 67 offices spread across 27
countries in the UK, the Americas, Asia Pacific, Europe and the Middle East.
The Group offers services, principally on a fee-based model, and operates through three businesses – Management, Adjusting and
Insurance Support Services. We also own insurers, creating value through undertaking select acquisitions and driving operational
efficiency.
Our vision
Our vision is to become the professional services provider of choice to the global insurance market by:
Building
A substantially larger Professional Services business in sectors where superior technical skills matter.
Achieving
Leading market positions for each of our businesses and expanding into growing economies and markets where we are currently
under-represented.
Developing
New services and associated revenue sources within our existing business model.
Capitalising
On the opportunities for cross referral and business synergies between our businesses and across our international network.
Our core values
Charles Taylor is a people business. Everything we do to achieve our vision is underpinned by our core values:
Excellence
We recruit, retain, and develop highly skilled, technically excellent professional staff.
Partnership
We have a partnership mind-set and work closely with our clients to deliver mutually beneficial outcomes, focusing on long-term
value creation.
Quality
We have a genuine pride in delivering high quality work. We live by our reputation in professional services and it is this focus on
quality which underpins our offering to clients.
Support
We work within a supportive, collegiate culture across the Group.
2
Business highlights
Revenue
£122.8m* +8.1%
(CER† £126.3m +11.2%)
(2013: £113.6m)
Professional Services profit1
£12.2m* +16.7%
(CER† £12.5m +19.6%)
(2013: £10.4m)
Statutory profit before tax
£9.6m* +38.5%
(CER† £9.9m +42.7%)
(2013: £6.9m)
Adjusted profit before tax1
£11.1m* +11.3%
(CER† £11.4m +14.2%)
(2013: £10.0m)
Net debt2
£32.6m
increased by 0.8%
(2013: £32.4m)
Statutory earnings per share
19.48p* +37.0%
(CER† 20.01p +40.7%)
(2013: 14.22p)
Adjusted earnings per share
23.17p* +15.6%
(CER† 23.71p +18.3%)
(2013: 20.05p)
Dividend per share
10.75p +7.5%
(2013: 10.00p)
–
Increased revenue
–
Increased adjusted profit before tax
–
Increased statutory profit before tax
–
Increased adjusted earnings per share and statutory earnings per share
–
Delivered higher Professional Services profit despite benign global claims environment
–
Net debt in line with prior year
–
Progressed growth initiatives
–
Rights issue to raise £30.6m in new equity
–
Second interim dividend of 7.50p/full year dividend of 10.75p
1.
The adjusted figures exclude the following (£m)
2014
1.5
0.2
(0.2)
1.5
(0.2)
0.0
1.4
Acquired intangible assets amortisation
Non-recurring costs
Non-controlling interests – profit before tax
Adjustments to profit before tax
Tax on non-recurring costs
Tax on non-controlling interests
Adjustments to earnings
2.
See Group CFO Report for more details
Movements are calculated using unrounded numbers so minor rounding differences may exist.
*
Actual exchange rates † Constant exchange rates
3
2013
1.2
1.6
0.2
3.0
(0.4)
0.0
2.6
Strategic Report
3
Business highlights
5
Charles Taylor at a glance
8
Business model
9
Business strategy
10
Group Chief Executive Officer’s Review
20
How we measure performance
21
Group Chief Financial Officer’s Report
23
How we manage risk
26
Corporate Social Responsibility and Diversity
Corporate Governance
28
Corporate Governance Report
29
Board of directors
32
Board Responsibilities
36
Nomination Committee Report
37
Audit Committee Report
40
Directors’ Remuneration Report
62
Directors’ Report
66
Directors’ Responsibilities Statement
Financial Statements
67
Independent Auditor’s Report
71
Consolidated Income Statement
72
Consolidated Statement of Comprehensive Income
73
Consolidated Balance Sheet
74
Company Balance Sheet
75
Cash Flow Statements
76
Consolidated Statement of Changes in Equity
77
Company Statement of Changes in Equity
78
Notes to the Financial Statements
Other Information
122
Five Year Record
123
Shareholder information
124
Charles Taylor offices
4
Charles Taylor at a glance
Charles Taylor is a leading provider of professional services to clients across the global insurance market.
Our Professional Services businesses
Management Services
The Management Services business provides end-to-end management of insurance companies and associations.
We deliver a complete outsourced management service to our customers covering every aspect of an insurance company’s operations
including marketing, management of underwriting and claims and provision of regulatory, accounting, investment management and
administrative operations.
Clients
–
The Standard Club
–
Signal Mutual
–
SCALA
–
The Offshore Pollution Liability Association
Growth opportunities
–
Grow membership and scale of client mutuals
–
Introduce new products and services for those client mutuals
–
Seek management contracts from new and existing mutuals, group captives, buying groups and associations
Adjusting Services
The Adjusting Services business provides loss adjusting services across the aviation, energy, marine, property & casualty and special
risks sectors. We also provide marine average adjusting and technical support services. The business specialises in the settlement of
larger and more complex losses arising from major insured incidents and claims.
Growth opportunities
–
Expand into new territories
–
Extend service offering in Group offices
–
Recruit and retain top performing adjusters
–
Develop and retain the next generation of adjuster
Insurance Support Services
The Insurance Support Services business provides a range of professional services thereby enabling our clients to select the specific
stand-alone services they require:
Claims Management Services
–
Elective claims services
–
Static claims management services
Insurance Technology Services
–
Specialist and bespoke insurance technology solutions
–
End-to-end insurance systems for insurance companies
–
System development and implementation support
5
Business Process Outsourcing
–
Turn-key managing agency services
–
Broking and underwriting services
–
Market-wide insurance services
–
Financial reporting services
–
Run-off management services
–
Third Party Administration (TPA) services
–
Life insurance administration services, focusing on HNW investors and UK offshore markets
–
Managing General Agency (MGA) services
Risk Transfer Solutions
–
Captive management
–
Coverholder and niche insurance solutions
–
Risk Consulting services
Investment Management
Growth opportunities
Claims Management Services
–
Expand claims management services
–
Secure more run-off servicing contracts
Insurance Technology Services
–
Develop additional technology solutions for the insurance market
–
Business Process Outsourcing
–
Seek turn-key managing agency appointments from new Lloyd’s syndicates
–
Develop MGA/coverholder services
Risk Transfer Solutions
–
Seek new captive management mandates
–
Develop niche insurance solutions
–
Develop risk consulting services
Investment management services
–
Seek additional investment management mandates
Our Owned Insurance Companies
The Owned Insurance Companies business comprises two parts. It owns and consolidates life insurance businesses which are
primarily in run-off, creating value through targeted acquisitions and operational efficiency. It also owns non-life insurance companies
which are closed to new business and are running off their liabilities in an orderly manner.
Growth opportunities
–
Seek out opportunities to acquire offshore life companies.
6
1.
Includes shared services teams on a pro rata basis and non-permanent contract staff
We have over 1,200 staff located in 67 offices spread across 27 countries.
7
Business model
Charles Taylor has a long established business model which generates revenue through the delivery of professional services to
insurers, their clients and advisers on a worldwide basis, predominantly through the charging of fees. Charles Taylor also owns
insurers, creating value through select acquisitions of life companies and by driving operational efficiency.
We are confident about the potential for long-term growth for professional services in the global insurance market and aim to increase
revenue and profit both through organic growth and targeted strategic M&A opportunities.
How we create value
Strong client relationships
Charles Taylor is a people business and our clients are at the heart of everything we do. We always aim to deliver the highest level of
professional service to our clients and to act in their best interests. Our commitment to quality is reflected in the strength of our client
relationships, many of which have been in place for many years.
Well-regarded professional services
We deliver professional services of a proven quality to our clients across the global insurance market. The Group offers services
across the whole insurance value chain and operates through three Professional Services businesses: Management, Adjusting and
Insurance Support Services. We also own and provide professional services to insurance companies.
Deep technical skills
Our services are specialist and highly technical in nature and we differentiate ourselves through the quality of our people, their
technical expertise, and their commitment to service excellence. Many of our professional staff are graduates or hold professional
qualifications. Our senior employees have developed superior technical knowledge gained through many years of market and practical
experience.
Breadth of locations
Insurance is a global business and we have offices strategically located around the world in order to be near our clients and to provide
our services locally wherever they are required by our clients. We have over 1,200 staff in 67 offices spread across 27 countries in
North and Latin America, Asia Pacific, Europe, the Middle East and Africa.
Extensive growth opportunities
We aim to increase revenue and profit from our professional services, principally through organic growth and targeted strategic M&A
opportunities. We are confident about the potential for long-term growth for professional services in the global insurance market.
Global trade flows continue to grow, driving an increasing demand for insurance and the services that support insurers, insureds and
their advisers. In addition, greater regulatory and solvency requirements are driving an increase in the consolidation of life companies.
We believe that Charles Taylor is embedded within the fabric of the international insurance market and is well positioned to benefit
from these trends.
8
Business strategy
Our business strategy is to deliver growth in revenue, profit and shareholder value by focusing on professional services.
Our approach is to seek organic growth by: capitalising on our areas of strength by offering related services to our clients; building our
niche businesses to leadership positions; and realising the significant potential for cross referral and joint working across the Group.
We are well positioned to generate this growth and believe the demand for the professional services we offer is substantial. We also
are open to growing by entering new business lines or through targeted M&A activity.
Our Professional Services business strategy has three elements: Optimise our business operations; Create growth in our core
Professional Services businesses; and Explore medium-term strategic options. The Group has over the past three years focused on
strengthening its core capabilities and support services to underpin the growth of the Group’s three Professional Services businesses.
The Directors believe that the core capabilities and infrastructure of the Group have been strengthened and the Directors can place
more emphasis on the other strands of the business strategy.
Optimise business operations: strengthen the
Group’s core capabilities and support services to
underpin growth.
See Group CEO’s Review for 2014 highlights.
Deliver growth in the core professional services
businesses; achieve leadership positions in all the
Group’s businesses and develop new, closely
related, insurance services.
See Group CEO’s Review for 2014 highlights.
Create medium-term strategic options; develop
new professional services business lines through
joint ventures or M&A opportunities. Any initiative
of this nature needs to be a good fit strategically,
culturally and financially.
See Group CEO’s Review for 2014 highlights.
In 2014 we started to roll-out our new case management system across our
adjusting network, enhanced our bespoke end-to-end insurance management
system for The Standard Club and developed our claims management systems
for Signal Mutual. We expanded our new IT team based in Vietnam to take
advantage of the high levels of IT literacy and lower operating costs in
Vietnam. We made a series of key hires in strategically important posts,
including a new Group Chief Financial Officer and Group Human Resources
Director, and a Corporate Development Director in Adjusting Services,
enabling us to drive forward our growth plans.
In 2014 we established a new fixed premium product and marine mutual war
risks insurance class for The Standard Club. We launched and are providing
management services to SafeShore, a new US Longshoreman Workers’
Compensation Small Account programme backed by Signal Mutual and
created new insurance products for Signal members. We opened an office in
Brazil, appointed numerous senior loss adjusters and extended the range of
services available from our existing adjusting offices. We introduced new
claims services for the Lloyd’s insurance market and rebranded our Isle of
Man business under the Charles Taylor identity. In early 2015 we were
appointed by the board of the Strike Club, a marine mutual insurer, to provide
end-to-end management services.
In 2014 we worked to establish a new managing agency at Lloyd’s and to set
up a new underwriting syndicate at Lloyd’s on behalf of the Standard Club.
We are building momentum behind our strategy to make carefully targeted
M&A opportunities with the acquisition of Knowles Loss Adjusters, which
broadens our UK adjusting network and a small US acquisition to strengthen
our Risk Consulting business. We acquired the business of SC Management,
the Strike Club’s management companies, in March 2015.
Our Owned Insurance Companies business strategy:
We are seeking targeted acquisition opportunities in
the international life insurance sector, while
reducing our exposure to the non-life insurance
run-off sector.
In 2014 we completed the acquisition of Nordea Life & Pensions Limited, an
Isle of Man life insurer which is open to new business. In early 2015 we agreed
to acquire Scottish Widows International Limited a closed book life insurer.
See Group CEO’s Review for 2014 highlights.
9
Group Chief Executive Officer’s Review
Charles Taylor has delivered a strong performance. The Group’s results in 2014 reflect the positive progress we have made in
delivering our growth strategy.
Group results 2014
2014
122.8
11.1
9.6
23.17
19.48
10.75p
£32.6m
Revenue (£m)
Adjusted profit before tax (£m)
Statutory profit before tax (£m)
Adjusted earnings per share (p)
Statutory earnings per share (p)
Dividend (p)
Net debt (£m)
2014 CER1
126.3
11.4
9.9
23.71
20.01
—
£32.6m
2013
£113.6m
£10.0m
£6.9m
20.05p
14.22p
10.00p
£32.4m
%
+8.1%
+11.3%
+38.5%
+15.6%
+37.0%
+7.5%
n/a
Professional Services performance
(£m)
Management Services
Adjusting Services
Insurance Support Services
Unallocated
Total
2014
43.9
56.1
21.8
—
121.8
Revenue
2014 CER
44.7
58.6
22.0
—
125.3
2013
41.1
54.9
15.9
—
111.9
Operating segment profit
2014
2014 CER
7.7
8.0
2.2
2.2
2.0
2.1
0.3
0.2
12.2
12.5
2013
6.6
4.8
(0.9)
(0.1)
10.4
2014
4.2
Revenue
2014 CER
4.2
2013
5.0
Operating segment profit
2014
2014 CER
0.5
0.5
2013
0.8
Owned Insurance Companies performance
(£m)
Owned Insurance Companies
1.
CER = Constant Exchange rates
2014 performance
Group Results
In a year when the unusually low level of large insured claims across the insurance market led to a fall in the performance of our
Adjusting Services business, we have significantly increased overall revenue and adjusted profit before tax. We have successfully
extended our range of professional services and invested in new staff, offices and teams. We also completed two carefully targeted
acquisitions during the year; and another two in the early part of 2015; with a further acquisition due to complete shortly.
Revenue increased 8.1% to £122.8m (CER £126.3m +11.2%) (2013: £113.6m). Group adjusted profit before tax rose 11.3% to
£11.1m (CER £11.4m +14.2%) (2013: £10.0m), while Group statutory profit before tax increased by 38.5% to £9.6m (CER £9.9m
+42.7%) (2013: £ 6.9m). Adjusted earnings per share rose by 15.6%% to 23.17p (CER 23.71p +18.3%) (2013: 20.05p). Statutory
earnings per share increased 37.0% to 19.48p (CER 20.01p +40.7%) (2013: 14.22p). At the Half Year, we reported that our results had
been reduced by the impact of the strength of sterling. This impact is still present, but has been reduced at the year end.
Professional Services
The Group’s core professional service businesses performed strongly overall. Revenue increased by 8.8% to £121.8m (CER £125.3m
+12.0%) (2013: £111.9m) and operating segment profit was up 16.7% to £12.2m (CER £12.5m +19.6%) (2013: £10.5m.):
–
The performance of our Management Services business was strong. The mutuals managed by the Group also performed well on
behalf of their members.
–
The Adjusting Services business has been affected by the unusually low level of large insured losses across the global insurance
market in 2014. Our investment in new offices, teams, systems & processes, and senior staff puts us in a strong position to
benefit when insurance claims return to more normal levels.
–
The Insurance Support Services business made a positive contribution to the 2014 result, greatly improved from the prior year.
Owned Insurance Companies
Owned Insurance Companies revenue was down 17.5% to £4.2m (CER £4.2m -17.2%) (2013: £5.0m) and operating segment profit
was down 32.1% to £0.5m (CER £0.5m -32.2%) (2013: £0.8m).
10
Dividend
A second interim dividend of 7.50p per share (2013: 6.75p), which replaces the final dividend, will be paid on 24 April 2015 to
shareholders on the register on 27 March 2015. When added to the first interim dividend of 3.25p per share (2013: 3.25p), this results
in the total dividends per share for the year being 10.75p (2013: 10.00p).
Balance sheet
Net debt rose slightly at the year end to £32.6m (2013: £32.4m) and free cash flow reduced to £3.8m (2013: £5.5m). The 12-month
rolling average net debt as at 31 December 2014 was £24.6m, compared to £22.0m at the prior year end. The increase in the 12-month
rolling average net debt of £2.6m was largely as a result of our investments in the business to deliver our growth strategy. This
includes opening new offices to extend the Group’s geographic reach, which we expect will deliver increased revenue once fully
established and investing in new IT systems to improve operational efficiency. We achieved a small reduction in the working capital
requirement of our Adjusting Services business. We continue to focus on managing our debt while investing for growth. See Group
CFO’s report page 21.
In common with many companies, the Group’s pension deficit rose during the year. The increase in net obligation has been driven by
a change in discount rates as a result of a fall in corporate bond yields which have largely been linked to the drop in gilt yields. The
Group’s net pension liabilities were £41.5m at the year end, compared to £26.7m in 2013. See Group CFO’s report page 21.
Management Services
The Management Services business provides end-to-end management services to insurance companies and associations. We
deliver a complete outsourced management and operational service to our insurance company clients, reporting directly to
their independent boards of directors. Our services can cover every aspect of those companies’ operations from underwriting,
claims management and delivery of safety services to regulatory, accounting and administrative operations, investment
management, customer service, corporate governance and company secretarial services. We manage four mutual insurance
companies - The Standard Club, Signal, SCALA and The Strike Club (appointed March 2015). We also provide
administration services to the Offshore Pollution Liability Association.
We are remunerated by fees from our mutual insurance company and association clients. Where we provide a full management
service, growth in the size of the mutuals, the number and extent of services we deliver and the volume of work involved generally
leads to growth in management activities and ultimately the level of management fees. The performance of the managed mutual
insurance companies is strong – providing a positive long-term indicator of the Management Services business. The business also
seeks to grow through the identification and implementation of opportunities to develop new insurance ventures and by tendering for
the management contracts of existing mutual insurance companies and other associations.
Management Services - UK & International
Our Management Services UK and International business performed strongly in 2014. We delivered high quality professional services
to our established clients, secured new client relationships, launched new products and services and opened a new office in Brazil.
Delivered services to existing clients
–
Standard Club. Charles Taylor has managed the Standard Club since it was founded in 1884. Today it provides protection and
indemnity (P&I) insurance to approximately 10% of world shipping. Our work continues to deliver positive results for the club,
which had a satisfactory 2014-15 renewal in February 2014. Free reserves rose to a record US$369 million. In July 2014, the
club’s credit rating was reaffirmed as ‘A’ (strong) by Standard & Poor’s. Insured tonnage stood at 136m gt at 31 December
2014. We have supported the club in setting up a new underwriting syndicate at Lloyd’s. We are also establishing a Managing
Agency to manage the syndicate. See Insurance Support Services page 16 for details of the managing agency.
–
The Offshore Pollution Liability Association (OPOL). Charles Taylor was appointed to provide a finance function,
administrative, management and IT support to OPOL in December 2013. Over the last year we helped OPOL to improve its
performance by developing bespoke IT solutions.
Secured new clients
–
The Strike Club. In line with our strategy to achieve growth by securing management contracts with mutual insurance
companies, we acquired the business of SC Management, the independent, dedicated management companies of The Strike
Club, a marine mutual insurance group, in early 2015. In conjunction with the acquisition, Charles Taylor has been appointed
by the Board of the Strike Club, to manage the club. The Strike Club is the only dedicated mutual insurer covering the running
costs of vessels delayed by strikes, shore delays, collisions, groundings and other incidents outside an owner’s or charterer’s
control.
11
Developed new products and services:
–
We worked with The Standard Club to establish a new fixed premium product.
–
We assisted The Standard Club in providing cover to Turk P&I, a fixed premium P&I insurer for Turkish coastal vessels.
–
We supported The Standard Club Asia in establishing a new Singapore War Risks class to insure shipowners against war and
related risks, which started underwriting in February 2015.
Extended our office network
–
We opened a new office in Brazil to support clients of The Standard Club in Latin America.
Optimised business operations
–
We enhanced our end-to-end insurance management system for the Standard Club.
Management Services – Americas
The Management Services Americas business had a very successful year. Through our efforts, Signal Mutual achieved further growth
and launched a new Longshoreman Workers’ Compensation Small Account program. We also extended the reach of our General
Agency and launched new insurance covers.
Secured growth for Mutual insurance clients
–
Signal Mutual: Charles Taylor has been the manager of Signal Mutual, the largest provider of Longshore workers’
compensation insurance to the US maritime industry, since it was founded in 1986. In 2014 the Association continued to grow
under our management. All the members, who were offered terms, renewed in October 2014. Our track record of consistently
reducing rates continued, reflecting further improvement in safety management, effective claims adjusting, selective
underwriting and efficient management techniques. Eleven new members joined the association and the total membership has
now reached 245 companies. The projected payroll of the member companies, on which calls are calculated, reached US$3.81
billion, an increase of 14.1%. Total calls for the year will be around US$230.86 m, up by 9.8% over the previous year. All key
performance indicators for the Association are at all-time highs.
–
SCALA: Charles Taylor has managed SCALA, which provides marine workers compensation to the majority of Canada’s ship
owners since 1978. The mutual delivered a steady performance during 2014 under our management. We further improved
claims handling processes on behalf of the mutual by making reporting enhancements to the Incident Reporting Database. Total
calls for the year were Canadian $4.95m.
Business strategy initiatives are highlighted in the
Group CEO’s reports with the following symbols:
Optimise business operations
Create growth in the core
Professional Services businesses
Explore medium-term strategic options
Optimised business operations
–
We enhanced our claims management systems on behalf of Signal, introduced new medical bill routing systems and enhanced
our legal service and billing arrangements, enabling claims services to be delivered more efficiently to the mutual. We
introduced reporting enhancements to the Incident Reporting Database, which is an extension of the SCALA Claims system.
Extended services and insurance covers
–
We supported the launch in October 2014 and are providing management services to SafeShore, a new Longshoreman Workers’
Compensation Small Account programme, backed by Signal Mutual, for businesses whose premiums are too small to join
Signal. It was created to meet strong market demand for cost-effective, responsive Longshore cover for the waterfront
employers with a smaller exposure to the Longshore Act. Safeshore has already been well received securing 30 new clients with
reported payroll of US$12m, to date.
–
We created a new Maritime Employers’ Liability cover for Signal Members in 2014 and secured new business for the Hull &
Machinery cover that was launched at the end of 2013.
12
Case study
Securing a new mutual management contract
Winning management contracts for mutual insurance companies is a key part of the growth strategy for our Management Services
business.
We have taken a significant step forward in achieving this ambition by being appointed as managers by the board of The Strike Club a
marine mutual insurance company. The transaction, which involved extensive work by our Management Services and Shared Services
teams in the second half of 2014, involved us acquiring a number of the companies which provided management services to the club.
Our team was led by Richard Yerbury, who joined Charles Taylor as Performance and Strategy Director of our Management Services
– UK & International business from Bain & Co in 2014.
The Strike Club is the only dedicated mutual insurer covering the running costs of vessels delayed by strikes, shore delays, collisions,
groundings and other incidents outside an owner’s or charterer’s control. In addition to mutual delay cover, it also offers war and loss
of earnings cover on a fixed premium basis. It offers comprehensive, cost-effective cover backed by excellent service.
The directors of The Strike Club had been undertaking extensive work to determine the best structure for the club to be compliant with
Solvency II, the fundamental review of capital adequacy and risk governance for the European insurance industry. The board decided
to appoint Charles Taylor as manager to deliver a new regulatory structure and to work with the club’s existing management team to
grow the club and extend the services available to its members.
Johan Hagn-Meincke of Clipper Group A/S, President and Chairman of The Strike Club said: “We aim to build on The Strike Club’s
existing excellent reputation for delivering high levels of service to its members backed by technical expertise and financial strength,
while preserving its mutual ethos and ownership structure. We are confident that, working with Charles Taylor’s Management
Services team along with Bill Milligan and his team, The Strike Club will go from strength to strength.”
“Combining our skills in marine mutual management with The Strike Club’s expertise in delay
insurance will enable us to extend the services available to The Strike Club’s members,
underpinned by the excellent levels of service that are the hallmark of mutual insurance.”
Richard Yerbury, Performance and Strategy Director, Charles Taylor Management Services – UK & International
Adjusting Services
The Adjusting Services business provides loss adjusting services across the aviation, energy, marine, property & casualty and
special risks sectors. It also provides average adjusting services for ship owners. The business primarily focuses on larger and
more complex claims arising from major insurance losses.
Our Adjusting Services business has delivered a creditable performance in a year when the number of large insured losses across the
global insurance market, which provide work for our adjusters, fell significantly. We marginally increased revenue over the prior year
level, although changes in the business mix, investment in new offices and additional senior staff reduced the business’s margin. We
believe Adjusting Services is in a strong position to deliver growth when large insurance claims return to more normal levels.
Figures reported by major insurers and brokers show that insured losses from natural disasters are running well below the average for
recent years. Munich Re NatCatSERVICE statistics show that insured losses in US$ from natural catastrophes in 2014 were down
47% on the 10 year average. Similar figures from SwissRe Sigma and Aon Benfield Impact confirm the decline in large global claim
levels.
Statistics published by Munich Re, show that it would be wrong to conclude any trend reversal in insured losses based on the last few
years’ experience. In its Topics GEO 2015 report, Munich Re says that “the loss trend of the past decades is clearly upwards,
primarily driven by the rise in exposed values.”
13
Maintained flow of high quality instructions
Against this background, we received a steady flow of new high-quality instructions from insurers, underlining the strength and depth
of our market relationships and reach of our global office network. A notable example is the high volume of work received by our
Mexico office following the devastating hurricanes in the country. Our Property, Casualty and Special risks team delivered positive
growth and expanded its capabilities in handling financial institutions losses. Aviation was appointed on five of the seven major high
profile aviation losses of 2014 in a relatively quiet year for claims. Our Energy team delivered a steady performance while
significantly strengthening its senior adjusting team. Marine had a very good end to 2014 with a notable pick up in instructions
following a slow start.
Extended our global office network
In line with our business plan, we are expanding our office network into geographies where there is a demand from global and local
insurers for our international loss adjusting expertise.
–
In 2014 we opened a new office in Rio de Janeiro, Brazil with a senior loss adjuster relocating from our Mexico office to start
the operation. We now have offices in two countries in Latin America markets, following the acquisition of our offices in
Colombia in 2012, supported by correspondents across the region. See Management Services page 12 for details of the new
joint office.
Recruited senior adjusters
Loss adjusting is a people business where our strong market relationships and recognised technical expertise enable us to win
additional business. During the year, we have recruited senior adjusters with strong market followings to drive further business
growth.
–
In North America we appointed two senior Property & Casualty Adjusters in our Calgary office and recruited a Senior Marine
Advisor for the Americas, operating out of our Toronto office. We recruited senior executive adjusters and an office manager in
our New York office and appointed two senior adjusters in addition to an office manager to grow our Houston operation.
–
We significantly enhanced our Energy loss adjusting capability in Asia with the appointment of four senior adjusters in
Singapore in early 2015. The appointments give us a highly experienced and respected energy adjusting team with a strong
market following.
–
In the UK, we recruited five additional Property & Casualty adjusters during the year.
Broadened the range of service from our Adjusting offices
We are capitalising on the strength of our global office network by expanding the range of services available to international insurers.
–
In 2014 we expanded our Sydney operation by opening new, larger premises and appointed senior staff to develop Property &
Casualty and Energy adjusting capabilities in addition to the office’s well-established Aviation abilities.
We established a Property & Casualty adjusting capability in our Singapore office with the addition of a senior adjuster to our team
and established a marine adjusting capability in our Doha office. Our recently established Property & Casualty capability in Indonesia
is growing well.
14
Acquired UK loss adjusting business
There is a substantial demand for property & casualty loss adjusting services across the UK by domestic and international insurers. To
meet this need, we extended our UK office network in 2014 with the acquisition of Knowles Loss Adjusters, a specialist property and
casualty loss adjuster. This added 10 offices to our UK network and around 50 additional staff and enables us to respond effectively to
claims across the UK and seek adjusting nominations from insurers underwriting UK property & casualty risks. Knowles has
delivered a positive performance in 2014.
Won ‘Adviser of the Year’ Award
Our commitment to delivering the highest standards of technical adjusting and professional services was recognised at the Insurance
Day London Market Awards 2014 where we were named ‘Adviser of the Year’. The judges’ citation said the award was for our
numerous achievements during the year which included our response to the 2013 Calgary Floods. We were finalists in the 2015
Commercial Insurance Awards, Loss Adjuster of the Year category and have been shortlisted for ‘Claims Management Team of the
Year’ at the Modern Claims Awards 2015.
Optimised business operations
–
We started rolling-out our new loss adjusting case management system across our network. The new system is already
increasing efficiency and reducing the administrative burden for our loss adjusters.
–
We have achieved a small reduction in the working capital requirement of our Adjusting Services. We are maintaining our
focus on reducing debt and appointed working capital specialists to review our approach to WIP and cash collection in 2014.
We expect the appointment of a dedicated manager, along with the introduction of our new loss adjusting case management
system will contribute further to our drive to reduce the working capital requirement of the business.
–
In late 2014, we appointed a Corporate Development Director to work with our Senior Management Team to identify new
business opportunities, support the development of new office locations and assist our Aviation, Marine, Energy and Property &
Casualty business lines in their development and growth.
Invested in training the next generation of adjusters
We are committed to investing in training and education to develop the next generation of loss adjusters.
–
During the year we seconded adjusters between our London, Hong Kong, Jakarta, Taipei and Liverpool offices to broaden their
experience of different markets and further enhance joint working across our office network.
–
We are supporting 11 staff based in London, Liverpool, Hong Kong and Jakarta to take the Association of Average Adjusters
examinations at this time, with one becoming fully qualified during 2014.
Case study
Extending our UK loss adjusting capability
Our Adjusting Services growth strategy includes extending our office network where there is a demand for our services and recruiting
and retaining top performing adjusters.
In 2014 we took our strategy forward with the acquisition of Knowles Loss Adjusters which gave us a platform to further penetrate the
UK property and casualty loss adjusting market. The acquisition expanded our UK office network with the addition of ten UK offices.
It has greatly increased our capability to respond to tenders for international and national account nominations, which require a
network of offices across the UK, as well as overseas.
Knowles targets UK commercial, personal, construction and professional lines claims. It also provides managed claims services to
insurers. All the directors and staff of Knowles joined Charles Taylor following the acquisition increasing our team of experienced and
specialist staff in the UK. David Parker, a founder and managing director of Knowles is working with our UK Property and Casualty
business to drive the business forward under our ownership.
David Parker, Managing Director, Knowles Loss Adjusters said:
“Knowles has grown and developed over the last 22 years because of our commitment to deliver a superior service by. Charles Taylor
has a similar ethos of delivering outstanding professional service and a global reputation in handling major losses. Our approach and
the services we offer make this an ideal combination for our clients and staff.”
“Knowles is an excellent fit with Charles Taylor Adjusting and gives us a far greater footprint
in the UK. Knowles’ expertise in UK general commercial claims perfectly complements our
strength in international markets.”
15
Andrew Jackson, Managing Director, Charles Taylor Adjusting – Property, Casualty and Special Risks
Insurance Support Services
The Insurance Support Services business provides technical services to clients in the Lloyd’s, London and international
insurance markets. It also delivers life and non-life run-off servicing services from London, Dublin and the Isle of Man. The
business is a leading provider of third party life insurance administration on the Isle of Man. It also includes our turn-key
managing agency, investment management, captive management, risk consulting and specialty risks business lines. Finally, the
Insurance Support Services business acts as the Group’s business incubator where we can develop and test new business
initiatives.
Our Insurance Support Services business has performed well in 2014. Our Non-life business has achieved strong revenue growth and
has made a positive operating segment profit contribution. The Life administration business is performing steadily under the Charles
Taylor Insurance Services brand and is progressing the development of its new insurance fund services business.
Insurance Support Services – Non-life
The Non- life Insurance Support Services business includes Charles Taylor Insurance Services (CTIS), our captive management, risk
consulting and specialty risks business lines. Following the appointment of a Chief Executive Officer of Non-life Insurance Support
Services in 2013, we appointed a Chief Operating Officer in 2014 to drive the development of existing and new services and to
improve business efficiency.
Charles Taylor Insurance Services is the largest of the Non-life Insurance Support Services business lines. It provides outsourced back
office insurance services to the Lloyd’s, London and international insurance markets. Over the year we have reduced the business’s
cost base and increased our focus on developing the most profitable business lines. These initiatives have delivered a welcome
improvement in performance.
Developed professional services
–
Promoted technology services. We are pro-actively promoting the Group’s wide range of insurance technology products and
services. This is in response to the growing demand for insurance technology services worldwide. Our capabilities include
experts in Software as a Service (SaaS) who have developed bespoke products and market-wide solutions, technical and
business consultants who specialise in document management and workflow systems and IT specialists who have developed
end-to-end insurance management systems.
–
Extended Claims Services. Our new elective claims services, which provide support to Lloyd’s managing agents on complex
claims, secured new clients during the year. Our recently established volume claims service, marketed under the ‘Trax’ brand
won numerous clients, including its first non-Lloyd’s client which marks a promising move into the London insurance
companies market.
–
Secured additional run-off servicing business. We were appointed as run-off manager for a sizeable general reinsurance
business. We believe there is potential to further develop our run-off servicing business as non-life insurers place business into
run-off and we will target our services at insurers and run-off aggregators in 2015.
–
Identified ‘Conduct Risk’ services. New ‘Conduct Risk’ governance rules were introduced by Lloyd’s in January 2015. We
believe we are well-positioned to capitalise on this development as many of our services, including our claims workflow, diary
management, elective claims and audit services as well as our TPA Database could support managing agents meeting managing
agents’ new obligations under the rules.
-
Established Charles Taylor Managing Agency (CTMA). We have been working to establish a turn-key managing agency, to
offer new Lloyd’s syndicates an end-to-end management service which we anticipate will commence trading in April 2015.
This will be one of only a few turn -key managing agencies serving the Lloyd’s market and we believe there will be significant
demand for the service. We are pleased that the Standard Club has chosen CTMA to support it in establishing Syndicate 1884
which is part of the club’s strategic objective of achieving long-term sustainable growth. To support the development of CTMA
we now have a corporate name at Lloyd’s. The development work to establish CTMA contributed to the increased revenue and
operating segment profit of the Insurance Support Services business in 2014.
Other Non-life Insurance Support Services: The Group’s other Insurance Support Services businesses performed steadily in 2014.
Charles Taylor KnowledgeCenter has benefited from an improved pipeline of new business. The Captive Management business has
performed steadily. Our Risk Consulting business acquired a small risk management business in the USA to extend its reach in North
America. The investment management business delivered steady returns for its clients. The Group’s new TPA service launched in the
USA in 2013 has secured new clients.
Business strategy initiatives are highlighted in the Group CEO’s reports with the following symbols:
Optimise business operations
Create growth in the core Professional Services businesses
16
Explore medium-term strategic options
Insurance Support Services – Life
The international life servicing business performed well in 2014. We rebranded the business under the Charles Taylor Insurance
Services name. This initiative has integrated it more fully into the Group and allows it to capitalise on the Group’s global presence and
reputation. We won a contract to provide life policy administration services to a major Caribbean-based life business. In addition, the
acquisition of an international life company by our Owned Insurance Companies business secured additional life policy administration
business for CTIS. We launched Charles Taylor Insurance Fund Services to provide specialist fund services for life companies’
unitised funds and portfolio bonds. We are actively marketing the business to life companies in the UK and international markets.
Case study
Charles Taylor Insurance Support Services case study
Building our presence in the Lloyd’s insurance market
We are seeking to build our presence in the Lloyd’s insurance market as part of the growth strategy for our Insurance Support Services
business. A major initiative in 2014 has been to develop Charles Taylor Managing Agency (CTMA), a turnkey managing agent to
provide clients who want to establish Lloyd’s syndicates with the end-to-end management services and oversight they need to operate
in the market.
We appointed Paolo Cuomo as Chief Operating Officer of CTMA in 2013 to lead the thorough and detailed process of establishing a
new turnkey managing agent at Lloyd’s. This involved setting up all the systems, processes and procedures and operational
capabilities of the turnkey managing agent. It also required regulatory approval from the PRA, the FCA and Lloyd’s, which we
received in early 2015. At the same time Lloyd’s approved Charles Taylor Managing Agency to provide management services to
Syndicate 1884, which was set up on behalf of one of its clients.
New syndicates entering the Lloyd’s insurance market will typically appoint an approved turn-key managing agent, to provide them
with all of the management oversight and services they require to operate in the Lloyd’s market. CTMA’s strategy is to offer its
syndicate management capabilities to other new Lloyd’s start-ups.
We already have deep experience of working in the Lloyd’s Market where we offer a wide range of highly technical insurance-related
services coupled with a commitment to excellence. We are confident that CTMA will offer exceptional management services to new
syndicates to the Lloyd’s market.
“We intend that CTMA provide turn-key management services to new syndicates entering
Lloyd’s. We believe there will be a significant demand for our distinctive services from clients
who value our professional, high quality approach.”
Paolo Cuomo, Chief Operating Officer, Charles Taylor Managing Agency
Owned Insurance Companies
The Owned Insurance Companies business comprises two parts. It owns and consolidates life insurance businesses which are
primarily in run-off, creating value through targeted acquisitions and operational efficiency. It also owns non- life insurance
companies which are closed to new business and are running off their liabilities in an orderly manner.
Life insurance
In line with our strategy to seek targeted acquisitions in the international life insurance sector, we acquired an international life
insurance business in 2014. Nordea Life & Pensions Limited, an Isle of Man life insurer which is open to new business was acquired
in November 2014. In January 2015 we agreed to acquire Scottish Widows International Limited, a closed book life insurer which
provides unit-linked life insurance policies and portfolio bonds to individual investors. We intend to transfer both companies into our
wholly owned Isle of Man life insurance subsidiary, LCL International Life Assurance Company Limited (“LCLI”), subject to
regulatory and court approvals. We expect the acquisitions to be earnings enhancing in 2015 and to generate an early payback of our
investment. The Nordea Life & Pensions acquisition has benefited CTIS in the Isle of Man through an increased run-off servicing
contract.
Non-life Run-off
The Group’s three non-life insurance companies delivered a small operating loss. We had previously decided not to acquire any
further non-life run-off businesses and are exploring our options in this market.
Case study
Securing opportunities to acquire offshore life companies
17
We are seeking acquisition opportunities in the international life insurance sector as part of our growth strategy for our Owned
Insurance Companies business. These also provide additional servicing contracts for Charles Taylor Insurance Services and offer the
potential of cash releases to Charles Taylor.
Our life insurance business is led by Jeffrey More, Chief Executive Officer of Charles Taylor Insurance Services in the Isle of Man. In
2014, Jeffrey led the project to acquire Nordea Life & Pensions Limited (NLP), an Isle of Man life insurer which provides
personalised life insurance products to high net worth individuals. This was the third acquisition of an international life insurance
business led by Jeffrey in the last three years
Our Isle of Man team is now working to merge the business into our wholly owned Isle of Man-registered life insurer, LCL
International Life Assurance Company Limited (LCLI), which specialises in acquiring and aggregating international life insurance
businesses.
Charles Taylor Insurance Services (IoM), is providing a highly personalised administration services to Nordea’s policyholders.
“Nordea Life & Pensions’ policyholders will continue to enjoy very high levels of service. By
merging the business into Charles Taylor’s own life insurer, we will be able to streamline
management and improve systems, delivering efficiencies without compromising service to
existing policyholders.”
Jeffrey More, Chief Executive Officer, Charles Taylor Insurance Services (IOM)
Other business strategy initiatives
In addition to the initiatives to optimise business operations already highlighted in this and the Group’s half year report, we
also took a number of steps to further strengthen and increase the efficiency of our shared services teams in 2014:
–
We expanded our new IT team based in Vietnam to take advantage of the high levels of IT literacy and lower operating costs in
Vietnam.
–
We made a series of key hires across all our business lines to drive forward our growth strategy. These include the Group Chief
Financial Officer and Group Human Resources Director. We also appointed a Performance and Strategy Director for
Management Services – UK & International, a Corporate Development Director for Adjusting Services, Chief Operating
Officers for Non-life Insurance Support services and our Captive Management business and created the new role of President of
Management Services – Americas.
See Business Strategy page 9.
Current trading and outlook
Charles Taylor has had a steady start to 2015 and we are looking forward to another year of positive progress.
In Professional Services:
–
We have further strengthened our business operations by enhancing our core capabilities, improving our systems and making
key hires in strategically important posts, enabling us to drive forward our growth plans.
–
We are delivering growth in the core professional services businesses. Our Management Services and Insurance Support
Services businesses are performing well and our Adjusting Service business is poised to benefit when insured losses from large
and complex claims return to more normal levels.
–
We are executing our plans to create our medium-term strategic options. In particular we are excited about the prospects for the
Group’s new turn-key managing agency. We are building momentum behind our strategy to make carefully targeted M&A
opportunities. Our recent acquisitions are contributing to the performance of our Professional Services business; further, we are
exploring other potentially attractive opportunities.
In Owned Insurance Companies, we recently announced the acquisition of a life insurance company – the fourth in three years – and
believe that there is potential for further acquisitions.
Rights issue
We are very confident in the future prospects for the Group and are currently exploring a number of further opportunities and
initiatives to take forward our business strategy for growth and achieve greater shareholder value. We believe the time is now right to
further strengthen the Group’s balance sheet to give us the resources to capitalise on these opportunities and have announced a rights
issue to raise £30.6m in new equity by way of an offer of three shares for every seven shares held. See Regulatory News
Announcement issued to the London Stock Exchange on 18 March 2015.
18
Our result has been achieved thanks to commitment of our highly professional team and I would like to thank all our staff for their
hard work throughout the year.
David Marock
Group Chief Executive Officer
17 March 2015
19
How we measure performance
Business strategy initiatives are highlighted in the Group CEO’s reports with the following symbols:
Optimise business operations
Create growth in the core
Professional Services businesses
Explore medium-term strategic options
Our key performance indicators show an improvement in adjusted profit before tax and adjusted earnings per share. The
Professional Services businesses increased revenue and operating profit segment profit driven by a strong performance in
Management Services and a good contribution from Insurance Support Services offsetting a creditable performance by
Adjusting Services in a year where the number of large insured losses across the global insurance market has been unusually
low.
20
Group Chief Financial Officer’s Report
The results for the year are summarised in the table below and explained in more detail in the Group Chief Executive Officer’s review.
Revenue (£m)
Operating segment profit (£m)
Finance costs/other (£m)
Non-controlling interests before tax (£m)
Adjusted profit before tax (£m)
Tax (£m)
Tax on non-controlling interests (£m)
Adjusted earnings (£m)
Adjusted earnings per share (p)
Note:
Professional
Services
121.8
12.2
—
(0.1)
12.1
(1.3)
0.0
10.8
25.65
2014
Owned
Insurance Eliminations/
Companies
Other
4.2
(3.1)
0.5
—
—
(1.4)
(0.2)
—
0.4
(1.4)
—
—
—
—
0.4
(1.4)
0.88
(3.36)
Total
122.8
12.7
(1.4)
(0.2)
11.1
(1.3)
0.0
9.8
23.17
Professional
Services
111.9
10.4
—
(0.1)
10.4
(1.8)
0.0
8.6
21.11
20131
Owned
Insurance Eliminations/
Companies
Other
5.0
(3.3)
0.8
—
—
(1.5)
0.3
—
1.1
(1.5)
(0.0)
—
—
—
1.1
(1.5)
2.63
(3.69)
Total
113.6
11.2
(1.5)
0.2
10.0
(1.8)
0.0
8.2
20.05
Small rounding differences arise in the total amounts above.
The above financial measures are adjusted to exclude acquired intangible charges, non-recurring items and non-controlling interests as
set out in the table below:
Statutory profit before tax
Amortisation of acquired intangible assets
Non-recurring costs:
Restructuring cost
Charges related to refinancing of senior facilities
Non-controlling interests before tax
Adjusted profit before tax
2014
(£m)
9.6
1.5
2013
(£m)
6.9
1.2
0.2
—
(0.2)
11.1
1.4
0.3
0.2
10.0
Adjusted profit before tax was £11.1 (2013: £10.0m), due to a strong performance by Professional Services and a satisfactory
performance from Owned Insurance Companies.
2014
(£m)
9.6
(1.2)
(0.2)
8.2
42,139
19.48p
Statutory profit before tax (£m)
Income tax expense (£m)
Non-controlling interests after tax (£m)
Net profit attributable to owners of the Company (£m)
Average number of ordinary shares for basic earnings per share
Statutory basic earnings per share (p)
2013
(£m)
6.9
(1.4)
0.3
5.8
40,835
14.22p
Statutory profit before tax was up 39.1% at £9.6m (2013: £6.9m). Statutory EPS was up 37.0% at 19.48p (2013: 14.22p) which
reflects the higher number of shares in issue during the year.
Mark Keogh
Group Chief Financial Officer
Net debt, cash flow and financing
Net debt increased by £0.2m over the year to £32.6m (2013: £32.4m) and free cash flow reduced to £3.8m (2013: £5.5m). As stated at
the Half Year, we consider that a 12-month rolling average figure is a better way to represent the Group’s underlying borrowings. At
31 December 2014, our average net debt was £24.6m, up from £22.0m at 31 December 2013. The increase in the 12-month rolling
average net debt of £2.6m was largely as a result of our investments in the business to deliver our growth strategy. This included
opening new offices to extend the Group’s geographic reach, which we expect will deliver increased revenue once fully established,
and investing in new IT systems to improve operational efficiency. We are continuing to focus on managing our debt while investing
for growth.
The Group’s senior banking facilities were renewed in November 2013 for a five year term. They comprise an amortising senior term
loan of £10.0m and a £30.0m revolving credit facility. In addition, the Group has £5.0m uncommitted overdraft facilities in the UK,
uncommitted overseas facilities of the local currency equivalent of £3.5m and committed overseas facilities of the local currency
21
equivalent of £3.2m. Total headroom on committed facilities at year-end was £17.0m (including surplus cash). Interest rates are
mostly linked to 3 month Libor plus margins of 2.25-2.75%. The senior term loan and revolving credit facility are available until 7
November 2018. The other facilities are renewed on an annual basis.
Retirement benefit schemes
The retirement benefit obligation in the Group balance sheet at 31 December 2014 was £41.5m, compared to £26.7m at the previous
year end. The increase in net obligation has been driven by a change in discount rates driven by a fall in corporate bond yields which
have largely been linked to the drop in gilt yields. There are multi-year programmes in place to recover pension scheme deficits fully
on a regulatory funding basis and funding costs are reflected in management fees charged by the Group where appropriate. Employer
contributions in the year were £3.8m (2013: £3.7m).
Dividend
The second interim dividend for 2014 is 7.50p (2013 final dividend: 6.75p) making the total dividend for the year 10.75p.
Foreign exchange
The Group manages its exposure to foreign currency fluctuations by use of forward foreign exchange contracts and options to sell
currency in the future. The contracts open during the year and at the year-end were to protect the Group’s exposure to movements
between £sterling and the US$, the Singapore $ and the Canadian$. The US$ profits of the Group were translated at 1.65 in 2014
(2013: 1.57). The sensitivity of the Group’s results to movements in exchange rates is explained in note 25 to the Financial
Statements. Results were not materially affected by movements in exchange rates between 2013 and 2014.
Taxation
During 2014, the effective tax rate on statutory profit was 12.2% compared to 19.8% in 2013. The underlying tax rate, which is
calculated on adjusted profit and excludes prior year adjustments and the recognition of new deferred tax assets, was 11.0% (2013:
16.1%). The statutory and underlying tax rates are lower because a larger proportion of profits were generated in lower tax countries.
Mark Keogh
Group Chief Financial Officer
17 March 2015
22
How we manage risk
The Group’s risk management processes are designed to identify, evaluate and manage the risk of failing to achieve our business
objectives.
Our systems of internal control which include the risk management, compliance and internal audit functions, report to the Group board
through the Audit Committee.
The Board, senior management and the Group’s businesses review the risks and controls set out in the Group’s risk register on a
regular basis. The Board requires risk mitigation actions to be completed appropriately and in a timely manner. The internal audit
function undertakes regular reviews of the risks highlighted in the risk register and inspects systems, processes and practices across the
Group’s offices on an on-going basis. A full explanation of our risk management and internal control processes is set out on page 34.
The Group’s risks reflect the fact that our activities are primarily based around providing professional services to clients in the global
insurance market.
The material risks identified at Group level fall into the three categories of business, financial, and regulatory compliance risks.
1.
Business risks
Type of risk
Risk description
Management action
Business concentration
A high proportion of Group revenues
are derived from the management of the
Standard Clubs and Signal Mutual.
We invest significant senior time and resource in
client relationship management to ensure that we
maintain the standards of service that our clients
expect. Senior management takes responsibility for
ensuring that high standards of service can be set
for new clients and ventures, without impacting
existing commitments.
Where a small number of key clients
purchase an increasing number of
services, the risk of conflicts of interest
arising, and the impact of those
conflicts may be higher.
Mutual management involves a long term
relationship with deep connections between the
manager and the mutual, which provides
opportunities to identify and address satisfactorily
any potential issues whether of service, conflict or
otherwise, at an early stage.
Our strategy to grow and diversify our businesses
across the global insurance market will dilute
revenue concentration over time.
Material errors
As a Professional Services business our
reputation and the potential for repeat
business is dependent on the continued
delivery of a high quality work product.
Staff may make errors in the course of
their work, some of which may not be
covered by insurance.
Where relevant circumstances arise, the
potential consequences need to be
identified in order that the risk can be
mitigated, and to ensure that insurance
cover is not invalidated by e.g. late
notification.
We embed procedures and conduct training to
reduce the risk of failure to provide services to a
high standard.
Service levels are monitored and control processes
are regularly reviewed, including procedures for
supervision and peer review of work.
Where possible, the Group’s standard terms are
used as the basis for contracting; these include
contractual protections.
The Group purchases professional indemnity
insurance to mitigate the financial impact of
claims that may arise. The Board is involved in
this purchase.
The Group has a central database to log incidents
which occur, and incidents which may give rise to
a claim are managed by the Group legal function.
23
Staff Issues Including loss of key
teams
All of our businesses depend on
recruiting and retaining experienced and
well-qualified professionals to deliver
our services.
Loss of business could result from
individuals or teams leaving for
competitors.
Failure to provide committed
service
Training programmes are in place to give staff the
opportunity to develop.
Lack of business growth across the
Group could cause key staff to leave or
make recruiting new staff increasingly
difficult.
Management is required to consider medium and
long-term succession planning in accordance with
anticipated client demand.
The Group has a large number of
business units, business lines and
widespread office locations.
Organisation structures are planned to ensure that
control is maintained and that business units are
managed by personnel of suitable quality and
experience.
There is a risk that we could fail to
provide the service product that we are
committed to provide, to properly and
consistently manage all parts of the
business, or fail to identify a breakdown
in management reporting.
Business development can sometimes
make additional demands on key staff
outside their day-to-day job
specification.
High fixed cost base/operational
leverage
We ensure that remuneration and benefits, career
opportunities, working conditions and staff
recruitment processes are carefully reviewed and
implemented to ensure that suitable personnel are
attracted to work in the Group and are retained.
The Board maintains contact with all businesses,
both through the business management structure
and directly.
We have established clear budgetary and other
financial control processes within the management
of business units.
BCP and crisis management teams have been
established.
Other business-critical risks may
adversely affect the whole or a
significant part of the Group.
Occurrences such as pandemic, cyberattack, and IT failure could result in
staff being unable to meet business
commitments.
Professional indemnity insurance is maintained,
and limits are reviewed annually.
In the event of a material fall in
revenues, there is a risk that such fall is
not matched by an immediate,
proportionate reduction in costs with a
consequent impact on earnings.
Senior management is focussed on reducing costs
without impacting adversely either the delivery of
services, or participation in opportunities for
growth.
The Group considers outsourcing and offshoring,
and manages a detailed budgeting process,
tracking revenues and expenses on a monthly
basis.
The Group may, where appropriate, offer variable
remuneration to new joiners.
External Events
The Group is at risk that external events
which are unanticipated, or the effect
and scope of which cannot be foreseen,
impact upon the business of CT. This
could either be sudden or gradual in
nature. This would include the adjusting
businesses dependence on the
frequency, size and complexity of
insurance claims which are in turn
dependent on, amongst other things, the
occurrence of natural and man-made
incidents, accidents and catastrophes.
24
The Group has a diversified business model within
its sector. This allows it to spread the risk of the
impact of an external event on one area of the
business.
The Group actively monitors industry trends and
where appropriate will assist its clients with
lobbying on behalf of their respective industries.
2.
Financial risks
Type of risk
Risk description
Management action
Banking covenant breaches, cash
cover and liquidity issues
CT maintains banking facilities. These
may contain financial covenants and
restrictions on conduct.
Banking facilities might be withdrawn
or not renewed.
We manage working capital and monitor relevant
performance indicators in order to identify and
take appropriate management steps to mitigate the
risk. Covenant compliance is reported to and
considered by the Board. Cash flow is budgeted
and reforecast regularly.
Refinancing may not be secured for
amounts outstanding when a facility
expires.
There are regular cash flow forecasts to project the
future funding position and to monitor expected
headroom against banking facilities and covenants.
Cash inflow may be insufficient to
cover outgoings, or outgoings may be
planned at an unaffordable level.
The Group maintains an open and regular dialogue
with a small number of relationship banks.
Facility headroom may be insufficient.
Further information on management of liquidity
and foreign exchange risks is given in note 1 to the
accounts.
The Group operates four defined benefit
pension schemes.
The condition of the Group’s defined benefit
pension schemes is regularly monitored.
We face the risk that the outstanding
pension scheme deficits may need to be
funded within a short timescale.
There is regular dialogue between the Group and
the schemes’ trustees covering investment policy
and an assessment of asset and liability risks.
Significant increase in liability to
fund defined benefit pension
schemes
All the defined benefit pension schemes are closed
to new members. The largest scheme has been
closed to future accruals.
Pensionable salary increases are capped by
reference to inflation.
Trustees and employer negotiate funding formally
every three years.
3.
Legal and Regulatory risks
Type of risk
Risk description
Management action
Material breach of legal and
regulatory obligations
The Group’s services are subject to
legal and regulatory control in many
different jurisdictions worldwide.
The Group’s Audit Committee oversees the risk
management and compliance functions. This
includes challenge and recommendation where
appropriate.
Failure to meet regulatory requirements
could lead to fines or legal action
against individuals and the Group.
The Group’s Compliance and Risk Committee
monitors the Group’s compliance and risk
activities. This includes ensuring that the Group’s
regulated subsidiaries and functions performed on
behalf of clients which are regulated entities
continue to meet the relevant regulatory
requirements.
The Group regularly reviews its policies and
procedures in relation to regulatory matters and to
ensure appropriate training is conducted.
25
Corporate Governance
Corporate Social Responsibility and Diversity
The Group is committed to conducting its business affairs in a fair, proper and ethical manner and in compliance with all
applicable laws, regulations and relevant professional standards.
Core values
The Group has adopted a set of corporate values, which have been communicated to all employees. We recognise the need for
commitment to all our stakeholders, be it our employees, our clients, our shareholders, our banks, our service providers, and local
communities.
Environmental policy
Damian Ely is the executive director responsible for the Group’s environmental policy. While the Group’s operations as a service
provider do not affect the environment to the same extent as some other companies, the Group seeks to minimise the environmental
impact of its business operations and aims to follow best practice in areas in which it does have an environmental impact.
The Group is committed to reducing its carbon footprint and strives to minimise its energy consumption through its energy
management policy and by encouraging staff to be aware of the environment and to use energy thoughtfully. Where possible the
Group uses energy-efficient business appliances and computers, thereby giving rise to energy savings and a reduction in emissions.
Details of the Group’s Greenhouse Gas emissions are set out in the Directors’ Report on page 64.
The Group’s head office incorporates a number of design and other initiatives to reduce that office’s environmental impact and carbon
footprint. Electronic document management systems have been implemented in most business units to reduce paper usage. In order to
reduce travel-related emissions, the Group encourages the use of video-conferencing technology in its offices. As part of its
environmental policy the Group operates various recycling programmes. The company publishes its UK policies on energy
management, environment and sustainability on the Company intranet, CTConnect.
Employees
Our employees play a vital role in accomplishing the Group’s goals. David Marock is the executive director responsible for
employees. At 31 December 2014, the Group had 1,061 permanent employees compared to 980 at 31 December 2013.
The Group is committed to providing an environment in which individual talents can flourish and for there to be fair and equal
employment opportunities for all persons. The Group is an equal opportunities employer and bases all decisions on individual ability
without regard to race, religion, beliefs, political opinions, creed, colour, ethnic origin, citizenship, nationality, marital/parental status,
identity expression, gender, sexual orientation, age or disability. Appropriate training and career development are available at all
levels and the Group is committed to helping employees to realise their potential by gaining relevant skills and experience.
The Group seeks to ensure the health, safety and welfare of all its employees and to meet all its obligations under the relevant
legislation. Employees are expected to co-operate with management to create a safe and healthy working environment for themselves
and others and to take reasonable care for their own health, welfare and safety at work. The Group’s health and safety responsibilities
are accorded equal priority with the Group’s other statutory duties and objectives.
The Group gives full and fair consideration to applications for employment made by disabled persons and will make reasonable
adjustments to remove substantial disadvantages faced by disabled persons, whether as employees, candidates for promotion or job
applicants. If an employee were to become disabled whilst employed, the Group would endeavour to make arrangements, wherever
possible, to continue their employment with the Group.
We recognise the importance of communication with our employees; we encourage two-way communications through the
management hierarchy. Employees are kept informed of developments in our business through internal communications, including the
Company intranet, CTConnect and annual Town Hall meetings with the Group Chief Executive Officer.
Employees are encouraged to become shareholders in the Company. This is primarily through the operation of the Company’s
sharesave scheme, details of which are set out in the Directors’ Remuneration Report on page 55. Senior management and many
managers across the business also receive part of any annual bonus award as deferred shares. The Company publishes its employment
policies on the Company intranet, CTConnect.
Human rights
Charles Taylor does not have a separate human rights policy. A respect for human rights is implicit in our employment policies,
corporate values and global policies on data protection, privacy, entertaining, gifts, bribery and financial crime.
26
Diversity
During 2014 there were five executive and five non-executive directors of the Company, of which nine were male and one female. 10
people were senior managers of the Company during 2014, of which 9 were male and one female. These are the executive directors
and members of the Executive Committee. At 31 December 2014, the Company employed 599 permanent male members and 416
permanent female members of staff.
Social and community involvement and charitable and political donations
The Group seeks to encourage employee involvement in community projects and programmes. The Group’s staff supported a number
of charities through various fund raising activities during 2014. During the year the Group made charitable contributions of £12,904
(2013: £16,544), principally to local charities serving the communities in which the Group operates. It is the Group’s policy not to
make political donations. No political contributions were made during the year (2013: £nil).
Strategic Report approval
The Board confirms that to the best of its knowledge the Strategic Report includes a fair review of the development and performance
of the business and the position of the Company and the undertakings included in the consolidation taken as a whole, together with a
description of the principal risks and uncertainties that they face.
Approved by the Directors and signed on behalf of the Board.
Ivan Keane
Group Company Secretary and
General Counsel
27
Corporate Governance Report 2014
Chairman’s Statement on Corporate Governance
Dear Shareholder,
I am pleased to present the Board’s annual report on corporate governance. The Company is committed to maintaining high
standards of corporate governance, which we regard as essential to support the growth of our business and to protect shareholder
value. This review, together with the reports of the Nomination, Audit and Remuneration Committees, provides an overview of our
corporate governance practices and summarises our activities in this area during the year.
There have been a number of changes to the Board during the year. Tito Soso gave notice of his resignation as Group Chief Financial
Officer in April 2014, but remained on the Board until a suitable replacement was found. The Nomination Committee immediately
commenced a search for a replacement and Mark Keogh joined the Company in June 2014 and was appointed Group Chief Financial
Officer on 29 August 2014. Julian Cazalet retired from the Board in October 2014 and Barnabas Hurst-Bannister replaced him on the
Board, with Gill Rider taking over as Senior Independent Non-Executive Director from Julian Cazalet, in addition to her role as
Chairman of the Remuneration Committee. As reported in last year’s report, Edward Creasy joined the Board on 1 January 2014.
These appointments will enhance the breadth of knowledge and experience amongst our Board members.
We have again undertaken a formal, internal evaluation of the Board’s effectiveness. The results of this exercise are summarized on
page 36. The Nomination Committee reviewed the appropriateness of each of the Directors putting themselves forward for election or
re-election at the forthcoming AGM. I am pleased to report that I am satisfied that the Board and each of the Directors are operating
effectively. I am therefore happy to recommend that each of the directors should be elected or re-elected as appropriate at the 2015
AGM.
During 2014, we have maintained our policy of shareholder engagement. In addition to the continuing rounds of dialogue with many
of our shareholders at the time of our interim and final results, I have also contacted our largest shareholders, constituting around two
thirds of our register. The majority of these have engaged and I have been able to have useful and constructive conversations and
meetings with these shareholders. We intend to continue this policy of engagement with our shareholders in the coming year, to ensure
that the Board stays abreast of the development of shareholder views on governance and other key issues.
The directors, whose names and details are set out on pages 29 to 31, are responsible for the corporate governance of the Company.
They support the principles of good corporate governance and the code of best practice laid down in the UK Corporate Governance
Code issued by the Financial Reporting Council in September 2012 (the Code), which is publicly available at www.frc.org.uk.
Throughout the year ended 31 December 2014 the Board believes it has complied with the principles and provisions recommended by
the Code.
Rupert Robson
Chairman
17 March 2015
28
Board of Directors
Leadership
The Board is collectively responsible for the long-term success of the Company. It does this by providing entrepreneurial leadership
whilst ensuring effective controls are established that enable the proper assessment and management of risk. The Board is ultimately
responsible for the Company’s strategic aims and long-term prosperity by ensuring that the right financial and human resources are in
place to deliver the Company’s strategy and objectives.
The day-to-day management and leadership of the Company is performed by the Executive Committee, which includes the heads of
the Group’s businesses, the Group Company Secretary and General Counsel and the Director of Human Resources.
Key:
1
Nomination Committee
2
Remuneration Committee
3
Audit Committee
Board of directors – Non-Executive Directors
Rupert Robson1, 2
Chairman
Chairman Nomination Committee
Rupert was appointed to the Board on 1 November 2007. He is also Chairman of EMF Capital Partners, Tullett Prebon plc and Sanne
Holdings Limited. Previously he was a Non-Executive Director of OJSC Nomos Bank, LME Holdings Ltd and Tenet Group Ltd, and
Managing Director, Global Head, Financial Institutions Group, Corporate, Investment Banking and Markets at HSBC and Managing
Director, Head of European Insurance, Investment Banking at CitiGroup Global Markets.
Gill Rider1, 2, 3
Senior Independent Non-Executive Director
Chairman Remuneration Committee
Gill was appointed to the Board on 25 January 2012. She is also President of the Chartered Institute of Personnel and Development
(CIPD), Chair of the University of Southampton Council and a Non-Executive Director of De La Rue plc and Pennon Group plc.
Previously she worked for Accenture for 27 years and was a member of the global Executive Committee for the last seven years. Most
recently, she spent five years as Director General in the UK Government’s Cabinet Office and as Head of the Civil Service Capability
Group.
Board of directors & Executive Committee – Executive Directors
David Marock
Group Chief Executive Officer
David was appointed Group Chief Executive Officer and to the Board on 1 July 2011. He joined from specialist insurer Beazley plc,
where he was Group Chief Operating Officer, a member of the Group Executive Committee and on the Board of Beazley Furlonge
Limited. He previously chaired the Xchanging Review Board and was on the Claims Service Review Board on behalf of the Lloyd’s
Market Association and a member of the Lloyd’s Market Association Claims and Market Process Committees. Prior to that he was at
McKinsey & Company, advising financial services clients on strategic, operational and corporate finance matters. David is a Fellow of
the Faculty of Actuaries. He is a Director of The Standard Club Limited, The Standard Club Europe Limited and Charles Taylor
Managing Agency Limited.
29
Damian Ely
Group Chief Operating Officer
Damian joined in 1988 to work as an underwriter in London in the Management Services business, primarily for Signal. In 1995 he
transferred to the United States, first as Senior Vice President, Signal and latterly as Chief Operating Officer, Americas. He returned to
the UK to take up the role of Group Chief Operating Officer in 2005. He is a Director of Signal Mutual Indemnity Association
Limited. He was appointed to the Board on 14 October 2005.
Executive Committee
Stephen Card
Chief Executive, Charles Taylor Insurance Services
Stephen joined in 2010 as Chief Executive of Charles Taylor Insurance Services. He is an insurance professional with over 35 years’
experience of broking and underwriting in the Lloyd’s and London insurance market.
Arthur Clarke
Chief Executive, Charles Taylor Adjusting
Arthur joined in 2002 as Operations Director for CTC Services. Previously he was an Executive Director of Xchanging Claims
Management formerly Lloyd’s Underwriters Claims and Recoveries Office. He has worked in the Lloyd’s and London insurance
market for over 30 years.
Suzanne Deery
Director of Human Resources
Suzanne joined in 2014 as the Director of Human Resources with responsibility for the Group’s global HR strategy and for the
operational management of our HR team. She previously worked at PwC, where she was most recently Regional HR Director and
Talent Leader for Central and Eastern Europe.
David Watson1, 2, 3
Non-Executive Director
Chairman Audit Committee
David was appointed to the Board on 19 May 2010. He is also Senior Independent Non-Executive Director of Countrywide plc, and a
Non-Executive Director of T R Property Investment Trust plc, Hermes Fund Managers Limited and of Kames Capital plc. He was
formerly Chief Financial Officer of Aviva General Insurance following a career of more than 30 years in a variety of companies in the
financial services industry including nine years as Group Finance Director of M&G Group Plc.
Edward Creasy1, 2, 3
Non-Executive Director
Edward was appointed to the Board on 1 January 2014. He has had a career in the London Market Insurance industry. He was Chief
Executive Officer of Kiln plc and latterly Chairman of the Kiln Group from 2001 to 2010 and has been a Director of the Lloyd’s
Franchise Board. He is currently a director of Charles Taylor Managing Agency Limited, Lycetts Holdings Limited, Lycett BrowneSwinburne & Douglass Limited, WR Berkley Insurance (Europe), Limited, WR Berkley Syndicate Limited and Deputy Chairman of
WR Berkley Syndicate Management Limited. Edward is also Senior Independent Director and Chairman of the Audit Committee at
Pacific Horizon Investment Trust plc and a Member of the Council of Lloyd’s Market Supervision and Review Committee.
Barnabas Hurst-Bannister1
Non-Executive Director
Barnabas was appointed to the Board on 8 October 2014. He has had a long career in insurance, initially as a broker before moving to
underwriting and spending twenty years underwriting Marine and Non-Marine classes, before becoming chairman of Travelers’
Syndicate Management Limited. Barnabas is a former Chairman of the London Market Group and the Lloyd’s Market Association
and a former member of the Council of Lloyd’s. He is currently Non-Executive Chairman of Torus Underwriting Management
Limited and a Non-Executive Director of Price Forbes & Partners Limited, The Standard Club Limited, The Standard Club Europe
Limited, Charles Taylor Managing Agency Limited and Talbot Underwriting Limited and formerly a Non-Executive Director of
Torus Insurance UK Limited.
30
Mark Keogh
Group Chief Financial Officer
Mark joined as Group Chief Financial Officer designate and was appointed to the Board on 16 June 2014, becoming Group Chief
Financial Officer on 29 August 2014. He joined from Meridien Restructuring, an interim management firm. He was previously Group
Managing Director & Finance Director of Warner Estate Holdings plc, a quoted real estate investment trust. Mark has also acted as
finance director of Severn Trent Water, Mowlem Construction Services and BP Marine. Mark is a qualified civil engineer, a Member
of the Institution of Engineers of Ireland (MIEI), a Chartered Accountant (ACA - ICAEW) and a Chartered Taxation Adviser (CTA ATII).
Joe Roach
Chief Executive, Management Services – Americas
Joe joined the Group in 1995 and is Chief Executive of both Charles Taylor Americas and Signal Administration Inc. Previously he
was at McQueary and Henry Inc, an insurance broker and he worked until the end of 1995 for Signal Administration Inc. (Texas),
which provided marketing and risk selection services to Signal Mutual Indemnity Association Ltd. He was a Deputy Chairman of the
Group between 2006 and 2007. He is a Director of Signal Mutual Indemnity Association Limited. He was appointed to the Board on
11 February 1997.
Jeremy Grose
Chief Executive, Management Services – UK & International
Jeremy joined in 1991 and took over as CEO of the management services business on the retirement of Alistair Groom in February
2014. Prior to that he was Chief Operating Officer of P&I management division.
Ivan Keane
Group Company Secretary and General Counsel
Ivan joined in 1989 having previously worked as a solicitor in private practice. He has held a wide variety of senior executive roles
within the Group, including working in P&I and other businesses, establishing and managing mutuals, and business development. He
was appointed Group Company Secretary in 2005 and acts as Group General Counsel.
Christian Schirmer
Chief Executive, Non-Life Insurance Support Services
Christian joined in 2013 as Head of ISS. He joined from Guy Carpenter, where he was CEO Pacific Region and Head of Analytics,
Asia-Pacific. He has previously worked as a management consultant, advising a wide range of insurance businesses and was head of
outward reinsurance at a major Lloyd’s managing agent. Christian is a Fellow of the Institute of Actuaries in both the UK and
Australia.
31
Board Responsibilities
The Board has delegated certain responsibilities to the Audit Committee, Remuneration Committee and Nomination Committee,
which report back to the Board. The Terms of Reference of each Committee are available in the Investors section of the Company’s
website.
Nomination Committee
Rupert Robson chairs the Nomination Committee, on which the non-executive directors, Edward Creasy, Barnabas Hurst-Bannister,
Gill Rider and David Watson also sit. The Nomination Committee Report is set out on page 36.
Audit Committee
David Watson chairs the Audit Committee. The non-executive directors, Edward Creasy and Gill Rider are members of the
Committee. David Watson is considered by the Board to have recent and relevant financial experience. The Audit Committee Report
is set out on page 37.
Remuneration Committee
Gill Rider chairs the Remuneration Committee. The non-executive directors, Edward Creasy, David Watson and Rupert Robson are
members of the Committee. The Directors’ Remuneration Report is set out on pages 40 to 61.
The Company has a set of formal governance policies, which are periodically reviewed and detail the formal matters reserved for the
Board.
The Board carries out its role by:
–
monitoring the Company’s operations worldwide;
–
providing input into and approval of management’s development of corporate strategy and performance objectives;
–
approving budgets and monitoring progress against those budgets;
–
monitoring and reviewing the effectiveness of the Company’s internal systems of control;
–
reviewing and ratifying the Company’s system of governance, compliance, risk management and internal audit; and
–
appointing and removing, where appropriate, the senior executives of the Company.
The Board reviews all aspects of the Company regularly, including major commercial decisions, client relationships, operations,
financial performance and position, employee matters, company policies, compliance, risks, risk management and internal audit. This
ensures that the Board is able to direct the management of the Company to the best of its ability and identify, address and resolve
matters of importance in a timely manner.
The Board has delegated to management responsibility for:
–
managing the Company’s day-to-day operations;
–
developing the Company’s annual budget and recommending it to the Board for approval;
–
managing the day-to-day operations within the budget;
–
the development and maintenance of client relationships; and
–
implementing strategy and making recommendations on significant strategic initiatives.
There is a clear division of responsibilities on the Board. The Chairman is responsible for running the Board and the executive
directors are responsible for running the Company. The non-executive directors are responsible for exercising independent and
objective judgment by constructively challenging proposals and recommendations from the executive directors in helping the Board to
reach its decisions.
As Chairman, Rupert Robson is responsible for:
–
leadership of the Board, ensuring its effectiveness on all aspects of the Board’s role;
–
setting the Board agenda and ensuring that the directors receive accurate, timely and clear information;
–
oversight of the Company’s affairs and its strategy;
32
–
facilitating openness and debate between the executive and non-executive directors;
–
ensuring effective communication between the Company and its shareholders; and
–
succession planning and the composition of the Board.
David Marock, as the Group Chief Executive Officer, is responsible for:
–
the day-to-day management of the Company;
–
development and implementation of Company strategy; and
–
managing major client relationships.
Gill Rider is the Senior Independent Non-Executive Director (SID), having replaced Julian Cazalet on his retirement from the Board
during the year. The SID acts as a sounding board for the Chairman and as an intermediary for the other directors, where necessary.
The SID is also an additional point of contact for shareholders, if they have reason for concern and where contact through the normal
channel of the Chairman has failed to resolve the concern or for which such contact is inappropriate.
All directors, whether executive or non-executive, have unrestricted access to the Group Company Secretary and General Counsel and
senior executives/managers within the Group on any matter of concern to them, in respect of their duties. In addition, new directors
are given a tailored induction and/or appropriate training on appointment to the Board. Appropriate time was set aside during the year
for training on relevant topics concerning the operation and function of the Board and the responsibilities and obligations of the
directors. The Company has undertaken to reimburse legal fees to the directors, if circumstances should arise in which it is necessary
for them to seek separate, independent legal advice in the furtherance of their duties.
Apart from David Marock and Barnabas Hurst-Bannister, in respect of their directorship of The Standard Club and Damian Ely and
Joe Roach in respect of their directorship of Signal Mutual Indemnity Association, at no time during the year did any of the other
directors hold a material interest in any contract of significance with the Company or any of its subsidiary undertakings other than a
third-party indemnity provision between each director and the Company and service contracts between each executive director and the
Company. The Company has purchased and maintained throughout the year Directors and Officers liability insurance. Details of the
directors’ remuneration, service agreements and interests in the shares of the Company are set out in the Directors’ Remuneration
Report on pages 40 to 61.
The non-executive directors, Edward Creasy, Gill Rider and David Watson are considered by the Board to be independent of the
management and free from any business or other relationship that could materially interfere with the exercise of their material
judgement, notwithstanding their shareholdings held during the year, which are considered to be not significant by the Board and in
the case of Edward Creasy, notwithstanding that he serves as a non-executive director on several subsidiary boards of the Company.
Barnabas Hurst-Bannister was treated as being independent on his appointment, notwithstanding he serves as a director on two of the
Standard Club’s group boards in a non-executive capacity. However, following the increase in The Standard Club’s shareholding in
the Company, Barnabas Hurst-Bannister is no longer treated as being independent in accordance with the Code. Once he was no
longer treated as being independent in accordance with the Code, Barnabas Hurst-Bannister stepped down as a member of the Audit
and Remuneration Committees in order that the Company continued to comply with the Code in respect of the membership of those
Committees.
The Chairman, Rupert Robson, was considered independent upon his appointment in 2007, but is not considered to be independent by
virtue of his appointment as Chairman. The letters of appointment of the non-executive directors are available for inspection at the
Company’s registered office during normal business hours and at the AGM.
The Board has maintained procedures whereby potential conflicts of interest are reviewed regularly. The Board has considered the
other appointments held by directors, details of which are contained in their biographies on pages 29 to 31, and on the Company’s
website and considers that the Chairman and each of the directors are able to devote sufficient time to fulfil the duties required of them
under the terms of their service agreements or letters of appointment.
Directors’ attendance at the Board and committee meetings convened in the year was as follows:
Board
10
Total number of meetings in 2014
Number of meetings attended in 2014:
Rupert Robson – Non-Executive Chairman1
David Marock – Group Chief Executive Officer
Damian Ely – Group Chief Operating Officer
Tito Soso – Group Chief Financial Officer (resigned 29 August 2014)
Mark Keogh - Group Chief Financial Officer (appointed 16 June 2014)
10
10
10
5
5
33
Committee meetings
Audit
Nomination Remuneration
5
6
4
—
—
—
—
—
6
—
—
—
—
4
—
—
—
—
Alistair Groom (resigned 28 February 2014)
Joe Roach III
Edward Creasy – non-executive2
Julian Cazalet – non-executive2 (resigned 6 October 2014)
Barnabas Hurst-Bannister – non-executive2 (appointed 8 October 2014)
Gill Rider – non-executive2
David Watson – non-executive2
1
9
10
7
3
10
10
1
Member of the Remuneration and Nomination Committees during the year.
2
Member of the Audit, Remuneration and Nomination Committees during the year.
—
—
5
4
1
5
5
—
—
6
5
—
6
6
—
—
3
3
1
4
4
There are three management committees: the Executive Committee, the Finance Committee and the Group Compliance and Risk
Committee, formed of executive directors and/or senior executives/managers from the businesses, which meet on a regular basis to
consider commercial, financial and operational issues and matters.
Fair, balanced and understandable assessment
In relation to compliance with the Code, the Board has given consideration to as to whether or not the Annual Report and Accounts,
taken as a whole, is fair, balanced and understandable and concluded that it is. A statement to this effect is included in the Directors
Responsibilities Statement on page 66. The preparation of this document is co-ordinated by the Finance and Company Secretariat
teams with group-wide support and input from other areas of the business. Comprehensive reviews have been undertaken at regular
intervals throughout the process by senior management and other contributing personnel within the Company.
The directors’ responsibilities for preparing the financial statements and supporting assumptions that the Company is a going concern
are set out on pages 66 and 62 respectively.
Risk management and internal control
There is an ongoing process for identifying, evaluating and managing the significant risks the Company faces. These risks include
strategic, operational, legal, regulatory, reputation and financial risks. The Company’s risk management processes are designed to
manage, rather than eliminate, the risk of the Company failing to achieve its business objectives, and can only provide reasonable, but
not absolute, assurance against material misstatement or loss.
The Company’s risk management systems are subject to continual review and development. The controls and processes are overseen
by the Group Chief Operating Officer and the Group Compliance and Risk Officer in conjunction with the Group Compliance and
Risk Committee. The Company’s compliance and risk management processes and systems are designed to ensure that management
and the Company’s various business units regularly review the risks and controls in their risk registers and that the tracking and
monitoring of outstanding risk mitigation actions or controls are actioned in a timely manner and properly followed up. The Group
Compliance and Risk Committee reports on its work to the Audit Committee and there is a standing invitation for members of the
Audit Committee to attend the Group Compliance and Risk Committee meetings.
The principal risks facing the Company and the risk mitigation actions, controls and processes by which they are managed are
explained in the report on the management of risks on pages 23 to 25. The Audit Committee and the Board monitor and review the
Company’s principal risks regularly along with the risk mitigation actions, controls and processes in place to manage those risks
recorded in the risk register to ensure they are up to-date and remain appropriate taking into account the changing circumstances in
which the Company operates.
Further information on financial risks is given in note 25.
The Company’s offices worldwide have in place plans to deal with a range of eventualities, which could cause serious disruption to
the Company’s businesses such as a fire, a natural disaster or flooding. These plans are also designed to cope with situations such as
an outbreak of a pandemic. Business continuity planning arrangements, especially in respect to IT, have been developed and are
regularly tested to enable key offices around the world to have a business continuity capability.
The Board is responsible for the Company’s system of internal control, which consists of internal audit, compliance and risk
management teams, along with various control systems and procedures in each of the Company’s business units. The Board reviews
annually the effectiveness of the Company’s system of internal control in accordance with the Code.
The Board continues to take steps to further embed internal control, compliance and risk management into the operations of the
Company and monitor and review matters which come to management’s and the Board’s attention.
An internal audit team operates within the Company. The team is managed and led by a senior manager who reports directly to the
Group Chief Operating Officer and to the Audit Committee. The Audit Committee and the Board receive four reports each year
summarising the findings of their audits together with a schedule of the outstanding audit issues and progress against their internal
audit timetable.
34
The internal audit team is responsible for auditing the Company’s businesses worldwide. An audit timetable is approved by the Audit
Committee at the beginning of the year and is subject to review throughout the year. The audit programme is focused around the
Company’s principal risks and will also take into consideration amongst other things the operational, financial and administrative
aspects of the Company’s businesses, taking as their points of reference those businesses’ controls and procedures, the controls
recorded in the risk register and any reported incidents. Some audits are occasionally carried out by external consultants or by staff
from outside the internal audit team. The internal audit team’s effectiveness is reviewed annually by the Audit Committee.
The Board confirms that the actions it considers necessary have been taken or are being taken to remedy such failings and weaknesses
which it has determined to be significant from its review of the systems of internal control. This has involved considering the matters
reported to it and developing plans and programmes that it considers are reasonable in the circumstances.
The external auditor’s reports to the Audit Committee include their views as to the principal risks facing the Group from an audit
perspective and how their audit approach seeks to address them.
The Company’s compliance obligations are overseen by the Group Compliance and Risk Officer and the Group Compliance and Risk
Committee, which reports to the Group Chief Operating Officer. The Group Compliance and Risk Officer submits a report to the
Audit Committee four times a year, which includes details of any material incidents reported by management where controls have
either failed or nearly failed. The Company’s systems and controls are regularly reviewed and enhancements made where appropriate,
in light of reported incidents.
The UK regulated activities of the Company are primarily carried out through two principal subsidiaries, Charles Taylor Services
Limited, which is regulated in the UK as an insurance intermediary, and by Charles Taylor Investment Management Company
Limited, which is regulated as an investment manager, by the Financial Conduct Authority (“FCA”), in accordance with the
requirements of the Financial Services Act 2012.
Certain subsidiary companies operate in overseas markets and are regulated by the relevant regulators in compliance with local
regulation.
Relationship with shareholders
The Company values dialogue with its shareholders. Any meetings with shareholders are reported on at Board meetings and the nonexecutive directors may attend such meetings, if they wish to do so. The Company has an “Investor” section on its website.
The Company communicates with shareholders through the annual report, the half year report and the AGM. The Company also meets
with major shareholders when required. The Company has taken advantage of the provisions within the Companies Act 2006 which
allows communication with shareholders to be made electronically, where shareholders have not requested hard copy documentation.
The AGM is held in a central London location and the Notice and any related papers are issued to shareholders at least 20 working
days before the date of the AGM to ensure that shareholders have sufficient time in which to consider the items of business. The AGM
provides the Board with an opportunity to meet informally and communicate directly with private investors. Separate resolutions are
proposed for each item of business and the “for”, “against” and “withheld” proxy votes cast in respect of each resolution are counted
and announced after the shareholders present have voted on each resolution. Voting at the AGM is conducted by way of a show of
hands, unless a poll is demanded, in order to encourage questions from and interaction with private investors. Proxy votes lodged on
each AGM resolution are also announced to the London Stock Exchange and published on the Company’s website. All the directors
attended the AGM in 2014 and all directors are due to attend the AGM to be held on 7 May 2015.
35
Nomination Committee Report
Rupert Robson chairs the Nomination Committee, on which the non-executive directors, Edward Creasy, Barnabas Hurst-Bannister,
Gill Rider and David Watson also sit. In 2014 there were six meetings of the Committee.
Board composition and balance
The Board comprises the Chairman, four non-executive directors and four executive directors and is collectively responsible for the
long-term success of the Company. It does this by providing entrepreneurial leadership, whilst ensuring effective controls are
established that enable the proper assessment and management of risk. The Board is ultimately responsible for the Company’s
strategic aims and the long-term prosperity of the Company, an objective achieved by ensuring that the right financial and human
resources are in place to deliver the Company’s business plan.
The Nomination Committee regularly evaluates and considers the mix of skills, experience and diversity on the Board and is satisfied
that these are appropriate to achieve the Company’s strategy and objectives.
The Company has formal policies to promote equality of opportunity across the Company and considers that diversity includes (but is
not limited to) personal attributes and characteristics, gender, ethnicity, age, disability and religious belief. The aim is to promote
equality, respect and understanding, and to avoid discrimination.
All Board appointments are subject to recommendation from the Nomination Committee, which takes into consideration, amongst
other things, the make-up of the Board and its balance of skills and experience. The Board believes that appointments to the Board
should be based on merit and overall suitability for the role. The Nomination Committee usually engages an executive recruitment
consultancy to assist with identifying suitable candidates to join the Board.
During the year, the Committee reviewed the make-up, knowledge, diversity, balance of skills and independence of the Board. The
Committee engaged an executive recruitment consultant to help identify a new Group Chief Financial Officer to replace Tito Soso,
who resigned during the year, and recommended the appointment of Mark Keogh to the Board. The Committee recommended that
Barnabas Hurst-Bannister be appointed to the Board to succeed Julian Cazalet, who stood down during the year, due to his extensive
Lloyd’s managing agency and marine insurance market experience and to further broaden the Board’s insurance expertise following
Julian Avery’s retirement at the end of 2013 and Alistair Groom’s retirement from the Company last February. The Committee also
considered Board and senior management succession in the Company, governance issues, reviewed and revised its Terms of
Reference and made various recommendations to the Board.
The external search consultancy retained by the Nomination Committee in respect of Mark Keogh’s appointment was Blackwood. The
final selection was the result of a competitive process led by Julian Cazalet and Gill Rider from a short-list of potential consultants.
The Company does not have any connection with Blackwood.
Board Performance and Evaluation
The performance of individual directors, the Board, its committees, and the Chairman are reviewed annually.
These performance reviews took into consideration whether or not the Board and its committees respectively had discharged their
duties, as set out in their terms of reference and whether their terms of reference in each case required updating or amendment. In
order to evaluate the performance of the Board, each member of the Board was asked to complete a detailed questionnaire, as well as
having a one to one review meeting with the SID. The responses to the questionnaires and the findings of these meetings were
reviewed by the Chairman, who summarised the findings and shared and discussed the findings with the whole Board. Topics covered
in the review of the Board included strategy, performance measurement, relationships with key stakeholders, risk management and the
conduct and effectiveness of board meetings. In summary, the Board had made progress in a number of areas and the directors
concluded that the Board had effectively discharged its duties during the year.
The Nomination Committee considered the contribution of each of the executive directors and the Chairman considered the
contribution of each of the non-executive directors. The non-executive directors, excluding the Chairman, considered the contribution
of the Chairman. The non-executive directors have met together without the executive directors during the year as required by the
Code.
The Company’s Articles of Association require that one-third of the Directors offer themselves for re-election every year.
Notwithstanding that as a small company, i.e. below the FTSE 350, the Code does not require all the directors to stand for annual reelection, the Board decided that all directors should be subject to annual re-election unless a director has been appointed since the
previous AGM and is, therefore, subject to election by the shareholders.
Rupert Robson
Chairman of the Nomination Committee
17 March 2015
36
Audit Committee Report
The Audit Committee takes responsibility for monitoring the integrity of the Company’s financial reporting and statements. It also
plays an important role in monitoring and managing the internal and external risks faced by the Company, by reviewing and
challenging the activities of the Company’s compliance, risk management and internal audit teams.
Audit Committee membership
The members of the Committee during the year were David Watson (Chairman), Julian Cazalet, Edward Creasy, Barnabas HurstBannister and Gill Rider. Barnabas Hurst-Bannister joined the Committee on his appointment as a director on 8 October 2014,
following the retirement of Julian Cazalet on 6 October 2014. He subsequently stood down from the Committee in March 2015 when
he was no longer regarded as independent under the Code.
Governance
The Committee members are all independent non-executive directors. The Committee Chairman is considered by the Board to have
recent and relevant financial experience. The Committee meets routinely four times a year and, additionally as required, to review or
discuss other significant matters. The Committee also meets the Company’s external auditor, the internal audit and risk executives
annually without management present.
The Group Company Secretary and General Counsel also attends all meetings and, when requested, the Group Chief Executive
Officer, Group Chief Financial Officer, Group Chief Operating Officer, Head of Internal Audit, external auditors, and the Group
Compliance & Risk Officer, also attend parts of the Committee’s meetings.
Membership of the Committee, details of the number of meetings held and attendance at meetings during the year are shown in the
Corporate Governance section.
The terms of reference of the Committee are available on the Company’s website under the Investor section - Corporate Governance
or from the Company Secretariat department. The Committee’s terms of reference were reviewed and confirmed by the Committee
during 2014.
The Committee Chairman will attend the AGM on 7 May 2015 to answer any questions on the Committee’s responsibilities.
Role and focus
The aims of the Committee are:
–
to monitor the integrity of the annual and half-year results, including reviewing the significant financial reporting judgements
they contain;
–
to advise the Board whether the annual report and accounts, taken as a whole, are fair, balanced and understandable and provide
the information necessary for shareholders to assess the Company’s performance, business model and strategy;
–
to review and monitor the adequacy and effectiveness of the Company’s financial, risk, regulatory and other controls;
–
to review the adequacy of the Company’s arrangements for the prevention and detection of fraud, or bribery and to enable the
effective treatment of whistle-blowing;
–
to monitor the resourcing, plans, findings, recommendations and effectiveness of the Internal Audit and Compliance and Risk
departments; and
–
to oversee the appointment, remuneration, plans, scope and relationship with the external auditor including monitoring its
independence and to consider its reports and findings.
Activities
The Committee discharged its responsibilities as listed above and, in particular, undertook the following activities:
Financial reporting
–
reviewed the preliminary full year and half year results, including accounting issues and judgements supported by internal
management and external auditor commentaries thereon;
–
reviewed the financial statements, 2014 annual report and a report from the external auditor on those statements;
–
considered the representations of management;
–
considered material litigation conducted by the Company and its subsidiaries;
–
reviewed and approved the board statement on internal control practices, principal risks and uncertainties and the Audit
Committee Report in the 2014 annual report; and
37
–
advised the Board on whether the annual report and accounts, taken as a whole, were fair, balanced and understandable and
provided the information necessary for shareholders to assess the Company’s performance, business model and strategy.
Risk management and compliance
–
undertook a detailed review and challenge of the Company’s internal risk reports and the related annual report disclosures;
–
considered reports on incidents occurring in the businesses and any control recommendations;
–
considered the resourcing and structure of the compliance function across the Group;
–
reviewed regular reports from the Group’s compliance and risk function on the work it had undertaken; and
–
held private discussions with the Group Compliance & Risk Officer without management present.
Internal audit
–
considered the staffing and structure of the internal audit function;
–
received and discussed the internal audit effectiveness review;
–
reviewed the draft annual internal audit plan and approved any proposed amendments thereto;
–
reviewed regular reports from the Company’s internal audit function on the work they had undertaken in reviewing the control
environment and internal control systems; and
–
held private discussions with the Head of Internal Audit without management present.
External audit
–
reviewed the performance and effectiveness of the services provided by the external auditor, and considered opportunities for
improvement to the year-end processes by both the finance function and external audit personnel;
–
considered the capability and independence of the external auditor and recommended the re-appointment of Deloitte LLP as the
Company’s auditor;
–
reviewed the draft terms of engagement and fees for both the half year review and full year audits;
–
considered and amended the Company’s policy on the permitted engagement of the Company’s auditor for non-audit services;
–
reviewed and debated the auditor’s assessment of the key risks, issues and proposed approach and scope of the audit work to be
undertaken for the 2014 year end audit;
–
reviewed the external audit findings for the Company and for its material subsidiaries;
–
reviewed the level of fees paid to the external auditor for non-audit services carried out by the auditor in conformity with the
Board’s policy; and
–
met with the external auditor during the year without management present.
Significant financial judgements
The Committee considered the following significant issues regarding the financial statements:
–
whether the attribution of the Company’s business operations to Cash Generating Unit’s (“CGU”) was appropriate, supported
by management and financial reporting structures and whether the carrying value of Goodwill and Intangibles was supported by
appraised values in use under a range of future operating conditions;
–
the determination of revenue for the year and in particular the determination and age profile of debtors and the valuation of
work-in-progress statements and the adequacy of any related provisions;
–
the carrying value of deferred tax balances in the light of the expected geographic distribution of the Company’s future taxable
profits;
–
the funding position of the Company’s defined benefit pension schemes, in comparison with comparable schemes, and the
primary assumptions on which the valuations were based; and
–
the Company’s future profit forecasts and cash flow projections and their sensitivity to future market and economic conditions
and hence whether the going concern basis of accounting was appropriate for the Company’s financial statements.
38
Auditor re-appointment
The Company’s audit services have been provided by Deloitte LLP since the Company’s floatation in 1996 with regular audit partner
rotations. The lead audit partner was last changed by rotation in 2010. The Committee last undertook an external tender for Group
audit in 2013, when Deloitte LLP were retained as the Company’s external auditor after a thorough review process. Resolutions will
be put to shareholders at the AGM over the re-appointment of Deloitte LLP and the setting of its fees.
Non-audit services
The Committee reviews regularly the amount and nature of non-audit work performed by the external auditor. The Committee accepts
in principle that certain work of a non-audit nature is best undertaken by the external auditor. The Company’s policy on non-audit
services provides clear guidance on the categories of non-audit work which may be undertaken by the external auditor, as well as
setting out categories of work that may not be undertaken by the external auditor. The policy also sets out the circumstances when
consent from the Committee is required where work falls into neither the pre-approved nor prohibited categories.
Committee effectiveness
The Committee conducted a review of its effectiveness taking into account both direct feedback and also considering the findings of
the Board review conducted by the Senior Independent Director. The review concluded that the Committee had received sufficient,
reliable and timely information from management to enable it to fulfil its responsibilities and that the Committee had performed a
valuable role in debating the Company’s risk assessment and in holding management to account in relation to the effectiveness of the
Company’s control environment and associated assurance processes.
David Watson
Chairman of the Audit Committee
17 March 2015
39
Directors’ Remuneration Report
REMUNERATION COMMITTEE CHAIRMAN–ANNUAL STATEMENT
Dear Shareholder
On behalf of the Board, I am pleased to present the Remuneration Report for the year to 31 December 2014, which clearly links
business performance with Executive reward. The report comprises:
–
the Directors’ Remuneration Policy, which was approved at the 2014 AGM and is included for information only, as it has not
changed; and
–
the Annual Report on Remuneration, which sets out how the policy was implemented in the financial year ending 31 December
2014 and is subject to an advisory shareholder vote at the 2015 AGM.
Shareholder engagement
I am pleased to report a strong level of support and engagement from shareholders. The resolutions seeking approval of the Directors’
Remuneration Policy and Annual Report on Remuneration and the new Deferred Annual Bonus Plan were supported by over 99% of
the votes cast. Before introducing the Directors’ Remuneration Policy last year, we consulted with our major shareholders and will do
so when the Directors’ Remuneration Policy is reviewed and developed in future years.
Base salary
In 2014 the executive directors received a base salary increase of 3% each, which was the first increase in base salaries for four years.
The Committee continues to apply restraint to salary increases; executive directors received a base salary increase of 1.9% each at the
1 January 2015 review date, which is the same as the average increase of UK employees.
Annual bonus
Annual bonus awards have been made in respect of the 2014 performance year to all executive directors. Taking account of overall
performance, the Committee has awarded bonuses of up to 81% of the maximum level. The Group Chief Executive Officer, David
Marock was awarded a total bonus payment for 2014 performance of £384,643 (116.7% of base salary; 78% of maximum bonus). The
largest total bonuses paid to other executive directors in respect of performance in 2014 were 39.1% of base salary and 81% of
maximum bonus. These bonuses are primarily a reflection of excellent financial performance with year-on-year growth in Group
adjusted PBT (+11.3%) and Group adjusted EPS (+15.6%). They also reflect significant achievements by the executive directors when
measured against their agreed set of personal objectives, their contribution to the success and development of the Company in the year
and the Company’s overall performance.
Long-term incentives
The Company achieved Total Shareholder Return (TSR) of more than 100% over the period 2011 to 2014 resulting in strong relative
performance for which the 2011 LTIP awards vested in full during the year. Further details are included on page 51.
The Committee aims to ensure that the remuneration for executive directors is: clear and simple, tied to performance; and is closely
aligned to the business strategy and the interests of shareholders. I hope you will support the remuneration resolution at the AGM.
Gill Rider
Chairman of the Remuneration Committee
Notes
This report has been prepared on behalf of the Board and has been approved by the Board. The Report complies with the Large and Medium Sized Companies and
Groups (Accounts and Reports) (Amendment) Regulations 2013, the 2012 UK Governance Code and the Financial Conduct Authority Listing Rules.
40
DIRECTORS’ REMUNERATION POLICY
This part of the Report sets out the material elements of the Directors’ Remuneration Policy for the Company which was approved by
shareholders at the 2014 AGM. The policy came into effect on 8 May 2014 and is due to be reviewed by shareholders at the 2017
AGM. There have been no changes to the policy for 2015 and it is shown for information and to provide context to the 2014
Remuneration Report. References to individual directors have been updated.
Policy overview
Executive remuneration packages are designed to attract, motivate and retain directors and senior management of high calibre. The
Remuneration Committee (the “Committee” hereafter) believes that the interests of shareholders and executive directors should be
aligned as far as possible. It seeks to achieve this by incentivising executive directors to deliver success over time through sustainable
and profitable growth. This includes the use of annual bonus awards linked to clear personal and departmental objectives and to the
overall performance of the Company, and awards under the LTIP linked to longer-term, sustained company performance.
The Committee undertakes periodic external comparisons to examine current market trends and practices and equivalent roles in
similar companies taking into account their size, business complexity, international scope and relative performance.
How the views of shareholders are taken into account
The Company values dialogue with its shareholders. The Committee considers investor feedback and the voting results received in
relation to relevant AGM resolutions, each year. This is considered alongside any additional feedback on remuneration received from
shareholders and/or shareholder representatives from time to time. If the Committee contemplates making any material changes to the
remuneration policy outlined in this section, we will consult with major shareholders and/or their representative bodies before putting
changes to the remuneration policy to shareholders.
Details of votes cast for and against the resolution to approve last year’s remuneration report are set out in the Annual Report on
Remuneration.
Consideration of employment conditions elsewhere in the Company
The pay and employment conditions of Charles Taylor employees are taken into account when setting executive remuneration policy.
The Company does not formally consult with employees in respect of the design of the executive directors’ remuneration policy.
Remuneration policy for directors
There are three main elements of the remuneration package for executive directors:
1.
Fixed pay, comprising base salary, pension scheme contributions and other benefits.
2.
Annual performance-related remuneration, including deferral into shares.
3.
Long-term performance-related remuneration in the form of share awards.
The table on the following page provides a summary of the key aspects of the remuneration policy for executive directors:
41
Executive Directors’ Remuneration Policy
Element
Base salary
Purpose and link to strategy
To provide a core level of reward
sufficient to attract, motivate and
retain directors of high calibre, able
to develop and execute the
Company’s strategy.
Benefits
To provide cost-effective and
market-competitive benefits to
support the well-being of directors.
Pension
To provide directors with a market
competitive pension/long-term
savings option to assist with
recruitment and retention.
Operation
Executive directors’ base salaries are
reviewed at the end of each financial
year and are determined by the
Committee taking account of base
salaries and base salary increases in
the Company as a whole, the
individual’s experience and
performance, and current market
rates.
Periodic reference is also made to
median levels amongst relevant
FTSE and industry comparators of
similar size and scope.
The Committee considers the impact
of any basic salary increase on the
total remuneration package.
Directors’ salaries (and other
elements of the remuneration
package) may be paid in different
currencies as appropriate to reflect
their geographic location.
Executive directors receive certain
benefits-in-kind such as a car or car
allowance, private medical insurance
and other insurance benefits.
Other ancillary benefits may be
provided, including relocation
assistance (as required).
A defined contribution to a money
purchase pension scheme is
provided, or an equivalent cash
allowance.
42
Maximum opportunity
The Committee is guided by the
general increase for the broader
employee population, but on
occasions may need to recognise, for
example, development in role,
change in position or responsibility,
and market levels. For this reason the
Committee does not feel it is
appropriate to set a maximum salary
as this would limit its ability to
respond to market conditions and
could set expectations of salary
levels for future appointments.
Salary levels may be changed from
time to time by the Committee within
this policy.
Current salaries are set out in the
Annual Report on Remuneration.
Benefits constitute only a small
percentage of total remuneration and
the value is not subject to a specific
cap.
The benefits provided may be subject
to minor amendment from time to
time by the Committee within this
policy.
Any employer contribution is limited
to maximum of 15% of base salary.
This is reviewed periodically by the
Committee and may be subject to
minor change within the policy.
Annual bonus
To tie a proportion of remuneration
to the Company’s annual
performance.
Compulsory partial deferral serves
further to align the executive
directors’ interests with those of
shareholders.
Each executive’s annual bonus is
determined based on group,
divisional/functional and personal
financial and non-financial goals.
The main emphasis is on financial
objectives.
Where a bonus award is above a
certain size, a proportion will be
delivered in deferred Company
shares which will be released in three
equal tranches after one, two and
three years.
For awards in respect of 2014, where
a bonus award exceeds the on-target
level, the portion above the on-target
level will be deferred as described
above.
Annual bonus awards are nonpensionable.
With effect from the 2014 bonus
award year and onwards, there is a
claw-back provision in place. This
allows the Committee to seek to
recoup paid and deferred bonus in
exceptional circumstances.
Summary details of the performance
targets set for the year under review
and performance against them is
provided in the Annual Report on
Remuneration to the degree these are
not commercially sensitive.
43
The policy maximum is 150% of
base salary for excellent
performance, although the
Committee may set individual limits
on bonus that are below this policy
maximum taking account of
individuals’ roles.
For on-target performance the bonus
opportunity is usually limited to no
more than two-thirds of the
maximum.
Participants may be eligible to
receive a payment in either cash or
shares, following vesting,
representing the dividends that have
accrued during the vesting period.
Long-term
incentive plan
2007 (LTIP)
To tie a proportion of remuneration
to the Company’s longer-term
performance to further align the
executive directors’ interests with
those of shareholders.
All employee
share schemes
To encourage employee share
participation.
Minimum
shareholding
requirement
(MSR)
To further align executive directors’
interests with shareholders.
Annual awards of performance
shares or nil-cost options are made.
These awards are subject to a threeyear service and performance period.
The Committee sets performance
conditions taking account of the
business strategy. From 2013
onwards LTIP grants are currently
subject to two performance metrics,
to give a more rounded view of
Company performance:
Half of the award is currently subject
to Total Shareholder Return (TSR)
relative to the constituents of a
relevant comparator index or peer
group and the other half of the award
is currently subject to Earnings Per
Share (EPS) growth. The Committee
has authority to change the metrics
for future awards, which will be
subject to consultation in advance
with major shareholders for material
changes.
The Committee has the discretion to
make a downward adjustment
(including to zero if appropriate) to
the vesting outcome under the
performance metrics, if it considers
that this is necessary to take account
of its broader assessment of the
performance of the Company.
With effect from awards in respect of
the 2014 financial year and onwards,
there is a claw-back provision in
place. This allows the Committee to
seek to recoup LTIP awards in
exceptional circumstances.
The Company may from time to time
operate tax-approved share plans
(such as HMRC-approved Save As
You Earn scheme) for which
executive directors could be eligible.
Each executive director will be
required to build up and maintain a
holding of Company shares
equivalent to a multiple of base
salary, as determined by the
Committee.
Until an executive director has built
up such a shareholding, they are
required to retain 100% of any LTIP
shares that vest, net of tax, and invest
at least 25% of the value of any cash
bonus in shares, net of tax.
44
The normal maximum annual award
size (in face value) under the LTIP is
75% of base salary. The plan rules
permit higher awards in exceptional
circumstances. The Committee does
not expect that any individual award
would exceed 125% of base salary.
For threshold performance, 25% of
the award will vest, increasing on a
straight line basis up to 100% of the
award for maximum performance.
Participants in the LTIP may be
eligible to receive a payment in either
cash or shares, following vesting
representing the dividends that they
would have accrued on the vested
shares in the vesting period.
The schemes are subject to the limits
set by tax authorities.
N/A.
Discretions retained by the Committee in operating the incentive plans
In operating the annual bonus plan and LTIP, the Committee will adhere to the respective plan rules and the Listing Rules where
relevant. There are several areas with regards to the operation and administration of these plans for which the Committee will retain
discretion. Consistent with market practice, these include (but are not limited to) the following:
–
Selecting the participants;
–
The timing of grant and/or payment;
–
The size of grants and/or payments (within the limits set out in the policy table above);
–
The extent of vesting based on the assessment of performance;
–
Determination of a good leaver and where relevant the extent of vesting in the case of the share based plans;
–
Treatment in exceptional circumstances such as a change of control, in which the Committee would act in the best interests of
the Company and its shareholders.
–
Making the appropriate adjustments required in certain circumstances (e.g. rights issues, corporate restructuring events,
variation of capital and special dividends);
–
Cash settling awards; and
–
The annual review of performance measures, weightings and setting targets for the annual bonus and discretionary share plans
from year to year.
Any performance conditions may be amended or substituted if one or more events occur which cause the Committee to reasonably
consider that the performance conditions would not without alteration achieve its original purpose. Any varied performance condition
would not be materially less difficult to satisfy.
Choice of performance measures and approach to target setting
The performance metrics that are used for our annual bonus and long-term incentive plans are chosen to reflect the Group’s key
performance indicators and strategic aims. Performance objectives are designed to encourage continuous improvement and incentivise
the delivery of stretch performance. A small percentage of the total opportunity is available for delivering threshold performance
levels with maximum outcomes requiring exceptional performance.
Annual bonus
In determining any bonus award, the Committee takes into account the performance of each executive director against his objectives,
his contribution to the success and development of the Company in the year and the Company’s overall performance. The measures
and criteria set may vary from year to year as appropriate to reflect the changing needs of the business.
LTIP
The LTIP is currently based on EPS and TSR performance. Growth in EPS is a measure of the Company’s overall financial success
and closely aligns the executives’ interests with those of our shareholders. TSR provides an external assessment of the Company’s
performance and captures the total return created for shareholders.
A sliding scale of targets is set for each measure that take account of corporate plans and external market expectations for the
Company. The Committee will review the appropriateness of the performance targets prior to each LTIP grant. The Committee
reserves the discretion within this policy to set different measures and targets for future awards, providing that, in the opinion of the
Committee, the new targets are no less challenging and are appropriate to the strategy in light of the circumstances at the time than
those used previously. Should there be a material change in the Company’s performance conditions (e.g. introducing an additional or
alternative performance metric) appropriate consultation with the Company’s major shareholders would take place in advance along
with a full explanation in the Annual Report on Remuneration to support any such change. The measures and targets for awards
granted under this remuneration policy are set out for shareholder approval in the Annual Report on Remuneration.
All-employee schemes
No performance targets are set for awards under tax-approved share plans as these are non-discretionary plans designed for allemployees. Any such plans are designed to encourage employees across the Group to purchase Company shares and applying
performance targets to these awards would materially reduce the effect in this regard.
45
Differences in remuneration policy for executive directors compared to other employees
The remuneration policy for the executive directors is designed having regard to the pay and employment conditions of other
employees in the Company and its subsidiaries.
There are some differences in the structure of the remuneration policy for the executive directors (as set out above) compared to that
for other employees within the organisation, which the Committee believes are necessary to reflect the differing levels of seniority and
responsibility. The remuneration policy for the executive directors places a greater weight on performance-based variable pay through
the long-term incentive scheme. This ensures the remuneration of the executives is aligned with both the long-term performance of the
Company and therefore the interests of shareholders.
External non-executive director positions
Executive directors may be required to serve as directors on a number of external organisations directly related to the Group’s
business activities; they receive no fees or additional remuneration for these appointments.
To further develop their skills and experience, executive directors are permitted, subject to approval of the Board, to have normally no
more than one external non-executive directorship, unrelated to Charles Taylor, and are allowed to retain the fees earned in relation to
this.
Details of external directorships held by the executive directors and any fees that they received are provided in the Annual Report on
Remuneration.
Approach to new executive director appointments
The remuneration package for a new executive director will be set in accordance with the Company’s approved remuneration policy
as set out in this report, subject to the points below.
The base salary level of a newly appointed executive will be set taking into account the individual’s experience and the nature of the
role being offered. Dependent on the previous experience of the individual appointed, base salary may be initially positioned below
the relevant market rate for the role and increased as the individual gains in relevant experience subject to their individual
performance.
In the case of an external hire, the Committee may offer additional cash and/or share-based elements when it considers these to be in
the best interests of the Company and its shareholders, to compensate for remuneration foregone by the individual in order to take up
the role. This includes the use of awards made under 9.4.2 of the Listing Rules. Such awards would take account of the form (cash or
shares) and time horizons attaching to remuneration foregone and the impact of any performance conditions.
For an internal appointment, any outstanding variable pay awarded in relation to the previous role will be allowed to pay out according
to its terms of grant and the appointee will become subject to the minimum shareholding requirements policy on their appointment as
an executive director.
Service contracts and payments for loss of office
All the executive directors have entered into service agreements with the Company, requiring notice of termination to be given by
either party. It is the Company’s policy that the period of notice for executive directors will not exceed 12 months.
A director’s service contract may be terminated without notice and without any further payment or compensation, except for sums
accrued up to the date of termination, in the event of gross misconduct. If the Company terminates the employment of an executive
director in other circumstances, compensation is limited to base salary due for any unexpired notice period, plus an amount in respect
of contractual benefits and pension which would have been received during the unexpired notice period. In the event of a change of
control of the Company there is no enhancement to contractual terms.
Directors’ contracts of service and letters of appointment, which include details of their remuneration, are available for inspection at
the registered office of the Company during normal business hours and will be available for inspection at the AGM.
46
Provision
Notice period from
either party
David Marock
12 months
Mark Keogh
12 months
Damian Ely
12 months
Joe Roach
12 months
Contract
commencement date
1 July 2011
16 June 2014
1 October 2005
1 January 1997
Payments on
termination
Base salary for period of notice plus benefits
including pension, paid monthly and subject to
mitigation.
Base salary for period of notice, paid monthly and
subject to mitigation.
In addition, any statutory entitlements in connection with the termination would be paid as necessary.
Remuneration
entitlements
An annual bonus may also become payable subject to performance, for the period of active service only.
Outstanding share awards will vest in accordance with the provisions of the various scheme rules – see
below. In all cases performance targets would apply to annual bonus and/or LTIP awards.
Change of control
There are no enhanced terms in the contracts in relation to termination following a change of control.
However, under the relevant plan rules, there is scope for accelerated vesting of any share awards.
If an executive director leaves employment, any outstanding share awards will be treated in accordance with the relevant plan rules.
Normally, any outstanding awards lapse on cessation of employment. However if an executive director ceases employment with the
Group as a ‘good leaver’ as defined in the various scheme rules or in the event of a takeover, any outstanding share awards will vest in
accordance with those rules. In the case of the LTIP awards, vesting is normally subject to a performance condition, with a pro-rata
reduction in the size of the award to reflect the period of time that the award has been held. Any remainder of the awards will lapse.
Under the bonus plan, the deferred shares for a good leaver may be permitted to immediately vest in full and if the award is in the
form of an option, there is a 12-month window in which the award can be exercised.
In determining whether an executive should be treated as a good leaver or not, the Committee will take into account the performance
of the individual and the reasons for their departure.
Legacy arrangements
For the avoidance of doubt, in approving this Policy Report, authority is given to the Company to honour any commitments entered
into with current or former directors (such as the payment of a pension or the unwinding of legacy share schemes) that have been
disclosed to shareholders in previous Directors’ Remuneration Reports.
Non-executive directors
The non-executive directors have individual letters of engagement and their remuneration is determined by the Board in accordance
with the Articles of Association.
47
Non-executive directors’ fees policy
Element
Purpose and link to strategy
Operation
Maximum opportunity
Non-executive
director fees
To attract and retain a high-calibre
chairman and non-executive directors
by offering market competitive fee
levels.
The Chairman is paid a single fee for
all his responsibilities. The NonExecutives are paid a basic fee. The
Chairmen of the Board Committees
and the Senior Independent Director
are paid an additional fee to reflect
their extra responsibilities.
The Committee is guided in
considering any increase in fees by
reference to current market levels but
on occasions may need to recognise,
for example, changes in
responsibility, and/or time
commitments.
The level of these fees is reviewed
periodically by the Committee and
Chief Executive for the Chairman
and by the Chairman and Executive
Directors for the Non-executive
Directors, with reference to market
levels in comparably sized FTSE
companies, and a recommendation is
then made to the Board. The Nonexecutive Directors have the option
to forego their fees in exchange for
shares in the Company.
Non-executive directors cannot
participate in any of the Company’s
annual bonus or share plans and are
not eligible for any pension
entitlements from the Company.
For the appointment of a new chairman or non-executive director, the fee arrangement would be set in accordance with the approved
remuneration policy in force at that time.
All non-executive directors have letters of appointment with the Company and are subject to annual re-election at the AGM. The
appointment letters for the Chairman and non-executive directors provide that no compensation is payable on termination, other than
accrued fees and expenses.
48
ANNUAL REPORT ON REMUNERATION
This report has been divided into separate sections for audited and unaudited information. The Companies Act requires the auditor to
report to the Company’s members on the “auditable part” of the Directors’ remuneration report and to state whether in its opinion that
part of the report has been properly prepared in accordance with the Companies Act 2006.
Audited Information
Single total figure remuneration
The table below reports the total remuneration receivable in respect of qualifying services by each director during the year:
Year ended 31 December 2014
David Marock
Damian Ely
Alistair Groom*
Mark Keogh**
Joe Roach
Tito Soso***
Rupert Robson
Julian Cazalet^
Edward Creasy^^
Barnabas Hurst-Bannister^^^
Gill Rider
David Watson
GCEO
GCOO
GCFO
GCFO
Chairman
Total salary
and fees
£
329,600
220,420
56,332
147,026
377,931
161,367
90,000
30,615
35,000
8,256
46,250
45,000
Taxable
benefits
£
8,644
20,495
3,708
2,893
18,609
4,614
—
—
—
—
—
—
*
Alistair Groom retired as a director on 28 February 2014.
**
Mark Keogh was appointed a director on 16 June 2014.
***
Tito Soso resigned as a director on 29 August 2014.
^
Julian Cazalet retired as a director on 6 October 2014.
^^
Edward Creasy was appointed a director on 1 January 2014.
^^^
Barnabas Hurst-Bannister was appointed a director on 8 October 2014.
Annual
bonus
£
384,643
86,173
—
71,093
126,483
—
—
—
—
—
—
—
Long term
incentives
£
818,264
142,099
134,283
—
142,099
—
—
—
—
—
—
—
Pension
related
benefits
£
43,625
30,748
8,450
19,367
5,294
22,371
—
—
—
—
—
—
Other
£
20,365
20,976
—
—
—
—
—
—
—
—
—
—
Total
£
1,605,141
520,911
202,773
240,379
670,416
188,352
90,000
30,615
35,000
8,256
46,250
45,000
Annual
bonus
£
320,000
53,500
94,095
94,605
157,450
—
—
—
—
—
Long term
incentives
£
0
0
0
0
0
—
—
—
—
—
Pension
related
benefits
£
48,000
29,855
47,047
5,416
33,939
—
—
—
—
—
Other
£
0
0
0
7,368
0
—
—
—
—
—
Total
£
695,899
315,385
473,954
513,375
422,105
90,000
45,000
40,000
35,000
45,000
Year ended 31 December 2013
David Marock
Damian Ely
Alistair Groom
Joe Roach
Tito Soso*
Rupert Robson
Julian Avery
Julian Cazalet
Gill Rider
David Watson
*
GCEO
GCOO
GCFO
Chairman
Total salary
and fees
£
320,000
214,000
313,650
386,390
226,263
90,000
45,000
40,000
35,000
45,000
Taxable
benefits
£
7,899
18,030
19,162
19,596
4,453
—
—
—
—
—
Tito Soso was appointed a director on 16 January 2013.
49
The figures in the single figure table are derived from the following:
Total salary and fees
Taxable benefits
Annual bonus
Long-term incentives
Pension related benefits
Other
The amount of salary and fees received in the year.
The taxable value of benefits received in the year. These are car allowance, private medical insurance,
life assurance, permanent health insurance and subscriptions.
Annual bonus that was earned in the year and can be split between cash and shares. Shares awarded
will be released in three equal tranches after one, two and three years.
The value of LTIP awards that vest in respect of a performance period that is completed by the end of
the relevant financial year. For 2014 this includes the 2011 LTIP awards which vested in full and for
2013 this includes the 2010 LTIP award under which none vested.
The pension figure represents the cash value of pension contributions received by the executive
directors.
Other includes the value of SAYE options vesting in the financial year.
Joiner and leavers during the year ending 31 December 2014
The new Group Chief Financial Officer, Mark Keogh, was appointed a director on 16 June 2014. He was appointed on an annual base
salary of £235,000. He is eligible to receive a 15% of salary pension contribution and other benefits in line with the approved
remuneration policy. His maximum annual bonus opportunity for 2014 is 75% of base salary but this entitlement was pro-rated from
the date of his appointment. Mark Keogh did not receive a LTIP award during 2014 nor any buy-out awards to compensate for
foregone remuneration.
Alistair Groom retired as Chief Executive Management Services - UK & International and as a director on 28 February 2014. He
received his base salary, pension and benefits up to his leaving date. He will be treated as a good leaver and therefore retain his prorated LTIP and bonus share awards. Vesting of the LTIP awards will depend on the normal performance conditions and the number of
shares he will receive will be prorated to the date of cessation of employment in accordance with the rules of the LTIP. His annual
bonus share awards will continue to vest in accordance with their original vesting dates. The value of these awards on vesting will be
disclosed in future Annual Reports on Remuneration.
Tito Soso ceased service as Group Chief Financial Officer and as a director on 29 August 2014 due to resignation. He received his
base salary, pension and benefits up to his leaving date as detailed in the above table. He ceased to be eligible for any annual bonus for
2014 and all of his outstanding bonus share awards, LTIP awards and recruitment award lapsed in full.
Annual bonus for the year ending 31 December 2014
At the start of each financial year the Remuneration Committee sets the bonus opportunity for the year and reviews and challenges the
performance objectives for each executive director. They are predominately financial as exemplified below but also include some
specific operational, people and client-related objectives which are personal to the executives. The Committee challenges to ensure
they are consistent with the strategy, budget and sufficiently stretching. The Group Chief Executive and individual directors agree the
objectives and all the objectives are shared in the executive team to ensure the team works collectively.
For 2014, the bonus opportunities for the executive directors were as follows:
On-Target %
of salary
100%
35%
27.5%
50%
David Marock
Damian Ely
Joe Roach
Mark Keogh*
*
Maximum %
of salary
150%
52.5%
41.25%
75%
Any bonus entitlement for Mark Keogh was pro-rated from the date of his appointment.
At the end of the year, the Group Chief Executive and the individual directors review their performance against their objectives.
Quantifiable measures are used wherever possible. The Committee assesses the performance of the Company, each business, the
support service teams, the individual and determines the performance level achieved. On-target performance is considered to be the
achievement of objectives and in particular key financial objectives. 75% of the assessment of the 2014 performance review was
weighted to key financial targets, 25% to achievement of personal objectives. Exceptional business performance would be required to
achieve maximum performance.
50
The key financial targets for 2014 were:
–
Grow Group’s adjusted PBT (attributable to owners of the Company) by 8%
–
Grow Group’s adjusted EPS by 3.9%
At the time of setting these targets they were considered stretching by the Committee and it is the measure of the team’s performance
that the targets were exceeded.
The table below shows the Group’s performance against these two financial targets over the last five years. Performance for 2014
significantly exceeded the target level set and the Committee determined that, for the 75% of the bonus dependent on financial
performance, the outcome was between target and maximum:
Year-on-year performance
Adjusted PBT (attributable)
Adjusted EPS
2014
11.3%
15.6%
2013
9.2%
9.4%
2012
(4.6%)
(7.7%)
2011
(6.1%)
(9.8%)
2010
(19.5%)
(24.2%)
The personal performance component was assessed against a range of personal objectives which relate to business, people and clients
including:
–
Strive to deliver strong financial performance for mutual clients while maintaining client servicing and satisfaction levels.
–
Create new business products and services to generate specified amounts of revenue and profit.
–
Ensure top team firmly established and operating effectively and that succession planning is well underway for key senior staff
across the Group.
–
Attract, retain and develop top talent within each business.
–
Develop and gain buy-in for a coordinated group-wide marketing, public relations, business development and sales approach
and culture.
–
Ensure restructuring plans are agreed and drive delivery within the agreed timeframes of cost cutting targets.
–
Drive down debt ratios through improved working capital and active management of the insurers in run-off business.
Taking account of personal performance against these criteria, together with the above-target financial performance, the Committee
awarded the bonuses shown in the table below. There is some variation to reflect individual performance against business and personal
objectives.
The resulting bonuses for 2014 were as follows:
Total
£
384,643
86,173
126,483
71,093
David Marock
Damian Ely
Joe Roach
Mark Keogh*
*
% of
Maximum
78%
74%
81%
64%
Cash
£
329,600
77,147
103,930
63,646
Shares
£
55,043
9,026
22,553
7,447
Any bonus entitlement for Mark Keogh was pro-rated from the date of his appointment
Vesting of LTIP awards
The LTIP awards granted on 27 April 2011 were based on performance to 26 April 2014 to vest 27 April 2014 and LTIP award
granted to David Marock on 18 October 2011 was based on performance to 17 October 2014 to vest 18 October 2014. As disclosed in
previous annual reports, the performance condition for these awards measured the Company’s Total Shareholder Return (TSR)
relative to the constituent companies of the FTSE Small Cap Index in accordance with the following table:
Ranking of the Company against the comparator Group by reference to TSR
Percentage of shares which may vest
Below median
Median
Between median and upper quartile
Upper quartile
Nil
25%
Pro rata on a straight-line basis between 25% and 100%
100%
51
For the vesting of the 2011 awards, Charles Taylor ranked in the top 25% and accordingly the awards vested in full. For the April
2011 awards, Charles Taylor was ranked 35th out of 201 constituent companies in the FTSE Small Cap Index with TSR growth over
three years of 102.42%. For the October 2011 award Charles Taylor was ranked 36th out of 209 constituent companies in the FTSE
Small Cap Index with TSR growth over three years of 108.84%.
LTIP awards made in 2014
LTIP awards were made on 20 March 2014 at a share price of 255.5p (the middle market quotation share price prior to the date of
grant).
Details of these awards for the Directors are set out in the table below. The maximum level of award permitted under the LTIP is 75%
of base salary per annum, however, the Plan Rules permit an award above the normal 75% of base salary limit in exceptional
circumstances (although the Committee does not expect that any individual award would exceed 125% of base salary).
Basis of award granted
75% of £329,600
50% of £220,420
31% of $624,613
50% of £242,050
David Marock – GCEO
Damian Ely – GCOO
Joe Roach – Executive director
Tito Soso – GCFO1
1
2014 awards
(number of shares)
96,751
43,135
45,686
47,367
Face value
£
£247,200
£110,210
£116,729
£121,025
Tito Soso’s LTIP award subsequently lapsed when he left the Company.
The awards are subject to a three-year performance period ending 31 December 2016 and are due to vest on 20 March 2017. The
proportion of shares which may be transferred under the LTIP will be determined by two performance metrics. Half of the award will
be subject to the Company’s Total Shareholder Return (TSR) relative to the constituent companies of the FTSE Small Cap Index in
accordance with the following table:
Ranking of the Company against the comparator Group by reference to TSR
Percentage of shares which may vest
Below median
Median
Between median and upper quartile
Upper quartile
Nil
25%
Pro rata on a straight-line basis between 25% and 100%
100%
The other half of the award will be subject to Earnings per Share (EPS) growth relative to UK RPI (Retail Price Index) inflation. There
will be zero vesting of this element if performance is below RPI+3 percentage points per annum, 25% vesting for RPI+3 percentage
points per annum, and 100% vesting for RPI+9 percentage points per annum (linear interpolation between threshold and maximum).
The Committee also has the discretion to make a downward adjustment (including to zero, if appropriate) to the vesting outcome
under either performance metric, if it considers that this is necessary to take account of its broader assessment of the performance of
the Company.
Claw-back
There is a claw-back policy in place which allows claw-back under the annual bonus plan and LTIP. This allows the Committee to
seek to recoup paid and deferred bonus and LTIP awards, if at any point before the third anniversary of vesting the Committee
considers there to have been a material misstatement of performance or case of gross misconduct.
The Committee considered that neither of these circumstances occurred during the year and therefore no claw-back was enacted
during 2014.
Directors’ interests and Minimum Shareholding Requirement (“MSR”)
There is a MSR for the executive directors. Each executive director is required to build up and maintain a holding of Charles Taylor
plc shares equivalent in value to 1x base salary. Until they have achieved this shareholding, they are required to retain 100% of any
LTIP shares that vest, net of tax, and invest 25% of the value of any cash bonus in shares, net of tax.
52
The beneficial interests of directors in the ordinary share capital of the Company at 31 December 2014 and 31 December 2013 were as
follows:
`
At 31 December 2014
1p Ordinary shares
David Marock
Damian Ely
Alistair Groom (retired 28
February 2014)
Mark Keogh (appointed 16
June 2014)
Joe Roach
Tito Soso (resigned
29 August 2014)
Rupert Robson
Julian Cazalet (retired 6
October 2014)
Edward Creasy (appointed 1
January 2014)
Barnabas Hurst-Bannister
(appointed 8 October 2014)
Gill Rider
David Watson
Total of directors’ interests
*
At 31 December 2013
1p Ordinary shares
Outstanding
performance
based share
awards*
Outstanding
share awards*
Unexercised
vested option
awards
Outstanding
unvested
option awards
%
shareholding
guideline
achieved at
31 December
2014
462,328
57,504
1.06%
0.13%
85,000
12,997
0.20%
0.03%
386,751
103,135
—
11,112
—
—
9,318
9,318
100
72
324,528
0.75%
328,300
0.79%
44,500
15,834
—
—
N/A
—
92,798
—
0.21%
—
36,792
—
0.09%
—
145,686
—
19,537
—
—
9,318
3,516
—
69
—
69,437
—
0.16%
40,000
69,437
0.10%
0.17%
—
—
—
—
—
—
—
—
N/A
N/A
40,000
0.10%
40,000
0.10%
—
—
—
—
N/A
4,291
0.01%
—
—
—
—
—
—
N/A
—
1,000
10,000
1,061,886
—
0.01%
0.02%
2.45%
—
1,000
10,000
623,526
—
0.01%
0.02%
1.51%
—
—
—
680,072
—
—
—
46,483
—
—
—
—
—
—
—
31,470
N/A
N/A
N/A
Includes awards structured as nil-cost options
Each director is taken to have a non-beneficial interest in the ordinary shares held by the Charles Taylor Employee Share Ownership
Plan, which totalled 299,123 shares as at 31 December 2014. There have been no other changes in the interests of directors in either
the share capital of the Company or options over the Company’s shares.
53
The following movements in awards and options over the ordinary share capital of the company took place during the year:
Director
David Marock
David Marock
David Marock
David Marock
David Marock
David Marock
David Marock
Alistair Groom
Alistair Groom*
Alistair Groom*
Alistair Groom*
a
c
d
c
g
j
a
a
c
c
h
Awards
and options
held at 31
December
2013
8,146
300,000
362,318
150,000
140,000
—
—
8,146
50,000
50,000
13,889
Alistair Groom*
Alistair Groom*
Damian Ely
Damian Ely
Damian Ely
Damian Ely
Damian Ely
i
g
f
a
c
c
h
13,333
50,000
14,000
8,146
50,000
30,000
9,259
—
—
—
—
—
—
—
(4,444)
—
—
(8,146)
(50,000)
—
(4,629)
—
(36,000)
(14,000)
—
—
—
—
—
—
—
—
—
—
—
8,889
14,000
—
—
—
30,000
4,630
Nil
Nil
277.50
110.48
Nil
Nil
Nil
Damian Ely
Damian Ely
Damian Ely
Damian Ely
Joe Roach
Joe Roach
Joe Roach
i
g
j
a
c
c
h
9,723
30,000
—
—
50,000
50,000
13,889
—
—
43,135
9,318
—
—
—
(3,241)
—
—
—
(50,000)
—
(6,944)
—
—
—
—
—
—
—
—
—
—
—
—
—
—
6,482
30,000
43,135
9,318
—
50,000
6,945
Nil
Nil
Nil
193.16
Nil
Nil
Nil
Joe Roach
Joe Roach
Joe Roach
Joe Roach
Tito Soso
Tito Soso
Tito Soso
Mark Keogh
i
g
b
j
e
c
j
a
18,888
50,000
3,516
—
100,000
150,000
—
—
1,733,253
—
—
—
45,686
—
—
47,367
9,318
260,893
(6,296)
—
—
—
—
—
—
—
(864,693)
—
—
—
—
(100,000)
(150,000)
(47,367)
—
(371,428)
—
—
—
—
—
—
—
—
—
12,592
50,000
3,516
45,686
—
—
—
9,318
758,025
Nil
Nil
178.50
Nil
Nil
Nil
Nil
193.16
Awards
and options
granted
during
2014
—
—
—
—
—
96,751
9,318
—
—
—
—
Options
exercised
during
2014
(8,146)
(300,000)
(362,318)
—
—
—
—
(6,335)
(47,250)
—
(6,944)
Options
lapsed
during
2014
—
—
—
—
—
—
—
(1,811)
(2,750)
(19,500)
—
Awards
and options
cancelled
during
2014
—
—
—
—
—
—
—
—
—
—
—
Awards
and options
held at 31
December
2014
—
—
—
150,000
140,000
96,751
9,318
—
—
30,500
6,945
Exercise
price (p)
110.48
Nil
Nil
Nil
Nil
Nil
193.16
110.48
Nil
Nil
Nil
Exercisable dates
Dec 2014–May 2015
18 Oct 2014
18 Oct 2014
27 Apr 2015
23 Apr 2016
20 Mar 2017
Dec 2017–May 2018
Dec 2014-May 2015
27 Apr 2014
27 Apr 2015
April 2014 & April 2015
April 2014, April 2015
& April 2016
23 Apr 2016
Apr 2007 – Apr 2014
Dec 2014-May 2015
27 Apr 2014
27 Apr 2015
April 2014 & April 2015
April 2014, April 2015
& April 2016
23 Apr 2016
20 Mar 2017
Dec 2017–May 2018
27 Apr 2014
27 Apr 2015
April 2014 & April 2015
April 2014, April 2015
& April 2016
23 Apr 2016
9 Jan 2016
20 Mar 2017
16 Jan 2016
16 Jan 2016
20 Mar 2017
Dec 2017–May 2018
*
Alistair Groom retired as a director on 28 February 2014 and he retained his LTIP and bonus share awards. Vesting of the LTIP awards will depend on the
normal performance conditions and the number of shares he will receive will be prorated to the date of cessation of employment in accordance with the rules of
the LTIP. His annual bonus share awards will continue to vest in accordance with their original vesting dates.
(a)
Charles Taylor Sharesave Scheme 2007 – Part A
(b)
Charles Taylor Sharesave Scheme 2007 – Part C
(c)
Charles Taylor Long Term Incentive Plan 2007 – subject to a three year relative TSR performance condition measured to the exercisable date with 25% vesting
at threshold performance
(d)
Recruitment Award – vests after three years
(e)
Recruitment Award – vests after three years
(f)
Charles Taylor Executive share Option Scheme 2007 – Part B, subject to a three year EPS growth performance condition
(g)
Charles Taylor Long Term Incentive Plan 2007 – subject to three year relative TSR and EPS performance conditions measured to 31 December 2015 with 25%
vesting at threshold
(h)
Bonus Share Award 2012 – shares released in three equal tranches after one, two and three years
(i)
Bonus Share Award 2013 – shares released in three equal tranches after one, two and three years
54
(j)
Charles Taylor Long Term Incentive Plan 2007 – subject to three year relative TSR and EPS performance conditions measured to 31 December 2016 with 25%
vesting at threshold
Executive share options (ESOS)
No options were granted during 2014 financial year, and none have been granted since 2006. Previous grants of options became
exercisable only if the total earnings per ordinary share increased by at least the rate of increase of the Retail Price Index plus six
percentage points per annum, over the three-year vesting period and may be exercised up to ten years after the date of the award.
The executive directors are no longer permitted to participate in the ESOS.
Save As You Earn (SAYE)
The Company also operates SAYE share option schemes for eligible employees, under which options may be granted at a discount of
up to 20% of market value. The value of options over shares that participants can be granted is capped, and is based on a monthly
contribution to a savings account of a maximum of £250 per participant for the schemes launched prior to 2014 and £500 per
participant for the scheme launched in 2014. The executive directors are eligible to participate in the SAYE share option scheme.
The Company’s shares were trading at £2.50 at the year-end (2013 – £2.52) and traded in the range £2.20 to £2.87 throughout the
year.
Pension and other arrangements
All of the executive directors are now in receipt of either a defined contribution to a money purchase pension scheme, or an equivalent
cash allowance. The table below details the defined contribution and cash allowance arrangements for each executive director.
Name
David Marock1
Damian Ely
Mark Keogh
Joe Roach
Alistair Groom
Tito Soso
Type of arrangement
Cash Allowance/Defined contribution to GPP2
Cash Allowance
Defined contribution to GPP2
Defined contribution to US 401(k) plan
Cash allowance
Defined contribution to GPP2
Employer contribution
15% of base salary
15% of base salary less Employer NIC
15% of base salary
US$8,250 pa
15% of base salary
15% of base salary
1
David Marock switched to cash allowance from defined contribution in April 2014.
2
GPP is Aviva Group Personal Pension.
Employee contribution
None
None
None
US$20,500 pa
None
None
There was no increase in the accrued pension values under the defined benefits scheme during the year. The following table sets out
the transfer value of the directors accrued benefits under the scheme calculated in a manner consistent with “Retirement Benefit
Schemes – Transfer Values (GN11)” published by the Institute of Actuaries and the Faculty of Actuaries.
Defined benefit schemes
Damian Ely
Alistair Groom
1
Transfer
value
31 December
2013
£000
Contributions
made by
the director in
2014
£000
1,658
3,847
—
—
Increase in
full transfer
Cutback
value in the Transfer value transfer value1
year net of 31 December 31 December
contributions
2014
2014
£000
£000
£000
837
474
2,495
4,321
1,171
3,068
The cutback transfer value relates to the reduced transfer value that would be available due to the funding situation of the scheme.
The increase in transfer value in 2014 was principally due to the impact of the fall in yields on gilts and bonds. The normal retirement
date under the Charles Taylor defined benefit Pension Scheme of Alistair Groom and Damian Ely is 62.
55
UNAUDITED INFORMATION
Remuneration principles
The Committee believes that the interests of shareholders and executive directors should be aligned, as far as possible. It seeks to
achieve this by incentivising executive directors to deliver success over time through sustainable and profitable growth.
Remuneration Committee
The Company’s Remuneration Committee is constituted in accordance with the recommendations of the UK Corporate Governance
Code. The members of the Committee during the year were Gill Rider (Chairman), Julian Cazalet, Edward Creasy, Barnabas HurstBannister and David Watson and Rupert Robson, who is the non-executive Group Chairman. Barnabas Hurst-Bannister joined the
Committee on his appointment as a director on 8 October 2014, replacing Julian Cazalet. He subsequently stood down from the
Committee in March 2015 when he was no longer regarded as independent under the Code. Gill Rider, Edward Creasy and David
Watson are independent non-executive directors. None of Gill Rider, David Watson and Rupert Robson has any personal financial
interest (other than as shareholders), conflicts of interest arising from cross-directorships, or day-to-day involvement in the running of
the business. Edward Creasy serves as a non-executive director on several subsidiary boards of the Company.
The Committee is responsible for developing policy on remuneration for the executive directors and senior management, for
determining specific remuneration packages for each of the executive directors, and recommending to the Board changes to the fees of
the non-executive Group chairman. The Chief Executive Officer may attend meetings by invitation. The Committee met four times
during 2014. No executive director plays a part in any discussion or decision about his or her own remuneration.
The terms of reference of the Committee are available on the Company’s website at www.ctplc.com under the Investor section Corporate Governance or from the Company Secretariat department.
Committee effectiveness
The Committee conducted a review of its effectiveness taking both direct feedback and also the findings of the Board review process.
The review concluded that the Committee had received sufficient, reliable and timely information to enable it to fulfil its
responsibilities.
Advisors
New Bridge Street, (“NBS”), a trading name of Aon Hewitt Ltd, is retained as the adviser to the Remuneration Committee. NBS was
appointed by the Committee to provide advice and information and is a signatory to the Remuneration Consultants’ Code of Conduct
which requires that its advice be objective and impartial. NBS has not provided other services to the Company during the financial
year.
New Bridge Street’s fees for providing advice and information related to remuneration and employee share plans to the Committee
amounted to £51,715.
In addition to New Bridge Street, the following people provided material advice or services to the Committee during the year:
David Marock
Group Chief Executive Officer
Ivan Keane
Group Company Secretary and General Counsel
Suzanne Deery
Director of Human Resources
Statement of voting at last AGM
The Company remains committed to on-going shareholder dialogue and takes a keen interest in voting outcomes. The following table
sets out voting outcomes in respect of the resolutions relating to approving Directors’ remuneration matters at the Company’s AGM
on 8 May 2014:
Resolution
Approve Remuneration Report
Approve Remuneration Policy
Approve Deferred Annual Bonus Plan
Votes for/discretionary
29,740,863
30,029,668
30,077,208
56
% of vote
99.82
99.78
99.92
Votes Against
53,409
67,538
24,539
% of vote Votes withheld
0.18
352,645
0.22
49,711
0.08
45,170
Performance graph
The following graphs show the value of £100 invested in the Company compared with the value of £100 invested in the FTSE Small
Cap Index, measured by reference to total shareholder return. The FTSE Small Cap Index has been selected for this comparison as it is
one of the indexes used to determine performance under the LTIP scheme for executive directors and is considered to be the most
appropriate index measure.
Chief Executive Officer remuneration for previous six years
Single figure of total remuneration (£’000)
Annual bonus payout against maximum opportunity %
LTI vesting rates against maximum opportunity %
2009
JR
562
55
0
2010
JR
479
0
0
2011
JR*
235
0
N/A
DM*
347
N/A**
N/A
2012
DM
650
57
0
2013
DM
696
67
0
2014
DM
1,605
78
100
*
John Rowe (JR) retired 30 June 2011 and David Marock (DM) was appointed 1 July 2011.
**
David Marock, under the terms of his appointment, received a guaranteed one-off bonus payment for 2011 of £160,000. This was in recognition of the fact that
he would be forgoing a significant bonus entitlement with his previous employer.
Percentage change in Chief Executive Officer’s remuneration
The table below sets out in relation to salary, taxable benefits and annual bonus the percentage increase in remuneration for David
Marock compared to UK full-time employees, as this is the most directly relevant comparison.
Chief
Executive
3%
9.4%
20%
Percentage change
Base salary
Benefits
Annual bonus
57
Wider
workforce
7.7%
13.9%
61.0%
The large increase in average annual bonus for the wider UK workforce reflects the Group’s strategy to move towards variable pay
increasing as a proportion of total compensation as well as more employees being included in the annual bonus scheme. The average
annual bonus increased from £2,726 to £4,415.
Relative importance of spend on pay
The following table sets out the percentage change in dividends and the overall expenditure on pay (as a whole across the Group):
2013
£4.04m
£66.8m
Dividends relating to the period
Overall expenditure on pay
2014
£4.17m
£68.0m
% change
3.2
1.8
External appointments
As detailed in the Remuneration Policy, to further develop their skills and experience, executive directors are permitted, subject to
approval of the Board, to have up to one external non-executive directorship, unrelated to Charles Taylor, and are allowed to retain the
fees earned in relation to this. No executive directors had an external directorship unrelated to Charles Taylor during the year under
review.
Dilution
The ABI guidelines permit the Company to issue options and awards of shares of up to 10% of the issued share capital on a ten year
rolling basis, of which, 5% can be applied against discretionary schemes (LTIP, Deferred Annual Bonus Plan and ESOS). As at 31
December 2014, there were 907,963 shares available for such awards, of which 571,518 shares were available for discretionary
schemes. The following table sets out the calculation:
All shares
43,429,610
4,342,961
3,434,998
907,963
Issued shares
ABI Limits
Issued (exercised and outstanding)
Available
58
Discretionary
(LTIP, DABP & ESOS)
43,429,610
2,171,481
1,599,963
571,518
STATEMENT OF IMPLEMENTATION OF REMUNERATION POLICY IN 2015
Base salary
The base salaries of executive directors were increased by 1.9% at 1 January 2015, as detailed in the table below:
David Marock
Damian Ely
Mark Keogh
Joe Roach
Base salaries
1 January 2015
335,862
224,608
239,465
US$636,481
GCEO
GCOO
GCFO (Appointed 16 June 2014)
Executive director
1 January 2014
£329,600
£220,420
Not applicable
US$624,613
Annual bonus awards
Under the annual bonus arrangement for 2015, the Committee has approved the level of bonus opportunity and set individual
performance objectives for each executive director as part of the Company’s performance management process. These objectives are
tailored to the roles of each executive director and consist of both financial and non-financial goals. 75% of the weighting of
objectives are financial. Consistent with 2014 the key financial targets will be growth in Group adjusted PBT and Group adjusted EPS
but 25 % of the objectives weighting relate to specific operational, people and client related objectives, which are personal to the
executives. The Committee believes these objectives to be commercially sensitive and has chosen not to disclose them in advance.
Retrospective disclosure will be provided in next year’s Annual Report on these objectives.
For 2015, the bonus opportunities for the executive directors will be as follows:
On-Target %
of salary
100%
50%
35%
27.5%
David Marock
Mark Keogh
Damian Ely
Joe Roach
Maximum %
of salary
150%
75%
52.5%
41.25%
If the bonus awarded is more than the on-target opportunity, the portion above this will be delivered entirely in deferred Charles
Taylor plc shares, which will be released in three equal tranches after one, two and three years.
Long-term incentive arrangements
The Committee will award performance shares under the LTIP in 2015 worth 75% of base salary for David Marock, 50% of base
salary for Damian Ely and 31% of base salary for Joe Roach. Mark Keogh will receive an LTIP award of 50% of base salary plus an
additional 25% of base salary that was due in September 2014 under his contract of employment, but which was unable to be awarded
at the time due to him being in a prohibited period under the Company’s share dealing code. These awards will be subject to two
performance metrics. Half of the award will be subject to the Company’s Total Shareholder Return (TSR) relative to the constituent
companies of the FTSE Small Cap Index (“the comparator Group”) in accordance with the following table:
Ranking of the Company against the comparator Group by reference to TSR
Below median
Median
Between median and upper quartile
Upper quartile
Percentage of shares which may vest
Nil
25%
Pro rata on a straight-line basis between 25% and 100%
100%
The other half of the award will be subject to Earnings Per Share (EPS) growth relative to UK RPI (Retail Price Index) inflation.
There will be zero vesting of this element if performance is below RPI+3 percentage points per annum, 25% vesting for RPI+3
percentage points per annum, and 100% vesting for RPI+9 percentage points per annum (linear interpolation between threshold and
maximum).
59
Reward scenarios
Under the Company’s remuneration policy, a significant portion of the remuneration received by executive directors is dependent on
Company performance. The chart below illustrates how the total pay opportunities for the executive directors vary under three
different performance scenarios: fixed pay only (minimum), on-target performance and maximum performance. The chart is only
indicative, as the effect of share price movements and dividend accrual have been excluded. All the assumptions used are noted below
the chart.
Assumptions:
–
Fixed pay = salary + benefits + pension contribution
–
Target = 67% of the annual bonus and 25% of the LTIP awards vesting
–
Maximum = 100% of the annual bonus and LTIP awards vesting
Base salary levels are based on those to applying on 1 January 2015. The value of taxable benefits is based on the cost of supplying
those benefits (as disclosed) for the year ending 31 December 2014. The remuneration of Joe Roach has been converted from US$ into
£sterling using an exchange rate of 0.60506.
The on-target bonus potential used for David Marock, Mark Keogh, Damian Ely and Joe Roach is 100%, 50%, 35% and 27.5% of
base salary respectively. The maximum bonus potential used for David Marock, Mark Keogh, Damian Ely and Joe Roach is 150%,
75%, 52.5% and 41.25% of base salary respectively. The LTIP awards used for David Marock is 75% of base salary. Whilst under this
policy the awards can be higher, the customary award sizes used for Mark Keogh, Damian Ely and Joe Roach are 50%, 50% and 31%
of base salary respectively.
The executive directors may participate in all-employee share schemes on the same basis as other employees. The value that may be
received under these schemes is subject to tax approved limits. For simplicity, the value that may be received from participating in
these schemes has been excluded from the above charts.
60
Non-executive directors
The non-executive directors have individual letters of engagement and their remuneration is determined by the Board in accordance
with the Articles of Association and based on surveys of the fees paid to non-executive directors of similar companies. Following a
review the basic fees paid to the non-executive directors were increased from £35,000 to £41,000. This is the first increase since 1
January 2010. There was no change to the fees paid to the Board Chairman or the additional fees paid to the Senior Independent
Director or Committee Chairman. A summary of the current fees is as follows:
2015
£90,000
£41,000
£5,000
£10,000
Board Chairman
Basic fee
Additional fee for Senior Independent Director
Additional fee for Committee Chairman
Approval
This report was approved by the Board of Directors on 17 March 2015 and signed on its behalf by:
Gill Rider
Chairman of the Remuneration Committee
17 March 2015
61
2014
£90,000
£35,000
£5,000
£10,000
% Increase
0%
17.1%
0%
0%
Directors’ Report
for the year to 31 December 2014
The Report of the Directors should be read in conjunction with the Strategic Report on pages 3 to 27 and the Corporate Governance
Report on pages 28 to 66, both of which form part of this Directors’ Report.
Strategic Report
The Strategic Report, which can be found on pages 3 to 27, sets out the development and performance of the Company’s business
during the financial year, the position of the Company at the end of the year, a commentary on likely future developments and a
description of the principal risks and uncertainties facing the Company.
Going concern
The Group’s business activities, together with the factors likely to affect its future development, performance and position are set out
in the Strategic Report. The Strategic Report sets out the financial position of the Company as well as providing a description of the
principal risks facing the Company and the processes by which they are managed. In addition to this, financial risks and uncertainties
are explained in note 25 to the financial statements. Details of the Company’s financial instruments are also provided in note 25.
After making enquiries, the directors have formed a judgement at the time of approving the financial statements, that there is a
reasonable expectation that the Company has adequate resources to continue in operational existence for the foreseeable future. For
this reason, the directors continue to adopt the going concern basis in preparing the financial statements.
Dividends
An interim dividend for the year to 31 December 2014 of 3.25p (2013: 3.25p) per share was paid on 28 November 2014. A second
interim dividend for the year to 31 December 2014 of 7.50p (2013 Final dividend: 6.75p) per share will be paid on 24 April 2015 to
those shareholders whose names are on the register on 27 March 2015. The second interim dividend replaces the final dividend. The
Company operates a Dividend Reinvestment Plan. This gives shareholders the opportunity to use their cash dividends to buy
additional shares through a special dealing arrangement with the Company’s Registrars.
Capital structure
Details of the issued share capital, together with details of the movements in the Company’s issued share capital during the year are
shown in note 22. The Company has one class of ordinary shares which carry no right to fixed income. Each share carries the right to
one vote at general meetings of the Company.
As at 31 December 2014 the issued share capital of the Company was 43,429,610 ordinary shares and the average monthly trading
volume was 430,058 ordinary shares (2013: 1,198,408 ordinary shares).
There are no specific restrictions on the size of a holding nor on the transfer of shares, which are both governed by the general
provisions of the Articles of Association and prevailing legislation. The directors are not aware of any agreements between holders of
the Group’s shares that may result in restrictions on the transfer of securities or on voting rights.
Options over 591,021 ordinary shares under Part A of the Charles Taylor Sharesave Scheme were granted on 9 October 2014 to
eligible employees of the Group. These options entitle the participants to acquire ordinary shares between 1 December 2017 and 31
May 2018 at a price of 193.16p per share. Options over 16,209 ordinary shares under Part B of the Charles Taylor Sharesave Scheme
were granted on 9 October 2014 to eligible employees of the Group. These options entitle the participants to acquire ordinary shares
between 1 December 2017 and 31 May 2018 at a price of 193.16p per share. Options over 31,687 ordinary shares under Part C of the
Charles Taylor Sharesave Scheme were granted on 9 October 2014 to eligible employees of the Group. These options entitle the
participants to acquire ordinary shares on 9 January 2017 at a price of 210.375p per share.
Awards over 282,939 ordinary shares under the Charles Taylor Long Term Incentive Plan 2007 (“LTIP”) were granted on 20 March
2014 to the executive directors and a member of the Executive Committee. Full details of the awards are set out in the Directors’
Remuneration Report on page 52.
As at 31 December 2014, the Charles Taylor Employees’ Share Ownership Plan (“ESOP”) held 299,123 shares. On 7 October 2011,
the ESOP Trustees entered into a share supply agreement with the Company, whereby awards made under the LTIP can be settled
from shares held in the ESOP.
Full details of the Company’s employee share schemes are set out in the Directors’ Remuneration Report on pages 40 to 61 and note
24.
No person has any special rights of control over the Company’s share capital and all issued shares are fully paid.
62
Resolutions approved at the last AGM will be proposed again at this year’s AGM – see resolutions 14, 15 and 16 in the Notice of the
AGM. Those resolutions authorise the directors to purchase or issue shares in the capital of the Company within certain limits.
Substantial shareholdings
Notifications of the following voting interests in the Company’s ordinary share capital had been received by the Company (in
accordance with Chapter 5 of the FCA’s Disclosure and Transparency Rules and Section 793 Companies Act 2006) as at 31 December
2014 and 17 March 2015:
Number
of shares
held at
31 December
2014
6,880,000
4,659,009
N/A
3,577,220
3,328,511
1,917,927
1,667,632
Delta Lloyd Asset Management
Legal & General Investment Management
The Standard Club Ltd
Columbia Wanger Asset Management
Kabouter Management LLC
The Diverse Income Trust plc
Mawer Investment Management Ltd
% of voting
rights held
15.84
10.73
N/A
8.19
7.66
4.42
3.84
Number
of shares
held at
17 March
2015
6,480,000
4,659,009
3,607,506
3,577,220
3,661,479
1,917,927
1,780,211
% of voting
rights held
14.09
10.13
7.84
7.77
7.96
4.17
3.87
Save for the above, the directors are unaware of any person, other than the directors whose interests are shown on page 53 and 54,
having a disclosable interest in the issued ordinary share capital of the Company.
Directors
The following directors served during the year ended 31 December 2014 and as at the date of this report:
Name
Rupert Robson
Julian Cazalet
Edward Creasy
Damian Ely
Alistair Groom
Barnabas Hurst-Bannister
Mark Keogh
David Marock
Gill Rider
Joseph Roach III
Tito Soso
David Watson
Appointment
Chairman and Chairman of the Nomination Committee
Senior Independent Non-executive Director (resigned 6 October 2014)
Independent Non-executive Director (appointed 1 January 2014)
Executive Director
Executive Director (resigned 28 February 2014)
Non-executive Director (appointed 8 October 2014)
Executive Director (appointed 16 June 2014)
Executive Director
Senior Independent Non-executive Director and Chairman of the Remuneration Committee
Executive Director
Executive Director (resigned 29 August 2014)
Independent Non-executive Director and Chairman of the Audit Committee
Brief biographies of the current directors, indicating their experience and qualifications are given on pages 29 to 31. All the directors
have elected to retire from the Board at the forthcoming AGM and offer themselves for re-election except for Mark Keogh and
Barnabas Hurst-Bannister, who are standing for election having been appointed since the last AGM.
Details of the directors’ notice periods are given on page 47.
With regard to the appointment and replacement of directors, the Company is governed by its Articles of Association, the Code, the
Companies Act and related legislation. The Articles of Association themselves may be amended by special resolution of the
shareholders. The powers of directors are described in the Articles of Association, copies of which are available on request, and in the
Corporate Governance report on pages 46 to 47.
A statement of directors’ interests in the shares of the Company and their remuneration is set out on pages 53 and 54.
Employees
Full details of arrangements relating to employees are described in the Strategic report on page 26.
Environmental policy
The Company’s Environmental policy is determined by the Board and Damian Ely is the Executive Director responsible for the
Group’s environmental policy. Further details can be found in the Strategic Report on page 26.
63
Greenhouse gas (GHG) emissions
Our emissions have been calculated based on the GHG Protocol Corporate Standard. Included are emissions from both our owned and
leased assets for which we are responsible in the UK and overseas. No material emissions are omitted and the following are reported
on:
–
Scope 1 emissions: Direct emissions from sources owned or operated by the Company; and
–
Scope 2 emissions; Indirect emissions attributable to the Company due to its consumption of purchased electricity, heat or
steam.
CHG emissions for period 1 January 2014 to 31 December 2014
Global tonnes of CO2e
2013
2014
—
—
2,056,342
2,588,509
Scope 1
Scope 2
The increase in Scope 2 emissions is due to additional buildings and square footage acquired during 2014.
There are no Scope 1 emissions to report as the owned properties utilise the latest refrigerant approved R-410a, which contains only
fluorine and does not contribute to ozone depletion.
Political donations
It is the Company’s policy not to make political donations.
Auditor
In the case of each of the persons who are directors of the Company at the date when this report was approved:
–
so far as each of the directors is aware, there is no relevant audit information of which the Company’s auditor is unaware; and
–
each of the directors has taken all the steps that he/she ought to have taken as a director to make himself/herself aware of any
relevant audit information and to establish that the Company’s auditor is aware of that information.
This confirmation is given and should be interpreted in accordance with the provisions of Section 418(2) Companies Act 2006.
The Company’s auditor, Deloitte LLP, has confirmed that they are willing to continue in office. Accordingly, a resolution is to be
proposed at the AGM for the reappointment of Deloitte LLP as auditor of the Company at a rate of remuneration to be determined by
the directors.
Annual General Meeting
The Annual General Meeting will be held at 10.00am on Thursday 7 May 2015 at the offices of Peel Hunt, Moor House, 120 London
Wall, London, EC2Y 5ET. The notice convening the AGM, together with details of the special business to be considered and
explanatory notes for each resolution, is contained in a separate circular sent to shareholders. It is also available to be viewed on the
Company’s website.
Events after the balance sheet date
The following material events took place after the balance sheet date:
Acquisition of Scottish Widows International Limited
On 8th January 2015, the Group announced its intention to acquire Scottish Widows International Limited (SWIL), a Jersey life
insurer in run-off, from Scottish Widows plc. SWIL provides unit-linked life insurance policies and portfolio bonds to individual
investors.
It is intended that SWIL will be re-domiciled to the Isle of Man following the acquisition and that its policies will subsequently be
transferred into Charles Taylor’s wholly-owned Isle of Man life insurance subsidiary LCL International Life Assurance Company
Limited, subject to court approval.
It is expected that the initial consideration will be £2.0m, met from existing cash resources. Subsequent payments of £3.0m will be
made after re-domiciliation and £7.5m payable following the long-term business transfer, or after 18 months at the latest. The total
consideration will be £12.5m. The gross assets of SWIL were £95.0m and net assets were £16.0m as at 30 June 2014.
The acquisition is subject to regulatory approval by The Jersey Financial Services Commission.
64
Acquisition of Almond One Limited (subsequently renamed Charles Taylor Managing Agency Holdings Limited (CTMAH))
and Almond Two Limited
On 26 February 2015, the Group made two related acquisitions. These acquisitions will enable the Group to offer managing agency
services to new syndicates at Lloyd’s on a ‘turnkey’ basis subject to regulatory approval by Lloyd’s, the Prudential Regulatory
Authority and the Financial Conduct Authority. The managing agency’s first client is anticipated to be The Standard Club’s planned
new syndicate 1884.
The Group acquired a 50.1% stake in CTMAH and 100% of Almond Two Limited (the acquisitions) from The Standard Club.
CTMAH had gross and net assets of £1.5m as at 19 February 2015. Almond Two Limited had gross assets and net assets of £3.0m as
at 19 February 2015.
The total consideration was £6.29m, met by the issue of 2,504,781 ordinary shares in Charles Taylor plc. The acquisitions will
commence trading on receipt of regulatory approval.
Acquisition of SC Management
On 3 March 2015, the Group acquired three of the SC Management group’s (SC Management) operating companies from its
shareholders, SCE Establishment Liechtenstein and S.C. Management (Bermuda) Ltd (the acquisition).
SC Management is the independent third-party manager of The Strike Club group (The Strike Club), a group of mutual insurance
companies. The Strike Club is a marine mutual insurance group that is fully owned by its members. It is the only dedicated mutual
insurer covering the running costs of vessels delayed by strikes, shore delays, collisions, groundings and other incidents outside an
owner’s or charterer’s control. In addition to mutual delay cover, it also offers war and loss of earnings cover on a fixed premium
basis.
The consideration for the acquisition was US$2.44m in cash, spread equally over ten years from 1 February 2016, subject to a
completion account adjustment. The gross assets of the acquired companies were US$1.13m and net assets US$0.73m.
Approved by the directors and signed on behalf of the Board.
Ivan Keane
Group Company Secretary and General Counsel
17 March 2015
Charles Taylor plc is registered in England No. 3194476.
65
Directors’ Responsibilities Statement
The directors are responsible for preparing the Annual Report and the financial statements in accordance with applicable law and regulations.
Company law requires the directors to prepare such financial statements for each financial year. Under that law the directors are required to prepare the group
financial statements in accordance with International Financial Reporting Standards (IFRS) as adopted by the European Union and Article 4 of the IAS
Regulation and have also chosen to prepare the parent company financial statements under IFRS as adopted by the European Union. Under company law the
directors must not approve the financial statements unless they are satisfied that they give a true and fair view of the state of affairs of the Company and of the
profit or loss of the Company for that period. In preparing these financial statements, International Accounting Standard 1 requires that directors:
• properly select and apply accounting policies;
• present information, including accounting policies, in a manner that provides relevant, reliable, comparable and understandable information;
• provide additional disclosures when compliance with the specific requirements in IFRS are insufficient to enable users to understand the impact of
particular transactions, other events and conditions on the entity’s financial position and financial performance; and
• make an assessment of the Company’s ability to continue as a going concern.
The directors are responsible for keeping adequate accounting records that are sufficient to show and explain the Company’s transactions and disclose with
reasonable accuracy at any time the financial position of the Company and enable them to ensure that the financial statements and the Directors’
Remuneration Report comply with the Companies Act 2006. They are also responsible for safeguarding the assets of the Company and hence for taking
reasonable steps for the prevention and detection of fraud and other irregularities.
The directors are responsible for the maintenance and integrity of the corporate and financial information included on the Company’s website. Legislation in
the United Kingdom governing the preparation and dissemination of financial statements may differ from legislation in other jurisdictions.
Directors’ responsibility statement
We confirm that to the best of their knowledge:
• the financial statements, prepared in accordance with IFRS as adopted by the EU, give a true and fair view of the assets, liabilities, financial position and
profit of the Company and the undertakings included in the consolidation taken as a whole;
• the Strategic Report includes a fair review of the development and performance of the business and the position of the Company and the undertakings
included in the consolidation taken as a whole, together with a description of the principal risks and uncertainties that they face; and
• the Annual Report and Financial Statements, taken as a whole, is fair, balanced and understandable and provides the information necessary for
shareholders to assess the Company’s performance, business model and strategy.
By order of the Board
David Marock
Group Chief Executive Officer
Damian Ely
Group Chief Operating Officer
Mark Keogh
Group Chief Financial Officer
17 March 2015
66
Independent Auditor’s Report
to the members of Charles Taylor plc
Opinion on financial statements of Charles Taylor plc
In our opinion:
• the financial statements give a true and fair view of the state of the Group’s and of the Parent Company’s affairs as at 31 December 2014 and of the
Group’s profit for the year then ended;
• the group financial statements have been properly prepared in accordance with International Financial Reporting Standards (IFRSs) as adopted by the
European Union;
• the parent company financial statements have been properly prepared in accordance with IFRSs as adopted by the European Union and as applied in
accordance with the provisions of the Companies Act 2006; and
• the financial statements have been prepared in accordance with the requirements of the Companies Act 2006 and, as regards the group financial
statements, Article 4 of the IAS Regulation.
The financial statements comprise the Consolidated Income Statement, the Consolidated Statement of Comprehensive Income, the Consolidated Balance
Sheet, the Company Balance Sheet, the Cash Flow Statements, the Consolidated Statement of Changes in Equity, the Company Statement of Changes in
Equity and the related notes 1 to 35. The financial reporting framework that has been applied in their preparation is applicable law and IFRSs as adopted by
the European Union and, as regards the parent company financial statements, as applied in accordance with the provisions of the Companies Act 2006.
Separate opinion in relation to IFRSs as issued by the IASB
As explained in note 1 to the group financial statements, in addition to complying with its legal obligation to apply IFRSs as adopted by the European Union,
the Group has also applied IFRSs as issued by the International Accounting Standards Board (IASB). In our opinion the group financial statements comply
with IFRSs as issued by the IASB.
Going concern
As required by the Listing Rules we have reviewed the directors’ statement that the Group is a going concern. We confirm that: we have concluded that the
directors’ use of the going concern basis of accounting in the preparation of the financial statements is appropriate; and we have not identified any material
uncertainties that may cast significant doubt on the Group’s ability to continue as a going concern.
However, because not all future events or conditions can be predicted, this statement is not a guarantee as to the Group’s ability to continue as a going
concern.
Our assessment of risks of material misstatement
The assessed risks of material misstatement described below are those that had the greatest effect on our audit strategy, the allocation of resources in the audit
and directing the efforts of the engagement team:
Risk
How the scope of our audit responded to the risk
Valuation of pension scheme obligations
The Group’s net pension liability as at 31 December 2014 is
£41.5million.
We obtained the valuation report prepared by the Group’s external pension
actuary. As part of our review of the pension scheme disclosure in note 29
we have:
The valuation of this liability involves actuarial modelling and is
• utilised our internal actuarial specialists in the valuation of pension
dependent on judgmental assumptions. Those key judgments include
schemes to assess and challenge the assumptions used in calculating
those around the discount rate, price inflation, asset yields and long term
the liabilities and understand the changes from prior periods and
life expectancy.
consistency with market benchmarks;
• tested the valuation of assets in the Group’s schemes by agreeing these
to external confirmation of market value and
• held discussions with management and reviewed legal correspondence,
in order to determine whether any further liabilities needed to be
recognised.
Valuation of goodwill
The Group balance sheet includes £42.2m of goodwill resulting from
past acquisitions in the Group as at 31 December 2014.
The Group’s assessment of impairment of goodwill is a judgmental
process which requires estimates concerning the future cash flows and
associated discount rates and growth rates based on management’s view
of future business prospects at the time of the assessment.
Refer to note 13 in the financial statements.
We reviewed management’s goodwill paper and impairment review. In
order to test the goodwill valuation we have:
• performed a detailed review of management’s forecasts, with a focus
on the implied growth rates and assessed the reasonableness of such
forecasts by assessing the prior year forecasting against the actual outturn in the current year.;
• assessed the discount rates applied to the expected cash flows with
focus on the sensitivity analysis to assess the level of headroom that
existed in the business; we have recalculated the weighted average cost
of capital, which represents the basis for the discount rate used.
67
Risk
How the scope of our audit responded to the risk
• reviewed the structure and allocation of the company’s goodwill model
to determine this complied with accounting standards.
Valuation of intangibles
The Group has £8.6m of internally generated intangible assets as at 31
December 2014.
Intangible assets are recognised based upon management’s models
which rely upon judgements including actuarial assumptions, estimated
useful lives and discount rates.
Refer to note 14 in the financial statements.
Recoverability of WIP and Debtors
The Group has £26.2m of trade debtors and of £23.5m accrued income
recognised as at 31 December 2014.
Due to the nature of the adjusting business the final settlement of
revenue often takes place significantly after work has been performed.
Valuation of WIP and debtors is therefore judgmental as a result of
management’s estimates of the recoverability of WIP and debtor
amounts and the discounting assumptions applied to the recoverable
amounts. Due to the time taken between the initial recording of accrued
income and its ultimate billing and the time taken to collect outstanding
fee receivables, a discount is applied to the amounts shown to reflect the
time value of money.
Refer to note 18 in the financial statements.
Revenue recognition
In accordance with ISA 240 The auditor’s responsibility to consider
fraud in the audit of financial statements, there is a presumed risk of
fraud around revenue recognition in our audit.
We have assessed the design, implementation and operating
effectiveness of controls surrounding all revenue streams, as well as
performed detailed substantive testing procedures across all revenue
balances. We concluded that the risk predominantly affected accrued
income in the Adjusting and Insurance Support Services (“ISS”)
divisions.
We reviewed management’s analysis on the treatment of intangibles. In
order to test the valuation of intangible we have:
• substantively tested the recognition of capitalised expenses to
determine whether this was in line with the applicable accounting
policy;
• reviewed and challenged management assumptions (i.e. pattern of
future economic benefits generation, estimated useful life) regarding
the valuation of intangibles and performed sensitivity analysis to assess
the level of headroom;
• obtained management’s models for the amortisation of intangibles and
tested the integrity of the model along with ascertaining that
amortisation was in line with management’s policy and prior year
treatment
• performed analytical review testing to compare amortisation expense to
our expectation.
We have assessed the design, implementation and operating effectiveness of
controls implemented over the WIP and debtors cycle
We obtained the client’s model for discounting WIP and debtors. As part
of our testing of these balances we:
• utilised our IT specialists to perform testing on the key systems and
controls utilised in the recording of loss adjusters time, which is the
basis for WIP,
• reviewed the ageing of debtors and WIP at a group level to identify
those balances that are static for long periods.
• Testing the discount: The discount rate is based on the interest rate on
the overdraft facilities which are financing the working capital. We
have agreed the discount rates used to the interest rates as per the
respective financing facilities.
Under IFRS “work-in-progress” (“WIP”) within the Adjusting division is
valued at sales value rather than at cost and is classified as “accrued
income”. Our substantive work on the Adjusting division focussed on
reviewing and challenging management’s over-recovery and discounting
model, in terms of both the reasonableness of the model but also the
accuracy of the data inputs. Our review concluded that the model is
reasonable.
We performed a detailed review of management’s methodology of
determining accrued income for the static claims business within the ISS
division. We challenged management’s key assumptions and judgements
and consider them to be in line with our expectations. This is consistent
with prior year discussions and recommendations.
We have audited the calculation of the management fees earned from the
mutuals and we have assessed the reasonableness of the adjustment related
to Signal, as this fee is “trued up” to reflect the actual increments in the
level of service rendered.
Our audit procedures relating to these matters were designed in the context of our audit of the financial statements as a whole, and not to express an opinion
on individual accounts or disclosures. Our opinion on the financial statements is not modified with respect to any of the risks described above, and we do not
express an opinion on these individual matters.
68
Our application of materiality
We define materiality as the magnitude of misstatement in the financial statements that makes it probable that the economic decisions of a reasonably
knowledgeable person would be changed or influenced. We use materiality both in planning the scope of our audit work and in evaluating the results of our
work.
We determined materiality for the Group to be £640,000, which is below 7.5% of adjusted profit for the year, and below 1.5% of equity. Adjusted profit for
the year is used by the Group for reporting adjusted earnings per share and we determined this to be the underlying profit that is of most interest to investors
and the entity. This excludes one-off restructuring costs and amortisation of customer relationships intangibles. Materiality has increased by £40,000 from
2013, driven by increased adjusted profit before tax of the Group.
We agreed with the Audit Committee that we would report to the Committee all audit differences in excess of £25,000, as well as differences below that
threshold that, in our view, warranted reporting on qualitative grounds. We also report to the Audit Committee on disclosure matters that we identified when
assessing the overall presentation of the financial statements.
An overview of the scope of our audit
Our group audit was scoped by obtaining an understanding of the Group and its environment, including group-wide controls, and assessing the risks of
material misstatement at the group level. Based on that assessment, we focused our group audit scope primarily on the audit work at twelve locations. Three
of these locations were subject to a full scope audit, whilst the remaining nine were subject to specified audit procedures where the extent of our testing was
based on our assessment of the risks of material misstatement and of the materiality of the Group’s operations at those locations.
These twelve locations account for 94% of the Group’s assets, 81% of the Group’s revenue and 86% of the Group’s profit before tax. They were also selected
to provide an appropriate basis for undertaking audit work to address the risks of material misstatement identified above. Our audit work at the 12 locations
was executed at levels of materiality applicable to each individual entity which were lower than group materiality. The materiality instructed for specified
audit procedures was in the range of £310,000 to £558,000.
At the parent entity level we also tested the consolidation process and carried out analytical procedures to confirm our conclusion that there were no
significant risks of material misstatement of the aggregated financial information of the remaining components not subject to audit or audit of specified
account balances.
The group audit team continued to follow a programme of planned visits that has been designed so that a senior member of the group audit team visits each of
the locations where the group audit scope requires a full audit to be completed; nevertheless, as the majority of the group’s operations are located in the UK,
no visits have been deemed necessary for the purpose of the current year audit. In years when we do not visit a significant component, we will include the
component audit team in our team briefing, discuss their risk assessment, and review documentation of the findings from their work.
Opinion on other matters prescribed by the Companies Act 2006
In our opinion:
• the part of the Directors’ Remuneration Report to be audited has been properly prepared in accordance with the Companies Act 2006; and
• the information given in the Strategic Report and the Directors’ Report for the financial year for which the financial statements are prepared is consistent
with the financial statements.
Matters on which we are required to report by exception
Adequacy of explanations received and accounting records
Under the Companies Act 2006 we are required to report to you if, in our opinion:
• we have not received all the information and explanations we require for our audit; or
• adequate accounting records have not been kept, or returns adequate for our audit have not been received from branches not visited by us; or
• the parent company financial statements are not in agreement with the accounting records and returns.
We have nothing to report in respect of these matters.
Directors’ remuneration
Under the Companies Act 2006 we are also required to report if in our opinion certain disclosures of directors’ remuneration have not been made or the part of
the Directors’ Remuneration Report to be audited is not in agreement with the accounting records and returns. We have nothing to report arising from these
matters.
Corporate Governance Statement
Under the Listing Rules we are also required to review the part of the Corporate Governance Statement relating to the Company’s compliance with ten
provisions of the UK Corporate Governance Code. We have nothing to report arising from our review.
Our duty to read other information in the Annual Report
Under International Standards on Auditing (UK and Ireland), we are required to report to you if, in our opinion, information in the annual report is:
• materially inconsistent with the information in the audited financial statements; or
• apparently materially incorrect based on, or materially inconsistent with, our knowledge of the Group acquired in the course of performing our audit; or
• otherwise misleading.
69
In particular, we are required to consider whether we have identified any inconsistencies between our knowledge acquired during the audit and the directors’
statement that they consider the annual report is fair, balanced and understandable and whether the annual report appropriately discloses those matters that we
communicated to the Audit Committee which we consider should have been disclosed. We confirm that we have not identified any such inconsistencies or
misleading statements.
Respective responsibilities of directors and auditor
As explained more fully in the Directors’ Responsibilities Statement, the directors are responsible for the preparation of the financial statements and for being
satisfied that they give a true and fair view. Our responsibility is to audit and express an opinion on the financial statements in accordance with applicable law
and International Standards on Auditing (UK and Ireland). Those standards require us to comply with the Auditing Practices Board’s Ethical Standards for
Auditors. We also comply with International Standard on Quality Control 1 (UK and Ireland). Our audit methodology and tools aim to ensure that our quality
control procedures are effective, understood and applied. Our quality controls and systems include our dedicated professional standards review team and
independent partner reviews.
This report is made solely to the Company’s members, as a body, in accordance with Chapter 3 of Part 16 of the Companies Act 2006. Our audit work has
been undertaken so that we might state to the Company’s members those matters we are required to state to them in an auditor’s report and for no other
purpose. To the fullest extent permitted by law, we do not accept or assume responsibility to anyone other than the Company and the Company’s members as
a body, for our audit work, for this report, or for the opinions we have formed.
Scope of the audit of the financial statements
An audit involves obtaining evidence about the amounts and disclosures in the financial statements sufficient to give reasonable assurance that the financial
statements are free from material misstatement, whether caused by fraud or error. This includes an assessment of: whether the accounting policies are
appropriate to the Group and the parent company’s circumstances and have been consistently applied and adequately disclosed; the reasonableness of
significant accounting estimates made by the directors; and the overall presentation of the financial statements. In addition, we read all the financial and nonfinancial information in the annual report to identify material inconsistencies with the audited financial statements and to identify any information that is
apparently materially incorrect based on, or materially inconsistent with, the knowledge acquired by us in the course of performing the audit. If we become
aware of any apparent material misstatements or inconsistencies we consider the implications for our report.
Alex Arterton (Senior Statutory Auditor)
for and on behalf of Deloitte LLP
Chartered Accountants and Statutory Auditor
London, United Kingdom
17 March 2015
70
Financial Statements
Consolidated Income Statement
Year to 31 December
Note
Continuing operations
Revenue from Professional Services
Revenue from Owned Insurance Companies
Gross revenue
Outward reinsurance premiums
Net revenue
Total revenue
Expenses from Owned Insurance Companies
Claims incurred
Reinsurance recoveries
Other gains from insurance activities
Net operating expenses
Net losses
Administrative expenses
Share of results of associates
Operating profit
Investment and other income
Finance costs
27
3
4
16
6
7
Profit before tax
Income tax expense
Profit for the year from continuing operations
8
2014
£000
2013
£000
118,607
108,544
5,211
(1,059)
4,152
122,759
6,495
(1,461)
5,034
113,578
(5,812)
676
6,835
(4,438)
(2,739)
(109,038)
121
11,103
64
(1,601)
9,566
(1,165)
8,401
(10,082)
1,533
10,478
(5,564)
(3,635)
(101,528)
69
8,484
92
(1,668)
6,908
(1,369)
5,539
Attributable to:
Owners of the Company
Non-controlling interests
23
8,211
190
8,401
5,807
(268)
5,539
Earnings per share from continuing operations
Statutory basic (p)
Statutory diluted (p)
11
11
19.48
19.31
14.22
14.11
Adjusted earnings per share figures are shown on page 96.
71
Consolidated Statement of Comprehensive Income
Year to 31 December
Note
Profit for the year
Items that will not be reclassified subsequently to profit or loss
Actuarial (losses)/gains on defined benefit pension schemes
Tax on items taken directly to equity
29
Items that may be reclassified subsequently to profit or loss
Exchange differences on translation of foreign operations
(Losses)/gains on cash flow hedges
Other comprehensive loss for the year, net of tax
Total comprehensive (loss)/income for the year
Attributable to:
Owners of the Company
Non-controlling interests
72
2014
£000
8,401
2013
£000
5,539
(16,936)
2,978
(13,958)
3,039
(1,929)
1,110
450
(135)
315
(13,643)
(5,242)
(1,925)
320
(1,605)
(495)
5,044
(5,473)
231
(5,242)
5,381
(337)
5,044
Consolidated Balance Sheet
At 31 December
2014
£000
2013
£000
13
14
15
16
17
42,196
12,898
4,011
748
8,613
68,466
41,536
11,205
4,090
668
5,811
63,310
27
18
795,628
60,061
52,185
907,874
976,340
319,248
53,850
48,757
421,855
485,165
27
19
12
756,057
24,097
4,032
326
112
5,345
41,886
831,855
76,019
281,114
20,907
4,284
335
434
5,302
39,990
352,366
69,489
37,402
41,534
308
60
10,505
89,809
921,664
35,255
26,671
411
150
9,639
72,126
424,492
54,676
60,673
434
35,650
6,872
662
(223)
(10,699)
32,696
21,980
54,676
415
32,704
6,872
662
(433)
(1,378)
38,842
21,831
60,673
Note
Non-current assets
Goodwill
Other intangible assets
Property, plant and equipment
Investments
Deferred tax assets
Total non-current assets
Current assets
Total assets in insurance businesses
Trade and other receivables
Cash and cash equivalents
Total current assets
Total assets
Current liabilities
Total liabilities in insurance businesses
Trade and other payables
Deferred consideration
Current tax liabilities
Obligations under finance leases
Borrowings
Client funds
Total current liabilities
Net current assets
Non-current liabilities
Borrowings
Retirement benefit obligation
Provisions
Obligations under finance leases
Deferred consideration
Total non-current liabilities
Total liabilities
20
20
20
20
29
21
20
12
Net assets
Equity
Share capital
Share premium account
Merger reserve
Capital reserve
Own shares
Retained earnings
Equity attributable to owners of the Company
Non-controlling interests
Total equity
22
23
The financial statements were approved by the Board of Directors and authorised for issue on 17 March 2015.
Mark Keogh
Director
17 March 2015
73
Company Balance Sheet
At 31 December
Note
2014
£000
2013
£000
16
72,926
78,843
18
179,370
145,150
Non-current assets
Investments
Current assets
Trade and other receivables
2,025
1,991
Total current assets
181,395
147,141
Total assets
254,321
225,984
135,757
Cash and cash equivalents
Current liabilities
Trade and other payables
19
159,188
Borrowings
20
1,192
1,401
160,380
137,158
21,015
9,983
37,370
35,163
197,750
172,321
56,571
53,663
434
415
Share premium account
35,650
32,704
Retained earnings
20,487
20,544
Total equity
56,571
53,663
Total current liabilities
Net current assets
Non-current liabilities
Borrowings
20
Total liabilities
Net assets
Equity
Called up share capital
22
The financial statements were approved by the Board of Directors and authorised for issue on 17 March 2015.
Mark Keogh
Director
17 March 2015
74
Cash Flow Statements
Year to 31 December
Note
2014
£000
2013
£000
28
9,835
12,937
Group
Net cash from operating activities
Investing activities
Interest received
30
70
Proceeds on disposal of property, plant and equipment
91
117
Purchases of property, plant and equipment
(1,534)
(1,161)
Acquisition of other intangible assets
(2,774)
(1,678)
Purchase of investments
Acquisition of subsidiaries
Net cash acquired with subsidiary
Net cash used in investing activities
(957)
(542)
—
(2,078)
440
33
(4,704)
(5,239)
487
205
Financing activities
Proceeds from issue of shares
Dividends paid
10
Repayments of borrowings
Repayments of obligations under finance leases
New bank loans raised
(4,167)
(4,043)
(29,125)
(15,444)
(477)
(687)
31,061
28,681
Increase/(decrease) in bank overdrafts
48
(13,736)
Net cash used in financing activities
(2,173)
(5,024)
2,958
2,674
48,757
47,758
470
(1,675)
52,185
48,757
1,896
1,132
Interest received
22
66
Net cash from investing activities
22
66
487
205
Net increase in cash and cash equivalents
Cash and cash equivalents at beginning of year
Effect of foreign exchange rate changes
Cash and cash equivalents at end of year
Company
28
Net cash from operating activities
Investing activities
Financing activities
Proceeds from issue of shares
Dividends paid
10
Repayments of borrowings
New bank loans raised
Decrease in bank overdrafts
(4,167)
(4,043)
(29,064)
(15,223)
31,061
28,681
(201)
(9,382)
(1,884)
238
34
1,436
Cash and cash equivalents at beginning of year
1,991
555
Cash and cash equivalents at end of year
2,025
1,991
Net cash (used in)/from financing activities
Net increase in cash and cash equivalents
75
Consolidated Statement of Changes in Equity
At 1 January 2014
Issue of share capital
Share premium arising on issue of share capital
Profit for the financial year
Dividends paid (note 10)
Actuarial losses on defined benefit pension
schemes (note 29)
Tax on items taken to equity
Foreign currency exchange differences
Movement in own shares
Movement in share-based payments
Losses on cash flow hedges
Other movements
At 31 December 2014
At 1 January 2013
Issue of share capital
Share premium arising on issue of share capital
Profit for the financial year
Dividends paid (note 10)
Actuarial gains on defined benefit pension
schemes (note 29)
Tax on items taken to equity
Foreign currency exchange differences
Movement in own shares
Movement in share-based payments
Gains on cash flow hedges
Other movements
At 31 December 2013
Share
capital
£000
415
19
—
—
—
Share
premium
account
£000
32,704
—
2,946
—
—
Merger
reserve
£000
6,872
—
—
—
—
Capital
reserve
£000
662
—
—
—
—
Own
shares
£000
(433)
—
—
—
—
Retained
earnings
£000
(1,378)
—
—
8,211
(4,167)
Noncontrolling
interests
£000
21,831
—
—
190
—
Total
£000
60,673
19
2,946
8,401
(4,167)
—
—
—
—
—
—
—
434
—
—
—
—
—
—
—
35,650
—
—
—
—
—
—
—
6,872
—
—
—
—
—
—
—
662
—
—
—
210
—
—
—
(223)
(16,936)
2,978
410
—
371
(135)
(53)
(10,699)
—
—
40
—
—
—
(81)
21,980
(16,936)
2,978
450
210
371
(135)
(134)
54,676
403
12
—
—
—
30,635
—
2,069
—
—
6,872
—
—
—
—
662
—
—
—
—
(385)
—
—
—
—
(3,684)
—
—
5,807
(4,043)
22,108
—
—
(268)
—
56,611
12
2,069
5,539
(4,043)
—
—
—
—
—
—
—
415
—
—
—
—
—
—
—
32,704
—
—
—
—
—
—
—
6,872
—
—
—
—
—
—
—
662
—
—
—
(48)
—
—
—
(433)
3,039
(1,929)
(1,856)
—
968
320
—
(1,378)
—
—
(69)
—
—
—
60
21,831
3,039
(1,929)
(1,925)
(48)
968
320
60
60,673
The capital reserve and merger reserve arose on formation of the Group and are non-distributable capital reserves.
Own shares comprise 299,123 (2013: 258,453) shares held by the Charles Taylor Employee Share Ownership Plan Trust (ESOP). The
market value of these shares was £747,808 (2013: £651,302) at the balance sheet date.
The trustee of the ESOP is Summit Trust International SA, an independent professional trust company registered in Switzerland. The
ESOP is a discretionary trust for the benefit of employees of the Group and provides a source of shares to distribute to the Group’s
employees (including executive directors and officers) under the Group’s various bonus and incentive schemes, at the discretion of the
trustee acting on the recommendation of a committee of the Board.
The assets, liabilities, income and costs of the ESOP are incorporated into the consolidated financial statements.
There are no significant restrictions on the ability of subsidiaries to transfer funds to the parent in the form of cash dividends or to
repay loans or advances other than company law requirements dealing with distributable profits, and in the case of the insurance
companies, regulatory permissions and solvency limits.
76
Company Statement of Changes in Equity
At 1 January 2014
Issue of share capital
Share premium arising on issue of share capital
Profit for the financial year
Dividends paid (note 10)
Losses on cash flow hedges
At 31 December 2014
Share
capital
£000
415
19
—
—
—
—
434
Share
premium
account
£000
32,704
—
2,946
—
—
—
35,650
Retained
earnings
£000
20,544
—
—
4,245
(4,167)
(135)
20,487
Total
£000
53,663
19
2,946
4,245
(4,167)
(135)
56,571
At 1 January 2013
Issue of share capital
Share premium arising on issue of share capital
Profit for the financial year
Dividends paid (note 10)
Gains on cash flow hedges
At 31 December 2013
Share
capital
£000
403
12
—
—
—
—
415
Share
premium
account
£000
30,635
—
2,069
—
—
—
32,704
Retained
earnings
£000
10,251
—
—
14,016
(4,043)
320
20,544
Total
£000
41,289
12
2,069
14,016
(4,043)
320
53,663
77
Notes to the Financial Statements
1. Accounting policies
General information
Charles Taylor plc (the Company) is a company incorporated in the United Kingdom under the Companies Act. The address of the
registered office is given on page 129. The principal activities of the Company and its subsidiaries (the Group) and the nature of the
Group’s operations are set out in note 31 and in the Strategic Report on pages 3 to 27. These financial statements are presented in
pound sterling because that is the currency of the primary economic environment in which the Group operates. Foreign operations are
included in accordance with the policies set out below.
Basis of accounting
The financial statements have been prepared in accordance with International Financial Reporting Standards (IFRSs). The financial
statements have also been prepared in accordance with IFRSs adopted by the European Union and therefore the Group financial
statements comply with Article 4 of the EU IAS Regulation.
The financial statements have been prepared on the historical cost basis, except for the revaluation of certain properties and financial
instruments that are measured at revalued amounts at fair values at the end of each reporting period, as explained in the accounting
policies below. Historical cost is generally based on the fair value of the consideration given in exchange for the assets. The principal
accounting policies adopted are set out below.
Structure of accounting policies
The accounting policies below are structured as follows:
(a)
Application of new and revised IFRSs.
(b)
Basis of consolidation.
(c)
Group-wide policies.
(d)
Accounting for insurance contracts and investment contracts business
(i)
Non-life business.
(ii)
Life business.
The most material estimates and judgements management have made in applying the accounting policies are described in note 2.
(a) Application of new and revised IFRSs
(i) Amendments to IFRSs and the new Interpretations that are mandatorily effective for the current year
In the current year the Group has applied a number of amendments to IFRSs and a new Interpretation issued by the International
Accounting Standards Board (IASB) that are mandatorily effective for an accounting period that begins on or after 1 January 2014.
Amendment to IAS 32 Offsetting Financial
Assets and Financial Liabilities
The Group has assessed whether certain of its financial assets and financial
liabilities qualify for offset based on the criteria set out in the amendments. The
amendments clarify the meaning of “currently has a legally enforceable right of setoff” and “simultaneous realisation and settlement”.
Amendments to IAS 36 Recoverable Amount
Disclosures for Non-Financial Assets
The amendments to IAS 36 remove the requirement to disclose the recoverable
amount of a cash generating unit (CGU) to which goodwill or other intangible
assets with indefinite useful lives had been allocated when there has been no
impairment or reversal of impairment of the related CGU. The amendments
introduce additional disclosure requirements, in line with the disclosures required
by IFRS 13 Fair Value Measurements.
78
Amendments to IAS 39 Novation of Derivatives
and Continuation of Hedge Accounting
The amendments provide relief from the requirement to discontinue hedge
accounting when a derivative designated as a hedging instrument is novated under
certain circumstances.
Amendments to IFRS 10, IFRS 12, and IAS 27
Investment Entities
The amendments to IFRS 10 define an investment entity and require such an entity
not to consolidate its subsidiaries but instead measure them at fair value through
profit or loss. IFRS 12 and IAS 27 introduce new disclosure requirements for
investment entities.
The application of these amendments has had no material impact on the amounts recognised and disclosures made in the Group’s
consolidated financial statements.
(ii) New and revised IFRSs in issue but not yet effective
The Group has not applied the following new and revised IFRSs that have been issued but are not yet effective:
IFRS 9
IFRS 15
Amendments to IFRS 11
Amendments to IAS 16 and IAS 38
Amendments to IAS 19
Amendments to IFRSs
Amendments to IFRSs
Financial Instruments
Revenue from Contracts with Customers
Accounting for Acquisitions of Interests in Joint Operations
Clarification of Acceptable Methods of Depreciation and Amortisation
Defined Benefit Plans: Employee Contributions
Annual improvements to IFRSs 2010-2012 Cycle
Annual improvements to IFRSs 2011-2013 Cycle
The directors do not expect that the application of the IFRSs listed above will have a significant impact on the Group’s financial
statements of the Group in future periods, except in the case of IFRS 15 which sets out extensive prescriptive guidance to deal with
specific scenarios and in additions, extensive additional disclosures.
Beyond the information above, it is not practicable to provide a reasonable estimate of the effect of these standards until a detailed
review has been completed.
(b) Basis of consolidation
The consolidated financial statements incorporate the financial statements of the Company and entities controlled by the Company (its
subsidiaries) made up to 31 December each year. Control is achieved when the Company:
•
has the power over the investee;
•
Is exposed, or has rights, to variable return from its involvement with the investee; and
•
has the ability to use its power to affect its returns.
The Company reassesses whether or not it controls an investee if facts and circumstances indicate that there are changes to one or
more of the three elements of control listed above.
The Group owns a number of insurance companies. The assets of the insurance companies are held for the benefit of the policyholders
in the first instance and the Group’s interest is restricted to income from managing these businesses and a share in any surplus after
deferred consideration payments to the former owners. Consequently, although fully consolidated, the assets and liabilities relating to
insurance companies are separately identified in these financial statements.
Similarly, the income and expense items relating to insurance contracts are grouped together in the consolidated income statement
because most are related, for example claims and related insurance recoveries, and to distinguish them from the Group’s main
activities.
The analysis between current and non-current assets and liabilities is not useful for insurance companies. The assets and liabilities of
the insurance companies have been classified as current rather than non-current for practical purposes and to conform with the
presentation used in these financial statements, although in practice an element is expected to be settled in more than one year.
Consolidation of a subsidiary begins when the Company obtains control over the subsidiary and ceases when the Company loses
control of the subsidiary. Specifically, the results of subsidiaries acquired or disposed of during the year are included in the
consolidated income statement from the date the Company gains control until the date when the Company ceases to control the
subsidiary.
79
Profit or loss and each component of other comprehensive income are attributed as appropriate to the owners of the Company and to
the non-controlling interests. Total comprehensive income of the subsidiaries is attributed to the owners of the Company and to the
non-controlling interests even if this results in the non-controlling interests having a deficit balance.
Where necessary, adjustments are made to the financial statements of subsidiaries to bring the accounting policies used into line with
the Group’s accounting policies.
All intragroup assets and liabilities, equity, income, expenses and cash flows relating to transactions between members of the Group
are eliminated on consolidation.
Non-controlling interests in subsidiaries are identified separately from the Group’s equity therein. Those interests of non-controlling
shareholders that are present ownership interests entitling their holders to a proportionate share of net assets upon liquidation may be
initially measured at fair value or at the non-controlling interests’ proportionate share of the fair value of the acquiree’s identifiable net
assets. The choice of measurement is made on an acquisition-by-acquisition basis. Other non-controlling interests are initially
measured at fair value. Subsequent to acquisition, the carrying amount of non-controlling interests is the amount of those interests at
initial recognition plus the non-controlling interests’ share of subsequent changes in equity. Total comprehensive income is attributed
to non-controlling interests even if this results in the non-controlling interests having a deficit balance.
Changes in the Group’s interests in subsidiaries that do not result in a loss of control are accounted for as equity transactions. The
carrying amount of the Group’s interests and the non-controlling interests are adjusted to reflect the changes in their relative interests
in the subsidiaries. Any difference between the amount by which the non-controlling interests are adjusted and the fair value of the
consideration paid or received is recognised directly in equity and attributed to the owners of the Company.
When the Group loses control of a subsidiary, the gain or loss on disposal recognised in profit or loss is calculated as the difference
between (i) the aggregate of the fair value of the consideration received and the fair value of any retained interest and (ii) the previous
carrying amount of the assets (including goodwill), less liabilities of the subsidiary and any non-controlling interests. Amounts
previously recognised in other comprehensive income in relation to the subsidiary are accounted for as if the Group had directly
disposed of the related assets or liabilities of the subsidiary (i.e. reclassified to profit or loss or transferred to another category of
equity as specified/permitted by applicable IFRS). The fair value of any investment retained in the former subsidiary at the date when
control is lost is regarded as the fair value on initial recognition for subsequent accounting under IAS 39 Financial Instruments:
Recognition and Measurement or, when applicable, the costs on initial recognition of an investment in an associate or jointly
controlled entity.
Going concern
The directors have, at the time of approving the financial statements, a reasonable expectation that the Company and the Group have
adequate resources to continue in operational existence for the foreseeable future. Thus they continue to adopt the going concern basis
of accounting in preparing the financial statements. Further detail is contained in the Directors’ Report.
Business combinations
Acquisitions of subsidiaries and businesses are accounted for using the acquisition method. The consideration transferred in a business
combination is measured at fair value, which is calculated as the sum of the acquisition-date fair values of assets transferred by the
Group, liabilities incurred by the Group to the former owners of the acquiree and the equity interest issued by the Group in exchange
for control of the acquiree. Acquisition-related costs are recognised in profit or loss as incurred.
At the acquisition date, the identifiable assets acquired and the liabilities assumed are recognised at their fair value at the acquisition
date, except that:
•
deferred tax assets or liabilities and liabilities or assets related to employee benefit arrangements are recognised and measured
in accordance with IAS 12 Income taxes and IAS 19 Employee Benefits respectively; and
•
assets (or disposal Groups) that are classified as held for sale in accordance with IFRS 5 Non-current Assets Held for Sale and
Discontinued Operations are measured in accordance with that Standard.
Goodwill is measured as the excess of the sum of the consideration transferred, the amount of any non-controlling interests in the
acquiree, and the fair value of the acquirer’s previously held equity interest in the acquiree (if any) over the net of the acquisition-date
amounts of the identifiable assets acquired and the liabilities assumed. If, after reassessment, the net of the acquisition-date amounts of
the identifiable assets acquired and liabilities assumed exceeds the sum of the consideration transferred, the amount of any noncontrolling interests in the acquiree and the fair value of the acquirer’s previously held interest in the acquiree (if any), the excess is
recognised immediately in profit or loss as a bargain purchase gain.
When the consideration transferred by the Group in a business combination includes assets or liabilities resulting from a contingent
consideration arrangement, the contingent consideration is measured at its acquisition-date fair value and is included as part of the
consideration transferred in a business combination. Changes in fair value of the contingent consideration that qualify as measurement
80
period adjustments are adjusted retrospectively, with corresponding adjustments against goodwill. Measurement period adjustments
are adjustments that arise from additional information obtained during the measurement period (which cannot exceed one year from
the acquisition date) about facts and circumstances that existed at the acquisition date.
The subsequent accounting for changes in the fair value of the contingent consideration that do not qualify as measurement period
adjustments depends on how the contingent consideration is classified. Contingent consideration that is classified as equity is not
remeasured at subsequent reporting dates and its subsequent settlement is accounted for within equity. Contingent consideration that is
classified as an asset or a liability is remeasured at subsequent reporting dates in accordance with IAS39 Financial Instruments:
Recognition and Measurement, or IAS37 Provisions, Contingent Liabilities and Contingent Assets, as appropriate, with the
corresponding gain or loss being recognised in profit or loss.
Where a business combination is achieved in stages, the Group’s previously-held interests in the acquired entity are remeasured to fair
value and the resulting gain or loss, if any, is recognised in profit or loss. Amounts arising from interests in the acquiree prior to the
acquisition date that have previously been recognised in other comprehensive income are reclassified to profit or loss, where such
treatment would be appropriate if that interest were disposed of.
If the initial accounting for a business combination is incomplete by the end of the reporting period in which the combination occurs,
the Group reports provisional amounts for the items for which the accounting is incomplete. These provisional amounts are adjusted
during the measurement period (see above), or additional assets or liabilities are recognised, to reflect new information obtained about
facts and circumstances that existed as of the acquisition date that, if known, would have affected that amounts recognised as of that
date.
Goodwill
Goodwill is initially recognised and measured as set out above.
Goodwill is not amortised but is reviewed for impairment at least annually. For the purpose of impairment testing, goodwill is
allocated to each of the Group’s cash-generating units expected to benefit from the synergies of the combination. Cash-generating
units to which goodwill has been allocated are tested for impairment annually, or more frequently when there is an indication that the
unit may be impaired. If the recoverable amount of the cash-generating unit is less than the carrying amount of the unit, the
impairment loss is allocated first to reduce the carrying amount of any goodwill allocated to the unit and then to the other assets of the
unit pro-rata on the basis of the carrying amount of each asset in the unit. An impairment loss recognised for goodwill is not reversed
in a subsequent period.
On disposal of a subsidiary, the attributable amount of goodwill is included in the determination of the profit or loss on disposal.
The Group’s policy for goodwill arising on the acquisition of an associate is described below.
Investments in associates
An associate is an entity over which the Group has significant influence and that is neither a subsidiary nor an interest in a joint
venture. Significant influence is the power to participate in the financial and operating policy decisions of the investee but is not
control or joint control over these policies.
The results and assets and liabilities of associates are incorporated in these financial statements using the equity method of accounting,
except when the investment is classified as held for sale, in which case it is accounted for in accordance with IFRS 5 Non-current
Assets held for Sale and Discontinued Operations.
Under the equity method, an investment in an associate is initially recognised in the consolidated statement of financial position at
cost and adjusted thereafter to recognise the Group’s share of the profit or loss and other comprehensive income of the associate.
When the Group’s share of losses of an associate exceeds the Group’s interest in that associate (which includes any long-term interests
that, in substance, form part of the Group’s net investment in the associate), the Group discontinues recognising its share of further
losses. Additional losses are recognised only to the extent that the Group has incurred legal or constructive obligations or made
payments on behalf of the associate.
When the Group reduces its ownership interest in an associate but the Group continues to use the equity method, the Group
reclassifies to profit or loss the proportion of the gain or loss that had previously been recognised in other comprehensive income
relating to that reduction in ownership interest if that gain or loss would be reclassified to profit or loss on the disposal of the related
assets or liabilities.
Where a Group company transacts with an associate of the Group, profits and losses resulting from the transactions with the associate
are recognised in the Group’s consolidated financial statements only to the extent of interests in the associate that are not related to the
Group.
81
(c) Group-wide policies
Revenue recognition
Revenue is measured at the fair value of the consideration received or receivable and represents amounts receivable for services
provided in the normal course of business, net of discounts, VAT and other sales-related taxes. Revenue is reduced for estimated
customer returns, rebates and other similar allowances.
Rendering of services
Revenue from a contract to provide services is recognised by reference to the stage of completion of the contract. Revenue from time
contracts is recognised at the contractual rates as labour hours are delivered and direct expenses incurred.
Dividend and interest revenue
Dividend income from investments is recognised when the shareholders’ rights to receive payment have been established (provided
that it is probable that the economic benefits will flow to the Group and the amount of revenue can be measured reliably).
Interest income is recognised when it is probable that the economic benefits will flow to the Group and the amount of revenue can be
measured reliably. Interest income is accrued on a time basis, by reference to the principal outstanding and at the effective interest rate
applicable, which is the rate that exactly discounts estimated future cash receipts through the expected life of the financial asset to that
asset’s net carrying amount on initial recognition.
Leases
Assets held under finance leases are recognised as assets of the Group at their fair value or, if lower, at the present value of the
minimum lease payments, each determined at the inception of the lease. The corresponding liability to the lessor is included in the
balance sheet as a finance lease obligation.
Lease payments are apportioned between finance charges and reduction of the lease obligation so as to achieve a constant rate of
interest on the remaining balance of the liability. Finance expenses are recognised immediately in profit or loss, unless they are
directly attributable to qualifying assets, in which case they are capitalised in accordance with the Group’s general policy on
borrowing costs. Contingent rentals are recognised as expenses in the periods in which they are incurred.
Rentals payable under operating leases are charged to income on a straight-line basis over the term of the relevant lease except where
another more systematic basis is more representative of the time pattern in which economic benefits from the lease asset are
consumed.
In the event that lease incentives are received to enter into operating leases, such incentives are recognised as a liability. The aggregate
benefit of incentives is recognised as a reduction of rental expense on a straight-line basis over the lease term, except where another
systematic basis is more representative of the time pattern in which economic benefits from the leased asset are consumed.
Foreign currencies
The individual financial statements of each Group company are presented in the currency of the primary economic environment in
which it operates (its functional currency). For the purpose of the consolidated financial statements, the results and financial position
of each Group company are expressed in pounds sterling, which is the functional currency of the Company, and the presentation
currency for the consolidated financial statements.
In preparing the financial statements of the individual companies, transactions in currencies other than the entity’s functional currency
(foreign currencies) are recognised at the rates of exchange prevailing on the dates of the transactions. At each balance sheet date,
monetary assets and liabilities that are denominated in foreign currencies are retranslated at the rates prevailing at that date. Nonmonetary items carried at fair value that are denominated in foreign currencies are translated at the rates prevailing at the date when
the fair value was determined. Non-monetary items that are measured in terms of historical cost in a foreign currency are not
retranslated.
Exchange differences are recognised in profit or loss in the period in which they arise except for:
•
exchange differences on transactions entered into to hedge certain foreign currency risks (see below under financial
instruments/hedge accounting); and
•
exchange differences on monetary items receivable from or payable to a foreign operation for which settlement is neither
planned nor likely to occur in the foreseeable future (therefore forming part of the net investment in the foreign operation),
which are recognised initially in other comprehensive income and reclassified from equity to profit or loss on disposal or partial
disposal of the net investment.
82
For the purpose of presenting consolidated financial statements, the assets and liabilities of the Group’s foreign operations are
translated at exchange rates prevailing on the balance sheet date. Income and expense items are translated at the average exchange
rates for the period, unless exchange rates fluctuate significantly during that period, in which case the exchange rates at the date of
transactions are used. Exchange differences arising, if any, are recognised in other comprehensive income and accumulated in equity
(attributed to non-controlling interests as appropriate).
On the disposal of a foreign operation (i.e., a disposal of the Group’s entire interest in a foreign operation, or a disposal involving loss
of control over a subsidiary that includes a foreign operation, loss of joint control over a jointly controlled entity that includes a
foreign operation, or loss of significant influence over an associate that includes a foreign operation), all of the accumulated exchange
differences in respect of that operation attributable to the Group are reclassified to profit or loss.
In addition, in relation to a partial disposal of a subsidiary that includes a foreign operation that does not result in the Group losing
control over the subsidiary, the proportionate share of accumulated exchange differences are reattributed to non-controlling interests
and are not recognised in profit or loss. For all other partial disposals (i.e. partial disposals of associates or joint arrangements that do
not result in the Group losing significant influence or joint control), the proportionate share of the accumulated exchange differences is
reclassified to profit or loss.
Goodwill and fair value adjustments arising on the acquisition of a foreign entity are treated as assets and liabilities of the foreign
entity and translated at the closing rate. The Group has elected to treat goodwill and fair value adjustments arising on acquisitions
before the date of transition to IFRSs as sterling-denominated assets and liabilities. Exchange differences arising are recognised in
other comprehensive income.
Operating profit
Operating profit is stated after charging restructuring costs and after the share of results of associates and joint ventures but before
investment income and finance costs.
Retirement benefit costs
Payments to defined contribution retirement benefit schemes are charged as an expense when employees have rendered service
entitling them to the contributions. Payments made to state-managed retirement benefit schemes are dealt with as payments to defined
contribution schemes where the Group’s obligations under the schemes are equivalent to those arising in a defined contribution
retirement benefit scheme.
For defined benefit retirement benefit schemes, the cost of providing benefits is determined using the Projected Unit Credit Method,
with actuarial valuations being carried out at the end of each reporting period. Remeasurement comprising actuarial gains and losses,
the effect of the asset ceiling (if applicable) and the return on scheme assets (excluding interest) are recognised immediately in the
balance sheet with a charge or credit to the statement of comprehensive income in the period in which they occur. Remeasurement
recorded in the statement of comprehensive income is not recycled. Past service cost is recognised in the period of the scheme
amendment. Net-interest is calculated by applying a discount rate to the net defined benefit liability or asset. Defined benefit costs are
split into three categories:
•
current service cost, past-service cost and gains and losses on curtailments and settlements;
•
net-interest expense or income; and
•
remeasurement.
The Group presents the first two components of defined benefit costs within cost of sales and administrative expenses in its
consolidated income statement. Curtailment gains and losses are accounted for as past-service cost.
Net-interest expense or income is recognised within finance costs.
The retirement benefit obligation recognised in the consolidated balance sheet represents the deficit or surplus in the Group’s defined
benefit schemes. Any surplus resulting from this calculation is limited to the present value of any economic benefits available in the
form of refunds from the schemes or reductions in future contributions to the schemes.
A liability for a termination benefit is recognised at the earlier of when the entity can no longer withdraw the offer of the termination
benefit and when the entity recognises any related restructuring costs.
Share-based payments
The Group operates three share-based payment schemes: an executive scheme, a long-term incentive scheme (LTIP) for senior
employees and a share-save (SAYE) scheme open to all qualifying employees.
83
Equity-settled share-based payments to employees and others providing similar services are measured at the fair value of the equity
instruments at the grant date. The fair value excludes the effect of non-market-based vesting conditions. Details regarding the
determination of the fair value of equity-settled share-based transactions are as follows:
•
Fair values for the executive scheme and the SAYE scheme are measured by use of the Black-Scholes-Merton pricing model.
The expected option life used in the model is based on management’s best estimates, taking behavioural considerations into
account.
•
Fair values for the LTIP are determined using a stochastic (Monte Carlo simulation) pricing model which calculates the fair
value of the market-related element of the LTIP awards by comparing the company’s TSR performance against the constituent
companies of the FTSE Small Cap Index.
The fair value determined at the grant date of the equity-settled share-based payments is expensed on a straight-line basis over the
vesting period, based on the Group’s estimate of equity instruments that will eventually vest. At each balance sheet date, the Group
revises its estimate of the number of equity instruments expected to vest as a result of the effect of non-market-based vesting
conditions. The impact of the revision of the original estimates, if any, is recognised in profit or loss such that the cumulative expense
reflects the revised estimate, with a corresponding adjustment to equity reserves.
SAYE share options granted to employees are treated as cancelled when employees cease to contribute to the scheme. This results in
accelerated recognition of the expenses that would have arisen over the remainder of the original vesting period.
For cash-settled share-based payments, a liability is recognised for the services acquired, measured initially at the fair value of the
liability. At each balance sheet date until the liability is settled, and at the date of settlement, the fair value of the liability is
remeasured, with any changes in fair value recognised in profit or loss for the year.
Further information on the Group’s schemes is provided in note 24 and in the report of the Directors’ Remuneration Report.
Taxation
The tax expense represents the sum of the tax currently payable and deferred tax.
Current and deferred tax are recognised in profit or loss, except when they relate to items that are recognised in other comprehensive
income or directly in equity, in which case, the current and deferred tax are also recognised in other comprehensive income or directly
in equity respectively. Where current tax or deferred tax arises from the initial accounting for a business combination, the tax effect is
included in the accounting for the business combination.
Current tax
The tax currently payable is based on taxable profit for the year. Taxable profit differs from net profit as reported in the income
statement because it excludes items of income or expense that are taxable or deductible in other years and it further excludes items that
are never taxable or deductible. The Group’s liability for current tax is calculated using tax rates that have been enacted or
substantively enacted by the balance sheet date.
Deferred tax
Deferred tax is the tax expected to be payable or recoverable on differences between the carrying amounts of assets and liabilities in
the financial statements and the corresponding tax bases used in the computation of taxable profit, and is accounted for using the
balance sheet liability method. Deferred tax liabilities are generally recognised for all taxable temporary differences and deferred tax
assets are recognised to the extent that it is probable that taxable profits will be available against which deductible temporary
differences can be utilised. Such assets and liabilities are not recognised if the temporary difference arises from the initial recognition
of goodwill or from the initial recognition (other than in a business combination) of other assets and liabilities in a transaction that
affects neither the taxable profit nor the accounting profit.
The carrying amount of deferred tax assets is reviewed at each balance sheet date and reduced to the extent that it is no longer
probable that sufficient taxable profits will be available to allow all or part of the asset to be recovered.
Deferred tax is calculated at the tax rates that are expected to apply in the period when the liability is settled or the asset is realised
based on tax laws and rates that have been enacted or substantively enacted at the balance sheet date. Deferred tax is charged or
credited in the income statement, except when it relates to items charged or credited in other comprehensive income, in which case the
deferred tax is also dealt with in other comprehensive income.
The measurement of deferred tax liabilities and assets reflects the tax consequences that would follow from the manner in which the
Group expects, at the end of the reporting period, to recover or settle the carrying amount of its assets and liabilities.
84
Deferred tax assets and liabilities are offset when there is a legally enforceable right to set off current tax assets against current tax
liabilities and when they relate to income taxes levied by the same taxation authority and the Group intends to settle its current tax
assets and liabilities on a net basis.
Property, plant and equipment
Property, plant and equipment is stated at cost less accumulated depreciation and any recognised impairment loss.
Depreciation is charged so as to write off the cost or valuation of assets less their residual values over their useful lives, using either
the straight-line method, on the bases shown below, or if more appropriate, another more systematic basis which is more
representative of the time pattern over which economic benefits are consumed.
Buildings
Fixtures and equipment
Leasehold buildings
Computers
Motor vehicles
2.5% pa
20%–25% pa
Over the shorter of lease term and expected useful life
25% pa
25% pa
The estimated useful lives, residual values and depreciation method are reviewed at the end of each reporting period, with the effect of
any changes in estimate accounted for on a prospective basis.
Assets held under finance leases are depreciated over their expected useful lives on the same basis as owned assets or, where shorter,
over the term of the relevant lease.
An item of property, plant and equipment is derecognised upon disposal or when no future economic benefits are expected to arise
from the continued use of the asset. The gain or loss arising on the disposal or scrappage of an asset is determined as the difference
between the sales proceeds and the carrying amount of the asset and is recognised in profit or loss.
Internally-generated intangible assets
An internally-generated intangible asset arising from the Group’s expenditure on IT system development is recognised only if all of
the following conditions are met:
•
an asset is created that can be identified (such as software and new processes);
•
it is probable that the asset created will generate future economic benefits; and
•
the development cost of the asset can be measured reliably.
Internally-generated intangible assets are amortised on a straight-line basis over their useful lives. Where no internally-generated
intangible asset can be recognised, development expenditure is recognised as an expense in the period in which it is incurred.
The value of customer relationships is measured and recorded as an intangible asset when businesses are acquired.
Impairment of tangible and intangible assets excluding goodwill
At each balance sheet date, the Group reviews the carrying amounts of its tangible and intangible assets to determine whether there is
any indication that those assets have suffered an impairment loss. If any such indication exists, the recoverable amount of the asset is
estimated to determine the extent of the impairment loss (if any). Where the asset does not generate cash flows that are independent
from other assets, the Group estimates the recoverable amount of the cash-generating unit to which the asset belongs.
An intangible asset with an indefinite useful life is tested for impairment at least annually and whenever there is an indication that the
asset may be impaired.
Recoverable amount is the higher of fair value less costs to sell and value in use. In assessing value in use, the estimated future cash
flows are discounted to their present value using a pre-tax discount rate that reflects current market assessments of the time value of
money and the risks specific to the asset for which the estimates of future cash flows have not been adjusted.
If the recoverable amount of an asset (or cash-generating unit) is estimated to be less than its carrying amount, the carrying amount of
the asset (or cash-generating unit) is reduced to its recoverable amount. An impairment loss is recognised immediately in profit or
loss, unless the relevant asset is carried at a revalued amount, in which case the impairment loss is treated as a revaluation decrease.
Where an impairment loss subsequently reverses, the carrying amount of the asset (or cash-generating unit) is increased to the revised
estimate of its recoverable amount, but so that the increased carrying amount does not exceed the carrying amount that would have
been determined had no impairment loss been recognised for the asset (or cash-generating unit) in prior years. A reversal of an
85
impairment loss is recognised immediately in profit or loss, unless the relevant asset is carried at a revalued amount, in which case the
reversal of the impairment loss is treated as a revaluation increase.
Financial instruments
Financial assets and financial liabilities are recognised on the Group’s balance sheet when the Group becomes a party to the
contractual provisions of the instrument.
Financial assets and financial liabilities are initially measured at fair value. Transaction costs that are directly attributable to the
acquisition or issue of financial assets and financial liabilities (other than financial assets and financial liabilities at fair value through
profit or loss) are added to or deducted from the fair value of the financial assets or financial liabilities, as appropriate, on initial
recognition. Transaction costs directly attributable to the acquisition of financial assets or financial liabilities at fair value through
profit or loss are recognised immediately in profit or loss.
Loans and receivables
Trade receivables, loans and other receivables that have fixed or determinable payments that are not quoted in an active market are
classified as “loans and receivables”. Loans and receivables are measured at amortised cost using the effective interest method, less
any impairment. Interest income is recognised by applying the effective interest rate, except for short-term receivables when the
recognition of interest would be immaterial.
Held to maturity investments
Debt securities that the Group has the positive intent and ability to hold to maturity (held-to-maturity debt securities) are classified as
held-to-maturity investments. Held-to-maturity investments are measured at amortised cost using the effective interest rate method
less any impairment, with revenue recognised on an effective yield basis.
Investments at fair value through profit or loss (FVTPL)
Investments classified as FVTPL are stated at fair value, with any gains or losses arising on remeasurement recognised in profit or
loss. The net gain or loss recognised in profit or loss incorporates any dividend or interest earned on the financial asset and is included
in the “other gains and losses” line item in the income statement.
Impairment
Financial assets, other than those at FVTPL, are assessed for indicators of impairment at each balance sheet date. Financial assets are
impaired where there is objective evidence that, as a result of one or more events that occurred after the initial recognition of the
financial asset, the estimated future cash flows of the investment have been affected. Objective evidence of impairment could include:
•
significant financial difficulty of the issuer or counterparty; or
•
default or delinquency in interest or principal payments; or
•
it becoming probable that the borrower will enter bankruptcy or financial reorganisation.
For certain categories of financial asset, such as trade receivables, assets that are assessed not to be impaired individually are, in
addition, assessed for impairment on a collective basis. Objective evidence of impairment for a portfolio of receivables could include
the Group’s past experience of collective payments, an increase in the number of delayed payments in the portfolio past the average
credit period, as well as observable changes in national or local economic conditions that correlate with default on receivables.
For financial assets carried at amortised cost, the amount of the impairment is the difference between the asset’s carrying amount and
the present value of estimated future cash flows, discounted at the financial asset’s original effective interest rate.
The carrying value of financial assets is reduced by the impairment loss except for trade receivables, where the carrying amount is
reduced through the use of an allowance account. When a trade receivable is considered uncollectible, it is written off against the
allowance account. Subsequent recoveries of amounts previously written off are credited against the allowance account. Changes in
the carrying amount of the allowance account are recognised in profit or loss.
If, in a subsequent period, the amount of an impairment loss decreases and the decrease can be related objectively to an event
occurring after the impairment was recognised, the previously recognised impairment loss is reversed through the profit or loss to the
extent that the carrying amount of the investment at the date the impairment is reversed, does not exceed what the amortised cost
would have been had the impairment not been recognised.
86
Cash and cash equivalents
Cash and cash equivalents comprise cash on hand, demand deposits, bank overdrafts and other short-term highly liquid investments
that are readily convertible to a known amount of cash and are subject to an insignificant risk of changes in value. Amounts of this
nature held in insurance companies have been shown within assets in insurance businesses and are not generally available for use by
the Group.
Client funds under group control outside the insurance companies are included in the balance sheet under cash and cash equivalents
with a corresponding liability recognised. Client funds are not available for use by the Group.
Financial liabilities and equity
Debt and equity instruments are classified as either financial liabilities or as equity in accordance with the substance of the contractual
arrangement.
Bank borrowings
Interest-bearing bank loans and overdrafts are initially measured at fair value, net of transaction costs incurred. Borrowings are
subsequently carried at amortised cost; any difference between the proceeds (net of transaction costs) and the redemption value is
recognised in the income statement over the period of the borrowings using the effective interest method.
The effective interest method is a method of calculating the amortised cost of a debt instrument and of allocating interest income over
the relevant period. The effective interest rate is the rate that exactly discounts estimated future cash receipts (including all fees and
margin paid or received that form an integral part of the effective interest rate, transaction costs and other premiums or discounts)
through the expected life of the debt instrument, or, where appropriate, a shorter period, to the net carrying amount on initial
recognition.
Trade payables
Trade payables are initially measured at fair value. They are not interest-bearing.
Derivative financial instruments
The Group enters into a variety of derivative financial instruments to manage its exposure to interest rate and foreign exchange rate
risk, including foreign exchange forward contracts and interest rate swaps. Further details of derivative financial instruments are
disclosed in note 25.
Derivatives are initially recognised at fair value at the date a derivative contract is entered into and are subsequently remeasured to
their fair value at each balance sheet date. The resulting gain or loss is recognised in profit or loss immediately unless the derivative is
designated and effective as a hedging instrument, in which event the timing of the recognition in profit or loss depends on the nature
of the hedge relationship. The Group designates certain derivatives as hedges of highly probable forecast transactions or hedges of
foreign currency risk of firm commitments (cash flow hedges).
A derivative with a positive fair value is recognised as a financial asset whereas a derivative with a negative fair value is recognised as
a financial liability. A derivative is presented as a non-current asset or a non-current liability if the remaining maturity of the
instrument is more than 12 months and it is not expected to be realised or settled within 12 months. Other derivatives are presented as
current assets or current liabilities.
Hedge accounting
The Group designates certain hedging instruments, which include derivatives, as cash flow hedges. At the inception of the hedge
relationship, the Group documents the relationship between the hedging instrument and the hedged item, along with its risk
management objectives and its strategy for undertaking such hedge transactions. Furthermore, at the inception of the hedge and on an
ongoing basis, the Group documents whether the hedging instrument is highly effective in offsetting changes in the cash flows of the
hedged item.
Note 25 sets out details of the fair values of the derivative instruments used for hedging purposes.
Cash flow hedge
The effective portion of changes in the fair value of derivatives that are designated and qualify as cash flow hedges is recognised in
other comprehensive income. The gain or loss relating to the ineffective portion is recognised immediately in profit or loss, and is
included in the “other gains and losses” line.
Amounts previously recognised in other comprehensive income and accumulated in equity are reclassified to profit or loss in the
period when the hedged item is recognised in profit or loss, in the same line of the income statement as the recognised hedged item.
However, when the forecast transaction that is hedged results in the recognition of a non-financial asset or a non-financial liability, the
87
gains and losses previously accumulated in equity are transferred from equity and included in the initial measurement of the cost of
the non-financial asset or non-financial liability.
Hedge accounting is discontinued when the Group revokes the hedging relationship, the hedging instrument expires or is sold,
terminated, or exercised, or no longer qualifies for hedge accounting. Any gain or loss recognised in other comprehensive income at
that time is accumulated in equity and is recognised when the forecast transaction is ultimately recognised in profit or loss. When a
forecast transaction is no longer expected to occur, the gain or loss accumulated in equity is recognised immediately in profit or loss.
Provisions
Provisions are recognised when the Group has a present obligation (legal or constructive) as a result of a past event, it is probable that
the Group will be required to settle that obligation and a reliable estimate can be made of the amount of the obligation.
The amount recognised as a provision is the best estimate of the consideration required to settle the present obligation at the balance
sheet date, taking into account the risks and uncertainties surrounding the obligation. Where a provision is measured using the cash
flows estimated to settle the present obligation, its carrying amount is the present value of those cash flows (when the effect of the
time value of money is material).
When some or all of the economic benefits required to settle a provision are expected to be recovered from a third party, a receivable
is recognised as an asset if it is virtually certain that reimbursement will be received and the amount of the receivable can be measured
reliably.
Restructurings
A restructuring provision is recognised when the Group has developed a detailed formal plan for the restructuring and has raised a
valid expectation in those affected that it will carry out the restructuring by starting to implement the plan or announcing its main
features to those affected by it. The measurement of a restructuring provision includes only the direct expenditures arising from the
restructuring, which are those amounts that are both necessarily entailed by the restructuring and not associated with the ongoing
activities of the entity.
Onerous contracts
Present obligations arising under onerous contracts are recognised and recorded as provisions. An onerous contract is considered to
exist where the Group has a contract under which the unavoidable costs of meeting the obligations under the contract exceed the
economic benefits expected to be received under it.
(d) Accounting for insurance contracts and investment contracts businesses
(i) Non-life business
Revenue from insurance contracts
Revenue from insurance contracts represents premiums earned. Premiums are earned pro-rata on a time apportioned basis. Unearned
premiums, representing unexpired periods of indemnity, are deferred and included in the balance sheet as a liability under insurance
technical balances. The treatment of associated acquisition costs and reinsurance premiums follows that of the underlying premium. If
it is likely that the unearned premium will not be sufficient to cover future losses, then further provision is made.
Claims
Claims incurred comprise claims and related expenses paid in the year and changes in the provision for outstanding claims. The
treatment of associated reinsurance recoveries follows that of the underlying claim.
Insurance technical provisions
These include outstanding claim provisions and unearned premium as liabilities and their associated reinsurance recoveries as assets,
as well as any deferred acquisition costs.
Outstanding claims provisions
Provisions are made at the year end for the estimated cost of claims incurred but not settled at the balance sheet date, including the
cost of claims incurred but not yet reported to the Group. The estimated cost of claims includes expenses to be incurred in settling
claims and a deduction for the expected value of salvage and other recoveries. The Group takes all reasonable steps to ensure that it
has appropriate information regarding its claims exposures. However, given the uncertainty in establishing claims provisions, it is
likely that the final outcome will prove to be different from the original liability established.
The estimation of claims incurred but not reported (IBNR) is generally subject to a greater degree of uncertainty than the estimation of
claims already notified to the Group.
88
In calculating the estimated cost of unpaid claims the Group uses a variety of estimation techniques, generally based upon statistical
analyses of historical experience, which assumes that the development pattern of the current claims will be consistent with past
experience. Allowance is made, however, for changes or uncertainties which may create distortions in the underlying statistics or
which might cause the cost of unsettled claims to increase or reduce when compared with the cost of previously settled claims
including:
•
changes in company processes which might accelerate or slow down the development and/or recording of paid or incurred
claims compared with the statistics from previous periods;
•
changes in the legal environment;
•
the effects of inflation;
•
changes in the mix of business;
•
the impact of large losses; and
•
movements in industry benchmarks.
Large claims impacting each relevant business class are generally assessed separately, being measured on a case-by-case basis or
projected separately in order to allow for the possible distorting effect of the development and incidence of these large claims.
Provisions are calculated gross of any reinsurance recoveries. Potential reinsurance recoveries are calculated as a function of claims,
and shown separately in the balance sheet as “amounts receivable under reinsurance contracts”.
The Group assesses its reinsurance assets for impairment on a quarterly basis. If there is objective evidence that the reinsurance asset
is impaired, the Group reduces the carrying amount of the reinsurance asset to its recoverable amount and recognises that impairment
loss in the income statement for the period.
Receivables and payables related to insurance contracts
Receivables and payables are recognised when due. These include amounts due to and from agents, brokers and insurance contract
holders.
If there is objective evidence that the insurance receivable is impaired, the Group reduces the carrying amount of the insurance
receivable accordingly and recognises that impairment loss through profit or loss in the period.
Non-life run-off provision for future non-operating losses
At the date of acquisition a provision is made for the expected operating losses to be incurred over the run-off period. This provision is
released to profit or loss over the expected life of the run-off.
Discount on reserves
At the date of acquisition the expected value of claims are discounted to their present value and an asset is recognised reflecting this
discount. This asset is amortised through profit or loss over the expected life of the run-off.
(ii) Life business
Insurance and investment contracts – classification
The policy holders own contracts with the Group that transfer insurance risk or financial risk or both.
Insurance contracts are those contracts that transfer significant insurance risk. Such contracts may also transfer financial risk. As a
general guideline, the Group defines as significant insurance risk the possibility of having to pay benefits on the occurrence of an
insured event that are at least 10% more than the benefits payable if the insured event did not occur. The majority of the insurance risk
arises on contracts where optional insurance benefits were applied for at outset by the insured. The Group practice is to treat the
insurance element as a separate unbundled contract.
Investment contracts are those contracts that transfer financial risk with no significant insurance risk.
Further contract distinctions are Unit Linked and Discretionary Participation Features (DPF). Unit-linked contracts are those linked to
specific assets, such that the value of contracts moves in line with the value of assets. DPF contracts are those where the policy holders
may receive a bonus, generally based on investment performance. Unit and non-unit linked policies may or may not have DPF.
89
Revenue recognition
For investment contracts, amounts collected as “premiums” are not included in the income statement. They are reported as deposits in
the balance sheet (under investment contract assets).
Insurance premiums on insurance policies and fees charged on investment contracts are included as revenue in the income statement
and are recognised as services are provided.
Claims
Claims under insurance contracts are recognised when payments are due. Claims costs include claims handling costs.
“Claims” under investment contracts are not reflected in the income statement. They are deducted from investment contract liabilities
in the balance sheet.
Provisions for liabilities
The provisions for insurance contract liabilities are established using methods and assumptions approved by management based on
advice from actuaries. This is based initially on the reserves required for regulatory purposes and adjusted to eliminate undistributed
surplus income and various regulatory or contingency reserves. This basis is commonly referred to as the “modified statutory solvency
basis”. Provisions are shown gross of reinsurance recoveries.
Investment contracts consist mainly of unit-linked contracts. Unit-linked liabilities are determined by reference to the value of the
underlying matched assets.
Value of business acquired
On acquisition of a portfolio of contracts, either directly from another insurer or through the acquisition of a subsidiary, the Group
recognises an intangible asset representing the value of business acquired (VOBA). VOBA represents the present value of future
profits embedded in acquired contracts. The Group amortises VOBA over the effective life of the acquired contracts.
2. Critical accounting judgements and key sources of estimation uncertainty
In the application of the Group’s accounting policies, which are described in note 1, the directors are required to make judgements,
estimates and assumptions about the carrying amounts of assets and liabilities that are not readily apparent from other sources. The
estimates and associated assumptions are based on historical experience and other factors that are considered to be relevant. Actual
results may differ from these estimates.
The estimates and underlying assumptions are reviewed on an ongoing basis. Revisions to accounting estimates are recognised in the
period in which the estimate is revised if the revision affects only that period, or in the period of the revision and future periods if the
revision affects both current and future periods.
Critical areas of management judgement and estimation
The following are the critical judgements and estimates that the directors have made in the process of applying the Group’s accounting
policies and that have the most significant effect on the amounts recognised in financial statements.
Revenue recognition in the adjusting businesses
Revenue is recognised when there is a contractual right to be paid in relation to past performance of contractual obligations. In
practice, the Group maintains time recording systems to capture time chargeable to clients and specified hourly rates are ascribed to
the hours recorded by the case handlers. Hourly rates are usually agreed in advance in the form of pre-engagement contractual terms
or are based on standard hourly rates applicable to the type of work and country in which the work is performed.
Regular periodic reviews are performed by case handlers, and by management, to ensure the carrying value of work on unfinished
cases reflects management’s view of its ultimate realisable value. Provisions against irrecoverable work in progress (accrued income)
and outstanding fees are made where the realisable value is expected to be lower than the carrying value and conversely upwards
revaluations of work-in-progress are made where management considers the carrying value is lower than the amount ultimately
recoverable.
Accrued income and fee receivables are shown in these accounts at their fair value. Because of the time taken between the initial
recording of accrued income and its ultimate billing and the time taken to collect outstanding fee receivables, a discount is applied to
the amounts shown to reflect the time value of money. The discount rate used is a significant judgement.
90
Fair valuation of acquisitions
The Group has included the assets and liabilities of the entities acquired during the period in its consolidated balance sheet at the date
of acquisition at their fair values. The fair values of assets and liabilities acquired are different in a number of instances from the
values shown in the entities’ own financial statements. This is due to the application of different accounting policies in these financial
statements or the application of fair valuation principles to assets and liabilities recorded by the entities under other bases such as
historical cost (for instance due to discounting requirements of acquisition accounting). Bargain purchase gains have arisen where the
fair value of net assets acquired exceeds the purchase consideration. Bargain purchase gains are recognised in profit or loss at the date
of acquisition.
Intangible assets acquired separately
Goodwill and intangibles have arisen in relation to the Group’s acquisitions of subsidiaries and are represented by the difference
between the estimated cost of the acquisitions and the fair value of the net assets acquired in those acquisitions. The Company is
required to assess annually, or more often if there is an indication of impairment, the carrying value of goodwill and intangibles. It
does this by assessing the future cash flows generated by the business units to which the goodwill and intangibles have been allocated
and by discounting those cash flows to assess whether the discounted value is higher or lower than the carrying value of the related
goodwill and intangibles. Management judgement is applied, in particular, in the initial allocation of goodwill to cash-generating
units, in assessing future cash flows and in determining appropriate discount rates.
Internally-generated intangible assets
An internally-generated intangible asset arising from development (or from the development phase of an internal project) is
recognised if, and only if all of the following conditions have been demonstrated:
•
the technical feasibility of completing the intangible asset so that it will be available for use or sale;
•
the intention to complete the intangible asset and use or sell it;
•
the ability to use or sell the intangible asset;
•
how the intangible asset will generate probable future economic benefits;
•
the availability of adequate technical, financial and other resources to complete the development and to use or sell the intangible
asset; and
•
the ability to measure reliably the expenditure attributable to the intangible asset during its development.
The amount initially recognised for internally-generated intangible assets is the sum of the expenditure incurred from the date when
the intangible asset first meets the recognition criteria listed above. Where no internally-generated intangible asset can be recognised,
development expenditure is recognised in profit or loss in the period in which it is incurred.
Subsequent to initial recognition, internally-generated intangible assets are reported at cost less accumulated amortisation and
accumulated impairment losses, on the same basis as intangible assets that are acquired separately.
Insurance reserves
Insurance reserves are set to reflect management’s best estimate of the ultimate cost of settling claims incurred under insurance
policies previously written by the insurance companies acquired. A number of actuarial estimation techniques have been used in
arriving at the insurance reserves recorded in these financial statements.
Pensions
The Group sponsors a number of defined benefit retirement schemes for employees. The scheme assets and the obligation to provide
future benefits are included in the group balance sheet. The cost of providing benefits to employees is reflected as a charge through
profit or loss. The respective scheme actuaries are engaged by the Company to assist management in determining the amounts to be
recorded in these financial statements. In this regard, management is responsible for determining the assumptions to be used in the
actuarial calculations, further details of which are given in note 29.
Taxation
The Group’s tax charge on ordinary activities is the sum of the total current and deferred tax charges. The calculation of the Group’s
total tax charge involves a degree of estimation and judgement until tax returns have been filed and agreed. Payments in respect of tax
liabilities for an accounting period result from payments on account and on the final resolution of open items.
The recognition of deferred tax assets is based upon whether it is probable that future taxable profits will be available, against which
they can be utilised. Recognition, therefore, involves judgement regarding the future financial performance of the particular legal
entity or tax group in which the deferred tax asset has been recognised.
91
3. Segmental information
Identification of segments
For management and internal reporting purposes the Group is currently organised into four operating businesses whose principal
activities are as follows:
•
Management Services business – mutual management service.
•
Adjusting Services business – energy, aviation, non marine and marine (including average) adjusting.
•
Insurance Support Services business – non-life and life insurance support services, including captive management, investment
management and risk management.
•
Owned Insurance Companies business – non-life and life insurance companies.
Management information about these businesses is regularly provided to the Group’s chief operating decision maker to assess their
performance and to make decisions about the allocation of resources. Accordingly, these businesses correspond with the Group’s
operating segments under IFRS 8 Operating Segments. Businesses forming part of each business which might otherwise qualify as
reportable operating segments have been aggregated where they share similar economic characteristics and meet the other aggregation
criteria in IFRS 8.
In the Management Services business, a higher proportion of revenue arises in the second half of the financial year. There is no
significant seasonality or cyclicality in the other businesses.
Measurement of segmental results and assets
Transactions between reportable segments are accounted for on the basis of the contractual arrangements in place for the provision of
goods or services between segments and in accordance with the Group’s accounting policies. Reportable segment results and assets
are also measured on a basis consistent with the Group’s accounting policies. Operating segment profit includes an allocation of
central costs across the four businesses and excludes non-recurring adjusting costs. The prior year operating segment profits and assets
have been adjusted to conform to the current year’s presentation. Reconciliations of segmental results to the group profit before tax are
set out below.
Information about major customers
The Group derived revenue of £35.4m (31 December 2013: £29.8m) from one external customer which accounts for more than 10%
of group revenue, and is included within both the Management Services and Insurance Support Services businesses.
92
Year to 31 December 2014
Revenue from external clients
Revenue from other operating
Total revenue
Depreciation and amortisation
Other expenses
Operating segment profit
Share of results of associates
Amortisation of acquired intangible
assets
Non-recurring costs (note 32)
Operating profit
Investment and other income
Finance costs
Profit before tax
Amortisation of acquired intangible
assets
Non-recurring costs (note 32)
Non-controlling interests before tax
Profit before tax – adjusted
Year to 31 December 2013
Revenue from external clients
Revenue from other operating segments
Total revenue
Depreciation and amortisation
Other expenses
Operating segment profit
Share of results of associates
Amortisation of acquired intangible
assets
Non-recurring costs (note 32)
Operating profit
Investment and other income
Finance costs
Profit before tax
Amortisation of acquired intangible
assets
Non-recurring costs (note 32)
Non-controlling interests before tax
Profit before tax – adjusted
Management
Services
£000
43,864
—
43,864
(984)
(35,145)
7,735
Professional Services businesses
Insurance
Adjusting
Support
Services
Services Unallocated
£000
£000
£000
56,067
18,655
21
—
3,147
—
56,067
21,802
21
(1,160)
(536)
—
(52,678)
(19,286)
224
2,229
1,980
245
Owned
Insurance
Companies
Total
£000
118,607
3,147
121,754
(2,680)
(106,885)
12,189
Insurance
Companies
£000
4,152
—
4,152
(367)
(3,254)
531
Other
Intersegment
eliminations
£000
—
(3,147)
(3,147)
—
3,147
—
Group
Total
£000
122,759
—
122,759
(3,047)
(106,992)
12,720
121
(1,527)
(211)
11,103
64
(1,601)
9,566
1,527
211
(225)
11,079
Management
Services
£000
41,069
—
41,069
(1,062)
(33,379)
6,628
Professional Services businesses
Insurance
Adjusting
Support
Services
Services Unallocated
£000
£000
£000
54,922
12,536
17
—
3,337
—
54,922
15,873
17
(1,238)
(919)
—
(48,840)
(15,832)
(170)
4,844
(878)
(153)
Total
£000
108,544
3,337
111,881
(3,219)
(98,221)
10,441
Owned
Insurance
Companies
Other
Insurance
Companies
£000
5,034
—
5,034
(524)
(3,728)
782
Inter-segment
eliminations
£000
—
(3,337)
(3,337)
—
3,337
—
Group
Total
£000
113,578
—
113,578
(3,743)
(98,612)
11,223
69
(1,181)
(1,627)
8,484
92
(1,668)
6,908
1,181
1,627
240
9,956
93
Management Services business
Adjusting Services business
Insurance Support Services business
Unallocated assets and eliminations
Owned Insurance Companies business
Total assets
– Non-current assets
– Current assets
Total assets
Current liabilities
Deferred consideration payable within 1 year
Net current assets
Non-current liabilities
Deferred consideration payable in more than 1 year
Total liabilities
Net assets
Non-controlling interests
Equity attributable to owners of the Company
At 31 December 2014
£000
Professional
Owned
Services
Insurance
businesses Companies
Group
2,961
—
2,961
121,278
—
121,278
31,651
—
31,651
22,140
—
22,140
—
798,310
798,310
178,030
798,310
976,340
65,784
2,682
68,466
112,246
795,628
907,874
178,030
798,310
976,340
(71,766)
(756,057)
(827,823)
(646)
(3,386)
(4,032)
39,834
36,185
76,019
(79,304)
—
(79,304)
(8,747)
(10,505)
(1,758)
(153,474)
(768,190)
(921,664)
24,556
30,120
54,676
(1,046)
(20,934)
(21,980)
23,510
9,186
32,696
Revenue
Year to 31 December
2013
2014
£000
£000
29,241
34,107
9,573
9,239
14,896
15,577
16,704
15,666
43,164
48,170
113,578
122,759
Geographical information
United Kingdom
Europe & Middle East
North America
Asia Pacific
Bermuda
1
At 31 December 2013
£000
Professional
Owned
Services
Insurance
businesses
Companies
Group
—
2,021
2,021
109,535
—
109,535
31,265
—
31,265
20,096
—
20,096
—
322,248
322,248
162,917
322,248
485,165
60,310
3,000
63,310
102,607
319,248
421,855
162,917
322,248
485,165
(66,968)
(281,114)
(348,082)
(102)
(4,182)
(4,284)
35,537
33,952
69,489
(62,487)
—
(62,487)
(980)
(8,659)
(9,639)
(130,537)
(293,955)
(424,492)
32,380
28,293
60,673
(1,057)
(20,774)
(21,831)
31,323
7,519
38,842
Non-current assets1
At 31 December
2013
2014
£000
£000
45,975
48,310
3,297
3,013
6,038
6,166
1,315
1,546
874
818
57,499
59,853
Excluding deferred tax.
4. Administrative expenses
Year to 31 December
2013
2014
£000
£000
Administrative expenses are as follows:
Staff costs
Depreciation and other amounts written off tangible fixed assets
Other operating charges
Total administrative expenses
Operating profit is stated after charging:
Rentals under operating leases:
Land and buildings
Hire of other assets
Depreciation and other amounts written off tangible fixed assets:
Owned assets
Assets held under finance leases
Amortisation of other intangible assets (Professional Services)
Amortisation of other intangible assets (Owned Insurance Companies)
Gain on foreign exchange
Auditor’s remuneration:
Audit fees payable to:
– Main auditor
– Other auditors
Total audit fees
Fees paid for other services:
– Main auditor
– Other auditors
Total other fees
78,774
1,660
28,604
109,038
76,686
2,253
22,589
101,528
5,008
134
4,925
94
1,267
393
2,595
318
(445)
1,678
575
2,210
461
(13)
560
3
563
588
—
588
129
177
306
53
218
271
The audit fee in respect of the Company was £65,000 (2013: £65,000). Fees paid to the main auditor for other services are principally
for overseas tax compliance services.
94
5. Information regarding directors and employees
Staff costs incurred during the year in respect of employees were:
Year to 31 December
2013
2014
£000
£000
66,248
68,028
5,010
5,610
5,428
5,136
76,686
78,774
Wages and salaries
Social security costs
Other pension costs
The emoluments and interests of the directors of the Company are set out in detail in the Directors’ Remuneration Report.
Employees
The average number of people, including directors, employed by the Group in the year was:
Year to 31 December
2013
2014
No.
No.
986
1,072
Executive and administration
6. Investment and other income
Year to 31 December
2013
2014
£000
£000
22
19
70
45
92
64
Profit on sale of fixed assets
Interest receivable and similar income
7. Finance costs
Year to 31 December
2013
2014
£000
£000
1,205
1,045
384
530
71
21
8
5
1,668
1,601
Bank loans and overdrafts repayable within five years
Deferred consideration discount unwind
Other loans
Finance leases
8. Income tax expense
Year to 31 December
2013
2014
£000
£000
Corporation tax:
Current year
Adjustments in respect of prior years
879
103
982
183
1,165
Deferred tax
1,347
(79)
1,268
101
1,369
UK Corporation tax is calculated at 21.5% (2013: 23.3%) of the estimated taxable profit for the year. Taxation for other jurisdictions
is calculated at the rates prevailing in the respective jurisdictions. The effective tax rate on statutory profit was 12.2% (2013: 19.8%).
95
The charge for the year can be reconciled to the profit per the income statement as below.
Year to 31 December
2013
2014
£000
£000
6,908
9,566
1,606
2,057
Profit on ordinary activities before tax
Tax at the UK corporation tax rate of 21.5% profit (2013: 23.3%)
Effects of:
Expenses not deductible
Taxable items excluded from profit
Non-taxable items included in profit
Lower tax rates on overseas earnings
UK insurance company results
Prior years’ adjustments – corporation tax
Income tax expense
146
(362)
(250)
(458)
(41)
73
1,165
379
(92)
(90)
(473)
118
(79)
1,369
9. Profit of parent company
As permitted by Section 408 of the Companies Act 2006, the income statement of the parent company is not presented as part of these
financial statements. The parent company’s result for the year amounted to £4.2m profit (2013: £14.0m profit).
10. Dividends paid
Year to 31 December
2013
2014
£000
£000
Ordinary dividends paid comprise:
Final dividend paid (2013: 6.75p; 2012: 6.75p per share)
Interim dividend paid (2014: 3.25p; 2013: 3.25p per share)
2,788
1,379
4,167
2,705
1,338
4,043
A second interim dividend, which replaces the final dividend, of 7.50p per share, will be paid on 24 April 2015. Dividends paid have
been shown as a movement in shareholders’ funds.
11. Earnings per share
Earnings per ordinary share have been calculated by dividing the profit on ordinary activities after taxation and non-controlling
interests for each year by the weighted average number of shares in issue. The shares held by the ESOP have been excluded from the
calculation because the trustees have waived the right to dividends on these shares.
The calculation of the statutory basic, statutory diluted and adjusted earnings per share is based on the following data:
Year to 31 December
2013
2014
£000
£000
Earnings
Earnings for the purposes of adjusted earnings per share being adjusted profit after tax attributable to owners of the Company
Amortisation of acquired intangible assets
Non-recurring costs
Tax on non-recurring costs
Earnings for the purposes of statutory basic and diluted earnings per share being net profit attributable to owners of the Company
Number of shares
Weighted average number of ordinary shares for the purposes of basic earnings per share
Effect of dilutive potential ordinary shares:
Share options
Weighted average number of ordinary shares for the purposes of diluted earnings per share
96
9,765
(1,527)
(211)
183
8,210
8,185
(1,181)
(1,627)
430
5,807
Number
Number
42,139,271
40,835,149
380,219
42,519,490
329,128
41,164,277
12. Acquisition of subsidiaries
KLA Group
On 14 May 2014, the Group acquired 100% of the issued share capital of KLA Holdings Limited and its subsidiary Knowles Loss
Adjusters Limited (Knowles). Knowles is a UK loss adjusting business focused on UK property and casualty (P&C) claims,
complementing the existing loss adjusting services provided by the Group.
The business contributed £2.4m revenue and £0.1m profit before tax to the Group since the acquisition date. The amounts recognised
in respect of the identifiable assets acquired and liabilities assumed are as set out in the table below:
KLA Group
Carrying
amount before
acquisition
£000
—
44
569
440
(416)
(83)
554
Identifiable intangible assets
Property, plant and equipment
Trade and other receivables
Cash and cash equivalents
Trade and other payables
Tax liabilities
Identifiable assets and liabilities
Goodwill
Consideration
Satisfied by:
Ordinary shares of the Company
Deferred consideration
Consideration
Adjustments
£000
2,025
—
—
—
—
—
2,025
Amount
recognised at
acquisition
£000
2,025
44
569
440
(416)
(83)
2,579
593
3,172
1,631
1,541
3,172
Nordea Life & Pensions Limited
On 21 November 2014, the Group acquired 100% of the issued share capital of Nordea Life & Pensions Limited Holdings Limited
(NLP), an Isle of Man life insurer which provides personalised life insurance products primarily to high net worth individuals, from
Nordea Life and Pensions S.A., Luxembourg. The acquisition is part of the Group’s strategy to make tactical acquisitions in the
international life insurance sector and thereby grow its life insurance business in the Isle of Man. It is intended that the NLP business
will be transferred into LCLI, subject to court approval, which would enable surplus reserves to be released.
The business contributed £0.3m revenue and £0.0m profit before tax to the Group since the acquisition date. The amounts recognised
in respect of the identifiable assets acquired and liabilities assumed are as set out in the table below:
Nordea Life & Pensions Limited
Carrying
Amount
amount before
recognised at
acquisition
Adjustments
acquisition
£000
£000
£000
243,776
—
243,776
338,789
—
338,789
4,995
—
4,995
(331,854)
—
(331,854)
(245,295)
—
(245,295)
(5,698)
—
(5,698)
(575)
—
(575)
15
—
15
18
—
18
4,171
—
4,171
–
4,171
Investment contract assets
Life Insurance contracts assets
Cash and cash equivalents
Insurance technical balances
Investment contracts unit linked liabilities
Other creditors
Provisions
Deferred acquisition costs
Fixed assets
Identifiable assets and liabilities
Goodwill
Consideration
Satisfied by:
Initial cash consideration
Deferred consideration
Consideration
1,769
2,402
4,171
97
If the two acquisitions had been completed on the first day of the financial year the combined revenue for the Group and profit before
tax would have been £126.6m and £10.2m respectively.
Deferred consideration relating to acquisitions is set out below:
At 31 December
2013
2014
£000
£000
6,738
5,473
6,103
6,660
131
117
951
703
—
1,584
13,923
14,537
LCL Group
Beech Hill Insurance Limited
Noble Inspection and Loss Adjustment Company
KnowledgeCenter
KLA Group
Within insurance company liabilities:
Nordea Life & Pensions Limited
Global Life Assurance Limited
2,232
379
17,148
—
750
14,673
LCL Group deferred consideration relates to the acquisitions of LCL International Life Assurance Company Limited and Bestpark
International Limited, purchased by the Group in 2005 as part of its acquisition of various closed insurance companies and run-off
service businesses.
For Beech Hill Insurance Limited, the first £6.8m of distributions are payable entirely to the vendor and then for amounts exceeding
£6.8m, 75% of distributions are payable up to a maximum of £10.0m.
Noble Inspection deferred consideration payments are subject in part to working capital targets being met. KnowledgeCenter and KLA
Group deferred consideration payments are subject to profitability targets being met.
The future payments for NLP are linked to management charge levels, being a maximum of €4.1m paid over two years. Future
payments for Global Life Assurance Limited are a function of the actual surrender experience on the policies acquired, versus an
expected surrender rate of 10%. The deferred consideration in respect of these two companies is included within the insurance
company liabilities on the balance sheet.
13. Goodwill
At 31 December
2013
2014
£000
£000
41,732
41,536
—
716
(196)
(56)
41,536
42,196
At 1 January
Additions
Foreign currency exchange differences
At 31 December
The Group tests goodwill for impairment annually and for new acquisitions in the year of acquisition, or more frequently if there are
indications that goodwill might be impaired.
The recoverable amounts of cash-generating units are determined from value in use calculations, where the key assumptions relate to
discount rates, revenue growth and cost growth. Management estimates discount rates using pre-tax rates that reflect current market
assessments of the time value of money. The discount rate used in the latest impairment review was based on 4.62% for those cashgenerating units that are not subject to tax and 5.80% for those cash-generating units that are subject to tax.
The revenue and cost growth rates used are based on reasonable management expectations for the 2015 budget and the following four
years, with an extrapolation using a steady growth. Revenue and cost growth rates for the five year forecast period and the subsequent
extrapolation fall within the range of 2.0%–5.0% pa. In addition, for the life insurance companies, which form part of the Owned
Insurance Companies CGU, an assessment is also made of the anticipated profitability arising from the ability to acquire and extract
value from future businesses.
Goodwill has been allocated to the cash-generating units shown below, which reflect the way in which the business is internally
managed.
2014
£000
124
20,904
11,551
9,617
42,196
Management Services business
Adjusting Services business
Insurance Support Services business
Owned Insurance Companies business
98
2013
£000
—
20,401
11,518
9,617
41,536
14. Other intangible assets
(ii)
Customer
relationships
£000
7,005
2,774
—
—
11,373
41
2,025
(869)
95
12,665
1,670
—
—
8,027
—
—
7,200
—
—
(120)
—
—
—
(7,200)
—
1,550
8,027
—
112
319
—
—
5,047
298
—
—
7,180
20
(7,200)
—
4,077
8,723
1,207
(767)
109
9,272
431
5,345
—
24,070
2,913
(7,967)
109
19,125
Net book value
At 31 December 2014
5,704
3,393
1,119
2,682
—
12,898
At 31 December 2013
3,997
2,650
1,558
2,980
20
11,205
Cost
At 1 January 2014
Additions
Acquisition of subsidiaries
Disposals
Foreign currency exchange differences
At 31 December 2014
Accumulated amortisation
At 1 January 2014
Amortisation
Disposals
Foreign currency exchange differences
At 31 December 2014
2
9,781
3,008
1,069
—
—
(iii)
(iv)
Intellectual Life insurance
property
VOBA
£000
£000
(v)
Non-life
discount on
reserves
£000
(i)
IT
assets
£000
Total
£000
35,275
2,815
2,025
(8,189)
97
32,023
(i)
IT assets are internally-generated intangible assets such as software and new processes. These assets are amortised over their expected useful lives which range
between three and ten years.
(ii)
Customer relationship intangible assets represent the value of expected profits arising from existing customer relationships in businesses acquired and are
amortised so as to match the pattern of expected profits.
(iii)
Intellectual property represents the claims management software acquired from KnowledgeCenter Limited and is amortised over its expected useful life.
(iv)
VOBA represents the present value of future profits embedded in acquired insurance contracts and is amortised based on the anticipated emergence of profits.
(v)
Non-life insurance discount on reserves represents the difference between the nominal value of insurance reserves and the discounted value of those reserves.
The intangible asset arising is amortised to match the anticipated cash flows arising as insurance claims are paid.
15. Property, plant and equipment
Computers
£000
Fixtures,
fittings and
equipment
£000
Motor
vehicles
£000
Total
£000
9,848
951
250
(1,440)
62
9,671
5,435
389
82
(572)
56
5,390
944
179
—
(205)
4
922
18,446
1,592
332
(2,217)
149
18,302
6
1,393
7,907
966
220
(1,370)
48
7,771
4,525
355
68
(560)
48
4,436
570
178
—
(196)
4
556
14,356
1,660
288
(2,126)
113
14,291
209
582
1,900
954
366
4,011
206
659
1,941
910
374
4,090
Freehold
buildings
£000
Leasehold
buildings
£000
326
—
—
—
1,893
73
—
—
18
344
9
1,975
120
8
—
—
1,234
153
—
—
7
135
Net book value
At 31 December 2014
At 31 December 2013
Cost
At 1 January 2014
Additions
Acquisition of subsidiaries
Disposals
Foreign currency exchange differences
At 31 December 2014
Accumulated depreciation
At 1 January 2014
Charge for the year
Acquisition of subsidiaries
Disposals
Foreign currency exchange differences
At 31 December 2014
Included in the above are the following assets held under finance leases:
99
Computers
£000
Fixtures,
fittings and
equipment
£000
3,527
—
192
—
(234)
—
—
—
3,293
192
2,989
347
(215)
—
3,121
188
—
—
—
Net book value
At 31 December 2014
At 31 December 2013
Cost
At 1 January 2014
Additions
Disposals
Foreign currency exchange differences
At 31 December 2014
Accumulated depreciation
At 1 January 2014
Charge for the year
Disposals
Foreign currency exchange differences
At 31 December 2014
Motor
vehicles
£000
Total
£000
278
59
(110)
(1)
226
3,997
59
(344)
(1)
3,711
188
194
46
(101)
1
140
3,371
393
(316)
1
3,449
172
4
86
262
538
4
84
626
16. Investments
At 31 December 2014
Associated
undertakings
Other
£000
£000
Group
Cost
At 1 January
Share of profit
Dividends received
Foreign currency exchange differences
At 31 December
605
121
(52)
10
684
63
—
—
1
64
Total
£000
668
121
(52)
11
748
At 31 December 2013
Associated
undertakings
Other
£000
£000
593
69
(55)
(2)
605
63
—
—
—
63
At 31 December
2014
£000
Company
Cost of group undertakings
At 1 January
Acquisition of subsidiary
Disposals
Transfer from group companies
Transfer to group companies
At 31 December
78,843
3,172
(45,215)
39,298
(3,172)
72,926
Total
£000
656
69
(55)
(2)
668
2013
£000
39,089
—
—
39,754
—
78,843
17. Deferred taxation
At 31 December
2013
2014
£000
£000
7,682
5,811
(1,913)
2,970
(214)
(93)
(6)
—
112
(107)
57
31
93
1
5,811
8,613
At 1 January
Retirement benefit obligation
US tax losses
UK tax losses
UK timing differences
Overseas timing differences
Foreign currency exchange differences
At 31 December
Deferred tax comprises:
Pension liability
Losses
Other timing differences
8,316
808
(511)
100
5,358
808
(355)
8,613
5,811
At the balance sheet date the Group has unused tax losses of £35.2m available for offset against future profits. A deferred tax asset of
£0.8m has been recognised in respect of such losses. A potential deferred tax asset of £6.2m relating to these unused tax losses and a
potential deferred tax asset of £1.2m relating to unused capital allowances, has not been recognised as it is not considered probable
that there will be future taxable profits available. The losses may be carried forward indefinitely.
Other timing differences include £207,000 (2013: £158,000) of deferred tax liabilities relating to overseas entities.
18. Trade and other receivables
Group
At 31 December
2013
2014
£000
£000
22,807
26,203
—
—
Trade debtors
Amounts due from subsidiaries
Amounts due from associates
Other debtors
Prepayments
Accrued income
Corporation tax
2
2,920
7,121
23,500
315
60,061
12
2,524
4,962
23,278
267
53,850
Company
At 31 December
2014
£000
—
2013
£000
—
179,343
—
145,085
—
27
—
—
—
65
—
—
—
179,370
145,150
Included within prepayments are IT assets of £2.9m (2013: £1.1m) in the course of construction.
19. Trade and other payables
Group
At 31 December
2014
£000
4,335
—
Trade creditors
Amounts owed to subsidiaries
Other taxation and social security
Other creditors
Accruals and deferred income
2,452
1,396
15,914
24,097
101
2013
£000
4,306
—
2,123
939
13,539
20,907
Company
At 31 December
2013
2014
£000
£000
—
—
134,900
158,980
—
—
—
8
849
208
135,757
159,188
20. Borrowings
Group
At 31 December
2014
£000
Total borrowings:
Amount due for settlement within 12 months
Amount due for settlement after 12 months
5,345
37,402
42,747
2013
£000
Company
At 31 December
2014
£000
5,302
35,255
40,557
1,192
37,370
38,562
2013
£000
1,401
35,163
36,564
Bank loans and overdrafts are secured by charges on specific assets and cross guarantees between group companies.
Analysis of group finance lease commitments
At 31 December
2014
£000
Minimum lease payments due:
within one year
in the second to fifth years inclusive
less: finance charges allocated to future periods
113
60
(1)
172
112
60
172
due within one year
due after more than one year
2013
£000
449
151
(16)
584
434
150
584
Finance leases are secured on the leased assets.
At 31 December
2014
£000
Net interest-bearing liabilities
Cash and cash equivalents
Bank overdrafts
Current loans
Non-current bank loans
Finance leases
Client funds
2013
£000
52,185
(4,488)
(857)
(37,402)
(172)
9,266
(41,886)
(32,620)
48,757
(4,440)
(862)
(35,255)
(584)
7,616
(39,990)
(32,374)
Employee
entitlements
£000
235
(66)
4
2
175
Total
£000
411
(185)
80
2
308
21. Provisions
Relocation and
reorganisation
£000
76
(76)
—
—
—
At 1 January 2014
Utilised in year
Profit and loss account charge
Foreign currency exchange differences
At 31 December 2014
Premises
dilapidations
£000
100
(43)
76
—
133
22. Called up share capital
At 31 December
2014
£000
Issued and fully paid
43,429,610 ordinary shares of 1p each (2013: 41,542,943)
434
2013
£000
415
The number of allotted and fully paid shares of the Company issued under employee share schemes for the year was 924,124. A
further 633,393 shares were issued to part fund the acquisition of KLA Group and under deferred consideration arrangements, 329,150
shares were issued to the former owners of LCL Group Limited.
102
23. Non-controlling interests
The following amounts are attributable to non-controlling interests:
Profit/(loss) before tax
Owned Insurance Companies business
Adjusting Services business
Income tax credit/(expense)
Owned Insurance Companies business
Adjusting Services business
Profit/(loss) for the period
Owned Insurance Companies business
Adjusting Services business
Equity
Owned Insurance Companies business
Adjusting Services business
2014
£000
2013
£000
160
65
225
(294)
54
(240)
—
—
(35)
(35)
(28)
(28)
160
30
190
(294)
26
(268)
20,934
1,046
21,980
20,774
1,057
21,831
The Group owns two insurance companies with significant non-controlling interests:
Cardrow Insurance Limited
The non-controlling shareholder is entitled to future distributions and returns of capital of a fixed amount being the aggregate of the
distributable reserves of the company at the date of the company’s acquisition by the Group and £22.5m, plus 82.5% of distributions
and returns of capital above that amount. Of the £22.5m, £13.0 was paid up in prior years.
Bestpark International Limited
The non-controlling shareholder is entitled to 49.99% of all future distributions and returns of capital.
24. Share-based awards
Share option schemes
The Company operates an executive share option scheme for eligible employees, in which options are exercisable if earnings per
ordinary share increase by the Retail Price Index plus 6% over a three-year period and personal targets are attained. The options expire
after tenyears from the date of grant and if the employee leaves they lapse unless exercised within six months of leaving.
The Company also operates a SAYE share option scheme for eligible employees under which options may be granted at a discount of
up to 20% of market value. Savings contracts may run over two, three, five or seven years. The options lapse immediately if the
employee leaves within three years of the option grant and lapse within six months of leaving if the employee leaves after three years
of option grant.
Share options outstanding during the year to 31 December were as follows:
2013
2014
Outstanding at beginning of year
Granted during the year
Exercised during the year
Forfeited during the year
Expired during the year
Outstanding at end of year
Exercisable at end of year
103
Options
1,301,671
638,917
(423,210)
(73,564)
(247,852)
1,195,962
Weighted
average
exercise
price
£1.61
£1.94
£1.14
£1.44
£2.78
£1.72
123,630
£1.14
Options
1,323,798
248,551
(136,932)
(133,746)
—
Weighted
average
exercise
price
£1.57
£1.70
£1.34
£1.52
—
1,301,671
£1.61
300,366
£2.57
As at 31 December 2014 share-based awards outstanding were as follows:
Savings-related share option schemes
Normally exercised in the period between:
December 2014 and May 2015
December 2015 and May 2016
January 2015
December 2015 and May 2016
December 2015 and May 2016
January 2016
December 2016 and May 2017
January 2017
December 2017 and May 2018
Executive share option schemes
Normally exercised in the period between:
April 2008 and April 2015
Long-term investment plan
Normally exercised on the third anniversary of the allocation date:
April 2015
April 2016
March 2017
Option price
per ordinary
share (p)
Number of
shares
110.48
144.95
149.89
141.08
140.20
178.50
168.00
210.375
193.16
120,630
20,249
31,906
146,952
3,850
35,040
195,418
31,687
607,230
248.50
3,000
260,500
234,000
235,572
1,926,034
The share options outstanding at 31 December 2014 had a weighted average remaining contractual life of 21 months. The options
granted during 2014 had an aggregate fair value of £228,000 (2013: £63,000).
The inputs into the Black-Scholes-Merton model for options granted during the year are as follows:
2014
£2.15
£1.94
27.2%
2–3 years
0.66%–0.85%
4.3%
Weighted average share price
Weighted average exercise price
Expected volatility
Expected life
Risk-free rate
Expected dividend yield
2013
£1.88
£1.70
26.4%
2–3 years
0.62%–0.90%
4.3%
Expected volatility was determined by calculating the historical volatility of the Company’s share price since flotation in 1996. The
expected life used in the model has been adjusted, based on management’s best estimate, for the effects of non-transferability, exercise
restrictions and behavioural considerations.
The Company recognised a total charge of £59,000 (2013: £44,000) relating to share option scheme transactions in 2014.
Long-term incentive scheme
Awards totalling 282,939 shares (2013: 420,000) were made under the LTIP during the year. These awards are subject to a three-year
performance period. The Company recognised a total charge of £306,000 (2013: £369,000) in relation to the LTIP scheme. Further
information on this scheme is given in the Directors’ Remuneration Report.
104
25. Financial instruments
The disclosures below should be read in conjunction with note 27, where related information has been disclosed in relation to the
Group’s insurance companies.
Fair values of financial assets and liabilities
Details of the accounting policies and methods adopted (including the criteria for recognition, the basis of measurement and the bases
for recognition of income and expenses) for each class of financial asset, financial liability and equity instrument are disclosed in note
1.
Financial assets and liabilities at 31 December were as follows:
Group
2014
£000
Financial assets
Trade and other receivables (excluding prepayments)
Cash and cash equivalents
Financial liabilities
Trade and other payables
Tax liabilities
Obligations under finance leases
Bank overdrafts and loans
Client funds
Retirement benefit obligation
Provisions
Deferred consideration
2013
£000
Company
2014
£000
2013
£000
52,940
52,185
105,125
48,888
48,757
97,645
179,370
2,025
181,395
145,150
1,991
147,141
24,097
326
172
42,747
41,886
41,534
308
14,537
165,607
20,907
335
584
40,557
39,990
26,671
411
13,923
143,378
159,188
—
—
135,757
—
—
38,562
—
—
—
—
36,564
—
—
—
—
197,750
172,321
Included within trade and other receivables is an asset of £nil (2013: £164,000) and within trade and other payables a liability of
£15,000 (2013: £44,000), relating to forward foreign exchange contracts in designated hedging relationships.
Financial risk management objectives
The Group’s central treasury function secures and controls debt financing, coordinates efficient cash management within the business
and monitors and manages financial risks relating to the operations of the Group. Treasury’s objective is to deploy financial resources
around the Group in the most efficient manner possible, ensuring that cash is available in the right place and currency at the right time
to pay liabilities as they fall due. Long-term, annual, monthly, weekly and daily forecasts form the basis for treasury decisions.
Financial risks comprise market risks such as currency risk, interest rate risk and other price risks and are influenced by fluctuating
changes in market prices, as well as credit and liquidity risks.
The Group seeks to minimise the effects of these risks by using derivative financial instruments to hedge risk exposures. The use of
financial derivatives is governed by the Group’s policies approved by the board of directors, which establish principles on currency
risk, interest rate risk and the use of financial derivatives and non-derivative financial instruments. Compliance with these policies is
reviewed by the Group’s internal auditors.
The Group does not enter into or trade financial instruments, including derivative financial instruments, for speculative purposes. The
treasury function reports to the Group’s Finance Committee.
Valuation techniques and assumptions applied for the purposes of measuring fair value
The fair values of the Group’s financial assets and liabilities are determined as follows:
•
For those financial assets and liabilities that are cash or short-term trade receivables or payables, carrying amount is a
reasonable approximation of fair value.
•
Retirement benefit obligations are valued by independent actuaries in accordance with IFRS.
•
The Group’s remaining financial assets and liabilities are measured, subsequent to initial recognition, at fair value, and they can
be grouped into Levels 1 to 3 based on the degree to which the fair value is observable:
––
Level 1 fair value measurements are those derived from quoted prices (unadjusted) in active markets for identical assets
or liabilities;
105
––
Level 2 fair value measurements are those derived from inputs other than quoted prices included within Level 1 that are
observable for the asset or liability, either directly (i.e. as prices) or indirectly (i.e. derived from prices); and
––
Level 3 fair value measurements are those derived from valuation techniques that include inputs for the asset or liability
that are not based on observable market data (unobservable inputs).
Fair value hierarchy
For each of the assets in the table below carrying value is a reasonable approximation to fair value. Excluding insurance companies,
there were no level 1 assets, no transfers between level 1 and 2 during the period, nor were there any valuation changes. All
movements in the asset or liability values below, except deferred consideration, are through profit or loss.
Deferred consideration held outside insurance company liabilities has increased by £0.6m, being £1.6m arising on the acquisition of
KLA Group (see note 12) offsetting a distribution of £0.9m of loan notes convertible to share to former owners of the LCL Group.
Other movements in deferred consideration are through profit or loss.
Trade debtors
Accrued income
Deferred consideration
FX forward contracts
Interest rate swaps
At 31 December 2014
Level 2
Level 3
£000
£000
—
26,203
—
23,500
—
14,537
—
(15)
—
—
(15)
64,240
Total
£000
26,203
23,500
14,537
(15)
–
64,225
At 31 December 2013
Level 2
Level 3
£000
£000
—
22,807
—
23,278
—
(13,923)
—
120
—
(61)
59
32,162
Total
£000
22,807
23,278
(13,923)
120
(61)
32,221
The fair values of the financial assets and liabilities included in the Level 2 category have been independently valued by the Royal
Bank of Scotland and HSBC based on observable market conditions prevailing at the valuation date, including relevant foreign
exchange rates and the zero-coupon yield curve.
The fair values of the financial assets and liabilities included in the Level 3 category above have been determined in accordance with
generally accepted pricing models based on a discounted cash flow analysis with the most significant inputs being the discount rate
that reflects substantially the same terms and characteristics including the credit quality of the instrument:
•
Trade debtors are reduced by a discount to reflect the time value of money at a discount rate of 2.75% (2013: 2.75%) that
reflects the Group’s debt funding rate over the relevant maturities.
•
Accrued income is uplifted by 7.9% for anticipated unrecorded income, which is based on average over-recovery of unrecorded
income during 2014, and then discounted for the time value of money at 2.75% (2013: 2.75%) that reflects the Group’s debt
funding rate over the relevant maturities.
•
Deferred consideration is reduced by a discount to reflect the time value of money at a discount rate of 3.36% (2013: 4.63%)
that reflects the Group’s debt funding rate over the relevant maturities.
The sensitivity of the fair values of trade debtors and accrued income to changes in the discount rate is negligible, irrespective of the
change in discount rate. The sensitivity of the fair value of deferred consideration to reasonably likely changes in the discount rate is
immaterial.
Currency risk
The Group has significant overseas subsidiaries which operate mainly in North America, Bermuda and the Asia Pacific region and
whose revenues and expenses are denominated mainly in foreign currencies. Hence, exposures to exchange rate fluctuations arise.
Exchange rate exposures are managed within approved policy parameters utilising forward foreign exchange and options contracts.
106
The carrying amounts of the Group’s monetary assets and liabilities, held by entities with a functional currency other than £sterling, at
the reporting date are as follows:
Assets
At 31 December
2014
£000
Group
US$
Other
Company
US$
Other
2013
£000
Liabilities
At 31 December
2014
£000
2013
£000
12,830
23,513
36,343
10,750
29,446
40,196
8,855
8,053
16,908
6,790
15,374
22,164
1,666
4,408
6,074
4,079
6,914
10,993
6,451
2,640
9,091
4,994
4,042
9,036
The Group issues invoices denominated in US$, and Canadian$ to customers within the Adjusting business with typical payment
periods of five months. The Group has entered into forward foreign exchange contracts to hedge the foreign exchange rate risk arising
on the future cash receipts relating to these invoices, which are designated as cash flow hedges.
The following table details the Group’s forward foreign currency contracts outstanding at the year end:
Currency value
2013
2014
Local ’000
Local ’000
Sell US$
Less than 3 months
3 to 6 months
6 to 9 months
Buy Singapore$
Less than 3 months
3 to 6 months
6 to 9 months
Sell Canadian$
Less than 3 months
3 to 6 months
6 to 9 months
Contract value
2014
£000
2013
£000
Fair value
2014
£000
2013
£000
—
—
—
—
2,262
—
—
2,262
—
—
—
—
1,500
—
—
1,500
—
—
—
—
132
—
—
132
1,128
—
1,332
—
557
—
681
—
(15)
—
(44)
—
—
—
—
—
—
—
1,128
1,332
557
681
(15)
(44)
—
—
—
—
471
—
—
471
—
—
—
—
300
—
—
300
—
—
—
—
32
—
—
32
The average strike price rates achieved for the above trades are £sterling : Singapore$2.0612 and US$ : Singapore$1.2735.
As at 31 December 2014, the aggregate amount of losses under forward foreign exchange contracts deferred in the cash flow hedging
reserve relating to the exposure on these anticipated future cash flows is £15,000 (2013: gains of £120,000). Upon maturity of the
contracts and the realisation of the anticipated cash flows, the amount deferred in equity will be reclassified to profit or loss. The
anticipated future cash flows relating to the forward foreign exchange contracts held at 31 December 2014 are expected to be realised
throughout the first three months of 2015.
The amount reclassified to profit or loss in the year to 31 December 2014 relating to matured forward foreign exchange contracts
designated as cash flow hedge instruments is £147,000 gain (2013: £46,000 gain). As at 31 December 2014, no ineffectiveness has
been recognised in profit or loss arising from hedging the anticipated future cash flows.
The policy of the Group permits the use of foreign currency option contracts for a proportion of its foreign currency liquidity risk to
protect against a weakening of the US$ against £sterling. There were no options open at 31 December 2014 or at 31 December 2013.
107
Currency sensitivity
As the Group is mainly exposed to the US$, the following table details the Group’s sensitivity to a 10% increase in the value of
£sterling against the US$. 10% represents management’s assessment of a reasonably possible change in foreign exchange rates,
although this cannot be predicted with certainty. The sensitivity analysis includes only outstanding foreign currency denominated
monetary items and adjusts their translation at the period end for a 10% change in US$ rates. A negative number below indicates a
decrease in profit or equity where the US$ weakens 10% against £sterling. For a 10% strengthening of the US$ against £sterling, there
would be an equal and opposite impact on profit and equity, and the signs below would be reversed.
Year to 31 December
2014
£000
(424)
(361)
Impact on profit before tax
Impact on equity
2013
£000
(382)
(360)
The results of overseas subsidiaries are translated into £sterling using the average rate of exchange for the year. A 10% weakening of
the US$ average rate for the year has been assumed in the sensitivity analysis and the impact is shown in the table below:
Year to 31 December
2013
2014
£000
£000
(325)
(491)
Profit before tax
Non-sterling currencies of primary importance to the Group moved as follows in the year:
US$
2014
Year end
1.558
2013
Year end
1.643
%
Change
(5.2)
108
2014
Average
1.645
2013
Average
1.569
%
Change
4.9
Impact
on 2014
operating
profit
£000
(263)
Interest rate risk
The Group is exposed to interest rate risk as entities in the Group borrow funds at floating interest rates. The Group’s exposures to
interest rates on financial assets and financial liabilities are detailed in the liquidity risk management section of this note.
The interest rate risk profile of financial assets and financial liabilities at 31 December, was as follows:
2013
2014
Group
Financial assets
£sterling
US$
Other
Financial liabilities
£sterling
US$
Other
Total
£000
Floating rate
£000
Fixed rate
£000
Non-interest
bearing
£000
Total
£000
Floating rate
£000
Fixed rate
£000
Non-interest
bearing
£000
40,758
3,224
8,203
52,185
—
—
—
—
28,024
9,606
15,310
52,940
68,782
12,830
23,513
105,125
31,649
2,467
14,641
48,757
—
—
—
—
25,800
8,283
14,805
48,888
57,449
10,750
29,446
97,645
76,177
2,595
5,860
84,632
115
—
57
172
72,407
6,260
2,136
80,803
148,699
8,855
8,053
165,607
65,222
2,219
13,106
80,547
554
—
30
584
55,438
4,571
2,238
62,247
121,214
6,790
15,374
143,378
2013
2014
Company
Financial assets
£sterling
US$
Other
Financial liabilities
£sterling
US$
Other
Total
£000
Floating rate
£000
Fixed rate
£000
Non-interest
bearing
£000
Total
£000
Floating rate
£000
Fixed rate
£000
Non-interest
bearing
£000
1,600
123
302
2,025
—
—
—
—
173,721
1,543
4,106
179,370
175,321
1,666
4,408
181,395
558
980
453
1,991
—
—
—
—
135,590
3,099
6,461
145,150
136,148
4,079
6,914
147,141
38,552
—
5
38,557
—
—
—
—
150,107
6,451
2,635
159,193
188,659
6,451
2,640
197,750
36,067
—
489
36,556
137
—
—
137
127,081
4,994
3,553
135,628
163,285
4,994
4,042
172,321
Interest rate sensitivity
For floating rate liabilities, the analysis is prepared assuming the amount of liability outstanding at the balance sheet date was
outstanding for the whole year. An increase in interest rates of 1.0% is used and represents management’s assessment of a reasonably
possible change in interest rates, although this cannot be predicted with certainty.
If interest rates had increased by 1.0% and all other variables wholly been held constant, the Group’s profit for the year to 31
December 2014 would have decreased by £364,000 (2013: £161,000). This is attributable to the Group’s exposure to interest rates on
its variable rate borrowings.
Capital risk management
The Group’s objectives when managing capital are:
•
to safeguard the entity’s ability to continue as a going concern, so that it can continue to provide returns to shareholders and
benefits for other stakeholders;
•
to maximise the return to shareholders commensurate with a level of risk in each of its various businesses that management
considers acceptable; and
•
to ensure the Group’s regulated businesses comply with requirements set by regulators in the various jurisdictions in which the
Group operates.
The Group takes account of risk when considering decisions involving the allocation of capital. Changes are made to the capital
structure as economic conditions and the perception of risk changes. Changes may be made by way of altering the amount of
dividends payable to shareholders, issuing shares or altering the level of the Group’s indebtedness e.g. by taking out or refinancing
loan facilities. The Group monitors capital by reference to the level of net debt relative to equity.
109
The Group has a number of insurance company and investment management subsidiaries subject to capital requirements imposed by
their respective regulatory authorities. Management and boards of regulated companies have processes in place to ensure that
minimum capital requirements are properly calculated, regularly monitored and maintained at an appropriate level. The Group
complied with externally imposed capital requirements during the year, however Bestpark International Limited’s regulatory capital is
below the minimal capital requirement. At the time of acquisition, the Group informed the UK regulator that no additional capital
would be made available. The regulator continues to monitor the situation closely together with the directors.
Equity price risk
Changes in equity prices affect the financial assets of the Group’s life insurance companies, but have no material economic impact on
the Group, as explained in note 27. The Group has no material exposures to commodity price risk, prepayment risk or residual value
risk.
Credit risk
Credit risk is the risk that a counterparty will default on its contractual obligations, resulting in financial loss to the Group.
The credit risk on liquid funds and derivative financial instruments is regarded as acceptable because the counterparties are banks with
high credit ratings assigned by international credit rating agencies. However, the Group has kept its counterparties under close review
because of recent solvency and liquidity problems in the banking sector and remains alert to potential risks.
The Group has no significant concentrations of credit risk relating to its clients. Credit policies, processes and management resources
are designed to address and limit risk. It is not possible to measure when trade debtors in the Adjusting Services business become past
due because of the role played by insurance brokers in collecting fees and the subscription nature of much of the market. Credit
periods are monitored for each office in the Adjusting Services business and debtor ageing is monitored for each client and individual
invoice. There are no material trade debtors outside the Adjusting Services business. The Group’s exposure to credit risk is best
represented by the value of trade and other receivables disclosed in note 18. No collateral is held as security for amounts due and no
other credit enhancements are in place. The credit quality of trade and other receivables is overall believed to be good and
commensurate with the normal commercial risks of business-to-business trading within the relevant market.
Liquidity risk
Liquidity risk is the risk of being unable to meet current and future payment obligations either as they fall due or in the full amount
due. The funding risk arises when the necessary liquidity cannot be obtained on the expected terms when required.
The ultimate responsibility for liquidity risk management rests with the board of directors, which monitors the Group’s short, medium
and long-term funding and liquidity requirements. The relevant procedures are implemented by the treasury function.
The Group manages liquidity risk by maintaining adequate banking facilities, subject to covenant compliance and reserve borrowing
facilities, by monitoring forecast cash flows and by matching the maturity profiles of financial assets and liabilities.
110
Maturity of financial liabilities
The maturity of the Group’s financial liabilities at 31 December was as shown below:
Group
Trade and other payables
Tax liabilities
Obligations under finance
leases
Bank overdrafts and loans
Client funds
Retirement benefit obligation
Provisions
Deferred consideration
<1 year
£000
1–2 years
£000
2014
2–5 years
£000
>5 years
£000
Total
£000
<1 year
£000
1–2 years
£000
2013
2–5 years
£000
24,097
326
—
—
—
—
—
—
24,097
326
20,907
335
—
—
—
—
112
5,345
41,886
1,786
308
4,032
77,892
60
1,320
—
—
36,082
—
—
—
—
—
34,401
—
—
—
5,358
—
32,604
—
1,902
—
5,706
—
17,161
—
4,159
7,325
3,142
44,582
3,204
35,808
434
5,302
39,990
1,902
411
4,284
73,565
150
854
—
1,786
—
172
42,747
41,886
41,534
308
14,537
165,607
1,471
4,377
6,597
46,704
1,571
18,732
584
40,557
39,990
26,671
411
13,923
143,378
2013
1–2 years
2–5 years
£000
£000
Total
£000
<1 year
£000
Company
Trade and other payables
Bank overdrafts and loans
159,188
1,192
160,380
2014
1–2 years 2–5 years
£000
£000
—
—
1,288
1,288
36,082
36,082
Total
£000
<1 year
£000
159,188
38,562
197,750
135,757
1,401
137,158
>5 years
£000
Total
£000
—
—
—
20,907
335
—
—
793
793
34,370
34,370
135,757
36,564
172,321
Sterling denominated bank borrowings and overdrafts bear interest at LIBOR and bank base rate respectively. US$ denominated
borrowings bear interest at rates based on the US Prime Rate.
The Group has various undrawn committed borrowing facilities. The facilities available at 31 December in respect of which all
conditions precedent had been met were as follows:
At 31 December
2013
2014
£000
£000
12,296
9,248
Expiring in one year or less
The Group has a senior facilities agreement with the Royal Bank of Scotland and HSBC for a five year term, which expires on 7
November 2018. The facilities comprise a £10.0m term loan with scheduled repayments every six months (starting with £0.5m, then
rising to £0.75m in 2016 and 2017, and then £2.5m in 2018) and a £30.0m revolving credit facility (RCF). £9.0m of the term loan
balance was outstanding at 31 December 2014 and the RCF was fully drawn. The senior facilities are subject to a variety of
undertakings and covenants, including target ratios for interest cover (EBITDA: interest), leverage (debt: EBITDA) and cash cover
(cash flow: debt repayments, interest and dividends).
Other group facilities are:
•
$1.0m US term loan with scheduled quarterly repayments; $0.2m of the term loan balance was outstanding at 31 December
2014;
•
Uncommitted overdraft of £5.0m in the UK;
•
Uncommitted overdraft US$4.0m in Hong Kong and Canadian$1.8m in Canada; and
•
Committed overdraft of US$5.0m in USA.
111
26. Operating leases
Year to 31 December
2013
2014
£000
£000
5,019
5,142
Lease payments under operating leases recognised as an expense in the year
At 31 December, the Group had outstanding commitments for future minimum lease payments under non-cancellable operating leases
which fall due as follows:
2014
£000
3,508
9,330
5,300
18,138
Within one year
In the second to fifth years inclusive
After five years
2013
£000
3,562
9,836
7,445
20,843
27. Insurance company disclosures
The directors believe the Group’s exposure to material adverse risk from the valuation of the assets or liabilities of the Group’s
insurance companies is limited. This is because the acquisition cost in each case comprised of either a nominal or refundable upfront
payment followed by deferred consideration based on future cash distributions by the insurance companies, or the former owners
being entitled to the majority of such distributions by the way of non-controlling interests in the companies’ shares. The Group’s net
investment in insurance companies is summarised on page 115.
There is no material risk to the Group arising from the investment portfolios held by the life insurance business as the majority of
policyholder liabilities are directly linked to the value of investments held.
Although there is some uncertainty over the ability of the non-life insurance company, Bestpark International Limited, to pay all its
future liabilities, and consequently a possibility that the company may become insolvent, the directors believe that there would be no
material disadvantage to the Group in that event. The Group is under no obligation to contribute further capital and does not intend to
do so. A prospective reduction in net assets will only have a limited effect on the Group for the reason set out above and also because
the Group has reduced its shareholding in the company from 100% to 50.01% since it was acquired. Insolvency of any of the owned
insurance companies may impact future service revenue and may result in an impairment of goodwill.
Insurance reserves are set to reflect management’s best estimate of the ultimate cost of settling claims incurred under insurance
policies previously written by the insurance companies acquired. A number of actuarial estimation techniques have been used in
arriving at the insurance reserves recorded in these financial statements.
Further details of the amounts included in the consolidated financial statements in respect of the Group’s insurance companies are
disclosed below to assist readers in understanding their impact on the consolidated income statement and balance sheet.
112
Consolidated income statement for group insurance companies
Gross premiums written
Outward reinsurance premiums
Net written premiums
Change in the gross provision for unearned premiums
Change in the provision for unearned premiums, reinsurers’ share
Unearned premiums
Fees from investment contracts
Fees from insurance contracts
Other fees
Total revenue
Other gains from insurance activities
Claims paid, gross amount
Claims paid reinsurers’ share
Net claims paid
Change in provision for claims, gross amount
Change in provision for claims, reinsurers’ share
Net change in provision for claims
Claims incurred, net of reinsurance
Net operating expenses
Net result
Year to 31 December 2014
Non-life
Total
business Life business
£000
£000
£000
319
980
1,299
(164)
(819)
(983)
155
161
316
206
—
206
(76)
—
(76)
130
—
130
3,404
(3)
3,407
—
302
302
(3)
3,709
3,706
282
3,870
4,152
125
6,710
6,835
(3,125)
(30,990)
(34,115)
702
1,309
2,011
(2,423)
(29,681)
(32,104)
4,114
24,189
28,303
(671)
(664)
(1,335)
3,443
23,525
26,968
(5,136)
1,020
(6,156)
(4,438)
(1,092)
(3,346)
335
1,078
1,413
Year to 31 December 2013
Non-life
business Life business
£000
£000
531
1,042
(228)
(853)
303
189
989
—
(380)
—
609
—
—
3,806
—
127
—
3,933
912
4,122
467
10,011
(4,108)
(1,997)
199
1,648
(3,909)
(349)
4,474
(8,451)
(511)
198
3,963
(8,253)
54
(8,602)
(1,873)
(3,691)
(440)
1,840
Total
£000
1,573
(1,081)
492
989
(380)
609
3,806
127
3,933
5,034
10,478
(6,105)
1,847
(4,258)
(3,977)
(313)
(4,290)
(8,548)
(5,564)
1,400
The financial assets shown in the table below and falling within the scope of IFRS 7 Financial Instruments: Disclosures have, where
indicated, been classified as at fair value through profit or loss (and are designated as such upon initial recognition), available for sale
or other. There are no financial liabilities shown in the table below which are within the scope of IFRS 7 and which have been
classified as at fair value through profit or loss or measured at amortised cost.
Amounts described as debtors arising from insurance and reinsurance operations are technically past due. Amounts shown have
been reduced for estimated impairment losses where applicable. Financial liabilities within the scope of IFRS 7 are shown in the
table below.
113
Consolidated balance sheet for group insurance companies
At 31 December
2014
£000
Investments at fair value through income
– Life insurance contracts
– Investment contracts assets held to back unit-linked liabilities
Investments available for sale
– Non-life insurance contracts
2013
£000
319,489
412,071
16,246
237,359
Amounts receivable under reinsurance contracts
Cash and cash equivalents in insurance businesses
Debtors arising from insurance and reinsurance operations
Deferred acquisition costs
Amounts due from group companies
Other assets
Total assets in insurance businesses before eliminations
Elimination of amounts due from group companies
Total assets in insurance businesses
—
731,560
3,363
58,116
2,501
20
5,165
68
800,793
(5,165)
795,628
3,059
256,664
4,784
55,741
1,789
76
5,473
194
324,721
(5,473)
319,248
Insurance technical balances
– Life insurance contracts
– Non-life insurance contracts
Investment contracts unit-linked liabilities
Creditors arising from insurance and reinsurance operations
Deferred reinsurance commissions
Deferred consideration
Provisions
Amounts owed to group companies
Other creditors
Total liabilities in insurance businesses before eliminations
Elimination of amounts owed to group companies
Total liabilities in insurance businesses
Net assets in insurance businesses
318,888
19,386
410,401
3,410
2
2,611
953
444
406
756,501
(444)
756,057
39,571
16,246
24,593
237,315
1,484
29
750
73
412
624
281,526
(412)
281,114
38,134
Investments held by group insurance companies
Other than £23.3m of investments included within unit trusts, investments at fair value through income are categorised as Level 1
within the IFRS 7 fair value hierarchy because their values are derived from quoted prices in active markets. Valuation techniques and
assumptions applied for the purposes of measuring fair values are described in note 25.
Corporate and government securities
Unit trusts
Promissory notes
Cash and cash deposits to back unit-linked
liabilities
With profits investments held with insurance
companies
Other investments
Other cash and cash equivalents in insurance
businesses
At 31 December 2014
Life
Life
insurance investment
Non-life
contracts
contracts
investments investments investments
£000
£000
£000
—
101,790
80,405
—
142,226
288,961
—
12,338
1,734
Total
£000
182,195
431,187
14,072
Non-life
investments
£000
3,059
—
—
At 31 December 2013
Life
Life
insurance
investment
contracts
contracts
investments investments
£000
£000
—
15,748
3,139
202,610
—
1,586
Total
£000
18,807
205,749
1,586
—
50,910
38,196
89,106
—
815
16,356
17,171
—
—
—
11,628
597
319,489
—
2,775
412,071
11,628
3,372
731,560
—
—
3,059
12,292
—
16,246
—
1,059
237,359
12,292
1,059
256,664
47,023
11,093
—
58,116
48,612
7,129
—
55,741
Investment contract assets are held to back unit-linked liabilities. Any increase or decrease in their value is matched by an
increase or decrease or the associated liability to policyholders.
114
Group net investment in insurance companies
At 31 December
2013
2014
£000
£000
319,248
795,628
(281,114)
(756,057)
(12,841)
(12,133)
2,980
2,682
20
—
28,293
30,120
(20,774)
(20,934)
7,519
9,186
Total assets in insurance businesses
Total liabilities in insurance businesses
Deferred consideration payable to former shareholders
Other intangible assets future profits – life
Other intangible assets discount of liabilities – non-life
Non-controlling interests
28. Notes to the Cash Flow Statements
Group
Year to 31 December
2013
2014
£000
£000
8,484
11,103
Operating profit
Adjustments for:
Depreciation of property, plant and equipment
Amortisation of intangibles
Other non-cash items
Decrease in provisions
Share of results of associates and joint ventures
Operating cash flow before movements in working capital
Increase in receivables
Increase/(decrease) in payables
Decrease in insurance company assets
Decrease in insurance company liabilities
Cash generated/(used) by operations
Contributed by:
– Professional Services
– Owned Insurance Companies
Cash generated/(used) by operations
Income taxes paid
Interest paid
Dividends from other group companies
Net cash before movement in client funds
Movement in client funds
Net cash from operating activities
1,660
2,913
1,155
(2,178)
(121)
14,532
(5,595)
2,684
109,444
(110,881)
10,184
2,253
2,671
2,253
(2,193)
(69)
13,399
(1,946)
581
30,079
(31,761)
10,352
10,524
(340)
10,184
(1,133)
(1,112)
—
10,186
166
10,352
(1,041)
(1,151)
—
7,939
1,896
9,835
8,160
4,777
12,937
Company
Year to 31 December
2013
2014
£000
£000
(845)
(569)
—
—
—
—
202
—
—
792
—
—
(367)
(30,802)
(16,645)
—
—
(53)
(21,765)
8,320
—
—
(47,814)
(13,498)
(47,677)
(137)
(47,814)
—
(12,489)
(1,009)
(13,498)
—
(1,034)
50,744
1,896
—
(955)
15,585
1,132
—
1,896
1,132
Additions to tangible fixed assets during the year amounting to £59,000 (2013: £nil) were financed by new finance leases.
Cash and cash equivalents (which are presented as a single class of assets on the face of the balance sheet) comprise cash at bank and
other short-term highly-liquid investments with a maturity of three months or less. Cash includes client funds of £41.9m (2013:
£40.0m).
115
29. Retirement benefit schemes
Certain employees of the Group are members of one of the four defined benefit schemes operated by the Group, details of which are
set out below. The assets of all these pension schemes are held in separate trustee-administered funds. The defined benefit pension
schemes are subject to triennial valuations by independent, professionally qualified actuaries, using the projected unit credit method.
The results of the last review for each scheme shown below. The Group also operates a defined benefit scheme in respect of certain
employees of the office in Jakarta, Indonesia. This scheme is not a material balance to the Group.
The last valuation was carried out as at
Market value of scheme assets at last valuation was
Percentage coverage of actuarial value to benefits accrued to members
The following actuarial assumptions were applied: Investment returns
– Post-retirement (male; female)
– Pre-retirement
Salary growth
Charles Taylor
& Co. Limited
Retirement Benefits
Scheme
1 July 2013
£52,109,000
65%
Wm. Elmslie
& Sons 1972
Pension & Life
Assurance Fund
1 January 2012
£3,567,000
183%
4.25%
4.5%
n/a
3.3%
5.4%
4.7%
6.5%; 6.0%1
4.0%
3.0%
4.45%
5.75%
3.0%
n/a
Nil2
18.0%
14.4%
Employer ongoing contribution rates for 2011 as percentage of pensionable earnings
(excluding deficit funding contributions)
1
2
E R Lindley
Richards Hogg
& Co. Limited
Pension & Life
Pension Plan Assurance Scheme
1 July 2011
1 May 2012
£3,797,800
£16,935,000
120%
64%
4.0% for current pensioners paid from the fund.
The surplus is sufficient to offset the future service contributions.
The employer’s contribution rates over the average remaining service lives of the members of each scheme take account of the
surplus/deficit disclosed by the above valuations. The total expense recognised in the income statement during the year in respect of
the above defined benefit schemes amounted to £1.8m (2013: £1.9m).
The total expense recognised in the income statement in respect of defined contribution schemes amounted to £3.2m (2013: £2.9m).
The defined benefit schemes are all closed to new entrants. The CT & Co Scheme was closed to future accrual from 1 July 2011 and
the last active member of the WM Elmslie Scheme retired in 2013, so there is no future accrual in respect of this scheme from 2014.
For the ER Lindley & Co and Richards Hogg Schemes, existing members continue to accrue benefits. The service cost in respect of
existing members (expressed as an annual percentage of pensionable payroll) may therefore be expected to increase in successive
years as a result of the schemes’ ageing membership.
The key risks which could significantly impact the balance sheet include:
•
fall in asset values;
•
decrease in discount rate;
•
increase in price inflation; and
•
increase in longevity.
The trustees control the investment strategies of the schemes, which may affect the asset values. Sensitivity for each of the other
risks listed above are shown at the end of this note.
116
IAS 19R Employee Benefits
The calculations used for IAS 19R disclosures have been based on the most recent actuarial valuations and updated by the
Group’s actuaries to take account of the requirements of IAS 19R in order to assess the liabilities of the Pension Plans at
31 December 2014. Plan assets for the four schemes are stated at their market value at 31 December 2014.
Similar financial assumptions have been used for each of the four schemes to calculate scheme liabilities under IAS 19R, as below.
Note that the Consumer Price Index (CPI) measure of inflation has been applied where the rules of the schemes permit.
Rate of increase in salaries
Rate of increase of pensions in payment
– RPI
– max 5%
– max 2.5%
– CPI
– max 5%
– max 2.5%
Discount rate
Inflation assumption
– RPI
– CPI
2014
%
3.10
At 31 December
2013
%
3.40
2012
%
2.80
3.10
2.50
3.40
2.50
3.00
2.50
2.35
2.35
3.50
2.65
2.50
4.60
2.05
2.05
4.50
3.10
2.35
3.40
2.65
2.80
2.05
2014
£000
32,349
16,999
13,790
13,790
607
2,168
7,025
86,728
At 31 December
2013
£000
30,497
6,005
25,836
6,558
395
2,686
7,032
79,009
2012
£000
26,167
5,013
24,695
5,234
74
5,234
7,298
73,715
The weighted average duration of the four pension schemes is 19 years.
Combined scheme assets
Equities
Gilts
Bonds
Hedge fund
Property
Cash
Group pension contracts
Total market value of assets
The assets shown above are mostly held in funds which in turn may invest in quoted assets. The schemes have no material direct
investments in quoted markets.
Amount recognised in the balance sheet in respect of the Group’s retirement benefit obligations
2014
£000
86,728
(126,124)
(1,955)
(183)
(41,534)
8,316
(33,218)
Total market value of assets as shown above
Actuarial value of liability
Restrictions on asset recognised
Overseas retirement benefit obligation
Net liability recognised in the balance sheet
Related deferred tax asset
Pension liability net of related deferred tax asset
At 31 December
2013
£000
79,009
(103,604)
(1,867)
(209)
(26,671)
5,358
(21,313)
2012
£000
73,715
(103,613)
(1,500)
(196)
(31,594)
7,271
(24,323)
The plan assets do not include any of the Group’s own financial instruments, nor any property occupied by, or other assets used by the
Group. For the Charles Taylor & Co Limited Retirement Benefits Scheme and the Richards Hogg Pension & Life Assurance Scheme,
the expected return reflects the long-term asset allocation of the Trustees. For the Charles Taylor & Co Limited Retirement Benefits
Scheme, the composite expected return is derived from FTSE-Actuaries Gilt indices and from indices published by Merrill Lynch as at
the measurement date. For the Richards Hogg Pension & Life Assurance Scheme, the Trustees’ investment consultants have provided
a best-estimate return assumption based on market conditions as at the measurement date. The ER Lindley & Co Ltd Pension Plan and
the Wm. Elmslie & Sons 1972 Pension & Life Assurance Fund are both invested in insurance contracts. The asset that the Company
can recognise in respect of the WM Elmslie & Sons 1972 Pension & Life Assurance Fund, has been restricted.
117
Amounts recognised in profit or loss in respect of the Group’s retirement benefit obligations
Year to 31 December
2013
2014
£000
£000
169
143
355
504
524
647
1,378
1,139
1,902
1,786
Current service cost
Administrative expenses
Current service cost
Net interest on the defined benefit liability
The charge for the year is included in administrative expenses in the income statement. The actual return on plan assets was 9.9%
(2013: 8.4%).
Analysis of amount recognised in the Consolidated Statement of Comprehensive Income
Year to 31 December
2013
2014
£000
£000
2,853
4,163
(484)
(1,996)
971
(20,396)
—
1,296
(301)
(3)
3,039
(16,936)
(1,929)
2,978
1,110
(13,958)
Return on plan assets excluding interest expense
Experience losses on liabilities
Changes in financial assumptions
Changes in demographic assumptions
Change in effect of asset ceiling excluding interest expense
Actuarial (loss)/profit recognised
Movement in deferred tax
Net (loss)/gain recognised
The cumulative amount of actuarial losses recognised in other comprehensive income is £41.4m (2013: £26.5m).
Change in the present value of the defined benefit obligation
Year to 31 December
2013
2014
£000
£000
103,613
103,604
169
143
355
504
4,616
4,687
(1,090)
20,396
—
(1,296)
484
1,996
55
44
(4,598)
(3,954)
103,604
126,124
Defined benefit obligation at 1 January
Service cost
Administration cost
Interest cost
Remeasurement – financial assumptions
Remeasurement – demographic assumptions
Remeasurement – experience adjustments
Member contributions
Benefits paid
Defined benefit obligation at 31 December
Change in the fair value of plan assets
Year to 31 December
2013
2014
£000
£000
73,715
79,009
3,238
3,633
2,919
4,163
3,680
3,833
55
44
(4,598)
(3,954)
79,009
86,728
Fair value of plan assets at 1 January
Interest income
Return on assets less interest income
Contributions by employer
Member contributions
Benefits paid
Fair value of plan assets at 31 December
118
Mortality assumptions
Investigations have been carried out within the past three years into the mortality experience of the Group’s defined benefit schemes.
These investigations concluded that the current mortality assumptions include sufficient allowance for future improvements in
mortality rates. The assumed life expectations on retirement at age 65 are:
Retiring today:
Males
Females
Retiring in 20 years:
Males
Females
2014
years
2013
years
2012
years
23.7
24.9
22.2
24.4
22.1
24.4
25.1
26.4
23.4
25.5
23.3
25.5
Sensitivity analysis
The key assumptions used in the IAS 19R valuation are detailed above. The sensitivities regarding these assumptions are shown
below.
Assumption
Discount rate
Longevity
Inflation rate
Change in assumption
Indicative effect on the scheme’s liabilities
Increase/decrease by 0.25%
Increase by one year
Increase/decrease by 0.25%
Decrease/increase by 5%
Increase by 4%
Increase/decrease by 2%
The sensitivities consider the impact of the single change shown, with the other assumptions assumed to be unchanged. The inflation
sensitivities allow for the consequential impact on the salary increase, statutory deferred revaluation and pension increase
assumptions. The sensitivity analyses have been determined based on a method that extrapolates the impact on the defined benefit
obligation as a result of reasonable changes in key assumptions occurring at the end of the reporting period. In practice, making two of
the changes shown would not make the overall results the sum of the two sensitivities, due to the interdependence of the assumptions.
The Group expects to contribute approximately £4.6m to its defined benefit plans in 2015.
30. Related party transactions
Balances and transactions between the Company and its subsidiaries, which are related parties, have been eliminated on consolidation
and are not disclosed in this note.
Transactions with the associate undertaking including amounts due from and owed to the undertaking are disclosed in notes 16, 18 and
19. Transactions and balances with the Charles Taylor Employee Share Ownership Trust are shown in the note below the
Consolidated Statement of Changes in Equity.
The remuneration of directors is disclosed in the Directors’ Remuneration Report and in note 5. Certain employees of the Group are
members of one of the four defined benefit schemes operated by the Group, of which details are given in note 29.
119
31. Principal subsidiaries
The subsidiaries listed below are included in the consolidated financial statements.
The main trading activities are the provision of specialist insurance management services to mutual associations and captive insurance
companies, claims consulting and average adjusting, third-party claims administration, risk assessment services, insurance and
insurance support services. The principal place of business is the same as the place of incorporation/establishment unless otherwise
indicated.
Principal place
of business
Subsidiary
Charles Taylor Adjusting (Australia) Pty Limited
Charles Taylor & Co. (Bermuda)
Charles Taylor Consulting (Hamilton)
CTC Insurance Management (Bermuda) Limited
Charles Taylor Broker Services Limited
Lansdowne Insurance Company Limited
Wyndham Insurance Company (SAC) Limited
Charles Taylor Consultoria do Brasil LTDA
Charles Taylor Consulting Services (Canada) Inc
Anson Adjusters & Surveyors Co. Limited
Charles Taylor S.A.S.
Charles Taylor Adjusting SARL
Charles Taylor Broker Services Limited
Bestpark International Limited
Cardrow Insurance Limited
Charles Taylor & Co. Limited
Charles Taylor Adjusting Limited
Charles Taylor Administration Services Limited
Charles Taylor Aviation (Asset Management) Limited
Charles Taylor Insurance Services Limited
Charles Taylor Investment Management Company Limited
Charles Taylor KnowledgeCenter Limited
Knowles Loss Adjusters Limited
Charles Taylor Services Limited
Richards Hogg Lindley (Hellas) Limited
Richards Hogg Lindley (India) Limited
PT Radita Hutama Internusa
Beech Hill Insurance Limited
Charles Taylor Insurance Services (Ireland) Limited
LCL International Life Assurance Company Limited
LCL Life & Pensions Limited
Charles Taylor Insurance Services (IoM) Limited
Charles Taylor (Japan) Limited
Charles Taylor Marine SDN Bhd1
Charles Taylor Consulting Mexico SA de CV
Charles Taylor Holdings BV
Charles Taylor Adjusting Qatar Ltd
Charles Taylor Mutual Management (Asia) Pte. Limited
Charles Taylor Adjusting Saudi Arabia Limited
Greece
India
Overseas Adjusters and Surveyors Co. Limited
Charles Taylor P&I Management (Americas) Inc
CTC Americas Inc
LAD (Aviation) Inc
RJA Ltd
Signal Administration Inc
1
Place of
incorporation/
establishment
Australia
Bermuda
Bermuda
Bermuda
Bermuda
Bermuda
Bermuda
Brazil
Canada
China
Colombia
France
Great Britain
Great Britain
Great Britain
Great Britain
Great Britain
Great Britain
Great Britain
Great Britain
Great Britain
Great Britain
Great Britain
Great Britain
Hong Kong
Hong Kong
Indonesia
Ireland
Ireland
Isle of Man
Isle of Man
Isle of Man
Japan
Malaysia
Mexico
Netherlands
Qatar
Singapore
Kingdom of
Saudi Arabia
Taiwan
USA
USA
USA
USA
USA
Percentage of
equity share
capital
100
100
100
100
100
100
100
100
100
70
100
100
100
50
99
100
100
100
100
100
100
100
100
100
100
100
78
100
100
100
100
100
100
100
100
100
49
100
60
85
100
100
100
100
100
Direct holdings.
Associate undertakings
Korhi Average Adjusters & Surveyors Limited
Activities
All holdings are indirect, except where indicated.
120
Principal place
of business
Place of
incorporation/
establishment
South Korea
Percentage of
equity share capital
30
32. Non-recurring costs
In the prior year the directors removed certain costs from the business in order to improve operational efficiency. The £0.2m cost
incurred to date represents further restructuring costs arising from the reduction of headcount in certain business segments. The
directors consider these costs to be of a non-recurring nature.
33. Capital commitments
There were no capital commitments at 31 December 2014 (2013: none).
34. Contingent liabilities
There are no material contingent liabilities requiring disclosure.
35. Events after the balance sheet date
These events are detailed in the Directors’ Report.
121
Five Year Record
2010
£000
Consolidated income statement
Revenue
Operating profit before amortisation of goodwill and gain on bargain purchases
Gain on bargain purchases
Operating profit
Net other charges
Profit before tax
Income tax expense
Profit for the year
Customer relationships amortisation
Non-recurring costs
Adjusted profit for the year
Attributable to non-controlling interests
Attributable to owners of the Company
Earnings and dividends
Earnings per ordinary share – statutory basic
– adjusted
Dividends per ordinary share
Cover for ordinary dividends (adjusted)
Consolidated balance sheet
Non-current assets
Net current assets
Non-current liabilities and provisions
Net assets
Share capital and share premium
Capital and merger reserves
Retained earnings
Own shares
Non-controlling interests
Total equity
Year to 31 December
2011
2012
£000
£000
(restated)
2013
£000
2014
£000
99,127
14,071
543
14,614
(2,133)
12,481
(1,898)
10,583
2,090
—
12,673
(3,849)
8,824
102,459
8,499
—
108,203
8,374
—
113,578
8,484
—
122,759
11,103
—
8,499
(2,120)
6,379
(1,813)
4,566
1,805
1,027
7,398
557
7,955
8,374
(1,745)
6,629
(1,702)
4,927
1,282
—
6,209
1,163
7,372
8,484
(1,576)
6,908
(1,369)
5,539
1,181
1,627
8,347
268
8,615
11,103
9,566
(1,165)
8,401
1,527
211
10,139
(190)
9,949
16.8p
22.0p
10.0p
2.2x
12.8p
19.9p
10.0p
2.0x
15.1p
18.3p
10.0p
1.8x
14.2p
20.0p
10.0p
2.0x
19.5p
23.2p
10.8p
2.1x
2010
£000
2011
£000
At 31 December
2012
£000
2013
£000
2014
£000
71,144
73,208
(66,912)
77,440
67,455
75,567
(74,253)
68,769
64,230
54,324
(61,943)
56,611
63,310
69,489
(72,126)
60,673
68,466
76,019
(89,809)
54,676
31,038
7,534
2,432
(310)
36,746
77,440
31,038
7,534
(6,340)
—
36,537
68,769
31,038
7,534
(3,684)
(385)
22,108
56,611
33,119
7,534
(1,378)
(433)
21,831
60,673
36,084
7,534
(10,699)
(223)
21,980
54,676
2012 figures have been restated for IAS 19R.
This Annual Report and Accounts contains certain forward-looking statements. By their nature, forward-looking statements involve
risks and uncertainties because they relate to events and depend on circumstances that will or may occur in the future. Actual results
may differ from those expressed in such statements, depending on a variety of factors, including demand and pricing; operational
problems; general economic conditions; political stability and economic growth in relevant areas of the world; changes in laws and
governmental regulations; exchange rate fluctuations and other changes in business conditions; the actions of competitors and other
factors.
122
Shareholder information
Analysis of shareholdings
The tables below show an analysis of ordinary shareholdings as at 31 December 2014.
Individuals
Bank or Nominees
Other corporations
Number of shares held:
1 to 5,000
5,001 to 10,000
10,001 to 50,000
50,001 to 250,000
250,001 to 1,000,000
1,000,001 to 2,000,000
2,000,001 to 5,000,000
Shares
5,510,922
34,486,451
3,432,237
43,429,610
Percentage
12.7%
79.4%
7.9%
100.0%
Holdings
527
272
24
823
Percentage
64.0%
33.0%
3.0%
100.0%
733,473
723,489
2,423,359
6,134,373
10,549,303
6,005,451
16,860,162
43,429,610
1.7%
1.7%
5.6%
14.1%
24.3%
13.8%
38.8%
100.0%
539
97
108
49
20
4
6
823
65.5%
11.8%
13.1%
6.0%
2.4%
0.5%
0.7%
100.0%
Shareholder enquiries
The Company’s Registrar is Computershare Investor Services PLC. Enquiries relating to the following administrative matters should
be addressed to the Company’s Registrar: Computershare Investor Services PLC, The Pavilions, Bridgwater Road, Bristol BS99 6ZZ.
Tel: 0870 889 4020.
•
Dividend reinvestment plan.
•
Dividend payment enquiries.
•
Dividend mandate instructions. Dividends may be paid directly into your bank or building society account on completion of a
mandate instruction form. Tax vouchers are sent to the shareholder’s registered address.
•
Loss of share certificates/dividend warrants/tax vouchers.
•
Notification of change of address.
•
Transfer of shares to another person.
•
Amalgamation of accounts. If you receive more than one copy of the annual report, you may wish to amalgamate your accounts
on the share register.
Internet and telephone share dealing service
www.computershare.com/sharedealingcentre
Tel: 0870 703 0084
Investor centre
As a part of our commitment to improve shareholder communications we offer a free and secure website, managed by our Registrar
Computershare Investor Services PLC. Managing your shares online means you can access information quickly, securely and
minimise postal communications.
To register visit www.investorcentre.co.uk – all you will need is your registered address details and your Shareholder Reference
Number which you will find on your certificate/tax vouchers.
123
You will be given instant access to:
•
View portfolio balances and the market value of all your holdings registered with Computershare
•
Update your address
•
Register to receive electronic shareholder communications
•
Download forms
Computershare will also send a unique activation code to your registered address, which you can use to:
•
Update your bank details
•
View and manage your dividend payments
•
Access your electronic tax vouchers
•
View your holding’s transactional history
For other enquiries relating to shareholder services or general enquiries about the Company, please contact: The Company Secretarial
Department, Charles Taylor plc, Standard House, 12–13 Essex Street, London WC2R 3AA. Tel. 020 3320 8888.
The Charles Taylor plc website
Shareholders are encouraged to visit our website www.ctplc.com for further information about the Company. The dedicated investors
section on the website contains information specifically for shareholders including regulatory announcements and copies of the latest
and past accounts.
Share price information
The Company’s share price appears in various UK national newspapers including the Daily Telegraph and The Independent under
“Support Services” and appears on various financial websites under the sector “Business Support Services” and code CTR.
Dividends and tax on dividends
Dividend information can be found in the Directors’ Report on page 62.
Non-taxpayers may be able to claim back from HMRC some or all of the tax paid by the Company on their cash dividend payments.
The dividend tax voucher will be required when making a claim.
Unsolicited mail
As the Company’s share register is, by law, open to public inspection, shareholders may receive unsolicited mail from organisations
that use it as a mailing list. To limit the amount of unsolicited mail you receive, write to the Mailing Preference Service, MPS Freepost
LON 20771, London, W1E 0ZT or visit the website at www.mpsonline.org.uk/mpsr.
Financial Diary
Annual General Meeting
7 May 2015
Half Year results announcement
28 August 2015
Second interim dividend for 2014
Ex-dividend
26 March 2015
Record date
27 March 2015
Payment due
24 April 2015
These dates are indicative only and may be subject to change.
124
Interim dividend for 2015
Ex-dividend
15 October 2015
Record date
16 October 2015
Payment date
27 November 2015
Charles Taylor offices
We have around 1,200 staff in 67 offices spread across 27 countries
Europe and Middle East
France
Greece
Isle of Man
Monaco
Qatar
1.
Republic of Ireland
Kingdom of
Asia Pacific
Australia
China
Saudi Arabia
India
UAE
UK
Indonesia
Japan
Malaysia
Americas
Philippines
Republic of Korea1
Singapore
South Africa
Bermuda
Brazil
Taiwan
Vietnam
Colombia
Mexico
USA
Canada
Associated undertaking
Further information about Charles Taylor can be found on our website at www.ctplc.com, or by contacting one of our offices
on the telephone numbers listed below.
Head Office
Australia
Belgium
Bermuda
Brazil
Canada
London Standard House
Brisbane
Melbourne
Perth
Sydney
Brussels
Hamilton (Mutual management)
Hamilton (Captive management)
Rio de Janeiro (Adjusting)
Rio de Janeiro (P&I)
Calgary
Halifax
St. John’s
Toronto
Vancouver
125
Telephone No
(+44) 20 3320 8888
(+61) 7 3839 9999
(+61) 3 9653 9594
(+61) 8 9321 2022
(+61) 2 9025 3532
(+32) 54 319 872
(+1) 441 292 3103
(+1) 441 295 8495
+55 (21) 37 36 36 52
+55 (21) 37 36 36 53
(+1) 403 266 3336
(+1) 902 835 7600
(+1) 709 726 7750
(+1) 416 640 6022
(+1) 604 566 9907
China
Colombia
France
Greece
India
Indonesia
Republic of Ireland
Isle of Man
Japan
Republic of Korea
Malaysia
Mexico
Monaco
Philippines
Qatar
Kingdom of Saudi Arabia
Singapore
South Africa
Taiwan
United Kingdom
(KLA = Knowles Loss Adjusters offices)
United Arab Emirates
126
Beijing
Hong Kong
Shanghai
(+86) 1350 116 9022
(+852) 2399 6100
(+86) 6888 3101
Bogota
Barranquilla
Cali
Medellin
Paris
Piraeus (P&I)
Piraeus (Adjusting)
Mumbai
Balikpapan
Jakarta
Surabaya
Dublin
Douglas
Tokyo
Seoul
Busan
Selangor
Mexico City
Monaco
Manila
Doha
Jeddah
Riyadh
Singapore (P&I)
Singapore (Aviation)
Singapore (Energy)
Singapore (Marine)
Johannesburg
Taipei
Aberdeen
Basingstoke (KLA)
Belfast (KLA)
Birmingham (KLA)
Bury (KLA)
Cardiff (KLA)
Chelmsford (KLA)
Glasgow
Glasgow (KLA)
Liverpool
London Leadenhall Street
London Portsoken Street
London St John’s Square (KLA)
London Standard House
Newcastle
Newcastle (KLA)
Ringwood, Hampshire
Sheffield (KLA)
Dubai
(+57) 1 746 0106
(+57) 1 746 0106
(+57) 1 746 0106
(+57) 1 746 0106
(+33) 153 430 030
(+30) 210 429 0733
(+30) 210 429 1300
(+91) 22 2283 5851
(+62) 542 7213 794
(+62) 21 515 2084
(+62) 31 827 3240
(+353) 16 766 634
(+44) 1624 683 699
(+81) 3 5297 4700
(+82) 2 752 1891
(+82) 2 752 1891
(+60) 3 7781 2260
(+52) 55 3000 1880
(+377) 9999 5300
(+44) 20 3320 2269
(+974) 4436 8254
(+966) 11472 4728
(+966) 1 472 4728
(+65) 6506 2896
(+65) 6506 2894
(+65) 6506 2891
(+65) 6506 2897
(+44 1425 480 333)
(+886) 2 2706 6509
(+44) 1343 850 465
(+44) 125 633 6241
(+44) 289 067 1099
(+44) 167 546 6441
(+44) 161 705 4358
(+44) 292 023 6060
(+44) 124 534 7496
(+44) 141 221 2992
(+44) 141 883 8771
(+44) 151 227 2175
(+44) 20 7623 1819
(+44) 20 7767 2700
(+44) 20 7336 8500
(+44) 20 3320 8888
(+44) 191 232 2745
(+44) 191 251 8279
(+44) 1425 480 333
(+44) 114 275 7030
(+971) 4 335 6490
United States of America
Dallas, TX (Signal)
Dallas, TX (Risk consulting)
Dallas, TX (Aviation)
Houston, TX
Long Beach, CA
Miami, FL
New York, NY (P&I)
New York, NY (Adjusting)
North Babylon, NY
San Francisco
Wilton, CT
127
(+1) 972 770 1480
(+1) 972 447 2055
(+1) 972 447 2050
(+1) 713 840 1642
(+1) 562 437 8100
(+1) 954 447 9840
(+1) 212 809 8085
(+1) 212 809 8082
(+1) 631 285 6934
(+1) 415 233 1121
(+1) 203 761 6060
Notes
128
Charles Taylor is a leading provider of professional services to clients across the global insurance market. We have been
providing such services since 1884 and today we employ over 1,200 permanent staff in 67 offices spread across 27 countries in
the UK, the Americas, Asia Pacific, Europe and the Middle East.
Charles Taylor plc
Standard House
12–13 Essex Street
London WC2R 3AA
T: +44 20 3320 8888
F: +44 20 3320 8800
E: [email protected]
www.ctplc.com
129


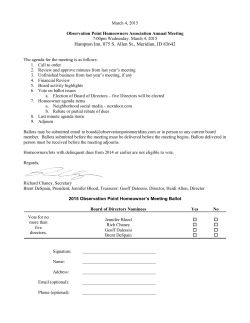


© Copyright 2026