
For personal use only
Annual Report For the year ended 31December 2014
For personal use only
Buru Energy Limited
www.buruenergy.com
Annual Report
2014
Buru Energy Limited
1
Annual Report
For the year ended 31 December 2014
ABN 71 130 651 437
Contents
1
Executive Chairman’s Report
2
Business Review
4
Operations Review
7
For personal use only
Corporate Register Corporate Governance Statement
13
Directors’ Report
21
Remuneration Report
28
Independent Auditor’s Declaration
40
Consolidated Statement of Financial Position
41
Consolidated Statement of Profit or Loss and Other Comprehensive Income
42
Consolidated Statement of Changes in Equity
43
Consolidated Statement of Cash Flows
44
Notes to the Financial Statements
45
Directors’ Declaration
83
Independent Audit Report
84
Additional ASX Information
86
Front cover: Enerdrill workover rig at Ungani production site
Corporate Register
as at 28 February 2015
Shares on issue:
339,997,078
Unlisted options:
6,400,000
Share Appreciation Rights:3,486,547
For personal use only
Directors
Mr Eric Streitberg
Executive Chairman
Hon Peter Jones
Independent Non-executive Director
Ms Eve Howell
Independent Non-executive Director
Mr Robert Willes
Independent Non-executive Director
Company Secretary
Mr Shane McDermott
Registered and Principal Office
Auditors
Level 2
88 William Street
PERTH WA 6000
Telephone: +61 (08) 9215 1800
Facsimile: +61 (08) 9215 1899
KPMG
235 St George’s Terrace
PERTH WA 6000
Share Registry
Link Market Services Limited
Locked Bag A14
SYDNEY SOUTH NSW 1235
Telephone:
1800 810 859 (Within Australia)
+61 (02) 8280 7211 (Outside Australia)
Email:
[email protected]
Website: www.linkmarketservices.com.au
Bankers
Commonwealth Bank of Australia
1230 Hay Street
WEST PERTH WA 6005
Stock Exchange
Australian Securities Exchange
Exchange Plaza
2 The Esplanade
PERTH WA 6000
ASX Code: BRU
ANNUAL REPORT 2014
1
Executive Chairman’s Report
Dear Shareholder,
For personal use only
I am pleased to present the Company’s Annual Report for
the 2014 calendar (and Buru Energy’s financial) year.
In 2014 the Company made major advances in its exploration
and development programs despite the fact that it was a
tumultuous and difficult year with the collapse in oil prices, very
weak share market conditions for junior oil and gas companies
and major Board and management changes.
The Ungani oilfield production test outperformed expectations,
major 2D and 3D seismic programs were acquired with very
positive results emerging from the data, and a revolutionary
advance was made in reducing exploration drilling costs. During
the year, the Company also received all regulatory approvals
required for its tight gas exploratory evaluation program after
undertaking a full and transparent consultation process that
included the extensive involvement of independent experts and
the sourcing of world class technical expertise. The initial work
on the evaluation of the tight gas resources in the Company’s
portfolio was undertaken once these approvals were obtained.
As the market conditions changed your new Board moved
quickly to put in place a strategy for financial security; raising
$31.1 million (before costs) in new equity at $0.75 per share,
reducing discretionary expenditure, substantially reducing
staff numbers and reorganising the Company’s management
structure.
These initiatives were necessary to ensure the Company is
able to build on its successful program in 2014 and continue
to explore its world class Canning Basin exploration acreage,
and also continue to progress the development of the Ungani
oilfield. It is also very encouraging that recent technical
work, building on the data acquired during the 2014 seismic
acquisition program, has confirmed the prospectivity of the
basin for conventional oil, and for conventional and tight gas
and liquids.
2
BURU ENERGY LIMITED
A major operational and technical focus during the year was
to achieve more cost effective exploration outcomes. This
was very successful with a step change in drilling costs being
achieved through the use of rigs with smaller operational
and environmental footprints. This has the potential to
transform the exploration of the basin, particularly for shallow
conventional oil targets similar to Ungani.
The reduction of exploration risk was a further focus. This
program has included the acquisition of 3D seismic and
airborne gravity and magnetic data which has proven very
effective in delineating Ungani style targets. Together with
the reduction in drilling costs, this will lead to more wells
being drilled and a substantially higher chance of success of
finding additional oil pools. This is a systematic exploration
approach which is particularly appropriate for exploration for
Ungani “lookalikes” along what is a now a well-defined trend.
Continued technical work has also identified numerous other
play types in the basin that are prospective for conventional
oil plays, including the Paradise area and sub-salt plays to the
southeast of Ungani.
The evaluation of the Ungani oilfield under a test production
program continued during the year with excellent results. The
test program is now essentially complete, although significant
uncertainties remain in the size of the resource, principally
in regard to ultimate recovery factors and the number and
configuration of wells required for full development. The next
phase of the development is planned to be an upgrade to
the facilities for future production and the acquisition of the
Production Licence for the field to allow continued production
under the appropriate regulatory regime. This requires the
Company, amongst other things, to come to an agreement with
the native title parties on whose land the Production Licence
application blocks lie. This process has been ongoing for over
two years and has been complicated by the changes in Company
management and the changes in advisers to the native title
parties. However, these negotiations are nearing completion and
once concluded will allow production from the field under the
appropriate Western Australian petroleum legislation.
For personal use only
Executive Chairman’s Report
These initiatives were necessary to ensure the
Company is able to build on its successful program in
2014 and continue to explore its world class Canning
Basin exploration acreage and also continue to progress
the development of the Ungani oilfield.
The appraisal of the world class tight wet gas resources in the
basin has continued with planning for a hydraulic stimulation
(frac) program in 2015. Initial work for this program was
completed during 2014 and it is planned to undertake a more
comprehensive program during the 2015 dry season. Very
extensive reviews and consultations for this program have been
undertaken, including independent scientific reviews for the
native title groups on whose land activity is planned, or who
have an interest in the program. Despite these reviews and
consultations, there has been opposition from activist groups
who reflect the views of groups who are opposed to the use of
fossil fuels. The Company will continue to consult and ensure
transparency in its operations as it moves forward with its
evaluation program which will include both the tight gas and
conventional gas resources of the basin.
Looking forward, the exploration and development of the
Canning Basin is the focus of the joint venture and this will be
undertaken in a systematic and cost effective way. The basin
remains one of the least explored in Australia with some of the
highest potential. Buru Energy controls the most prospective
parts of the basin and this provides the opportunity for very
substantial value accretion going forward.
Your Board and management have the depth of skills and
experience required to ensure that this value is realised and I
would like to thank the staff of the Company who have tirelessly
and enthusiastically supported the business through this
challenging transition period and who approach the coming
year with enthusiasm and determination for the Company to
succeed. I would also like to thank all our shareholders and all
other stakeholders for their ongoing support.
ANNUAL REPORT 2014
3
Business Review
For the year ended 31 December 2014
Corporate Summary
Current Issued Capital
For personal use only
Fully paid ordinary shares
339,997,078
Options (Unlisted – Employees)
6,400,000
Share Appreciation Rights (Unlisted – Employees)
3,486,547
Trading History
Share price range during 2014
Liquidity (annual turnover as % of average issued capital)
Average number of shares traded per month
Location of the Company’s Assets
4
BURU ENERGY LIMITED
$0.375 to $2.10
80.64%
~ 20.75 million
Business Review
For the year ended 31 December 2014
For personal use only
Principal Assets
Buru Energy Limited (“Buru Energy”) or (“the Company”) holds
a very substantial exploration and production portfolio in the
onshore Canning Basin of Western Australia. These holdings
provide the Company with the following factors for success:
•
An extensive basin wide acreage spread in the most
underexplored onshore Australian basin
•
Significant oil and gas potential in conventional reservoirs
with the Ungani oilfield under current development
•
A multi TCF basin wide tight wet gas resource with high
liquids content
•
Major international partners - Mitsubishi Corporation
(“Mitsubishi”) and Apache Onshore Holdings Pty Ltd
(“Apache”)
•
High permit equities and operatorship of core acreage
•
A State Agreement which provides long term tenure over
core acreage
Shareholder Communications
Under its ASX disclosure obligations and generally in regard to
shareholder communication, Buru Energy provides shareholders
with all relevant and price sensitive information during the year.
These communications include regular shareholder updates
and quarterly and half yearly reporting obligations. All this
information is made available on the Company’s website (www.
buruenergy.com) which also contains details of the Company’s
general activities. Consequently, this report in accordance
with ASX recommended corporate governance practices, also
sets out for shareholders the Company’s business philosophy,
economic and financial condition, and future prospects. It also
includes a brief review of the Company’s operations during the
last financial year, as these are set out in detail in the quarterly
and half yearly reports of the Company on the Company’s
website, and in the regular corporate update presentations.
The Company’s Business Philosophy and Strategy
Buru Energy is committed to delivering value to its shareholders,
traditional owners, the community and our employees through
responsible, safe, innovative and cost effective exploration,
development and production of our assets. We do this
through integrity in our actions and decisions and by actively
participating in and supporting the communities within which
we operate.
Buru Energy respects the traditional owners in the areas in which
it operates, their culture, law and leadership, and will always
strive to demonstrate that respect in all aspects of our business.
The Company’s immediate strategy is to progress the
development of the Ungani oilfield into full scale production, to
complete an appraisal program of the Laurel Wet Gas project,
and to continue an active seismic acquisition and drilling
exploration program for conventional oil and gas prospects,
with an initial focus on the Ungani oil trend.
Funding, Commitments and Prospects
The funding requirements of the Company are continuously
reviewed through detailed internal cash flow models that are
continuously updated for external and internal factors. The
internal cash flow models are also used to review and to test
investment decisions including exploration and development
decisions.
Formal control over the Company’s activities is maintained
through a budget and cash flow monitoring process with
annual budgets considered in detail by the Board and forming
the basis of the Company’s strategy.
Cash flows are tested under various scenarios to ensure
that expenditure commitments are able to be met under
all reasonably likely scenarios, and sufficient exploration
expenditure is able to be budgeted to ensure a realistic
probability of success of finding oil and gas. Expenditures
are also carefully monitored with more stringent expenditure
controls and oversight introduced during the year, including a
flattened and more accountable management structure.
The current oil price and the early stage of development
of the Company’s producing assets means that it is not yet
generating sufficient net revenue to support its exploration
and development plans, and therefore still requires equity
from shareholders at appropriate times to accelerate the
development of its projects.
The Company’s longer term prospects are dependent on its
ability to cost effectively develop and produce its existing
resources and its ability to be successful in its exploration
programs.
Success in these endeavors is reliant on sufficient cash being
available, and also on the skills and experience of the Buru
Energy team. During the year very significant reductions in staff
numbers were implemented through redundancies, and the
Company’s management structure was reorganised to increase
individual accountability and reduce “siloing”. These measures
have resulted in a more cost and results focused team which has
the capability to deliver the required results.
ANNUAL REPORT 2014
5
Business Review
For the year ended 31 December 2014
Business Risk Management
The Board of the Company aspires to best practice in corporate
governance and the ASX core principles of corporate
governance have been integrated into the governance policy of
the Company together with specific principles for Buru Energy.
The detailed compliance system of the Company is set out in the
Corporate Governance Statement of this report.
Management of business risk, particularly exploration and
operational risk, is an essential component of success for
resource companies. The current operating environment
is particularly stringent in respect of environmental and
community standards and this is a major focus of the Company’s
compliance activities including the maintenance of a “social
licence to operate”.
For personal use only
Corporate Governance
The Board has a majority of independent Directors (three out of
four), however, the Chairman is not independent as he is a major
shareholder and executive of the Company. This situation does
not comply with the Company’s Board Charter and has arisen
subsequent to the withdrawal of the previous Chairman from
re-nomination at the Company’s 2014 Annual General Meeting,
and the subsequent resignation from the Company and the
Board of the Managing Director. These circumstances resulted
in the current Executive Chairman returning from executive
retirement to take up his current position.
The Board is seeking to recruit an additional suitably qualified
independent Director, and the transition to a Non-executive
Chairman will take place in due course at a time appropriate in
all the circumstances. More details on these matters are set out
in the Corporate Governance Statement.
Corporate Responsibility
The Company’s responsibilities to the community and its
shareholders are supported by codes of conduct and a number
of specific policies, the details of which are available on the
Company’s website.
The Company’s activities in the Canning Basin encompass
a large part of the southern and western Kimberley region
of northern Western Australia which was the birthplace of
Australian indigenous land rights movement. Buru Energy and
the traditional owners have access agreements that provide
protocols for exploration access over all of the Company’s permit
areas and are currently negotiating for an agreement over the
Company’s Production Licence applications for the Ungani
oilfield.
The Company has a strong commitment to assisting Aboriginal
people to achieve economic independence through
employment, business development and training, and gives
support to those activities that are sustainable in the
longer term.
6
BURU ENERGY LIMITED
The structured identification and management of risk across the
business also assists in optimising business processes as it leads
to focus on the value adding components of the business. The
Company manages risk through a formal risk identification and
risk management system, details of which are included in the
Corporate Governance Statement. The review of the Company’s
risk profile during the year identified additional risks associated
with its increased development and appraisal activity. However,
these risks are considered to be in the normal course of business
and the internal processes of the Company are considered
sufficient to manage them.
The Company’s internal commercial and financial risk
management system is subject to a process of continual review
and is also subject to Board oversight, and external audit.
Operations Review
For the year ended 31 December 2014
For personal use only
Operations Review
The Company’s activities during the year continue to be focused
on exploration and development of its petroleum exploration
permits and licences in the Canning Basin in the northwest of
Western Australia.
Production and Development
Ungani
The Ungani oilfield was producing under an Extended
Production Test (“EPT”) regime during the year to gather the data
needed to prepare a development plan for the field. The data
acquisition program under the EPT has now been substantially
completed and the field has been shut-in to allow for the
necessary upgrades to the facility to allow full field production
under a Production Licence. The oil was exported from the Port
of Wyndham and investigations for access to the Port of Broome
for export of oil were also undertaken during the year.
The production from the Ungani Extended Production Test to
date is as follows:
•
Production Test Phase 1 - 31 May 2012 to 30 March 2013: 101,278 bbls
•
Production Test Phase 2 - 9 December 2013 to 31 December
2014: 351,038 bbls
Nine shipments totalling 328,683 bbls from the Port of
Wyndham gave joint venture sales revenue of $30.2 million
(net to Buru Energy $15.1 million) for the year ended 31
December 2014. The oil has all been sold into Asian refineries
under the marketing agreement between Buru Energy and
Mitsubishi.
The upgrade of the Ungani facilities for permanent production
is being reviewed to ensure the new facilities are ‘fit for purpose’
and completed at lowest possible cost. The final facility design
is dependent on the predictions of reservoir performance that
are being calibrated with the results of the EPT.
Negotiations with the Nyikina Mangala and Yawuru native title
parties in relation to the Production Licence agreement for
Ungani have continued to progress.
Blina and Sundown
The Blina and Sundown oilfields remained shut-in during the
year with a review of forward operations at the fields being
continued.
Remediation of this area, which has been under the previous
ownership of seven different companies since the discovery
of oil in the area in 1981, continued. The Company took the
decision to cease production from the area in 2013 in order
to address the legacy issues, including the rehabilitation of
interceptor and evaporation ponds. The Company has worked
with the Department of Mines and Petroleum (“DMP”) to
prepare and implement an Environment Plan to address these
legacy issues, and during 2014 continued the remediation work
across the sites. An ongoing comprehensive water monitoring
program has not detected any evidence of groundwater
contamination in the area.
The full remediation program is expected to take up to a further
two years to complete and the field remediation operations will
be recommenced as soon as practicable in the dry season in the
second quarter of 2015.
The Company has made adequate provision for the costs of
this work.
ANNUAL REPORT 2014
7
Operations Review
For the year ended 31 December 2014
Drilling
Commodore 1
Ungani 3 was drilled as a stepout and appraisal well on the
Ungani oilfield. The well was drilled with the Crusader 405
specialised high capacity drilling rig. The rig was mobilised to
the Ungani 3 site in late 2013 and the well was spudded on 14
January 2014. The Ungani 3 well penetrated an oil saturated
Ungani Dolomite section some 20 metres higher than the
intersection in Ungani 1. However, the highly permeable
dolomite present in the central field area was not intersected at
the Ungani 3 location. Post well analysis of the Ungani 3 rotary
sidewall cores confirmed that the section was oil saturated, but
that the vugular porosity encountered in the previous wells
was less well developed at this location. Subsequent testing
operations recovered oil from the reservoir but further testing is
required to quantify the resources in the well.
Commodore 1 was the first well to be drilled as part of the
Apache farm out announced in November 2013. The cost of
the well was fully funded by Apache under the terms of the
farmout which includes a commitment by Apache to fund a
$25 million exploration program on EP 390, 438, 471 and 473.
The Commodore 1 well is located in exploration permit EP 390.
Buru Energy and Mitsubishi both have a 25% equity interest in
the well and in EP 390, with Apache having the remaining 50%
equity interest. The well is located some 140 kilometres to the
south of Broome and some 100 kilometres inland from the Great
Northern Highway.
For personal use only
Ungani 3
Ungani North 1
A production test of the Ungani North 1 well was undertaken
during the year. The Ungani North 1 well is located some six
kilometres north of the Ungani Production Facility. A completion
string was first run in the well with DDH1 Rig 31, and then some
30 metres of Ungani Dolomite section over the interpreted
oil column of approximately 46 metres was perforated for
production testing. The perforation was carried out with the
well underbalanced with a nitrogen cushion. Nitrogen lift
operations established fluid influx into the well at relatively low
rates with the fluid recovered being indicative of drilling fluid
filtrate from the original drilling operations and therefore not
diagnostic as to potential reservoir recovery. The results need
to be fully evaluated before further testing, and consequently
the well was temporarily suspended while the results are
evaluated and a forward program agreed with the joint venture.
The forward program is likely to include pumping the well to
attempt to remove the drilling fluid and ascertain the nature and
flow characteristics of the formation fluid.
8
Drilling operations at the Commodore 1 well commenced on
21 November 2014 and were completed on 23 December using
DDH1 Rig 31. The well was drilled to a total depth of 1,600
metres. Open-hole wireline logs acquired in the Lower Grant
Formation objectives confirmed no significant hydrocarbons
had been encountered in that section. The full section of
the Carribuddy Formation, the Bongabinni Shale and the
Nita Formation was then cored with excellent core recovery.
Although oil shows were noted in cores at several intervals, both
inspection of the cores and interpretation of the wireline logs
indicated there were no zones with producible hydrocarbons.
Consequently the well was plugged and abandoned. The next
well under the Apache farmout is Olympic 1 and this well is
planned to be drilled in the 2015 dry season.
Sunbeam 1
Following the completion of the Commodore 1 well, DDH1
Rig 31 was mobilised to the Sunbeam 1 well and drilling
operations at that well commenced on 25 January 2015 and
were completed on 11 February 2015. The Sunbeam 1 well is
located in exploration permit EP 129 and completion of the
well satisfied the Year 4 work commitment on that permit. Buru
Energy has a 100% equity interest in the well and in EP 129.
The well is located some 85 kilometres south east of Derby and
some 18 kilometres south of the Gibb River Road.
The primary objective Grant Formation channel fill sands were
encountered as prognosed but did not contain any significant
hydrocarbons.
The well has been suspended for possible re-entry and
deepening to the underlying Emanuel prospect during the
coming dry season. The Emanuel prospect is a Frasnian aged
reefal anomaly of a type that has not previously been tested in
the area.
BURU ENERGY LIMITED
Operations Review
For the year ended 31 December 2014
Seismic
For personal use only
Jackaroo 3D Seismic Survey
Acquisition of the Jackaroo 3D seismic survey commenced on
20 October 2014 and was completed on 30 November 2014.
The completed survey is some 224 sq km in area and it was
completed with no safety or environmental incidents.
The survey is located between the existing Yulleroo and Ungani
3D seismic grids and joins the two grids to give seamless 3D
coverage from Yulleroo to Ungani. It covers the currently
identified Jackaroo and Praslin prospects and a number of other
conventional oil prospects along trend.
Initial processing of the data has indicated that the data quality
of the 3D survey is good to excellent, and the anticipated
structural trends and prospects have been properly imaged. The
survey was acquired along survey lines that had been heritage
cleared by senior Yawuru, Nyikina Mangala and Karajarri cultural
advisers who physically inspected the survey lines in their
particular cultural areas.
The survey lines were prepared using techniques that minimise
disturbance to vegetation. Buru Energy staff and management,
together with the seismic contractor for the survey, Terrex Seismic,
have developed and refined these techniques over many years of
operations in Western Australia and they have been recognised
as leading practice in environmental management. Current
assessments indicate that the Company’s seismic lines have
strong regrowth after two wet seasons. The operations are also
overseen by the Western Australian Department of Mines and
Petroleum who require submission and approval, and subsequent
adherence to, a rigorous environment plan which is then
monitored and audited during operations. These environment
plans are publicly available documents.
2D seismic program
During the year, the Company also completed the acquisition
of the following 2D seismic surveys which were at both regional
and prospect scales.
Survey
The data quality is generally very good and the surveys have
defined a number of prospects and met their exploration
objectives. Both the 3D and 2D surveys were acquired on budget
and with no significant environmental or operational incidents.
Kilometres
Buru Energy share of expenditure
Commodore West 2D
123
Nil (Apache 100% farmin)
Mt Fenton 2D
112
41.67% (EP 458 JV)
Barbwire 2D
246
41.67% (EP 458 JV) and 10% (EP 476 Apache option)
Mt Rosamund 2D
507
10% (Apache option)
Total 2D surveys
988
ANNUAL REPORT 2014
9
Operations Review
For the year ended 31 December 2014
TGS (Laurel Formation Tight Gas Pilot
Exploration Program)
For personal use only
During the year, the Company received all regulatory approvals
required for the TGS program after undertaking a full and
transparent consultation process that included the extensive
involvement of independent experts and the sourcing of
world class technical expertise. These robust and thorough
consultations and approval programs have resulted in
transparent and fact based approvals for the program.
The extensive and iterative nature of these approvals also meant
that the operational timeframes for undertaking the program
were compressed, and it was not possible to commence initial
site and preparatory work until the approvals were received.
It was therefore necessary to undertake a full review of the
planned execution and timing of the program. The review
included operational considerations such as the availability of
specialised technical equipment, the ability to complete the
program prior to the wet season (including completing the
flow back and testing program), and the costs of the program
(which are affected by timing of the program and the ability
to complete it in a way that maximises efficient equipment
utilisation).
The results of this review led the joint venture to adopt a
three phased program. This phasing will ensure the program
is undertaken in the most cost effective way and will also
ensure the program meets all regulatory requirements and
environmental standards.
The Phase 1 activity for the Laurel Formation Tight Gas Pilot
Exploration Program was completed for the Asgard and Valhalla
North wells in late 2014. This phase of the program involved:
•
10
Wellsite preparation and civil works: These works included
the construction of the water holding and flowback water
retention ponds, flare pits, and associated civil works. These
civil works are to support the frac program planned for 2015.
•
Well conditioning: A coil tubing unit was used to
condition the well fluid in the well bore to an operationally
appropriate brine solution.
•
Cement bond logging: This was undertaken as a condition
of the approvals for the program to confirm previously
obtained data.
•
Conducting of “mini fracs” or Diagnostic Fracture Injection
Tests (DFITs): DFITs are routinely conducted as part of frac
program design and involve perforating a single zone,
injecting brine and then observing the resultant pressure
responses. The data from these mini fracs gave increased
confidence in the success of the planned fracs and will be
used to optimise the design of the main fracs to ensure they
provide definitive results at the lowest cost.
The program was carried out with no operational or
environmental incidents.
The Yungngnora People at Noonkanbah where these activities
took place were very supportive of this program of work and
provided assistance with all phases of the activities including:
Cultural inductions: All Buru Energy personnel and contractors
working on site attended cultural inductions and a welcome to
country from the Yungngnora people
Site activities: Up to 10 Yungngnora people were involved
in all operational aspects of the program including site
construction, well interventions and data gathering.
Groundwater monitoring: Four Yungngnora environmental
cadets assisted with all groundwater monitoring on their
country during the program. The cadets graduated with
a Certificate II in Conservation and Land Management at
Kimberley Training Institute in early December 2014.
TO Rangers: Koolkarriya rangers from Noonkanbah provided
access control and coordination onsite during operations at
both well sites.
Members of the Yungngnora community will remain actively
involved in the program including during the planned main
frac program next year. More than 20 community members are
participating in ongoing training for a Certificate II Resources and
Infrastructure Work Preparation and other certifications with the
Kimberley Training Institute (KTI).
BURU ENERGY LIMITED
Operations Review
For personal use only
For the year ended 31 December 2014
The completion of the program at Valhalla North and Asgard was
later than planned due to the late arrival of contractor equipment
and subsequent mechanical and electrical issues with this
contractor equipment. This later timing meant the window for
utilisation of the coil tubing unit and the wireline logging unit
from this particular contractor had the potential to be affected by
the onset of the wet season and they were therefore demobilised.
Consequently, preparatory works in the Yulleroo area requiring this
equipment were deferred to the 2015 dry season.
Phase 2 and Phase 3 are planned for 2015. Phase 2 is a planning,
validation and optimisation phase to ensure all operations
and logistics are optimised and all contracts are the most
cost effective. The design of the fracs will also be reviewed
incorporating the results from the DFITs to ensure the highest
probability of obtaining definitive results at the lowest cost.
Phase 3 will include mobilisation of the frac spread, undertaking
the fracs, and then a flow back period of up to three months to
ensure the data obtained will allow definitive decline curves to
be calculated.
Corporate
Share Placement and Share Purchase Plan
In September the Company raised a total of $31.1 million
of which $28.1 million (before costs) was via a placement of
12.5% of its equity capital to a new cornerstone shareholder
and existing institutional and sophisticated investors. $20
million of the placement was subscribed by Coogee Chemicals
Pty Ltd and its holding company, Chemco Pty Ltd (together
Coogee Chemicals), with the balance subscribed by existing
Buru Energy eligible sophisticated investors and institutional
shareholders. Following completion of the placement, Coogee
Chemicals became a substantial shareholder in Buru Energy. The
placement was at $0.75 per share which was a discount of 2% to
the closing price prior to the trading halt for the capital raising.
An accompanying Share Purchase Plan (“SPP”) at the same price
of $0.75 per share closed in October with a total of 3,986,550
new shares issued to 376 shareholders raising $3.0 million. The
combined share placement and SPP raised a total of $31.1
million before costs.
Acreage Management
During the year, the Company commenced a review and
rationalisation of its acreage portfolio in response to the
declining sharemarket and oil price environment. This included
the application for relinquishment of permits in remote areas
with high operating costs (EP 474), and the renegotiation
of permit work commitments, where appropriate, to ensure
exploration can be carried out in a systematic and orderly
manner.
The Company’s agreement with Backreef Oil Pty Limited for the
acquisition of a 50% interest in EP 487 came to an end on 31
December 2014. The parties originally executed the agreement
on 25 September 2012 with a requirement that the transfer
proceed by 31 December 2013, a date which was subsequently
extended to 31 December 2014. The transfer of the 50% interest
in EP 487 did not occur as required and the parties did not agree
to further extend the date for transfer, therefore the agreement
came to an end.
The removal of this permit from Buru Energy’s portfolio has no
material effect on its previously stated prospective tight gas
resources given their overall size. However, it also reduced the
Company’s contingent funding obligations by the $3.5 million
purchase price, any costs associated with the current litigation,
and the costs of early stage exploration activity on this permit.
Apache Acacia Option
In 2013, Apache was granted an option to earn a 40% interest
in exploration permits 472, 476 and 477, up to a 40% interest in
exploration permit 478 and up to a 50% interest in exploration
permit 474 in return for a non-refundable option fee equal
to the greater of $7.2 million, and 80% of the costs of various
exploration activities on these permits. The option fee was
received by the Buru Energy - Mitsubishi JV and was expended
on the exploration activity including seismic and aerogravity
acquisition.
Buru Energy has been informed by Apache that it does not wish
to exercise the option but as a result of the recent suspension
and extension of these permits, the joint venture is still
discussing the next steps for these permits. The agreement with
Apache in the Coastal Blocks is not affected by this decision.
ANNUAL REPORT 2014
11
Operations Review
For the year ended 31 December 2014
Yakka Munga Pastoral Lease
For personal use only
During the year the Company was successful in a tender for
the Yakka Munga pastoral lease that covers the area of the
Ungani oilfield. Settlement took place on 16 January 2015 with
a purchase price of $7 million. The Company intends to enter
into an arrangement with an experienced local cattle station
operator to manage the station and assist in co-ordination of
the station’s operations and the on-ground activity of the joint
venture. It has also been approached by parties interested in
participating in the lease and is considering these approaches.
Board Changes
In the period commencing from the appointment of
Dr Keiran Wulff as Managing Director on 14 January 2013,
Mr Eric Streitberg undertook duties as an Executive Director
focused on exploration and business development activity. He
subsequently relinquished his executive directorship of the
Company on 14 January 2014, and was appointed a Nonexecutive Director. At that time he also became entitled to a
contractual termination payment as part of his service with the
Company since its foundation in 2008. On 5 February 2014,
Non-executive Director Mr Austin Miller resigned from the Buru
Energy Board, for personal reasons. At the Company’s 2014 AGM
on 23 May 2014, Mr Graham Riley, the then Chairman, advised
that he did not wish to stand for re-election as a Director of
the Company. Mr Eric Streitberg was appointed as Executive
Chairman of the Company subsequent to the meeting. Two
Independent Non-executive Directors, Ms Eve Howell and Mr
Robert Willes, were subsequently appointed to the Board on
2 July 2014, and the then Managing Director of the Company,
Dr Keiran Wulff, entered into an agreement with the Company
under which he relinquished his executive position and resigned
as a Director of the Company as of 2 July 2014. Upon Dr Wulff’s
resignation, Mr Eric Streitberg assumed Dr Wulff’s duties as
Managing Director in his role as Executive Chairman.
The Board of the Company now comprises:
•
Mr Eric Streitberg Executive Chairman
•
Hon Peter Jones
Independent Non-executive Director
•
Ms Eve Howell
Independent Non-executive Director
•
Mr Robert Willes
Independent Non-executive Director
otherwise stated.
Board of Directors
The respective roles and responsibilities of both the Board and
management are set out in the Board Charter which can be
viewed in the corporate governance section of the Company’s
website www.buruenergy.com.
Roles and Responsibilities of the Board and Senior Executives
(ASX’s Recommendation 1.1, 1.2 & 1.3)
The Board is collectively responsible for the governance of the
Company and for promoting its success. The Board’s primary
purpose is to govern the Company on behalf of all shareholders.
The Board’s specific job outputs are to maintain a link between
the Company’s shareholders and its operations and to create
and maintain governance policies that address the broadest
levels of all decisions and situations. The Board retains the
responsibility for setting the Company’s strategic direction and
objectives and for setting limitations on the means by which
management may achieve those objectives. Limitations on
management are primarily imposed by approved corporate
strategy and expenditure limits. The Board delegates to
management the responsibility for developing the capability to
achieve Buru Energy’s aims and objectives and employing that
capability within the limitations set by the Board. The Board
monitors and maintains this delegation by requiring regular
reporting by management to the Board.
The Board delegates a portion of its authority through
management limitations, policies and holding the Chairman
accountable. It also recognises in its policies, strategic direction
and setting of objectives for management, its accountability to
legal and ethical obligations and its broader responsibility to
non-equity stakeholders and the community.
The mandate to lead Buru Energy is placed by shareholders in
the hands of the entire Board. The principles endorsed by the
Board are as follows:
No person within Buru Energy, whether a Board member or a
member of management, can have any authority unless the
Board grants that authority.
All Board members are accountable individually and as a whole
for any lapses of performance or behaviour by Buru Energy.
The Board possesses authority only as a group. The Chairman
and individual Directors have no power unless specifically given
12
BURU ENERGY LIMITED
For personal use only
Corporate Governance Statement
This statement outlines the main corporate governance practices in place during the year. The Company’s corporate governance
practices comply with the ASX Corporate Governance Principles and Recommendations with 2010 Amendments - 2nd Edition (“ASX
Recommendations”), unless otherwise stated.
Board of Directors
The respective roles and responsibilities of both the Board and management are set out in the Board Charter which can be viewed in
the corporate governance section of the Company’s website www.buruenergy.com.
Roles and Responsibilities of the Board and Senior Executives (ASX’s Recommendation 1.1, 1.2 & 1.3)
The Board is collectively responsible for the governance of the Company and for promoting its success. The Board’s primary purpose
is to govern the Company on behalf of all shareholders. The Board’s specific job outputs are to maintain a link between the Company’s
shareholders and its operations and to create and maintain governance policies that address the broadest levels of all decisions and
situations. The Board retains the responsibility for setting the Company’s strategic direction and objectives and for setting limitations
on the means by which management may achieve those objectives. Limitations on management are primarily imposed by approved
corporate strategy and expenditure limits. The Board delegates to management the responsibility for developing the capability to
achieve Buru Energy’s aims and objectives and employing that capability within the limitations set by the Board. The Board monitors
and maintains this delegation by requiring regular reporting by management to the Board.
The Board delegates a portion of its authority through management limitations, policies and holding the Chairman accountable. It
also recognises in its policies, strategic direction and setting of objectives for management, its accountability to legal and ethical
obligations and its broader responsibility to non-equity stakeholders and the community.
The mandate to lead Buru Energy is placed by shareholders in the hands of the entire Board. The principles endorsed by the Board are
as follows:
•
No person within Buru Energy, whether a Board member or a member of management, can have any authority unless the Board
grants that authority.
•
All Board members are accountable individually and as a whole for any lapses of performance or behaviour by Buru Energy.
•
The Board possesses authority only as a group. The Chairman and individual Directors have no power unless specifically given it by
the Board collectively.
A Director or other officer of Buru Energy who makes a business judgment will have met the requirements as a Director of Buru Energy
and their equivalent duties at common law and in equity, if they:
•
make the judgment in good faith for a proper purpose;
•
do not have a material personal interest in the subject matter of the judgment;
•
inform themselves about the subject matter of the judgment to the extent they reasonably believe to be appropriate; and
•
rationally believe that the judgment is in the best interests of Buru Energy.
The Director’s or officer’s belief that the judgment is in the best interests of Buru Energy is a rational one unless the belief is one that no
reasonable person in their position would hold.
Mr Eric Streitberg is a major shareholder of the Company and undertakes full time executive duties with the Company. Consequently
his role as the Executive Chairman of the Company does not comply with ASX Recommendation 2.2 which states that the Chairman
of the Board should be an Independent Director. This is an interim arrangement following the restructure of the Buru Energy Board in
2014. The Company anticipates appointing a further Independent Director as it continues to restructure the Board and the plan is for
the Chairman role to be undertaken by an Independent Director at an appropriate time.
ANNUAL REPORT 2014
13
Corporate Governance Statement
For personal use only
Senior executives are responsible for supporting the Executive Chairman and assisting him with the management of the Company in
accordance with the delegated authority of the Board. Senior executives are responsible for reporting all matters which fall within the
Company’s materiality thresholds to the Executive Chairman.
Board Processes (ASX’s Recommendation 2.4, 4.1 & 8.1)
Full Board meetings are conducted in accordance with the Company’s constitution at least nine times a year, but generally monthly,
at venues, dates and times agreed, where practical, in advance. In accordance with the constitution, a Chairman has been appointed
and the quorum for a meeting is two Directors. To assist in the execution of its responsibilities, the Board has established an Audit and
Risk Committee and a Remuneration and Nomination Committee. Further details on both Committees are included in this Corporate
Governance Statement.
The agenda for each Board meeting is developed by the Company Secretary in consultation with the Executive Chairman. Board
papers are distributed to Directors at least three business days before the meeting, unless the meeting has been called urgently. Board
papers contain the information required for the Directors to make informed decisions in the efficient discharge of their responsibilities.
The minutes of Board meetings are circulated, approved and signed by the Chairman within fourteen days of the date of the meeting.
Urgent matters that cannot wait until the next scheduled Board meeting and for which an impromptu Board meeting cannot be arranged
are dealt with by a circular resolution in accordance with Buru Energy’s Constitution (Article 11.22). Circular resolutions are normally preceded
by telephone or email correspondence if practical, and are approved by the Executive Chairman before being circulated. The resolution is
passed when it is signed by the last of the Directors. Signed circular resolutions are entered into the minute book.
The Board meets informally as required to discuss matters and to ensure members are fully informed of the Company’s operations.
Directors are also provided with a weekly report setting out material matters that have occurred.
Director Education
The terms and conditions of the appointment and retirement of Non-executive Directors are set out in a letter of appointment, including
expectations of attendance and preparation for all Board meetings, minimum hourly commitment, appointments to other Boards, the
procedures for dealing with conflicts of interest, and the availability of independent professional advice. Each new Director will undergo
a formal induction at the earliest opportunity to enable them to gain an understanding of the Company’s financial, strategic, operational
and risk management position and to participate fully and actively in Board decision-making. Directors also have the opportunity to visit
Company facilities and meet with management to gain a better understanding of business operations and both Mr Willes and Ms Howell did
so during the year. Directors are also given access to continuing education opportunities to update and enhance their skills and knowledge.
Independent professional advice and access to company information
Each Director has the right to access all relevant Company information and to speak to and have access to management. Subject
to prior consultation with and approval by the Chairman, each Director may seek independent professional advice in respect of the
Company and the Board’s affairs from a suitably qualified adviser at the Group’s expense. A copy of the advice received by a Director in
these circumstances will, subject to the Chairman’s discretion, be made available to all other members of the Board.
Composition of the Board & Director Independence (ASX’s Recommendation 2.1, 2.2, 2.3 & 2.6)
The names of the Directors of the Company in office at the date of this report, specifying which are independent, are set out in the
Directors’ Report on pages 21 to 23.
The composition of the Board is determined using the following principles:
•
a minimum of three and no more than eight Directors, with extensive knowledge relevant to the conduct of the Company’s
business;
•
a majority of independent Non-executive Directors;
•
a Non-executive independent Director as Chairman (however this is not currently complied with as set out above); and
•
all Directors are subject to re-election every three years, except for the Managing Director (currently the functional role of the
Executive Chairman).
14
BURU ENERGY LIMITED
For personal use only
Corporate Governance Statement
The Board should, collectively, have the appropriate level of personal qualities, skills, experience and time commitment to properly
fulfil its responsibilities or have ready access to such skills where they are not available.
The Board considers the mix of skills and the diversity of Board members when assessing the composition of the Board. The Board
assesses existing and potential Directors’ skills to ensure they have appropriate capabilities, experiences, skills and ability to add value
to the Company’s business as a whole. The composition of the Board is also assessed having regard to the Company’s Diversity Policy,
which is designed to promote and achieve diversity at all levels of Buru Energy’s business, including the Board.
The Board assesses the independence of each Director annually in light of the interests declared by them. Directors will be considered
independent if they meet the definition of an ‘Independent Director’ in accordance with the ASX Corporate Governance Council
Corporate Governance Principles and Recommendations.
Board Committees
Remuneration and Nomination Committee (ASX’s Recommendation 2.4, 2.5, 2.6, 8.1, 8,2, 8.3 & 8.4)
The Remuneration and Nomination Committee oversees the appointment and induction process for Directors and Committee
Members, and the selection, appointment and succession planning processes for the Company’s Managing Director (currently the
Executive Chairman), executives and senior management. The Committee makes recommendations to the Board on the appropriate
skill mix, personal qualities, expertise and diversity of each position. When a Board vacancy exists or there is a need for particular skills,
the Committee in consultation with the Board determines the selection criteria based on the skills deemed necessary. The Committee
identifies potential Board candidates with advice from external consultants. The Board then appoints the most suitable candidate.
Board candidates appointed through this process must stand for election at the next general meeting of shareholders following their
appointment.
Approximately every three years, or more frequently if appropriate, the Remuneration and Nomination Committee uses an external
facilitator to undertake an evaluation of the performance of the Board, its Committees, individual Directors, and senior executives. The
other Directors have an opportunity to contribute to the review process. The reviews generate recommendations to the Board, which
votes on them. The Committee’s nomination of existing Directors for reappointment is not automatic and depends on, amongst other
things, the outcome of the review process.
The Remuneration and Nomination Committee also conducts an annual review of the performance of the Managing Director
(currently the Executive Chairman) and the senior executives reporting directly to him and the results are discussed at a Board
meeting. The Committee reviews and makes recommendations to the Board on remuneration packages and policies applicable to the
executive officers and Directors of the Company and of other Group executives for the Group. It is also responsible for short and long
term incentive performance packages, superannuation entitlements and retirement and termination entitlements.
The composition of the Remuneration and Nomination Committee is a minimum of three members and is comprised of only Nonexecutive Directors. The members of the Remuneration and Nomination Committee during the period were:
•
The Hon. Peter Jones AM (Chairman) – Independent Non-executive
•
Ms Eve Howell – Independent Non-executive (appointed 29 July 2014)
•
Mr Robert Willes – Independent Non-executive (appointed 29 July 2014)
•
Mr Eric Streitberg – (appointed 5 February 2014 and resigned 29 July 2014)
•
Mr Graham Riley – Independent Non-executive (resigned 23 May 2014)
•
Mr Austin Miller – Independent Non-executive (resigned 5 February 2014)
The Executive Director, Company Secretary and General Manager Commercial are invited to Committee meetings, as required but they
do not attend meetings involving matters pertaining to themselves.
ANNUAL REPORT 2014
15
Corporate Governance Statement
For personal use only
The Remuneration and Nomination Committee will meet at least two times a year and as often as required as determined by the
Chairman of the Committee. The Committee met four times during the year ended 31 December 2014. The number of meetings
attended by each Committee member is set out in the Directors’ Report. Any Committee member may convene a meeting of
the Committee and two members constitute a quorum. The Committee has the right to access management and may engage
independent professional advisers as it requires, to assist it to discharge its purpose and responsibilities. The Company Secretary is
the Secretary of the Remuneration and Nomination Committee. The minutes of meetings are circulated, approved and signed by the
Chairman within twenty one days of the date of the meeting.
Further details on the Remuneration and Nomination Committee, including its charter, the Board Renewal and Performance Evaluation
Policy and the Diversity Policy can be viewed in the corporate governance section of the Company’s website www.buruenergy.com.
Audit and Risk Committee (ASX’s Recommendation 4,1, 4.2, 4.3, 4.4 ,7.1, 7.2, 7.3, & 7.4)
The Audit and Risk Committee advises on the establishment and maintenance of a framework of internal control and appropriate
ethical standards for the management of the Group.
The Audit and Risk Committee is responsible for oversight and review of:
•
the annual and half yearly statutory financial statements;
•
procedures and issues that could have a significant impact on financial results (for example impairment testing);
•
Buru Energy’s internal controls including accounting controls;
•
external auditor’s independence and monitoring the audit process in accordance with the international auditing standards and
any other applicable regulations;
•
the appropriateness of the external auditor’s provision of non-audit services;
•
the need for and, if required, the scope and conduct of internal audit;
•
the establishment and implementation of a risk management process to identify, assess, monitor and control risk;
•
management’s periodic risk assessments and recommendations;
•
the adequacy of Buru Energy’s insurances;
•
compliance with appropriate regulations (including environmental and safety); and
•
reporting on reserves in accordance with the appropriate regulations and guidelines.
The Audit and Risk Committee reviews the performance of the external auditors on an annual basis and will meet with them during
the year to:
•
discuss the external audit plans, identifying any significant changes in structure, operations, internal controls or accounting policies
likely to impact the financial statements and to review the fees proposed for the audit work to be performed;
•
review the half-year and full year financial reports prior to lodgement with the ASX, and any significant adjustments required as a
result of the auditor’s findings, and to recommend Board approval of these documents, prior to announcement; and
•
review the results and findings of the auditor, the adequacy of accounting and financial controls, and to monitor the
implementation of any recommendations made.
The Audit and Risk Committee oversees the establishment, implementation, and annual review of the Group’s Risk Management
System. Management has established and implemented the Risk Management System for assessing, monitoring and managing all
risks, including material business risks, for the Group (including sustainability risk). The Executive Chairman and the Head of Finance
have provided assurance, in writing to the Board, that the financial reporting risk management and associated compliance and
controls have been assessed and found to be operating effectively. The operational and other risk management compliance and
controls have also been assessed and found to be operating effectively.
Management provide the risk profile on a quarterly basis to the Audit and Risk Committee that outlines the material business risks
to the Group. Risk reporting includes the status of risks through integrated risk management programs aimed at ensuring risks are
identified, assessed and appropriately managed.
16
BURU ENERGY LIMITED
For personal use only
Corporate Governance Statement
The Audit and Risk Committee reports the status of material business risks to the Board on a quarterly basis. Further details of the
Group’s risk management policy and internal compliance and control system are available on the Company’s website.
The risks involved with oil and gas exploration generally and the specific risks associated with Buru Energy’s activities in particular are
regularly monitored and all exploration and investment proposals reviewed by the Committee include a conscious consideration of
the issues and risks of each proposal. The Company’s executive and senior management have extensive experience in the industry
and manage and monitor potential exposures facing Buru Energy.
The Board is responsible for the overall internal control framework, but recognises that no cost-effective internal control system will
preclude all errors and irregularities. Comprehensive practices have been established to ensure:
•
capital expenditure and commitments above a certain size obtain prior Board approval;
•
financial exposures are controlled, further details of the Group’s policies relating to interest rate management, forward exchange
rate management and credit risk management are included in Note 6 to the financial statements;
•
occupational health and safety standards and management systems are monitored and reviewed to achieve high standards of
performance and compliance with regulations;
•
business transactions are properly authorised and executed;
•
the quality and integrity of personnel;
•
financial reporting accuracy and compliance with the financial reporting regulatory framework; and
•
environmental regulation compliance.
Formal appraisals are conducted at least annually for all employees. Training and development and appropriate remuneration and
incentives with regular performance reviews create an environment of cooperation and constructive dialogue with employees and
senior management.
The Executive Chairman and the Head of Finance have provided assurance in writing to the Board that the Group’s financial reports are
founded on a sound system of risk management and internal compliance and control which implements the policies adopted by the
Board. Monthly actual results are reported against budgets approved by the Directors and revised forecasts for the year are prepared
regularly.
The Group’s operations are subject to significant environmental regulation under both Commonwealth and State legislation in relation
to its oil and gas exploration and production activities. The Group is committed to achieving a high standard of environmental
performance and continuous improvement. It has established a Group-wide Environmental Policy together with operation and activity
specific environmental management plans to manage this area of the Company’s activities. Compliance with the requirements of environmental regulations and with specific requirements of site environmental approvals was
substantially achieved across all operations with no instances of material, non-compliance in relation to approval requirements noted.
Based on the results of enquiries made, the Board is not aware of any significant breaches during the period covered by this report.
Given the size and scale of Buru Energy, it does not have a separate internal audit function.
The composition of the Audit and Risk Committee is a minimum of three members and is comprised of only Non-executive Directors.
The members of the Audit and Risk Committee during the period were:
•
Mr Robert Willes (Chairman) – Independent Non-executive (appointed 29 July 2014)
•
The Hon. Peter Jones AM – Independent Non-executive
•
Ms Eve Howell – Independent Non-executive (appointed 29 July 2014)
•
Mr Eric Streitberg – (appointed 5 February 2014 and resigned 29 July 2014)
•
Mr Graham Riley – Independent Non-executive (resigned 23 May 2014)
•
Mr Austin Miller – Independent Non-executive (resigned 5 February 2014)
ANNUAL REPORT 2014
17
Corporate Governance Statement
For personal use only
The external auditors, the Executive Chairman and the Head of Finance, are invited to Audit and Risk Committee meetings at the
discretion of the Committee. The Executive Chairman and the Head of Finance declared in writing to the Board:
•
that the financial records of the Company for the financial year have been properly maintained; and
•
the Group’s financial reports for the year ended 31 December 2014 comply with accounting standards and present a true and fair
view of the Group’s financial condition and operational results.
This statement is required annually.
The Audit and Risk Committee will meet at least three times a year and as often as required as determined by the Chairman of the
Committee. The Committee met three times during the year. The number of meetings attended by each Committee member is
set out in the Directors’ Report. Any Committee member may convene a meeting of the Committee and two members constitute
a quorum. The Committee has the right to access management and may engage independent professional advisers as it requires,
assisting to discharge its purpose and responsibilities. The Company Secretary is the Secretary of the Audit and Risk Committee. The
minutes of meetings are circulated, approved and signed by the Chairman within twenty one days of the date of the meeting. The
external auditor met with the Audit and Risk Committee twice during the year.
Further details on the Audit and Risk Committee including its charter can be viewed in the corporate governance section of the
Company’s website www.buruenergy.com.
Ethical standards
Code of conduct (ASX’s Recommendations 3.1 & 3.5)
Buru Energy has established a Code of Conduct. The Code of Conduct applies to all Directors, senior executives, employees and
contractors working on Buru Energy sites. It sets out the practices necessary to maintain confidence in the Company’s honesty and
integrity and the practices necessary to take into account the legal obligations and the expectations of the Company’s stakeholders
and the responsibility and accountability of individuals for reporting and investigating reports of unethical practices.
The Code of Conduct sets out the procedure to be followed if there is, or may be, a conflict between the personal or other interests of
a Director and the business of the Company including the notification of an interest to the Board and a withdrawal from a meeting in
which the material matter is discussed.
There have been no reports of a departure from the Code of Conduct.
Diversity (ASX’s Recommendations 3.2, 3.3 and 3.4)
The Board is committed to having an appropriate level of diversity on the Board and in all areas of the Group’s business. The Board has
established a policy regarding gender, age, ethnic and cultural diversity. Details of the policy are available on the Company’s website.
The key elements of the Group’s diversity policy are as follows:
•
Disclose the Group’s commitment to attracting and retaining a diverse range of talented people to work in all levels of its business,
from entry positions to Board members.
•
Annual assessment of gender diversity on the Board and in all areas of the Group’s business and reporting against the gender
diversity objectives approved by the Board.
18
BURU ENERGY LIMITED
Corporate Governance Statement
For personal use only
The Group’s gender diversity as at the end of the reporting period was as follows:
Period
31 December 2014
Gender
Level
Males
31 December 2013
Females
Males
Females
Number
%
Number
%
Number
%
Number
%
Directors
3
75
1
25
5
100
0
0
Senior Executives
5
100
-
-
5
71
2
29
All Other Employees
35
78
10
22
44
60
29
40
TOTAL
43
80
11
20
54
64
31
36
During the year ended 31 December 2014, the outcomes of the Company’s diversity objectives were as follows:
Diversity Objective
Outcome
Continue to grow and develop our Aboriginal
workforce
Achieved. In addition to direct employees, Buru Energy employed 20
people on site during the TGS Phase 1 program. To develop its workforce,
the Company continues to support the training of Aboriginal employees
through work readiness programs implemented in communities through
the Kimberley Training Institute.
Increase our partnering with local Kimberley
Aboriginal businesses to provide services
Achieved. The Company has increased participation of Kimberley Aboriginal
businesses for on ground services. This has included providing services
across the following areas: road maintenance, transport, environmental
monitoring, access control and coordination, operations assistance, site
remediation and rehabilitation.
Implement a mentoring program for women
Due to the organisational restructure during the year, the Company did not
meet this objective.
Develop and implement leadership training that
includes a Diversity module
Due to the organisational restructure during the year, the Company did not
meet this objective.
The Board has set the following diversity objectives for 2015:
•
Continue to grow and develop the Company’s Aboriginal workforce
•
Continue to increase partnering with local Kimberley Aboriginal businesses to provide services
•
Continue to provide mentoring and support to female employees
Trading in Company securities by Directors and employees
The key elements of the Company’s share trading policy for Directors and employees are:
•
•
Identification of those restricted from trading – Directors and senior executives may acquire shares in the Company, but are
prohibited from dealing in Company shares or exercising options:
--
in respect of a well drilling program in which Buru Energy has an interest, from the date on which the casing string above
the first objective is set (or such earlier time or event as may be notified to staff by the Executive Chairman) until the close of
trading on the day that the drilling rig has been released from the relevant location;
--
two weeks prior to the release of Buru Energy’s half-year and annual reports;
--
whilst in possession of price sensitive information not yet released to the market;
to raise the awareness of legal prohibitions including transactions with colleagues and external advisers;
ANNUAL REPORT 2014
19
Corporate Governance Statement
to raise awareness that the Group prohibits entering into transactions that limit economic risks related to unvested share-based
payments;
For personal use only
•
•
to raise awareness that the Group prohibits those restricted from trading in Company shares as described above from entering
into transactions such as margin loans that could trigger a trade during a prohibited period;
•
to require details to be provided of intended trading in the Company’s shares;
•
to require details to be provided of the subsequent confirmation of the trade; and
•
the identification of processes for unusual circumstances where discretions may be exercised in cases such as financial hardship.
The policy also details the insider trading provisions of the Corporations Act 2001 and is reproduced in full on the Company’s website.
Communication with shareholders
Timely and Balanced Disclosure (ASX’s Recommendations 5.1, 5.2, 6.1 and 6.2)
The Board provides shareholders with information using a comprehensive Continuous Disclosure and Market Communications Policy
which includes identifying matters that may have a material effect on the price of the Company’s securities, notifying them to the
ASX, posting them on the Company’s website, and issuing media releases. More details of the policy are available on the Company’s
website.
In summary, the Continuous Disclosure and Market Communications Policy operates as follows:
•
the Executive Chairman and Company Secretary are responsible for interpreting the Group’s policy and where necessary informing
and seeking approval from the Board. The Executive Chairman and Company Secretary are primarily responsible for all external
communications including releases made on ASX;
•
the full annual report is made available to all shareholders via the Company’s website. A physical copy will be sent to any
shareholder that specifically requests it. The full annual report includes relevant information about the operations of the Group
during the year, changes in the state of affairs and details of future developments;
•
the half-yearly report is made available to all shareholders via the Company’s website. A physical copy will be sent to any
shareholder that requests it. The half-yearly report contains summarised financial information and a review of the operations of the
Group during the period;
•
proposed major changes in the Group which may impact on share ownership rights are submitted to a vote of shareholders;
•
all announcements made to ASX, and related information (including information provided to analysts or the media during
briefings), are placed on the Company’s website after they are released to the ASX;
•
the full texts of notices of meetings and associated explanatory material are placed on the Company’s website; and
•
the external auditor attends the annual general meeting to answer questions concerning the conduct of the audit, the preparation
and content of the auditor’s report, accounting policies adopted by the Group and the independence of the auditor in relation to
the conduct of the audit.
All of the above information, dating back to the listing of the Company, is made available on the Company’s website within one day
of public release, and is emailed to all shareholders who lodge their email contact details with the Company. Information on lodging
email addresses with the Company is available on the Company’s website.
The Board encourages full participation of shareholders at the Annual General Meeting, to ensure a high level of accountability and
identification with the Group’s strategy and goals. Important issues are presented to the shareholders as single resolutions.
Shareholders are requested to vote on the appointment and aggregate remuneration of Directors, the granting of options and shares
to Directors, the Remuneration report and changes to the Constitution and all other matters requiring shareholder approval. A copy of
the Constitution is available to any shareholder who requests it.
20
BURU ENERGY LIMITED
Directors’ Report
For the year ended 31 December 2014
For personal use only
Directors Report
The Directors present their report together with the consolidated financial statements of the Group comprising Buru Energy
Limited (“Buru Energy” or “Group”) and its subsidiaries for the year ended 31 December 2014, and the auditor’s report thereon. The
remuneration report for the year ended 31 December 2014 on pages 28 to 39 forms part of the Directors’ report.
Directors
The Directors of the Company at any time during or since the end of the financial year are:
Name, qualifications and independence status
Experience, special responsibilities and other directorships
Mr Eric Streitberg, BSc (App Geoph)
Mr Streitberg has more than 40 years of experience in petroleum geology and
geophysics, oil and gas exploration and oil and gas company management.
He was a founding shareholder and held the position of Managing Director
of ARC Energy Limited from 1997 until August 2008, during which time ARC
Energy Limited was transformed from a junior oil and gas exploration company
into a mid-size Australian oil and gas producer. He was also the founding
shareholder and Managing Director of Discovery Petroleum which was a key
participant in the renaissance of the Perth Basin as a significant gas producer
until the takeover of that company in 1996. Prior to that he held various senior
international exploration roles with Occidental Petroleum and BP. He was a
founding shareholder and Non-executive Director of Adelphi Energy Limited
from 2005 until its takeover in 2010.
Executive Chairman
He is a Fellow of the Australian Institute of Mining and Metallurgy and
the Australian Institute of Company Directors, a member of the Society of
Exploration Geophysicists, Petroleum Exploration Society of Australia and the
American Association of Petroleum Geologists.
Mr Streitberg is a Director and past Chair of the Australian Petroleum
Production and Exploration Association and has also chaired the APPEA
Exploration and Environment Committees. He is the immediate past Chair of
the Marine Parks and Reserves Authority of Western Australia.
Mr Streitberg is a Certified Petroleum Geologist and Geophysicist and holds a
Bachelor of Science (App. Geoph.) from the University of Queensland.
Mr Streitberg has been a Director since October 2008 and was a Non-executive
Director of Buru Energy during the period 14 January 2014 to 23 May 2014. Mr
Streitberg has been the Executive Chairman since 23 May 2014.
The Hon. Peter Jones AM
Independent Non-executive Director
The Hon. Mr Jones was a member of the Western Australian Parliament from
1974 to 1986 during which time he served as the Minister for Resources
Development, Mines, Fuel and Energy. He was the founding Chairman of ARC
Energy Limited and Chairman of AMMTEC Limited. He previously served as the
Chairman of Defence Housing Australia and the Water Corporation of Western
Australia.
The Hon. Mr Jones is the Chairman of the Remuneration and Nomination
Committee, a member of the Audit and Risk Committee and has been a
Director since October 2009.
ANNUAL REPORT 2014
21
Directors’ Report
For the year ended 31 December 2014
For personal use only
Name, qualifications and independence status
Ms Eve Howell
Independent Non-executive Director
(Appointed 2 July 2014)
22
Experience, special responsibilities and other directorships
Ms Howell has over 40 years of experience in the oil and gas industry in a
number of technical and managerial roles, primarily with Amoco Corporation,
Apache Energy Ltd and Woodside Energy Ltd. She is a Director of ASX-listed
Downer EDI Limited and Mermaid Marine Australia Ltd.
In the private sector, Ms Howell is Non-executive Chairman of EMR Resources
Pty Ltd and on the Senior Advisory Panel of Miro Advisors Ltd. She has
previously served on a number of boards including Tangiers Petroleum (as
Executive Chairman), the Fremantle Port Authority, the Australian Petroleum
Production and Exploration Association, and as a board member and President
of the Australian Mines and Metals Association. She is a Graduate of the
Australian Institute of Company Directors.
Ms Howell began her exploration career in the UK and since 1981 has worked
for several Australian based companies including Apache during a time when
the company developed significant oil production from the Carnarvon Basin
and became the second largest domestic gas supplier. She held various senior
positions in Apache in Australia including Business Development Manager
and Managing Director. Between 2006 and 2011, Ms Howell was a Woodside
Executive Committee member, with her positions including Executive Vice
President of the North West Shelf.
Ms Howell holds a Bachelor of Science (with Honours in Geology and
Mathematics) from the University of London and an MBA from Edinburgh
Business School.
Ms Howell is a member of the Audit and Risk Committee and the
Remuneration and Nomination Committee and has been a Director since
July 2014.
BURU ENERGY LIMITED
Directors’ Report
For personal use only
For the year ended 31 December 2014
Name, qualifications and independence status
Experience, special responsibilities and other directorships
Mr Robert Willes
Mr Willes has over 25 years of extensive international experience in the oil
and gas and energy industries. He is the Managing Director of Challenger
Energy Ltd and has previously served on a number of boards including the
Australian Petroleum Production and Exploration Association (APPEA), North
West Shelf Gas Pty Ltd, North West Shelf Liaison Co. Pty Ltd, North West Shelf
Australia LNG Pty Ltd, North West Shelf Shipping Services Co. Pty Ltd, Carbon
Reduction Ventures Pty Ltd and Perth Centre for Photography. His early
career with BP involved several positions in petroleum product supply, trading
and marketing, and as a lead negotiator for numerous gas transactions in
Europe. He subsequently joined BP’s Group Mergers and Acquisitions team,
where he led the divestments of Burmah Castrol’s Chemicals Division and
Great Yarmouth Power Ltd, and advised the Corporation on a number of
acquisition opportunities. In Australia, Robert was BP’s General Manager of the
North West Shelf LNG Project. Robert also had overall accountability for BP’s
interests in the Browse LNG and Greater Gorgon LNG Projects, and for Business
Development activities in Asia Pacific. More recently, Robert was CEO of
Eureka Energy Limited, and was instrumental in managing the recommended
A$107million on-market takeover by Aurora Oil and Gas Limited. He is
currently Managing Director of Challenger Energy Ltd, an ASX-listed oil and
gas explorer with exposure to the emerging world-scale shale gas province in
South Africa’s Karoo Basin. Robert is a Graduate of the Australian Institute of
Company Directors and member of the Association of International Petroleum
Negotiators. He holds an Honours Degree in Geography from Durham
University in the UK, and has completed Executive Education Programmes at
Harvard Business School in the USA and Cambridge University in the UK.
Independent Non-executive Director
(Appointed 2 July 2014)
Mr Willes is the Chairman of the Audit and Risk Committee, a member of the
Remuneration and Nomination Committee and has been a Director since July 2014.
Dr Keiran Wulff, PhD
(October 2012 to 2 July 2014)
Mr Graham Riley, BJur LLB
(May 2008 to May 2014)
Mr Austin Miller
(November 2012 to 5 February 2014)
Dr Wulff was a Director from October 2012 and Managing Director from
January 2013 until his resignation in July 2014.
Mr Riley was an Independent Non-executive Director from May 2008 and
Chairman from March 2009 until May 2014. He was a member of the Audit and
Risk Committee and the Remuneration and Nomination Committee.
Mr Miller was an Independent Non-executive Director from November 2012
until his resignation in February 2014. He was the Chairman of the Audit and
Risk Committee and was a member of the Remuneration and Nomination
Committee.
ANNUAL REPORT 2014
23
Directors’ Report
For the year ended 31 December 2014
For personal use only
Company Secretary
Mr Shane McDermott, CA, AGIA, BComm (Accounting and Finance) has an accounting and auditing background having worked at
a large international accounting practice for five years at its Perth office before joining Buru Energy in 2009. He is a member of the
Institute of Chartered Accountants Australia and an Associate of the Governance Institute of Australia. Mr McDermott was appointed
Company Secretary on 11 July 2014. He previously acted as Buru Energy’s Joint Company Secretary from 1 December 2011 to 1
November 2012.
Mr Chris Bath was the previous Company Secretary from 1 November 2012 to 11 July 2014.
Board and Committee Meetings
The number of Board and Committee meetings and the number of meetings attended by each of the Directors of the Company
during the year were:
Meeting
Audit & Risk
Committee Meetings
Board Meetings
Eligible to
Attend
Attended
Eligible to
Attend
Eric Streitberg
16
16
Peter Jones
16
Eve Howell
Remuneration & Nomination
Committee Meetings
Attended
Eligible to
Attend
Attended
1
1
1
1
16
3
3
4
4
8
8
2
1
3
3
Robert Willes
8
7
2
2
3
3
Keiran Wulff
8
7
-
-
-
-
Graham Riley
6
6
1
1
1
1
Austin Miller
1
1
-
-
-
-
Director
Principal Activities
The principal activity of the Group during the period was oil and gas exploration and production in the Canning Basin, in the
northwest of Western Australia. There were no significant changes in the nature of the Group’s principal activities during the period.
Operations Review
The Operations Review for the year ended 31 December 2014 is set out on pages 7 to 12 and forms part of this Directors’ Report.
Operating Results
The consolidated loss of the Group after providing for income tax for the year ended 31 December 2014 was $31,643,000 (six months
ended 31 December 2013: loss of $14,981,000).
Financial Position
The net assets of the Group totalled $129,966,000 as at 31 December 2014 (31 December 2013: $131,392,000).
Dividends
The Directors do not propose to recommend the payment of a dividend for the period. No dividends have been paid or declared by
the Company during the current period.
24
BURU ENERGY LIMITED
Directors’ Report
For the year ended 31 December 2014
For personal use only
Significant Changes in the State of Affairs
No significant change in the state of affairs of the Group occurred during the period other than already referred to elsewhere in this
report.
After Balance Date Events
No significant events have occurred subsequent to balance date other than those already disclosed in the Operations Review.
Likely Developments
The Group’s likely developments in its operations in future financial years and the expected results of those operations have
been included generally in the Operations Review. Other than as disclosed elsewhere, disclosure of information regarding likely
developments in the operations of the consolidated entity in future financial years and the expected results of those operations is
likely to result in unreasonable prejudice to the Group. Accordingly, this information has not been disclosed.
Environmental Regulations
The Group is subject to environmental regulation under relevant Australian and Western Australian legislation in relation to its oil
and gas exploration and production activities, particularly with the DMP and the Western Australian Department of Environment
Regulation (“DER”). The Directors actively monitor compliance with these regulations. As at the date of this report, the Directors are
not aware of any material breaches in respect of the regulations.
Directors’ Interests
The relevant interest of each Director in the shares or options issued by the Company, as notified by the Directors to the ASX in
accordance with s205G(1) of the Corporations Act 2001, at the date of this report are as follows:
Directors
Ordinary Shares
Unlisted Options
Share Appreciation Rights
Eric Streitberg
28,720,566--
Peter Jones
248,277--
Eve Howell
65,000--
Robert Willes
---
Total
29,033,843
-
-
Share Options
At the date of this report, the unissued shares of the Company (all of which are held by employees of the Company) under option
are as follows:
Date of Expiry
31 December 2016
Total
Exercise Price
Number of shares under Option
$1.12
6,400,000
6,400,000
All unissued shares are ordinary shares in the Company. All options expire on the earlier of their expiry date or within 30 days from
termination of the employee’s employment. These options do not entitle the holder to participate in any share issue of the Company
or any other body corporate. Further details about options granted to Directors or senior executives during the financial year are
included in the Remuneration Report on pages 28 to 39. No options have been granted since the end of the reporting period. During
or since the end of the reporting period, no shares were issued on the exercise of options previously granted as compensation.
ANNUAL REPORT 2014
25
Directors’ Report
For the year ended 31 December 2014
For personal use only
Share Appreciation Rights
Details of the Share Appreciation Rights (“SARs”) outstanding as at the date of this report are as follows:
Number of
SARs granted
Grant
date
Vesting
date
Exercise price
per SAR ($)
Expiry
date
% of SARs
vested
% of SARs
forfeited
Year in which
grant vests
200,000
3 Jan 13
31 Dec 13
4.00
30 Jun 16
100%
0%
2013
250,000
3 Jan 13
31 Dec 14
4.25
30 Jun 16
100%
0%
2014
300,000
3 Jan 13
31 Dec 15
4.50
30 Jun 16
0%
0%
2015
2,736,547
3 Jan 14
31 Oct 16*
1.63
3 Jan 18
0%
0%
2016
3,486,547
*This is the service period vesting date. The Vesting is also subject to various performance hurdles relating to Relative Total
Shareholder Return
Further details about SARs granted to Directors or senior executives during the financial year are included in the Remuneration Report
on pages 28 to 39.
Indemnification and Insurance of Officers
The Company has agreed to indemnify all current Directors and officers of the Company and its controlled entities against all liabilities
to another person (other than the Company or a related body corporate) that may arise from their position as Directors and officers of
the Company and its controlled entities, except where the liability arises out of conduct involving a lack of good faith. The agreement
stipulates that the Company will meet the full amount of any such liabilities, including costs and expenses.
During the year, the Company has paid insurance premiums of $62,172 (2013: $62,800) in respect of Directors’ and officers’ liability. The
premiums cover current and former Directors and officers, including senior executives of the Company and Directors and secretaries of
its controlled entities. The insurance premiums relate to:
•
costs and expenses incurred by the relevant officers in defending proceedings, whether civil or criminal and whatever their
outcome; and
•
other liabilities that may arise from their position, with the exception of conduct involving a wilful breach of duty or improper use
of information or position to gain a personal advantage.
Proceedings on Behalf of Company
No person has applied for leave from any Court to bring proceedings on behalf of the Company or intervene in any proceedings
to which the Company is a party for the purpose of taking responsibility on behalf of the Company for all or any part of those
proceedings. The Company was not a party to any such proceedings during the period.
Non-audit Services
During the period, the Company’s auditor did not perform any other services in addition to their statutory audit, half year review and
joint venture audits. During the year ended 31 December 2014, the amount paid or payable to the Group’s auditor (KPMG Australia)
for statutory and other audit and review services totalled to $87,425 (six months ended 31 December 2013: $70,250 and year ended 30
June 2013: $94,250).
26
BURU ENERGY LIMITED
Directors’ Report
For the year ended 31 December 2014
For personal use only
Auditor’s Independence Declaration
The lead auditor’s independence declaration is set out on page 40 and forms part of the Directors’ Report for the year ended 31
December 2014.
Rounding off
The Company is of a kind referred to in ASIC Class Order 98/100 dated 10 July 1998 and in accordance with that Class Order, amounts
in the financial report and Directors’ report have been rounded off to the nearest thousand dollars, unless otherwise stated.
This report is made in accordance with a resolution of Directors.
---------------------------------------------------Mr Eric Streitberg
Ms Eve Howell
Executive Chairman
Non-executive Director
PerthPerth
25 March 2015
25 March 2015
ANNUAL REPORT 2014
27
Remuneration Report - Audited
For the year ended 31 December 2014
For personal use only
Principles of compensation - Audited
The Directors present their Remuneration Report for Buru Energy for the year ended 31 December 2014. This remuneration report
outlines the remuneration arrangements of the Company’s Directors and other key management personnel (“KMP”) in accordance
with the requirements of the Corporations Act 2001 and its Regulations. In accordance with section 308(3C) of the Corporations
Act 2001, the Remuneration Report has been audited and forms part of the Directors’ Report. Remuneration is also referred to as
compensation throughout this report.
The Group notes the greater than 25% vote against the adoption of the 2013 Remuneration Report at the Annual General meeting
on 23 May 2014. In response, during the 2014 year the Company underwent a process of significant organisational restructuring
to achieve long term cost saving initiatives. Redundancies were an important and necessary part of this process. To illustrate the
significant reduction in KMP remuneration, the Remuneration Report has been presented in a manner to show current Directors and
other KMP separately from former Directors and KMP. This provides a more transparent summary of the Company’s Director and KMP
current remuneration levels. The Group continues to strive for best practice remuneration practices and schemes and has had ongoing
communications with large shareholders to ensure alignment of expectations.
KMP have authority and responsibility for planning, directing and controlling the activities of the Group and comprise the Directors,
executives and senior management in accordance with s300A of the Corporations Act 2001.
Compensation levels for KMP are competitively set to attract and retain appropriately qualified and experienced Directors and
executives. The compensation structures explained below are designed to reward the achievement of the Company’s strategic
objectives and achieve the broader outcome of the creation of shareholder value. The Company’s compensation structures take into
account:
•
•
the capability and experience of KMPs; and
the Group’s corporate, operational and financial performance.
Compensation packages include a mix of fixed and variable compensation, and short and long term performance based incentives.
Fixed compensation
Fixed compensation consists of base compensation (which is calculated on a total cost basis and includes any FBT charges related
to employee benefits), as well as employer contributions to superannuation funds. Compensation levels are reviewed annually by
the Remuneration and Nomination Committee through a process that considers individual, segment and overall performance of
the Group. In addition, external consultants provide analysis and advice to ensure the Directors’, executive and senior management
compensation is competitive in the market place. Compensation is also reviewed on promotion.
Performance linked compensation
Performance linked compensation includes both short-term and long-term incentives, and is designed to reward KMP for meeting or
exceeding the Company’s expectations and agreed objectives. The short-term incentive (“STI”) is an ‘at risk’ bonus provided in the form
of cash, while the long-term incentive (“LTI”) is provided under the Employee Share Option Plan (“ESOP”) and as Share Appreciation
Rights (“SARs”) to KMP. The LTIs are structured to ensure that incentives are appropriately aligned to sustainable shareholder value
creation.
Short-term incentive bonuses
The payments of bonuses are linked to the fulfilment of key performance indicators (“KPIs”). The KPIs are designed to promote
shareholder value creation and include financial and non-financial measures. The individual’s reward under the STI bonus scheme is
directly aligned to the creation of shareholder value through the achievement of the Company’s strategic and performance goals. All
STI bonuses are subject to Board approval.
The financial and non-financial measures vary with position and responsibility and include measures such as achieving operational
outcomes and ensuring high levels of safety and environmental performance.
28
BURU ENERGY LIMITED
Remuneration Report - Audited
For the year ended 31 December 2014
For personal use only
Long-term incentive bonuses
The Remuneration and Nomination Committee considers that an LTI scheme structured around equity based compensation is
necessary to attract and retain the highest calibre of professionals to the Group, whilst preserving the Group’s cash reserves. The
purpose of these schemes is to align the interests of KMP with shareholders and to reward, over the medium term, KMP for delivering
value to shareholders through share price appreciation.
Options are issued under the ESOP in accordance with the thresholds set in the plan approved by shareholders. The number of
options available to be issued under the ESOP is limited to 5% of the total number of ordinary shares in the Company. The options are
issued for no consideration and vest immediately. All options refer to options over ordinary shares of Buru Energy Limited which are
exercisable on a one for one basis.
During the financial period the Group issued SARs to certain KMP. Each SAR represents a right to an award equivalent to the positive
difference between the notional share price set at the date of grant and the share price at the date of exercise, subject to satisfaction of
any vesting conditions and exercise conditions. At the Board’s discretion, the award may be settled in ordinary shares of an equivalent
value or as a cash payment.
Consequences of performance on shareholder wealth
The Board considers that the most effective way to increase shareholder wealth is through the successful exploration and
development of the Group’s oil and gas exploration permits. The Board considers that the Group’s LTI schemes incentivise KMP to
successfully explore the Group’s oil and gas permits by providing rewards, over the short and long term that are directly correlated to
delivering value to shareholders through share price appreciation. The Company’s share price is the primary measure when the Board
considers the effectiveness of STI and LTI remuneration consequences on shareholder wealth.
Reporting Period
31 Dec
2008
31 Dec
2009
31 Dec
2010
31 Dec
2011
31 Dec
2012
31 Dec
2013
31 Dec
2014
$0.16
$0.23
$0.44
$1.23
$2.40
$1.75
$0.44
Share Price
Service contracts
The employment contract with the Executive Chairman, Mr Eric Streitberg, is unlimited in term but capable of termination with three
months’ notice by either party, or by payment in lieu thereof at the discretion of the Company.
Service contracts with all non Director current KMP are unlimited in term but capable of termination on three months’ notice by either
party, or by payment in lieu thereof at the discretion of the Company.
The Remuneration & Nomination Committee determined the amount of compensation payable to KMP under each agreement. KMP
are also entitled to receive their contractual and statutory entitlements including accrued annual and long service leave, together
with any superannuation benefits, on termination of employment. Compensation levels are reviewed each year to take into account
cost-of-living changes, any change in the scope of the role performed by KMP and any changes required to meet the principles of the
Group’s compensation policy.
Services from remuneration consultants
There were no services received from remuneration consultants during the period.
Non-executive Directors
Total fixed compensation for all Non-executive Directors, last voted upon by shareholders at the 2012 Annual General Meeting, is
not to exceed $600,000 per annum. The Non-executive Directors’ base fee is $92,000 plus statutory superannuation per annum and
the Chairman’s base fee is $150,000 plus statutory superannuation per annum. Mr Streitberg is not eligible for this remuneration.
An additional fee of $7,000 plus statutory superannuation per annum is payable for Non-executive Directors being a member of a
Committee and the fee for chairing a Committee is $14,000 plus statutory superannuation.
ANNUAL REPORT 2014
29
Remuneration Report - Audited
For the year ended 31 December 2014
For personal use only
Key Management Personnel Compensation - Audited
During the 2014 year, the Company underwent a process of significant organisational restructuring to achieve long term cost saving
initiatives. Redundancies were an important and necessary part of this process. This Remuneration Report has therefore been
presented in a manner to show current Directors and other KMP separately from former Directors and KMP. This provides a more
transparent summary of the Company’s Director and KMP current remuneration levels.
Details of the nature and amount of each major element of compensation of each current Director of the Company and other KMP for
the 12 months ended 31 December 2014 and six months ended 31 December 2013, in AUD are as follows:
30
BURU ENERGY LIMITED
Total Current Directors’
Remuneration
Mr E Streitberg, Exec Director
(Executive Chairman since May
2014)
Executive Directors
Total Non-executive Directors’
Remuneration
Mr R Willes, NED
(Appointed Jul 2014)
Ms E Howell, NED
(Appointed Jul 2014)
The Hon. P Jones AM, NED
Non-executive Directors
721,496
304,662
Dec
2013
248,162
Dec
2013
Dec
2014
513,309
56,500
Dec
2013
Dec
2014
208,187
-
Dec
2013
Dec
2014
47,083
-
Dec
2013
Dec
2014
44,167
56,500
Dec
2013
Dec
2014
116,937
Dec
2014
Salary
& Fees
ANNUAL REPORT 2014
-
-
-
-
-
-
-
-
-
-
-
-
STI cash
bonus (E)
9,184
14,634
9,184
14,634
-
-
-
-
-
-
-
-
Nonmonetary
benefits (G)
Short-term
313,846
736,130
257,346
527,943
56,500
208,187
-
47,083
-
44,167
56,500
116,937
Total
28,181
115,248
22,955
95,991
5,226
19,257
-
4,355
-
4,085
5,226
10,817
Superannuation
benefits
-
-
-
-
-
-
-
-
-
-
-
-
Other
long term
Post-employment
-
524,400(C)
-
524,400(C)
-
-
-
-
-
-
-
-
Termination
benefits (F)
-
-
-
-
-
-
-
-
-
-
-
-
ESOP (A) /
SARs (B)
Share-based
payments
342,027
1,375,778
280,301
1,148,334
61,726
227,444
-
51,438
-
48,252
61,726
127,754
Total
0.00%
0.00%
0.00%
0.00%
0.00%
0.00%
0.00%
0.00%
0.00%
0.00%
s300A(1)(e)(i)
proportion of
remuneration
performance
related
0.00%
0.00%
0.00%
0.00%
0.00%
0.00%
0.00%
0.00%
0.00%
0.00%
s300A(1)(e)(vi)
value of share
based payments
as a proportion
of remuneration
For personal use only
Remuneration Report - Audited
For the year ended 31 December 2014
31
32
BURU ENERGY LIMITED
1,883,832
377,290
Dec
2014
Dec
2013
72,628
Dec
2013
Total Current Directors and
Executive Officer Remuneration
1,162,336
Dec
2014
Total Current Executive Officer
Remuneration
-
207,160
-
48,654
-
356,522
72,628
550,000
Dec
2013
Dec
2014
Dec
2013
Dec
2014
Dec
2013
Dec
2014
Dec
2013
Dec
2014
Company Secretary (D)
Head of Finance &
Mr S McDermott,
(Commenced Nov 2014)
General Manager - Commercial
Mr R Aden,
(Commenced Feb 2014)
General Counsel
Mr N Rohr,
(Commenced Nov 2013, ceased
employment 31 Jan 2015)
Chief Operating Officer
Mr P Milford,
Current Executives as at 31 December 2014
Salary &
Fees
-
-
-
-
-
-
-
-
-
-
-
-
STI cash
bonus (E)
9,184
41,627
-
26,993
-
9,871
-
590
-
9,452
-
7,080
Nonmonetary
benefits (G)
Short-term
386,474
1,925,459
72,628
1,189,329
-
217,031
-
49,244
-
365,974
72,628
557,080
Total
34,899
216,313
6,718
101,065
-
19,464
-
4,622
-
25,416
6,718
51,563
Superannuation
benefits
-
-
-
-
-
-
-
-
-
-
-
-
Other
long term
Post-employment
-
524,400(C)
-
-
-
-
-
-
-
-
-
-
Termination
benefits (F)
421,373
3,136,010
469,837
-
79,346
1,760,232
-
293,857
-
95,282
-
485,137
79,346
885,955
Total
-
469,837
-
57,362
-
41,416
-
93,747
-
277,312
ESOP (A) /
SARs (B)
Share-based
payments
0.00%
19.52%
0.00%
43.47%
0.00%
19.32%
0.00%
31.30%
0.00%
19.52%
0.00%
43.47%
0.00%
19.32%
0.00%
31.30%
s300A(1)(e)(i)
s300A(1)(e)(vi)
proportion of
value of share
remuneration based payments
performance as a proportion of
related
remuneration
For personal use only
Remuneration Report - Audited
For the year ended 31 December 2014
Total Directors Remuneration
Total Former Directors
Remuneration
Dr K Wulff, Managing Director
(Ceased employment Jul 2014)
Mr A Miller, NED
(Ceased Feb 2014)
Mr G Riley, NED Chairman
(Ceased May 2014)
1,137,082
753,162
Dec
2013
448,500
Dec
2013
Dec
2014
415,586
310,000
Dec
2013
Dec
2014
338,898
56,500
Dec
2013
Dec
2014
11,771
82,000
Dec
2013
Dec
2014
64,917
Dec
2014
Former Directors as at 31 December 2014
Salary
& Fees
-
250,000
-
250,000
-
250,000
-
-
-
-
STI cash
bonus (E)
14,141
22,316
4,957
7,682
4,957
7,682
-
-
-
-
Nonmonetary
benefits (G)
Short-term
1,089
5,226
70,917
28,675
11,771
56,500
596,580
314,957
767,303
1,409,398
453,457
69,667
193,259
41,486
78,011
7,585
82,000
673,268
6,005
Superannuation
benefits
64,917
Total
-
-
-
-
-
-
-
-
-
-
Other
long term
-
731,066
-
206,666
-
206,666
-
-
-
-
Termination
benefits (F)
Post-employment
110,584
-
110,584
-
110,584
-
-
-
-
-
ESOP (A) /
SARs (B)
Share-based
payments
947,554
2,333,723
605,527
957,945
454,216
874,163
61,726
12,860
89,585
70,922
Total
24.35%
28.59%
0.00%
0.00%
0.00%
0.00%
s300A(1)(e)(i)
proportion of
remuneration
performance
related
24.35%
0.00%
0.00%
0.00%
0.00%
0.00%
s300A(1)(e)(vi)
value of share
based payments
as a proportion
of remuneration
Details of the nature and amount of each major element of compensation of each former Director of the Company and former KMPs for the 12 months ended 31 December
2014 and six months ended 31 December 2013, in AUD are as follows:
For personal use only
Remuneration Report - Audited
For the year ended 31 December 2014
ANNUAL REPORT 2014
33
34
BURU ENERGY LIMITED
Total Directors and Executive
Officer Remuneration
Total Executive Officer
Remuneration
Total Former Executive Officer
Remuneration
Mr T Streitberg,
Head of Strategy
(Ceased employment Jul 2013)
Ms L West
General Counsel
(Ceased employment Apr 2014)
Mr J Ford
GM Community Relations
(Ceased employment Aug 2014)
Ms L Dawson
GM Corporate Affairs
(Ceased employment Jul 2014)
Mr B Williams
GM Commercial
(Ceased employment Dec 2014)
Mr C Bath,
CFO and Company Secretary
(Ceased employment Jul 2014)
3,636,873
1,762,717
Dec
2013
1,009,555
Dec
2013
Dec
2014
2,499,791
936,927
Dec
2013
Dec
2014
1,337,455
38,808
Dec
2013
Dec
2014
-
120,450
Dec
2013
Dec
2014
60,360
45,767
250,000
45,767
-
45,767
-
-
-
-
-
-
156,250
Dec
2013
Dec
2014
-
-
228,574
166,424
Dec
2013
-
-
-
45,767
-
STI cash
bonus (E)
Dec
2014
196,874
270,600
Dec
2013
Dec
2014
601,200
184,395
Dec
2013
Dec
2014
250,447
Dec
2014
Former Executives as at 31 December 2014
Salary
& Fees
27,219
71,163
13,078
48,847
13,078
21,854
-
-
1,405
-
3,540
3,552
-
3,540
3,540
7,080
4,593
7,682
Nonmonetary
benefits (G)
Short-term
8,094
15,394
20,503
14,453
3,375
11,146
-
608,280
274,140
200,414
166,424
232,126
159,790
60,360
121,855
38,808
1,835,703
3,958,036
1,068,400
2,548,638
995,772
138,678
372,816
69,011
179.557
62,293
78,492
21,300
234,755
1,359,309
46,520
Superannuation
benefits
258,129
Total
Post-employment
-
-
-
-
-
-
-
-
-
-
-
-
-
-
-
-
-
-
Other long
term
330,000
1,404,586
330,000
673,520
330,000
673,520
330,000
-
-
-
-
100,000
-
175,000
-
-
-
398,520
Termination
benefits (F)
328,746
469,837
218,162
469,837
218,162
-
-
-
-
-
-
-
-
-
218,162
-
-
-
ESOP (A) /
SARs (B)
Share-based
payments
2,633,127
6,205,275
1,685,573
3,871,552
1,606,227
2,111,321
368,808
-
133,001
63,735
174,243
352,629
181,818
383,508
492,302
608,280
256,055
703,169
Total
0.00%
0.00%
0.00%
0.00%
0.00%
0.00%
0.00%
0.00%
44.31%
0.00%
17.88%
0.00%
0.00%
0.00%
0.00%
0.00%
0.00%
0.00%
0.00%
0.00%
44.64%
0.00%
0.00%
0.00%
s300A(1)(e)(i)
s300A(1)(e)(vi)
proportion of
value of share
remuneration based payments
performance as a proportion of
related
remuneration
For personal use only
Remuneration Report - Audited
For the year ended 31 December 2014
Remuneration Report - Audited
For the year ended 31 December 2014
For personal use only
Notes in relation to the table of KMP remuneration
A.
The fair value of the options issued under the ESOP is calculated at the date of grant using the Black & Scholes option-pricing model and expensed at grant date. The
value disclosed is the portion of the fair value of the options recognised in this reporting period.
B.
The fair value of the SARs is calculated at the date of grant using the Black & Scholes option-pricing model and expensed over the vesting period. The value disclosed is
the portion of the fair value of the SARs recognised in this reporting period.
C.
On 14 January 2014, Mr E Streitberg assumed the role of Non-executive Director of Buru Energy and ceased to act in an executive capacity for the Company. Under Mr
Streitberg’s previous executive contract, he was entitled to a termination benefit of 12 months’ salary in recognition of his service since the foundation of the Company
in 2008. Following Mr Riley’s resignation as Chairman on 23 May 2014, Mr Streitberg was reappointed by the Board in an executive capacity as Executive Chairman and
was engaged at a day rate of $1,600 per day. On 2 July 2014, Dr Wulff entered into an agreement with the Company under which he relinquished his executive position
and resigned as a Director of the Company. Mr Streitberg assumed Dr Wulff’s duties and Mr Streitberg’s remuneration was set at $620,000 per annum excluding
superannuation. This was equivalent to Dr Wulff’s salary prior to his cessation of employment.
D.
Mr McDermott was a KMP from July 2014 following Mr Bath’s cessation of employment. $87,000 salary and $8,019 superannuation from the period January 2014 to
June 2014 is included in the above table.
E.
Dr Wulff received a Short Term Incentive cash bonus during the period of $250,000. In the previous period, Mr Bath received a Short Term Incentive cash bonus of
$45,767 in accordance with his employment contract on completion of 12 months’ service. All bonuses were approved by the Board and have fully vested. No bonuses
were forfeited during the period.
F.
Dr Wulff was provided with a termination benefit of 4 months’ salary based on an annual salary of $620,000. Mr Bath was provided with a termination benefit of 12
months’ salary based on an annual salary of $398,520. Ms Dawson was provided with a termination benefit of 6 months’ salary based on an annual salary of $350,000.
Mr Ford was provided with a termination benefit of $100,000, this amount was agreed between the Company and Mr Ford. In the prior period, Mr Tom Streitberg was
provided with a termination benefit of 10 months’ salary based on an annual salary of $396,000.
G.
Non-monetary benefits to KMP in 2014 relate to the provision of car parking, life insurance and salary continuance insurance.
ANNUAL REPORT 2014
35
Remuneration Report - Audited
For the year ended 31 December 2014
Loans to Key Management Personnel
For personal use only
There were no loans outstanding at the end of the period to key management personnel or their related parties.
Shares held by Key Management Personnel
Held at
1 Jan 14
Commenced as
KMP / Ceased
as KMP
Exercise of
options
Purchased
Sold
Held at
31 Dec 14
28,700,566
-
-
20,000
-
28,720,566
Mr G Riley
1,500,000
(1,500,000)
-
-
-
-
Mr A Miller
1,625,132
(1,625,132)
-
-
-
-
248,277
-
-
-
-
248,277
Ms E Howell
-
-
-
65,000
-
65,000
Mr S McDermott
-
70,000
-
-
-
70,000
KMP
Mr E Streitberg
The Hon P Jones
Analysis of share based payments - ESOP
Details of the options issued under the ESOP to each KMP during the reporting period and details of vesting profiles of options that
vested during the reporting period are as follows:
Number
of options
granted
KMP
Fair value
per option
at grant
Grant
date ($)
date
Exercise
price per
option ($)
Expiry
date
% of
options
vested
Financial
years in
% of
options which grant
vests
forfeited
Mr P Milford (A)
300,000
22 Oct 14
0.14
1.12
31 Dec 16
100%
0%
2014
Mr N Rohr
300,000
22 Oct 14
0.14
1.12
31 Dec 16
100%
0%
2014
Mr R Aden
300,000
22 Oct 14
0.14
1.12
31 Dec 16
100%
0%
2014
Mr S McDermott
300,000
22 Oct 14
0.14
1.12
31 Dec 16
100%
0%
2014
The movement during the period by value of options granted under the ESOP to KMP during the period is detailed below.
Granted during
the period
$(A)
KMP
Value of options
exercised
$(A)
Value of
options lapsed
$(A)
Recognised as an
expense during
the period
$(A)
Mr P Milford (A)
41,416
-
-
41,416
Mr N Rohr
41,416
-
-
41,416
Mr R Aden
41,416
-
-
41,416
Mr S McDermott
41,416
-
-
41,416
36
BURU ENERGY LIMITED
Remuneration Report - Audited
For the year ended 31 December 2014
For personal use only
The movement during the period by number of options granted under the ESOP to KMP during the period is detailed below.
KMP
Held at
1 Jan 14
Granted as
compensation
Exercised
Lapsed
Held at
31 Dec 14
Vested
during
the year
Vested and
exercisable
Mr P Milford (A)
-
300,000
-
-
300,000
300,000
300,000
Mr N Rohr
-
300,000
-
-
300,000
300,000
300,000
Mr R Aden
-
300,000
-
-
300,000
300,000
300,000
Mr S McDermott
-
300,000
-
-
300,000
300,000
300,000
A. Mr P Milford ceased employment with the Company subsequent to the end of the year. All of the options granted under the ESOP
to Mr P Milford have now been forfeited.
No options have been granted since the end of the financial year. The options were provided at no cost to the recipients. All
options expire on the earlier of their expiry date or 30 days after the termination of the individual’s employment. The options vested
immediately and are exercisable from grant date. No terms of options granted as compensation to a KMP have been altered or
modified by the issuing entity during the reporting period or the prior period. During the reporting period, no shares were issued on
the exercise of options previously granted as compensation.
ANNUAL REPORT 2014
37
Remuneration Report - Audited
For the year ended 31 December 2014
Analysis of share based payments - SARs
For personal use only
Details of the Share Appreciation Rights (“SARs”) granted to KMP during the reporting period and details of the vesting profiles of the
SARs granted to KMP that were outstanding at the end of the reporting period are as follows:
Number
of SARs
outstanding
Grant
date
Fair value
per SAR at
Vesting grant date
($)
date
Exercise
Vesting price per
SAR ($)
Condition
Financial
years in
which
% of
% of
grant
SARs
SARs
Expiry
vests
date vested forfeited
Executives
Mr P Milford (A)
Mr N Rohr
Mr S McDermott
38
125,000 3 Jan 14
31 Oct 16
0.61
TSR Peers
1.63
3 Jan 18
0%
0%
2016
125,000 3 Jan 14
31 Oct 16
0.59 TSR ASX200
1.63
3 Jan 18
0%
0%
2016
125,000 3 Jan 14
31 Oct 16
0.68
TSR Peers
1.63
3 Jan 18
0%
0%
2016
125,000 3 Jan 14
31 Oct 16
0.68 TSR ASX200
1.63
3 Jan 18
0%
0%
2016
250,000 3 Jan 14
31 Oct 16
0.71
TSR Peers
1.63
3 Jan 18
0%
0%
2016
250,000 3 Jan 14
31 Oct 16
0.71 TSR ASX200
1.63
3 Jan 18
0%
0%
2016
27,729 3 Jan 14
31 Oct 16
0.61
TSR Peers
1.63
3 Jan 18
0%
0%
2016
27,729 3 Jan 14
31 Oct 16
0.59 TSR ASX200
1.63
3 Jan 18
0%
0%
2016
27,729 3 Jan 14
31 Oct 16
0.68
TSR Peers
1.63
3 Jan 18
0%
0%
2016
27,730 3 Jan 14
31 Oct 16
0.68 TSR ASX200
1.63
3 Jan 18
0%
0%
2016
55,461 3 Jan 14
31 Oct 16
0.71
TSR Peers
1.63
3 Jan 18
0%
0%
2016
55,461 3 Jan 14
31 Oct 16
0.71 TSR ASX200
1.63
3 Jan 18
0%
0%
2016
8,449
3 Jan 14
31 Oct 16
0.61
TSR Peers
1.63
3 Jan 18
0%
0%
2016
8,449
3 Jan 14
31 Oct 16
0.59 TSR ASX200
1.63
3 Jan 18
0%
0%
2016
8,450
3 Jan 14
31 Oct 16
0.68
TSR Peers
1.63
3 Jan 18
0%
0%
2016
8,450
3 Jan 14
31 Oct 16
0.68 TSR ASX200
1.63
3 Jan 18
0%
0%
2016
16,899
3 Jan 14
31 Oct 16
0.71
TSR Peers
1.63
3 Jan 18
0%
0%
2016
16,899
3 Jan 14
31 Oct 16
0.71 TSR ASX200
1.63
3 Jan 18
0%
0%
2016
BURU ENERGY LIMITED
Remuneration Report - Audited
For the year ended 31 December 2014
For personal use only
The movement by value of SARs issued to KMP during the period is detailed below.
Value of SARs
granted
$(A)
KMP
Value of
SARs lapsed
$(A)
Value of SARs
exercised
$(A)
Recognised as an
expense during
the period
$(A)
Mr P Milford (A)
672,500
-
-
235,896
Mr N Rohr
149,187
-
-
52,331
45,458
-
-
15,946
Mr C Bath
600,273
-
(600,273)
-
Ms L Dawson
468,873
-
(468,873)
-
Mr J Ford
374,726
-
(374,726)
-
Mr S McDermott
The movement during the period by number of SARs granted to KMP during the period is detailed below.
Granted as
compensation
Exercised
Lapsed
2,500,000
-
-
(2,500,000)
-
-
-
Mr P Milford (A)
-
1,000,000
-
-
1,000,000
-
-
Mr N Rohr
-
221,839
-
-
221,839
-
-
Mr S McDermott
-
67,596
-
-
67,596
-
-
Mr C Bath
-
791,298
-
(791,298)
-
-
-
Mr B Williams
750,000
-
-
(750,000)
-
-
-
Ms L Dawson
-
626,298
-
(626,298)
-
-
-
Mr J Ford
-
506,563
-
(506,563)
-
-
-
KMP
Mr K Wulff
Held at
1 Jan 14
Held at
% of options
vested
% of options
forfeited
A. Mr P Milford ceased employment with the Company subsequent to the end of the year. All of the SARs granted to Mr P Milford
have now been forfeited.
No expense was recognised during the period for the above SARs that were granted during the period but forfeited prior to vesting
before the end of the period. No SARs have been granted since the end of the financial year. The SARs were provided at no cost
to the recipients. All SARs expire on the earlier of their expiry date or on the termination of the individual’s employment. The SARs
are subject to service conditions and performance hurdles before they vest. The service condition is continued employment with
the Company from 1 November 2013 to 31 October 2016. The performance hurdles are measured against Total Shareholder Return
(TSR) against a custom peer group of companies and the ASX 200 over three separate tranches with the third tranche concluding
31 October 2016. No SARs vest until completion of the service condition on 31 October 2016. No terms of SARs granted as
compensation to a KMP been altered or modified by the issuing entity during the reporting period or the prior period. During the
reporting period, no shares were issued on the exercise of SARs previously granted as compensation.
ANNUAL REPORT 2014
39
For personal use only
Independent Auditors’ Declaration
40
BURU ENERGY LIMITED
Consolidated Statement of Financial Position
For personal use only
As at 31 December 2014
Note
31 December
2014
31 December
2013
Cash and cash equivalents
19a
59,893
60,252
Trade and other receivables
17
5,328
7,394
Inventories
18
6,400
5,724
Investments
15
15,367
-
86,988
73,370
in thousands of AUD
CURRENT ASSETS
Total Current Assets
NON-CURRENT ASSETS
Property, plant and equipment
12
7,585
7,974
Exploration and evaluation expenditure
13
64,930
64,618
Oil and gas assets
14
14,666
11,922
Investments
15
7,311
30,028
94,492
114,542
181,480
187,912
Total Non-Current Assets
TOTAL ASSETS
CURRENT LIABILITIES
Trade and other payables
22
3,713
8,681
Provisions
23
1,208
1,274
4,921
9,955
Total Current Liabilities
NON-CURRENT LIABILITIES
Trade and other payables
22
40,000
40,000
Provisions
23
6,593
6,565
Total Non-Current Liabilities
46,593
46,565
TOTAL LIABILITIES
51,514
56,520
129,966
131,392
258,211
228,149
2,316
3,761
Accumulated losses
(130,561)
(100,518)
TOTAL EQUITY
129,966
131,392
NET ASSETS
EQUITY
Contributed equity
Reserves
The notes on pages 45 to 82 are an integral part of these consolidated financial statements
ANNUAL REPORT 2014
41
Consolidated Statement of Profit or Loss and
Other Comprehensive Income
For the year ended 31 December 2014
For personal use only
in thousands of AUD
Revenue
Note
7
31 Dec 2014
6 Months to
31 Dec 2013
15,141
-
(11,119)
-
4,022
-
1,831
119
Exploration and evaluation expenditure
(13,560)
(8,964)
Impairment of exploration expenditure
(10,183)
-
Operating costs
Gross profit
Other income
8
Impairment of loan provided to suppliers
15
(1,681)
-
Corporate and administrative expenditure
9
(13,281)
(7,034)
24
(1,133)
(729)
(33,985)
(16,608)
Share-based payment expenses
Results from operating activities
Financial income
10
Net finance income
Loss for the period before tax
Income tax (expense)/benefit
11
Loss for the period
2,342
1,627
2,342
1,627
(31,643)
(14,981)
(31,643)
(14,981)
Other comprehensive income
Items that may be reclassified subsequently to profit or loss
Change in fair value of available-for-sale financial assets net of tax
(978)
-
Other comprehensive income for the period, net of income tax
(978)
-
Total comprehensive loss for the period
(32,621)
(14,981)
Loss per share (cents)
21
(10.24)
(5.09)
Diluted Loss per share (cents)
21
(10.24)
(5.09)
The notes on pages 45 to 82 are an integral part of these consolidated financial statements
42
BURU ENERGY LIMITED
Consolidated Statement of Changes in Equity
For personal use only
For the year ended 31 December 2014
Share
capital
Share based
payment
reserve
Financial asset
revaluation
reserve
Retained
losses
Total
equity
$
$
$
$
$
189,311
2,168
1,303
(85,976)
106,806
Loss for the period
-
-
-
(14,981)
(14,981)
Net change in fair value of
available-for-sale financial assets
-
-
-
-
Total comprehensive loss
for the period
-
-
-
38,838
-
-
-
38,838
Share based payment transactions
-
729
-
-
729
Share options exercised/forfeited
-
(439)
-
439
-
38,838
290
-
439
39,567
Balance as at 31 December 2013
228,149
2,458
1,303
(100,518)
131,392
Balance as at 1 January 2014
228,149
2,458
1,303
(100,518)
131,392
Loss for the period
-
-
-
(31,643)
(31,643)
Net change in fair value of available-forsale financial assets
-
-
(978)
-
(978)
-
-
(978)
30,062
-
-
-
30,062
Share based payment transactions
-
1,133
-
-
1,133
Share options/ share appreciation rights
exercised/forfeited
-
(1,600)
-
1,600
-
30,062
(467)
-
1,600
31,195
in thousands of AUD
Balance as at 1 July 2013 (Restated)
Comprehensive income for the period
(14,981)
(14,981)
Transactions with owners recorded
directly in equity
Issue of ordinary shares, net of
transaction costs
Total transaction with owners
recorded directly in equity
Comprehensive income for the period
Total comprehensive loss
for the period
(31,643)
(32,621)
Transactions with owners recorded
directly in equity
Issue of ordinary shares, net of
transaction costs
Total transaction with owners
recorded directly in equity
Balance as at 31 December 2014
258,211
1,991
325
(130,561)
129,966
The notes on pages 45 to 82 are an integral part of these consolidated financial statements
ANNUAL REPORT 2014
43
Consolidated Statement of Cash Flows
For the year ended 31 December 2014
Cash receipts from customers
15,732
253
Payments to suppliers and employees
(21,535)
(7,330)
Payments for exploration and evaluation expenditure
(19,846)
(5,563)
(25,649)
(12,640)
For personal use only
31 December
2014
6 months to
31 December
2013
in thousands of AUD
CASH FLOWS FROM OPERATING ACTIVITIES
Net cash outflow from operating activities
19b
CASH FLOWS FROM INVESTING ACTIVITIES
Interest received
2,301
1,632
(955)
(498)
Payments for exploration and evaluation expenditure
(12,499)
(3,831)
Research and development tax concession received
4,221
-
Payments for oil and gas development assets expenditure
(2,813)
(6,049)
-
(2,000)
Receipts of loan repayment from suppliers
319
-
Transfer to long-term cash held in escrow (**)
(850)
(632)
4,633
-
750
-
Payments for purchase of plant and equipment
Loan provided to suppliers
Withdrawal of cash held in escrow (**)
Proceeds from sale of financial assets
Net cash outflow from investing activities
(4,893)
(11,378)
30,062
38,838
30,062
38,838
Net increase / (decrease) in cash and cash equivalents
(480)
14,820
Cash and cash equivalents at the beginning of the period
60,252
45,437
121
(5)
59,893
60,252
CASH FLOWS FROM FINANCING ACTIVITIES
Proceeds from the issue of share capital (net of transaction costs)
Net cash inflow from financing activities
Effect of exchange rate changes on cash and cash equivalents
Cash and cash equivalents at end of the period
The notes on pages 45 to 82 are an integral part of these consolidated financial statements
** Funds held in escrow on behalf of Alcoa of Australia Limited (Note 15(ii))
44
BURU ENERGY LIMITED
19a
Notes to the Financial Statements
For personal use only
For the year ended 31 December 2014
1.
Reporting Entity
Buru Energy Limited (“Buru Energy” or the “Company”) is a for profit company domiciled in Australia. The address of the
Company’s registered office is Level 2, 88 William Street, Perth, Western Australia 6000. The consolidated financial statements
of the Company as at and for the year ended 31 December 2014 comprise the Company and its subsidiaries (together
referred to as the “Group”) and the Group’s interest in jointly controlled entities. The Group is primarily involved in oil and gas
exploration and production in the Canning Superbasin in the Kimberley region of northwest Western Australia.
2.
Basis of Preparation
(a)
Statement of Compliance
The consolidated financial statements are general purpose financial statements which have been prepared in accordance
with Australian Accounting Standards (AASBs) (including Australian Interpretations) adopted by the Australian Accounting
Standards Board (AASB) and the Corporations Act 2001. The consolidated financial statements of the Group comply with
International Financial Reporting Standards (IFRSs) and interpretations adopted by the International Accounting Standards
Board (IASB). The financial statements were approved by the Board of Directors on 25 March 2015.
(b)
Basis of Measurement
The consolidated financial statements have been prepared on the historical cost basis, except for the following material items
in the statement of financial position:
- Available-for-sale-financial assets are measured at fair value; and
- Share based payments are measured at fair value.
The methods used to measure fair value are discussed further in note 4.
(c)
Functional and Presentation Currency
These consolidated financial statements are presented in Australian dollars, which is each of the Group entities’ functional
currency. The Company is of a kind referred to in ASIC Class Order 98/100 dated 10 July 1988 and in accordance with that
Class Order, all financial information presented in Australian dollars has been rounded to the nearest thousand unless
otherwise stated.
(d)
Use of Estimates and Judgements
The preparation of financial statements in conformity with IFRS requires management to make estimates and assumptions
that affect the application of accounting policies and the reported amounts of assets, liabilities, income and expenses. Actual
results may differ from these estimates. Estimates and underlying assumptions are reviewed on an ongoing basis. Revisions to
accounting estimates are recognised in the period in which the estimate is revised and in any future periods affected.
Information about assumptions and estimation uncertainties in applying accounting policies that have the most significant
effect on the amount recognised in the financial statements are described in the following notes:
ANNUAL REPORT 2014
45
Notes to the Financial Statements
For the year ended 31 December 2014
For personal use only
Note 13 – Exploration and evaluation expenditure
Determining the recoverability of exploration and evaluation expenditure capitalised requires estimates and judgements as
to future events and circumstances, in particular, whether successful development and commercial exploitation or sale of
the respective area of interest is likely. Critical to this assessment are estimates and assumptions as to the timing of expected
cash flows, exchange rates, commodity prices and future capital requirements. If, after having capitalised the expenditure a
judgement is made that recovery of the expenditure is unlikely, an impairment loss is recorded in the income statement.
Note 16 – Recognition of tax losses
In accordance with the group’s accounting policies for deferred taxes (refer note 3(o)), a deferred tax asset is recognised
for unused tax losses only if it is probable that future taxable profits will be available to utilise those losses. Determination
of future taxable profits requires estimates and assumptions as to future events and circumstances, in particular, whether
successful development and commercial exploitation, or alternatively sale, of the respective areas of interest will be achieved.
This includes estimates and judgements about oil and gas prices, reserves, exchange rates, future capital requirements, future
operational performance and the timing of estimated cash flows. Changes in these estimates and assumptions could impact
on the amount and probability of estimated taxable profits and accordingly the recoverability of deferred tax assets. The
carrying amount of deferred tax assets are set out in note 16.
Note 23 – Provisions
The site restoration provision is in respect of the Group’s obligation to rectify environmental liabilities relating to exploration
and production in the Canning Superbasin in accordance with the requirements of the Department of Environmental
Regulation and the Department of Mines and Petroleum. Significant estimates and assumptions are made in determining the
provision for site rehabilitation as there are numerous factors that will affect the ultimate liability payable. These factors include
estimates of the timing, extent and costs of rehabilitation activities, regulatory changes and changes in discount rates. Those
uncertainties may result in future actual expenditure differing from the amounts currently provided. The provision at balance
date represents management’s best estimate of the present value of the future rehabilitation costs required. Changes to
estimated future costs are recognised in the statement of financial position by adjusting the rehabilitation asset and liability.
Note 24 – Measurement of share-based payments
The fair value of share-based payment expenses is measured using the Black & Scholes valuation model that requires the use
of estimates and assumptions for measurement inputs, including expected volatility of the underlying share and weighted
average expected life of the instrument.
(e)
Changes in Accounting Policies
Except for the changes listed below, the Group has consistently applied the accounting policies set out in Note 3 to all periods
presented in these consolidated financial statements.
The Group has adopted the following new standards and amendments to standards, including any consequential
amendments to other standards, with a date of initial application of 1 January 2014.
a) AASB 136 Impairment of Assets
46
BURU ENERGY LIMITED
Notes to the Financial Statements
For personal use only
For the year ended 31 December 2014
The nature and effects of the changes are explained below.
(i)
Subsidiaries
As a result of AASB 10 (2011), the Group has changed its accounting policy for determining whether it has control over and
consequently whether it consolidates its investees. AASB 10 (2011) introduces a new control model that focuses on whether
the Group has power over an investee, exposure or rights to variable returns from its involvement with the investee and ability
to use its power to affect those returns.
In accordance with the transitional provisions of AASB 10 (2011), the Group reassessed the control conclusion for its investees
(refer note 25) at 1 July 2013 and concluded that the application of AASB 10 (2011) does not have any impact on the amounts
recognised in the financial statements.
(ii)
Joint arrangements
As a result of AASB 11, the Group has changed its accounting policy for its interests in joint arrangements. Under AASB 11,
the Group has classified its interests in joint arrangements as either joint operations (if the Group has rights to the assets, and
obligations for the liabilities, relating to an arrangement) or joint ventures (if the Group has rights only to the net assets of an
arrangement). When making this assessment, the Group considered the structure of the arrangements, the legal form of any
separate vehicles, the contractual terms of the arrangements and other facts and circumstances. Previously, the structure of
the arrangement was the sole focus of classification.
The Group has re-evaluated its involvement in its joint arrangements (note 27) and has reclassified the investments from jointly
controlled assets to joint operations. Notwithstanding the reclassification, the Group continues to recognise its share of assets,
liabilities and transactions, including its share of those incurred jointly, in its consolidated financial statements. The application
of AASB 11 therefore does not have any impact on the recognised assets, liabilities and comprehensive income of the Group.
(iii)
Disclosure of interests in other entities
As a result of AASB 12, the Group has expanded its disclosures about its interests in joint arrangements (see note 27).
(iv)
Fair value measurement
AASB 13 establishes a single framework for measuring fair value and making disclosures about fair value measurements when
such measurements are required or permitted by other AASBs. It unifies the definition of fair value as the price that would be
received to sell an asset or paid to transfer a liability in an orderly transaction between market participants at the measurement
date. It replaces and expands the disclosure requirements about fair value measurements in other AASBs, including AASB 7. As
a result, the Group has included additional disclosures in this regard (see Note 15).
In accordance with the transitional provisions of AASB 13, the Group has applied the new fair value measurement guidance
prospectively and has not provided any comparative information for new disclosures. Notwithstanding the above, the change
had no significant impact on the measurements of the Group’s assets and liabilities.
(v)
Employee benefits
In the current period, the Group adopted AASB 119 (2011) which revised the definition of short-term employee benefits to
benefits that are expected to be settled wholly within 12 months after the end of the annual reporting period in which the
employees render the related service. The application of AASB 119 (2011) does not have a significant impact on the amounts
recognised in these financial statements.
ANNUAL REPORT 2014
47
Notes to the Financial Statements
For the year ended 31 December 2014
For personal use only
3.
Significant Accounting Policies
The accounting policies set out below have been applied consistently by Group entities to all periods presented in these
consolidated financial statements.
(a)
Basis of Consolidation
(i)
Subsidiaries
Subsidiaries are entities controlled by the Group. The Group controls an entity when it is exposed to, or has rights to, variable
returns from its involvement with the entity and has the ability to affect those returns through its power over the entity.
The financial statements of subsidiaries are included in the consolidated financial statements from the date that control
commences until the date that control ceases.
(ii)
Joint arrangements
A joint arrangement is an arrangement over which two or more parties have joint control. Joint control exists only when
decisions about the relevant activities - i.e. those that significantly affect the returns of the arrangement - require the
unanimous consent of the parties sharing control of the arrangement. Buru Energy has numerous arrangements which meet
this definition for its oil and gas activities in different exploration permits.
In accordance with AASB 11, the arrangements have been classified as joint operations (whereby the jointly controlling parties
have rights to the assets and obligations for the liabilities relating to the arrangement) as opposed to a joint venture because
separate vehicles have not been established through which activities are conducted. The Group therefore recognises its assets,
liabilities and transactions, including its share of those incurred jointly, in its consolidated financial statements.
(iii)
Transactions eliminated on consolidation
Intra-group balances and transactions, and any unrealised income and expenses arising from intra-group transactions,
are eliminated in preparing the consolidated financial statements. Unrealised gains arising from transactions with equity
accounted investees are eliminated against the investment to the extent of the Group’s interest in the investee. Unrealised
losses are eliminated in the same way as unrealised gains, but only to the extent that there is no evidence of impairment.
(b)
Foreign Currency
Transactions in foreign currencies are translated to Australian Dollars at the foreign exchange rate ruling at the date of the
transaction. Monetary assets and liabilities denominated in foreign currencies at the balance sheet date are translated to
Australian dollars at the foreign exchange rate ruling at that date. Foreign exchange differences arising on translation are
recognised in the income statement.
(c)
Property, Plant and Equipment
(i)
Recognition and measurement
Items of property, plant and equipment are measured at cost less accumulated depreciation and accumulated impairment losses.
Cost includes expenditure that is directly attributable to the acquisition of the asset. Purchased software that is integral to the
functionality of the related equipment is capitalised as part of that equipment.
Gains and losses on disposal of an item of property, plant and equipment are determined by comparing the proceeds from
disposal with the carrying amount of property, plant and equipment and are recognised net in profit or loss.
48
BURU ENERGY LIMITED
Notes to the Financial Statements
For personal use only
For the year ended 31 December 2014
(ii)
Subsequent costs
Subsequent expenditure is capitalised only when it is probable that the future economic benefits associated with the
expenditure will flow to the Group, and its cost can be measured reliably. The costs of the day-to-day servicing of property,
plant and equipment are recognised in profit or loss as incurred.
(iii)
Depreciation
Depreciation is calculated over the depreciable amount, which is the cost of an asset, or other amount substituted for cost,
less its residual value. Depreciation is recognised in profit or loss on a straight-line basis over the estimated useful lives of each
component of property, plant and equipment, since this most closely reflects the expected pattern of consumption of the
future economic benefits embodied in the asset.
The estimated useful lives for the current and comparative period are as follows:
•
plant & equipment
10 – 30 years
•
office equipment
3 – 20 years
•
fixtures and fittings 6 – 20 years
•
intangibles5 years
•
heritage and cultural assets
not depreciated
The useful life, residual value and the depreciation method applied to an asset are reassessed at least annually. Heritage and
cultural assets with the potential to be maintained for an indefinite period through conservation, restoration and preservation
activities are considered to have an indefinite life and not depreciated.
(d)
Exploration and Evaluation Expenditure
Exploration and evaluation expenditure in respect of each area of interest is accounted for using the successful efforts method
of accounting. The successful efforts method requires all exploration and evaluation expenditure to be expensed in the period
it is incurred, except the costs of successful wells and the costs of acquiring interests in new exploration assets, which are
capitalised as intangible exploration and evaluation. The costs of wells are initially capitalised pending the results of the well.
An area of interest refers to an individual geological area where the presence of oil or a natural gas field is considered
favourable or has been proved to exist, and in most cases will comprise an individual prospective oil or gas field.
Exploration and evaluation expenditure is recognised in relation to an area of interest when the rights to tenure of the area of
interest are current and either:
a) such expenditure is expected to be recovered through successful development and commercial exploitation of the area of
interest or, alternatively, by its sale; or
b) the exploration activities in the area of interest have not yet reached a stage which permits reasonable assessment of the existence
of economically recoverable reserves and active and significant operations in, or in relation to, the area of interest are continuing.
Where an ownership interest in an exploration and evaluation asset is exchanged for another, the transaction is recognised by
reference to the carrying value of the original interest. Any cash consideration paid, including transaction costs, is accounted
for as an acquisition of exploration and evaluation assets.
Any cash consideration received, net of transaction costs, is treated as a recoupment of costs previously capitalised with any
excess accounted for as a gain on disposal of non‑current assets.
ANNUAL REPORT 2014
49
Notes to the Financial Statements
For the year ended 31 December 2014
For personal use only
The carrying amounts of the Group’s exploration and evaluation assets are reviewed at each reporting date to determine
whether any of the following indicators of impairment exists:
a) tenure over the licence area has expired during the period or will expire in the near future, and is not expected to be
renewed; or
b) substantive expenditure on further exploration for and evaluation of mineral resources in the specific area is not budgeted
or planned; or
c) exploration for and evaluation of resources in the specific area has not led to the discovery of commercially viable
quantities of resources, and the Group has decided to discontinue activities in the specific area; or
d) sufficient data exist to indicate that although a development is likely to proceed, the carrying amount of the exploration
and evaluation asset is unlikely to be recovered in full from successful development or from sale.
Where an indicator of impairment exists, a formal estimate of the recoverable amount is made and any resultant impairment
loss is recognised in the income statement. (Refer note 3c(i) - (ii)).
When a discovered oil or gas field enters the development phase the accumulated exploration and evaluation expenditure is
transferred to oil and gas assets – assets in development.
(e)
Oil and Gas Assets
Assets in development The costs of oil and gas assets in development are separately accounted for and include past exploration and evaluation costs,
development drilling and other subsurface expenditure, surface plant and equipment and any associated land and buildings.
When the committed development expenditure programs are completed and production commences, these costs are subject
to amortisation. Once the required statutory documentation for a Production Licence is received the accumulated costs are
transferred to oil and gas assets – producing assets.
(f)
Financial Instruments
(i)
Non-derivative financial assets
The Group initially recognises loans and receivables and deposits on the date that they are originated. All other financial assets
(including assets designated at fair value through profit or loss) are recognised initially on the trade date at which the Group
becomes a party to the contractual provisions of the instrument.
The Group derecognises a financial asset when the contractual rights to the cash flows from the asset expire, or it transfers the
rights to receive the contractual cash flows on the financial asset in a transaction in which substantially all the risks and rewards
of ownership of the financial asset are transferred. Any interest in transferred financial assets that is created or retained by the
Group is recognised as a separate asset or liability.
Financial assets and liabilities are offset and the net amount presented in the statement of financial position when, and only
when, the Group has a legal right to offset the amounts and intends either to settle on a net basis or to realise the asset and
settle the liability simultaneously.
The Group has the following non-derivative financial assets: cash and cash equivalents, loans and receivables and availablefor-sale financial assets.
Cash and cash equivalents
Cash and cash equivalents comprise cash balances and call deposits with original maturities of three months or less and are
used by the Group in the management of its short-term commitments.
50
BURU ENERGY LIMITED
Notes to the Financial Statements
For personal use only
For the year ended 31 December 2014
Loans and receivables
Loans and receivables are financial assets with fixed or determinable payments that are not quoted in an active market. Such
assets are recognised initially at fair value plus any directly attributable transaction costs. Subsequent to initial recognition
loans and receivables are measured at amortised cost using the effective interest method, less any impairment losses. Loans
and receivables comprise trade and other receivables.
Available-for-sale financial assets
Available-for-sale financial assets are non-derivative financial assets that are designated as available-for-sale and that are not
classified in any of the other categories of financial assets. Available-for-sale financial assets are recognised initially at fair value
plus any attributable transaction costs. The Group’s investments in equity securities and certain debt securities are classified
as available-for-sale financial assets. Subsequent to initial recognition, they are measured at fair value and changes therein,
other than impairment losses (see note 3(i)(i)), and foreign currency differences on available-for-sale equity instruments, are
recognised in other comprehensive income and presented within equity in the fair value reserve. When an investment is
derecognised, the cumulative gain or loss in equity is transferred to profit or loss.
(ii)
Non-derivative financial liabilities
Financial liabilities are recognised initially on the trade date at which the Group becomes a party to the contractual provisions
of the instrument. The Group derecognises a financial liability when its contractual obligations are discharged or cancelled or
expire. Financial assets and liabilities are offset and the net amount presented in the statement of financial position when, and
only when, the Group has a legal right to offset the amounts and intends either to settle on a net basis or to realise the asset
and settle the liability simultaneously.
The Group has the following non-derivative financial liabilities: trade and other payables.
Trade and Other Payables
Trade payables are non-interest bearing and are normally settled on 30 day terms.
Unearned income includes payments received relating to revenue in subsequent years. Revenue will only be recognised
when Buru Energy delivers the goods or services to the customer.
Such financial liabilities are recognised initially at fair value plus any directly attributable transaction costs. Subsequent to initial
recognition these financial liabilities are measured at amortised cost using the effective interest rate method.
(iii)
Share capital
Ordinary shares
Ordinary shares are classified as equity. Incremental costs directly attributable to the issue of ordinary shares and share options
are recognised as a deduction from equity, net of any tax effects.
(g)
Inventories
Inventories are valued at the lower of cost or net realisable value. Net realisable value is the estimated selling price in the
ordinary course of business, less the estimated costs of completion and selling expenses. Cost is determined as follows:
a) Materials and consumables, which include drilling and maintenance stocks, are valued at the cost of acquisition which
includes expenditure incurred in acquiring the inventories and bringing them to their existing location and condition; and
b) petroleum products, comprising extracted crude oil stored in tanks and pipeline systems, are valued using the full
absorption cost method.
Inventories are accounted for on a FIFO basis.
ANNUAL REPORT 2014
51
Notes to the Financial Statements
For the year ended 31 December 2014
Leased Assets
Leases in terms of which the Group does not assume substantially all the risks and rewards of ownership are classified as
operating leases. The leased assets are not recognised in the Group’s statement of financial position.
(i)
Impairment
For personal use only
(h)
(i)
Non-derivative financial assets (including receivables)
A financial asset not carried at fair value through profit or loss is assessed at each reporting date to determine whether there
is objective evidence that it is impaired. A financial asset is impaired if objective evidence indicates that a loss event has
occurred after the initial recognition of the asset, and that the loss event had a negative effect on the estimated future cash
flows of that asset that can be estimated reliably.
Objective evidence that financial assets (including equity securities) are impaired can include default or delinquency by a
debtor, restructuring of an amount due to the Group on terms that the Group would not consider otherwise, indications that
a debtor or issuer will enter bankruptcy, adverse changes in the payment status of borrowers or users in the Group, economic
conditions that correlate with defaults or the disappearance of an active market for a security. In addition, for an investment in
an equity security, a significant or prolonged decline in its fair value below its cost is objective evidence of impairment.
The Group considers evidence of impairment at both a specific asset and collective level. In assessing collective impairment
the Group uses historical trends of the probability of default, timing of recoveries and the amount of loss incurred, adjusted for
management’s judgement as to whether current economic and credit conditions are such that the actual losses are likely to be
greater or less than suggested by historical trends.
An impairment loss in respect of a financial asset measured at amortised cost is calculated as the difference between its
carrying amount and the present value of the estimated future cash flows discounted at the asset’s original effective interest
rate. Losses are recognised in profit or loss and reflected in an allowance account against receivables. Interest on the impaired
asset continues to be recognised through the unwinding of the discount. When a subsequent event causes the amount of
impairment loss to decrease, the decrease in impairment loss is reversed through profit or loss.
Impairment losses on available-for-sale investment securities are recognised by transferring the cumulative loss that has
been recognised in other comprehensive income, and presented in the fair value reserve in equity, to profit or loss. The
cumulative loss that is reclassified from other comprehensive income and recognised in profit or loss is the difference
between the acquisition cost, net of any principal repayment and amortisation, and the current fair value, less any impairment
loss previously recognised in profit or loss. Changes in impairment provisions attributable to time value are reflected as a
component of interest income.
If, in a subsequent period, the fair value of an impaired available-for-sale debt security increases and the increase can be
related objectively to an event occurring after the impairment loss was recognised in profit or loss, then the impairment loss is
reversed, with the amount of the reversal recognised in profit or loss. However, any subsequent recovery in the fair value of an
impaired available-for-sale equity security is recognised in other comprehensive income.
(ii)
Non-financial assets
The carrying amounts of the Group’s non-financial assets, other than deferred tax assets and inventories, are reviewed at
each reporting date to determine whether there is any indication of impairment. If any such indication exists then the asset’s
recoverable amount is estimated. An impairment loss is recognised if the carrying amount of an asset or its cash-generating
unit exceeds its recoverable amount. For the purpose of impairment testing, assets that cannot be tested individually are
grouped together into a cash-generating unit (“CGU”). A CGU is the smallest identifiable asset group that generates cash flows
that largely are independent from other assets and groups. Impairment losses are recognised in profit or loss.
52
The recoverable amount of an asset or CGU is the greater of its value in use and its fair value less costs to sell. In assessing value
in use, the estimated future cash flows are discounted to their present value using a pre-tax discount rate that reflects current
market assessments of the time value of money and the risks specific to the asset or CGU.
BURU ENERGY LIMITED
Notes to the Financial Statements
For personal use only
For the year ended 31 December 2014
Impairment losses recognised in prior periods are assessed at each reporting date for any indications that the loss has
decreased or no longer exists. An impairment loss is reversed only to the extent that the asset’s carrying amount does not
exceed the carrying amount that would have been determined, net of depreciation or amortisation, if no impairment loss had
been recognised.
(j)
Employee Benefits
(i)
Long-term employee benefits
The Group’s net obligation in respect of long-term employee benefits is the amount of future benefit that employees have
earned in return for their service in the current and prior periods plus related on-costs; that benefit is discounted to determine
its present value, and the fair value of any related assets is deducted. The discount rate is the yield at the reporting date on
AA credit-rated or government bonds that have maturity dates approximating the terms of the Group’s obligations. The
calculation is performed using the projected unit credit method. Any actuarial gains or losses are recognised in profit or loss in
the period in which they arise.
(ii)
Termination benefits
Termination benefits are recognised as an expense when the Group is demonstrably committed, without realistic possibility
of withdrawal, to a formal detailed plan to either terminate employment before the normal retirement date, or to provide
termination benefits as a result of an offer made to encourage voluntary redundancy. Termination benefits for voluntary
redundancies are recognised as an expense if the Group has made an offer of voluntary redundancy, it is probable that the
offer will be accepted, and the number of acceptances can be estimated reliably. If benefits are payable more than 12 months
after the reporting period, then they are discounted to their present value.
(iii)
Short-term benefits
Short-term employee benefit obligations are expensed as the related service is provided.
A liability is recognised for the amount expected to be paid if the Group has a present legal or constructive obligation to pay
this amount as a result of past service provided by the employee and the obligation can be estimated reliably.
(iv)
Share-based payment transactions
The grant date fair value of share-based payment awards granted to employees is recognised as an employee expense, with
a corresponding increase in equity, over the period that the employees unconditionally become entitled to the awards. The
amount recognised as an expense is adjusted to reflect the number of awards for which the related service and non-market
vesting conditions are expected to be met, such that the amount ultimately recognised as an expense is based on the
number of awards that meet the related service and non-market performance conditions at the vesting date. For share-based
payment awards with non-vesting conditions, the grant date fair value of the share-based payment is measured to reflect such
conditions and there is no true-up for differences between expected and actual outcomes.
The fair value of the amount payable to employees in respect of share appreciation rights, which are settled in cash, is
recognised as an expense, with a corresponding increase in liabilities, over the period that the employees unconditionally
become entitled to payment. The liability is remeasured at each reporting date and at settlement date. Any changes in the fair
value of the liability are recognised as personnel expense in profit or loss.
Share-based payment arrangements in which the Group receives goods or services as consideration for its own equity
instruments are accounted for as equity-settled share-based payment transactions, regardless of how the equity instruments
are obtained by the Group. When the Company grants options over its shares to employees of subsidiaries, the fair value at
grant date is recognised as an increase in the investments in subsidiaries, with a corresponding increase in equity over the
vesting period of the grant.
ANNUAL REPORT 2014
53
Notes to the Financial Statements
For the year ended 31 December 2014
Provisions
A provision is recognised when the Group has a present legal or constructive obligation as a result of a past event, and it
is probable that an outflow of economic benefits will be required to settle the obligation and that the obligation can be
measured reliably. Provisions are determined by discounting the expected future cash flows at a pre-tax rate that reflects
current market assessments of the time value of money and, where appropriate, the risks specific to the liability. The
unwinding of the discount is recognised as a finance cost.
For personal use only
(k)
(i)
Site restoration
Provisions are made for the estimated cost of an oil and gas field’s site rehabilitation, decommissioning and restoration.
Provisions include reclamation, plant closure, waste site closure and monitoring activities. The amount recognised as a liability
represents the estimated future costs discounted to present value at a pre-tax rate that reflects current market assessments of
the time value of money and the risks specific to the liability.
Uncertainty exists as to the amount of restoration obligations which will be incurred due to the following factors:
•
uncertainty as to the remaining life of existing operating sites; and
•
the impact of changes in legislation.
At each reporting date the site restoration provision is re-measured to reflect any changes in discount rates and timing or
amounts of the costs to be incurred. Such changes in estimates are dealt with on a prospective basis from the date of the
changes and are added to, or deducted from, the related asset where it is probable that future economic benefits will flow to
the entity.
(l)
Revenue
Revenue from the sale of oil, gas and condensate in the course of ordinary activities is recognised in the income statement
at the fair value of the consideration received or receivable. Revenue is recognised when the significant risks and rewards of
ownership have been transferred to the buyer, recovery of the consideration is probable and the amount of revenue can be
estimated reliably.
(m)
Lease Payments
Payments made under operating leases are recognised in profit or loss on a straight-line basis over the term of the lease. Lease
incentives received are recognised as an integral part of the total lease expense, over the term of the lease. Minimum lease
payments made under finance leases are apportioned between the finance expense and the reduction of the outstanding
liability. The finance expense is allocated to each period during the lease term so as to produce a constant periodic rate of
interest on the remaining balance of the liability. Contingent lease payments are accounted for by revising the minimum lease
payments over the remaining term of the lease when the lease adjustment is confirmed.
Determining whether an arrangement contains a lease
At inception of an arrangement, the Group determines whether such an arrangement is or contains a lease. A specific asset
is the subject of a lease if fulfilment of the arrangement is dependent on the use of that specified asset and the arrangement
conveys the right to use the asset. At inception or upon reassessment of the arrangement, the Group separates payments
and other consideration required by such an arrangement into those for the lease and those for other elements on the basis
of their relative fair values. If the Group concludes for a finance lease that it is impracticable to separate the payments reliably,
an asset and a liability are recognised at an amount equal to the fair value of the underlying asset. Subsequently the liability
is reduced as payments are made and an imputed finance charge on the liability is recognised using the Group’s incremental
borrowing rate.
54
BURU ENERGY LIMITED
Notes to the Financial Statements
For personal use only
For the year ended 31 December 2014
(n)
Finance Income and Expenses
Finance income comprises interest income on funds invested (including available-for-sale financial assets), and gains on the
disposal of available-for-sale financial assets. Interest income is recognised as it accrues in profit or loss, using the effective
interest method.
Finance expenses comprise unwinding of the discount on provisions and impairment losses recognised on financial assets. All
borrowing costs are recognised in profit or loss using the effective interest method.
Foreign currency gains and losses are reported on a net basis.
(o)
Income Tax
Income tax expense comprises current and deferred tax. Income tax expense is recognised in the income statement except
to the extent that it relates to items recognised directly in equity, in which case it is recognised in equity. Current tax is the
expected tax payable or receivable on the taxable income or loss for the year, using tax rates enacted or substantively enacted
at the reporting date, and any adjustment to tax payable in respect of previous years. Deferred tax is recognised in respect of
temporary differences between the carrying amounts of assets and liabilities for financial reporting purposes and the amounts
used for taxation purposes.
Deferred tax is not provided for: temporary differences on the initial recognition of assets or liabilities in a transaction that is
not a business combination and that affects neither accounting nor taxable profit, nor differences relating to investments in
subsidiaries to the extent that they will not reverse in the foreseeable future. The amount of deferred tax provided is based
on the expected manner of realisation or settlement of the carrying amount of assets and liabilities, using tax rates enacted
or substantively enacted at the balance sheet date. A deferred tax asset is recognised only to the extent that it is probable
that future taxable profits will be available against which the asset can be utilised. Deferred tax assets are reviewed at each
reporting date and are reduced to the extent that it is no longer probable that the related tax benefit will be realised.
PRRT
Petroleum Resource Rent Tax (PRRT) is considered for accounting purposes to be a tax on income. Accordingly, current and
deferred PRRT expense is measured and disclosed on the same basis as income tax.
Tax consolidation
The Company and its wholly-owned Australian resident entities have formed a tax-consolidated group. As a consequence, all
members of the tax-consolidated group are taxed as a single entity. The head entity within the tax-consolidated group is Buru
Energy Limited.
(p)
Goods and Services Tax
Revenue, expenses and assets are recognised net of the amount of goods and services tax (“GST”), except where the amount
of GST incurred is not recoverable from the taxation authority. In these circumstances, the GST is recognised as part of the cost
of acquisition of the asset or as part of the expense. Receivables and payables are stated with the amount of GST included.
The net amount of GST recoverable from, or payable to, the ATO is included as a current asset or liability in the balance sheet.
Cash flows are included in the statement of cash flows on a gross basis. The GST components of cash flows arising from
investing and financing activities which are recoverable from, or payable to, the ATO are classified as operating cash flows.
ANNUAL REPORT 2014
55
Notes to the Financial Statements
For the year ended 31 December 2014
Segment Reporting
An operating segment is a component of Buru Energy that engages in business activities from which it may earn revenues
and incur expenses, including revenues and expenses that relate to transactions with any of Buru Energy’s other components.
All operating segments’ operating results are reviewed regularly by the Group’s Executive Chairman and Head of Finance to
make decisions about resources to be allocated to the segment and to assess its performance, and for which discrete financial
information is available. Segment results that are reported to the Executive Chairman and Head of Finance include items
directly attributable to a segment as well as those that can be allocated on a reasonable basis. Unallocated items comprise
mainly corporate assets and head office expenses. Segment capital expenditure is the total cost incurred during the year to
acquire property, plant and equipment, and intangible assets other than goodwill..
(r)
Earnings Per Share
The Group presents basic and diluted earnings per share (“EPS”) data for its ordinary shares. Basic EPS is calculated by dividing
the profit or loss attributable to ordinary shareholders of the Group by the weighted average number of ordinary shares
outstanding during the period, adjusted for shares held by the Group’s sponsored employee share plan trust. Diluted EPS is
determined by adjusting the profit or loss attributable to ordinary shareholders and the weighted average number of ordinary
shares outstanding, adjusted for shares held by the Group’s sponsored employee share plan trust, for the effects of all dilutive
potential ordinary shares, which comprise share options granted to employees.
(s)
Government Grants
Government grants related to assets are recognised initially as a deduction in the carrying amount of the asset when there is
reasonable assurance that the grant will be received and the Group will comply with the conditions associated with the grant.
The grants are then recognised in profit or loss on a systematic basis over the useful life of the asset. Grants that compensate
the Group for expenses incurred are recognised in profit or loss as other income on a systematic basis in the same periods in
which the expenses are recognised.
(t)
New Standards and Interpretations Not Yet Adopted
AASB 9 Financial Instruments (2010), AASB 9 Financial Instruments (2009)
AASB 9 (2009) introduces new requirements for the classification and measurement of financial assets. Under AASB 9 (2009),
financial assets are classified and measured based on the business model in which they are held and the characteristics of
their contractual cash flows. AASB 9 (2010) introduces additional changes relating to financial liabilities. The IASB currently has
an active project to make limited amendments to the classification and measurement requirements of AASB 9 and add new
requirements to address the impairment of financial assets and hedge accounting. AASB 9 (2010) and (2009) are effective
for annual periods beginning on or after 1 January 2015, with early adoption permitted. The impact of the adoption of these
standards is not expected to have a material impact on the financial statements of the Group.
For personal use only
(q)
56
BURU ENERGY LIMITED
Notes to the Financial Statements
For personal use only
For the year ended 31 December 2014
4.
Determination of Fair Values
A number of the Group’s accounting policies and disclosures require the determination of fair value, for both financial and
non-financial assets and liabilities. When measuring the fair value of an asset or a liability, the Group uses market observable
data as far as possible. Fair values are categorised into different levels in a fair value hierarchy based on the inputs used in the
valuation techniques as follows.
-
-
-
If the inputs used to measure the fair value of an asset or a liability might be categorised in different levels of the fair value
hierarchy, then the fair value measurement is categorised in its entirety in the same level of the fair value hierarchy as the
lowest level input that is significant to the entire measurement.
The Group recognises transfers between levels of the fair value hierarchy at the end of the reporting period during which the
change has occurred.
Further information about the assumptions made in measuring fair values is included in the following notes:
- Note 24 – Share-based payment arrangements;
- Note 15 – Investments.
5.
Segment Information
The Group continues to have only one reportable geographical segment being the Canning Superbasin in North West Western
Australia and three reportable operating segments being the Group’s three strategic business units: oil, gas and exploration.
For each of the strategic business units, the Group’s Executive Chairman and Head of Finance review internal management
reports on at least a monthly basis. The following summary describes the operations in each of the Group’s reportable
operating segments:
- Oil: Primarily includes the development and production of the Ungani conventional oilfield. The currently shut in Blina and
Sundown oilfields are also included in this segment.
- Gas: Exploration and appraisal of gas is currently concentrated in the Valhalla and Yulleroo areas where gas has been
intersected in the Laurel Formation.
-Exploration: The exploration program is focused on prospects in the Ungani oil trend and evaluation of the other areas in the
Company’s portfolio, including the Acacia area and the Goldwyer Shale in the southern part of the basin.
Information regarding the results of each reportable segment is included below. Performance is measured in regard to the
Group and its segments principally with reference to earnings before interest and tax, and capital expenditure on exploration
and evaluation assets, oil and gas assets, and property, plant and equipment. Corporate represents a reconciliation of
reportable segments revenues, profit or loss and assets to the consolidated figures.
Level 1: quoted prices (unadjusted) in active markets for identical assets or liabilities.
Level 2: inputs other than quoted prices included in Level 1 that are observable for the asset or liability, either directly (i.e. as
prices) or indirectly (i.e. derived from prices).
Level 3: inputs for the asset or liability that are not based on observable market data (unobservable inputs).
ANNUAL REPORT 2014
57
Notes to the Financial Statements
For the year ended 31 December 2014
For personal use only
Profit or loss
58
Oil
Gas
Exploration
Corporate*
Total
in thousands of AUD
Dec 14
Dec 13
Dec 14
Dec 13
Dec 14
Dec 13
Dec 14
Dec 13
Dec 14
Dec 13
External revenues
15,141
-
-
-
-
-
-
-
15,141
-
Operating costs
(11,119)
-
-
-
-
-
-
-
(11,119)
-
4,022
-
-
-
-
-
-
-
4,022
-
-
-
-
-
-
-
1,670
119
1,670
119
Exploration and evaluation
expenditure
(6)
-
(3,816)
(726)
(9,738)
(8,238)
-
-
(13,560)
(8,964)
Impairment of exploration
expenditure
-
-
-
-
(10,183)
-
-
-
(10,183)
-
Impairment of loan
-
-
-
-
-
-
(1,681)
-
(1,681)
-
Corporate and
administrative expenditure,
including depreciation
-
-
-
-
-
-
(13,281)
(7,034) (13,281)
(7,034)
Share based payment
expenses
-
-
-
-
-
-
(1,133)
(729)
(1,133)
(729)
Profit on sale of financial
assets
-
-
-
-
-
-
161
-
161
-
4,016
-
(3,816)
-
-
-
4,016
-
(3,816)
-
-
-
4,016
-
(3,816)
Gross Profit
Other income
EBIT
Interest income
Reportable segment
profit / (loss) before tax
Income tax expense /
(benefit)
Net profit / (loss)
after tax
(726) (19,922) (8,238) (14,263) (7,644) (33,985) (16,608)
-
-
2,342
1,627
2,342
1,627
(726) (19,922) (8,238) (11,921) (6,017) (31,643) (14,981)
-
-
-
-
-
-
-
(726) (19,922) (8,238) (11,921) (6,017) (31,643) (14,981)
*Corporate represents reconciliation of reportable segments to IFRS measures
BURU ENERGY LIMITED
-
Notes to the Financial Statements
For the year ended 31 December 2014
For personal use only
Total Assets
Oil
Gas
Exploration
Corporate*
Total
Dec 14
Dec 13
Dec 14
Dec 13
Dec 14
Dec 13
Dec 14
Dec 13
Dec 14
Dec 13
1,084
-
-
-
-
-
85,904
73,370
86,988
73,370
Property, plant and
equipment
-
-
-
-
-
-
7,585
7,974
7,585
7,974
Exploration and evaluation
assets
-
-
19,748
17,435
45,182
47,183
-
-
64,930
64,618
14,666
11,922
-
-
-
-
-
-
14,666
11,922
Investments
-
-
-
-
-
-
7,311
30,028
7,311
30,028
Total Assets
15,750
11,922
19,748
17,435
45,182
in thousands of AUD
Current assets
Oil and gas assets –
development
47,183 100,800 111,372 181,480 187,912
*Corporate represents reconciliation of reportable segments to IFRS measures
ANNUAL REPORT 2014
59
Notes to the Financial Statements
For the year ended 31 December 2014
Financial Risk Management
Fair value vs carrying amounts
The carrying value of financial assets and liabilities in the statement of financial position are materially equal to their fair values.
Credit risk of trade and other receivables
Credit risk is the risk of financial loss to the Group if a customer or counterparty to a financial instrument fails to meet its
contractual obligations, and arises principally from the Group’s receivables from customers.
The Group’s exposure to credit risk is influenced mainly by the individual characteristics of each customer.
The Group does not require collateral in respect of trade and other receivables.
The Group does not have an allowance for impairment on trade and other receivables. To date the Group have always
received full consideration for trade and other receivables in a timely manner and as such there is no reason to believe that this
will not continue going forward.
Financial instruments carried at fair value
Fair value measurements for financial instruments are categorised into different levels in the fair value hierarchy based on the
inputs to valuation techniques used. The different levels are defined as follows.
•
Level 1: quoted prices (unadjusted) in active markets for identical assets or liabilities that the Group can access at the
measurement date.
•
Level 2: inputs other than quoted prices included within Level 1 that are observable for the asset or liability, either directly or
indirectly.
For personal use only
6.
•
Level 3: unobservable inputs for the asset or liability
The Group’s available for sale financial assets are classed as Level 1. The Group has no other financial instruments.
Exposure to credit risk
The carrying amount of the Group’s financial assets represents the Group’s maximum credit exposure. The Group’s maximum
exposure to credit risk at the reporting date was:
60
Note
Carrying amount
31 December
2014
31 December
2013
17
4,328
6,921
19a
59,893
60,252
Available-for-sale financial assets
15
601
2,167
Other loans, due after 1 year
15
-
2,000
Cash held in escrow
15
22,077
25,861
86,899
97,201
in thousands of AUD
Trade and other receivables (excluding prepayments)
Cash and cash equivalents
Trade and other receivables include accrued interest receivable from Australian accredited banks of $108,000 (31 Dec 2013:
$187,000), and tax amounts receivable of $486,000 (31 Dec 2013: $4,615,000) from the Australian Taxation Office (refer note 17).
BURU ENERGY LIMITED
Notes to the Financial Statements
For personal use only
For the year ended 31 December 2014
Impairment losses
During the period, the Group recorded an impairment expense of $1.681 million against the loan provided to suppliers. None
of the Group’s other financial instruments were impaired at year end.
Cash and cash equivalents
The Group held cash and cash equivalents of $59,893,000 at 31 December 2014 (31 Dec 2013: $60,252,000) and cash held in
escrow of $22,077,000 (31 Dec 2013: $25,861,000) which represents its maximum credit exposure on these assets. The cash
and cash equivalents are held with bank and financial institution counterparties, which are rated at least AA-, based on rating
agency Fitch Ratings.
Liquidity risk
Liquidity risk is the risk that the Group will not be able to meet its financial obligations as they fall due. The Group’s approach
to managing liquidity is to ensure, as far as possible, that it will always have sufficient liquidity to meet its liabilities when
due, under both normal and stressed conditions, without incurring unacceptable losses or risking damage to the Group’s
reputation. This is monitored through rolling cash flow forecasts. The Group maintains sufficient cash to safeguard liquidity
risk.
The following are contractual maturities of trade and other payables (excluding provisions):
Carrying amount
in thousands of AUD
Less than 1 year
1 – 5 years (i)
31 December
2014
31 December
2013
3,713
8,681
40,000
40,000
43,713
48,681
(i) This profile assumes that gas is not delivered to Alcoa of Australia Limited under the GSA (Note 22(i)).
Market risk
Market risk is the risk that changes in market prices, such as foreign exchange rates, interest rates and equity prices will affect
the Group’s income or the value of its holdings of financial instruments. The objective of market risk management is to manage
and control market risk exposures within acceptable parameters, while optimising the return.
Currency risk
The companies in the Group are exposed to currency risk on sales that are denominated in a currency other than the
functional currency of the companies in the Group (AUD). All sales of crude oil are denominated in US dollars. The Group
does not consider it necessary to hedge its foreign currency exposure due to the relatively low amounts of USD income/
expenditure and USD cash held.
ANNUAL REPORT 2014
61
Notes to the Financial Statements
For the year ended 31 December 2014
For personal use only
Exposure to currency risk
The Group’s exposure to foreign currency risk at balance date was as follows, based on notional amounts:
31 December 2014
31 December 2013
AUD
USD
AUD
USD
514
421
372
333
Trade receivables
1,084
968
-
-
Gross balance sheet exposure
1,598
1,389
372
333
in thousands
Cash and cash equivalents
The average exchange rate from AUD to USD during the period was AUD 0.9029 / USD 1.0000 (Dec 2013: AUD 0.9225 / USD
1.0000). The reporting date spot rate was AUD 0.8202 / USD 1.000 (Dec 2013: AUD 0.8948 / USD 1.000).
Sensitivity analysis
A 10 percent strengthening of the Australian dollar against the USD over the period would have increased the loss after tax for
the financial period by $1,376,454 (Dec 2013: nil as the revenue for the 6 months to Dec 13 was nil). A 10 percent weakening
of the Australian dollar against the USD over the period would have decreased the loss after tax for the financial period by
$1,682,334 (Dec 2013: nil as the revenue for the 6 months to Dec 13 was nil). This analysis assumes that all other variables
remain constant.
Interest rate risk
At balance date the Group’s exposure to market risk for changes in interest rates relate primarily to the Group’s short term
cash deposits. The interest rate risk is only applicable to interest revenue as the Group does not have any short or long term
borrowings. The Group constantly analyses its exposure to interest rates, with consideration given to potential renewal of
the terms of existing deposits. Fixed rate instruments are term deposits held for less than 3 months, therefore the fair value
approximates the carrying amount.
62
BURU ENERGY LIMITED
Notes to the Financial Statements
For the year ended 31 December 2014
For personal use only
At the reporting date the Group’s interest-bearing financial instruments were as follows:
Carrying
amount
Carrying
amount
31 December
2014
31 December
2013
Cash and cash equivalents
41,513
49,840
Cash held in escrow
22,077
25,861
Total fixed interest bearing financial assets
63,590
75,701
in thousands of AUD
Fixed rate instruments
Fair value sensitivity analysis for fixed rate instruments
The Group does not account for any fixed rate financial assets and liabilities at fair value through profit or loss. Therefore a
change in interest rates at the reporting date would not affect profit or loss.
Carrying
amount
Carrying
amount
31 December
2014
31 December
2013
Cash and cash equivalents
18,380
10,412
Total variable interest bearing financial assets
18,380
10,412
in thousands of AUD
Variable rate instruments
Other market price risk
Equity price risk arises from available-for-sale equity securities held in other listed exploration companies. The Group monitors
its available for sale equity instruments on a regular basis including regular monitoring of ASX listed prices and ASX releases.
The Group does not enter into commodity derivative contracts.
Sensitivity analysis – equity price risk
The Group’s equity investments are listed on the Australian Securities Exchange. For such investments classified as available for
sale, a 10 percent increase in the value of the shares at the current and comparative reporting dates would have decreased the
Group’s other comprehensive income of $60,100; an equal change in the opposite direction would have increased the Group’s
other comprehensive income for the period by $60,100.
Capital management
The Group’s objective when managing capital is to safeguard its ability to continue as a going concern, so as to maintain future
exploration and development of its projects. Capital consists of share capital of the Group. In order to maintain or adjust its
capital structure, Buru Energy may in the future return capital to shareholders, issue new shares, borrow funds from financiers
or sell assets. Buru Energy’s focus has been to maintain sufficient funds to fund exploration and evaluation activities. There are
no external borrowings as at 31 December 2014, however Buru Energy has a potential obligation to repay a $40 million Gas
Supply Agreement prepayment (see note 22). There were no changes in the Group’s approach to capital management during
the period. None of the Group’s entities are subject to externally imposed capital requirements.
ANNUAL REPORT 2014
63
Notes to the Financial Statements
For the year ended 31 December 2014
For personal use only
7.
8.
9.
Revenue
in thousands of AUD
Sales of crude oil
6 months ended
31 December
31 December
2013
2014
15,141
-
15,141
-
Other Income
in thousands of AUD
31 December 6 months ended
2014
31 December
2013
Equipment rental
975
31
Fuel tax credits
654
45
Other revenue
202
43
1,831
119
31 December
2014
6 months ended
31 December
2013
Wages and salaries
9,481
4,353
Contract employment services
1,364
524
Other associated personnel expenses
1,374
434
Office and other administration expenses
1,062
1,723
13,281
7,034
31 December
2014
6 months ended
31 December
2013
Interest income on bank deposits
2,221
1,632
Net foreign exchange gain / (loss)
121
(5)
2,342
1,627
Administrative Expenditure
in thousands of AUD
The above expense excludes share based payments disclosed at note 24.
10. Finance Income and Expenses
64
in thousands of AUD
Net finance income recognised in profit or loss
BURU ENERGY LIMITED
Notes to the Financial Statements
For the year ended 31 December 2014
For personal use only
11. Income Tax Expense
6 months ended
31 December
31 December
2013
2014
in thousands of AUD
Current income tax
Current income tax charge
-
Adjustments in respect of previous current income tax
-
-
84
-
84
Deferred tax recognised on movement in financial asset revaluation reserve
-
-
Benefit relating to origination and reversal of temporary differences
-
(84)
-
-
-
-
(31,643)
(14,981)
9,493
4,494
(917)
(251)
49
-
-
-
(8,625)
(4,243)
-
-
Deferred income tax
Total income tax expense / (benefit) reported in the income statement
Numerical reconciliation between tax expense and pre-tax accounting profit
Accounting loss before tax
Income tax benefit using the domestic corporation tax rate of 30%
Increase in income tax due to:
- Non-deductible expenses
- Non-assessable income
- Deferred tax recognised on movement in financial asset revaluation reserve
- Temporary differences and tax losses not brought to account as a DTA
Income tax benefit / (expense) on pre-tax loss
Tax recognised directly in equity
12 months ended 31 December 2014
in thousands of AUD
Financial Assets
Before Tax
Tax
(Expense)
Benefit
Net of tax
-
-
-
6 months ended 31 December 2013
Before Tax
Tax
(Expense)
Benefit
Net of tax
-
-
-
Tax consolidation
The company and its 100% owned entities have formed a tax consolidated group. Members of the consolidated entity have
entered into a tax sharing arrangement in order to allocate income tax expense to the wholly owned controlled entities on a
pro-rata basis. The agreement provides for the allocation of income tax liabilities between the entities should the head entity
default on its tax payment obligations. At balance date, the possibility of default is remote.
ANNUAL REPORT 2014
65
Notes to the Financial Statements
For the year ended 31 December 2014
For personal use only
66
Tax effect accounting by members of the Consolidated Group
Members of the tax consolidated group have entered into a tax funding agreement. The tax funding agreement provides for
the allocation of current taxes to members of the tax consolidated group. Deferred taxes are allocated to members of the tax consolidated group in accordance with a group allocation approach which is consistent with the principles of
AASB 112 Income Taxes. The allocation of taxes under the tax funding agreement are recognised as an increase/decrease in
the controlled entities intercompany accounts with the tax consolidated group head entity, Buru Energy. In this regard, Buru
Energy has assumed the benefit of tax losses from the member entities. The nature of the tax funding agreement is such that
no tax consolidation contributions by or distributions to equity participants are required.
BURU ENERGY LIMITED
Notes to the Financial Statements
For the year ended 31 December 2014
For personal use only
12. Property, Plant and Equipment
in thousands of AUD
Plant and
Office
Fixtures
equipment equipment and fittings
Heritage and
cultural assets
Intangible
Assets
Total
Cost or deemed cost
Carrying amount at 1 July 2013
4,750
1,106
1,661
868
858
9,243
Additions
179
188
120
9
5
501
Disposals
(4)
-
-
-
-
(4)
Transfers
-
-
-
-
-
-
Balance at 31 December 2013
4,925
1,294
1,781
877
863
9,740
Carrying amount at 1 January 2014
4,925
1,294
1,781
877
863
9,740
Additions
574
340
20
-
34
968
Disposals
-
(10)
(1)
-
-
(11)
5,499
1,624
1,800
877
897
10,697
Carrying amount 1 July 2013
(502)
(498)
(165)
-
(57)
(1,222)
Depreciation for the period
(192)
(122)
(146)
-
(87)
(547)
3
-
-
-
-
3
Balance at 31 December 2013
(691)
(620)
(311)
-
(144)
(1,766)
Carrying amount 1 January 2014
(691)
(620)
(311)
-
(144)
(1,766)
Depreciation for the period
(495)
(370)
(307)
-
(179)
(1,350)
-
5
-
-
-
5
(1,186)
(985)
(618)
-
(323)
(3,111)
At 30 June 2013
4,248
608
1,496
868
801
8,021
At 31 December 2013
4,234
674
1,470
877
719
7,974
At 31 December 2014
4,313
639
1,182
877
574
7,585
Balance at 31 December 2014
Depreciation
Disposals
Disposal
Balance at 31 December 2014
Carrying amounts
ANNUAL REPORT 2014
67
Notes to the Financial Statements
For the year ended 31 December 2014
For personal use only
13. Exploration and Evaluation Expenditure Capitalised
in thousands of AUD
31 December
2014
31 December
2013
Carrying amount at beginning of the period
64,618
63,828
Exploration expenditure capitalised
11,161
4,345
Exploration expenditure written off during the period
(10,183)
-
(666)
(3,555)
64,930
64,618
Research and development tax concession
Carrying amount at the end of the period
Exploration and evaluation expenditure in respect of each area of interest is accounted for using the successful efforts method
of accounting. The successful efforts method requires all exploration and evaluation expenditure to be expensed in the period
it is incurred, except the costs of successful wells and the costs of acquiring interests in new exploration assets, which are
capitalised as intangible exploration and evaluation. The costs of wells are initially capitalised pending the results of the well.
Based on a review of exploration and evaluation expenditure capitalised to each area of interest, $10,183,000 of exploration
and evaluation expenditure has been written off in current reporting period in relation to areas where no further exploration or
evaluation of hydrocarbon resources are currently budgeted or planned.
14. Oil and Gas Assets
in thousands of AUD
Assets in Development
Carrying amount at beginning of the period
31 December
2014
31 December
2013
11,922
5,009
Expenditure incurred
4,147
6,913
Amortisation expensed
(1,403)
-
Carrying amount at the end of the period
14,666
11,922
15. Investments
in thousands of AUD
Current
Cash held in escrow (ii)
Non-Current
Available-for-sale financial assets (i)
Cash held in escrow (ii)
31 December
2014
15,367
-
15,367
-
31 December
2014
2,167
6,710
25,861
-
7,311
BURU ENERGY LIMITED
31 December
2013
601
Loan provided to suppliers (iii)
68
31 December
2013
2,000
30,028
Notes to the Financial Statements
For personal use only
For the year ended 31 December 2014
(i)
Investments
The Group’s available-for-sale financial assets are categorised as Level 1 within the fair value hierarchy (refer note 4) and are
measured at fair value based on quoted market prices at the reporting date, without any deduction for transaction costs. There
were no transfers between levels during the period.
(ii)
uru Energy and Alcoa of Australia Limited have agreed to escrow these funds in partial satisfaction of Buru Energy’s potential
B
obligations to repay $40 million to Alcoa of Australia Limited if Buru Energy does not deliver gas (Note 22). The Group’s
exposure to credit, currency and interest rate risks related to other investments is disclosed in note 6. Buru Energy and Alcoa
have entered into an agreement for up to $20 million of the escrowed funds to be applied to fund the next phase of the
appraisal program for the Laurel Wet Gas accumulation and these funds will therefore be released from escrow when required
for the appraisal program, subject to the terms of agreement. The remaining funds will be retained in the escrow account.
$4.633 million has been released from escrow during the period. The classification between current and non-current reflects
expectations around when the timing of funds will be released from escrow.
(iii)
During the period, the Group recorded an impairment expense of $1.681 million against the loan provided to suppliers.
16. Tax Assets and Liabilities
Unrecognised net deferred tax assets
Deferred tax assets have not been recognised in respect of the following items.
in thousands of AUD
31 December
2013
31 December
2013
Net
Movement
Business related costs
797
380
417
Capital loss on bad debts
526
-
526
Accruals
107
106
1
2,340
2,352
(12)
794
372
422
Tax losses
40,452
30,511
9,941
PRRT
45,925
36,197
9,728
4
-
4
90,945
69,918
21,027
(19,479)
(14,903)
(4,576)
(1,695)
(1,689)
(6)
(200)
(200)
-
(30)
-
(30)
(21,404)
(16,792)
(4,612)
69,541
53,126
16,415
Deferred tax assets
Provisions
Development expenditure
Other
Deferred tax liabilities
Exploration expenditure
Property, plant and equipment
Investments in listed entities
Other
Net deferred tax assets not brought to account
The deductible temporary differences and tax losses do not expire under current tax legislation. Deferred tax assets have not
been recognised in respect of these items because it is not probable that future taxable profit will be available against which
the Group can utilise the benefits.
ANNUAL REPORT 2014
69
Notes to the Financial Statements
For the year ended 31 December 2014
17. Trade and Other Receivables
31 December
2014
31 December
2013
1,084
3
108
187
Joint venture receivables
2,644
2,094
Prepayments
1,000
473
486
1,060
Research and development tax concession
-
3,555
Other receivables
6
22
5,328
7,394
For personal use only
in thousands of AUD
Trade receivables
Interest receivable
GST receivable
The Group’s exposure to credit and currency risks and impairment losses related to trade and other receivables are disclosed
in note 6.
18. Inventories
31 December
2014
31 December
2013
5,943
5,118
457
606
6,400
5,724
31 December
2014
31 December
2013
Bank balances
18,380
10,412
Term deposits maturing within 3 months
41,513
49,840
Cash and cash equivalents in the statement of cash flows
59,893
60,252
in thousands of AUD
Materials and consumables – at cost
Petroleum products – at cost
19. (a) Cash and Cash Equivalents
70
in thousands of AUD
The Group’s exposure to interest rate risk and sensitivity analysis for financial assets is disclosed in note 6.
BURU ENERGY LIMITED
Notes to the Financial Statements
For the year ended 31 December 2014
(b) Reconciliation of Cash Flows from Operating Activities
For personal use only
in thousands of AUD
Note
31 December
2014
31 December
2013
(31,643)
(14,981)
Cash flows from operating activities
Loss for the period
Adjustments for:
Income tax expense
11
-
-
Depreciation
12
1,350
547
Impairment losses on exploration expenditure
13
10,183
Amortisation on development expenditure
14
1,403
-
(162)
29
Profit from sale of available-for-sale-financial assets
Share based payment expenses
24
1,133
729
Impairment of loan to suppliers
15
1,681
-
Net finance income
10
(2,342)
(1,627)
(18,397)
(15,303)
Change in trade and other receivables
(1,574)
(1,151)
Change in trade and other payables
(4,949)
4,199
Change in inventories
(676)
(527)
Change in provisions
(54)
142
(7,252)
2,663
(25,649)
(12,640)
Operating loss before changes in working capital and provisions
Changes in working capital, net of acquisitions
Cash received from / (used in) operating activities
Net cash outflow from operating activities
ANNUAL REPORT 2014
71
Notes to the Financial Statements
For the year ended 31 December 2014
20. Capital and Reserves
Share capital
For personal use only
Ordinary Shares Ordinary Shares
31 December
2014
31 December
2013
No.
No.
298,505,530
274,036,429
Issued under Institutional Placement on 15 August 2013
-
21,300,000
Issued under Share Purchase Plan on 13 September 2013
-
3,029,278
37,504,998
-
3,986,550
-
Unlisted options exercised during the period
-
139,823
On issue at the end of the period – fully paid
339,997,078
298,505,530
On issue at the beginning of the period
Issued under Institutional Placement on 26 September 2014 (i)
Issued under Share Purchase Plan on 24 October 2014 (i)
(i)
uring the period, the Company successfully raised a total of $31.1 million (before fees of $1.0 million) through the placement
D
of new shares to institutional investors and a share purchase plan (SPP) for existing shareholders. 37.5 million new shares were
issued under the Institutional Placement (IP), representing approximately 12.5% of the Company’s existing issued capital. The
Company also provided its existing shareholders with an opportunity to gain further exposure to Buru Energy through the SPP,
allowing shareholders to purchase shares at the same price as the IP.
The Company has also issued share options (see note 24). The Company does not have authorised capital or par value in
respect of its issued shares. The holders of ordinary shares are entitled to receive dividends as declared from time to time and
are entitled to one vote per share at meetings of the Company. All shares rank equally with regard to the Company’s residual
assets.
Share-based Payments Reserve
The share-based payments reserve represents the fair value of equity-based compensation to the Group’s Directors and employees.
Financial Asset Revaluation Reserve
The Financial Asset Revaluation Reserve relates to the revaluation of the Group’s available for sale financial assets.
72
BURU ENERGY LIMITED
Notes to the Financial Statements
For the year ended 31 December 2014
21. Loss Per Share
For personal use only
Basic loss per share
in thousands of AUD
Loss attributable to ordinary shareholders
31 December
2014
31 December
2013
31,643
14,981
31 December
2014
31 December
2013
No.
No.
298,505,530
274,036,429
10,607,028
20,173,327
309,112,558
294,209,756
Weighted average number of ordinary shares
Issued ordinary shares at beginning of the period
Effect of shares issued
Weighted average number of ordinary shares at the end of the period
Diluted earnings per share
The Company’s potential ordinary shares, being its options granted, are not considered dilutive as the conversion of these
options would result in a decrease in the net loss per share.
22. Trade and Other Payables
31 December
2014
31 December
2013
Trade payables
1,194
4,554
Non-trade payables and accrued expenses
2,519
4,127
40,000
40,000
43,713
48,681
31 December
2014
31 December
2013
3,713
8,681
40,000
40,000
43,713
48,681
in thousands of AUD
Unearned income (i)
in thousands of AUD
Current
Non-current
The Group’s exposure to currency and liquidity risk related to trade and other payables is disclosed in note 6.
ANNUAL REPORT 2014
73
Notes to the Financial Statements
For the year ended 31 December 2014
For personal use only
(i)Unearned income consists of Buru Energy’s potential obligation to repay a $40 million Gas Supply Agreement (“GSA”). The
GSA provides for the delivery to Alcoa of Australia Limited of up to 500 PJ of gas from gas discoveries made by Buru Energy
on Buru Energy’s Canning Basin permits. Alcoa of Australia Limited now has the right to extend the gas sales contract final
investment decision date on an annual basis until 1 January 2018. Buru Energy will be obliged to repay the $40 million
prepayment in three equal annual instalments concluding on 30 June 2018 if, prior to 1 July 2015, Buru Energy has not
made a final investment decision to proceed with a gas development that would allow the supply of sufficient gas to meet
its delivery obligations under the GSA (unless the FID Date is extended in accordance with the abovementioned right in
which case repayments will commence on 31 December 2018, 31 December 2019 or 31 December 2020 respectively). If
Buru Energy is required to repay the $40 million, there is no interest obligation.
Buru Energy and Alcoa of Australia Limited subsequently entered into an agreement for up to $20 million of the escrowed
funds to be applied to fund the next phase of the appraisal program for the Laurel Wet Gas accumulation. The remaining funds
will be retained in the escrow account.
Revenue will only be recognised when Buru Energy delivers gas under the GSA. At balance date, no gas has been delivered to
Alcoa of Australia Limited and therefore the balance is presented as a non-current payable in the balance sheet.
23. Provisions
74
31 December
2014
31 December
2013
Provision for annual leave
494
560
Provision for site restoration (i)
714
714
1,208
1,274
128
100
6,465
6,465
6,593
6,565
31 December
2014
31 December
2013
7,179
7,179
-
-
7,179
7,179
in thousands of AUD
Current
Non-Current
Provision for long-service leave
Provision for site restoration (i)
(i) Site restoration provision
in thousands of AUD
Opening balance
Provisions made during the period
Balance at the end of the period
The site restoration provision is in respect of the Group’s obligation to rectify environmental liabilities relating to exploration
and production in the Canning Basin in accordance with the requirements of the DER and the DMP. The provision is derived
from an external independent review of the liabilities by Parsons Brinckerhoff which was undertaken in June 2013. Due to the
long-term nature of the liability, there is significant uncertainty in estimating the costs that will be incurred at a future date.
The rehabilitation is expected to occur progressively.
BURU ENERGY LIMITED
Notes to the Financial Statements
For the year ended 31 December 2014
For personal use only
24. Share-based Payments
Description of share-based arrangements
During the year ended 31 December 2014 the following share-based payments were made:
31 December
2014
6 months ended
31 December
2013
Share appreciation rights
803
729
Employee share options
883
-
Share appreciation rights and employee share options forfeited prior to vesting
(553)
-
1,133
729
Fair value expensed in thousands of AUD
The fair value of share based payment arrangements are measured using the Black & Scholes valuation model. Measurement
inputs include share price on a measurement date, exercise price of the instrument, expected volatility (based on weighted
average historic volatility adjusted for changes expected due to publicly available information) weighted average expected life
of the instruments (based on historical experience and general option holder behaviour), expected dividends, and the risk-free
interest rate (based on government bonds). Service and non-market performance conditions attached to the transactions are
not taken into account in determining fair value.
Share Appreciation Rights (SARs)
During the financial year the Group issued SARs to certain employees. Each SAR represents a right to an award equivalent to
the positive difference between the notional share price set at the date of grant and the share price at the date of exercise,
subject to satisfaction of any vesting conditions and exercise conditions. At the Board’s discretion, the award may be settled in
ordinary shares of an equivalent value or as a cash payment. It is the Board’s intention to preserve cash and settle the award in
ordinary shares. The SARs lapse at the earlier of the expiry date and the date of cessation of employment.
ANNUAL REPORT 2014
75
Notes to the Financial Statements
For the year ended 31 December 2014
For personal use only
The fair value of all share appreciation rights granted during the year was measured using the Black & Scholes model. Expected
volatility is estimated by considering historic average share price volatility. The inputs used in the measurement of the fair
values at grant date of the equity settled share based payment plans were as follows:
Grant
Date
Number
SARs
granted
Exercise
Price
Volatility
Expected
Dividends
Risk free
interest
rate
Vesting
Date
Expiry
Date
Fair
Value
Share Appreciation Rights issued to KMPs:
3 Jan 14
264,199
$1.77
$1.63
55%
Nil
3.0%
31 Oct 16
3 Jan 18
$0.61
3 Jan 14
264,199
$1.77
$1.63
55%
Nil
3.0%
31 Oct 16
3 Jan 18
$0.59
3 Jan 14
264,199
$1.77
$1.63
55%
Nil
3.0%
31 Oct 16
3 Jan 18
$0.68
3 Jan 14
264,199
$1.77
$1.63
55%
Nil
3.0%
31 Oct 16
3 Jan 18
$0.66
3 Jan 14
528,399
$1.77
$1.63
55%
Nil
3.0%
31 Oct 16
3 Jan 18
$0.71
3 Jan 14
528,399
$1.77
$1.63
55%
Nil
3.0%
31 Oct 16
3 Jan 18
$0.71
7 Feb 14
137,500
$1.95
$1.63
55%
Nil
2.9%
31 Oct 16
7 Feb 18
$0.77
7 Feb 14
137,500
$1.95
$1.63
55%
Nil
2.9%
31 Oct 16
7 Feb 18
$0.74
7 Feb 14
137,500
$1.95
$1.63
55%
Nil
2.9%
31 Oct 16
7 Feb 18
$0.81
7 Feb 14
137,500
$1.95
$1.63
55%
Nil
2.9%
31 Oct 16
7 Feb 18
$0.79
7 Feb 14
275,000
$1.95
$1.63
55%
Nil
2.9%
31 Oct 16
7 Feb 18
$0.84
7 Feb 14
275,000
$1.95
$1.63
55%
Nil
2.9%
31 Oct 16
7 Feb 18
$0.84
3,213,594
Share Appreciation Rights issued to employees:
3 Jan 14
319,693
$1.77
$1.63
55%
Nil
3.0%
31 Oct 16
3 Jan 18
$0.61
3 Jan 14
319,693
$1.77
$1.63
55%
Nil
3.0%
31 Oct 16
3 Jan 18
$0.59
3 Jan 14
319,693
$1.77
$1.63
55%
Nil
3.0%
31 Oct 16
3 Jan 18
$0.68
3 Jan 14
319,693
$1.77
$1.63
55%
Nil
3.0%
31 Oct 16
3 Jan 18
$0.66
3 Jan 14
639,386
$1.77
$1.63
55%
Nil
3.0%
31 Oct 16
3 Jan 18
$0.71
3 Jan 14
639,386
$1.77
$1.63
55%
Nil
3.0%
31 Oct 16
3 Jan 18
$0.71
7 Feb 14
31,250
$1.95
$1.63
55%
Nil
2.9%
31 Oct 16
7 Feb 18
$0.77
7 Feb 14
31,250
$1.95
$1.63
55%
Nil
2.9%
31 Oct 16
7 Feb 18
$0.74
7 Feb 14
31,250
$1.95
$1.63
55%
Nil
2.9%
31 Oct 16
7 Feb 18
$0.81
7 Feb 14
31,250
$1.95
$1.63
55%
Nil
2.9%
31 Oct 16
7 Feb 18
$0.79
7 Feb 14
62,500
$1.95
$1.63
55%
Nil
2.9%
31 Oct 16
7 Feb 18
$0.84
7 Feb 14
62,500
$1.95
$1.63
55%
Nil
2.9%
31 Oct 16
7 Feb 18
$0.84
2,807,544
76
Share Price
at Grant
Date
BURU ENERGY LIMITED
Notes to the Financial Statements
For the year ended 31 December 2014
For personal use only
The total number of SARs issued during the period was 6,021,138. The movement during the reporting period in the number
of share appreciation rights is as follows:
Number of SARs
SARs on issue as at 1 January 2014
5,000,000
Granted during the period ended 31 December 2014
6,021,138
Forfeited during the period ended 31 December 2014*
(7,534,591)
Outstanding as at 31 December 2014
3,486,547
* 6,834,591 SARs forfeited during the period prior to vesting with the expense being reversed in the statement of profit or loss.
The vesting profile of the SARs outstanding as at 31 December 2014 are as follows:
Number of SARs
Vested and exercisable as at 31 December 2014
450,000
Vesting 31 December 2015
300,000
Vesting 31 October 2016
2,736,547
Outstanding as at 31 December 2014
3,486,547
Employee Share Option Plan (ESOP)
At the 2012 Annual General Meeting, shareholders reapproved the Company’s ESOP for a further three years. Options are
issued for no consideration and vested immediately. All options refer to options over ordinary shares of Buru Energy Limited
which are exercisable on a one for one basis. The fair value of all share options granted during the year was measured using the
Black and Scholes model. Expected volatility is estimated by considering the historic share price volatility. The inputs used in
the measurement of the fair values at grant date of the equity settled share based payment plans were as follows:
Number
ESOP options
granted
Share Price
at Grant
Date
Exercise
Price
$0.75
$1.12
6,400,000
Volatility
Expected
Dividends
Risk free
interest
rate
Expiry
Date
Fair
Value
51%
Nil
2.5%
31 Dec 16
$0.14
6,400,000
The number and weighted average exercise prices of share options are as follows:
Weighted average
exercise price ($)
Number of
options
Outstanding unlisted options as at 1 January 2014
4.04
1,339,800
Granted 22 Oct 2014
1.12
6,400,000
Forfeited during the period ended 31 December 2014
4.04
(1,339,800)
Outstanding as at 31 December 2014
1.12
6,400,000
The unlisted share options outstanding as at 31 December 2014 have an exercise price of $1.12 (December 2013: $4.04), and
a weighted average contractual life of 2.0 years (December 2013: 1 year). All options outstanding fully vested in previous
reporting periods.
ANNUAL REPORT 2014
77
Notes to the Financial Statements
For the year ended 31 December 2014
For personal use only
25. Group Entities
Parent entity
Buru Energy Limited (i)
Country of
incorporation
Ownership
interest
Ownership
interest
31 December 2014
31 December 2013
Australia
Subsidiaries
Terratek Drilling Tools Pty Limited
Australia
100%
100%
Royalty Holding Company Pty Limited
Australia
100%
100%
Buru Energy (Acacia) Pty Limited
Australia
100%
100%
Buru Operations Pty Limited
Australia
100%
100%
Yakka Munga Pastoral Company Pty Limited
Australia
100%
100%
Buru Fitzroy Pty Limited
Australia
100%
100%
(i) Buru Energy Limited is the head entity of the tax consolidated group. All subsidiaries are members of the tax consolidated group.
26. Parent Entity Disclosures
As at, and throughout the year ended 31 December 2014 the parent company of the Group was Buru Energy Limited.
Company
12 months ended 6 months ended
31 December
2014
31 December
2013
(25,238)
(12,648)
(978)
-
(26,216)
(12,648)
88,912
77,806
192,271
192,293
4,921
9,952
51,514
56,517
258,211
228,149
2,316
3,761
Retained earnings
(119,770)
(96,134)
Total equity
140,757
135,776
in thousands of AUD
Result of the parent entity
Loss for the period
Other comprehensive income / (expense)
Total comprehensive loss for the period
Financial position of the parent entity at year end
Current assets
Total assets
Current liabilities
Total liabilities
Total equity of the parent entity at year end
Share capital
Reserves
78
Company
BURU ENERGY LIMITED
Notes to the Financial Statements
For the year ended 31 December 2014
For personal use only
27. Joint Operations
The consolidated entity has an interest in the following joint operations as at 31 December 2014 whose principal activities
were oil and gas exploration and development.
Permit/Joint
Operation
December 2014
Beneficial Interest
December 2013
Beneficial Interest
Operator
Country
EP 371
50.00%
50.00%
Buru Energy Ltd
Australia
EP 390
25.00%
50.00%
Buru Energy Ltd
Australia
EP 391
50.00%
50.00%
Buru Energy Ltd
Australia
EP 428
50.00%
50.00%
Buru Energy Ltd
Australia
EP 431
50.00%
50.00%
Buru Energy Ltd
Australia
EP 436
50.00%
50.00%
Buru Energy Ltd
Australia
EP 438
25.00%
37.50%
Buru Energy Ltd
Australia
EP 457
37.50%
37.50%
Buru Fitzroy Pty Ltd
Australia
EP 458
37.50%
37.50%
Buru Fitzroy Pty Ltd
Australia
EP 471
25.00%
50.00%
Buru Energy Ltd
Australia
EP 472
50.00%
50.00%
Buru Energy (Acacia) Pty Ltd
Australia
EP 473
25.00%
50.00%
Buru Energy Ltd
Australia
EP 476
50.00%
50.00%
Buru Energy Ltd
Australia
EP 477
50.00%
50.00%
Buru Energy (Acacia) Pty Ltd
Australia
EP 478*
100.00%
100.00%
Buru Energy (Acacia) Pty Ltd
Australia
* Subject to Trident Energy farm-in right to earn a 17.5% interest. Upon satisfaction or expiration of this right, Buru Energy must
transfer half of its remaining interest to Mitsubishi.
ANNUAL REPORT 2014
79
Notes to the Financial Statements
For the year ended 31 December 2014
The Group’s interests in assets/liabilities and income/expenditure employed in the above joint operations are detailed below.
The amounts are included in the financial statements under their respective asset categories.
For personal use only
12 months ended 6 months ended
31 December
2014
31 December
2013
2
1
(32,449)
(4,690)
(32,447)
(4,689)
1
113
Trade and other receivables
248
867
Inventory
483
490
Total current assets
732
1,470
Exploration expenditure
50,652
44,288
Development expenditure
16,107
11,708
Total non-current assets
66,759
55,996
Trade and other payables
3,809
6,742
Total current Liabilities
3,809
6,742
63,681
50,724
31 December
2014
31 December
2013
Less than one year
1,208
1,229
Between one and five years
2,154
3,382
-
-
3,362
4,611
in thousands of AUD
Income
Expenditure
Current assets
Cash and cash equivalents
Non-current assets
Current Liabilities
Share of net assets of joint venture operations
28. Operating Leases
Leases as lessee
Non-cancellable operating lease rentals are payable as follows:
in thousands of AUD
More than five years
The Group leases a corporate office in Perth and an office/warehouse facility in Broome. The leases expire in October 2017 and
November 2015 respectively. Both have options to renew the lease after the expiry dates.
The Group also maintains operating leases for production vehicles and accommodation for employees required to travel for
work purposes.
The total operating lease amount recognised as an expense during the period was $1,435,000 (6 months ended 31 December
2013: $691,000).
80
BURU ENERGY LIMITED
Notes to the Financial Statements
For the year ended 31 December 2014
29. Capital and Other Commitments
31 December
2014
31 December
2013
Within one year
14,125
26,150
One year later and no later than five years
36,131
24,075
-
-
50,256
50,225
For personal use only
in thousands of AUD
Exploration expenditure commitments
Contracted but not yet provided for and payable:
Later than five years
The commitments are required in order to maintain the petroleum exploration permits in which the Group has interests
in good standing with the Department of Mines & Petroleum (“DMP”). These obligations may be varied from time to time,
subject to approval by the DMP. Included in the above are the commitments during the term of the State Agreement,
under which Buru Energy and Mitsubishi have committed to the continued exploration, appraisal and, if technically viable,
development of the gas resources of the permits with the objective of delivering gas into the Western Australian domestic gas
market.
30. Contingencies
There were no material contingent liabilities or contingent assets for the Group as at 31 December 2014 (30 June 2014: nil).
31. Related Parties
Key management personnel compensation
The key management personnel compensation comprised:
in AUD
Short-term employee benefits
Post-employment benefits
Termination benefits
Share-based payments
31 December
2014
6 months ended
31 December
2013
3,958,036
1,835,703
372,816
138,678
1,404,586
330,000
469,839
328,746
6,205,275
2,633,127
Individual Directors and executives compensation disclosures
Information regarding individual Directors and executives compensation and some equity instruments disclosures as required
by Corporations Regulations 2M.3.03 is provided in the Remuneration Report section of the Directors’ report on pages 28 to 39.
Apart from the details disclosed in this note, no Director has entered into a material contract with the Group since the end of
the previous financial year and there were no material contracts involving directors’ interests existing at the end of the period.
Other related party transactions
No other related party transaction has occurred during the reporting period.
ANNUAL REPORT 2014
81
Notes to the Financial Statements
For the year ended 31 December 2014
32. Subsequent Events
For personal use only
During the year the Company was successful in a tender for the Yakka Munga pastoral lease that covers the area of the Ungani
facility. Settlement took place subsequent to end of the year on 16 January 2015 with payment of the purchase price of
$7,000,000.
33. Auditors’ Remuneration
82
31 December
2014
6 months ended
31 December
2013
87,425
70,250
Audit services
KPMG Australia: Audit and review of financial reports
All amounts payable to the Auditors of the Company were paid or payable by the parent entity.
BURU ENERGY LIMITED
For personal use only
Directors’ Declaration
1
In the opinion of the Directors of Buru Energy Limited (‘the Company’):
(a)the consolidated financial statements and notes that are contained on pages 41 to 82 and the Remuneration report in the
Directors’ report, set out on pages 28 to 39, are in accordance with the Corporations Act 2001, including:
(i)Giving a true and fair view of the Group’s financial position as at 31 December 2014 and of its performance, for the
financial period ended on that date; and
(ii)Complying with Australian Accounting Standards (including the Australian Accounting Interpretations) and the
Corporations Regulations 2001.
(b) There are reasonable grounds to believe that the Group will be able to pay its debts as and when they become due and
payable.
2
The Directors have been given the declarations required by Section 295A of the Corporations Act 2001 from the Executive
Chairman and Head of Finance, for the year ended 31 December 2014.
3
The Directors draw attention to Note 2(a) to the consolidated financial statements, which includes a statement of compliance
with International Financial Reporting Standards.
Signed in accordance with a resolution of the Directors:
- - - - - - - - - - - - - - - - - - - - - - - - - - - - - - - - - - - - - - - - - - - - - - - - - - - Mr Eric Streitberg
Ms Eve Howell
Non-executive Director
Executive Chairman
PerthPerth
25 March 2015
25 March 2015
ANNUAL REPORT 2014
83
For personal use only
Independent Audit Report
84
BURU ENERGY LIMITED
For personal use only
Independent Audit Report
ANNUAL REPORT 2014
85
Additional ASX Information
Additional information required by the ASX Limited Listing Rules and not disclosed elsewhere in this report is set out below.
The distribution of ordinary shares ranked according to size as at 28 February 2015 was as follows:
Ordinary shares
%
No. of holders
%
100,001 and Over
242,276,422
71.26
340
3.76
10,001 to 100,000
75,082,372
22.08
2,511
27.75
5,001 to 10,000
12,387,216
3.64
1,588
17.55
1,001 to 5,000
9,508,409
2.80
3,204
35.40
742,659
0.22
1,407
15.55
339,997,078
100.00
9,050
100.00
1,032,111
0.30
1,651
18.24
No. of ordinary shares
%
For personal use only
Category
1 to 1,000
Total
Unmarketable Parcels
The 20 largest ordinary shareholders of the ordinary shares as at 28 February 2015 were as follows:
Rank Name
1
BIRKDALE ENTERPRISES PTY LTD
29,213,557
8.59
2
COOGEE RESOURCES PTY LTD
26,666,666
7.84
3
UBS WEALTH MANAGEMENT AUSTRALIA NOMINEES PTY LTD
12,486,317
3.67
4
MR ERIC CHARLES STREITBERG
10,568,133
3.11
5
FLEXIPLAN MANAGEMENT PTY LTD
8,517,469
2.51
6
CITICORP NOMINEES PTY LIMITED
8,370,277
2.46
7
NATIONAL NOMINEES LIMITED
8,268,409
2.43
8
CVC LIMITED
6,049,151
1.78
9
J P MORGAN NOMINEES AUSTRALIA LIMITED
5,842,952
1.72
10
MAXIGOLD HOLDINGS PTY LTD
5,052,043
1.49
11
HSBC CUSTODY NOMINEES (AUSTRALIA) LIMITED
4,765,124
1.40
12
MS NICOLA MARIE YEOMANS
4,722,400
1.39
13
TROJAN OSF PTY LTD
3,706,000
1.09
14
CHARRINGTON PTY LTD
2,700,000
0.79
15
AUSTRALIAN FOUNDATION INVESTMENT COMPANY LIMITED
2,500,000
0.74
16
PGP PTY LTD
2,080,000
0.61
17
WHITTINGHAM SECURITIES PTY LIMITED
2,000,000
0.59
18
ABN AMRO CLEARING SYDNEY NOMINEES PTY LTD
1,860,995
0.55
19
CHARRINGTON PTY LTD
1,720,000
0.51
20
ROCKET SCIENCE PTY LTD
1,520,000
0.45
Total twenty largest shareholders
148,609,493
43.71
Balance of register
191,387,585
56.29
Total register
339,997,078
100.00
86
BURU ENERGY LIMITED
Additional ASX Information
The following interests were registered on the Company’s register of Substantial Shareholders as at 28 February 2015:
For personal use only
Shareholder
Number of ordinary shares
%
Birkdale Enterprises Pty Ltd
29,213,557
8.59
Eric Streitberg and his associates
28,720,566
8.45
Coogee Resources Pty Ltd
26,666,666
7.84
Voting rights
Ordinary shares
At a general meeting of shareholders:
(a) On a show of hands, each person who is a member or sole proxy has one vote.
(b) On a poll, each shareholder is entitled to one vote for each fully paid share.
Unlisted Options
There are no voting rights attached to the unlisted options:
Other information
Buru Energy Limited, incorporated and domiciled in Australia, is a publicly listed company limited by shares.
The Company is listed on the Australian Securities Exchange. ASX Code: BRU
The Company and its controlled entities schedule of interests in permits as at 28 February 2015 were as follows:
Permit
Type
EP129
Exploration permit
100.00%
Buru Energy Ltd
EP371
Exploration permit
50.00%
Buru Energy Ltd
EP390
Exploration permit
25.00%
Buru Energy Ltd
EP391
Exploration permit
50.00%
Buru Energy Ltd
EP428
Exploration permit
50.00%
Buru Energy Ltd
EP431
Exploration permit
50.00%
Buru Energy Ltd
EP436
Exploration permit
50.00%
Buru Energy Ltd
EP438
Exploration permit
25.00%
Buru Energy Ltd
EP457
Exploration permit
37.50%
Buru Fitzroy Pty Ltd
EP458
Exploration permit
37.50%
Buru Fitzroy Pty Ltd
EP471
Exploration permit
25.00%
Buru Energy Ltd
EP472#
Exploration permit
50.00%
Buru Energy (Acacia) Pty Ltd
EP473
**
Ownership
Operator
Exploration permit
25.00%
Buru Energy Ltd
#
Exploration permit
50.00%
Buru Energy Ltd
EP477#
Exploration permit
50.00%
Buru Energy (Acacia) Pty Ltd
EP478*#
Exploration permit
100.00%
Buru Energy (Acacia) Pty Ltd
L6
Production license
100.00%
Buru Energy Ltd
L8
Production license
100.00%
Buru Energy Ltd
L17
Production license
100.00%
Buru Energy Ltd
PL7
Onshore pipeline license
100.00%
Buru Energy Ltd
EP476
Subject to Trident Energy farm-in right to earn a 17.5% interest. Mitsubishi is entitled to an interest equal to Buru’s interest.
Excluding Backreef Area
#
Subject to Apache option as announced on 4 November 2013.
*
** ANNUAL REPORT 2014
87
For personal use only
Annual Report For the six months ended 31December 2014
2014
Buru Energy Limited
1
www.buruenergy.com
Annual Report


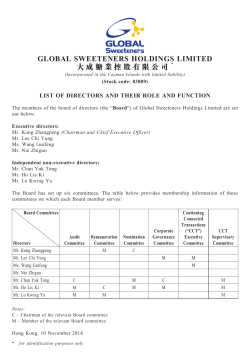

© Copyright 2026