
ON THE BRINK: - Carnegie Community Action Project
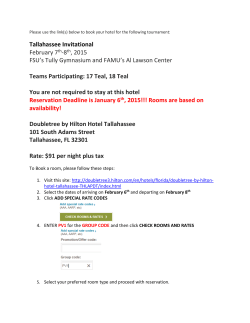
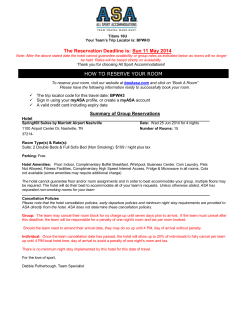
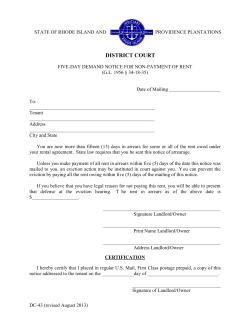
CARNEGIE COMMUNITY ACTION PROJECT’S
2014 HOTEL SURVEY AND HOUSING REPORT
ON THE BRINK:
THE DTES HOUSING CRISIS
By Jean Swanson and Tamara Herman
Researched by Jim Cardinal, King-mong Chan, Clifford Cheena & Tracey Morrison
ON THE BRINK: THE DTES HOUSING CRISIS
CCAP’S 2014 HOTEL SURVEY AND HOUSING REPORT
Written by Jean Swanson & Tamara Herman
Thank you to our researchers Jim Cardinal, King-mong Chan, Clifford Cheena and
Tracey Morrison
Thank you to King-mong Chan for the Chinatown chart (pg. 12), Rory Sutherland for
the support and Dianna Hurford for the list of Chinatown society buildings.
This report is dedicated to the memory of Bud Osborn, who loved the Downtown Eastside
and hated gentrification, and Anthony Curtis Snakeskin, who helped CCAP do research for
past hotel reports. This report is also dedicated to all the people who have lost their lives
in SRO hotels, shelters, and on the streets because they have been systematically denied
dignified, safe, affordable housing.
CCAP acknowledges that our neighbourhood lies on the Unceded Territories
of the Coast Salish People: Tsleil-Waututh, Musqueam, Squamish.
Carnegie Community Action Project (CCAP)
c/o Carnegie Centre, 401 Main St., Vancouver,
Unceded Coast Salish Territories, BC V6A 2T7
www.ccapvancouver.wordpress.com
CCAP is a project of the board of the Carnegie Community Centre Association, which has about
5,000 members, most of whom live in the Downtown Eastside (DTES) of Vancouver. CCAP
works on housing, income, and land use issues in the DTES so that the area can remain a
low income friendly community. CCAP works with DTES residents as they speak out for the
changes they would like to see in their neighbourhood.
Thank you to Vancity for supporting CCAP’s work. Support for this
project does not necessarily imply that funders endorse the findings or
contents of this report.
If you find any inaccuracies in this report please contact Jean Swanson at
[email protected]
Printed in Vancouver (Unceded Coast Salish Territories) March 2015. Report design by Tamara Herman.
Cover: Cranes begin construction on the Sequel Condo project, which will mean 79 condos and 18 social
housing units, of which only half (9) will rent at welfare rates. Sequel is located directly across the street from
Insite, a supervised consumption centre. BC Housing subsidized Sequel with a low-interest loan.
raise shit [an excerpt]
downtown eastside poem of resistance
by Bud Osborn
...and gentrification has become a central
characteristic
of what neil smith perceives as
“a revengeful and reactionary viciousness
against various populations accused of
‘stealing’ the city
from the white upper classes”
and this viciousness and violence
brought to the downtown eastside
by friendly predators
such as builders planners architects landlords
bankers and politicians...
INTRODUCTION & HIGHLIGHTS
For Downtown Eastside (DTES) low-income
residents, the housing crisis sweeping the
neighbourhood is old news. As CCAP has
documented, rents in privately-owned hotels have
risen steadily in the 6 years since we published
our first study. In 2014, however, scarcely a
month went by without news of the housing crisis
in the headlines.
The year began with low-income, predominantly
Chinese speaking seniors, at the Chau Luen
Towers fighting – and winning – a move
by the landlord to increase rents by up to
40%. The landlord used a section of the
Residential Tenancy Act that allows them to
raise rents to match other similar buildings in
the neighbourhood to justify the increase. The
case was chilling: Despite a victory this time,
many expect the same reasoning to be used in
other buildings in the future as rents continue
escalating.
In March 2014, the Local Area Plan (LAP) for
the DTES was passed amid controversy on all
sides. For developers, some business owners
and some home-owners, the zoning rule barring
condos from the DTES Oppenheimer Sub-
District was viewed as a move to “ghettoize” the
neighbourhood. For many low-income residents,
the Oppenheimer Sub-District was but a small
measure of protection against rising rents and
affordable housing shortages in a neighbourhood
that has seen property values rise by 300% over
the past 12 years1. With disappointing numbers
of new social housing proposed, a definition that
fails to ensure people on welfare can afford to live
in social housing, and allowances for new market
development throughout the neighbourhood, the
LAP falls short of protecting the DTES as a lowincome neighbourhood.
In April 2014, with municipal elections looming,
the Metro Vancouver Homelessness Count
results were released. Homelessness was in
the news again. In the City of Vancouver, street
homelessness had risen by 249% since the last
regional count in 2011 and had almost doubled
since the 2013 local count2.The mayor cited
1 City of Vancouver (2014). “Downtown Eastside Social Impact Assessment: Draft Report.” Available at http://vancouver.ca/files/cov/social-impact-assessment-2014-feb-26.pdf
2 2014 Metro Vancouver Homeless Count Preliminary
Report (2014). Available at http://stophomelessness.ca/
wp-content/uploads/2008/09/Preliminary_release_report_final_April_23_14_to_be_posted.pdf
CCAP Hotel Survey and Housing Report 2014 | 01
INTRODUCTION & HIGHLIGHTS
2015”3 was overshadowed with a muted priority
of “affordable housing and support for the
most vulnerable.”4 At the same time, there was
turbulence on the provincial front: BC Housing
announced an asset transfer program, which
would involve the sale of 350 parcels of leased
land and nine buildings to non-profit housing
operators. Although BC Housing has said that it
will reinvest the $500 million to be gained through
the sales into social housing, it is unclear what
the future of such housing projects will be and
how much housing will be available to people on
welfare in the DTES.
Police at Oppenheimer Park Tent City. CCAP photo
renovictions from SROs in the DTES as one of
the reasons behind the dramatic increase.
Then, in July, with homelessness at a tipping
point, a tent city began in Oppenheimer Park. The
homeless campers issued a statement asserting
their unceded Aboriginal Title and denying the
City’s jurisdiction to evict them from the park.
By October, the tent city had grown from 40 to
200 tents. Many tenters had absolutely no other
housing options, and some said that living in a
tent was a more humane option than living in an
SRO.
With the City struggling to find a justification
to issue an injunction and evict the tenters, it
became clear that there simply was not enough
housing to offer people. The City opened a
shelter with 40 mats, which many tenters rejected
as an unacceptable housing option. Finally, the
City signed a lease on an old Quality Inn Hotel,
which is slated for demolition in two years’ time.
There is now a 600 person waiting list for the
building’s 157 rooms. When the eviction order
was issued in October, the tent city campers had
succeeded in winning some of the only new –
albeit temporary – affordable housing to open in
2014.
The rest of the fall was marked by a turbulent
municipal election period, where Vision
Vancouver’s 2011 promise of “ending street
homelessness in the city of Vancouver by
02 | CCAP Hotel Survey and Housing Report 2014
In the backdrop, and out of the news, loomed
the development future of Chinatown. With 753
condos and upscale market rental units proposed
– and only 11 social housing units at welfare rate
– a tidal wave of gentrification is poised to strike
the neighbourhood. The biggest concentration
of remaining low income housing in the DTES is
now in Chinatown.
The history of the DTES teaches us that these
buildings will not be sheltered from the rising
property values and property taxes that come
with a massive number of market housing. CCAP
3 Mayor of Vancouver (2011). “Mayor Gregor Robertson’s
Inaugural Address.” Available at http://www.mayorofvancouver.ca/mayor-gregor-robertsons-inaugural-address
4 Vote Vision (2014). “More Affordable Housing and Support for the Most Vulnerable.“ Available at http://www.
votevision.ca/affordable_housing
Chinatown Vancouver. Photo under CC License by
Flickr/Chrystian Guy
INTRODUCTION & HIGHLIGHTS
Bud Osborn memorial wall at the site of Sequel 138. Photo under CC License by wikipedia/ Eviatar Bach
documented the “Woodwards Effect” on housing
in our 2012 report, “We’re trying to get rid of
the welfare people.” Essentially, all the hotels –
except one – that surround the new Woodwards
development increased their rents beyond what
people on welfare can afford.
At the end of a year when the housing crisis has
become impossible to ignore, CCAP conducted
its annual study of rents in privately-owned single
room occupancy hotels (SROs) in the DTES.
With over 14,000 people on the BC Housing
waiting list, SROs are widely considered to be the
last stop before homelessness for the city’s most
vulnerable and marginalized residents.
CCAP’s annual Hotel Survey and Housing Report
is a measure of whether low-income people can
afford to remain in a neighbourhood they have
built, contributed to and brought to life.
Above all else, the cost of housing determines
who can live in a neighbourhood and who faces
either homelessness or displacement. For many
DTES low-income residents surviving on income
assistance, the welfare shelter allowance of $375
per month is a benchmark of whether housing is
affordable and accessible. This year, we found:
• Between 2009 and 2014, the average lowest
rents in hotels surveyed by CCAP increased
from $398 to $485;
• 81% of all hotels rooms we obtained
information from are in hotels where rents
begin at $425;
• Residents surviving on social assistance and
paying the average rent of $485 in DTES
hotels have $125 per month left to cover food,
transit, basic necessities and other expenses;
• Four of the 12 hotels with rooms renting at
$375 or less are in Chinatown or Strathcona;
• The largest reserve of affordable housing,
renting at $425 or less, is in Chinatown or
Strathcona, where 753 market housing units
were either built in 2014, approved or in the
development or rezoning proposal phase;
• $500 is the lowest rent in 23 hotels and $700
is the lowest rent in 9 hotels (with 445 rooms);
Woodwards. CCAP photo
• The rate of change of proposed and approved
residential buildings for 2013 to 2014 is 1471
units above welfare rate and 314 at welfare
rate or a ratio of 4.7 to 1.
CCAP Hotel Survey and Housing Report 2014 | 03
RENTS
SAMPLE INFORMATION
Number of hotels checked
Number of hotels that provided rent information
Number of rooms in hotels that provided rent information
Percentage of rooms in hotels that provided rent information
2013
81
64
3071
93%
2014
79
68
3004
96%
For all our reports we have conservatively
grouped hotels by the lowest rent in the rent
range. This means that hundreds of people
actually pay higher rents than it appears by
looking at our data. For example, in some
cases CCAP has classified a hotel as having
rents that begin at $425 even though some
rooms in the building rent for $550 or more.
than we did last year. A breakdown of the hotels
renting rooms at $375 shows that this is not
because there are more affordable rooms. For
the first time, CCAP had a Cantonese-speaking
surveyor who was able to get information from
more buildings where the manager or desk
clerks spoke only Cantonese. This allowed
us to access information for four more hotels,
two of which are owned by Chinese societies.
All four hotels have rents in the $375 or lower
range5. Thus, of the 12 hotels where the lowest
rent is $375 or less, four are buildings in
Chinatown or Strathcona that were not included
in last year’s report. In total, 81% of all hotel
rooms we obtained information from are in
hotels where rents begin at $425.
This year’s results look deceptively optimistic.
CCAP found more rooms that rent for $375
5 Lung Jen Benevolent ($300), Tsung Tsin Benevolent
($240), Keefer Cabins ($375), Lucky Rooms ($380)
Rents are the first indicator in determining
whether a room is available for a low-income
tenant. Most hotels have rooms that rent
at different rates. Because CCAP does not
have access to the hotel owners’ books, our
surveyors ask managers and desk clerks what
the rent range is in each hotel.
Money remaining after rent paid
Welfare rates versus rent costs
04 | CCAP Hotel Survey and Housing Report 2014
$125
money remaining
after rent paid
2014
RENTS
SIX YEARS OF HOTEL SURVEY FINDINGS
Percentage of hotel rooms where all rooms rent for
$375 or less
Number of rooms in hotels where all rooms rent for
$375 or less
Vacant hotel rooms renting for $375 or less
Number of rooms in hotels where lowest rent is $425
or more
Between 2009 and 2014, the average lowest
rents in hotels surveyed by CCAP increased from
$398 to $485. If we omit the four affordable buildings in Chinatown and Strathcona we accessed
this year in order to better compare with previous
years, the average lowest rent for 2014 is $495.
As shown in the chart below, inflation only accounts for $34 of this $87 increase6.
Every year, CCAP tracks the number of rooms in
hotels where the lowest rent is more than $425
a month, or 70% of a monthly welfare cheque
and $50 over the welfare shelter allowance. This
year, researchers found 166 more rooms where
the lowest rents are $425 or higher. The lowest
6 Inflation rate calculated using Bank of Canada inflation
calculator. Available at http://www.bankofcanada.ca/rates/
related/inflation-calculator/
2009
2010
2011
2012
2013
2014
29%
12%
7%
5%
4%
9%
777
365
235
159
126
283
4
1416
2
1689
2
1567
1
2042
0
2278
2
2444
rents in a total of 46 of the 64 hotels CCAP
surveyed are $425 or more.
Equally disconcerting is the fact that rents are
escalating beyond $425 to $500 and more.
Last year, CCAP found 14 hotels with 614 rooms
that rent for $500 or more. This year CCAP,
found 23 hotels where $500 is the lowest rent.
In total, these hotels contained 907 rooms. This
year, CCAP also found 9 hotels with 445 rooms
where the lowest rent is $700 or more.
Social assistance rates have not been raised
above $610 since 2007. In 2014, a person on
social assistance spending the average SRO rent
of $485 would be spending 80% of their income
on housing.
Average lowest rents for hotels surveyed by CCAP from 2009 - 2014
$495
Average SRO Rent Rate
Inflation Rate
average lowest
rent
2014
CCAP Hotel Survey and Housing Report 2014 | 05
VACANCIES
Vacancy numbers give us a glimpse of what options are available for people who are looking for housing.
This year, CCAP obtained vacancy information from 61 hotels, of which 22 had vacancies. Of the 22,
CCAP collected rent information from 18 hotels. There was only one room available at a rent of $375 and
it measured 6 by 8 feet.
DOUBLE BUNKING
Some hotels allow two people to share one small room and collect double rent from them. Cramming two
people into one tiny room is a recipe for conflict. It is also especially bad for women who may experience
violence from their partner. In some cases, however, double bunking is an alternative to homelessness.
In this year’s report, CCAP obtained information on double bunking from 48 hotels. Of those, 13 admitted
that they allowed two people to share one room and nine provided us with rent information. Although one
hotel does not charge for an extra tenant and another charges a $25 fee, seven charge between $600 and
$1120 when two people share a room.
DAILY/WEEKLY RENTALS
CCAP tracks daily and weekly rentals because they can erode the stock of permanent housing. Temporary
tenants usually pay higher rents than monthly tenants. Besides, except for a handful of SROs that are
legally allowed to rent on a daily weekly basis, the practice is illegal in most hotels. For this year’s report,
CCAP’s researchers got information on daily-weekly rental from 46 hotels. Informants at four hotels said
they rent on a daily or weekly basis. One was the Ivanhoe, which has an exemption from the city that
allows it to rent some rooms on this basis.
The Clifton Hotel. CCAP photo
06 | CCAP Hotel Survey and Housing Report 2014
GENTRIFICATION
Gentrification is continuing at a rapid pace in the DTES. Since CCAP’s last report, Steven Lippman,
the DTES’s most notorious gentrifier, bought two more hotels: The Station and Thornton Park. In 2014,
the lowest rent at the Station increased by $190 and the lowest rent at Thornton Park increased by
$125. Many low income tenants were evicted or bought out, and with lowest rents at $600 and $525
respectively, low income DTES residents cannot hope to move in. Eight hotels, including The Station
and Thornton Park, increased their rents by over $100.
HOTELS WITH RENT INCREASES OVER $100 IN 12 MONTHS
Hotel
Alexander Court
American Hotel
Lowest rent 2013
$500.00
$500.00
Lowest rent 2014
$700.00
$700.00
Increase
$200.00
$200.00
Burns Block
$900.00
$1,000.00
$100.00
Golden Crown
$700.00
$800.00
$100.00
Grand Trunk
$550.00
$750.00
$200.00
New Columbia
$570.00
$800.00
$230.00
The Station
$410.00
$600.00
$190.00
Thornton Park
$400.00
$525.00
$125.00
For this year’s report, CCAP looked again at rents in five hotels that gentrified rapidly, beginning
in 2010. In just four years, average lowest rents increased by 51% in these hotels to $775, which
exceeds welfare shelter rate allowances by $400. Inflation only accounts for $31 of this increase. The
rapidly gentrifying hotels are another marker of how rents in the neighbourhood skyrocket without
Average lowest rents for 5 hotels that gentrified very rapidly between
2010 - 2014
$775
average lowest
rent for rapidly
gentrifying hotels
2014
Average rents
Inflation rates
CCAP Hotel Survey and Housing Report 2014 | 07
GENTRIFICATION
While high rents are the most forceful forms
of discrimination against low income tenants,
gentrifying hotels continue to use outright
discrimination against people on welfare. As
described in our 2013 report, online advertising,
requesting LinkedIn profiles for applicants,
installing security cameras and using keyless
entry cards that are expensive to replace
discourage and prevent low income people from
renting rooms.
Two of our surveyors are low income
Indigenous residents. They reported feeling that
discrimination based on race and income came
into play when asking about rents and vacancies
in several hotels. For example, the surveyors told
CCAP that desk staff at the Alexander Court were
rude and the New Columbia clerk said that the
hotel does not rent to people on social assistance
or disability. The clerk at Keefer Rooms said there
were no vacancies at first, but when the surveyor
talked about how clean and quiet she was, an
empty room appeared.
RATE OF CHANGE: 2013 to 2014
The rate of market housing development
compared to social housing development is
called the “rate of change.” CCAP monitors the
rate of change because the city’s 2005 Housing
Plan, adopted by City Council, called for the
rate of change in the Downtown Eastside to be
1:17. In other words, for every one unit of market
housing, one unit of social housing should be
built. This is because if the rate of change is too
fast, and market housing dominates, low-income
people can be forced out of their neighbourhood.
For the people who remain, the neighbourhood
can become unsafe and unwelcoming. Lately it
has become apparent that the city is not trying
to keep the rate of change at 1:1, as the rate of
approved condo and market development units is
soaring.
7 City of Vancouver (2005). Housing Plan for the DTES.
Available at http://vancouver.ca/files/cov/housing-plan-forthe-downtown-eastside-2005.pdf
8 City of Vancouver (2014). “Downtown Eastside/Oppenheimer Official Development Plan.” Available at http://
former.vancouver.ca/commsvcs/BYLAWS/odp/deod.pdf
9 City of Vancouver (2013). “Regular Council Meeting
Minutes: December 3, 2013.” Available at http://former.
vancouver.ca/ctyclerk/cclerk/20131203/documents/regu20131203min.pdf
08 | CCAP Hotel Survey and Housing Report 2014
In 2005, low income people were not excluded
from “social housing” just because their incomes
were too low. However, recently, with the passing
of the DTES Local Area Plan, the City’s definition
of “social housing” in the DTES means only
one third of “social housing” units will be rented
at no higher than income assistance rates; but
there are no maximum rents for the remaining
two thirds of “social housing” units8. They could
be as high as $1,443 a month for a studio unit,
which City Council defines as “affordable rental
housing.”9 CCAP refuses to accept that social
housing can rent over $1400 a month as this
amounts to over $800 a month more than what
a person on welfare receives for their entire
income. That is why we distinguish between
social housing that people on welfare can afford
and what the City defines as social housing
when we report on rate of change. The citywide definition of “social housing” is even worse
with no units required to rent at or below income
assistance rates.
In 2013, the rate of change for new units
approved and proposed was 2.7 market units
for every one welfare and pension rate social
housing unit. The rate of change for the number of units that actually opened in 2014 is 28 market
units at 219 E. Georgia St. to 139 social housing units at 590 Alexander St. However, the Alexander
St. project is among the few remaining sites yet to be completed out of the 14 sites owned by
the City for which the Province announced funding back in 2007. There have been no such
announcements from the Province for new projects since then.
The rate of change for new units approved and proposed but not built for 2014 is as follows:
Development
Name
Market
Social housing
Social housing
(Address)
housing
units above
units at welfare
units
welfare rate
rate
138 E. Hastings
Sequel
79
9
9
211 Gore
Remand
70
25
188 Keefer (611 Main) 188 Keefer
134
11
11
955 E. Hastings
Wall
282
35
35
720 East Hastings
Library
21
189 Keefer
Keefer Block
81
633 Main
Blue Sky Chinatown 192
558 E. Cordova
Boffo
24
5
606 Powell
Drake
146
150 E. Cordova
INGastown
61
179 Main
47
4
5
626 Alexander
24
5
41 E. Hastings
78
68
52
231 E. Pender
Framework
60
137 Keefer
14
105 Keefer
137
450 Gore
61
TOTALS
1344
127
314
The rate of change of proposed and approved residential buildings for 2013 to 2014 is 1471 units
above welfare rate and 314 at welfare rate, or a ratio of 4:7 to 1.
CCAP Hotel Survey and Housing Report 2014 | 09
CHINATOWN
The rate of change calculation hints at the most
substantial threat to the future of the DTES as a
low income neighbourhood: The gentrification of
Chinatown. The three most recent development
applications in the Downtown Eastside are all
located in or near Chinatown, and none contain
any social housing units. In total, in addition to
28 condo units completed in 2014, 427 condos
and 298 market rental units are either approved
or proposed in or near Chinatown. Only 11 social
housing units at welfare rate and 6 BC Housing
Income Limits (HILS) rate units are proposed
(about $850/month currently).
Yet the 536 market housing units, 125 single
social housing units and 75 social housing family units at Woodwards paint a more optimistic
picture in terms of rate of change than the development future of Chinatown, with a ratio of 759
unaffordable units to 11 affordable units or a rate
of change of 69:1.
If numbers are any indication, the influx of condos and upscale market rentals into Chinatown
will surpass the Woodwards development in
terms of scope and impact. CCAP’s hotel reports
have painted a clear picture of rising rents in the
radius surrounding Woodwards.
Part of the reason rents are so low in Chinese
family clan and benevolent society-owned
buildings is because of the rich history and
contributions of the Chinese community in
Vancouver. Beginning over 100 years ago,
Chinese family clan and benevolent societies
Chinatown holds some of the most affordable
housing remaining in the DTES. Average rents,
for example, in the 11 SRO buildings located in
Chinatown are $409, or $76 below the average
for all SROs.
Change in Chinatown. Photo under CC License by Flickr/Ted McGrath
10 | CCAP Hotel Survey and Housing Report 2014
purchased buildings to support their community
members who came to Canada in order to
work and provide for their families at home.
In delivering supports and services to their
members, the societies played in an important
role in bringing Chinatown to life.
Societies still own approximately 50 buildings in
the DTES, of which 20 are in Chinatown10. Many
of these buildings offer low-rent housing to lowincome Chinese seniors, who are among the
neighbourhood’s most vulnerable residents.
Many of the societies are struggling to pay
expenses and maintain their buildings. Ming Sun,
a building that rented rooms to seniors at $150
to $300 per month, was closed last year due to
maintenance issues. The Ming Sun Benevolent
Society has been unable to raise funds to repair
and reopen the building as low income housing.
With the escalating property values – and taxes –
that come with a flood of market housing, CCAP
is concerned that family clan and benevolent
societies will no longer be able to offer low rents
for seniors.
The Chau Luen Tower, managed by the Chau
Luen Kon Sol Society, is another example of how
rising rents jeopardize low income housing in
Chinatown. When the buildings’ predominantly
elderly and Chinese-speaking residents were
given notice that their rents would increase by
30% to 40%, the tenants filed a case at the
Residential Tenancy Board (RTB). The society
argued that the rent hike was justified because
the BC Residential Tenancy Act allows landlords
to raise rents to match other rates in the area.
One of the two buildings listed by the society was
the Golden Crown, which rents at $800 to $1200.
Although the RTB ruled in favour of the tenants
and against the rent increase, the 298 new
market rentals slated for Chinatown could give
landlords a stronger case in the future.
Anyone familiar with Vancouver’s Chinatown
will have noticed a tremendous difference
in local stores and shops over the past few
years. Expensive cafes, designer furniture
stores, brand-name clothing stores and fancy
restaurants have opened and some have taken
the place of a number of low cost stores and
restaurants that served the Chinese community.
In the past year, changes along Pender and
Keefer Streets have been impossible to ignore.
The rising property values that come with condos
also mean rising rents for retail. We can expect
that more Chinese retail serving the low income
community will be forced to close their doors in
the future.
Chinese seniors face multiple barriers due to their poverty, language and
age. CCAP’s work in Chinatown over
the past years has taught us much
about the importance of community
and place in the lives of many low income seniors. Without rent protections
or new social housing units, the future
of the community is in jeopardy.
10 City of Vancouver (2014). “Administrative
Report: Chinese Family Clan and Benevolent Societies in the Downtown Eastside:
A New Grant Program and Strategic Support for Buildings with Heritage, Affordable
Housing, or Cultural Assets.” Available
at http://former.vancouver.ca/ctyclerk/
cclerk/20140708/documents/a1.pdf
Millennium Gate. CCAP photo
CCAP Hotel Survey and Housing Report 2014 | 11
在華埠的發展計劃 | DEVELOPMENT PROJECTS IN CHINATOWN
狀況
Status
大廈名字
(層數)
地址
發展商
Address
Developer
Name of
Building
(Number of
Stories)
完成
(2014年)
The Flats
(9)
Completed
(in 2014)
被市議會
批准
Approved
219 佐治東
街
188 奇化街
Blue Sky
Chinatown
(15)
Keefer
Block (10)
633 緬街
Main St.
Keefer St
189 奇化街
Westbank
Bosa
Blue Sky
Properties
Solterra
Keefer St.
Framework 231 片打東
(8)
街 E. Pender
Number of Units
私人柏文
單位
(買)
市價的
出租單
位
Condos
Market
Rental
「廉價房屋」
(卑詩省房屋入
息限額: 月租
$850)
社會房
屋 (福利
金額: 月
租$375)
Affordable Housing (BC Housing
Income Limits:
$850/month)
Social
housing
(Welfare
Rate: $375/
month)
Panther
E. Georgia St.
188 Keefer
(17)
住宅單位的數量
Porte Dev.
28
-
-
-
134
5
6
11
-
192
-
-
81
-
-
-
61
-
-
-
-
40
-
-
-
61
-
-
14
-
-
-
137
-
-
-
455
298
6
11
St.
---- (9)
---- (6)
發展計
劃申請
---- (9)
245 佐治東
街E Georgia
St.
450 歌雅街
Gore Ave
137 奇化街
Keefer St.
Proposed
(Development)
土地更改
申請
Proposed
(Rezoning)
---- (13)
105 奇化街
GMC
Projects
GMC
Projects
James
Schouw
and
Associates
Beedie
Keefer St.
總數
Total
總數 (超過福利金額的住屋)
Total Non-Welfare Rate Housing
總數 (按着福利金額的住屋)
Total Welfare Rate Housing
不可負擔住屋同可負擔住屋的比例
Ratio of Unaffordable to Affordable Housing
12 | CCAP Hotel Survey and Housing Report 2014
759
11
69:1
RECOMMENDATIONS
In 2014 the City of Vancouver counted the highest number of homeless people ever. The combination
of low welfare rates, lack of new social housing and gentrification pushed more people onto the street
and into shelters. To solve these problems, all levels of government must take action as follows:
CITY GOVERNMENT
#1. Use City powers to impose non-profit management on hotels with outstanding Standards of
Maintenance complaints, ensuring that tenants have the protection of the Residential Tenancy Act.
#2. Lease SROs to non-profit organizations to keep them from being gentrified and ensure good
management.
#3. Designate enough land for 5000 units of social housing in the Downtown Eastside to show senior
governments that the City is serious about solving the housing crisis.
#4. Restore minimum unit size to 320 sq. ft so people have a home that is livable and feels
permanent.
#5. Do not provide incentive to profit or non profit SRO owners to upgrade their units unless rents are
maintained at welfare/pension rate.
#6. Amend the SRA bylaw to define SRO hotel “conversion” to mean raising rents above welfare and
pension level shelter rates. Include zero-eviction conditions in all renovation and building permits.
#7. Stop market housing development in the DTES to keep property values low and preserved for
social housing until SRO hotels have been replaced with safe, secure, self-contained and residentcontrolled low-income social housing and no one needs to sleep on the streets or in shelters.
#8. Develop an SRO tenant organizer structure to educate, support and liaise between tenants
and bylaw and Residential Tenancy enforcement bodies. Embrace a women-centred philosophy in
hotels with policies and practices that ensure women’s access and safety in all spaces, especially for
Aboriginal women and women of colour.
PROVINCIAL GOVERNMENT
#1. Raise welfare, disability and minimum wage rates substantially.
#2. Reform the Residential Tenancy Act to provide effective rent control by the rental unit rather
than the tenant. This will stop giving landlords an incentive to evict low-income people and will end
renovictions.
CCAP Hotel Survey and Housing Report 2014 | 13
RECOMMENDATIONS
#3. Legislate the right of all tenants to organize tenant unions.
#4. Ensure that residents of all non profit social housing, including hotel rooms, supportive housing
projects and emergency shelters, have full tenant rights under the Residential Tenancy Act.
#5. Provide funds to build 10,000 units a year of low income social housing throughout the province.
Replace 1,000 SRO units with self-contained, resident controlled social housing every year for five
years in the DTES.
#6. Amend the BC Human Rights Code and Residential Tenancy Act to make it illegal to discriminate
on the basis of social condition including class, poverty and drug use.
#7. Ensure that immigration status is not a barrier to social housing.
FEDERAL GOVERNMENT
Enact a national housing program immediately. Provide funds to build low income social housing in
the DTES to replace 1,000 SRO units per year for the next five years.
14 | CCAP Hotel Survey and Housing Report 2014
APPENDICES
APPENDIX 1
Which hotels were surveyed?
CCAP started with the city’s 2009 SRO list for the DTES. We deleted buildings run by non-profits
because they are generally cleaner and cheaper. These include Kye7e, Sereena’s Place, Cosmopolitan, Dodson, Hampton Hotel, Jubilee Rooms, Powell Rooms, Heatley Apartments, International Inn,
The London, Holborn, Seaview, Colonial, Lion, and Princess Rooms. Even though we did not survey
these buildings, CCAP recognizes that these buildings are not secure units of low income housing
because their leases with non profits can expire. That left us with 79 open buildings that we visited.
We accessed rent information from 68 buildings with 3004 rooms. Usually, the information was provided by a manager or desk clerk but sometimes we had to rely on a tenant because managers or
desk clerks were not available after several tries.
APPENDIX 2
How did CCAP do the hotel survey?
For the hotel survey part of this study, CCAP went door to door to privately owned and run hotels
within the DTES boundaries. CCAP researchers approached each hotel like a prospective tenant
looking for a room. The CCAP researcher usually spoke to the desk clerk or manager and asked
about vacancies, rent levels, daily/weekly rentals, and student only rentals. The researcher looked
to see if there was a sign asking for guests to pay fees to visit residents and asked if there were
any vacant rooms that were not being rented. Sometimes hotels were surveyed more than once by
different people to test the data. CCAP does not have the resources or the authority, like the City
does, to actually inspect buildings, so this survey does not include maintenance aspects of the hotels.
This information is as good as what was told to CCAP researchers by desk clerks, managers, and in
a few cases, tenants, as CCAP has no way of looking at hotel records. CCAP also analyzed city and
provincial statistics about new housing being built and provincially owned hotels.
APPENDIX 3
Why is it important for rents to be lower than $375 a month?
About 7000 DTES residents rely on welfare and disability income.i Since 2007, $375 a month is all
single people have to pay for their rent, utilities and phone. If people on income assistance have to
pay more than $375, this money must come out of their support allowance of $235, leaving them
with not enough money to eat and pay for other necessities. The DTES also has about 3000 seniors.
Many of them rely on a basic pension of only about $1300 a month. For these seniors, rents at or
below $390 a month (30% of their income) are considered affordable.
i Phone conversation between Jean Swanson and Dave Jagpal, Manager of Integration Services in the Ministry of Housing and Social Development, June 23, 2010.
CCAP Hotel Survey and Housing Report 2014 | 15
APPENDIX 4
Residential hotel rooms are not healthy or adequate accommodation
The City’s DTES Housing Planii (p. 5) recognizes that the SROs are not good quality housing and calls
for them to be replaced “with new self-contained social housing for singles,” with supports for some
residents. CCAP believes that DTES hotel rooms are not proper housing because they are tiny, usually
measuring about 10 by 10 feet. Residents usually have to share bathrooms with everyone on their floor
and people don’t have kitchens. How can low-income people eat cheaply without the means to cook? In
addition, the buildings are old and don’t meet current earthquake standards. Many are poorly managed,
filthy, and pest ridden. Although not all DTES residents have health issues, many have told CCAP that
living in a decent self contained apartment is part of feeling respected and can be an important part of
managing health issues. In addition, SRO hotels are fundamentally unsafe spaces for women. A woman
resident of the Regent Hotel explained, “When women leave their rooms at night to take a leak in the
common bathroom we wonder if there is a man behind our door. We wonder if there is a man in the
bathroom. And when we come back we wonder if there is a man waiting for us in our rooms. We feel
locked up in our own rooms.”
APPENDIX 5
SROs must be retained as an affordable last resort
While hotels are not proper places to live, they are the housing of last
resort for low-income people. Even though CCAP wants all the rooms
replaced, it is crucial that they remain open and available at $375 per
month until replacement housing is available and until the homeless
people in the DTES have homes. If the hotel rooms do not stay open
and available to low-income residents, homelessness will increase. City
statistics show street and sheltered homelessness has increased from
628 in 2002 to 1,798 in 2014.iii
APPENDIX 6
What can current DTES residents afford to pay for rent?
The vast majority of current DTES residents are low income people
according to the Statistics Canada definition of the Low Income Cut Off
(2011) line where a single person is considered low income if they have less than $23,298 a year.iv Of
course, many people who have less than $23,298 a year really do have a lot less. A person on welfare
receives only $7320 a year; on disability, $10,872; on old age security (OAS) and guaranteed income
supplement (GIS), about $15,000, on full-time minimum wage of $10.25, about $21,320 gross. Shelter
costs are not supposed to take up more than 30% of income, according to federal and provincial governments.
ii City of Vancouver (2005). Housing Plan for the DTES. Available at http://vancouver.ca/files/cov/housing-plan-for-the-downtown-eastside-2005.pdf
iii 2014 Metro Vancouver Homeless Count Preliminary Report (2014). Available at http://stophomelessness.ca/wp-content/
uploads/2008/09/Preliminary_release_report_final_April_23_14_to_be_posted.pdf
iv Statistics Canada (2012). “Low Income Cut-Offs (1992 Base) Before Tax.” Available at http://www.statcan.gc.ca/
pub/75f0002m/2012002/tbl/tbl02-eng.htm
16 | CCAP Hotel Survey and Housing Report 2014
This means that the amounts people in these categories have for rent are as followsv:
Income Source
Rent Low Income People Can Afford (30% of Net Income)
Welfare
$375/month allocated by the province
Disability
$375/month allocated by the province
Basic OAS and GIS
$390/month
Minimum Wage (full-time)
$533/month
Poverty line earnings
$582/month
Average rent for 1BR apt in Vancouver $1,005/month
While not everyone in the DTES is on welfare or disability, people working at minimum wage and
pensioners cannot afford average rents for even bachelor apartments. Even someone making $10.25 an
hour could only afford rent at $533 a month, which hundreds of single DTES rooms are already renting
for, with many more renting for more than that.
APPENDIX 7
Hotels where the lowest rent is $700 or more (total: 9)
Alexander Court
Golden Crown
New Columbia
American Hotel*
Grand Trunk
Pender Lodge
Burns Block
Metropole
Lotus
*A handful of rooms at the American Hotel rent for under $700 because of a Housing Agreement with the City.
Hotels where the lowest rent is between $500 and $700 (total: 14)
Argyle
Astoria
Danny’s Inn
Georgia Manor
Glory
Harbour Rooms
Laurel Apartments
Persepolis
Shamrock
The Station
Thorton Park
Vet’s Rooms
Woodbine
York Rooms
Hotels where the lowest rent is between $425 and $500 (total: 22)
Arlington
Arno
Balmoral
BC Rooms
Brandiz
Chelsea
Cobalt
Decker
Empress
Hildon
Ivanhoe
Lion
Low Young Court
Lucky Lodge
Main Rooms
Pacific Rooms
Patrick Anthony
Regent
Silver/Avalon
Travelers
United Rooms
Wonder Rooms
v For the Average Rent of 1BR Apartment in Vancouver: Canada Mortgage and Housing Corporation (2013). Rental Market
Report. Available at http://www.cmhc-schl.gc.ca/odpub/esub/64467/64467_2013_A01.pdf
CCAP Hotel Survey and Housing Report 2014 | 17


© Copyright 2026