
GFMS Gold Survey 2014 - Update 2(GFMS 黃金報告2014
© 2015 Thomson Reuters. All rights reserved. Republication or redistribution of Thomson Reuters
content is prohibited without the prior written consent of Thomson Reuters. “Thomson Reuters”
and the Thomson Reuters logo are trademarks of Thomson Reuters and its affiliated companies.
1008834_v1.indd 1
sponsors
GFMS GOLD SURVEY 2014
UPDATE 2
25/11/2014 15:15
The cover of the GFMS Gold Survey 2014 Update 2 is sponsored by the following companies:
TANAKA PRECIOUS METALS
Tanaka Precious Metals is Japan’s leading precious metals refiner and manufacturer. Although best known
internationally for its high specification industrial products, used in various applications ranging from semiconductors
to communications, the company is also a producer and trader of a wide range of gold bullion bars and coins. Tanaka
bars are acceptable “good delivery” on the London gold market.
Valcambi is a leader in precious metals refining and operates one of the world’s largest and most efficient integrated
precious metals plants situated on a 33 hectare site, at Balerna, Switzerland.
We are one of the world’s largest manufacturers of minted ingots. Reacting to the demands of investors in
different markets around the globe we are continuously carefully developing within the size range from 0,5 g to
1000 g, gold, silver, platinum and palladium minted bars in different forms and new designs. For our clients, according
to their wishes we customize individually obverse and reverse of the bars, certificates and tailored packaging solutions.
All products produced in our foundry and minting facilities are certified by our laboratory, carefully inspected by our
operators, individually packed and controlled before shipment. The Hallmark is not only a guarantee for quality of
Swiss workmanship, it guarantees also the fineness of the most sought after bars in the world, desired by precious
metals connoisseurs and investors alike.
A Valcambi manufactured bar is not only sold at an outstanding price but is synonymous with unique craftsmanship,
guaranteed fineness, transparency and reliability.
GFMS Gold Market Research
and Forecasts
SEEK MORE
Dig deeper into the gold market with GFMS research
and forecasts on Thomson Reuters Eikon. Use the
new GFMS gold pages to quickly understand the key
drivers behind market movements. See which factors
drove price performance in the past, what will drive
the evolution of these markets in the future, and what is
happening inside various sectors of the industry today.
GFMS gold pages include:
• Historical supply and demand statistics
• Forecasts of supply, demand and price
• Field research reports on key markets
• Exclusive analyst commentaries giving expert
insight on news and market developments
To find out more contact us on [email protected]
The cover of GFMS Gold Survey 2014 Update 2 features Japan’s Fujiyama covered with Gold Grain and Switzerland’s
Matterhorn covered with Valcambi CombiBars and on the back cover a 1 ounce round Valcambi minted Gold bar and
a 50 gramme minted Tanaka Gold bar.
Cover designed by Valcambi and photography by Adriano Heitmann / Immagina, Stabio, Switzerland
For more information visit thomsonreuterseikon.com
© 2014 Thomson Reuters. 1006310 0314.
1006310_v2.indd 1
01/04/2014 16:09
GFMS GOLD SURVEY 2014
UPDATE 2
BY:
Rhona O’Connell, Head of Metals Research & Forecasts
William Tankard, Manager, Mining
Cameron Alexander, Manager, Regional Demand
Andrew Leyland, Manager, Regional Demand
Ross Strachan, Manager, Regional Demand
Matthew Piggott, Senior Analyst
Saida Litosh, Senior Analyst
Sudheesh Nambiath, Senior Analyst
Janette Tourney, Senior Analyst
Johann Wiebe, Senior Analyst
Ling Wong, Senior Analyst
Erica Rannestad, Senior Analyst
Samson Li, Senior Analyst
Sara Zhao, Analyst
Natalie Scott-Gray, Analyst
Dante Aranda, Analyst
Gregory Rodwell, Analyst
John Bedi, Analyst
Beverley Salmon, Customer Relationship Manager
PUBLISHED JANUARY 2015 BY THOMSON REUTERS
The Thomson Reuters Building, 30 South Colonnade
London, E14 5EP, UK
E-mail: [email protected]
Web: https://thomsonreuterseikon.com/markets/metal-trading/
ISBN: 978-0-9928402-8-0 (Print)
ISBN: 978-0-9928402-9-7 (Online)
ISSN: 2055-1797 (Print)
ISSN: 2055-1800 (Online)
THE GFMS TEAM AT THOMSON REUTERS GRATEFULLY
THE FOLLOWING COMPANIES FOR THIS YEAR’S
www.pamp.com
www.cmegroup.com
www.gold.org
Italpreziosi SPA
www.heraeus-precious-metals.com
ACKNOWLEDGES THE GENEROUS SUPPORT FROM
GFMS GOLD SURVEY AND ITS TWO UPDATES
TANAKA PRECIOUS METALS
www.randrefinery.com
www.degussa-goldhandel.com
www.valcambi.com
www.igr.com.tr
TABLE OF CONTENTS
1. Summary and Market Outlook
• Supply 7 • Demand 7 • Market Outlook 8
2. Gold Prices in 2014
13
• Exchange Traded Funds 14 • Activity on Commodities Exchanges 15
• Over-the-Counter Market 17 • Physical Bar Investment 17
• Official Coin Sales & Fabrication 19 • Medals & Imitation Coins 19
4. Mine Supply
9
• Price Outlook 10
3. Investment 5
20
• Mine Production 20 • Production Costs 24 • Producer Hedging 26
5. Official Sector
27
6. Scrap Supply
29
7. Fabrication Demand
31
• Indian Sub-Continent 32 • East Asia 33 • Europe 35 • North America 37
• South America 37 • Middle East 38
8. Price Appendix
40
Focus Boxes
• Supply-Demand Methodology 6 • The Impact of a Stronger US Dollar on the Stability of Emerging Economies 16 • Corporate Activity 23 • Swiss Referendum; Unique or a Sign of the Times 28
• Industrial Demand 39
ACKNOWLEDGEMENTS
The estimates shown in this Update for the main components of mine production, scrap, fabrication and investment demand are calculated
on the basis of a detailed supply/demand analysis for each of the markets listed in the main tables. In the vast majority of cases, the
information used in these analyses has been derived from visits to the countries concerned and discussions with local traders, producers,
refiners, fabricators and central bankers. Although we also make use of public domain data where this is relevant, it is the information
provided by our contacts that ultimately makes this Update unique. We are grateful to all of them.
© THOMSON REUTERS 2015
All content provided in this publication is owned by Thomson Reuters and/or its affiliates (the “Thomson Reuters Content”) and protected
by United States and international copyright laws. Thomson Reuters retains all proprietary rights to the Thomson Reuters Content. The
Thomson Reuters Content may not be reproduced, copied, manipulated, transmitted, distributed or otherwise exploited for any commercial
purpose without the express written consent of Thomson Reuters. All rights are expressly reserved.
TRADEMARKS
“Thomson Reuters” and the Thomson Reuters logo are trademarks of Thomson Reuters and its affiliated companies. The third party
trademarks, service marks, trade names and logos featured in this publication are owned by the relevant third parties or their affiliates.
No use of such mark, names or logos is permitted without the express written consent of the owner.
DISCLAIMER OF WARRANTIES AND NO RELIANCE
This publication is provided by Thomson Reuters on an “as is” and “as available” basis. Thomson Reuters makes no representations or
warranties of any kind, express or implied, as to the accuracy or completeness of the Thomson Reuters Content. Thomson Reuters is an
aggregator and provider of information for general information purposes only and does not provide financial or other professional advice.
Thomson Reuters is not responsible for any loss or damage resulting from any decisions made in reliance on the Thomson Reuters Content,
including decisions relating to the sale and purchase of instruments, or risk management decisions.
GFMS GOLD SURVEY 2014 - UPDATE 2
1. SUMMARY AND MARKET OUTLOOK
world’s two largest consuming countries, China and
India, it was a close race for the rank of world’s biggest
consumer of gold products, with initial estimates
showing India taking the lead back from China at
880 tonnes versus 866 tonnes respectively.
On the supply side, once again the fall in scrap volumes
has offset record mine production, with total supply to
the market estimated to have declined by 3.0% year-onyear in the second half of 2014. Record mine supply of
1,650 tonnes continued to flow from new project rampups, with growth expected to taper off over the course of
2015. Scrap volumes are also expected to continue to fall
after seeing large declines over the past four years.
Within this decline is a disparity between the individual
sectors. Central banks, for example, added 461 tonnes of
gold, a 12.7% increase year-on-year, while private holders
of coins and bars added 1,057 tonnes, representing a
40.1% drop year-on-year from a record 2013. Meanwhile
the jewellery market suffered from a fall in demand for
high carat investment-class pieces, similar to the coin
and bar market, but saw a decent increase in demand
for higher margin 14-carat and 18-carat pieces. In the
This year is forecast to be the nadir for annual average
prices in our base case forecast, at $1,170/oz. With priceelastic buyers partially sidelined in 2014, we expect fresh
pent-up demand later this year to give price support and
start to reverse the prevailing bear market. For now,
though, dollar strength and uncertainty over monetary
policy will mean that cash remains king and this will put
fresh pressure on gold in the first half of this year.
WORLD GOLD SUPPLY AND DEMAND
Change
Change
(tonnes)
2013
2014E
y-o-y
13.H1
13.H2
14.H1
14.H2E 15.H1F
y-o-y
Supply Mine production 3,049
3,109
2.0%
1,428
1,622
1,459
1,650
1,492
2.3%
Scrap
1,262
1,122
-11.1%
626
636
571
551
531
-7.0%
-39
42
n/a
-29
-11
63
-21
30
-52.7%
4,272
4,273
0.0%
2,025
2,247
2,093
2,180
2,053
-1.9%
Net Hedging Supply Total Supply Demand Jewellery
2,385
2,133
-10.5%
1,286
1,099
1,056
1,077
1,043
-1.3%
Industrial Fabrication
408
389
-4.7%
207
201
196
193
191
-2.7%
...of which Electronics
-2.3%
279
267
-4.2%
141
138
134
133
131
...of which Dental & Medical
36
34
-5.8%
18
18
17
17
16
-7.1%
...of which Other Industrial
93
87
-5.8%
48
45
44
43
43
-2.0%
-17.4%
Net Official Sector
409
461
12.7%
223
186
242
219
200
Retail Investment
1,765
1,057
-40.1%
1,092
674
545
512
523
-4.2%
...of which Bars
1,385
808
-41.7%
857
528
426
382
405
-4.8%
...of which Coins
380
250
-34.4%
235
146
120
130
118
-1.8%
Physical Demand
4,968
4,041
-18.7%
2,808
2,160
2,040
2,001
1,957
-4.1%
Physical Surplus/Deficit
-695
232
n/a
-782
87
53
179
97
82.3%
ETF Inventory Build
-880
-152
-82.7%
-579
-301
-42
-110
-75
76.5%
Exchange Inventory Build*
-98
1
n/a
-111
13
14
-13
-
n/a
Net Balance
283
384
35.8%
-92
375
82
302
172
110.5%
Gold Price (London PM, US$/oz) 1,411.23 1,266.40
-10.3%1,523.29 1,301.81 1,290.76 1,242.62 1,180.00
-8.6%
Source: GFMS, Thomson Reuters
Totals may not add due to independent rounding. Net producer hedging is the change in the physical market impact of mining companies’
gold loans, forwards and options positions. *Exchange data includes full year COMEX and SHFE data and TOCOM data through November.
5
SUMMARY AND MARKET OUTLOOK
The second half of 2014 saw the US dollar strengthen
sharply, helping to push the gold price down 8.3%
between the end of June and the close of the year.
Shifts were accordingly different in many other major
currencies, with the euro price up 3.3%, the yen price up
8.2% and the rouble price up a shocking 49.2% over the
time period. While not all buyers shared the benefits
of falling prices, the major consuming markets in the
Middle East and China, which maintain some link to the
dollar, did see an uptick in physical offtake. This was not
enough to stop total physical demand falling by 7.4%
year-on-year in the second half, bringing the annual
decline to an estimated 18.7% in 2014.
GFMS GOLD SURVEY 2014 - UPDATE 2
Physical surpluses and deficits in the gold market are
less relevant than those in the industrial metals, owing
to the level of above ground gold stocks available to the
market. We calculate that at end-2014 stocks were close
to 35 years of current consumption levels. Over 35% of
this abundance of above-ground stock is held by central
banks and private investors and can often be lent by
those entities into the market. This of course is backed
up by the amount of “investment-grade jewellery” or
investment products, held in private hands, which can
also return to the market with speed in times of price
extremes, or indeed, financial distress. This ample
liquidity (most of the time) is why, like most currencies,
gold usually trades at full carry.
It is useful to consider the supply of gold to the market
and the changing features of demand for physical gold
that make up our supply and demand balance to the
level of physical surplus and deficit. The existence of
large volumes of Over-the-Counter (OTC) trade and
near-to-market inventory means that the physical
surplus or deficit in the market may not directly impact
the price. It will, however, impact upon lead times,
premia and margins across the value chain. The addition
of a physical surplus / deficit in the Survey allows us to
remove the previous residual balancing line item of netimplied investment / net-implied disinvestment.
Thomson Reuters’ supply and demand data are collected
and collated by our team of research analysts based
in Australia, China, Europe, India and the USA within
an extensive field research programme which involves
interviewing stakeholders across the supply chain in
every market and utilising the unique data sets available
to us after researching the market continuously since
1967. In order to build up a picture of supply and demand
in the gold market Thomson Reuters maintains individual
demand databases for over 90 countries globally and for
over 110 countries on the supply-side.
Via primary research analysts collect information on
jewellery fabrication and consumption; coin fabrication
and sales; bar investment; industrial; electronic and
medical uses; scrap entering the market and the
proportion of this that is used to manufacture jewellery
(in order to calculate jewellery’s net-pull on the gold
market). Information on over 800 mines and projects
is also collated on a mine-by-mine basis in order to
model global gold production. In addition to this
Thomson Reuters also collects net central bank sales and
purchases information and collates producer hedging
and de-hedging data.
All of this information, including mine cost profiles,
analysts’ “views from the field”, disaggregated supply
and demand data back to 2000, as well as base case
and two alternative scenarios underpin price forecasts for
one, three and ten year periods and are now available on
Thomson Reuters Eikon.
PHYSICAL SURPLUS / DEFICIT OF GOLD
1200
6
2000
800
600
Surplus
1500
400
200
1000
0
-200
-400
Changes in known stock levels are also included in the
supply-demand balance in order to account for the
highly visible moves in Exchange Traded Fund (ETF)
Real Gold Price
1000
500
Deficit
-600
-800
0
2004
20052006
20072008
20092010
20112012
20132014
2004
2006
2008
2010
2012
2014
Source: GFMS, Thomson Reuters
Constant 2013 US$/oz
OTC trade can have a large impact upon the gold market
and in the first eleven months of 2014 volumes of gold
transferred, as reported by London Bullion Market
Association clearing members, totalled approximately
132,200 tonnes, with a value of $5.4 trillion. Even
this figure does not represent the total value of gold
transactions globally. As a rule of thumb, the net
transfers are roughly one-third of the total loco London
market volume. The changing dynamics of the market
and the proliferation of trading centres in the Far East
in particular mean that loco London trade is now closer
to 70% of the world total as against its historical share
of 90%. This share changed during 2014 in particular
and we can therefore assume an average market share
of perhaps 80% for the year as a whole. This leads to
turnover of roughly 540,000 tonnes for the year overall,
with a value of approximately $22 Bn, or roughly 174
times mine production.
holdings and published inventory changes at gold futures
exchanges. It is important to note that the resulting Net
Balance does not include changes in OTC investment or
dis-investment. Changes in ETF holdings are a helpful
guide to investment trends in gold, but ultimately only
make up a small part of the market.
Tonnes
SUMMARY AND MARKET OUTLOOK
GOLD SURVEY 2014: SUPPLY-DEMAND
METHODOLOGY
GFMS GOLD SURVEY 2014 - UPDATE 2
SUPPLY
——Mine production increased by 2% or 60 tonnes to a
supply as the market switched to net producer
hedging.
——Global scrap supply eased an estimated 11% in 2014
as a 7% year-on-year fall was recorded in H2.
Global mine production continued to grow last year,
increasing to an all-time high of 3,109 tonnes, in spite of
the lower gold price. Indeed, in many cases changes to
production plans involving higher production have been
effected with the principal objective being to reduce unit
costs. Yet more important to 2014’s production uplift
though has simply been production growth from large
projects, brought online and ramping up, the legacy of
investments made during years of higher prices. Aside
from China, where strong output growth was broadbased, from smaller mining operations, many instances
of country level growth were driven by headline projects.
These have included Russia, Canada, the DRC and
Mongolia, which respectively benefited from substantial
additions from Kupol (expansion), Detour Lake, Kibali
and Oyu Tolgoi. Heavy production losses at the country
level were sparse, with the United States, Peru and South
Africa the only ones seeing drops in excess of ten tonnes.
Last year saw net producer hedging return to the market
for only a second time in the past decade. The activity
that swung producer hedging activity back to the supply
side of the market was attributable to a large move by
Polyus Gold International to secure acceptable gold sales
prices and cash flow through a phase of heavy capital
expenditure associated with the development of Natalka,
a project whose development has been pushed back
since the hedges were put in place.
WORLD GOLD SUPPLY
6000
5000
Net Producer Hedging
Net Official Sector Sales
Scrap
Mine Production
2000
1600
Real Gold Price
Tonnes
1200
3000
800
2000
400
1000
0
2004
2006
2008
Source: GFMS, Thomson Reuters
2010
2012
2014
0
Constant 2013 US$/oz
4000
SUMMARY AND MARKET OUTLOOK
record high of 3,109 tonnes.
——Producers generated an additional 42 tonnes of
Global scrap supply declined almost 11% last year to
an estimated 1,122 tonnes in concert with the 10.3% fall
in the dollar gold price. The drop in price was indeed
the chief catalyst for the decline in 2014 with further
erosion of near market stocks adding a secondary factor
that pushed scrap receipts to the lowest level since
2007. Scrap from East Asia moved against trend, rising
4% year-on-year, though this was driven entirely by an
increase from China where heavy liquidation from the
supply chain pushed scrap supply to a record level.
Jewellery scrap from India is estimated to have declined
26% year-on-year, while total recycling in the Middle
East retreated 14% largely as a result of the weaker
price profile. Turning to the industrialised world, lower
prices were again the chief culprit, with supply from
North America easing 21% year-on-year, driven down by
a notable decline in e-waste recycling, while the weaker
euro failed to elicit higher scrap flows across Europe,
which eased 17% year-on-year.
DEMAND
——Total physical demand fell 19% in 2014 as all areas,
with the exception of official sector purchases,
registered declines.
——Jewellery fabrication was down 11% year-on-year
despite lower gold prices, mainly due to restrained
demand in China.
——Industrial demand slipped by 5%, due to weakness in
all major segments.
——Retail purchases of bars and coins slumped by 40%
last year, driven by weak investor interest in Asia.
Jewellery fabrication dropped by 11% last year, to
an estimated 2,133 tonnes. This was largely due to
substantial losses in China, where jewellery demand
slipped 33% year-on-year to 608 tonnes, undermined
by slowing economic growth and Chinese government
anticorruption policies. Last year’s drop was also
attributable to a lack of price volatility, as consumers and
the supply chain waited for further weakness in the price
before re-entering the market. It is worth mentioning
that 2013 was an outlier, and a comparative analysis
between last year and 2012 reveals that last year’s
offtake was modestly up, reflecting a normalisation in the
buying pattern.
Excluding China from global offtake, which accounted
for approximately 28% of the total last year, reveals
that jewellery fabrication in the rest of the world
increased by 3%, led by a surge in demand in India and
a modest recovery in some parts of the developed world,
7
predominantly the United States and some European
countries. These gains, however, were mitigated by
losses in some key markets across East Asia and the
Middle East.
Starting with India, jewellery fabrication rose 14% to a
record high of 690 tonnes in 2014, surpassing China
to restore its status as the world’s largest jewellery
manufacturer. This positive outcome was largely due
to a rebound in demand in the second half of the year,
as easing premia and lower prices in local terms saw
retailers replenish their inventories ahead of the wedding
season. Another positive development for Indian
gold demand was the surprise announcement of the
withdrawal of the 20:80 rule by the Reserve Bank of India
in November last year in light of an easing trade deficit
due to lower oil prices.
Turning to North America, jewellery fabrication posted
a 3% year-on-year increase last year, driven by modest
growth in demand in the United States, which accounted
for over 80% of the region’s total. An improving
economic climate and lower gold prices helped to explain
the 3% rise in US jewellery fabrication. In stark contrast,
European jewellery demand dropped by an estimated
5%, led by a sharp decline in Turkish jewellery offtake,
hit by high local prices and the introduction of credit
restrictions. Excluding Turkey from the European total
shows that demand in the rest of the region was actually
slightly up year-on-year, helped by a marginal recovery
in Italy and Switzerland, and a strong rebound in British
demand.
Industrial demand fell 5% to an estimated 389 tonnes
in 2014, due to continued substitution in the electronics
industry, further undermined by a weak economic
recovery in some parts of the world. Gold used in dental
and other industrial & decorative applications continued
to retreat despite lower gold prices.
Total Identifiable Investment, which is defined as
the sum of physical bar investment, all coins and ETF
inventory changes, is estimated to have increased by
2% to 905 tonnes. The rise was primarily attributable
to a slower pace of ETF selling during 2014, from
880 tonnes of outflows in 2013 to 152 tonnes last year.
Retail purchases of bars and coins contracted by 40%, as
speculative interest from key Asian markets was largely
absent last year. Despite such a dramatic drop, last
year’s demand, at 1,057 tonnes, was still the fifth highest
on record.
MARKET OUTLOOK
This year is forecast to be the bottom for average annual
prices, coming in at $1,170/oz, with a first half average of
$1,180/oz. As such, we do not expect price declines in
the first six months of the year to be steep enough from
current levels to re-invigorate demand from the retail
investment sector (physical bar and coin purchases) with
a further 4.2% decline forecast. Matching this we expect
continued redemptions from ETF holdings as gold and,
more generally, commodities remain out of favour with
many in the Western investment community. Likewise,
investment grade high-carat jewellery will also suffer,
with a forecast decline in jewellery demand of 1.3% for
the first half of 2015.
While official sector purchases are forecast to continue,
it appears unlikely, given low international oil prices and
growing deficits in many purchasing nations, that buying
will accelerate. Finally, a combination of lower scrap
and higher mine output are forecast to see 2,053 tonnes
of supply enter the market in the first half of 2015.
Compared to new physical demand forecast for the
period, we expect a modest market surplus of 97 tonnes
for the first six months. If we include ETF redemptions,
then this increases to 172 tonnes.
WORLD GOLD DEMAND
8
6000
5000
4000
Net Official Sector Purchases
Net Producer De-Hedging
Retail Investment*
Industrial Fabrication
Jewellery
2000
Real Gold Price
1500
1000
3000
2000
500
1000
0
2004
2006
2008
2010
2012
Source: GFMS, Thomson Reuters
*Retail Investment refers to physical bar and coin investment
2014
0
Constant 2013 US$/oz
In 2014 net official sector purchases rose by 13%
compared to the previous year, to 461 tonnes. As a result,
central bank acquisitions were at the second highest
annual total since the end of the gold standard. Critical
to this has been repeated hefty purchases from Russia
(and to a lesser but not insignificant extent Kazakhstan)
from April onwards. Even though these countries were
already regular purchasers, heightened geopolitical
tensions were undoubtedly encouraging higher volumes.
Despite the signing of a fourth Central Bank Gold
Agreement sales from these countries remain trivial and
while there was sporadic activity elsewhere it remains
dwarfed by purchases.
Tonnes
SUMMARY AND MARKET OUTLOOK
GFMS GOLD SURVEY 2014 - UPDATE 2
GFMS GOLD SURVEY 2014 - UPDATE 2
GOLD PRICES, 2013-2014
2. GOLD PRICES IN 2014
•
Gold closed 2014 down by 1.6% intra-year, at $1,206/oz
basis the p.m. fix. Much of the price weakness was caused
by continued buoyant equity markets and a strengthening
US dollar. There were also intermittent bouts of volatility.
2013
% change y-o-y
2014
2014
averageintra-year
US $/oz
1,411
1,266
Driven by an improving underlying economy in the US,
investors expect the Federal Reserve Board (Fed) to hike
rates to 0.5% during the middle of 2015 reaching 1% by
year-end. Consequently, gold is expected to remain under
pressure in the first half-year, averaging $1,180/oz.
-1.6%
Yen/g 4,412 4,298 -2.6%12.3%
Yuan/g 279.2250.8 -10.2%0.9%
Rand/g433,957440,561
•
-10.3%
Euro/kg 34,19530,638 -10.4% 10.7%
1.5%
7.0%
A$/oz1,4551,403 -3.6%7.2%
Rouble/g 1,441 1,559
8.2%64.5%
TL/g 85.9 88.9 3.5%5.6%
Rps/10g 29,31028,278 -3.5% -8.6%
Rph/g 470,311482,408
2.6%
0.8%
Source: GFMS, Thomson Reuters
Following a considerable decline of almost 29% intrayear in 2013, gold started 2014 on a positive note
reaching $1,385/oz on 14th March, which turned out to be
the high for the year. Since then, the price declines mean
gold has been trapped in a descending triangle. Several
unsuccessful attempts to break the annual high were
recorded, indicated by the downward sloping tops on the
second chart (page 11, points 1, 2 and 3).
On 6th October, gold was back where it started the year
testing the intermediate floor at $1,180/oz. After a shortlived bounce the price fell through the floor and recorded
its low for the year on the 5th November at $1,142/oz on
the fix; a level last seen in the third quarter of 2010.
Price volatility was higher in the second half of the year
than the first, which was also reflected in the VIX, the
broader volatility index (see bottom chart on page 11).
Volatility measured by the VIX was 6% higher at 14.6 in
the second half compared to an average of 13.8 in the
first half. The rise can be explained by two significant
corrections in equity markets, of which the more dramatic
took place in October on the back of rising tensions
over sanctions between Russia and the West. As a
consequence, the fear index spiked to 31 – a level last
recorded during the fears of a possible Eurozone breakup
in 2011 – and the S&P lost more than 10% of its value in
18 trading days.
But gold was not really able to benefit from this
weakness as equity buying quickly resumed leaving
the uptrend of the S&P intact. Optimism about the US
economy clearly accelerated in the second half of the
year driven by a string of positive data releases on the
US economy and reflected by the significant rise in the
dollar compared to a basket of other currencies. The
announcement of various possible quantitative easing
measures in Europe, Japan and China resulted in
significant deterioration of these respective currencies
which clearly benefited the US dollar.
GOLD PRICES
Contrary to 2013, gold was not centre stage with respect
to falling commodity prices last year. That honour went
to oil, iron ore and thermal coal. Gold, meanwhile,
witnessed a year of consolidation, and despite some
volatility, traded in a relatively narrow range of
$1,200-$1,300/oz for the majority of last year. Gold
closed the year only marginally lower on an intra-year
basis at $1,206/oz but posted a 10.3% year-on-year
decline on an annual average basis.
The US dollar and gold usually share a strong negative
correlation (see chart on page 12), which meant that a
strengthening greenback put further downward pressure
on gold. From May onwards last year, the trade weighted
dollar started its rise from approximately 80 to as much
as 92 by the end of the year; an increase of approximately
15%. The flight of capital to the US was also reflected in
10 year Treasury yields, which declined throughout the
whole of 2014 from 3% at the beginning of last year to
below 2% during the start of 2015.
Investor positioning on COMEX was somewhat erratic
over the course of last year. Managed money net
speculative longs saw two waves of increases in March
and July/August, which coincided with two minor revivals
in the gold price. However, short positions accumulated
again towards year-end when gold, for the first time since
2010, dipped below the $1,180-1,200/oz range; a level
which had endured four tests in the previous two years.
The broadly sideways price action over the year was also
reflected in investor appetite for gold ETFs, which still
recorded outflows during the year, although considerably
less than in 2013. In 2014, ETF holdings declined by
8.6%, or 152 tonnes, to 1,659 tonnes (see Chapter 3 for
more detail).
9
GFMS GOLD SURVEY 2014 - UPDATE 2
PRICE OUTLOOK
GOLD PRICES
Even though the Bank of Japan, the People’s Bank of
China and the European Central Bank in one way or
another have all made further commitments towards
more easing in order to boost their sputtering economies,
a positive effect on precious metals prices based on any
of these measures remained absent in 2014. In fact, any
meaningful influence on precious metals prices seems to
be mainly stemming from monetary policy discussion at
the Fed.
In the short term, US monetary policy will focus on the
timing of raising interest rates, the expectation of which
provides a negative backdrop for the gold price in 2015.
We expect the Fed to start hiking rates in mid-2015,
depending on progress in the labour market and inflation
expectations. The former is well on track with the most
recent unemployment levels down to a six and a half year
low of 5.6%. With respect to the latter, wage growth in
the US is expected to accelerate above the 2% average of
the past five years. But with the broad underemployment
rate still high and with the considerable plunge in the
oil price, we don’t expect any significant inflationary
pressures to emerge soon.
In fact, just one week into the New Year, global bond
markets were signalling reduced confidence in central
bankers’ ability to increase inflation towards their 2%
target. Indeed, long dated bonds in Germany, Japan, UK
and the US have registered dramatic declines in yield.
At the beginning of the year US 10 year Treasury yields
dipped below 2% while equivalent German and Japanese
bonds hit record lows of 0.44% and 0.27% respectively.
The global financial picture looks precarious with the US
still considered as the best place to hide, as illustrated by
continued capital inflows from Europe, driven also by a
possible Greek exit from the Eurozone.
Despite all this, we expect the Fed still to go ahead with
the rate hike this year. At the start of the New Year, three
month euro/dollar futures are discounting interest rates
at 0.5% by June and 1% by year-end. Considering the
disappointing returns in other asset classes last year,
stocks might still be appealing this year. Although the
S&P has showed considerable hiccups, optimism in the
US economy prevails. In addition, with the historical
multiple (P/E ratio) at approximately 17, which is almost
equal to the average over the 1986-2014 period, stocks
are not as expensive as some might argue.
Another risk on the horizon is the financial crisis in
Russia, where a historic slump in oil revenues and
10
VOLATILITY (US$ SPOT)*
2009
2010
21.1%
15.9% 13.Q3
23.4%
2011 2012 2013
18.9%
16.5%
13.Q4
14.Q1
20.2%
15.3%
2014
20.2%
12.9%
14.Q2
14.Q3
14.Q4
12.3%
10.9%
13.3%
*20-day rolling average
GOLD PRICE CORRELATIONS*
14.Q1
14.Q2
14.Q3
14.Q4
0.47
0.94
0.53
US$/Euro Rate
0.85
Silver
0.79 0.78 0.930.88
Oil WTI
0.74
CRB
0.910.520.89 0.12
0.05
0.80
0.17
S&P 500
0.55
-0.38
-0.43
-0.61
COMEX “Investor” Long
0.96
0.88
0.97
0.19
*Based on daily log-returns, save for managed money net investor
positions on COMEX where weekly.
Source: GFMS, Thomson Reuters
Western imposed sanctions have seen the value of the
rouble deteriorate. Central bank efforts to prop up the
currency by raising interest rates to 17% overnight turned
out to be fruitless. The majority of Russia’s reserves
are US and EU government bonds; gold is only a small
portion. However, if Russia continues to liquidate its
FX holdings, will it at some point sell some of its gold?
During the previous crisis in 1998 it did, to the tune of
118 tonnes. We expect this to be very unlikely this time
around. Any such sales would produce a knee-jerk
downward reaction in the gold price.
Many of these gold bearish factors have become
increasingly visible during last year. The point and
figure chart on the next page illustrates our long term
projection level. After careful calculation, this has been
set at $1,100/oz.
The second gold chart illustrates the sentiment on
a shorter time horizon. The key take away from our
perspective is the downward breach of the intermediate
floor at the $1,180/oz area. Although gold quickly
reversed after that, a clear short term trend remains
absent with price action looking rather choppy. Between
October 2014 and January 2015, gold built up some
momentum as indicated by the grey wedge on the chart.
Any upside break-out should be capped by the downward
sloping trend line in the $1,280-1,300/oz area, leaving
the overall downward trend intact. We do, however,
expect the price to bottom this year and are looking for
a second-quarter average of $1,125/oz, followed by an
average of $1,160/oz in the second half as we enter the
“sell the rumour buy the fact” environment with respect
to interest rates coupled with improving fundamentals.
GFMS GOLD SURVEY 2014 - UPDATE 2
TECHNICAL ANALYSIS OF THE GOLD PRICE
2000
Point & Figure Chart, Gold
Box size: 20 USD
Reversal size: 3 Boxes
Nov-2006 to Jan-2015
1800
1
Box count established: 13 boxes
US$/oz
1600
2
Breach below first floor. Box count activated on 14th Dec 2011
3
Correction calculation:
13 Boxes x 20 USD box size x 3 Box reversal size = 780 USD
1400
4
Correction calculation:
1880 - 780 = 1100 USD
1200
Breach of recent price floor
Target: 1100 USD
1000
800
Note: For a detailed explanation on how to calculate a target price using Point and Figure charts, please read the article published on 5th November, 2014, titled “Gold Price Forecast:
A Technical Perspective.” The article is available in the market commentary section of the GFMS Gold Homepage on Thomson Reuters Eikon.
GOLD PRICES
1440
1
1400
21
1360
31
US$/oz
1320
1280
1240
1232
1
1200
1200
1186
1160
2
1146
1140
3
1100
01-Oct-13
02-Jan-14
01-Apr-14
01-Jul-14
01-Oct-14
04-Jan-15
S&P 500, Daily, LHS
VIX, Daily, RHS
2130
28
2070
25
2010
22
1950
19
1890
16
1830
13
1770
10
1710
7
1650
01-Oct-13
02-Jan-14
01-Apr-14
01-Jul-14
01-Oct-14
04-Jan-15
Source: GFMS, Thomson Reuters
11
12
a
a
c
d
c
e
Feb
Mar
Tension escalates in the region. Ukraine crisis adds to
geopolitical risk premium
(29/01/14): A further $10bn taper is announced
(11/02/14): US debt ceiling raised through to March
2015, technical default averted
(22/02/14): President Yanukovych leaves Ukraine
(19/03/14): Additional taper takes stimulus down to
$55bn per month
Source: GFMS, Thomson Reuters
d
e
b
c
f
g
May
h
i
Jun
j
k
l
m
Aug
nm
o
Sep
p
k (02/07/14): British MPs urge watchdog to probe
allegations of price-rigging in gold
l (11/07/14): CME cuts gold futures margins by 10%
m (17/07/14): Malaysian commercial airliner crashes in
Ukraine. Geopolitical tensions increase.
n (01/08/14): Argentina defaults on its debt
o (14/08/14): Russian President Putin plays low on crisis
in Ukraine at a speech in Crimea
p (04/09/14): ECB cuts refinancing rates to 0.05% and
overnight deposit to -0.20%
Jul
f (15/04/14): Gold short-covering rally meets profit
taking followed by heavy technical sales amid
improving US economic sentiment
g (25/04/14): Russia threatens military exercise along
Ukraine border
h (01/05/14): U.S April NFP rose 304,000
i (21/05/14): India eases gold import rules
j (18/06/14): Fed reduces further bond purchases to
$15bn of MBS and $20bn per month of long dated
Treasuries
Apr
Correlation: Spot Gold and the Trade Weighted US Dollar
b
,
a (03/01/14): ISIS occupies Fallujah, city near Baghdad.
Jan-14
92
91
90
89
88
87
86
85
84
83
82
81
80
79
GOLD PRICES
Nov
r
o
Dec
s t
u
v
Jan-15
q 3rd and 4th week October: Indian festival demand
reaches peak for the year
r (07/11/14): Russian rouble weakens 13% in a week
to lowest on record.
s (28/11/14): India’s gold import rule 20:80
scheme abolished
t (30/11/14): Swiss referendum gets negative vote
u (05/12/14): November US NFP registered at
321,000
v (23/12/14): US Q3 GDP grows at 5%
Oct
q
Gold US$/oz p.m. Fix (RHS)
Trade Weighted US Dollar (LHS)
-1.0
-0.5
0
0.5
1100
1140
1180
1220
1260
1300
1340
1380
1420
GFMS GOLD SURVEY 2014 - UPDATE 2
Gold London p.m. Fix, US$/oz
Trade Weighted Dollar
(Inverted, 1 January 2014 = 100)
GFMS GOLD SURVEY 2014 - UPDATE 2
3. INVESTMENT
•
Total Identifiable Investment, which includes physical
bar investment, all coins and ETF inventory changes, is
estimated to have risen by 2% to 905 tonnes in 2014.
•
In indicative value terms, total identifiable investment
fell by 8%, to an estimated $37 billion, entirely due to the
10% drop in the annual average gold price.
A close analysis of individual components of Identifiable
Investment reveals that the 2% rise in tonnage terms was
primarily down to a slower pace of ETF selling witnessed
last year. This was particularly evident at the beginning
of the year, when ETF holdings began to stabilise after
a prolonged period of heavy redemptions and even saw
a moderate increase in February, the first month to
register positive inflows in more than a year. For 2014
as a whole, ETF outflows were 152 tonnes, compared to
880 tonnes in 2013. On the other hand, last year saw
double-digit declines in both physical bar investment
and coin demand, taking our retail investment figure to
1,057 tonnes, down by 40% year-on-year. Nevertheless,
it is worth mentioning that last year’s level was down
from the all-time high registered in 2013 and, despite the
sharp drop, was still the fifth highest on record.
quarter and a weak recovery in the Eurozone further
added to economic woes. This boosted gold’s safe
haven appeal and encouraged some fresh investment
as evidenced by stabilisation and then accumulation of
ETF holdings at the beginning of the year. A positive shift
in investor attitude towards the yellow metal was also
supported by a steady expansion in net investor positions
on COMEX, as investors shrugged off conventional assets
in light of increased risk aversion. Gold broke through
the $1,380/oz level in mid-March, hitting a six-month
high and the highest level for the year, with a pm fix of
$1,385.00 on 14th March.
In addition to renewed economic fears at the start of the
year, investor interest towards gold was firmly supported
by increased geopolitical risk. Military intervention into
the Ukrainian territory by Russian forces and the Russian
annexation of the Black Sea resort region of Crimea
spurred gold’s safe haven role, pushing the gold price
through the $1,350/oz mark in early March towards a sixmonth high by mid-month.
IDENTIFIABLE INVESTMENT*
KEY MARKET INDICATORS
(tonnes)
13.H2 14.H1 14.H2E
...of which Bars
528426 382405
S&P 500
1,426 1,848
2,059
11%
146
120
130
118
CRB Index
484 456 438
-4%
-301
-42
-110
-75
XAU Index
ETF Inventory Build
Total Identifiable Investment
372
503
512
402
523
(end-period)
Change
2012
2013
2014 y-o-y
674
...of which Coins**
545
15.H1F
Retail Investment
448
US 30-year Bond
166 84
69
-18%
2.95%
3.94%
2.75%
n/a
1,204.50 1,206.00
0%
Indicative Value US$ (bn)***16 21 16 17
Gold Price $/oz
1,657.50 * Excludes investment activity in the futures and OTC markets.
**Official Coins and Medals & Imitation Coins. ***Indicative value calculated using average gold prices. Contango (3-mth)
0.35%
0.01%
0.00%
n/a
US$ Libor (3-mth)
0.31%
0.25%
0.26%
n/a
Source: GFMS, Thomson Reuters Source: Thomson Reuters
13
INVESTMENT
Global monetary policy was once again a key determinant
of investor sentiment during 2014, with investors closely
watching the path of US monetary policy after the
Federal Reserve announced the first round of tapering in
December 2013. The shift in US policy and the prospects
of a gradual normalisation sparked fears over increased
capital flow volatility and financial stability in emerging
markets, sending local currencies plunging. This,
along with soft economic data in some key developing
countries, spurred worries about the world’s economic
prospects. Disappointing US economic data in the first
As the US economy made its turn for the better after
the first-quarter contraction and continued to solidify
in the latter half of the year, the central bank remained
committed to tapering. The Federal Reserve continued
to cut asset purchases by an additional $10 billion per
month at each FOMC meeting until shutting down its
stimulus programme in October. In contrast to the
Federal Reserve, the ECB loosened its monetary policy
to fight prolonged economic stagnation and growing
deflationary pressures. Elsewhere, the Bank of Japan
surprised markets by announcing a fresh injection of
liquidity to counter the negative effects on growth of the
hike in consumption tax. In light of slowing economic
activity, the People’s Bank of China cut its benchmark
GFMS GOLD SURVEY 2014 - UPDATE 2
policy rates for the first time since July 2012. Diverging
policy moves by the world’s major central banks
resulted in sharp exchange rate movements and dollar
appreciation against most currencies. Gold came under
significant pressure in the final months of 2014 in light
of an improving economic climate in the United States,
stronger US dollar and a lack of imminent inflationary
pressures, breaching the $1,200 level on a few occasions.
It is interesting to note that, despite weaker gold prices,
last year saw little physical support, even when the
yellow metal slid below the psychologically important
$1,200 level. Restrained investment demand from key
physical markets was largely attributable to various
government policies aimed at curbing demand for gold
and a generally low price volatility environment. Another
explanation is that the local currency price in many of
these countries had not fallen anywhere near as far as
in dollar terms and hence the relative lack of a price
response. In addition, the sharp price correction in 2013
triggered a rush of bargain hunting, driving investment
demand to record levels. The markets therefore needed
some time to digest the extra gold purchased during the
frenzy witnessed in 2013.
Meanwhile, Indian investment demand last year fell a
long way short of previous highs, registering a near 60%
year-on-year drop. This was largely attributable to the
declining price trend, import restrictions, high premia
and expectations of further drops in the price, which
saw investors deferring purchases of gold bars and
coins. Furthermore, with the newly elected government,
investor confidence and expectations of higher economic
growth improved, prompting investors to flee from safehaven assets towards other financial instruments with
fixed returns.
EXCHANGE TRADED FUNDS
——Total ETF holdings in 2014 fell by 9%, with the fourth
quarter accounting for almost half of all redemptions.
Our retail investment figure, which is defined as the sum
of physical bars and coins, dropped by a marked 40%
last year, to an estimated 1,057 tonnes. China and India
Combined holdings of ETFs declined by 152 tonnes,
or 9% over the year, from 1,811 tonnes to 1,659 tonnes.
Total ETF holdings in value terms at the end of the
year, at $64bn, were $6bn or 9% lower year-on-year, a
stark difference to 2013 in which ETF outflows posted a
$73bn or 51% decline. Despite outflows in each quarter,
redemptions in the second half of 2014 made up over
70% of the total, with the heaviest outflows concentrated
in the fourth quarter. The easing in ETF liquidation over
the first quarter of 2014, which resulted in February
recording the first monthly inflow since December 2012,
IDENTIFIABLE INVESTMENT
GOLD EXCHANGE TRADED FUNDS AND SIMILAR PRODUCTS
2000
1500
Coins*
Bar Hoarding
2000
3000
Gold Price
2500
1800
ETF Stock Build
2000
Gold Price
Other
ETF Securities
1600
iShares Gold
1600
500
1400
0
1200
1000
-500
1000
500
-1000
800
Tonnes
2000
GBS (LSE listed)
1200
1500
800
SPDR Gold Shares
400
ZKB
H1-11
H1-12
H1-13
Source: GFMS, Thomson Reuters
*Official coins and medals & imitation coins
14
H1-14
H1-15F
0
Jan-06
0
Jan-08
Jan-10
Jan-12
Jan-14
Source: GFMS, Thomson Reuters; collated from respective ETF issuers’ data
US$/oz
1000
US$/oz
Tonnes
INVESTMENT
Another important factor restraining the scale of gold
investment last year was generally a more cautious
attitude towards alternative asset classes such as
commodities. This was partly explained by slowing
economic growth across emerging markets, the stronger
US dollar and increased concerns about the end of the
commodities supercycle. In addition, a lack of price
volatility that prevailed over much of the year saw many
investors waiting on the sidelines for further weakness in
the price before re-entering the market.
together accounted for more than half of the 40% drop in
global retail investment. After the extraordinary growth
in 2013, Chinese investment demand took a huge drop
last year, falling to its lowest level since 2010. This was
partly due to the relatively stable price environment and
a lack of price volatility that saw investors waiting on the
sidelines for further pullbacks in the price. Additionally,
demand for gold bars and coins was further constrained
by the government measures introduced in 2013 in an
effort to suppress bribery and corruption in the country.
GFMS GOLD SURVEY 2014 - UPDATE 2
GOLD TRADED ON COMMODITY EXCHANGES
(total volume in nominal tonne equivalents)
13.H1
13.H2
14.H1
COMEX
SHFE
14.H2
80,981 66,113 60,321 65,703
22,727 24,989
7,301
32,875 3,055
3,639
3,353
TOCOM
7,510 4,715 3,632 MCX
7,0333,546 2,192 2,281
SGE Spot
1,981
2,026
2,182
2,939
711
403
272
241
SGE AU(T+D)
NYSE Liffe*
5,294
5,113
DGCX
258 191223203
Borsa Istanbul
255
183
91
148
the opening of The Merk Gold Trust, ETF inflows have
increased by 47% or 1.5 tonnes, while Bo Gold ETF has
posted outflows of 98% or 1 tonne.
ACTIVITY ON COMMODITY EXCHANGES
——Trading volumes on major commodity exchanges,
with the exception of Chinese markets, posted
marked declines in 2014.
COMEX
*Includes the 100-ounce and 33.2-ounce contracts
Source: GFMS, Thomson Reuters; relevant exchanges
was driven by rising geopolitical tension in Crimea,
weaker than expected US economic data due to poor
weather and financial turmoil in emerging markets.
However, by late April with equity markets at all time
highs, weaker-than-expected physical demand from
Asia and the US Fed announcing a 2014 year-end to its
stimulus programme, ETF outflows gained momentum.
Among the individual funds, the largest redemptions
took place in the established entities, with SPDR Gold
Shares, the largest gold ETF, posting an outflow of
89 tonnes or 11% over the year, more than half of the
total outflows recorded for the period. Meanwhile, other
noteworthy decreases were registered by ZKB Gold,
Julius Baer and GBS LSE which saw losses of 13, 14, and
36 tonnes respectively. In stark contrast, London based
ETF Securities was the only ETF to record a significant
inflow in 2014, of 16 tonnes with an additional three
tonnes of inflows in early January 2015.
It is also worth noting that 2014 saw the introduction of
two new gold-backed exchange traded funds. Californiabased Merk Funds launched The Merk Gold Trust in May
on the New York Stock Exchange, while China’s Bosera
Asset Management Co. Limited introduced China’s fourth
gold-backed exchange traded fund in August, Bo Gold
ETF, registered to the Shenzhen Stock Exchange. Since
The renewed investor interest in the first half of the year
was triggered by fresh concerns over global economic
recovery, amid a series of disappointing US economic
data, financial turmoil in emerging markets and an
escalation of geopolitical tensions in Ukraine, which saw
gold prices rise to multi-month highs by March. However,
with more upbeat economic data in the following
months, together with growing speculation that the ECB
would announce policy easing at the June meeting, safe
haven assets were put under pressure.
By early October, a surge in the US dollar saw investors
rapidly liquidate long positions, by 74 tonnes, in turn
restoring their short positions to a level last seen in
December 2013. However, this did not last long, as
prices rallying fuelled short covering. Indeed, by the time
gold had risen above $1,200 in December, shorts had
liquidated to such an extent that the net long had risen to
its highest level since August.
OTHER EXCHANGES
While global futures trading has for a long time been
dominated by COMEX, the last few years have witnessed
strong investor activity on a number of other commodity
exchanges around the world, particularly in China and
15
INVESTMENT
In the second half of the year liquidation continued to
pick up pace as the gold price declined by $109. This
was driven by a variety of factors, including a surging US
dollar, weakening euro and plummeting oil price, while
the weakening yen following the announcement from the
Bank of Japan on further easing of monetary policy was
another drag. Expectations that the US would actually
start to tighten monetary policy following the end of the
Fed QE programme in October, encouraged redemptions
in the final quarter of 2014 of 82 tonnes, to end the year
at 1,655 tonnes.
The total volumes of gold futures traded on COMEX
last year decreased by 14% year-on-year to 41 million
contracts. This is equivalent to a nominal 126,024 tonnes
and to an average daily turnover of 502 tonnes. Open
interest at 371,646 contracts by end-December was down
by a modest 2%. CFTC reports on managed money can
be used as a proxy for investor activity on the exchange.
The first half of 2014 was characterised by a significant
contraction in short positions of 139 tonnes, with the
first quarter of the year responsible for over two-thirds
of the drop. Investors instead were seen to favour long
positions and by late June an increase of 128 tonnes
had been recorded resulting in a near 300% rise in net
“investor” positions to reach 356 tonnes.
GFMS GOLD SURVEY 2014 - UPDATE 2
THE IMPACT OF A STRONGER US DOLLAR ON
THE STABILITY OF EMERGING ECONOMIES
countries with large debts denominated in US dollar. In recent
years, easy global financial conditions combined with low yields
in the advanced countries triggered large investment flows,
Diverging macroeconomic developments and the varying
mainly in dollars, into emerging countries, thanks to their
government responses in recent months have raised concerns
promising growth prospects. While access to the international
about financial vulnerabilities, particularly in emerging market
debt markets helped to support viable investment projects
economies, and the overall impact on the global economy. After
and boost economic growth, rapidly growing debt issuance by
an unusually prolonged period of monetary policy alignment,
emerging markets has made them particularly vulnerable to
the world’s major central banks have embarked on increasingly
increased interest rate and currency risks.
growth path in the second quarter of 2014, after the first-
A continued appreciation of the dollar against most currencies
quarter setbacks, and continued to recover for the remainder of
may have a profound impact on the financial stability, and
the year, the US Federal Reserve steadily reduced its monthly
hence economic health, of many developing countries, as it
bond purchases to end the quantitative easing programme in
would lead to a significant increase in local currency liabilities.
October. On the other hand, the ECB loosened its monetary
Rising debt burdens may affect the capacity of financial
policy by lowering its benchmark interest rate to a record low
corporates to service their debts, drive some into bankruptcy
and announcing purchases of asset-backed securities and
and eventually cause billions of dollars’ worth of losses.
covered bonds - all in an effort to fight protracted economic
Meanwhile, deteriorating creditworthiness of many corporates
weakness and dangerously low levels of inflation. While these
may induce a tightening of financial conditions, which could
policy moves were largely anticipated by the markets, this sent
further worsen once the US Federal Reserve decides to make a
government bond yields across the Eurozone to record lows.
step towards normalising interest rates.
Similarly, and in stark contrast to the US Federal Reserve,
In addition to rising interest rates globally, currency mismatches
the Bank of Japan announced a fresh injection of liquidity in
represent another possible source of vulnerability, particularly in
October last year, boosting Japanese stocks and sending the
countries with large levels of foreign currency borrowing. Russia
yen plunging. This was in light of growing nervousness about
serves as a good example, where a slowdown in the domestic
the prospects of US monetary policy tightening and its impact
economy and the escalation of the conflict with Ukraine saw the
on emerging market economies, and in an attempt to revive
rouble plunge, thus inflating the local currency value of foreign
growth in the aftermath of the April consumption tax hike.
currency liabilities and affecting the economy’s debt servicing
Meanwhile, the People’s Bank of China cut its main policy rates
capacity. There are also some country-specific vulnerabilities
in November, for the first time since July 2012, as policy makers
that may pose a threat to the stability of emerging market
tried to counter the slowing economic growth.
economies. For example, the uncertainty associated with the
Presidential election and a generally bleak economic outlook
Increasing economic and policy divergences led to sharp
saw the Brazilian real weaken last year. Commodity producers
currency market movements and a pronounced strengthening
and manufactures exporters tend to have a better capability
of the dollar against all the major currencies. The rise of the US
to service the rising debt costs associated with the currency
dollar to a seven-year high against the euro spurred concerns
depreciation, as they earn much of their revenues in foreign
among global financial policy makers about its impact on the
currencies. However, net commodity exporters are more
financial stability of emerging market economies, particularly
exposed to the risk of weak commodity prices.
EXCHANGE RATES, EMERGING MARKET ECONOMIES
Against the backdrop of a stronger dollar and diverging
monetary policies, gold came under significant pressure in the
120
final months of 2014, sliding below the $1,150/oz level to multiIndex, 1st January 2014 = 100
INVESTMENT
differing paths. As the US economy returned to a moderate
year lows. We expect to see more weakness in the gold price in
100
the coming months, particularly as the US economic recovery
continues to build momentum, prompting the US Federal
80
60
Brazilian real
Reserve to bring forward the first increase in interest rates
Indian rupee
and also raising the potential of faster-than-expected policy
Chinese renminbi
tightening. However, as we discussed earlier, the appreciation
South African rand
of the dollar, if persistent, would pose a significant threat to
Russian rouble
40
Jan-14
Mar
May
Source: Thomson Reuters
16
financial stability of emerging market economies. This could, in
Jul
Sep
Nov
Jan-15
turn, prompt investors to seek shelter in safe-haven gold, similar
to what we observed at the beginning of 2014.
GFMS GOLD SURVEY 2014 - UPDATE 2
Turning to the Shanghai Gold Exchange, while trading
volumes of gold spot and AU(T+D) futures contracts
posted year-on-year growth, total physical gold delivery
for 2014 fell 4% year-on-year, to just over 2,100 tonnes.
This was largely attributable to weak jewellery demand,
with fabrication returning to levels last seen in 2011, while
the ongoing anti-corruption campaign kept investor
interest weak.
OTC MARKET
——The OTC market saw net buying last year, chiefly
aided by opportunistic buying in Asia. Overall
volumes though were markedly lower than in 2013.
A key factor underpinning the net purchases in the
OTC market, which might seem surprising to some, is
the continued shift from west to east. There are many
examples of this, but most recently it is worth noting the
stellar growth in activity on the SHFE, as described in
more detail in the previous section. Another important
development in this mould is the launch of gold contracts
on three Asian exchanges, which are likely to cause a
further shift away from western markets in the coming
months and years.
PHYSICAL BAR INVESTMENT
—— Physical bar investment declined by 42% to
808 tonnes in 2014, the lowest since 2009.
World demand for physical bars contracted by over
40% year-on-year during 2014, to an estimated
808 tonnes, as the bargain hunting that had
characterised the shift of physical metal from west to
east in 2013 was largely absent in 2014. In fact, demand
from Asia contracted sharply by 49%, as a lack of gold
price fluctuation saw speculators largely remaining on
the sidelines.
NET INVESTOR POSITIONS IN COMEX FUTURES
1800
250
Gold Price
200
1600
150
1400
100
1200
50
0
Jan-12
Source: CFTC
Comex settlement price (US$/oz)
There was net investment in the OTC market in 2014 and
this helped to provide some support to gold prices at
times, not least in the first quarter, fuelled by geopolitical
turmoil and bargain hunting. However, it is worth
noting that the overall level of activity in this arena was
noticeably softer than in 2013. Supporting this view is
data from the LBMA, showing that the net volume of gold
transferred in the first eleven months of 2014 (data for
December was not available at the time of writing) was
down 18% compared to the same period a year earlier. It
is not surprising that the value of these transactions for
the same time period fell by an even more severe 26%.
This was both a symptom and a cause of the low volatility
in the market, and in this vein it was only in November
that activity was up for the first time year-on-year on
the back of increased volatility. It is also arguably the
case that a trend across the wider markets to move more
activity into the futures markets may also have been a
drag on volumes.
1000
Jul-12
Jan-13
Jul-13
Jan-14
Jul-14
17
INVESTMENT
Turnover on India’s Multi-Commodity Exchange
witnessed a near 60% decline over 2014, with trading
volumes falling to their lowest levels since 2005,
reaching 302 tonnes in April. A series of regulations
and gold import restrictions introduced by the Indian
authorities, in addition to the implementation of the
Commodity Transaction Tax of 0.01%, saw traders shift
to alternative exchanges such as COMEX, the Dubai Gold
and Commodity Exchange, and alternative unregulated
markets in India. However, the easing of import
regulations as of 21st May has seen volumes improve,
reaching 430 tonnes in November.
Interestingly, the number of transfers only edged lower
by 4%, as the decline derived from the size of the average
transfer, which continues to slide lower. This is chiefly
indicative of heavy investor selling in 2013, especially by
institutional investors (and buying by different investors)
not being replicated en masse in 2014.
Managed Money net positions (contracts, thousands)
India, as a result of market liberalisation and an increase
in investor interest in commodities. As illustrated in
the earlier table, China’s Shanghai Futures Exchange
saw a significant 19% year-on-year rise in trading
volumes in 2014. This, however, is largely a function of
the extended trading hours, rather than an indication
of strong investment activity. The introduction of the
after-hours trading session in July 2013 saw a dramatic
increase in trading volumes on the exchange. However,
a comparative analysis between the second half of 2014
and the second half of 2013 reveals those volumes have
contracted by more than 20%.
GFMS GOLD SURVEY 2014 - UPDATE 2
Physical bar investment in China slumped 53% in 2014
to a five-year-low of 171 tonnes. Offtake in the first half
declined by an extraordinary 62% year-on-year, though
it should be noted that the level of demand witnessed
in 2013 during this period was perhaps a once in a
generation event, as bargain hunters surged to buy
the yellow metal following the sudden price crash. An
additional factor in the first half of last year was the
ongoing anti-corruption movement in China, which
had severely restrained the gifting sector from which
the majority of the bullion purchases stem. Bar sales
in the second half of 2014 dropped by a less dramatic
30% year-on-year, as the anti-corruption policy that was
introduced in mid 2013 had less impact on demand last
year. That said, the desire to invest in gold was negatively
impacted by the prolonged low static price level during
much of 2014, which eroded investor confidence.
Bar hoarding volume across the remainder of South
East Asia (excluding China) performed in a similar
manner, collectively slumping by 46% in 2014 from the
RETAIL INVESTMENT
700
600
500
Other
China
400
300
200
100
0
Q1-10
Q1-11
Q1-12
Source: GFMS, Thomson Reuters
18
extraordinary level witnessed a year earlier. Demand
retreated across all major markets in the region as
expectations of weaker prices and more impressive
gains from other asset classes saw consumers turn away
from the yellow metal. The greatest change was seen
in Indonesia, where demand collapsed by an estimated
72% year-on-year, as investors there could see little
upside potential in the gold price that was trading in a
narrow range and looked to allocate funds elsewhere.
In a similar vein, Thailand investment demand slumped
50% last year, from 2013’s record level with many
speculators taking considerable losses in 2013. Indeed,
many were still sitting on stock purchased at a higher
price and therefore had a limited cash flow to trade.
Elsewhere, physical investment in Vietnam slipped by a
third last year. Consumers still had an appetite for gold
as an inflation hedge against a weakening currency,
but due to the tight control of investment products by
the State Bank were turning to 24-carat jewellery as an
alternative means of investing.
Investment demand in Japan also recorded a sizeable
decline last year, sliding 64% from the 2013 level. The
first quarter delivered a rush in demand for investment
products ahead of the 3% rise in the consumption tax.
However, demand fell away thereafter, with the domestic
market dominated by sell side activity in the final quarter,
as the weak currency saw gold in yen terms push to levels
not seen since April 2013.
Physical bar investment in Europe fell 15% to 201 tonnes
in 2014. The majority of the decline was in the first
half, when demand fell a whopping 29% year-on-year,
whereas during the second half of the year it was down
by a marginal 1%. Physical buying in countries such as
Germany and Switzerland fell considerably in the first
half of last year, following an extraordinary buying spree
in 2013 on the back of the major price drop. In Italy,
demand declined by ‘just’ 2%, as continued economic
headwinds motivated consumers to diversify some of
their capital holdings into safe-haven gold.
North America
Europe
India
Tonnes
INVESTMENT
Indian investment demand fell sharply in 2014, by 59%
year-on-year to 110 tonnes. Investments were largely in
smaller denomination bars ranging from 10 grammes
to 50 grammes. This is largely attributed to the
declining price trend, higher premia and expectations
of lower prices, which kept the regular investors away.
Indeed, with the new government in power there was a
notable rise in consumer confidence, with expectation
of economic growth leading people to allocate their
savings to other financial instruments with fixed returns
and fixed assets such as real estate, due to the increase
in tax benefits. In addition, the stronger performance in
other asset classes saw professional investors allocate
their funds elsewhere. According to anecdotal evidence
the share of unaccounted money which is often routed to
gold had reduced significantly and was finding its way to
other fixed assets.
Q1-13
Q1-14
Physical bar demand in the United States dropped 26%
to 25 tonnes in 2014, a slight improvement over the
29% decline recorded in 2013. Demand was lacklustre
throughout the year, falling quarter-on-quarter in the
first nine month period. In the third quarter, there was
increased liquidation of investor holdings and less buying
activity relative to the first half of the year. Demand
improved in the fourth quarter of the year, jumping to
eight tonnes during the period, more than double the
demand seen in the previous quarter. This improvement
GFMS GOLD SURVEY 2014 - UPDATE 2
(tonnes)
Change
2013 2014E y-o-y
Europe
North America
Asia
Other
Total 14.H1 14.H2E 15.H1F
238 201-15% 85 116 90
38
28
-27%
1,072 550-49%
15
13
14
311 239 288
3728
-24%141413
1,385
808
-42%
426
382
405
Source: GFMS, Thomson Reuters
was prompted by increased investor interest anytime
prices fell below $1,200 and a surge in demand when
prices fell around $1,140 at the beginning of November.
OFFICIAL COIN SALES & FABRICATION
——Official coin sales are estimated to have fallen by
38% to reach 172 tonnes, the lowest level since 2007.
Global official gold coin sales in 2014 are estimated
to have fallen by 38% year-on-year to 172 tonnes, the
lowest level since 2007. This was a sharp reversal from
2013, when official coin sales reached an all time high of
277 tonnes. Our official coin figures include an estimate
of both bullion and numismatic coins produced by
national mints around the world.
MEDALS & IMITATION COINS
——Coin sales decline to lowest level in five years as
investment trend fades.
Indian coin demand in 2014 dropped by an estimated
27% year-on-year to 71 tonnes, marking it as the second
consecutive year of decline and the lowest in four years.
Lower price expectation and high premia in the first
six months of the year discouraged consumers, though
seasonal factors and attractive price points at times
during the year helped boost volumes. Sovereign coins
produced by MMTC-PAMP continued to be an attractive
option for consumers given the absence of imported
coins which otherwise were being sold by banks and
post offices. Demand during the key festivals and gifting
during the September to November period were strong
enough to lift second half demand by 38% year-on-year.
OFFICIAL BULLION COIN FABRICATION
100
2000
Gold Price
80
1500
60
US$/oz
The GFMS team at Thomson Reuters also conducts a
quarterly gold bullion coin survey with key national mints
globally to gauge regional sales trends for official coins.
This survey captures investors’ sentiment for gold bullion
in the short term in response to price movements. Our
survey indicates that on a regional basis, official coin
sales to North America and Asia (ex. Japan) dropped
by 43% and 66% respectively in 2014, in tandem with
sluggish gold price movements.
From a coin production perspective, Turkey remains
the largest official coin fabricating country, producing
a total of 45 tonnes in 2014. This is followed by the
United States, Canada, China, South Africa, Austria
and Australia, producing an estimated tonnage of
23 tonnes, 20 tonnes, 19 tonnes, 17 tonnes, 14 tonnes
and 11 tonnes respectively. Much like official coin sales
trends, production of these coins saw a sharp year-onyear decrease in most countries, with the exception
of certain countries like France, where the issuance of
commemorative coins was up from the previous year.
40
1000
Official coin sales to Europe and Japan fared better,
with sales to Europe falling by 28%, while sales to
Japan actually increased by 14%. The key behind this
divergence resides with foreign exchange movements:
20
0
Q1-09
Q1-10
Q1-11
Source: GFMS, Thomson Reuters
Q1-12
Q1-13
500
Q1-14
19
INVESTMENT
The drastic fall in official coin sales last year indicated
the waning enthusiasm for gold as a safe haven asset,
as the general recovery from the global financial crisis
prompted investors to search for higher returns from
other investment avenues. Bargain hunting, a defining
theme behind gold demand in 2013, had been largely
absent in 2014, with the exception of early November,
when the price fell from $1,249/oz to $1,140/oz in less
than three weeks, which saw a moderate rise in buying,
although the effects were mainly felt in silver bullion
coins.
the euro and yen depreciated considerably against the
dollar in 2014, and gold prices denominated in these
currencies stayed relatively firm – in fact increased on
a year-on-year basis. This dissuaded investors in these
regions from liquidating their investments, and in some
cases encouraged further investments to hedge against
currency movements.
Tonnes
WORLD PHYSICAL BAR INVESTMENT
GFMS GOLD SURVEY 2014 - UPDATE 2
TOP 20 GOLD MINING COUNTRIES
•
Global gold mine supply is estimated to have risen by
2%, or 60 tonnes, in 2014.
•
Average Total Cash Costs decreased by 4% year-onyear, to average $736/oz on a nine-month basis.
•
After two consecutive years of producer de-hedging, we
estimate that the producer hedge book grew by 42 tonnes
in 2014.
MINE PRODUCTION
INTRODUCTION
For the full year we estimate that mine production rose to
a new all-time high of 3,109 tonnes. Volumes continued
to grow due to the ongoing effects of investment in
project development in previous years. The top five mine
site increases were all from properties which began
operations in prior years and were ramping production
up towards full capacity in 2014. Between them these
five accounted for 55 tonnes of growth. More mature
properties generally did not do so well, with losses seen
at some of the world’s largest mature assets, such as at
Cortez, Newmont’s Nevada complex, Yanacocha and a
number of South African mines.
MINE SUPPLY
Regionally production followed a similar trend, with
the largest falls seen in some of the established gold
producing countries, such as Peru, the United States
and South Africa. Some of the largest growth was seen
in countries such as China, which has long enjoyed an
upward trajectory, but also other countries including
Mongolia, the Democratic Republic of Congo, the
Dominican Republic and Russia. The latter overtook
Australia to become the second largest gold producing
country last year.
Last year saw the gold price fall to four-year lows in early
November, below the current industry average All-in
Cost of production and, whilst miners had some success
in cutting the average cost of production during 2014,
margins have contracted for most operators. Although
closures and suspensions have so far been limited to
smaller, ageing higher cost operations, there have been
deferrals of major capital expenditure projects and a
reduction in exploration spending. We would argue that
in terms of both profitability and volumes, the industry
remains in a precarious position.
2013
Production (t)
2014E
14.H1
438.2 465.7 202.7 263.0 6%
Russia
248.8 272.0 104.1 167.9 9%
Australia
268.1 269.7 134.4 135.3 1%
United States
228.2 200.4 99.8 100.6 -12%
187.7 169.3 79.8 89.5 -10%
South Africa
177.0 164.5 81.7 82.9 -7%
Canada
133.3 153.1 75.5 77.5 15%
-3%
Peru
Mexico
119.8 115.7 58.3 57.4 Indonesia
109.2 109.9 48.6 61.3 1%
Ghana
107.4 106.1 53.5 52.6 -1%
Brazil
80.1 80.5 38.4 42.1 1%
Uzbekistan
77.4 80.4 39.7 40.7 4%
Papua New Guinea 60.5 59.2 29.0 30.2 -2%
Argentina
50.1 57.6 26.5 31.1 15%
Mali
48.2 48.3 24.5 23.8 0%
Kazakhstan
42.4 47.8 22.6 25.2 13%
Tanzania
46.6 44.3 21.8 22.4 -5%
Chile
48.6 43.9 21.3 22.6 -10%
Colombia
41.2 43.1 21.4 21.7 5%
Philippines
Rest of World
World
38.7 39.4 19.4 20.0 2%
498.0 538.0 255.7 282.4 8%
3,049.5 3,109.0 1,458.8 1,650.2 2%
Source: GFMS, Thomson Reuters
AFRICA
African output edged up by 1% to an 11-year high of
587 tonnes. Strong growth from the Democratic
Republic of Congo (DRC) was the driving force behind
Africa’s positive outcome, where production rose by more
than 50% year-on-year, with Kibali the overwhelming
influence, estimated to have produced over 15 tonnes
having achieved first pour in September 2013. Support
came from higher output from Twangiza and Namoya,
while informal production was estimated to be steady
year-on-year. Côte d’Ivoire’s output was higher, by
four tonnes, largely thanks to Agbaou, which reached
GLOBAL MINE PRODUCTION
2000
Australia
Russia
Other
Other Africa
South America
Other Asia
South Africa
North America
China
1500
1000
500
0
H1-10
H1-11
H1-12
Source: GFMS, Thomson Reuters
20
Change
14.H2E
y-o-y
China
Tonnes
4. MINE SUPPLY
H1-13
H1-14
GFMS GOLD SURVEY 2014 - UPDATE 2
MINE PRODUCTION WINNERS AND LOSERS, 2014E VERSUS 2013
-15 t
-10 t
-5 t
-0.5 t
+0.5 t
+5 t
+10 t
+15 t
Source: GFMS, Thomson Reuters
commercial production in January 2014. Burkina Faso
also recorded a gain of four tonnes, with improvements
at two of the country’s largest operations behind the
increase: a plant upgrade at Essakane facilitated the
throughput of harder, higher grade ore. Meanwhile
at Mana, the mining of higher grade ore from the Siou
and Fofina orebodies, compared to material sourced
exclusively from the Wona-Kona deposit in 2013,
translated to a near-50% lift in ounces produced.
Outside South Africa, Tanzania and Eritrea both saw
output drop by approximately two tonnes. Tanzania’s
drop was on account of the cessation of mining at Golden
Pride, while in Eritrea it was due to a planned shift in
orebody mineralogy at Bisha that has seen higher base
metal output with concomitantly lower gold production.
Mine production in North America fell by twelve tonnes or
3% year-on-year to total 469 tonnes. The outcome was
primarily led by the United States where we estimate
output stood at 200 tonnes, the heaviest drop globally,
of 28 tonnes. The most pronounced fall was registered
at the country’s second largest operation, Cortez, where
processed grades roughly halved. In addition, output at
Newmont’s Nevada complex fell by an estimated nine
tonnes as a planned stripping campaign continued into
the second half of the year. At Hollister the suspension of
operations resulted in a three tonne drop in output.
Production in Mexico fell by 3%, or four tonnes, to total
116 tonnes. At Los Filos higher strip ratios led to lower
processing rates, while at Cerro San Pedro mining
activity focused on waste stripping over the first half of
the year, reducing ore accessibility. We estimate that
production at these operations fell by a combined three
tonnes. Lower grades were also seen at Mulatos, where
output fell by nearly two tonnes as higher than normal
rainfall led to leach pad dilution and lower crusher
throughput. At Soledad-Dipolos production ceased due
to a court order which caused a one tonne drop in output.
Nevertheless, gains were registered at Peñasquito where
an increase in gold ore grades, sulphide ore recovery and
throughput led to an increase of nearly six tonnes.
21
MINE SUPPLY
Countering the gains, and having maintained a flat
profile in 2013, South African production resumed its
long term contraction last year, falling by an estimated
7% to 165 tonnes. Whilst there were a handful of gains,
including Kusasalethu and Moab Khotsong, up almost
two and one tonnes respectively, the bulk of mines
saw lower output. South Deep lost an estimated three
tonnes year-on-year, after a safety initiative led to ground
support remediation activities being prioritised over
production at parts of the mine. Elsewhere, estimated
losses of one tonne each also came from Driefontein,
Doornkop and Mponeng.
NORTH AMERICA
GFMS GOLD SURVEY 2014 - UPDATE 2
Mine supply in Canada grew for a sixth consecutive year
to reach 153 tonnes. The 15% growth in output was
driven by two operations commissioned last year (Mount
Milligan, and a re-start at Goldex) and a further two
large properties which ramped up to nameplate capacity
(Detour Lake and Canadian Malartic). In aggregate these
mines are estimated to have produced an additional
16 tonnes relative to 2013. Additionally, new supply came
from Éléonore, where the first gold pour took place in
October 2014. We estimate production at just under two
tonnes in 2014.
SOUTH AMERICA
South American output is estimated to have fallen by 4%,
to total 534 tonnes. The decline was led by the region’s
largest producer, Peru, where we pitch the contraction at
18 tonnes, or 10%. At Yanacocha, output was impacted
by lower head grades due to planned mine sequencing,
which resulted in a drop of more than 10%. Several
mines including Antapite, Julcani, Ares, Coricancha and
Pierina were placed on care & maintenance activities
during the year, amounting to a loss of three tonnes. In
addition, attempts by the government to formalise small
scale mining and stamp out illegal mining activities have
led to a drop in output from the jungle region of Madre
de Dios.
MINE SUPPLY
In Chile, gold production fell by five tonnes, primarily
the result of the suspension of mining at La Coipa in
October 2013. At the country’s largest operation, El
Peñón, underground dilution resulted in an approximate
25% drop in head grade leading to a two tonne drop
in output. Similarly, at Centinela (previously named
Esperanza) gold production fell by over one tonne due
to significantly lower ore grades and, to a lesser extent,
lower throughput. Nevertheless, gains were witnessed
at Maricunga, where higher grade ore was processed as
a result of favourable mine sequencing from the Pancho
pit, combined with better recoveries from the heap
leach and carbon plant that together led to a two tonne
increase in production.
An offset came from growth from the Dominican
Republic, Argentina and Colombia, where we estimate
production increased by a combined 18 tonnes. In the
Dominican Republic, the ramp-up to full production
at Pueblo Viejo continued, adding eight tonnes relative
to 2013. In Argentina, new supply came from Cerro
Negro, where the first gold was poured in July to produce
an estimated four tonnes by year-end. At Veladero,
higher head grades added nearly two tonnes, while
at Gualcamayo production rose by almost two tonnes
22
following its first full year in operation. Colombian
gold production rose by an estimated 5% to 43 tonnes,
primarily due to higher informal gold production.
OCEANIA
Australian mine supply is estimated to have increased
by 1% during 2014, reaching a total of 270 tonnes. The
major growth story has been the ramp-up in output from
Tropicana, which commenced commissioning during the
third quarter of 2013. The mine added a further twelve
tonnes to Australian output during 2014. Additional new
production during the period came from Tomingley and
the continued ramp-up of Andy Well.
Much of the gain in supply from these new mines was
offset by small-scale losses elsewhere. This includes
closures of operations including Coolgardie, Laverton,
Meekathara, Wiluna, Bronzewing and Coyote, which
collectively reduced supply by five tonnes. Gains and
losses at the larger Australian mines were relatively
modest in scale during 2014. At Boddington, St. Ives
and Cowal, processed grades were lower year-on-year,
contributing towards a combined loss estimated at three
tonnes. Production from Telfer was an estimated one
tonne lower during 2014, due to lower throughput as
planned maintenance was undertaken.
In New Zealand, an estimated two tonne decrease in
mine supply stemmed from lower output from Reefton
and Macraes, on lower processed grades together with
pit redesign work. This outweighed the gain in output
from Waihi, where the stripping campaign undertaken
during the prior period facilitated a higher mining and
milling rate during 2014. Meanwhile in the Solomon
Islands, the ongoing suspension of Gold Ridge led to
a one tonne, or 70%, fall in output. Mine supply from
Papua New Guinea is estimated to have decreased by
one tonne, largely due to lower production from Lihir,
where scheduled lower milled grades and a planned
autoclave shutdown had an impact on output. This was
only partially countered by increased production from
Hidden Valley and Porgera.
ASIA
Asian gold production grew by the largest volume of
any region in 2014, rising by 51 tonnes or 6% yearon-year. Responsible for half of the region’s growth,
Chinese production exhibited another strong year in
which we estimate output to have grown by 28 tonnes
to total 468 tonnes. The main driver of the growth was
domestically produced ore, from smaller scale producers,
GFMS GOLD SURVEY 2014 - UPDATE 2
CORPORATE ACTIVITY
2014E TOP 10 GOLD PRODUCERS
In keeping with the more conservative outlook adopted by the
(tonnes)
2013
2014E
mining industry over the last couple of years, corporate activity
Barrick Gold
222.9
194.4
-13%
in the gold mining sector remained subdued throughout 2014.
Newmont Mining
157.5
151.2
-4%
According to data from ThomsonOne Investment Banking, the
AngloGold Ashanti
127.7
136.9
7%
aggregate value of quantified deals completed during 2014 was
Goldcorp1
82.989.3 8%
US$8 billion, approximately 15% lower than in 2013.
Kinross Gold2
77.780.4 3%
Navoi MMC
70.5
High-value M&A activity of the kind seen prior to 2013 remains
Newcrest Mining2
73.572.0 -2%
elusive, with the major gold miners generally focusing their
Gold Fields1,2
58.162.6 8%
priorities on rationalisation of existing portfolios and, in some
Polyus Gold International3 51.350.8 -1%
cases, reduction of debt levels. Rumours of a proposed merger
Sibanye Gold
between Barrick and Newmont, potentially exploiting synergies
between their Nevada operations, have so far amounted to
nothing, with talks between the two companies reportedly
44.5
Change
y-o-y
73.0
50.1
1
Includes Discontinued Operations
2
Estimate 3 Including Veduga
4%
13%
Source: Company Reports; GFMS, Thomson Reuters
called off during April.
supplement production from Palmarejo through acquisition of
The largest transaction of the year was the acquisition of Osisko
Paramount Gold and Silver, owner of the San Miguel project, in
Mining by Yamana Gold and Agnico-Eagle Mines, for a total
an all-stock merger agreement valued at US$146 million.
consideration of US$3.7 billion, in a white knight bid following
The ‘Tier 1’ gold miners took the opportunity to divest various
Yamana now jointly operate Canadian Malartic, one of Canada’s
ageing or non-core operations during 2014; Barrick’s Plutonic
largest gold mines. Generally, portfolio expansion activities
and Kanowna mines along with Newmont’s Jundee were
were more prevalent among the smaller mining companies
acquired by Northern Star Resources, and Goldcorp and Barrick
last year. B2Gold and Papillon Resources merged in a deal
sold their Marigold JV to Silver Standard Resources. Newmont
valued at US$570 million, adding the Fekola development
disposed of its 44% stake in the Penmont joint venture, which
project to B2Gold’s four operating mines. Agnico expanded its
was acquired by the majority owner, Fresnillo, for $450 million
Southern Business with the C$205 million acquisition of Cayden
in cash. This divestment strategy extended to project-stage
Resources and its exploration-stage El Barqueňo property in
assets in some cases, with Kinross Gold taking the decision to
Mexico. Turning to pending transactions, Coeur Mining plans to
divest Fruta del Norte for US$240 million in cash and shares.
toll treated by the larger gold smelters. We estimate that
output from both non-ferrous metal and precious metal
smelters accounted for the majority of the country’s
growth.
ramp up of operations at Oyu Tolgoi, following production
of first concentrates in January 2013, led to an estimated
twelve tonne gain for the full-year at the mine. This was
the second largest individual mine increase globally.
Conversely, the country’s integrated miner/refiners did
not fare so well, with operations coming under pressure
from the decline in the international gold price. With less
price incentive to push for higher domestic production
volumes, companies instead continue to look overseas
for acquisition opportunities, while cutting domestic
exploration and administrative expenditures; similar
action to their western listed counterparts. Within
the top ten gold mining companies in China, output is
estimated to have risen by approximately 3% last year;
much less significant than the growth estimated from
small scale operators.
Output in Kazakhstan continued to grow, rising by
an estimated five tonnes year-on-year. While gold
production from the assets of Kazzinc and Kaz Minerals
was lower than last year, government data indicates that
output between January-November rose by 12%. Part of
the increase we estimate to be attributable to the output
of Kazakhaltyn, and also to increased state-controlled
activities in-country tied in with the start of operations at
a third Kazakh gold refinery.
Outside China, Asian production posted another strong
performance in terms of volumes. The most significant
contribution came from Mongolia, where the continued
Uzbek output is estimated to have increased slightly
during 2014, by 4%, as a result of continued investment
in improving operational efficiencies and prolonging the
life of mine at the large state-run Muruntau complex.
Small increases of one tonne apiece are also estimated
to have occurred in Azerbaijan and Armenia. Elsewhere,
23
MINE SUPPLY
an unsolicited takeover attempt by Goldcorp. Agnico and
GFMS GOLD SURVEY 2014 - UPDATE 2
However, a few countries did see output decline; among
them Kyrgyzstan, Vietnam and Laos, which between
them experienced a fall of five tonnes. In Kyrgyzstan, we
estimate that output at Kumtor fell by one tonne from
the prior year. In Vietnam suspended operations at Bong
Mieu and Phuoc Son led to a similar drop, while in Laos
gold mining activities at Sepon ceased in December 2013
due to high costs.
EUROPE
European output is estimated to have risen by a
strong 7%, or 20 tonnes; the second largest regional
increase globally. This left total production at a new
annual record high of 328 tonnes, representing an
increase of 59% over the last decade. Such a strong
outcome in 2014 was entirely due to Russia, where
output rose year-on-year by 23 tonnes, or 9%. One of the
largest mine site gains was estimated to have occurred at
Kupol, which added five tonnes year-on-year. Processed
grades rose substantially from the contribution of ore
from Dvoinoye, which began operation in the first quarter
of 2014, through the expanded Kupol mill. A full year of
operation at Mayskoye, which began production in the
second quarter of 2013 and continued ramping up output
in 2014, accounted for a further four tonnes.
MINE SUPPLY
Polyus Gold International reported an increase of 4%
among its operations for the first nine months of the
year, with a 10% increase in production at Olimpiada
and a doubling of production at Verninskoye responsible
for the growth. At both properties, throughput rose
substantially. Higher throughput and grades lifted
production at Petropavlovsk’s Albyn property by two
tonnes. Elsewhere, gold output as a by-product of the
country’s base metal mining industry also grew, by an
estimated three tonnes year-on-year.
Outside Russia, European production fell across the
board, with the largest decline in Finland, accounting
for just over one tonne. The bulk of the drop was due to
the suspension of operations at Laiva in the first quarter
of 2014, coupled with a small drop at Kittila. A drop of
over one tonne was also seen at Çöpler, in Turkey, where
the grade of stacked ore fell year-on-year, and additional
minor losses among the other European countries.
PRODUCTION COSTS
——The global Total Cash Cost averaged $736/oz during
the first nine months of 2014, a 4% year-on-year
reduction. All-in Costs for the period are estimated at
$1,300/oz.
The global average Total Cash Cost of production for the
first nine months of 2014 was, at $736/oz, 4% lower than
that of the same period in 2013. The drive by producers
to maximise production and minimise unit costs is one
factor driving this trend, and this increase in mine supply
is partly attributable to the ramp-up in output from new,
relatively low-cost operations such as Canadian Malartic
and Pueblo Viejo. Furthermore, closure of a number
of high-cost mines throughout 2013 and 2014 also
contributed towards the reduction in average producer
cash costs.
Comparison of regional trends in producer-reported
Total Cash Costs reveals that the situation is not entirely
positive. In North America, Total Cash Costs increased
during the period, driven by the United States, where
9-month costs for 2014 rose by 5% year-on-year. This
stemmed from lower production and higher unit costs at
some ageing mines, and at very large operations such as
Cortez. The 15% increase in average Total Cash Costs for
Mexican producers, due in part to the introduction of a
new mining tax, also contributed to the regional trend.
As a consequence of US dollar strength last year,
producers in a number of countries including Canada,
Australia and South Africa had, to varying extents,
favourable exchange rate movements to thank for
reductions in USD costs. Factors such as exchange
rate movements, lower oil prices and lower price-linked
royalty rates have benefited many operators in recent
months, but can hardly be relied upon to continue
working in favour of gold miners over the longer term.
QUARTERLY TOTAL CASH COSTS BY REGION
1800
1600
Gold Price
World
Simple Margin
(World)
Australia
South Africa
North America
South America
1400
1200
US$/oz
production from the region’s second largest producer,
Indonesia, remained almost flat, in line with the
performance at the most significant property, Grasberg.
1000
800
600
400
200
Q1-10
Q1-11
Source: GFMS, Thomson Reuters
24
Q1-12
Q1-13
Q1-14
GFMS GOLD SURVEY 2014 - UPDATE 2
With the exception of the first quarter of 2014, the
trend in the quarterly gold price has remained negative
throughout the last two years. However, the reining-in of
Total Cash Costs has provided gold miners with a limited
degree of respite, with the quarterly average simple cash
margin seeing a $10/oz quarter-on-quarter increase in
the third quarter of 2014..
Total Production Costs, which include Total Cash Costs
plus depreciation, averaged $972/oz during the first
nine months of 2014, a 2% decrease year-on-year. The
smaller decrease relative to that of the Total Cash Cost
was a consequence of higher depreciation charges
following mine plan revisions. We estimate the All-In
Cost of production (a proprietary GFMS metric designed
to reflect the full marginal cost of mining, including
ongoing capital costs, indirect costs and corporate
overheads), at approximately $1,300/oz for the first nine
months of 2014. However, for full-year 2014 it is likely to
exceed this as it will incorporate impairments announced
in year-end reports, such as the potential write-down
of up to $2.7 billion of Cerro Negro announced by
Goldcorp. Given that the annual average gold price saw
a 10% decrease in 2014, it is likely that many producers
will recalculate year-end reserves at lower gold prices,
and may also undertake mine plan revisions that could
necessitate further impairments.
Although cost-containment has been a prevailing
theme for some time now in the mining industry, it is
not yet clear to what extent the various austerity and
margin-protection measures implemented recently are
sustainable over the longer term, rather than just shortterm survival strategies.
REPORTED TOTAL CASH AND PRODUCTION COSTS
(US$/oz)
13.Q2
13.Q3 13.Q4
14.Q1 14.Q2 14.Q3
North America
647
639
640
669
683
706
South America
655
617
663
658
674
614
Australia
864 731726740749708
South Africa
997
Other
829 821756764 761742
World
Gold price
Cash margin
926
911
931
934
962
773
736
724
735
744
728
1,415
1,326
1,276
1,293
1,288
1,282
642
591
552
558
544
554
Production cost 1,009
959
950
969
988
960
Note: Weighted averages based on the Gold Institute reporting
standard. Does not include mines for which gold is not the primary
source of revenue.
Source: GFMS, Thomson Reuters
As yet, there are few examples of gold miners making
fundamental changes to working practices, such
as moving to increased mechanisation at existing
operations. Exceptions include Acacia Mining’s
Bulyanhulu, and Gold Fields’ South Deep.
Generally, miners have sought to bring down their
production costs through undertaking various efficiency
initiatives together with cuts to non-essential capital
spending and corporate overheads. Some have also
revised mine plans in order to improve near-term output.
These mine plan revisions may (in some cases) be
enabling operations to remain profitable, but will have
repercussions for production levels in later years, given
that some miners have opted to prioritise higher‑grade
ore in order to lower unit costs. The observable
consequences of these actions over the last few quarters
have included the sustained growth in global mine
supply, and a reversal of the long-established trend of
falling global average processed grade.
WORLD TOTAL CASH COST CURVES
1800
1800
1600
1600
9-Month 2013 Average Gold Price ($1,455.53/oz)
1400
9-Month 2014 Average Gold Price ($1,287.73/oz)
1200
1000
1000
800
800
9M 2014 Total Cash Cost
600
MINE SUPPLY
1200
US$/oz
US$/oz
1400
600
9M 2013 Total Cash Cost
400
400
200
200
0
0
0
10
Source: GFMS, Thomson Reuters
20
30
40
50
60
Cumulative Production %
70
80
90
100
25
GFMS GOLD SURVEY 2014 - UPDATE 2
WEIGHTED AVERAGE STRIKE PRICES OF CONTRACTS
PRODUCER HEDGING
(weighted by number of contracts, end-September 2014)
Contract Type
Trigger
USD
——We estimate that the global producer hedge book
grew by 42 tonnes in 2014.
After two consecutive years of de-hedging by mining
companies we estimate that in 2014 the global producer
hedge book increased in volume by a delta-adjusted
42 tonnes. Within the year, the first six months saw
net hedging reach 63 tonnes, while we believe that the
second half of the year saw modest de-hedging that
partially offset those additions.
AUD
Bought Puts
-
$1,146
Sold Calls
-
$1,651
$1,753
Forward Sales
-
$1,350
$1,487
$1,676
$1,518
-
$926
$1,203
-
Knock-in Barrier Sold Calls
Knock-out Barrier Bought Puts
$1,324
Source: GFMS, Thomson Reuters
COMPOSITION OF THE DELTA-ADJUSTED HEDGE BOOK
(tonnes, end period)
13.H2
14.H1
14.H2E
Forward Sales
The stand out activity of the year was the relatively large
hedge position entered into by Polyus Gold International
in the second quarter. The company entered into a series
of price protection arrangements covering 88 tonnes
of production, using a combination of zero cost Asian
barrier collars and forward sales. The main purpose of
the programme was to provide cash flow stability as the
company planned to continue to invest in the Natalka
project (which has since been placed on hold). The collar
portion of the hedge by Polyus re-introduced barrier
options to the hedge book, something not seen since the
mid‑2000s.
77
90
Options
13
Total
91
Change
y-o-y
73
64
154
-5%
60345%
133
46%
Source: GFMS, Thomson Reuters
remain focused on improving margins through lowering
the cost of production rather than locking in a price
against any future price downturn.
Consequently, with the beginnings of deliveries
into the Polyus hedge, the second half of the year is
estimated to have returned to modest net de-hedging.
Underneath this net result, we believe that a small
number of producers have continued to enter into
new small positions and renew others as older hedges
mature. Some activity has already been outlined by
producer reporting, such as additional hedging from
OceanaGold, Northern Star Resources and Norton Gold
Fields. We also look for a potential hedge of a portion of
La Herradura production from Fresnillo plc. This action
will offset some of the deliveries that were scheduled to
mature in the fourth quarter, such that the full year will
see hedging of an estimated 42 tonnes. This would leave
the hedge book standing at 133 tonnes at end-December,
a rise of 46% from the multi-decade low of 91 tonnes
seen at end-September 2013.
While the Polyus hedge was substantial, and
accounted for 55% of the total volume of contracts
at end‑September, we do not believe that it will be a
strategy followed wholesale by other large-scale gold
miners. Prices have already fallen below the average Allin Cost of production. Therefore, for producers at the top
of the cost curve, the opportunity has now passed. The
contango remains thin and therefore does not provide
a meaningful incentive to attempt to beat spot prices.
Furthermore, investor and management aversion to the
practice of hedging has not altered sufficiently in our
opinion to remove what has been an important obstacle
to widespread hedging. Lastly, mining companies
COMPOSITION AND MATURITY PROFILE OF THE GLOBAL HEDGE BOOK AT END-SEPTEMBER
600
600
Vanilla Options
Barrier Calls
Forward Sales
Barrier Puts
Vanilla Puts
Forward Sales
400
400
200
200
Q1-09
Source: GFMS, Thomson Reuters
Q1-10
Non-Vanilla Options
Nominal Composition of the Hedge Book
Vanilla Calls
00
Q1-08
26
6060
Non-Vanilla Options
Delta-adjusted delivery profile (tonnes)
Global hedge book volume (tonnes)
delta-adjusted
MINE SUPPLY
800
800
Q1-11
Q1-12
Q1-13
Q1-14
Vanilla Options
5050
Forward Sales
4040
3030
2020
1010
00
2014
2015
2016
2017
2018
GFMS GOLD SURVEY 2014 - UPDATE 2
5. OFFICIAL SECTOR
•
•
A Swiss referendum on gold reserves and the signing
of the fourth Central Bank Gold Agreement attracted
much attention. However, the repatriation of gold to other
European countries is arguably of greater importance.
INTRODUCTION
Our estimates for official sector sales/purchases are
based on a combination of publicly available data in IMF
statistics, central bank websites, as well as information
collected through our field research. Due to the lag that
often exists between activity taking place and being
identified, it is possible that our estimates will be revised.
Our current estimate is that net official sector purchases
rose by 13% to 461 tonnes in 2014. We would not view
this increase as a function of lower prices but instead it is
more reflective of geopolitical events and the strength of
the US dollar/weakness of some domestic currencies.
Underpinning this view was exceptionally strong buying
from Russia, and from some other CIS countries. It is
admittedly the case that these countries were already
regular net purchasers of gold, especially Russia.
However, it is also clear that they have stepped up the
pace and consistency of buying as the geopolitical events
have increased instability and their desire to shift away
from dollar dependency and to provide some support to
the beleaguered rouble. The woes of domestic currencies
was also part of the rationale motivating some of the
other major purchasers, namely Iraq and Mongolia.
view that this is symptomatic of the countries economic
woes sparked by the political situation and with the IMF
bailout being insufficient. The only other seller of note
was Germany, of roughly three tonnes for its official coin
programmes.
PURCHASES
Gross purchases are estimated at 511 tonnes in 2014,
up by 17% year-on-year. Before looking at a countryby-country breakdown, it is important to note that
our figure does not include the net increase in Turkish
official reserves, as this is reflected in changes in local
commercial banks’ gold deposits with the central bank.
Starting with the announced purchasers, long term buyer
Russia has acquired more gold than at any time since at
least the break up of the USSR with 152 tonnes in the first
eleven months. Indeed, the pace of acquisitions picked
up in April and averaged almost 20 tonnes per month
over the remainder of the year. In addition, significant
buy-side interest was also apparent from other CIS
countries. For instance, Kazakhstan bought 46 tonnes,
partly through regular purchases of domestic gold
output, and Azerbaijan bought ten tonnes. The other major acquirers were Iraq who bought
48 tonnes in the first half of the year, and Mauritius
who acquired four tonnes. Overall, almost 40% of gross
purchases or more than 200 tonnes were accounted for
by undeclared transactions, details of which cannot be
released in respect of confidentiality.
SALES
WORLD OFFICIAL SECTOR PURCHASES AND SALES
The other was the Ukraine, which has sold nearly 19
tonnes, predominantly in October. It is likely in our
200
Gross Purchases
Net Purchases/Sales
141
137
100
Tonnes
Gross sales from the official sector rose substantially in
2014, to 50 tonnes, although this still represents a very
low level by historical standards. There were two major
factors for this; the first was Ecuador, who undertook
a swap transaction with Goldman Sachs and so their
holdings dropped by 14 tonnes in the second quarter.
(This technically shows up as a sale, because a swap is a
simultaneous sale and repurchase transaction, with title
passing for the duration of the exercise.)
58
23
164
113 118
66
150
112
124 118
131
92
101
116 103
85
14
0
-100
-17
Gross Sales
-200
Q1-10
Q1-11
Q1-12
Source: GFMS, Thomson Reuters
Q1-13
Q1-14
27
OFFICIAL SECTOR
Net official sector purchases picked up in 2014, aided
by stellar demand from Russia. As a result, it appears likely
that central bank buying was at its second highest level
since the end of the gold standard.
GFMS GOLD SURVEY 2014 - UPDATE 2
SWISS REFERENDUM; UNIQUE OR A SIGN OF
THE TIMES?
was also appealing, especially when there was a threat of war.
In addition to Switzerland, there have already been moves
reserves. While the Venezuelan example is somewhat different,
there were a number of interesting developments in central
the pattern elsewhere is more consistent, involving European
bank activity in 2014 with the greatest amount of attention
nations wishing to have a higher proportion of reserves under
garnered by the Swiss gold referendum. The vote was on
their own direct oversight.
November 30th and if successful the implications would have
been:-
The German example has been widely documented, and
initially developed at a glacial speed, with just five tonnes
1. The SNB would be banned from ever selling gold from its
being transferred in 2013 (although it does appear to have
reserves again.
progressed more quickly in 2014). But the Dutch central bank
surprised the market by announcing in late November that it
2. All of Switzerland’s current 1,040 tonnes gold reserves,
had already transferred 122.5 tonnes from the Federal Reserve
and future purchases, would have to be stored in the country,
to Amsterdam.
meaning that the approximate 208 tonnes in the Bank of
England and 104 tonnes in the Bank of Canada would have to
As a result, the Dutch central bank now has exactly the same
be repatriated.
amount of gold held domestically as it does in the Federal
Reserve. By way of historical context it also transferred gold
3. Most significantly, 20% of Switzerland’s currency reserves
from Australia (sic) to the UK back in 2000. The distribution
would have to be in physical gold (the wording does not
after these changes is now 31% in each of Amsterdam and New
deal with swaps and non-trade sales). This would mean a
York, while Ottawa and London store 20% and 18% respectively.
large purchasing programme for the Bank, which has rapidly
expanded its balance sheet since the turn of the century.
Looking ahead, the trend appears to be far from over, and not
just because the repatriation to Germany is not expected to be
The polls in the approach to the vote made it appear plausible
completed until 2020. In fact, there has been an increasing
but unlikely that the vote would pass (one poll did show the
trend of calls for further repatriation; in particular there
vote would be successful, but this turned out to have been
are movements in Austria, Belgium and France all gaining
unrepresentative). There also needed to be 50% of the cantons
media attention for taking these steps since the move by the
voting in favour for it to be enacted. However, the vote was far
Netherlands was made public. We would caution that while
more convincing then was expected, with only 22.7% voting for,
all of these individual countries’ efforts are far from certain we
compared to 77.3% against and all 23 cantons voting against
would expect there to be significant tonnages, over and above
the motion.
that being transferred to Frankfurt, being repatriated over the
coming years.
Much of the intention about this proposal, rightly and
understandably focused on the potential increase in reserves,
as this could have led to an increase in gold holdings by up
to 1,500 tonnes - at level prices, which of course would not
happen. We do not expect either such a programme, or a
CENTRAL BANK GOLD HOLDINGS PER CAPITA
referendum thereon, to be replicated, certainly by another
advanced economy. This is particularly the case with a criterion
4.5
that would not have allowed resale of any of the holdings under
4.0
any circumstances as this would tie a central bank’s hands and
terminals made exchange easier, while location diversification
28
Source: IMF; GFMS, Thomson Reuters
Libya
Kuwait
Belgium
USA
Singapore
Aruba
Austria
also as a matter of convenience; location near major market
0.0
Portugal
for many decades, in part as a legacy of the World wars but
Netherlands
The practice of holding gold reserves elsewhere has prevailed
1.0
0.5
Italy
exclusively in Europe, to repatriate part or all of their reserves.
1.5
France
part of an increasing desire by central banks, especially but not
Lebanon
In stark contrast, we view another aspect of the referendum as
2.5
2.0
Germany
most called upon.
3.5
3.0
Switzerland
thus make this “rainy day fund” unusable exactly when it is
Ounces per capita
OFFICIAL SECTOR
by Venezuela, Germany and the Netherlands to repatriate
Over and above the purchases and sales that were transacted
GFMS GOLD SURVEY 2014 - UPDATE 2
6. SCRAP SUPPLY
Global scrap supply fell 11% year-on-year in 2014, as
the depletion of near-market stocks combined with a lower
gold price discouraged liquidation of existing holdings.
Global scrap supply fell 11%, or 140 tonnes, to an
estimated 1,122 tonnes in 2014. This was its lowest level
since 2007, accounting for 26% of total gold supply,
compared to a high of 42% in 2009. Since 2010, scrap
supply has declined every year, with the rate of decline
reaching its peak in 2013 (-24% year-on-year). We
expect scrap volumes entering the market to continue to
weaken, although at a slower pace than previous years
and eventually stabilise.
Distress selling, a key theme between 2008 and 2012,
has also largely stopped, culminating in the shrinkage
of the number of existing players in cash-for-gold
operations. The toughening and overlapping nature
of regulatory rules to prevent money laundering in
many countries has further reduced the availability of
recyclable scrap from entering the system. These factors
have jointly contributed to dwindling scrap volumes.
ABOVE-GROUND JEWELLERY STOCKS & % RETURN OF SCRAP
100
2.5
Jewellery Stocks
Scrap
90
2.0
80
1.5
70
1.0
60
0.5
50
2004
2006
2008
2010
2012
2014E
Scrap return rate (%)
Europe saw scrap supply decline 17% in 2014 to
290 tonnes, representing 26% of global scrap supply.
Importantly, the declines, while large still leave scrap
levels above pre-2008 levels. Although the price of gold
in euro and sterling has not contracted as much as the
dollar; a number of other reasons are behind the fall.
First, the change in regulatory rules has raised costs for
the scrap supply chain, e.g. through the introduction
of a cashless scrap system in the UK. Second, there is
a decline in available supplies of near-market stocks.
Third, with the European economy stagnating, distress
selling has largely stopped across the region; indeed
people with scrap have become savvier, often waiting for
prices to rise before selling. Fourth, and in large part as
a result of the first three points, not only is supply to the
existing players dropping but the number of players in
the industry has fallen.
Scrap supply from the Middle East region declined by an
estimated 14% in 2014 in concert with the weaker dollar
gold price and depletion of near market gold assets. The
first half saw scrap ease just 9% due to opportunistic
selling in the first three months as gold tracked higher,
encouraging some profit taking. The second half of 2014
delivered a sizeable 19% drop in scrap receipts across
the region as gold prices eased. Looking at the region
in more detail reveals a common thread with a drop
witnessed in most markets. Scrap from Saudi Arabia
eased 12% year-on-year while supply from the UAE is
estimated to have contracted by a tenth. Elsewhere, Iran
and Iraq both recorded a similar dip in recycling, easing
5% and 4% respectively. Egypt was the only outlier with
scrap supply only easing at the margin as consumers
there took advantage of the weaker Egyptian pound
which augmented the price in local terms.
0.0
Source: GFMS, Thomson Reuters
29
SCRAP SUPPLY
The gold price trend is arguably the key determinant
behind the contraction in scrap supply over the years.
That said, we doubt that gold scrap supply will recover
meaningfully even if gold prices rally in the interim.
First and foremost, the dearth of near market stocks has
reduced the availability of scrap as most were shaken
loose from holders when scrap supply peaked in 2009.
In the United States scrap supply fell to 86 tonnes in
2014, down 19% from the previous year. The sustained
lower level of gold prices throughout the year was
the primary driver behind lower scrap in the country.
Interestingly, and contrary to price trends, scrap supply
increased 22% in the July to December period from the
previous six months. This increase was attributed to
some release of pent up scrap stocks, as pawnbrokers,
collectors, and others gave up on waiting for higher gold
prices to sell to recyclers and refiners. Gold recovery
from e-waste recycling saw a significant dip due to lower
feedstock volumes and a double-digit decline in perunit gold content of some e-waste streams delivered to
recyclers. Gold content in e-waste delivered to recyclers
in 2013 had increased from the previous year, which
suggests that collectors shipped their higher-grade
material that year amid a falling price and were left with
the lower-grade material in 2014.
Above-ground Jewellery Stocks (000 tonnes)
•
GFMS GOLD SURVEY 2014 - UPDATE 2
WORLD SCRAP SUPPLY
WORLD SCRAP SUPPLY
1200
800
Africa
1000
South America
North America
Gold Price
600
800
*
Tonnes
400
600
1600
1400
Europe
US$/oz
Tonnes
Developing Countries
1800
Oceania
400
200
Industrialised Countries
SCRAP SUPPLY
0
H1-04
H1-06
H1-08
H1-10
Source: GFMS, Thomson Reuters * Forecast
H1-12
*
H1-14
The turnover of gold in the Turkish market only really
got going in the final quarter of 2014 after a paltry
performance in the first half. The increase in activity,
including higher imports, lower prices and more jewellery
sales generally, saw more gold begin to flow through the
market, including as scrap. While lower prices meant
volumes were still constrained in comparison to recent
years we now expect to see scrap volumes stabilise with
higher levels coming back to the market at price levels
over 92 lira/gramme. The return of gold and jewellery
purchases by instalment on credit cards, albeit now at a
maximum of four instalments instead of twelve, should
also lead to more gold recycling. Buying gold and
jewellery on instalment was banned between February
and late October 2014. Total old gold scrap volumes in
Turkey are estimated at 20 tonnes in the second half of
2014, down by 25% year-on-year, a slower rate of decline
than that seen in the first half.
Jewellery scrap from India is estimated to have declined
26% year-on-year to 74 tonnes in 2014, the lowest level
in three years and the second consecutive year-on-year
decline. Looking at the receipts on a half yearly basis,
whilst the first increased by 24% on expectation of a
further decline prices, the second, in contrast, slumped
48% year-on-year. The acute decline was attributed to
a sustained period of prices trading in a lower range and
offering little incentive to profit from recycling. That said,
the previous year was dominated by scrap sales which
emerged from the auctioning of collateralised jewellery.
However in 2014 the share from this source is estimated
to have only been 2% compared to 10% in 2013. Refiners,
on the other hand, enjoyed brisk business handling scrap
jewellery but those volumes were in exchange of old
jewellery for new and doesn’t form part of our net figures
reported here. Another important development in 2014
was the first steps towards making scrap collection an
organised business.
30
1200
200
Asia
0
H1-11
H1-12
Source: GFMS, Thomson Reuters
H1-13
H1-14
H1-15F
1000
Chinese scrap supply was the major outlier in the Asian
region, posting a 21% year-on-year increase to reach a
record high of 182 tonnes. The surprise rise occurred
despite the average domestic RMB gold price easing 10%
in 2014. This increase, however, didn’t necessarily stem
from typical end-user liquidation. Indeed, the uptick was
largely attributable to an unusual phenomenon in the
jewellery sector last year which saw jewellery fabricators
clearing out their jewellery inventory (usually older
designs and slow moving stock) to refineries to boost
liquidity on their balance sheet, and counter the sluggish
jewellery demand in China.
East Asian scrap supply rose 4% in 2014 though this
figure was heavily influenced by the increase witnessed in
China. Excluding China’s contribution the remainder of
region experienced a decline more in line with the global
average, retreating 10% year-on-year to an estimated
162 tonnes. There were some sizeable falls across the
region last year, with the most notable decline seen in
Japan where scrap receipts declined 28% year-on-year.
Elsewhere, Thailand and Indonesia saw scrap flows drop
by 5% and 7% respectively as weaker domestic currencies
pushed local gold prices higher and encouraged some
profit taking. In Vietnam, the elevated premium
encouraged liquidations during the price peaks though
scrap still eased by 7% year-on-year.
WORLD SCRAP SUPPLY
(tonnes)
Europe
Change
2013 2014E y-o-y
14.H1 14.H2E 15.H1F
348 290-17% 146 144 137
North America 150
118
-21%
56
63
51
South America
3329
-12%141414
Asia
644599-7%308290288
Africa
80 79-2% 42 36 37
Oceania
77
-6%333
World Total 1,262
1,122 Source: GFMS, Thomson Reuters
-11%
571
551
531
GFMS GOLD SURVEY 2014 - UPDATE 2
7. FABRICATION DEMAND
•
Annual fabrication demand shrank 10% year-on-year in
2014 to 2,522 tonnes. This decline is despite a 10% drop in
the average gold price for the year.
•
The decline in fabrication demand is mainly
attributable to a fall in jewellery fabrication to 2,133 tonnes
(-11% year-on-year). Industrial fabrication demand also saw
a drop to 389 tonnes (-5% year-on-year).
•
Assuming an average H1 2015 price of $1,180/oz, we
forecast fabrication demand to be largely flat compared to
H1 2014. We do not foresee a surge of fabrication demand
similar to that of H1 2013 as aggressive bargain hunting,
which largely characterised the market in 2013, has given
way to a more cautious sentiment.
INTRODUCTION
In the developed markets, we are seeing a divergence
in fabrication trends between North America and
Europe: whilst North America achieved total fabrication
demand of 143 tonnes in 2014, the highest level since
2011 and a year-on-year increase of 2%, fabrication
demand in Europe declined by 5% over the same period
to 351 tonnes, the lowest level on record. We attribute
this to the different state of economic recovery in the
regions: the US appears to be gathering momentum
as its domestic economy continues to expand. Europe,
in contrast, seems to be mired in a deflationary trap
as economic recovery remains stagnant. These
developments have dealt a blow to consumer confidence,
resulting in lower demand for luxury goods.
In Asia, fabrication demand in the second half of 2014
remained flat from the first half of the year despite
a price decline. On a year-on-year basis, fabrication
fell by 3% on the back of a strong second half of 2013,
Looking forward, it is forecast that the first half of 2015
will see fabrication decline marginally in year‑on‑year
terms to 1,234 tonnes. The gold price is forecast to drop
to an average of $1,180/oz, but we do not expect this
decline to trigger much of an increase in fabrication
demand on aggregate as many bargain hunters are still
digesting 2013’s over-consumption.
WORLD GOLD JEWELLERY AND INDUSTRIAL FABRICATION
WORLD JEWELLERY FABRICATION
Change
Change
(tonnes)
2013 2014E y-o-y 14.H2E 15.H1F
(tonnes)
2013
2014E
y-o-y 14.H2E 15.H1F
Europe
368
351
North America
141
143
South America
44
46
Asia
Africa
Oceania
-4%
174
181
Europe
2%
81
64
North America
75
78
3%
46
34
4%
23
24
South America
31
36
14%
18
18
2,1741,915-12% 959 929
62631% 3134
33
-1%22
World Total 2,793 2,522 -10% 1,270 1,234
..of which:-
Middle East
East Asia
CIS
Indian Sub-Continent
274250-9% 120 135
1,3481,022-24% 465 554
93 90-3% 45 43
656730 11% 415288
Source: GFMS, Thomson Reuters
Asia
Africa
Oceania
301 286-5% 141 149
1,912 1,668-13% 839 806
62 631% 3134
3
3-1%
1 2
World Total
2,385
2,133
-11%
1,077 1,043
...of which:-
Middle East East Asia
CIS
274 249-9% 120 135
1,100
74
787-29%
351 440
72-2% 36 34
Indian Sub-Continent 644 720 12% 410280
Source: GFMS, Thomson Reuters
31
FABRICATION DEMAND
The second half of 2014 witnessed a 1.4% increase
in fabrication demand to 1,270 tonnes, compared to
1,252 tonnes in the first six months of 2014. The increase,
however, was muted considering an average quarteron-quarter price decline of 4% in the second half of
2014. Bargain hunting, which largely shaped fabrication
demand in 2013, was generally absent over 2014 despite
multiple price dips below $1,200/oz in the second half, as
potential buyers, expected at $1,200, stood aside looking
for further weakness.
which had been driven by bargain hunting. China’s
fabrication demand eased considerably from the second
quarter of 2014 onwards to pre-2012 levels as market
reaction to price movements was generally muted. In
contrast, fabrication demand in India, the other jewellery
powerhouse, grew from strength to strength over the
course of the year. We estimate jewellery and industrial
fabrication demand in India at 700 tonnes in 2014,
sweeping past China’s 676 tonnes to reclaim its position
as the largest user of gold globally.
GFMS GOLD SURVEY 2014 - UPDATE 2
INDIAN SUB-CONTINENT
——Indian jewellery fabrication rose by 14% in 2014,
mostly due to a surge in demand during the second
half of the year.
——Store expansion and growth of the organised
jewellery market continued to contribute to the
growth in fabrication.
Consumption was very strong during the September to
November period due to lower prices and the easing of
local premia. Seasonal factors played a role in adding
to volumes relative to prior months, but on a year-onyear basis it was still the best festival season in three
years. Additionally, the new Companies Act-2013, which
became effective 1st April 2014, forced customers to
redeem their deposits in the form of gold jewellery ahead
of maturity and a large part of this redemption happened
in August and September. Customers redeemed an
estimated 75 tonnes. As a result, retailers had to
replenish their inventory in addition to restocking. While
the orders increased, so did the premia, rising from an
average of about a dollar in the first week of August to
fifteen dollars by the end of that month.
INDIAN GOLD BULLION IMPORTS*
300
Gold Price
60
10
30
0
Jan-13
Jan-14
36
Jewellery Fabrication excluding Scrap
Gold Price
30
24
100% OPACITY
150
18
100
12
50
6
Tonnes
200
0
Q1-10
Q1-11
Q1-12
Source: GFMS, Thomson Reuters
0
Q1-13
Q1-14
Rupees/10g (thousands)
20
Rupees/10g (thousands)
120
90
Scrap used in Fabrication
250
30
32
Jewellery imports were an important source of supply in
the first half, particularly those coming from the UAE and
Singapore. These imports are estimated at 37 tonnes for
40
150
0
Jan-11
Jan-12
Source: GFMS, Thomson Reuters
*including re-exports
The policy reversal coincided with seasonal weakness
that is typical for the time of year so fabrication volumes
had already begun to slow. Also, with assurance that
there was going to be no supply constraints in the
future, retailers were focused on reducing their excess
stock that had been built up in anticipation of increased
restrictions. As a result premia collapsed to par and at
times local gold traded at a modest discount. Adding to
the pressure was the offloading of unofficially imported
gold as a brief rally in prices during December generated
higher margins. We estimate about 120 tonnes of gold
emerged through cross-border smuggling for the whole
of 2014, but this estimate is subject to revision.
INDIAN GOLD JEWELLERY FABRICATION
180
Tonnes
FABRICATION DEMAND
Indian jewellery fabrication rose 14% year-on-year
to reach a record high of 690 tonnes in 2014. Most
of the growth occurred during the third and fourth
quarters as retailers restocked when local premia eased
and gold prices fell. This growth in demand was in
contrast to the situation in the first half when retailers
deferred large‑scale buying due to high premia and less
availability of metal within official channels. However,
allowing Premier and Star trading houses, who were
previously excluded, to import under the 20:80 scheme
and the relaunch of the gold loan programme, effective
as of 21st May, boosted demand. Consumption is
estimated to have registered only single-digit growth last
year and even that mostly occurred in the second half.
The eventual recovery of consumer sentiment generated
a high level of replenishment and restocking among
retailers with fabricators reportedly operating at volumes
25% higher than their normal output. Expectations
of higher demand were followed by higher imports;
however, as the Finance Minister hinted at his discomfort
at the surging import volumes, the market was extremely
cautious. Premier and Star trading houses imported
approximately 250 tonnes in just three months.
Interestingly, despite such a high rate of imports, the
daily premium touched $27 during the second week of
November. This, according to local sources, was largely
due to the high level of hoarding by speculators who
hoped for a return to tighter market regulations, which
would presumedly drive premia higher. As demand
moderated toward the end of November so did premia,
falling to $8 on 27th November. However, in a surprise
move, the government announced on the 28th November
that they had advised the RBI to scrap the 20:80 rule and
to remove all the restrictions that had been introduced on
and since 14th August 2013.
GFMS GOLD SURVEY 2014 - UPDATE 2
the whole of 2014, though volumes dissipated as premia
collapsed later in the year. The Free Trade Agreement
that Indonesia has with its Asian counterparts has seen
a significant rise in trade to India, especially from late
September last year. With an import duty of just 1%
from Indonesia we understand about 410 kilogrammes
of 24-carat jewellery and about 580 kilogrammes of
22-carat jewellery were imported during the September
to December period in 2014. Sources however confirmed
these shipments are being remelted and sold into the
local market in bar form while entering the country with a
jewellery tariff code.
Jewellery consumption as discussed earlier witnessed
moderate growth in 2014. To counter this low volume
growth amid falling prices, retailers increased their
markup from an average of 6% on machine-made plain
jewellery to at least 10%. Also of note was the increase
in sale of high margin products during the second half
of the year, particularly in urban areas. The semi-urban
and rural regions however continued to be dominated
by plain 22-carat jewellery, due to the inherent affinity
toward plain designs.
all markets in the region failed to replicate the surge
in demand triggered by the price drop in 2013.
——Chinese jewellery fabrication retreated 33%
year-on-year from the record levels of 2013 as a
weaker economy and a drop in sentiment reduced
investment-related purchases.
After the extraordinary demand in jewellery seen in
2013, China’s jewellery fabrication fell back to an
estimated 608 tonnes, equivalent to a 33% year-on-year
decline in 2014. However, this had already been widely
expected throughout the industry with no one in the
trade expecting 2014 to be a repeat of 2013. Jewellery
fabrication, to give a sense of perspective, was up by 1.5%
against 2012. Jewellery offtake in the first quarter was
robust, rising a healthy 8% for the period, stimulated by
Chinese New Year sales. The end of the Chinese New
Year holiday season saw a swift cooling in demand, and
the softness extended into the second quarter. Despite
a brief recovery in the market due to the Labour Holiday
in May, the rest of the second quarter remained quiet
and weak. As the gold frenzy in China started in the
second quarter of 2013, the already higher base made
the decline in the second quarter of 2014 even more
dramatic, registering a 54% year-on-year drop. The
local gold price, quoted on the Shanghai Gold Exchange,
was trading at an average of 0.5% and 0.1% premium
compared to the international benchmark respectively for
the first and second quarters.
The third quarter also remained lacklustre, and despite
a slight improvement compared to the second quarter,
total jewellery offtake retreated by 46% year-on-year,
compared with exceptionally strong third-quarter sales
in 2013. Poor market sentiment sparked a war among
fabricators, with markups slashed to levels not seen
CHINESE GOLD JEWELLERY FABRICATION
300
300
1000
280
250
800
260
200
240
150
180
100
120
50
60
East Asian GDP**
240
400
220
200
200
0
H1-10
H1-11
H1-12
H1-13
H1-14
Source: GFMS, Thomson Reuters
*The sum of total fabrication and physical bar investment
**Weighted average: Indonesia, South Korea, Thailand
180
360
Gold Price
0
Q1-10
Q1-11
Q1-12
Source: GFMS, Thomson Reuters
300
Q1-13
Q1-14
Yuan/gramme
600
Tonnes
1200
GDP (US$bn)
Tonnes
EAST ASIAN TOTAL DEMAND*
——East Asian jewellery fabrication fell 29% in 2014, as
0
33
FABRICATION DEMAND
Pakistan’s jewellery fabrication is estimated to have
declined by 15% in 2014. The decline can be largely
attributed to terror attacks, which disrupted economic
activity, and a looming energy crisis. While a supply
shortfall persisted, following a tightening of import
regulations, much of the domestic consumption that
emerged was investment driven, both in bars and in plain
jewellery as consumers looked to gold for its safe haven
appeal. Unofficial gold imports contributed to a large
part of the supplies available in the domestic market.
EAST ASIA
GFMS GOLD SURVEY 2014 - UPDATE 2
since 2011. With production costs still on an uptrend,
particularly labour and rents, consolidation was a feature
of the jewellery manufacturing industry last year. Further
consolidation is expected in 2015.
Jewellery fabrication in the last quarter of 2014 remained
weak and despite a better year-on-year performance
during the October National Day holiday, and the
year‑end restocking process ahead of the Spring Festival
2015, demand retreated by 28% on an annual basis;
the local gold price traded at an average premium of
0.2% for the final quarter of the year. One specific trend
last year was the expansion and return to favour of the
18-carat market, as the segment was well supported by
the younger generations due to its fashionable designs
and affordability, rather than for investment.
Jewellery fabrication demand in Indonesia retreated
13% in 2014, the first decline in four years with several
factors affecting offtake across the archipelago. The
weak domestic currency saw gold in local terms rise 3%
year-on-year. Similarly, a rangebound trading pattern
for much of the year kept investors on the sidelines, with
expectation of weaker prices seeing many prepared to
wait before replenishing gold stocks. Even when prices
dipped in the third quarter there was only a muted
response from consumers compared to 2013 when any
price drop saw consumers rush in to take advantage of
the perceived discounted price. Consumption in rural
regions was marginally stronger than in the major cities,
with economic growth in the commodities-focused
provinces of Kalimantan and Sumatra outperforming
urban centres where a soft economy dampened
consumer sentiment and led to a drop in discretionary
spending.
South Korean jewellery fabrication recorded a modest
2% drop in 2014. An already fragile domestic economy,
along with the sinking of the MV Sewol incident in
April of last year, discouraged discretionary consumer
spending. Indeed unlike most other markets in the
region, gold jewellery demand in Korea is more sensitive
Following a 7% rise in 2013, Vietnamese jewellery
fabrication recorded another increase last year, rising
8% to an estimated 12.4 tonnes. The gain may indicate
a healthy domestic retail market at first glance; however
demand for most jewellery segments was actually
weaker in 2014. This was largely a function of softer
demand for gemset and low‑carat designs being offset
by plain 24‑carat jewellery (predominately rings), which
is increasingly being purchased as a simple investment
vehicle because access to investment bars continues
to be tightly controlled by the State Bank. Consumers
can often purchase the encapsulated rings, which have
item weight and purity stamped on the packaging, at
a lower premium than official bars so many investors
have migrated to this uncomplicated method of saving,
effectively augmenting jewellery fabrication and
consumption demand last year.
THAI BULLION IMPORTS
ANNUAL JAPANESE JEWELLERY FABRICATION
Jewellery consumption in Hong Kong declined by over
31% last year. Despite an increase in the number of
visitors in 2014, average spending per tourist actually
decreased. Bargain hunters who took advantage of the
acute price drop in 2013 were largely sidelined in 2014.
China’s anti-corruption policy is still being strictly policed
and this too had a negative effect on the appetite of
Mainland tourists particularly for luxury goods.
180
Other
30
15
150
Switzerland
Australia
25
12
120
20
90
15
60
10
30
5
0
0
Q1-11
Q1-12
Source: GFMS, Thomson Reuters
34
Q1-13
Q1-14
White Gold
Yellow Gold
Platinum
9
Tonnes
Gold Price
Baht/Baht bar (thousands)
Tonnes
FABRICATION DEMAND
Turning briefly to industrial fabrication, despite the
modest growth within the Chinese electronics sector in
2014 on the back of increased output, initial estimates
point to almost no change in the use of fine gold in this
sector, as ongoing substitution to cheaper metals such as
palladium and copper partially offset the use of gold.
to developments in the local economy than movements
in the international gold price.
6
3
0
2004
2006
2008
Source: Japan Chain Makers Association
2010
2012
GFMS GOLD SURVEY 2014 - UPDATE 2
A strong finish to the year on the domestic retail scene
was not sufficient to lift Malaysian jewellery fabrication
in 2014. A weaker export sector dragged down the
overall fine gold jewellery offtake by an estimated
9% year‑on‑year. Domestic consumption was stronger in
three of the four quarters last year with consumption in
the second quarter slumping by 50% from the elevated
levels in the corresponding period in 2013 when prices
initially plunged. The export market, which dominates
total fabrication in the country, suffered as traditional
markets (chiefly the Middle East) were down sharply due
to weakening consumer sentiment across the region.
EUROPE
——European fabrication dropped 5% year-on-year in
2014 to 351 tonnes, but the picture was mixed around
the continent. While fabrication dropped sharply in
Turkey* and much less in most of the Eurozone, it
picked up in Italy, the UK and central Europe.
——Jewellery fabrication dropped by an estimated 5%,
driven by drops in Turkish*, Russian and Italian
production. However in central Europe and the UK
fabrication was up strongly in 2014.
Italian total fabrication, from historic lows in 2013, rose
by 1.0% year-on-year in 2014 to 93 tonnes. Previously we
noted that Italy’s export-oriented jewellery fabrication
began to recover towards the end of 2013 and into the
first half of 2014; however, jewellery fabrication in the
second half of 2014 was actually down 3% year-on-year
as exports stalled and demand remained quiet.
Japanese jewellery fabrication was unable to maintain
the robust growth witnessed at the start of the year and
annual demand slipped by an estimated 7% year‑on‑year.
The first quarter was buoyed by the impending 3% rise
in the consumption tax, which took place on 1st April.
The recovery had been entirely driven by export growth,
particularly in the first quarter of the year, with much of
that coming from Dubai. Despite geopolitical concerns,
the trade data indicated the first-half rise at nearly 29%
in gross weight terms. Another strong increase was
recorded in shipments to Hong Kong/China, which may
seem a bit surprising given that China’s gold demand was
restrained last year. However, this could perhaps reflect
a stronger 18-carat segment (as Italy is predominantly
specialising in 18K gold), while the larger 24-carat sector
has remained weak. Lower gold prices in dollar terms
ITALIAN OFFICIAL JEWELLERY EXPORTS BY REGION
EUROPEAN Q1-3 HALLMARKING AND FABRICATION
120
Jan - Sep
Europe*
UK*
Swiss**
2013
2014
N. America
100
Italy - Domestic
Italy - Export
80
100% OPACITY
Index 2008 = 100
S. America
Middle East**
East Asia
60
40
Others
0
5
10
15
20
25
30
Tonnes
Source: GFMS, Thomson Reuters; Calculations based on Italian export data.
Shows only the direct flow of finished pieces. *incl Russia; **incl Turkey
20
2008
2009
2010
2011
2012
2013
2014
Source: GFMS, Thomson Reuters; BAO; Swiss Confederation; ISTAT.
*Index based on number of gold items fabricated and imported into the UK.
**Index based on hallmarked unit of watches
* Details of Turkish demand are located in the “Middle East” section of this chapter as Turkey straddles Europe and the Middle East
35
FABRICATION DEMAND
Following the anomaly of 2013 when fabrication demand
surged 46%, the first increase in eight years, Thai
jewellery fabrication demand declined 16% year‑on‑year.
Field research revealed a domestic market that was
lacking direction. The plain 965 purity gold market,
which dominates consumption across the country, is
predominately investment driven and with prices largely
rangebound, and expectations of lower prices, consumers
were reluctant to replenish gold assets. In contrast to
2013, a drop in price did not necessarily instigate a rush
in purchases. On several occasions during the year
consumers sold gold jewellery back as expectations of
further declines ahead instigated a stop loss mentality.
While plain gold demand was softer last year, it was
the gemset sector that was more severely impacted as
weaker domestic consumption was exacerbated by a
material fall in exports to several key markets (chiefly to
Europe). The weak economic environment in the region
saw orders for finished jewellery drop sharply.
Thereafter, demand for discretionary items wavered
as Japan’s economy again slipped into recession,
consequently dragging down jewellery consumption. In
addition, a weaker currency, that saw gold in yen terms
fall just 2% last year, added little stimulus to a struggling
retail sector.
GFMS GOLD SURVEY 2014 - UPDATE 2
and an improving economy have also lifted jewellery
consumption in the United States, pushing up exports to
that destination by double-digit percentages.
FABRICATION DEMAND
Despite protracted economic weakness, trade data
reported an increase in Italian jewellery exports to other
parts of Europe, particularly France, Germany and Spain.
We feel that higher exports to these countries could
therefore be a result of trade restocking in light of lower
gold prices. As we mentioned above, export growth
slowed significantly in the second half. The latest trade
figures saw total gross exports flattening in July and
down 9% year-on-year in August. Much of that was due
to a sharp drop in demand from the Middle East on the
back of the escalation of the Iraq/Syria crisis, which saw
a double-digit decline in shipments to Dubai over the two
months. Italy’s domestic consumption remains weak,
falling by an estimated 7% year-on-year in 2014, as tough
economic conditions and poor consumer sentiment
continue to take their toll.
German fabrication fell by 1% year-on-year to 32 tonnes,
driven by lower industrial demand. Jewellery fabrication
however remained flat at 15 tonnes. Changing tastes
in Germany and across the continent have translated
to a decline in the amount of gold used for decorative
purposes, especially in 2014. This ties in with weakening
interest in traditional gold jewellery in the country,
with consumers increasingly spending their money on
electronics. As with other markets in the west, younger
Germans tend to change jewellery to match outfits and
if these pieces are precious metals at all they are plated
or vermeil. This shift is reflected in the drop of the lower
price segment of the market, typically 8-carat; however
the bridal sector, typically 18-carat, remains strong.
Swiss jewellery and watch fabrication had a positive year,
up 4% year-on-year to 31 tonnes. This increase was due
to restocking and increased exports. Exports to China
were roughly flat, where anti-corruption initiatives have
cooled ostentatious gift buying; whereas the US, Japan
and South Korea all imported significantly more watches.
French jewellery fabrication suffered another year
of decline as it fell 2% year-on-year to six tonnes,
though the pace of decline slowed. This drop is despite
considerable growth in exports and reflects weakness
in the domestic market, where even fabrication of
costume jewellery has declined. The fall in the gold
price did have the effect of curtailing the expansion of
the 9-carat segment. The overarching trend of the last
five years from 9-carat to 18-carat did slow last year due
to regulatory concerns, however. Despite lower prices,
36
consumers still allocate their spending towards other
consumer goods and the more affordable end of the
jewellery market as regulations hamper gold jewellery
fabricators and retailers. Sales of branded pieces remain
robust however, as have high end gemset pieces.
British fabrication performed strongly compared to its
continental neighbours, up 20% year-on-year to ten
tonnes. Even more impressive, jewellery fabrication was
up 23% year-on-year. This growth is both an expression
of economic confidence in Britain and shifts in retail
trends and tastes. Indeed our field research backed up
with hallmarking statistics show that there has been
a move in the lower‑end of the market from silver to
9-carat gold, especially rose and yellow gold. There was
also impressive growth in the 22-carat market, which is
favoured for investment in some communities. Producers
and retailers also noted huge growth in internet sales,
with ‘Black Friday’ boosting sales.
Spanish gold jewellery fabrication slumped again in
2014, to its lowest level since our records began. To
put this into historical context, last year’s volumes were
less than a fifth of the 2003 peak. The prolonged crisis,
as well as a weak recovery, substantially undermined
households’ spending power and hence hampered
jewellery sales. The economic downturn had also
altered consumption habits and the gifting culture, with
fewer people giving jewellery for religious and family
celebrations. That said, after the long decline, it seems
that jewellery consumption started to bottom out in the
second half of 2014, helped by an improving economy
and lower gold prices.
Russian jewellery fabrication fell by an estimated 4%
last year, for the first time since the industry was hit by
the economic crisis in 2008, taking volumes to just below
50 tonnes. The reversal in the positive trend observed in
recent years was largely attributable to a sharp decline
in local jewellery consumption, particularly in the final
months of the year, when the economy began to feel
the negative effects of western sanctions and falling oil
prices.
In addition to economic and political headwinds,
consumer confidence and hence retail sales were badly
hit by a slump in the Russian rouble, which slipped to
record lows against the dollar towards the end of the
year. This resulted in a sharp rise in the local currency
gold price in the fourth quarter, up by 36% year-on-year,
hurting demand for gold jewellery. Not surprisingly, last
year’s volumes failed to reach pre-crisis level.
GFMS GOLD SURVEY 2014 - UPDATE 2
NORTH AMERICA
monthly average gold prices from year ago levels. Gold
prices started off a quarter lower in January than a year
earlier and by October were down 7% year-on-year.
——North American fabrication demand rose to an
estimated 143 tonnes in 2014, up almost 2% from the
previous year. Last year witnessed the strongest rate
of growth since 2010, when demand rose 6%.
Jewellery fabrication in North America totalled 78 tonnes
in 2014, up 3% from the previous year. Jewellery demand
in the United States, which accounted for over 80% of
jewellery fabrication in the region last year, saw a 3%
increase in 2014. Last year’s increase was slower than
the 14% growth seen in 2013 due to the smaller decline
in gold prices and slower growth in gold jewellery retail
sales.
Jewellery store sales rose 1.1% in the first ten months of
last year, a slower pace than the 9.5% growth seen in
the same period in 2013, according to US Census Bureau
data. Sales were overall positive throughout the year, but
weakened, declining from year ago levels, in September
and October. This slowdown in growth over the course
of the year corresponds with the narrowing decline in
US JEWELLERY IMPORTS & JEWELLERY STORE SALES
200
40
180
38
160
Tonnes
36
Jewellery Store Sales (RHS)
34
120
32
100
30
80
28
60
26
40
24
20
22
0
20
2005
2007
2009
2011
2013
Source: GFMS, Thomson Reuters; GTIS; US Census Bureau
North American gold demand for other applications such
as dental restorations, electronics, and decorative items,
totalled 66 tonnes in 2014, down 0.4% from the previous
year. The lion’s share of this segment of demand is for
gold used in electronics. Electronics demand totalled
56 tonnes, up 0.4% from 2013. This was the first, albeit
small, increase in two years and can be attributed to
higher sales in consumer electronics. According to the
Consumer Electronics Association, US shipments of
consumer electronics are estimated to have increased 3%
in 2014, a stronger rate of increase than the 2% growth
seen in 2013. Gold demand growth, however, was curbed
by continued substitution of gold for copper in bonding
wire and the ongoing decline in global computer sales.
SOUTH AMERICA
——South American fabrication grew by 4% year‑on‑year
Sales (Bln US$)
140
On a year-on-year basis, gold demand from jewellery
manufacturers in Mexico increased by almost 9% to an
estimated six tonnes in 2014, which was the first increase
since 2005. This surge in growth is largely on the back
of a very weak 2013 and subsequent restocking in 2014.
Consumer demand for gold jewellery has largely trended
downward over the past decade due to high crime
rates and high gold prices, which has prompted a shift
toward silver jewellery, and the ongoing shift in jewellery
demand toward other materials.
in 2014 as jewellery fabrication remained robust.
Brazilian jewellery fabrication grew by 16% year‑on‑year
in 2014 to reach 25 tonnes. Total fabrication in H2 2014
increased by 5% from the first half of the year, driven by
healthy demand growth and restocking. This growth
occurred despite an increase in gold prices in local terms
due to real depreciation in the latter half of the year, a
37
FABRICATION DEMAND
Gold jewellery imports to the United States were 14%
higher, by volume, in the first ten months of 2014
compared to the corresponding period of 2013. Italian
imports rose significantly throughout the year, by 35%
in the January-October period. Italy is the third largest
US import partner after India and China, accounting
for around 15% of total imports by volume. Italian gold
jewellery imports rose due to euro weakness, making
Italian jewellery slightly more price competitive relative
to the United States’ other major partners. Additionally,
Italian jewellery is of better quality than other major
trade partners. China and India shipped 9% and 10%
more gold jewellery, respectively, to the US in the first
10 months of last year than in 2013. These two countries
account for a combined 35% of US jewellery imports.
Yellow metal remained a fashion trend in the US
throughout the year, boosting interest in gold jewellery.
Retailers continued to increase store space allocated
to gold jewellery to capture this trend. The shift back
toward 14-carat and away from 10-carat remained in
effect throughout the year as well. Consolidation and
shutdowns within jewellery manufacturers persisted
in 2014, however total volume from domestic jewellery
manufacturing rose nonetheless due to growth in retail
sales. Similarly, these trends helped boost Canadian
jewellery fabrication by 3% in 2014 to total nine tonnes.
GFMS GOLD SURVEY 2014 - UPDATE 2
testament to the robustness in demand for luxury goods
in the country. Industrial fabrication demand, primarily
used in gold plating applications, remains strong at an
estimated volume of nine tonnes in 2014. Demand for
plated applications has gained considerable popularity
in recent years, partly driven by the high gold price,
which has encouraged the switch to cheaper substitutes
such as plated or fashion jewellery. Furthermore,
Brazil has established itself as a gold plated jewellery
manufacturing hub, which has further spurred demand.
card debt and the misuse of the scheme to effectively
act as a proxy for short–term loans. This ban had a
substantial impact on the market and helped lead to
large volumes of 22‑carat material being exported from
the local market. From late October the ban was relaxed
to allow four instalments and, coupled with lower prices,
this has lead to healthy volumes flowing through the
market. For the second half as a whole we estimate a 6%
decline in fabrication year-on-year; however, this masks
an even stronger performance in Q4.
MIDDLE EAST
One area that has been a success story for Turkish
fabricators in 2014 has been the export market. In
addition to the large volumes of 22‑carat material
leaving the country there has also been a 30% increase
in 18‑carat jewellery exports as Turkish design becomes
increasingly popular in this segment. Overall, according
to the Turkish Jewellery Export Association, the value
of gold jewellery exports, excluding diamond jewellery,
increased by over 40% in 2014.
——Jewellery fabrication in the Middle East declined
Jewellery fabrication demand in Turkey fell to 70 tonnes
in 2014, down 20% from a year ago. The first three
quarters of 2014 were particularly slow in the Turkish
market in comparison to 2013. Indeed, by the end of
the third quarter imports of gold bullion were down by
60% year-on-year. Early November saw Turkish prices
drop below 85 lira/gramme, however, and this prompted
a significant increase in purchasing and saw the local
premium spike to $20/ounce briefly. This was some way
off the $40/ounce premium witnessed in 2013’s buying
surges and domestic volumes of investment‑grade
jewellery and small bars have been down.
Domestic fabrication in Turkey was hurt by a number
of factors in 2014, notably higher than expected price
levels and restrictions imposed on credit card instalment
payments, which reduced local consumption. The
advance of ISIS in Iraq also led to a sharp slowdown in
this key export market. In February 2014 the Turkish
banking watchdog BDDK introduced a ban on purchasing
gold and jewellery by instalments, owing to rising credit
Jewellery fabrication in the United Arab Emirates
(UAE) was only moderately weaker last year as
increased demand from India boosted offtake of plain
22‑carat designs. The elevated premium level in India
stimulated demand for investment-grade jewellery
from neighbouring countries. However, domestic
consumption eased by more than a tenth as purchases
across the region retreated from the heady levels of 2013,
driving imports sharply lower. The year started well,
with healthy demand in the first quarter as a rising price
environment encouraged restocking. Demand stalled
in the second quarter and didn’t recover thereafter. A
return in consumer interest in gemset and particularly
diamond jewellery was a feature last year as investment
motives, which were the chief architect for the surge in
2013 offtake, were largely absent from the market in
2014. Indeed, retailers suggested consumers may have
overstocked, bringing forward purchases during the price
MIDDLE EAST H2 JEWELLERY FABRICATION
TURKISH BULLION IMPORTS
350
Turkey
Others
300
GCC*
Egypt
50
100
50
0
H2-05
H2-07
H2-09
H2-11
H2-13
*GCC: Saudi Arabia, UAE, Oman, Bahrain, Kuwait, Qatar
Source: GFMS, Thomson Reuters
38
100
40
75
Tonnes
150
Gold Price
30
50
20
25
10
0
Jan-11
Jan-12
Source: GFMS, Thomson Reuters
0
Jan-13
Jan-14
Gold price (TL/g)
200
125
60
250
Tonnes
FABRICATION DEMAND
9% in 2014, due to a sizeable fall in investment
driven purchases amid uncertainty about the future
direction of gold prices.
GFMS GOLD SURVEY 2014 - UPDATE 2
INDUSTRIAL DEMAND
In addition to the economic impact the electronics sector
continued to face stiff head winds, slipping around 4% from
——Gold used in industrial applications slipped 5% in
2014 despite weaker gold prices and a healthy rise in
semi-conductor output.
2013 volumes, due chiefly to substitution away from gold
to cheaper alternatives such as copper and silver. This was
particularly prevalent within the bonding wire market, where the
yellow metal’s market share has now slipped below 50%.
Gold used in industrial and dental applications declined by
Gold in other industrial & decorative applications is estimated to
dragging down overall demand. Despite further encouraging
have declined 6% in 2014 with modest rises in several Western
signs that the US economy is expanding there remains several
and South East Asian markets, offset by a sizable decline
regions globally that have struggled to rebound and remain a
in India where demand for gold jari (thread) has remained
concern on an economic basis. Demand across Europe remains
stagnant since the beginning of last year. Demand for gold in
moribund as several countries in the region linger in recession,
dental applications continued to retreat in 2014, easing by 6%
as does Japan, while a slowdown in China has impacted offtake
year-on-year, despite a weaker gold price. The fall was a result
domestically and in neighbouring countries that export to the
of ongoing societal changes and migration to more aesthetically
Asian giant.
pleasing applications such as ceramics and cobalt chrome.
WORLD FABRICATION OF GOLD BONDING WIRE
GLOBAL SEMICONDUCTOR BILLINGS
80
Tonnes
110
40
*
20
90
0
80
H1-14
H1-15
drop in 2013. Another influence was the closure of trade
routes into northern Iraq due to the rising control of ISIS,
with this key market one of the more robust in the region
in recent years.
Turning to Iran, we estimate that fabrication demand
declined only at the margin, dipping 1% year‑on‑year
as consumers looked to the yellow metal as a method
of protecting wealth. Despite a more stable political
background the economy struggled with the pressures
of falling oil prices and continuing international
sanctions. Egyptian jewellery fabrication is showing
signs of a modest recovery as the tempered political
climate in recent months has brought an improved level
of consumer confidence and spending. Government
stimulus programs helped boost consumer sentiment
and economic activity last year. However, this trend
is likely to have a greater impact in 2015. The tourist
market, which historically has been a mainstay of
Egyptian consumption, remains subdued as a result of
the tensions in the region and has offset domestic gains.
Europe
Other Asia Pacific
Americas
Japan
160
200
Electronics Fabrication
160
120
120
80
80
40
40
0
H1-08
H1-10
Source: SIA; GFMS, Thomson Reuters
0
H1-12
H1-14
Current estimates point to a 9% drop in Saudi Arabian
jewellery fabrication volumes last year, in turn giving up
some of the impressive gains witnessed in 2013. Despite
the drop in offtake, the Saudi market remained quite
buoyant at times with retailers reporting moderate sales
activity across the year. While the lack of investment
interest in gold certainly played a part in the drop in sales
volumes, changing consumer tastes have also had a role
in reducing the fine gold consumed in this segment.
Indeed, most of the major branded fabricators in the
country have been aggressively promoting lightweight
gemset (chiefly cubic zirconia) 21-carat items and
increasingly 18-carat items for a number of years as they
attempted to generate higher margins to offset dwindling
sales volumes. While 21-carat jewellery still dominates,
item weights have fallen dramatically during the elevated
price and this has compounded the decline in fine gold
consumption. To this end domestic fabrication has fallen
by more than two-thirds in the last decade.
39
FABRICATION DEMAND
H1-10
H1-11
H1-12
H1-13
Source: GFMS, Thomson Reuters; OECD Stats
*Estimate
100
200
Global Electronics Fabrication (tonnes)
Industrial Production
Industrial Production (2010 = 100)
60
120
Global Semiconductor Billings (millions of USD)
almost 5% in 2014 with weakness in all major segments
GFMS GOLD SURVEY 2014 - UPDATE 2
8. PRICE APPENDIX
GOLD PRICES AND LEASING RATES IN LONDON AND EQUIVALENTS CONVERTED AT CLOSING DAILY EXCHANGE RATES
January-December 2014
London
London 1-month 12-month
AM fix
PM fix Euro/kg Yen/g Yuan/g
A$/oz Rand/kg INR/10g Leasing Leasing
US$/oz
US$/oz
Rate %
Rate %
Period Average
1,266.06
1,266.40
30,638 4,298.13 250.82 1,402.94
Maximum
1,379.00
1,385.00
32,0034,721.64 273.851,534.80 475,374
Minimum
1,144.50
1,142.00
Range:Average
19%
28,811 4,085.57 224.46 1,323.91
19%
440,561
409,113
10% 15%20% 15%
28,278
0.150
0.410
30,965
0.740
0.556
25,585
0.001
0.321
15%
19%
Monthly Average
Jan
1,243.07
1,244.80
29,3964,153.75 242.171,406.38 434,373
29,714
0.154
0.416
Feb
1,298.71
1,300.98
30,5994,270.87 254.36 1,450.07
456,713
30,411
0.187
0.429
Mar
1,336.56
1,336.08
31,0704,396.04 265.14 1,471.67 460,280
30,034
0.114
0.414
Apr
1,299.18
1,299.00
30,242 4,280.31 259.96 1,394.47
29,369
0.201
0.452
May
1,288.91
1,287.53
30,1524,214.08 258.21 1,383.49 429,198
28,914
Jun
1,277.86
1,279.10
30,239 4,196.54 256.22 1,365.19
27,552
0.096
438,937
438,950
0.178
0.457
0.402
Jul
1,312.99
1,310.97
31,1354,288.21 261.27 1,396.58 449,197
28,167
0.058
0.387
Aug
1,297.01
1,295.99
31,2834,287.68 256.41 1,392.57 443,820
28,273
0.100
0.353
Sep
1,241.33
1,238.82
30,8884,275.35 244.49 1,369.60 437,269
27,097
0.043
0.344
Oct
1,223.57
1,222.49
30,9934,244.32 240.74 1,392.98 434,539
27,082
0.114
0.362
Nov
1,176.41
1,176.30
30,3204,402.47 231.67 1,362.10
419,381
26,192
0.375
0.449
Dec
1,200.44
1,202.29
31,3424,610.03 239.13 1,456.71 443,895
26,776
0.215
0.466
0.420
Quarterly Average
Q1
1,291.90
1,293.06
30,3364,271.69 253.70 1,442.01 450,101
30,042
0.151
Q2
1,288.47
1,288.39
30,2114,229.76 258.10 1,380.79 435,748
28,587
0.157
0.437
Q3
1,283.82
1,281.94
31,0974,283.70 254.09 1,386.21 443,506
27,830
0.066
0.362
Q4
1,201.24
1,201.40
30,8834,407.41 237.321,402.55 432,517
26,680
0.229
0.423
Monthly Maximum
Jan
1,270.00
1,267.00
29,826 4,205.28 246.39 1,459.51
457,915
30,020
0.197
0.432
Feb
1,340.00
1,339.00
31,320 4,400.55 263.65 1,486.72
468,491
30,850
0.210
0.443
Mar
1,379.00
1,385.00
32,003 4,512.56 273.85 1,534.80
475,374
30,965
0.171
0.434
Apr
1,324.50
1,325.75
30,847 4,339.96 265.06 1,407.38
446,065
30,195
0.270
0.490
May
1,306.25
30,6004,274.95 261.451,408.05 440,757
30,700
0.240
0.492
Jun
1,323.00
1,318.50
31,158 4,322.58
264.13 1,408.35
450,919
28,800
0.150
0.414
Jul
1,343.25
1,340.25
31,663 4,365.45 267.26 1,427.32
460,593
28,950
0.100
0.417
Aug
1,317.50
1,315.75
31,642 4,325.62 260.48 1,420.28
451,654
28,725
0.163
0.376
Sep
1,287.25
1,286.50
31,582 4,316.11 254.021,399.63 442,068
27,905 0.084
0.365
Oct
1,251.75
1,250.25
31,616 4,299.81 246.02 1,424.30
443,946
27,630
0.243
0.382
Nov
1,202.25
1,203.75
31,241 4,559.03 237.02 1,406.29
425,013
26,720
0.647
0.538
1,228.25
1,229.00
31,8974,721.64 244.05 1,479.92 456,995
27,120
0.740
0.556
Dec
1,311.00
APPENDIX
Monthly Minimum
Jan
1,219.75
1,221.00
28,811 4,102.58 237.54 1,371.76
418,171
29,350
0.109
0.397
Feb
1,246.50
1,250.25
29,6974,085.57 243.59 1,401.00
444,130
29,850
0.129
0.409
Mar
1,294.00
1,291.75
30,1604,256.74 258.17 1,394.68 437,007
28,575
0.052
0.390
Apr
1,283.50
1,283.75
29,876 4,235.42
256.16
1,373.71
432,250
28,400
0.077
0.398
May
1,254.00
1,250.50
29,497 4,092.01
251.16 1,343.32
420,156
27,120
0.093
0.404
Jun
1,244.25
1,242.75
29,3214,094.62 249.86 1,336.80
424,451
26,800
0.044
0.383
Jul
1,292.50
1,285.25
30,831 4,231.51
255.11 1,372.64
437,345
27,800
0.024
0.347
Aug
1,280.50
1,275.25
30,871 4,237.55
252.19 1,371.68
437,344
27,790
0.058
0.337
Sep
1,210.00
1,213.50
30,3644,243.35 239.08 1,350.26
431,833
26,500
0.001
0.321
Oct
1,173.25
1,164.25
29,888 4,181.96 228.80 1,323.91
413,038
26,090
0.032
0.342
Nov
1,144.50
1,142.00
29,4084,208.77 224.46 1,329.45
409,113
25,585
0.203
0.373
Dec
1,177.00
1,175.75
30,7874,499.78 235.34 1,406.53
421,749
26,090
0.023
0.398
Source: Thomson Reuters. Lease rates are calculated, not market values
40
The cover of the GFMS Gold Survey 2014 Update 2 is sponsored by the following companies:
TANAKA PRECIOUS METALS
Tanaka Precious Metals is Japan’s leading precious metals refiner and manufacturer. Although best known
internationally for its high specification industrial products, used in various applications ranging from semiconductors
to communications, the company is also a producer and trader of a wide range of gold bullion bars and coins. Tanaka
bars are acceptable “good delivery” on the London gold market.
Valcambi is a leader in precious metals refining and operates one of the world’s largest and most efficient integrated
precious metals plants situated on a 33 hectare site, at Balerna, Switzerland.
We are one of the world’s largest manufacturers of minted ingots. Reacting to the demands of investors in
different markets around the globe we are continuously carefully developing within the size range from 0,5 g to
1000 g, gold, silver, platinum and palladium minted bars in different forms and new designs. For our clients, according
to their wishes we customize individually obverse and reverse of the bars, certificates and tailored packaging solutions.
All products produced in our foundry and minting facilities are certified by our laboratory, carefully inspected by our
operators, individually packed and controlled before shipment. The Hallmark is not only a guarantee for quality of
Swiss workmanship, it guarantees also the fineness of the most sought after bars in the world, desired by precious
metals connoisseurs and investors alike.
A Valcambi manufactured bar is not only sold at an outstanding price but is synonymous with unique craftsmanship,
guaranteed fineness, transparency and reliability.
GFMS Gold Market Research
and Forecasts
SEEK MORE
Dig deeper into the gold market with GFMS research
and forecasts on Thomson Reuters Eikon. Use the
new GFMS gold pages to quickly understand the key
drivers behind market movements. See which factors
drove price performance in the past, what will drive
the evolution of these markets in the future, and what is
happening inside various sectors of the industry today.
GFMS gold pages include:
• Historical supply and demand statistics
• Forecasts of supply, demand and price
• Field research reports on key markets
• Exclusive analyst commentaries giving expert
insight on news and market developments
To find out more contact us on [email protected]
The cover of GFMS Gold Survey 2014 Update 2 features Japan’s Fujiyama covered with Gold Grain and Switzerland’s
Matterhorn covered with Valcambi CombiBars and on the back cover a 1 ounce round Valcambi minted Gold bar and
a 50 gramme minted Tanaka Gold bar.
Cover designed by Valcambi and photography by Adriano Heitmann / Immagina, Stabio, Switzerland
For more information visit thomsonreuterseikon.com
© 2014 Thomson Reuters. 1006310 0314.
1006310_v2.indd 1
01/04/2014 16:09
© 2015 Thomson Reuters. All rights reserved. Republication or redistribution of Thomson Reuters
content is prohibited without the prior written consent of Thomson Reuters. “Thomson Reuters”
and the Thomson Reuters logo are trademarks of Thomson Reuters and its affiliated companies.
1008834_v1.indd 1
sponsors
GFMS GOLD SURVEY 2014
UPDATE 2
25/11/2014 15:15
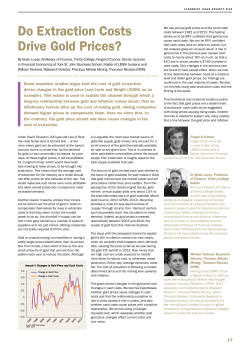


© Copyright 2026