
NRLP Mid-Term Assessment Report_31032015_latest
Aajeevika National Rural Livelihoods Mission Mid-Term Assessment Report National Mission Management Unit National Rural Livelihoods Mission RL Division, Ministry of Rural Development Government of India March, 2015 Contents Acknowledgements .................................................................................................................................... vii Abbreviations Used ................................................................................................................................... viii Executive Summary....................................................................................................................................... 1 Chapter-1 Introduction ............................................................................................................................. 10 Table-1.1 Sample from Resource Blocks ....................................................................................... 12 Table-1.2 Sample from Intensive Blocks (Other than Resource Blocks) ............................ 13 Chapter-2 Mission Structures and Human Resources .................................................................. 16 Table-2.1 Timeline of Establishment of SRLMs .......................................................................... 17 Table-2.2 Status of SMMU Staff in SRLMs ..................................................................................... 19 Table-2.3 Key SMMU Staff in Position: Dec. ‘14 .......................................................................... 20 Table-2.4 DMMU Staff in Position: Dec. ‘14 .................................................................................. 21 Table-2.5 BMMU Staff in Position: Dec. ‘14 .................................................................................. 22 Chapter-3 NRLP Footprint....................................................................................................................... 25 Table-3.1 Expansion of Districts Implementing NRLM: Dec.’14 .......................................... 27 Table-3.2 Blocks Implementing NRLM: Dec. ‘14 ........................................................................ 28 Table-3.3 Year-wise Commencement of Intensive Blocks: NRLP ....................................... 29 Table-3.4 Expansion of Resource Block Strategy: Number of Blocks ................................ 30 Table-3.5 NRLP Resource Blocks in Progress: Dec 2014 ........................................................ 30 Table-3.6 NRLP Footprint in GPs and Villages: Intensive Blocks ........................................ 31 Chapter 4 Social Mobilization and Inclusion .................................................................................... 32 Table-4.1 Year-wise Mobilization of Households into NRLM Fold ..................................... 33 Table-4.2 Households Mobilized in Resource Blocks with NRO Support ........................ 33 Table-4.3 Extent of Social Mobilization in Sample Clusters .................................................. 34 Table-4.4 Social Composition of Members Mobilized in Intensive Blocks ...................... 36 Table-4.6 Social Composition of SHG Members: Sample ........................................................ 38 Table-4.7 Social Composition of Members in Resource Blocks: Sample .......................... 38 Table-4.8 Social Composition of Sample Members in Partnership Blocks ...................... 39 Table-4.9 Social Composition of SHG Leaders: Total Sample ............................................... 39 Table-4.10 Social Composition of SHG Leaders: Resource Block Sample ........................ 40 Table-4.11 Social Composition of Sample SHG Leaders: Partnership Blocks (%) ........ 40 Chapter–5 Promotion and Functioning of SHGs ............................................................................. 42 Table-5.1 SHGs Promoted and Revived Per Block: Intensive Blocks ................................. 43 Table-5.2 Average SHGs per Block in Resource Blocks ........................................................... 44 Table-5.3 Composition of Sample SHGs ........................................................................................ 45 Table-5.4 Age Analysis of Sample SHGs: All Block Sample .................................................... 45 i Table-5.5 Adherence of SHGs to Panchsutras: Total Sample ................................................ 46 Table-5.6 Adherence of Sample SHGs to Panchsutras: Resource Block Sample............ 47 Table-5.7 Core Modules of SHG Member Training .................................................................... 48 Table-5.8 Training Provided to SHGs: Sample ............................................................................ 49 Table-5.9 Members Attending Three-Day Basic Training: Sample..................................... 50 Table-5.10 Facilitation Support Provided to SHGs: Sample .................................................. 50 Table-5.11 Source of Facilitation Support: Sample ................................................................... 50 Table-5.12 Number of SHGs Taking up Different Issues: All Block Sample .................... 51 Chapter-6 Finances of SHGs .................................................................................................................... 53 Table-6.1 SHGs with Saving Bank Accounts: All Intensive Blocks ...................................... 54 Table-6.2 Per SHG and per Member Cumulative Savings: Sample of New SHGs ........... 54 Table-6.3 Per SHG and per Member Cumulative Savings: Sample of New and Preexisting SHGs............................................................................................................................................ 55 Table-6.4 Eligible SHGs Provided RF in Intensive Blocks: MIS ............................................ 56 Table-6.5 Grading of SHGs: Sample ................................................................................................. 56 Table-6.6 No. of SHGs Provided with RF: Sample ...................................................................... 57 Table-6.7 Eligible SHGs Provided CIF in Intensive Blocks ..................................................... 58 Table-6.8 Sample SHGs Provided CIF ............................................................................................. 58 Table-6.10 SHG Bank Linkage in Intensive Blocks .................................................................... 59 Table-6.11 No. of SHGs Accessed Bank Credit: Sample ........................................................... 60 Table-6.12 CIF-Bank Loan Ratio in Intensive Blocks: 2014-15............................................ 60 Table-6.13 Leverage Ratio (Own Fund to Bank Loan) in Sample SHGs: All Blocks ...... 61 Table-6.14 Idle Funds with SHGs as Proportion of Total Outstanding Loans ................ 63 Table-6.15 Distribution of Sample SHGs by Amount of Idle Funds in Dec.’14 ............... 63 Table-6.16 Velocity of Fund Rotation in Sample SHGs: Up to Dec.’14 ............................... 64 Table-6.17 Members Availing Internal Loans (At least once): Total Sample (All Blocks) ........................................................................................................................................................ 65 Table-6.18 Members Availing Internal Loans (At least once): Total Sample (Resource Blocks) ........................................................................................................................................................ 65 Table-6.19 Purpose-wise Utilization of Loans As Indicated by Members: Sample ...... 66 Table-6.20 Status of Bookkeeping in Sample SHGs .................................................................. 68 Table-6.21 Status of Bookkeeping in Sample SHGs: Sample States .................................... 68 Chapter–7 Promotion and Functioning of VOs ................................................................................ 71 Table-7.1 Growth of VOs per Block: NRLP ................................................................................... 72 Table-7.2 Number of Villages with VOs: All Blocks ................................................................... 73 Table-7.3 Formation of VOs in During the Project Period: NRLP ........................................ 73 Table-7.4 SHGs Holding Membership in VO ................................................................................ 74 ii Table-7.5 Analysis of Sample VOs by Age: Total Sample ........................................................ 74 Table-7.6 SHGs Federated into VOs: Sample ............................................................................... 75 Table-7.7 Regularity of VO Meetings in Sample VOs ................................................................ 75 Table-7.8 SHGs Attending VO Meetings......................................................................................... 76 Table-7.9 SHGs Reviewed by VOs: Oct-Dec.’14........................................................................... 76 Table-7.10 SHGs Provided CIF: All Block Sample ...................................................................... 77 Table-7.11 SHGs Provided CIF in Resource Blocks ................................................................... 77 Table-7.12 MIP Appraisal Total Sample ........................................................................................ 78 Table-7.13 CIF Amount Provided to SHGs: Total Sample ....................................................... 78 Table-7.14 CIF Amount Provided to SHGs: Resource Blocks ................................................ 79 Table-7.15 CIF Recovery in VOs ....................................................................................................... 79 Table-7.16 Receipts and Payments of Sample VOs: Total Sample ...................................... 80 Table-7.17 Status of Bookkeeping in VOs: Total Sample ........................................................ 81 Table-7.18 Status of Bookkeeping in Sample VOs: Resource Blocks ................................. 81 Table-7.19 Role of VO in Mobilization, Training and Convergent Activities: Total Sample ........................................................................................................................................................ 82 Table-7.20 Capacity Building of EC Members: Total Sample ................................................ 83 Table-7.21 Social Issues Taken up by VOs: Sample .................................................................. 84 Chapter–8 Promotion of Social Capital............................................................................................... 86 Chapter 9: Process Study: MKSP Intervention ................................................................................ 96 Chapter 10 Process Study: CMSA Intervention .............................................................................107 Annex-1 Districts and Blocks ...................................................................................................... 116 Annex-2 HR Structure Recommended by NMMU ..................................................................... 117 Annex-3 HR Hygiene Practices in NRLP States: A Summary ...................................................... 119 Annex-4 Rationalised Structure ................................................................................................. 125 Annex-5 Efficiency Benchmarks for an Intensive Block (for 3 years)......................................... 126 Annex – 6 Identification of Target Households: A Summary of Methods Adopted .................. 130 Annex-7 Methods Adopted for Ensuring Social Inclusion in Different States ........................... 132 Annex-8 Identification and Mobilization ................................................................................... 134 Annex-9 Capacity Building of Community Institutions: NRLP States ......................................... 139 Annex-10 Revolving Fund Disbursement Channel: A Summary ................................................ 142 Annex-11 CIF Disbursement Channel: A Summary .................................................................... 147 Annex-12 Methods and Processes Adopted for Bookkeepers .................................................. 152 Annex-13 Internal CRPs Methods Adopted for Identification, Training and Deployment ........ 155 Annex-14 Status of MIS, Procurement and FMS in Different States ......................................... 159 Annex-15 State Information Report........................................................................................... 167 iii Annex-16: NRLP: MTR A Suggested Methodology for Process Study ........................................ 175 Annex-17:NRLP: MTR Checklist for Process Study ..................................................................... 176 Annex-18 : NRLM – MTR Process Assessment Study Focus Group Discussion Guide for SMMU/DMMU/BMMU Staff ..................................................................................................... 178 Annex-19: NRLP: MTR Sampling Procedure ............................................................................... 182 Annex-23 Implementation Processes in a Typical Block ............................................................ 215 Annex-24 Expansion from Resource Blocks to Newer Blocks .................................................... 217 Annex Table-3.1 NRLP Implementation in Progress: Districts, Blocks and Villages Entered ..... 218 Annex Table-4.1 Social Mobilisation in Resource Blocks (Sample) ............................................ 219 Annex Table-4.2 Social Mobilisation in Intensive Blocks ........................................................... 220 Annex Table-4.3 Social Mobilisation: Sample Clusters .............................................................. 221 Annex Table-4.4 Social Composition of Members Mobilized in Intensive Blocks ..................... 222 Annex Table-4.5 Social Composition of Members Mobilized in Resource Blocks ..................... 222 Annex Table-4.6 Social Composition of SHG Members: Total Sample ...................................... 223 Annex Table-4.7 Social Composition of Members in Resource Blocks: Sample ........................ 223 Annex Table-4.8 Social Composition of Sample Members in Intensive Blocks ......................... 223 Annex Table-4.9 Social Composition of Sample SHG Leaders: All Blocks .................................. 224 Annex Table-4.10 Social Composition of Sample SHG Leaders: Resource Blocks ..................... 224 Annex Table-4.11 Social Composition of Sample SHG Leaders: Intensive Blocks (%) ............... 224 Annex Table-5.1 New & Revived SHGs in NRLM fold in Intensive Blocks .................................. 226 Annex Table-5.2 New SHGs and Revived/Strengthened SHGs under NRLM Fold in Resource Blocks ......................................................................................................................................... 227 Annex Table-5.3 CBOs Promoted: Total Sample ........................................................................ 227 Annex Table-5.4 CBOs Promoted in Resource Blocks ................................................................ 227 Annex Table-5.5 SHGs Formed/Revived and Strengthened: Total Sample ............................... 228 Annex Table-5.6 SHGs Formed/Revived and Strengthened in Resource Blocks: Sample ......... 228 Annex Table-5.7 Training Provided to SHGs: All Blocks ............................................................. 230 Annex Table-5.8 Training Provided to Sample SHGs During CRP Rounds: Resource Blocks ..... 230 Annex Table-5.9 Training Provided to Sample SHGs on Meeting Processes: All Blocks ............ 230 Annex Table-5.10 Sample SHGs Trained Maintenance of Books of Accounts: All Blocks ......... 231 Annex Table-5.11 Sample SHGs Trained Maintenance of Books of Accounts: Resource Blocks231 Annex Table-5.12 MCP Training Provided to Sample SHGs: All Blocks ...................................... 231 Annex Table-5.13 MCP Training Provided to Sample SHGs: Resource Blocks ........................... 232 Annex Table-5.14 Other Types of Training Provided to Sample SHGs: All Blocks ..................... 232 Annex Table-5.15 Other Types of Training Provided to Sample SHGs: Resource Blocks........... 232 Annex Table-5.16 Members Provided Three Day Basic Training: All Blocks.............................. 233 iv Annex Table-5.17 Members Provided Three Day Basic Training: Resource Blocks ................... 233 Annex Table-5.18 SHGs Provided Facilitation Support: All Blocks ............................................. 233 Annex Table-5.19 SHGs Provided Facilitation Support: Resource Blocks .................................. 234 Annex Table-5.20 SHGs Provided Facilitation Support by Active Women and Staff: All Blocks 234 Annex Table-5.21 SHGs Provided Facilitation Support by Active Women and Staff: Resource Blocks ......................................................................................................................................... 234 Annex Table-5.22 SHGs Providing Training During Preceding Three Months: All Blocks .......... 235 Annex Table-5.23 SHGs Providing Training During Preceding Three Months: Resource Blocks 235 Annex Table-5.24 Attendance of Members at Sample SHG Meetings: All Blocks ..................... 235 Annex Table-5.25 Savings Subscribed by Members: All Blocks ................................................. 236 Annex Table-5.26 Stipulated Meetings Conducted During Last Six Months: Sample SHGs ...... 236 Annex Table-5.27 Number of Meetings held Vis-à-vis Expected During Last Six Months: Sample SHGs ........................................................................................................................................... 237 Annex Table-5.28 Average Member Attendance at Meetings: All Blocks ................................. 238 Annex Table-6.1 SHG Savings both Old and New SHGs: All Sample Blocks ............................... 239 Annex Table-6.2 Amount of Savings Collected by SHGs During Preceding 6 Months ............... 240 Annex Table-6.3 Savings Undertaken by Sample SHGs in All Blocks ......................................... 241 Annex Table-6.4 No. of members who have taken loans: All Blocks ......................................... 242 Annex Table-6.5 No. of members who have taken loans: Resource Blocks .............................. 242 Annex Table -6.6 Savings of Sample SHGs (New) by Age: All Blocks ......................................... 243 Annex Table -6.7 Savings of Sample SHGs (New) by Age: Resource Blocks............................... 244 Annex Table -6.8 Grading of Sample SHGs: All Blocks ............................................................... 245 Annex Table-6.9 Grading of Sample SHGs: Resource Blocks ..................................................... 245 Annex Table-6.10 Sample SHGs Provided RF: All Blocks ............................................................ 245 Annex Table-6.11 Sample SHGs Provided RF: Resource Blocks ................................................. 246 Annex Table–6.12 No. of Sample SHGs Provided with CIF: All Blocks ....................................... 246 Annex Table–6.13 No. of Sample SHGs Provided with CIF: Resource Blocks ............................ 246 Annex Table-6.14 No. of Sample SHGs Accessed Bank Credit: All Blocks .................................. 247 Annex Table-6.15 No. of Sample SHGs Accessed Bank Credit: Resource Blocks ....................... 247 Annex able – 6.16 Idle Funds with Sample SHGs by Age: All Blocks .......................................... 248 Annex Table-6.17 Average Idle Cash with Sample SHGs: Resource Blocks ............................... 249 Annex Table-6.18 Status of Bookkeeping in Sample SHGs: Intensive Blocks ............................ 249 Annex Table-6.19 Status of Bookkeeping in Sample SHGs: Resource Blocks ............................ 250 Annex Table-6.20 Velocity of Fund Rotation in Sample SHGs: Up to Dec.’14 ........................... 250 Annex Table-6.21 Leverage Ratio (Own Fund to Bank Loan) in Sample SHGs: All Blocks ......... 252 Annex Table–7.1 Growth of VOs Per Block: NRLP ..................................................................... 254 v Annex Table-7.2 SHGs Holding Membership in Sample VOs: All Blocks.................................... 255 Annex Table-7.3 SHGs Holding Membership in Sample VOs:: Resource Blocks ........................ 255 Annex Table-7.4 SHGs Federated into Sample VOs: All Blocks .................................................. 255 Annex Table-7.5 SHGs Federated into Sample VOs: Resource Blocks ....................................... 256 Annex Table -7.6 Regularity of Sample VO Meetings: All Blocks ............................................... 256 Annex Table -7.7 Regularity of Sample VO Meetings: Intensive and Resource Blocks ............. 257 Annex Table-7.8 SHGs Attending VO Meetings: Total Sample .................................................. 257 Annex Table-7.9 SHGs Attending VO Meetings: Resource Blocks ............................................. 258 Annex Table-7.10 SHG Reviewed by Sample VOs: All Blocks..................................................... 258 Annex Table-7.11 SHG reviewed by Sample VOs: Resource Blocks........................................... 258 Annex Table-7.12 Status of CIF Recovery in Sample VOs: All Blocks ......................................... 259 Annex Table-7.13 Status of CIF Recovery in Sample VOs: Resource Blocks .............................. 259 Annex Table-7.14 MIP Appraisal in Sample VOs: Resource Blocks ............................................ 260 Annex Table-7.15 SHGs Provided CIF by Sample VOs: All Blocks............................................... 260 Annex Table-7.16 SHGs Provided CIF by Sample VOs: Resource Blocks .................................... 260 Annex Table-7.17 CIF Amount Provided to SHGs by Sample VOs: Total Sample ...................... 261 Annex Table-7.18 CIF Amount Provided to SHGs by Sample VOs: Resource Blocks ................. 261 Annex Table-7.19 Role of Sample VOs in Other Activities: Total Sample .................................. 262 Annex Table-7.20 Role of Sample VOs in Other Activities: Resource Blocks ............................. 262 Annex Table-7.21 Capacity Building of EC Members in Sample VOs: Intensive Blocks ............. 263 Annex Table-7.22 Capacity Building of EC Members in Sample VOs: Resource Blocks ............. 264 Annex Table-7.23 Receipts and Payments of Sample VOs: All Blocks ....................................... 264 Annex Table-8.1 Social Capital Available: All States .................................................................. 265 Annex Table-8.2 SHG Bookkeepers Services Available in Intensive Blocks ............................... 266 Annex- Table-8.3 MCP Trainers Available: Intensive Blocks ...................................................... 266 Annex Table-8.4 VO Book Keepers Available: Intensive Blocks ................................................. 267 Annex Table -8.5 All Community Cadres Required, Identified, Trained and Engaged: Total Sample........................................................................................................................................ 268 Annex Table-8.6 VO Sub-Committees in Intensive Blocks ......................................................... 269 Annex Table-8.7 VO Sub-Committees in Resource Blocks ......................................................... 269 Annex Table –9.1 Status of SRLMs Submitting System Generated IUFRS (Tally IUFR) .............. 270 Annex Table – 9.2 Status of Procurement of Essential Services: NRLP States .......................... 271 Annex Table –9.3 NRLP Expenditure Up to Dec. ‘14 .................................................................. 272 vi Acknowledgements All NRLP states have participated in the Mid-Term Assessment Study. Several SMMU, DMMU and BMMU professionals participated in the study, shared their perspectives and facilitated collection of key information from the sample SHGs, VOs and Clusters. All the State Mission Directors provided their valuable insights into the implementation processes, emerging outcomes and the key challenges ahead of them. But for their support, advice and cooperation, this study could not have been completed. The NMMU seeks to place on record its deep sense of appreciation to all the State Missions. All thematic units of NMMU participated in the design of the study, its methodology and tools, besides effectively facilitating the conduct of the study in 13 NRLP states in a relatively short span of time. We would like to place on record my appreciation for all the thematic groups who have made this study possible. The World Bank TTL Parmesh Shah and his team provided valuable advice and guidance on key indicators of assessment and the dimensions to be explored as part of the study. The NMMU stands grateful to the TTL and his team. Mr. T. Vijay Kumar, Additional Secretary and the Mission Director, NRLM is the architect of the Mission. But for his guidance and invaluable insights provided into the working of the Mission, this study could neither have been conceived nor completed. We stand immensely grateful to him. The study was closely monitored and supervised by Ms. Santhi Kumari, COO, NRLM. The team stands grateful to her for her support, guidance and advise. Mr. G Muralidhar, Lead IBCB was involved in the initial preparation of the study design and tools. Finally, we would like to thank all the members of NRLPS and the RL Division of the MORD for their support and cooperation. M&E Team NRLM-MORD vii Abbreviations Used AAP Annual Action Plan BMMU Block Mission Management Unit CB Capacity Building CBO Community Based Organization CC Community Coordinator CEO Chief Executive Officer COO Chief Operating Officer CRP Community Resource Person CSO Civil Society Organization DMMU District Mission Management Unit DPM District Project Manager DRDA District Rural Development Agency EC Executive Committee FGD Focus Group Discussion FI Financial Inclusion FM Financial Management FY Financial Year GB General Body GOI Government of India GOTN Government of Tamil Nadu GP Gram Panchayat HR Human Resource IB Institution Building iCRPs Internal CRPs IDA International Development Agency IPC Innovation, Partnership and Convergence KII Key Informant Interview KMC Knowledge Management and Communication M&E Monitoring & Evaluation MAVIM Mahila Arthik Vikas Mahamandal MEL Monitoring, Evaluation and Learning MIS Management Information System MORD Ministry of Rural Development viii MTR Mid-Term Review NGO Non-Governmental Organization NIRD National Institute of Rural Development NMMU National Mission Management Unit NRLM National Rural Livelihoods Mission NRLP National Rural Livelihoods Project NRO National Resource Organization PRADAN Professional Assistance for Development Action S&P Skills and Placement SGSY Swarnjayanthi Gram Swarozgari Yojana SHG Self Help Group SID Social Inclusion and Development SMD State Mission Director SMMU State Mission Management Unit SRLM State Rural Livelihoods Mission TNWDC Tamil Nadu Women Development Corporation TRIPTI Targeted Rural Initiatives for Poverty Termination and Infrastructure VO Village Organization SM Social Mobilization IEC Information, Education and Communication GPLF Gram Panchayat Level Federation PRA Participatory Research Analysis CM Community Mobilizer SC Scheduled Caste ST Scheduled Tribe EAP Externally Aid Project CIF Community Investment Fund RF Revolving Fund OBs Office Bearers MCP Micro Credit Plan MIP Micro Investment Plan ix Executive Summary Purpose of the Assessment 1. The NRLP has been implemented as part of NRLM since June 2011 in 13 high poverty states with the support of the World Bank. As the project has reached mid-way, an internal assessment has been undertaken to take stock of the implementation progress and key achievements, assess key issues faced in implementation and identify the tasks ahead. The internal assessment report is expected to feed into the MTR of the project. The internal assessment is based on a three-part study comprising (i) a process assessment study in each state; (ii) analysis of state MIS; and (iii) a sample study of 502 SHGs, 121 VOs and 65 clusters spread across 10 states which have implemented intensive Mission activities for a minimum period of one year. Specially trained internal teams of the project states conducted the study, which was designed and supported by NMMU. Transition of States 2. There was an initial delay in setting up of autonomous Mission societies and dedicated implementation structures by the states. Except Bihar, all other states transited to NRLM after meeting the transition conditions during FY 2012-13. The project, however, gathered momentum during 2013-14 and established implementation structures and systems. Thus, by Dec.’14, the NRLP was being implemented in 374 blocks located in 130 high poverty and low HDI districts of 13 states. Human Resources 3. By Dec.’14, the state Missions had a vast reservoir of professional staff (over 7,000), recruited primarily from the market through a transparent selection process. The state Missions were able to recruit and use 67% of the approved SMMU staff, 56% of DMMU staff and 67% of the BMMU staff for implementing the Mission activities, after necessary induction and training. However, the state Missions need to focus on two areas viz., attrition among the staff and relatively high rate of turnover among the senior management, particularly, the CEOs/SMDs in some states. The rate of attrition among staff was particularly high in Assam, Odisha, Madhya Pradesh, Karntaka and Gujarat, while the turnover rate among CEOs/SMDs is relatively high in Assam, Bihar, Gujarat, Rajasthan and Odisha. The attrition rate could be minimized by improving HR hygiene in the state Missions. This would include payment of appropriate market based compensation and other allowances, timely reimbursement of travel and other costs, introduction of performance appraisal system and performance based incentives and minimum social security benefits. Most of these problems could be solved if the state Missions get their HR manual and policy approved by the competent authority. Further, ensuring reasonably stable tenure for CEOs/SMDs is important to promote continuity in implementation as states with stable tenure for CEOs/SMDs, have shown better results. Appointment of COOs also assumes importance in this context. Equally important for the state Missions is to undertake recruitment for the unfilled approved positions 1 consistent with the rationalization norms indicated as soon as possible to facilitate deepening and expansion of the project activities. Footprint 4. Intensive implementation of NRLP was initiated by states in a phased manner – 13 blocks in FY 2011-12, 124 blocks in FY 2012-13, 183 blocks in FY 2013-14 and 54 blocks in FY 2014-15, bringing the total to 374 blocks by Dec.’14 (as against the target of 400 blocks). These include 55 resource blocks supported by NROs and 14 partnership blocks in Jharkhand and 3 in Maharashtra supported by PRADAN and MAVIM, respectively. Within these blocks, the project had its footprint in 74% of the GPs and 60% of the villages. The staggered process of commencement of project activities in different districts and blocks had their impact on the pace of social mobilization. Social Mobilization 5. The mobilization of total households at the end of Dec.’14 stood at 3.2 million (52% into the new SHGs and 48% into the revived and strengthened SHGs), at an average rate of 8,599 households per block. This compares well with the expected number of households to be mobilized as per the efficiency benchmark (of 7,560 households per block at the end of second year). The average rate of mobilization per resource block works out to 7,547 households. The extent of social mobilization suggests that most of the blocks could be saturated during the next one year. However, there are inter-state variations in the rates of mobilization reflecting the history of SHG movement in the states, legacy of implementing CBO-centred EAPs, the availability of the stock of cognitive social capital and delays in the transition of states to the Mission. The states with low rates of social mobilisation need to intensify their efforts to saturate social mobilisation during the next one year. Social Inclusion 6. The emerging results of mobilization clearly demonstrates that the states have adopted highly inclusive strategies. The 374 blocks under implementation are characterized by a significant presence of the STs, the SCs and other vulnerable communities. Of the 3.2 million households mobilized into NRLP fold, 29% belong to the STs, 21% to the SCs and 9% to the minority groups, reflecting the inclusive character of the entire mobilization process. The mobilization in the resource blocks is even more inclusive. The social composition of SHG members in the resource blocks also reveals that 46% belong to the STs, 16% to the SCs and 5% to the minorities. Further, the project has firmly instituted inclusive approaches even in facilitating selections for leadership positions. Of the total SHG-OBs, those from the STs and the SCs constituted 42% and 16%, respectively. There was representation to the minorities as well as physically challenged persons. Promotion of SHGs 7. SHGs are the building blocks on which the entire edifice of community institutional structure is built. Commencing relatively slowly in FYs 2011-12 and 201213, the promotion of SHGs gathered momentum during FY 2013-14 and thereafter. By 2 Dec.’14, a total of about 1.44 lakh new SHGs were promoted, besides reviving 1.31 lakh pre-project SHGs. On an average, about 738 SHGs were promoted per project block, while the expected number of SHGs in a block after two years of intensive implementation is 720. The resource blocks supported by external CRP teams of NROs promoted a larger number of SHGs (912 SHGs per block). With the deepening of resource block strategy, the numbers are expected to rise sharply. States which transited early and those that had a history of strong SHG movement were ahead of others in the process of SHG promotion. The study conducted in sample clusters also indicates that 57% of the total SHGs promoted are new, while the proportion of new SHGs in the resource blocks is relatively high (72%). Age Analysis of SHGs 8. The age analysis of the sample SHGs reveals that 8% are about 1 year old, 31% are in the age group 12 to 18 months, 26% in the group 18 to 24 months and 34% over two years old. The preponderance of relatively young SHGs indicates that a good deal of capacity building and nurturing support would be required for the SHGs to become selfsufficient and sustainable. Adherence to Panchsutras 9. The sample study indicates that 75 to 90% of the SHGs were adhering to the five canons of good governance known as Panchsutras, reflecting the initial support, training and capacity building provided to SHGs, particularly, in the resource blocks. However, there were minor inter-state variations. Capacity Building of SHGs 10. The project has been organizing basic SHG training (3 days) as well as training in bookkeeping (5 days) and MCP (3 days), using core modules designed/customized by Mission states. In the resource blocks, 60% of the SHGs were provided basic training as part of CRP rounds, which was followed-up by trainings by PRPs and internal cadre. However, the training of SHGs, both new and revived, needs to be increased in the intensive blocks. Recognizing the importance of training, the state Missions have stepped up their efforts in identifying and training community cadres who would in turn provide training to the SHGs in a cascading mode. The state Missions are also entering into partnerships with reputed training institutions to supplement their efforts. SHG Bank Accounts 11. A necessary pre-requisite for all SHGs is to have savings bank accounts within three months of their formation. As of Dec.’14, 84% of the SHGs under the project fold had savings bank accounts with the states of Bihar, Jharkhand, Madhya Pradesh and Uttar Pradesh reporting a relatively lower percentage of SHGs having bank accounts. SHG Savings 3 12. The average cumulative savings per project SHG stood at Rs.14,353/(Rs.1,259/- per member) at the end of Dec.’14. The revived SHGs brought under NRLP account for a larger average amount of Rs.20,116/- per SHG (Rs.2502/- per member). The rate of average saving is commensurate with the average age of the SHGs. Grading of SHGs 13. The sample data indicates that about 61% of the SHGs had attained ‘A’ grade and others were catching up rapidly. The study also indicates the need for instituting a mechanism that would ensure grading of SHGs at regular intervals. Revolving Fund 14. As of Dec.’14, 63% of eligible SHGs (3 month old and adhering to Panchsutras) were provided RF and efforts were afoot in the Mission states to cover all eligible SHGs by Mar.’15. The sample data indicates that the RF coverage of SHGs was even higher. CIF Disbursement System 15. System of disbursing CIF through VOs was gradually getting established in Mission states, involving (i) identification and training of MCP trainers; (ii) training of SHGs in MCP preparation; (iii) appraisal of MCPs and disbursement of CIF to SHGs; and (iv) recovery of CIF from SHGs including the CIF directly received by them from Mission units. However, Madhya Pradesh, Chhattisgarh and Rajasthan need to accelerate the formation of VOs. CIF Provided to SHGs 16. Up to Dec.’14, 42,824 SHGs were provided CIF and this constitutes 57% of the SHGs that had prepared MCPs. The sample data also indicates that 48% of the eligible SHGs were provided CIF. The study reveals that shortage of MCP trainers, lag in training of SHGs in the preparation of MCPs, inadequate MCP appraisal capacity and lengthy sanction procedures contribute to the low CIF disbursement. The states are augmenting their MCP training and appraisal capacity, besides bringing in changes in the funds flow mechanisms. The VOs are being guided to managing CIF more efficiently. Bank Credit to SHGs 17. The MIS data reveals that 35% of the 6-month old SHGs under the project fold had accessed first dose of bank credit, which is a significant achievement, considering the fact that the project districts are located in areas with relatively low banking infrastructure and not so encouraging bank loan repayment history for the SHGs. Interestingly, the sample data also indicates that 34% of SHGs have accessed bank credit. However, the Mission states would do well to explore all possibilities to bank link all eligible SHGs for the first and repeat doses of credit. The project states were in the process of taking up several measures such as appointment of retired bankers, hiring the services of bank mitras and constitution of Community Based Recovery Mechanism (CBRM) to augment the bank credit to SHGs. Implementation of interest 4 subvention initiative in the project districts is also expected to promote SHG bank linkage. 5 Leverage Ratio 18. An attempt made to relate state-wise CIF disbursed (based on IUFRs) and bank loans mobilized by SHGs (MPR data) during FY 2014-15 indicates that the ratio is 1.87. As the data on CIF and bank loans are taken from two different sources, the leverage ratio was re-estimated using the sample data, which however suggests that the ratio was 0.6 up to Dec.’14 (since formation of new SHGs and revival of pre-existing SHGs). The leverage ratio of 0.6 appears to be reasonable considering the fact that it is the first linkage for most of the sample SHGs. Idle Funds with SHGs 19. While leveraging external funds is important, even more important is efficient utilization of own funds of the SHG by minimizing idle funds held in the form of cash-in hand and cash-at bank. The analysis is made using sample data reveals that there is a considerable amount of idle fund as percent of outstanding loan in Dec.’14. The number of sample SHGs that had more than Rs.10,000/- as cash-at bank and cash-in hand was large (153 out of 307 sample SHGs for which detailed comparable data was available). Velocity of SHG Funds 20. Rotation velocity of all SHG funds including own funds, RF, CIF and bank loans up to Dec.’14 varied between 0.7 and 1.6 across the sample states (10 for which comparable data were available), indicating scope for improving the rotation of funds. On the average, the rotation velocity of all funds up to Dec.’14 worked out to 1.3. Equity in the Use of Loan Funds 21. Overall, 84% of the sample members had accessed at least one loan (small or big) from the SHGs, irrespective of the source of funds. The proportion exceeds 90% in all resource blocks. This bears testimony to the inclusive approaches promoted in the resource blocks. SHG Bookkeeping 22. Analysis of bookkeeping practices suggests that there is a significant scope for improving the quality of bookkeeping (books, bookkeepers and bookkeeping) by facilitating engagement of adequate number of trained bookkeepers and providing handholding support to SHGs. Promotion and Functioning of VOs 23. VOs have been promoted in the project states right from FY 2011-12, but their promotion gathered momentum during FY 2013-14. A total of 13,450 VOs were formed in all project states up to Dec.’14, at an average rate of 36 per block. Out of the 34,172 villages in which the implementation was in progress, only 37% had VOs and all the villages are expected to form VOs during the next 3 to 6 months. 6 SHGs Federated into VOs 24. A total of 1.18 lakh SHGs had federated into the VOs (43% of the total SHGs), at an average rate of 9 per VO (12 in the sample clusters), with the inter-state variation reflecting the overall progress of IB in the states; while in the sample clusters, 55% of the SHGs had federated into the VOs. Functioning of VOs 25. Most of the VOs are nascent with 85% being less than 18 months of age (sample data). The relatively young VOs were however, practising all democratic norms as indicated by the regular conduct of EC meetings and the high proportion of SHGs (89% to 92% during Oct-Dec.’14) participating in such meetings. Review of SHGs 26. As federations at the village level, the VOs (61%) were undertaking review of performance of SHGs on a monthly basis using monthly report cards (Masik Prativedan). The VOs were also found instituting the sub-committee system. A significant proportion of VOs had loan repayment and bank linkage sub-committees. However, the sub-committee system needs to be strengthened with suitable capacity building and institution of agenda based reviews. Management of CIF by VOs 27. As most of the VOs were relatively young, only a small proportion of eligible SHGs were provided CIF up to Dec.’14 (while a larger proportion of SHGs were provided CIF directly prior to the establishment of VOs). On the average, sample VOs provided a CIF amount of Rs.38,362/- per SHG. The VOs had also started recovering CIF from the SHGs. The demand-collection-balance during Oct – Dec 2014, shows an increasing trend with about 40% of the demand being recovered. Average Receipts of VO 28. The sample data reveals that on the average, each sample VO had a cumulative total receipt of Rs.3.79 lakh up to Dec.’14, indicating that the VOs are handling substantial amount of funds, largely received as CIF. It is therefore important that this community fund is managed following all prudential norms such that it becomes a real community fund in perpetuity. VO Bookkeeping 29. The status of bookkeeping in VOs was satisfactory with most books adopted being regularly updated. However, there is need for all VOs to adopt all books of accounts and engage the services of trained bookkeepers to maintain all books. 7 Other Activities 30. Apart from managing CIF, the VOs were also undertaking other tasks expected of them viz., mobilization of left out poor (63% of VOs), organizing training of SHGs (43% of VOs), undertaking convergent activities with PRIs (46% of VOs) and working with line departments (23% of VOs). Capacity Building of VOs 31. In order to improve the functional capacity of the VOs, the Mission units were organizing systematic immersion and exposure and training in management of VOs, bookkeeping, MCP appraisal and CIF management. Some VOs were also found training the sub-committee members. With the VOs progressively gaining control over the community staff and social capital, the functional capacity of the VOs is expected to grow rapidly. Social Capital 32. The functional efficiency and sustainability of SHGs and their federations and the livelihood outcomes expected of them depend on the stock and quality of different types of social capital supporting them. In the context of NRLM, the social capital required for the community institutions include: (i) SHG bookkeepers, (ii) MCP trainers; (iii) women activists; (iv) VO bookkeepers; (v) VO animators; and (vi) internal CRPs. The MIS data indicates that on the average there were: 284 SHG bookkeepers per block at the rate of 3 SHGs per bookkeeper; 71 women activists per block at the rate of 1 per 11 SHGs; 35 internal CRPs per block at the rate of 1 per 22 SHGs (while Chhattisgarh has completed training of internal CRPs who are likely to be deployed in the intensive blocks shortly); and the projection of the NRO team indicates that 3,310 internal CRPs would be ready by Mar.’16, 7,210 internal CRPs by Mar.’17 and 15,800 by Dec.’17. 33. Further, the sample data indicates that 50% of all community cadres required were available. The sample study also reveals that resource blocks had 56% of required SHG bookkeepers, 40% of required MCP trainers and 70% of VO bookkeepers. The intensive blocks had a relatively lower stock of social capital. Only 52% of SHG bookkeepers, 41% of MCP trainers, and 37% of VO bookkeepers required as per norms were available in Dec.’14. Clearly, the generation of social capital needs to be augmented not only to meet the requirements of the existing CBOs but also to cater to the needs of the community institutions that would come up in the other blocks. This is particularly true of internal CRPs. Capacity Building of Social Capital 34. The internal CRPs and women activists identified in the resource blocks are also required to be trained fully and their services utilized optimally in the scaling-up process. Further, the real challenge is to ensure that all community cadres identified are adequately trained and those trained and engaged continue to provide services to these institutions. This in turn calls for a suitable policy to ensure payment of appropriate compensation to each cadre for the service rendered by them. 8 Conclusion 35. Establishment of new implementation structures and recruitment of professional staff are inherently time-consuming. Notwithstanding, the initial delays, the Mission gathered momentum from FY 2013-14 onwards. The states have standardised implementation processes and instituted basic systems at all levels. By Dec.’14, the project had its foot print in 374 blocks, spread over 130 districts and had entered 74% of the target GPs and 60% of the villages and mobilized 3.2 million households into 2.76 lakh SHGs. The results of mobilisation are highly inclusive, with the SCs and the STs accounting for more than 50% of the total. Further, 80% of the SHGs were adhering to panchasutras. About 2/3rd of eligible SHGs were provided RF, while about half of eligible SHGs (that completed MCPs) were provided CIF. Even more significant was that 33% of the 6 month-old SHGs were enabled to assess the first dose of bank loans. The promotion of VOs had also started with over 12583 VOs having been formed up to Dec.’14. All VOs were conforming to democratic principles of governance. The VOs were being strengthened to manage CIF efficiently. The resource blocks have adequately demonstrated the ‘proof of concept’ on the ground and are generating different types of social capital required to facilitate deepening of the activities in the project blocks. The states have reached a critical stage to take the project to the next higher level viz., promotion and diversification of livelihoods of the poor, social development activities such as promotion of health and nutrition and the welfare of the disabled and the aged. The project is poised for a big leap forward and all the targets set are feasible to be achieved during the rest of the project period. 9 Chapter-1 Introduction The Context 1.1 The Ministry of Rural Development (MoRD), Government of India (GOI) launched National Rural Livelihoods Mission (NRLM) in 2011, after restructuring the Swarnjayanthi Gram Swarozgari Yojana (SGSY). The central objective of the NRLM is to eliminate rural poverty through creation and strengthening of institutional platforms of the rural poor. The NRLM has been designed to provide a combination of financial resources and technical assistance to enable the states adopt a comprehensive livelihoods approach that encompasses four inter-linked components viz., (a) mobilization of all rural poor households into functionally effective self-help groups (SHGs), SHG federations and other organizations; (b) enhancing access to financial, technical and marketing services; (c) building capacities and skills of the poor and promotion of sustainable livelihoods; and (d) finally, improving the inclusive delivery of social and economic support services to the poor. The mandate of NRLM is to cover 70 million poor rural households in more than 600 districts, 6,000 blocks, 250,000 Gram Panchayats and 600,000 villages in the country through self-managed community institutions and support them for livelihoods over a period of eight to ten years. 1.2 In order to augment the resources required for implementation of NRLM in 13 high poverty states with special problems, the GOI has entered into an agreement with the World Bank (IDA credit) for an assistance equal to USD 1.00 billion over XII Plan period, which was later scaled down to USD 500 million with the closing date extended up to 31st December, 2017. This part of the NRLM that is being implemented with the support of the World Bank in 13 states1, 130 districts and 374 blocks is called National Rural Livelihoods Project (NRLP). But in terms of strategy and components, NRLP falls under the overall ambit of NRLM. Purpose of Mid-Term Assessment 1.3 As NRLP has been implemented since 2011, it is only imperative that a mid-term assessment is made to take stock of the (i) implementation progress and key achievements; (ii) key processes instituted with respect to results indicators; (iii) key issues faced with respect to progress, scaling-up and quality; (iv) feasibility of achieving NRLP and intensive blocks results indicators, in the remaining period; and (v) any changes/corrective measures and restructuring that would be required for accelerating implementation and scaling-up, improved project outcomes and utilization of NRLP funds. The financing agreement stipulates that an MTR be jointly conducted by the World Bank and the project management. It is in this context that a mid-term assessment has been undertaken by the states implementing NRLP under the overall guidance of the NRLM-MORD, which is expected to provide inputs for the MTR. 1 Assam, Bihar, Chhattisgarh, Gujarat, Jharkhand, Karnataka, Madhya Pradesh, Maharashtra, Odisha, Rajasthan, Tamil Nadu, Uttar Pradesh and West Bengal. These thirteen states account for 85% of the rural poor in the country. 10 Scope of Mid-Term Assessment 1.4 In order to make a comprehensive mid-term assessment (MTA) of the progress of NRLP, a three-part study was undertaken. The three components of the study include: (i) a process assessment study; (ii) critical analysis of State MIS Information; and (iii) a sample study of SHGs, VOs and Clusters. A process assessment study was designed and conducted by an internal team comprising NMMU members and senior state professionals with the objective of capturing the key processes adopted by each Mission state. The independent state teams led by state anchor persons conducted the process studies, primarily using FGD/KII mode with key staff of SMMU, DMMU, BMMU as well as community resource persons. The mid-term assessment inter alia sought to examine: (i) the key processes adopted by the Mission in the implementation of key activities; (ii) internal and external constraints affecting implementation; and (iii) emerging outcomes in key areas vis-à-vis the benchmarks. The FGD guide/tool used by the internal teams is presented in Annex-18. The key issues that the teams sought to explore is in Annex-17. 1.5 The second component of the assessment is based on analysis of progress reports provided by the states. Detailed MIS information on the progress of NRLP in the intensive districts and blocks was collected using pre-designed templates, from each state, as part of this process. The information collected from each state on key indicators was then analysed to delineate major trends emerging from different states at the state, district and block levels. The pre-designed templates used for collection of information from the states are furnished in Annex-15. 1.6 The third and most significant component part is a study of sample SHGs, VOs and Clusters drawn from both resource and intensive blocks of the 10 NRLP states which have completed at least one year of implementation in intensive blocks. The focus of this component is an assessment of the functional effectiveness of the community institutions (SHGs and VOs) and their potential sustainability features. Study Sample 1.7 The universe of the study included all resource and intensive blocks in which Mission implementation has been in progress more than one year. Based on the intensity of Mission inputs provided, the blocks which were more than one year old were divided into two categories viz., (i) resource blocks supported by external resource person teams drawn from NROs; and (ii) intensive blocks in which implementation was undertaken with internal resources of SRLMs. The number of resource blocks which were more than one year old as of Dec.’14 and the number of sample blocks selected from them are furnished in Table-1.1. 11 Table-1.1 Sample from Resource Blocks S. No. 1. 2. State No. of Resource Blocks No. of Resource Blocks > 1 year old No. of Sample Blocks No. of No. of No. of Sample Sample Sample Villages SHGs Clusters (>1 year old) (>1 year old) 4 12 36 8 24 72 4 4 2 Chhattisgarh Jharkhand 12 8 4 Madhya 3. 7 6 3 6 18 54 Pradesh 4. Maharashtra 8 8 4 8 24 72 5. Rajasthan 5 3 2 4 12 36 6. Total 36 29 15 30 90 270 Note: Figures in parentheses indicate the actual number of SHGs covered in the study. The changes were necessitated by field level constraints. But care was taken to adhere to probability base of the sample. Source: NRLM MIS. 1.8 Five NRLP states have been implementing resource block strategy with the support of NRO teams in 55 blocks, of which implementation is more than one year old in 29 of them. About 50% of these blocks were selected in the first stage. Then, from each sample block comprising 4 clusters, 2 clusters were selected using the predesigned sampling procedure. From each cluster, 3 villages in which implementation had been in progress for more than one year were selected. The sampling procedure is outlined in Annex-19. 1.9 The second part of the universe included all the one-year old blocks in the 10 states (including the 5 resource block states indicated above). From each state, 2 blocks were selected following the pre-designed sampling procedure. However, in Bihar with a total of 77 intensive blocks, 5 sample blocks were selected. From each sample block, 2 clusters were randomly selected and from each cluster, 2 villages (not contiguous) were sampled following the procedure outlined. From each sample village, 3 SHGs were selected at the last stage following the randomization procedure indicated and after ensuring that all the SHGs were more than one-year old. The intensive block sample details are furnished in Table-2. Pre-tested tools were used to collect detailed information from the sample SHGs, VOs and Clusters. The tools used are presented in Annexes-20, 21 & 22. 12 Table-1.2 Sample from Intensive Blocks (Other than Resource Blocks) No. of Sample No of No. of No. of S. SHGs State Intensive Sample Sample No. (>1 Blocks Blocks Clusters year old) 25 25 2 4 8 19 1. Assam 77 69 5 10 20 60 2. Bihar 12 12 2 4 8 24 3. Chhattisgarh 15 15 2 4 8 11 4. Gujarat 14 14 2 4 8 24 5. Jharkhand* 39 39 2 4 8 24 6. Madhya Pradesh 28 9 2 4 8 23 7. Maharashtra** 28 21 2 4 8 23 8. Odisha 2 0 0 9. Rajasthan 16 16 2 4 8 24 10. Tamil Nadu 11. Total 256 220 21 42 84 232 Notes: (1) *Includes Partnership Blocks with PRADAN; (2) ** Includes one Partnership Block with MAVIM; (3) Figures in parentheses indicate the actual number of SHGs covered in the study. The changes were necessitated by field level constraints. But care was taken to adhere to probability base of the sample. Source: NRLM MIS No. of Intensive Blocks > 1 year old No. of Sample Villages (>1 year old) Field Teams 1.10 Field teams were constituted by individual states. Each state team was headed by a senior professional by SMMU with 2 to 3 other professionals supporting him. One of the professionals was drawn from other SRLMs to ensure objectivity and bring in external perspective. Each district team was headed by a senior DPM and comprised one CC from each sample block and another CC from a neighbouring block. Thus, a three member district team visited the sample blocks and villages and collected detailed information from the sample SHGs, VOs and Clusters. The teams were provided a twoday intensive training that included a pilot run. The teams followed quality assurance norms built into the protocol. Each DPM heading the team was required to check 10% of the SHG/VO schedules. The data collected through the schedules was double-checked before transferring the same into an electronic data sheet pre-designed by NMMU. Notwithstanding the precautions taken, there were certain data entry related problems which were resolved by the NMMU team in consultation with the state teams. State datasets which have significant outliers or data deficiencies are not included in the analysis and the state teams have been requested to revalidate the datasets before they can be factored into the analysis. The field data thus collected, cleaned and compiled was analysed by NMMU team to generate two-way and three-way multivariate tables and inferences drawn from them in conjunction with MIS and process study information. 13 1.11 The study was designed and conducted in a reasonably short span of time. The study was designed and tools developed and field tested during Dec.’14. A two-day orientation was organized to the key NMMU and state professionals participating in the study at NIRD during 6-7 January, 2015. The process study, followed by the field study were conducted in two rounds. The first round, covering the states of Assam, Gujarat, Madhya Pradesh, Maharashtra, Jharkhand and Tamil Nadu was completed during 20-24 January, 2015. While the states of Bihar, Rajasthan, Chhattisgarh and Odisha were covered during 27 January - 1 February, 2015. In these 10 states, both process study and field study were conducted. In the states of Karnataka, Uttar Pradesh and West Bengal, where intensive implementation has not attained a critical stage, only process studies were conducted during 27-31 January, 2015. Thereafter, the state teams undertook preparation of state process study reports, while the field study teams undertook cleaning and digitization of data. The NMMU teams undertook review of draft state process reports and provided inputs for finalization of state process reports. The NMMU-M&E team also undertook analysis data and report preparation in the second part of February, 2015. Outline of the Report 1.12 The report is presented in 8 chapters. Chapter-1 outlines the context, purpose, scope and methodology of the study and its limitations. Chapter-2 discusses Mission structures established in different states along with the human resources engaged for Mission implementation. The NRLP footprint is briefly outlined in Chapter-3. The extent of social mobilization and inclusion achieved in the project is analysed in Chapter-4. Chapter-5 presents a discussion on the promotion and functioning of SHGs, while the finances of SHGs are discussed in Chapter-6. The promotion and functioning of VOs in the Mission states are discussed in Chapter-7. Chapter-8 examines the stock and forms of the social capital used in the project. Limitations of the Report 1.13 As described above, the internal mid-term assessment study was conducted in a relatively short span of time, covering a sample of 502 SHGs, 122 VOs, and 65 clusters in intensive and resource blocks spread over 10 states. This is a fairly representative sample drawn following the basic principles of sampling. However, in the actual selection of a small proportion of SHGs and VOs, not more than 5% of the samples, there were deviations from the prescribed sample. In Maharashtra, a small number of villages and SHGs had to be replaced due to the extremist threat in them. All efforts were made to provide comprehensive training to the internal teams in the collection of data, data cleaning and data entry. However, given the fact that the internal teams deployed are not professionally trained investigators coupled with the time limitations, there could be minor data quality problems particularly in recording and SHG and VO financial transactions. Every effort was made to clean the data and truncate the suspected contaminated sample before undertaking the analysis. There are significant inter-state variations in the implementation of the Mission, largely arising out of the delays in transition, establishment of Mission structures and systems, hiring of staff, attrition among top Mission functionaries and the access to the stock of social capital. The history of SHG movement also varies significantly across the Mission states. The states with experience in implementing EAP projects had certain initial advantages which 14 others did not have. Because of these cross-sectional differences, drawing inferences on the entire project being implemented in 13 states, posed several problems. However, wherever possible, the differences in the progress of resource blocks and intensive blocks have been brought out. As far as possible, the inter-temporal differences in the progress of the Mission states have also been brought out. These limitations, however, are not unusual to cross-sectional studies. 15 Chapter-2 Mission Structures and Human Resources Introduction 2.1 The launch of NRLM marked a paradigm shift in the strategy of implementation of rural poverty alleviation programmes in the country. Unlike its predecessor programmes, NRLM is mandated to be implemented in a Mission mode. Mission mode of implementation implies a shift from allocation based strategy to a demand driven strategy requiring the states to formulate their own poverty reduction plans focusing on time bound delivery of outcomes. All states are required to implement Annual Action Plans (AAPs) after seeking necessary approval of the MORD. Given the extent of mobilization envisaged and the community institutions expected to be promoted and nurtured, the Mission also mandates that a dedicated implementation structure manned by professional staff be established at the state, district and block levels. Thus, the states were required to transit to NRLM, only after fulfilling the following conditions: set up a society or designate an existing society as State Rural Livelihoods Mission (SRLM) and place a fulltime CEO to head the Mission; and recruit suitable professional teams from the market for the Mission management units at the state, district and block levels albeit in a phased manner, after obtaining necessary approvals. 2.2 Pursuant to the launch of the Mission in June 2011, all states have either established independent societies or designated the pre-existing entities as the respective SRLMs. The timeline of establishment of 13 SRLMs is furnished in Table-2.1. Out of the 13 SRLMs, 12 were established during FY 2012-13, while Bihar designated its pre-existing society (Bihar LPS) as its SRLM in January 2012. Thus, there was an initial loss of time in setting up the state Missions and consequently their activities. Given the diversity in the state administrative environment, the process of establishing new implementation architecture with a certain degree of functional and financial autonomy would be expected to take time. Thus, most of the SRLMs would have spent a substantial part of FY 2012-13 in establishing the three-tier implementation structures and the associated systems. 16 Table-2.1 Timeline of Establishment of SRLMs S. No. State 1. Assam 2. Bihar 3. Chhattisgarh 4. Gujarat 5. Jharkhand 6. Karnataka 7. Madhya Pradesh 8. Maharashtra 9. Odisha 10. Rajasthan 11. Tamil Nadu 12. West Bengal 13. Uttar Pradesh Source: NRLM MIS Month and Year of Transition May'12 Jan'12 May'12 Aug'12 May'12 Jan'13 May'12 May'12 May'12 Aug'12 May'12 Feb'13 Mar'13 Establishment of Mission Structures 2.3 Following the establishment of the SRLMs, all states have set up three-tier implementation structures comprising an SMMU, DMMUs and BMMUs. Apart from 13 SMMUs headed by CEOs/SMDs, 13 NRLP states have set up 100 DMMUs headed by district mission managers/other designated persons and 374 BMMUs headed by block mission managers by Dec.’14. Some states such as Madhya Pradesh and Rajasthan which have been implementing externally funded DPIP have initially adopted PFT structures at the sub-block level and are expected to transit to BMMU structures gradually. All SRLMs have been formulating and implementing AAPs of the Mission in intensive districts and intensive blocks (including resource blocks), after obtaining necessary approval of the MORD through the implementation structures established. However, it may be noted that there is a substantial degree of variations across the states in the financial powers vested with the DMMUs and BMMUs. In some states, the powers to sanction funds are vested with the district commissioners or CEOs of zilla panchayats at the district level and BDOs at the block level. The number of intensive districts and blocks approved for implementation during the last three years is presented in Annex-1. Human Resources 2.4 The transition conditions require the SRLMs to hire and optimally utilize the services of professional staff at all SMMU, DMMU and BMMU levels. The adequacy and quality of professional human resources are the key drivers of the Mission implementation. Therefore, their timely recruitment, induction and training as well as their optimal utilization assume importance. The state Missions are expected to institute appropriate systems for induction, training, management, performance 17 assessment, compensation, and redressing grievances. These issues are briefly examined in the following. 2.5 Further, in order to ensure that SRLMs have competent staff in different thematic areas, SRLMs have been advised to hire professionals from the market through a transparent selection process involving detailed notification, short-listing of eligible candidates, written test, group discussion and personal interview by a board comprising SMD, COO, thematic specialist, SPMs and a representative of NMMU. The SRLMs were also permitted to procure the services of competent HR agencies to ensure selection of quality professionals. The Missions were also advised to use the services of existing government staff after necessary assessment and provide appropriate fitment in the salary structure. A model compensation package for professionals of different levels was also suggested to the SRLMs. 2.6 The early experience suggests that NRLM can be sustained only through a gradual process of communitization. This would imply rationalization of HR structure in such a way that the community institutions and the community cadres takeover the activities presently handled by the Mission units in a phased manner. 2.7 In the rationalized structure, staff at the district and state levels would concentrate on implementing and deepening interventions in the resource blocks. While thematic specialists at the state, district and block levels would be merged and all staff would have ‘area responsibility’ as their primary focus. The staff would need to spend a substantial part of time in the community facilitating community institutions and the livelihoods of the poor. It is from this perspective that the staff structures for SMMU, DMMU and BMMU are being rationalised. The recommended rationalised structure is in Annex-4. SMMU Teams 2.8 The SRLMs are required to obtain appropriate sanctions from the state governments for recruitment of professional as well as support staff at all levels. The estimated number, level and type of staff required should match the actual requirements of the Mission. Further, as the SRLMs may not be able to find all staff required in one selection, the SRLMs and their HR agencies are expected to undertake multiple selections including selections through deputations, re-employment of professionals employed in externally aided projects and campus recruitments. The SRLMs have also been advised to adopt a young professional policy to encourage recruitment of young professionals from leading institutions. The HR structure recommended for the SMMU is presented in Annex-2. Hiring Processes 2.9 A review of the hiring process indicates that all except the state of West Bengal have hired professionals through the open market by adopting a transparent selection process, involving notification, written test, group discussion and personal interview. In West Bengal, however, most of the state level SGSY staff have been absorbed into SMMU. State Missions of Jharkhand, Maharashtra, Gujarat, Rajasthan, UP, Bihar and Odisha undertook recruitment with the support of HR agency, while Assam through a consultant. The SRLMs of Karnataka and Chhattisgarh undertook recruitment of SMMU staff in-house. In Odisha and Bihar, most of the staff working with the state units of the World Bank funded projects were absorb into SMMU. In Tamil Nadu, most of the SMMU 18 staff are deputed from the Tamil Nadu Women Development Corporation (TNWDC) and Government of Tamil Nadu (GOTN). SMMU Staff in Position 2.10 The number of staff required (as assessed by the SRLM), number of staff approved by the state governments and the proportion of staff actually in position in December, 2014, reveals varied trends. The staff in position at the SMMU level as percentage of the approved staff is only 65. Jharkhand, which has hired all staff from the market including COO, has reported that 94% of the positions approved are filled. The states of Bihar, Tamil Nadu and West Bengal which have absorbed/accommodated staff of the EAP/state government/ SGSY also indicate high percentage of recruitment (84 to 96%). The rate of attrition among staff is the lowest in these states. The lowest percentage of staff in-position are in the states of Assam (29), UP (29) and Odisha (32). Table-2.2 Status of SMMU Staff in SRLMs Dec. ‘14 S. No. State No. of Staff Approved* No. of Staff In Position Staff in Position as % of Staff Approved Staff Attrition (%) Assam 48 14 28 29 1. Bihar 111 93 <2 84 2. Chhattisgarh 33 26 15 79 3. Gujarat 50 37 74 13 4. Jharkhand 62 58 4 94 5. Karnataka 52 34 30 65 6. Madhya Pradesh 62 40 35 65 7. Maharashtra 99 66 67 7 8. Odisha 103 44 21 43 9. 55 33 18 TBC 10. Rajasthan Tamil Nadu 49 34 0 69 11. 52 22 10 42 12. Uttar Pradesh 25 23 92 8 13. West Bengal 14. Total 779 509 65 Note: * including support staff, young professionals and project executives; TBC – To Be Collected Source: State Information Reports 2.11 Staff in-position is relatively low in certain SMMUs for three reasons viz., (i) high attrition due to poor HR hygiene; (ii) delays in approval from the state governments and consequent delay in hiring the services of professionals; and (iii) repatriation of government employees on deputation. High attrition rates reported in Assam, Chhattisgarh, MP, Karnataka and Odisha appear to be due to relatively lower salaries (Assam), delayed payment of salaries (UP, Karnataka) and unusual delay in reimbursement of travel costs (all states). A summary of the HR hygiene practices in NRLM states is presented in Annex-3. 2.12 The existing HR Structure for the SMMU suggests that the recruitment of at least one professional is made for different thematic areas viz., IB, CB, FI, Livelihoods, M&E and MIS, HR, FM and Procurement. In the area of IB & CB, which is central to the Mission, all 13 states have reported positioning of adequate staff. The thematic areas of 19 FI, Livelihoods, M&E, MIS, FM and Procurement are better placed in terms of positioning of staff. In fact, in respect of FI, almost all states except UP and West Bengal have more than one professional each. 2.13 The rationalised HR structure recommended seeks to collapse thematic responsibilities for the SMMU staff and deploy the staff primarily for area responsibiltieis. Accordingly, the job descriptions of SMMU staff need to be modified and reorientation conducted. Further, the SRLMs are advised to avoid positioning staff for layering interventions in advance. The states have also been advised to avoid the tendency to assign additional thematic areas to SMMU staff. 2.14 The rationalised HR structure recommended each SMMU to hire and position 818 members, depending on the size of the state. Based on the suggested norm, the total staff required for 13 SMMUs is 324, which is far lower than 520 members currently in position. This implies that the surplus staff will have to be moved to the district and sub-district levels with appropriate responsibilities. Total Resource Cell/Pool Procurement FM HR KMC MIS ME&L IP&C S&P FI Livelihoods (Farm & NonFarm) State SID S N o IB & CB Table-2.3 Key SMMU Staff in Position: Dec. ‘14 1 2 3 4 5 6 Assam 2 0 1 2 1 0 0 0 0 1 3 1 0 11 Bihar 5 13 5 9 9 0 3 4 1 6 13 2 2 72 Chhattisgarh 3 0 1 1 1 0 1 1 0 1 2 1 0 12 Gujarat 4 0 5 2 5 0 1 2 1 3 2 0 0 25 Jharkhand 4 2 4 4 5 0 2 2 3 4 4 2 9 45 Karnataka 1 1 3 1 1 0 1 0 0 0 1 0 0 9 Madhya 7 3 1 2 1 1 1 1 1 1 3 1 0 0 16 Pradesh 8 Maharashtra 4 0 2 3 2 1 1 1 2 2 8 2 0 28 9 Odisha 3 2 2 4 2 0 1 1 1 3 3 2 0 24 10 Rajasthan 1 1 1 2 1 0 3 0 0 3 3 2 0 17 11 Tamil Nadu 3 3 2 1 1 0 1 2 2 2 2 1 0 20 12 Uttar Pradesh 2 1 1 1 0 0 2 0 0 1 1 0 0 9 13 West Bengal 2 1 2 2 1 1 1 0 0 1 2 1 0 14 Total 37 25 31 33 30 3 19 14 11 30 45 14 11 302 Note: In the states of Gujarat, Chhattisgarh and Maharashtra, Social Inclusion activities are also handled by IB & CB teams. Source: HR Unit- NMMU DMMU 2.15 Each DMMU was advised to hire 4 to 8 thematic experts, apart from the district mission manager. In addition, each DMMU could hire an MIS assistant, accountant and a data entry operator (See Annex-2 for recommended HR structure for DMMU). The 20 states have been advised to utilize the services of district level thematic specialists for area specific responsibilities from FY 2015-16 onwards covering all thematic areas to speed-up the implementation process. The state-wise DMMU staff approved and inposition indicates that 58% of the positions required have been filled. The rationalised structure recommended for DMMU is 3-5 members. At this rate, the required staff for 130 DMMUs would be around 650. The current staff in position exceeds the staff required as per the restructuring norms. Table-2.4 DMMU Staff in Position: Dec. ‘14 1. Assam No. of Intensive Districts Up to Dec.’14(NRLP) 8 2. Bihar 19 380 243 64 8 3. Chhattisgarh 9 60 33 55 17 4. Gujarat 9 81 53 65 34 5. Jharkhand 12 100 75 75 7 6. Karnataka 5 80 43 54 46 7. Madhya Pradesh 10 163 89 55 TBC 8. 9. Maharashtra Odisha 10 7 170 112 105 24 62 21 12 17 10. Rajasthan 7 36 19 53 TBC 11. Tamil Nadu 4 56 44 79 0 154 46 30 8 200 1672 136 972 68 58 0 - S. No. State 22 12. Uttar Pradesh 8 13. West Bengal 14. Total 130 Note: TBC – To Be Collected Source: State Information Reports No. of Staff Approved No. of Staff In Position 80 62 Staff in Position as % of Staff Approved 78 Staff Attrition (%) 47 BMMU 2.16 Each BMMU is recommended 2 to 4 thematic experts and 3 to 9 CCs, besides a block Mission manager. The initial HR structure recommended for BMMU is furnished in Annex-2, while the rationalized structure recommended is in Annex-4. 2.17 As of Dec. ‘14, the Mission was in progress in 374 intensive blocks including resource blocks. The number of positions approved for these blocks was 4,505, out of which 3,049 were filled in (68%). The variations in the number of staff appointed are due to the delays in setting up of BMMUs, delays in securing approvals from the state governments and the delays in procurement of HR agency to facilitate recruitment. Further, high attrition rate among certain states is also responsible for the low staff being in position. 21 2.18 In the rationalised structure, 4-6 members would be placed in each BMMU. This implies that a total of 2,400 staff would be required at the block level. At present, there are 3,301 staff in position, i.e. an excess of 901 staff. In the process of communitization, the excess staff would have to be moved to new blocks. Table-2.5 BMMU Staff in Position: Dec. ‘14 1. Assam No. of Intensive Blocks Up to Dec.’14 (NRLP) 25 2. Bihar 77 1131 582 51 13 3. Chhattisgarh 16 128 99 77 22 4. Gujarat 20 274 212 77 22 5. Jharkhand 29 369 266 72 4 6. Karnataka 20 160 124 78 25 7. Madhya Pradesh 46 792 772 97 8. 9. Maharashtra Odisha 36 28 492 231 369 139 75 60 TBC 4 TBC 10. Rajasthan 7 56 25 45 TBC 11. Tamil Nadu 16 272 160 59 22 12. Uttar Pradesh 32 13. West Bengal 14. Total 374 Note: TBC – To Be Collected Source: State Information Reports 176 88 50 0 17 224 4505 25 3049 11 68 S. No. State No. of Staff Approved No. of Staff In Position Staff in Position as % of Staff Approved Staff Attrition (%) 200 188 94 41 0 2.19 Several factors appeared to be responsible for the relatively low percentage of staff being in position at the DMMU and BMMU level as per the existing norms: First, delays in obtaining approvals from the state governments is the principal reason. Second, delays in procuring and contracting the services of HR recruitment agency is another important factor. Critical lack of procurement staff at the state level has delayed the procurement of HR agencies. Third, some state governments such as UP and Karnataka advised SRLMs against managing the contracts of Mission staff and instead advised them to hire the services of a HR management agency (in addition to HR recruitment agency) to manage the contracts of all Mission staff. This has resulted in deferment of the entire recruitment process by the two SRLMs. Fourth, in respect of Tamil Nadu, the recruitment of DMMU staff is delayed due to the initial plans of the Mission to set up DMMUs in all 30 districts, while MORD has accorded its approval for setting-up of only 4 DMMUs. The state has ultimately decided to limit NRLP DMMU recruitment only to 4 22 districts, while taking up the remaining districts with state government support. Fifth, the long process of selection/ deselection/ rationalization of the existing staff in the TRIPTI project as well as DRDAs, is causing delay in the recruitment of DMMU staff in Odisha. Sixth, attrition of existing staff primarily due to the sub-market rates of remuneration and travel reimbursement policies is an important issue in the states of Assam, Karnataka and Gujarat. Further, delays in the adoption of a comprehensive HR manual and policy by each Mission state is responsible for a large number of HR related decisions being postponed leading to higher attrition rate. Finally, lack of healthy HR practices such as abnormal delays in reimbursement of travel cost (paid at non-market rates, often below the rates applicable for government staff), absence of a contract renewal system, lack of annual increments, absence of insurance cover and lack of social security benefits have cumulatively affected the incentives of the staff and contributed to the high rate of attrition. Capacity Building of Staff 2.20 The capacity building framework of the SRLMs includes a four-phase rigorous induction process comprising orientation (2-3 days), immersion (15-20 days), exposure visit (30 days) and classroom input (5-10 days). Some states, such as Jharkhand, Bihar, Chhattisgarh, Rajasthan, UP and Assam have also included attachment with CRPs (in one village) as an integral part of induction. The core NRLM processes and COM are an integral part of the staff induction. 2.21 Of the total staff, 82% underwent an initial orientation across SRLMs, while 65% village immersion. Only 23% of staff went on an exposure visit and 38% had accompanied CRPs on their regular rounds. Besides induction, the staff were also trained in thematic areas in a phased manner. 2.22 The core staff capacity building modules include: (i) NRLM framework, (ii) theory of change and processes, (iii) poverty, (iv) vulnerability and livelihoods, (v) 10year perspective for a block, (vi) household, SHG, VO and CLF, (vii) gender, (viii) community institutions their cadres and sustainability, (ix) participatory skills, (x) facilitation skills, (xi) training skills, (xii) leadership skills, and (xiii) project management skills. 2.23 The capacity building framework for SRLM staff goes beyond induction and classroom training. It includes training in the field, as well as demonstration. The SRLMs have also assigned area responsibilities in addition to thematic responsibilities to staff, further enhancing the understanding of the staff. As a result, the SMMU and DMMU staff have begun to spend more time in the field, training the community and block staff. SRLMs have facilitated learning forums such as Writeshops (at national and state levels), team meetings (at national, state, district and block levels), mentoring and visioning for the staff. Six SRLMs, viz. Jharkhand, Chhattisgarh, Madhya Pradesh, Maharashtra, Rajasthan and Karnataka have conducted visioning exercises, followed by strategic planning workshops. State anchoring by NMMU has also contributed to the 23 capacities of SMMU staff, who are in turn nurturing district and block staff. The preparation of annual action plans (AAPs) has also contributed to the capacities of the staff. 2.24 The states have developed capacity building plans involving training needs assessment, preparation/customization of modules, identification of resource pools, training centres, partnerships with capacity building agencies, and preparation of training calendars. Chhattisgarh and Rajasthan SRLMs have utilized the services of SSK, Lucknow, while Jharkhand has partnered with both SSK, Lucknow and XLRI. A few other states have partnered with their SIRDs as well as NIRD. Some states have also developed training calendars for all staff at various levels. However, the capacity building architecture needs to be strengthened at all levels and a training calendar developed and monitored regularly. Summary 2.25 Though NRLM was launched in June 2011, 12 out of 13 states transited to NRLP after meeting the transition conditions only during FY 2012-13. This initial delay has a cascading effect on the pace of implementation of the project. There were subsequent delays in the setting up of implementation structures, hiring of HR agencies and recruitment of staff, primarily due to the delays in obtaining necessary sanctions from the state governments and lengthy process of procurement involved. Despite the initial delay and the administrative delays, the state Missions were able to recruit 65% of the staff approved at SMMU, 58% at the DMMU level and 68% at the BMMU level. This is a significant achievement, considering the fact that these recruitments were made from the market, following a transparent selection process. The human resources recruited by the Missions constitute a vast reservoir of professionals drawn from multiple areas which facilitated the states to set up three-tier implementation structures and implement annual action plans. The high rate of turnover among CEOs/SMDs and the high rate of attrition among key staff is a matter of serious concern. The state Missions need to institute appropriate HR hygiene practices to retain the professional staff hired and to put their full potential to optimum utilization. The relatively high attrition rate could be checked by the state Missions by adopting suitable HR practices to ensure payment of appropriate compensation and other allowances, timely reimbursement of travel and other costs, institution of performance appraisal system and incentives based on performance, provision of minimum social security benefits etc. Further, the state Missions should ensure that key staff required are appointed at all levels to facilitate project expansion into all clusters and villages, strengthening of community institutions and promotion of the livelihoods of the poor. Finally, early adoption of HR manual and policy by all state Missions would promote healthy HR environment in the project. 24 Chapter-3 NRLP Footprint Introduction 3.1 NRLM was designed to be implemented intensively in all rural blocks of the country. However, intensive implementation of the Mission simultaneously in all rural blocks of the country would require substantial human resources in general and social capital in particular, besides financial resources. Moreover, not all states had prior experience in implementing NRLM type programmes involving intensive mobilization of the poor and building their institutions for promoting sustainable livelihoods. Unless a ‘proof of concept’ is established on the ground, in each state, mainstreaming an intensive strategy would be difficult. Therefore, NRLM was designed to be implemented in a phased but intensive manner by applying human and financial resources in select incubation blocks in the first phase such that they would emerge as replicable models for the rest of the Mission area. Thus, NRLP was designed as a subset of NRLM to create a ‘proof of concept’, and an enabling environment for scaling-up the Mission activities to cover all blocks, villages and poor households in a time bound manner. An attempt is made in this chapter to present the footprint of NRLP with a view to presenting the progress of NRLP in 13 states since the inception of the Mission in June, 2011. Intensive Block Implementation Strategy 3.2 Intensive block is a sub-district unit identified by State Rural Livelihoods Mission (SRLM) in the first phase of implementation to demonstrate best practices and ideal processes to be adopted in rolling out key Mission activities. Over a period of three years, the intensive blocks are expected to identify and develop ‘social capital’ of the poor for scaling up and replicating Mission mandate to other blocks in a systematic manner. Besides serving as ‘proof of concept’, the intensive blocks are expected to serve as immersion and training sites for the project staff and the members of the community institutions. NRLM has adopted a three-pronged strategy for implementing the programme at the block level as briefly indicated below. Resource Block 3.3 Resource block strategy envisages use of social capital nurtured and developed in states which have successfully implemented large scale community driven poverty alleviation projects such as Andhra Pradesh, Telangana and Bihar. In order to facilitate use of social capital (CRPs) from these states, the Mission implementation agencies in these states have been recognized as National Resource Organizations (NROs) in June 2012 and the other Mission states are encouraged to enter into a partnership with them for undertaking initial social mobilization, institution building, capacity building and identification and training of internal social capital (internal CRPs, active women, bookkeepers, trainers etc.,). The states of Jharkhand, Chhattisgarh, Gujarat, Karnataka, Madhya Pradesh, Rajasthan, Maharashtra, Uttar Pradesh and West Bengal have been using the services of NROs in implementing intensive block strategy in the first phase in 55 NRLP blocks (Dec.’14). The essence of resource block strategy is that external women community resource persons of proven quality, drawn from the states of AP, 25 Telangana and Bihar undertake SM, IB and CB activities besides identifying and training social capital in select blocks, named as resource blocks. Encouraged by the early success of the model, the MORD has since recognized a few experienced CBOs also as NROs with whom the state Missions can partner with for taking forward the resource block strategy. Intensive Blocks 3.4 In addition to intensive implementation in the resource blocks with the support of social capital provided by NROs, the SRLMs have also been implementing intensive strategies in select blocks with their own staff and internal social capital available or through the social capital generated in the resource blocks. The basic difference between the resource blocks and intensive blocks is the nature of social capital employed for catalyzing social mobilization and institution building. Partnership Blocks 3.5 The third variant of intensive implementation is the partnership block model in which the state Missions have entered into partnership with reputed NGOs/CSOs which have been engaged in the implementation of CBO-centered community based livelihood promotion models. Under the partnership agreement, the NGO/CSO adopts and mainstreams all NRLM approaches in their ongoing CBO based interventions. Under this model, the Jharkhand SRLM is partnering with PRADAN for intensive implementation in 14 blocks, while the Maharashtra SRLM with MAVIM, a parastatal women development agency, for implementation of NRLM intensive approaches in 6 blocks. Block Implementation Processes 3.6 NRLM has been designed to be implemented for a period of 10 years in a block. A typical block has about 15,000 poor households, of which 13,500 (i.e. 90%) are considered as NRLM target households. Similarly, a block on the average is expected to have 120 villages, which could be divided into 4 clusters for implementation. 3.7 In a typical intensive block, the first 3 years are expected to focus on building the organisations of the poor by mobilising them into SHGs, federations at village, cluster and block levels. The following three years are expected to focus on deepening the Mission activities with a particular focus on additional layers such as health, nutrition, interventions for persons with disability (PwD) and livelihoods. The processes involved in different phases of implementation in a block are summarized Annex-23. The benchmarks for implementation (over a period of three years) are given in Annex-5. Expansion of Intensive Blocks 3.8 All the 13 states have been implementing intensive Mission strategies. As of Dec. ’14, the NRLP was being implemented in 374 blocks (including resource and partnership blocks) scattered over 130 districts of 13 states. This constitutes 29% of the total districts of the 13 states (Annex Table-3.1). The socio-economic profile of the districts selected indicates that a high proportion of them are relatively backward with 26 a substantial presence of the marginalized communities of the SCs and the STs. Thus, the selection of the districts under NRLP could be considered as inclusive. It may be noted that the Mission states have adopted intensive approach in select blocks of 42 other districts. Table-3.1 Expansion of Districts Implementing NRLM: Dec.’14 S. No. State Total Districts 1. Assam 27 2. Bihar 38 3. Chhattisgarh 27 4. Gujarat 26 5. Jharkhand 24 6. Karnataka 30 7. Madhya Pradesh 50 8. Maharashtra 33 9. Odisha 30 10. Rajasthan 33 11. Tamil Nadu 31 12. Uttar Pradesh 75 13. West Bengal 18 14. Total 442 (100) No. of Districts in Progress NRLM Total 27 8 19 (100) 19 19 (50) 11 9 2 (41) 9 9 (35) 12 12 5 (50) 5 5 (17) 10 10 (20) 10 10 (30) 10 7 3 (33) 9 7 2 (27) 15 4 11 (48) 22 22 (29) 8 8 (44) 130 42 168 (29) (10) (38) NRLP Source: NRLM-MIS 3.9 NRLP was originally designed to be implemented intensively in 400 blocks of 100 districts in 12 states over a period of 5 years. In the restructured NRLP, the number of blocks has been reduced to 300 in 13 states. However, as of Dec.’14, the states were implementing NRLP in 374 blocks (Annex Table-3.1). 27 Table-3.2 Blocks Implementing NRLM: Dec. ‘14 S. No. State Total Blocks in the State Blocks in Progress NRLP NRLM Total 44 1. Assam 219 25 19 (20) 77 2. Bihar 534 77 (14) 18 3. Chhattisgarh 146 16 2 (12) 20 4. Gujarat 224 20 (9) 32 5. Jharkhand 259 29 3 (12) 20 6. Karnataka 176 20 (11) 46 7. Madhya Pradesh 313 46 (15) 36 8. Maharashtra 351 36 (10) 40 9. Odisha 314 28 12 (13) 11 10. Rajasthan 248 7 4 (4) 60 11. Tamil Nadu 385 16 44 (16) 22 12. Uttar Pradesh 822 22 (3) 32 13. West Bengal 341 32 (9) 4332 374 84 458 14. NRLP States (100) (9) (2) (11) Notes: (1) NRLP Blocks include Resource and Partnership Blocks; (2) NRLM Blocks include Partnership Blocks; (3) figures in parentheses are percentages; (4) “ –“ indicates absences of NRLM intensive blocks. Source: NRLM-MIS. Expansion of NRLP Blocks 3.10 The NRLP intensive block strategy was initiated in 124 blocks during FY 201213, 183 blocks in FY 2013-14 and 54 blocks in FY 2014-15. The state-wise and yearwise expansion of NRLP implementation is presented in Table-3.3. Delays in transition of states to NRLM appears to be primary reason for the slow pace of expansion. It may be noted that 12 out of 13 states transited to NRLM only during FY 2012-13 and thus becoming eligible for NRLP funding. Delays in the establishment of Mission architecture and recruitment of human resources required at SMMU, DMMU and BMMU are the other important factors limiting the pace of expansion of NRLP. The pre-NRLM capacity differential of the states, particularly, in respect of social capital also seems to have affected the pace of expansion of intensive implementation into newer blocks. 28 Expansion of Intensive Blocks 3.11 The rate of expansion of intensive blocks in the NRLP states, however, has not been uniform, though all the 13 states had transited to NRLM by Mar. ’13. Establishment of implementation structures following the transition and recruitment of professional staff from the market are inherently time consuming, given the diverse administrative environment in different states. Thus, up to Mar. ’13, intensive implementation could be taken up only in 124 (33%) blocks. Implementation started in most of the blocks in 2013-14 and 2014-15. The pace of expansion has had its impact on the rate of social mobilization. Table-3.3 Year-wise Commencement of Intensive Blocks: NRLP Dec.’14 2011-12 S. 2014-15 2013-14 (3 Years) & State Total Blocks No. (<1 Year) (1 Year) 2012-13 (2 Years) 1. Assam 0 5 20 25 2. Bihar 8 47 22 77 3. Chhattisgarh 0 12 4 16 4. Gujarat 0 0 20 20 5. Jharkhand 7 17 5 29 6. Karnataka 0 20 0 20 7. Madhya Pradesh 1 3 42 46 8. Maharashtra 19 9 8 36 9. Odisha 0 28 0 28 10. Rajasthan 2 5 0 7 11. Tamil Nadu 0 0 16 16 12. Uttar Pradesh 17 5 0 22 13. West Bengal 0 32 0 32 54 183 137 374 14. Total (14) (49) (37) (100) Notes: (1) Figures in parentheses are percentages to total intensive blocks; (2) Includes resource blocks implemented with external CRP support. Source: NRLM-MIS Resource Blocks 3.12 Of the 374 NRLP intensive blocks, 55 are from resource block stream. The age of the resource blocks also reflects inter-state variations. The resource block strategy was started in 20 blocks during 2012-13, 10 blocks during 2013-14 and 25 blocks during 2014-15 (up to Dec.’14). There were some initial delays in preparing the states for partnering with NROs. The process of identification and orientation of external CRPs required on a large scale also took some time. After having established the partnerships with NROs, there has been a steady progress in the scaling-up of resource block strategy and in deepening SM and IB activities in the selected blocks. 29 Table-3.4 Expansion of Resource Block Strategy: Number of Blocks Dec. ‘14 Year of Commencement 2012-13 2013-14 2014-15 1. Chhattisgarh 4 --2. Gujarat --3 3. Jharkhand 5 5 2 4. Karnataka --3 5. Maharashtra 8 --6. Madhya Pradesh 3 3 1 7. Rajasthan --5 8. Uttar Pradesh -2 10 9. West Bengal --1 10. Total 20 10 25 Note: Includes only blocks in which external CRP strategy is adopted Source: NRLM-MIS S. No. State Total 4 3 12 3 8 7 5 12 1 55 Table-3.5 NRLP Resource Blocks in Progress: Dec 2014 S. No. State 1. Assam 2. Bihar 3. Chhattisgarh 4. Gujarat 5. Jharkhand 6. Karnataka 7. Madhya Pradesh 8. Maharashtra 9. Odisha 10. Rajasthan 11. Tamil Nadu 12. Uttar Pradesh 13. West Bengal 14. NRLP States Source: NRLM-MIS Total Intensive Blocks in Progress 25 77 16 20 29 20 46 36 28 7 16 22 32 374 Resource Resource Blocks Blocks in Identified Progress 0 0 0 0 4 4 5 3 16 12 5 3 7 7 8 8 0 0 5 5 0 0 12 12 8 1 70 55 Blocks in progress as % of total Intensive Blocks 0 0 25 15 41 15 15 22 0 71 0 55 3 15 Mission Footprint in Villages of Intensive Blocks 3.13 By Dec.’14, the Mission had its footprint in 74% of the GPs and 60% of the villages. However, mere footprint does not indicate the intensity of efforts made and the resulting outputs. For example in West Bengal, Assam, Karnataka, Odisha and Tamil Nadu, the footprint reported indicates presence of the Mission or its predecessor 30 project, which have since been replaced by NRLM, in a larger proportion of villages. Further, Karnataka and West Bengal, which are late comers to the resource block strategy, just initiated Mission implementation in certain intensive blocks. These states along with Assam, Odisha and Tamil Nadu are required to intensify their efforts by deploying required frontline staff and strengthening implementation structures and systems. Table-3.6 NRLP Footprint in GPs and Villages: Intensive Blocks Dec.’14 Percent of GPs Percent of Villages States Districts Blocks Entered Entered Assam 8 25 100 80 Bihar 19 77 73 41 Chhattisgarh 9 16 82 73 Gujarat 9 20 61 59 Jharkhand 12* 29* 84 49 Karnataka 5 20 100 96 Madhya Pradesh 10 46 97 98 Maharashtra 10 36 64 54 Odisha 7* 28* 35 31 Rajasthan 7 7 52 25 Tamil Nadu 4 16 100 72 Uttar Pradesh 22 22 43 18 West Bengal 8 32 100 92 74 60 14. Total 130 374 (10595) (34172) Notes: (1) * Total districts approved for Odisha is 8. (2) The total blocks approved for NRLP in Jharkhand and Odisha are 30 and 33, respectively. (3) Figures in parentheses are total GPs and Villages entered. (4) Intensive blocks includes resource blocks. Source: Computed from Annex Table-3.1. S. No. 1. 2. 3. 4. 5. 6. 7. 8. 9. 10. 11. 12. 13. Summary 3.14 NRLP has been designed as a subset of NRLM to create a ‘proof of concept’ and an enabling environment for scaling-up the Mission activities to cover all blocks, villages and households of the poor in a time bound manner. Over a period of three years, the intensive blocks are expected to identify, train and develop social capital to facilitate scaling-up of the Mission. NRLM has adopted a three-pronged strategy covering resource blocks, intensive blocks and partnership blocks to implement the Mission activities intensively and generate the required social capital and establish ‘proof of concept’. Thus, by Dec.’14, intensive implementation of the project, has been implemented in 374 blocks of 130 districts in 13 states. The Mission has made its footprint in 74% of the GPs and 60% of villages in these blocks. Establishing a footprint is only the first critical step and the project is successful in respect of this. But what is more important is the mobilization of all rural poor households in the ‘entered’ villages and saturate mobilization. It is also important to expand the Mission activities to other uncovered GPs and villages. 31 Chapter 4 Social Mobilization and Inclusion Introduction 4.1 NRLP was originally designed to be implemented in about 400 blocks spread over 12 states during 2011-16. The project had an original mobilization target of 4.8 million households. However, as the setting up of dedicated institutional structures to implement the project took much longer time than expected, the project has since been restructured and the period extended up to Dec.’17. The geographical spread and household reach of the project have however remained the same. This chapter examines the progress of the Mission in respect of social mobilization and inclusion. Geographical Spread 4.2 As against the target of 400 blocks, the geographical spread of the project has expanded to 374 blocks spread across 130 districts of 13 high poverty states by Dec. ‘14. Out of the 374 blocks in which intensive implementation is in progress, 55 are resource blocks implemented with the support of NROs in 9 states. Intensive implementation in the other 319 blocks is spearheaded by the frontline staff of the state Missions with the support of existing social capital, largely developed through EAP/state funded projects. Mobilization of Households into NRLP Fold 4.3 The total number of households mobilized in the intensive blocks at the end of Dec.’14 stood at 3.2 million, which constitutes 67% of the project target set for Dec.’17. This includes both new households brought into SHGs as well as households holding membership in pre-existing SHGs brought under NRLM fold. However, if only households mobilized (1.44 million households) into new SHGs are considered, then the mobilization ratio is 36%. From a macro perspective, the pace of mobilization appears to be satisfactory and the target is not only feasible but is likely to be overreached, even if only households mobilized into new SHGs are considered. 4.4 The average number of households (in all NRLM compliant SHGs) mobilized per block stood at 8599 in Dec.’14. As most of the blocks are about 2 years old, the number of households brought into NRLM fold (including member households in the revived/ strengthened SHGs) compares favourably with the expected number of households to be mobilized as per the internal benchmarks suggested by NMMU (Annex-5). 4.5 The inter-state variations in the extent of mobilization reflect the age of the Mission and implementation in each block, the delays in recruitment of staff, the presence of resource blocks, the legacy of SHG-centred projects implemented in the states and the availability of pre-existing social capital. Thus, mobilization per block is higher in states with pre-existing projects woven around SHGs (Bihar, Madhya Pradesh and Tamil Nadu). The large number of households mobilized in Assam and West Bengal reflect the legacy of SHG movements and reporting. Uttar Pradesh, a late entrant to the 32 process of intensive implementation, has mobilized only 2,550 households per block on the average. Table-4.1 Year-wise Mobilization of Households into NRLM Fold Dec.’14 No. of HHs Mobilized During NRLP Average S. State Intensive 2011-12 & Per No. 2013-14 2014-15 Total Blocks* Block 2012-13 1. Assam** 25 -235869 37938 273807 10952 2. Bihar 77 109385 343709 427200 880294 11432 3. Chhattisgarh 16 -50165 31481 81646 5103 4. Gujarat 20 -144108 34771 178879 8944 5. Jharkhand 29 18083 83103 71843 173029 5967 6. Karnataka 20 -46425 52180 98605 4930 7. MP 46 118970 153313 120651 392934 8542 8. Maharashtra 36 37890 79335 135669 252894 7025 9. Odisha 28 -221762 15160 236922 8462 10. Rajasthan 7 -14235 8769 23004 3286 11. Tamil Nadu 16 -27216 87862 115078 7192 12. Uttar Pradesh 22 -21620 34500 56120 2551 13. West Bengal** 32 -434638 18039 452677 14146 14. Total 374 8599 284328 1855498 1076063 3215889 Notes: (1) * includes resource blocks; -- either state not transited or data not reported in the year; (2) ** Assam and West Bengal reported pre-existing households brought under NRLM for the first time in 2013-14; (3) Numbers include member households brought into new SHGs as well as pre-existing SHGs brought into NRLM after strengthening/revival. Source: State Information Reports 4.6 Number of households mobilized into NRLP fold with the support of external CRPs in the resource blocks was on the average 7,811 per block at the end of Dec.’14. The rate of mobilization of households per resource block appears to be in tune with the expected rate of mobilization after two years. On the average, most of the blocks had completed two years of intensive implementation by Dec.’14. Table-4.2 Households Mobilized in Resource Blocks with NRO Support Dec.’14 S. No 1 2 3 4 State Chhattisgarh Jharkhand Madhya Pradesh Maharashtra 4 12 12 16 36862 102473 3072 6405 9216 8539 Expected Mobilizati on after Two Years* 7560 7560 7 8 53911 6739 7702 7560 11340 8 10 69366 6937 8671 7560 11340 No. of RBs No. of CRP No. of HHs Rounds Mobilized Completed Average Per CRP Round Average Per Block Expected Mobilization after Three Years* 11340 11340 33 5 6 Rajasthan 5 4 18600 4650 Total 36 50 281212 5624 Note: * Based on efficiency parameters worked out by NMMU Source: State Information Reports 3720 7811 7560 7560 11340 11340 4.7 The extent of mobilization completed in sample clusters of 10 states (including households mobilized into new SHGs and revived SHGs) as proportion of the potential target households is slightly lower. In all sample clusters, assuming that 2/3rds of the total households constitute the target, 57% stood mobilized by Dec.’14. In the resource block sample, the corresponding ratio was 45%. The relatively lower ratio of mobilization in the sample resource block clusters reflects the process oriented approach adopted for mobilization in them. The other reason could be that most of the resource block clusters are located in remote blocks with a strong presence of the most vulnerable communities. It is expected to take relatively longer time for mobilization in these clusters. In the sample intensive block clusters, other than resource block clusters, the ratio was slightly higher at 61%. Overall, it may be said that the mobilization of households is progressing at a rate faster than the expected rate. The methodologies and processes adopted for social mobilization in the resource and intensive blocks are summarized in Annex-6. Table-4.3 Extent of Social Mobilization in Sample Clusters S. No. Sample Type 1. Sample clusters in all blocks 2. Sample clusters in resource blocks 3. Sample clusters in intensive blocks Source: computed from Annex Table-4.3 Total HHs in the Sample Clusters 479803 176486 303317 Target HHs in the Sample Clusters (2/3rd of the Total HHs) 327891 125017 202874 Dec.’14 Percentage of HHs Mobilized into SHG Fold 57 45 61 Social Inclusion 4.8 An important mandate of NRLM is to adopt inclusive approaches in social mobilization and institution building. The objective of social inclusion requires the state Missions to adopt a strategy that would focus on mobilization of the left out households, particularly, those belonging to the vulnerable communities of the SCs, the STs and the Minorities. An inclusive strategy would also imply prioritization of most backward geographies (states, districts, blocks, villages and households) for project intervention. Social inclusion in the promotion of community institutions would require a strategy that would result in a fair share in leadership positions as well as funds for the members of the vulnerable communities. From this perspective, an attempt is made in this chapter to briefly examine the results of inclusive approaches adopted by the state Missions. Selection of Geographies 4.9 NRLP has been designed to be implemented in 13 high poverty states. The estimates of rural poverty made by the Tendulkar Committee and adopted by the Planning Commission indicate that these 13 states account for 85% of the rural poor 34 (absolute number). Thus, the project design has an implicit inclusion agenda. The Mission states are expected to identify districts, taking into account the intensity of rural poverty, the presence of vulnerable communities of the SCs and the STs and other human development indicators. The 130 districts selected by the Mission states for intensive implementation are low HDI districts, with a substantial presence of the population of the STs and the SCs. Some of these are IAP districts, affected by extremist violence. The blocks selected within the intensive districts are also characterized by significant presence of the STs and the SCs and located in fragile agricultural zones with serious livelihood issues. The selection of blocks, based on objective indicators has been approved by MORD as part of the state AAPs. Within the selected intensive blocks, the Missions have adopted a strategy of prioritizing most backward villages in each cluster such that the remote and interior villages as well as those with a large presence of the STs and the SCs receive precedence. Mobilization of Poverty Groups 4.10 As pointed out in the previous chapter, the total number of households mobilized (including the member households of the pre-existing SHGs brought under NRLM fold) stood at about 3.2 million at the end of Dec.’14. The underlying assumption is that each member mobilized into an SHG represents one household. It is also assumed that almost all these households belong to the poverty groups as the strategy adopted by the Mission is to mobilize the poorest of the poor and the poor households. However, the relative poverty status of these households will be assessed by the village communities through participatory wealth ranking, in a phased manner and after the establishment of the VOs. The methods adopted for identification of target households are summarized in Annex-6, while the methods and processes adopted for promoting social inclusion are summarized in Annex-7. Mobilization of Vulnerable Communities Intensive Blocks 4.11 The mobilization process adopted by the Mission states has resulted in highly inclusive mobilization. Out of about 3.2 million poor member households mobilized into NRLM fold from 374 intensive blocks up to Dec.’14, 29% belong to the STs, 21% to the SCs and 9% to the minority groups, reflecting the inclusive character of mobilization process adopted (Table-4.4). The inter-state variations in the extent of inclusion of vulnerable communities also reflect the demography of the intensive blocks in which implementation is in progress. Thus, the states of Jharkhand, Chhattisgarh, Gujarat, Madhya Pradesh and Odisha have mobilized a large percentage of the STs, while Bihar, Rajasthan, Karnataka, Uttar Pradesh and West Bengal account for a significant percentage of the SC household members. As could be expected on a priori grounds, Assam, Bihar, UP and West Bengal have mobilized significant proportion of members from minority groups. The methods and processes adopted in the mobilization of poverty groups into SHGs are summarized in Annex-8. 35 Table-4.4 Social Composition of Members Mobilized in Intensive Blocks S. Total SHG State No. Members* 1. Assam 273807 2. Bihar 880294 3. Chhattisgarh 81646 4. Gujarat 178879 5. Jharkhand 173029 6. Karnataka 98605 7. Madhya Pradesh 392934 8. Maharashtra 252894 9. Odisha 236922 10. Rajasthan 23004 11. Tamil Nadu 115078 12. Uttar Pradesh 56120 13. West Bengal 452677 14. Total 3215889 Note: * Intensive Blocks includes Resource Blocks Source: Computed from Annex Table-4.4 Percentage of Members Belonging to ST SC ST Others 28 12 19 41 2 30 13 55 48 13 1 39 63 9 4 24 65 9 5 21 14 26 6 54 76 8 1 15 26 17 3 53 56 14 7 23 19 30 1 50 12 19 6 63 1 27 9 63 10 39 15 36 29 21 9 40 Resource Blocks 4.12 The inclusive mobilization is also evident from the social composition of members mobilized into SHGs from the resource blocks as well. The NRO-driven external CRP strategy has been very inclusive. Special efforts have been made by the external CRPs to identify and mobilize only poor and vulnerable households into the SHGs. The external CRPs have been specially trained in the identification of the poor households. The social composition of the SHGs promoted in the resource blocks indicates that the STs constitute 46% followed by the SCs and the Minorities at 16% and 5%, respectively. Table-4.5 Social Composition of Members Mobilized in Resource Blocks S. No. 1. 2. 3. 4. 5. 6. 7. 8. 9. 10. Dec.’14 State Total Sample SHG Members Percentage of Members from STs SCs Minorities Others Chhattisgarh Gujarat Jharkhand Karnataka Madhya Pradesh Maharashtra Rajasthan Uttar Pradesh West Bengal Total 36862 27084 73814 30456 91553 69375 19425 31663 32435 412667 59 44 68 18 76 44 11 1 1 46 8 15 9 30 12 14 32 30 24 16 1 15 7 5 2 3 2 10 6 5 33 27 17 47 10 39 55 59 69 33 36 Source: Computed from Annex Table-4.5 37 Social Composition of Sample SHG Members 4.13 The sample study conducted in 10 states covering 5,854 members also amply reflects the inclusive character of mobilization. The social composition of the sample members indicates that 45% belong to the STs, 14% to the SCs and 5% to the minority communities (Table-4.6). The inter-state variations reflect the demographic composition of the sample villages. Table-4.6 Social Composition of SHG Members: Sample Dec.’14 S. Percentage of Members belonging to Total Sample State No. SHG Members ST SC Minority Others 1. Assam 191 29 16 16 39 2. Chhattisgarh 542 56 13 0 31 3. Gujarat 256 35 13 3 49 4. Jharkhand 1219 79 2 4 15 5. Madhya Pradesh 861 73 7 2 18 6. Rajasthan 377 3 60 0 37 7. Maharashtra 1062 31 15 5 50 8. Bihar 714 0 18 20 62 9. Odisha 265 63 25 0 11 10. Tamil Nadu 309 16 8 0 75 11. Total 5796 45 14 5 36 Note: Sample includes resource, intensive and partnership blocks sub-sample. Source: Computed from Sample data furnished in Annex Table-4.6. Resource and Partnership Blocks 4.14 The inclusiveness is also evident from the sub-sample of SHG members from the resource blocks. Out of a total of 3,076 sample SHG members, 55% belong to the STs, 15% to the SCs and 5% to the minority communities, clearly reflecting the focus of the project on inclusive mobilization. The sample data reinforces the analysis based on the state MIS. The social composition of the sample members from the partnership blocks also indicates a preponderance of the ST and the SC members. Table-4.7 Social Composition of Members in Resource Blocks: Sample Dec.’14 S. No. 1. 2. 3. 4. 5. 6. State Chhattisgarh Jharkhand Madhya Pradesh Rajasthan Maharashtra Total Total Sample SHG Members 414 899 605 377 781 3076 Percentage of Members belonging to ST SC Minority Others 69 78 69 3 36 55 8 2 10 60 16 15 0 6 3 0 6 5 23 14 19 37 42 26 38 Source: Computed from Annex Table-4.7 Table-4.8 Social Composition of Sample Members in Partnership Blocks Dec.’14 S. No. State 1. Jharkhand 2. Maharashtra 3. Total Source: Sample data Percentage of Members belonging to Total Sample SHG Members ST 83 14 51 320 281 601 SC 1 12 6 Minority 0.0 1 1 Others 16 73 43 Social Composition of SHG Leaders: Sample 4.15 NRLP has also been promoting inclusion at the SHG leadership level as well to avoid elite capture of these institutions and to train members of the vulnerable communities in management of community institutions. The data from the total sample of SHGs clearly indicates that 42% of the leaders are from the STs, 16% from the SCs and 6% from the minorities (Table-4.9). It is interesting to note that even physically challenged persons found a place in leadership roles. Table-4.9 Social Composition of SHG Leaders: Total Sample Dec.’14 S. No. State Total ST Percentage of Leaders from SC Minority PWD 1. Assam 43 28 23 2. Bihar 180 0 18 3. Chhattisgarh 96 54 16 4. Gujarat 48 35 15 5. Jharkhand 287 78 3 6. Madhya Pradesh 165 72 7 7. Maharashtra 199 29 18 8. Odisha 48 60 25 9. Rajasthan 125 5 50 10. Tamil Nadu 52 17 13 11. Total 1243 42 16 Source: Computed from sample data furnished in Annex Table-4.9 19 20 0 2 6 2 2 0 1 4 6 0 0 0 0 1 0 1 0 0 0 0 Others 30 62 30 48 12 19 51 15 45 65 35 4.16 The sample data from the resource blocks suggests greater degree of inclusion with 52% of the leaders drawn from the STs, 18% from the SCs and 4% from the minorities. It is interesting to note that even physically challenged persons are encouraged to hold leadership positions (Table-4.10). The social background of the leaders of SHGs drawn from partnership blocks also indicates positive bias in favour of vulnerable groups (Table-4.11). 39 Table-4.10 Social Composition of SHG Leaders: Resource Block Sample Dec.’14 Percent of Leaders from S. State Total No. ST SC Minorities PWD Others 1. Chhattisgarh 74 66 9 0 0 24 2. Jharkhand 215 75 3 8 1 13 3. Madhya Pradesh 116 66 10 3 0 22 4. Maharashtra 144 35 19 3 1 42 5. Rajasthan 108 6 57 1 0 36 6. Total 657 52 18 4 1 26 Source: Computed from sample data furnished in Annex Table-4.10 Table-4.11 Social Composition of Sample SHG Leaders: Partnership Blocks (%) S. No. State 1. Jharkhand 2. Maharashtra 3. Total Source: Sample data Total 72 55 127 ST Leaders from SC 89 13 56 1 15 7 Others 10 73 37 Summary 4.17 NRLP is currently being implemented in 374 blocks spread over 130 districts of 13 high poverty states. Of the total, 55 are resource blocks, in which intensive implementation is supported by NROs. The geographical spread of the project exceeds the revised project target of 300 blocks. The mobilization of total households at the end of Dec.’14, stood at 3.2 million which constitutes 85% of the project target set for Dec.’17. This includes both households mobilized into new SHGs (52%) and the households in the revived and strengthened SHGs. The average number of households mobilized per block works out to about 8599, which compares well with the expected number of households to be mobilized as per the efficiency benchmarks. The average mobilization per resource block works out to 7,560 households. Assuming the twothirds of the total households in a block constitute the target, the project had mobilized 57% by Dec.’14. However, there are inter-state variations in the magnitude of mobilization reflecting the history of SHG movements in the states, legacy of implementing CBO-centred EAPs, the stock of pre-existing cognitive social capital and the date of transition of the states to the Mission. 4.18 An important mandate of NRLM is to promote inclusive approaches in social mobilization. The early results amply demonstrates the inclusiveness of the project. First of all, the project is being implemented in the states in which account for 85% of the rural poor in the country. Within the 13 states, 130 districts selected for project implementation are relatively backward with a strong presence of the vulnerable communities of the SCs and the STs, besides being low HDI districts, with some of them 40 being exposure to extremist violence. The 374 blocks under implementation are also characterized by significant presence of the SCs and the STs besides being located in the fragile agricultural zones with serious livelihood issues. Within the selected blocks, the Mission units are focusing on mobilizing the most vulnerable communities particularly in the remote and interior areas. More significantly, out of the 3.2 million households mobilized into NRLP fold, 29% belong to the STs, 21% to the SCs and 9% to the minority groups, reflecting the inclusive character of the entire mobilization process. The mobilization in the resource blocks is even more inclusive with the vulnerable communities accounting for 67% of the total households. The social composition of SHG members also reveals that about 65% of them belong to the ST (45%), the SC (14%) and minority (6%). This is equally true of the composition of members from the resource and partnership blocks. The project has firmly instituted inclusive approaches even in leadership positions. Of the total SHG-OBs, those from the STs and the SCs constituted 42% and 16%, respectively. There was representation to the minorities as well as physically challenged persons. The project states have adopted a calibrated inclusive strategy to achieve the results. Thus, the mobilization process and outcomes have been extremely inclusive. 41 Chapter–5 Promotion and Functioning of SHGs Introduction 5.1 The central objective of NRLM is to reduce rural poverty in all its forms and enable the rural poor, particularly, the poorest of the poor to improve their livelihoods and quality of life in a sustained manner. The Mission seeks to achieve this objective by building and sustaining self-managed and self-governed institutions of the poor, which would in turn promote their livelihoods and mitigate the downside risks faced by them. Institution building is the bedrock on which the entire NRLP strategy is posited. SHGs constitute the basic foundation of this institution building model. The implicit assumption of the project is that unless all the target households are mobilized into functionally effective SHGs, the higher objectives cannot be achieved. An attempt is made in this chapter to examine the promotion of SHGs as well as revival and strengthening of pre-existing SHGs in different states since the launch of the project and their adherence to the canons of democratic functioning. Promotion of New SHGs 5.2 The promotion of new SHGs gathered momentum only from 2013-14 due to delays in the transition of the states to NRLM and the recruitment of staff. Thus up to March 2013, only 16,672 new SHGs were promoted in states that had transited early. During FY 2013-14, the number of new SHGs promoted peaked to 66,802 in the project states. During 2014-15, the number of new SHGs promoted exceeded 61,330 (up to Dec.’14). Thus, a total of 1,44,804 new SHGs were promoted up to Dec.’14 in the 13 project states. Revival and Strengthening of Pre-Existing SHGs 5.3 Along with promotion of new SHGs, the project states have undertaken equally significant steps to revive and strengthen 1,31,344 pre-existing SHGs fulfilling NRLM criteria. The revival of pre-existing SHGs also followed a similar time pattern of growth. During FY 2011-12, only 8,378 pre-NRLM SHGs were brought under NRLM fold. This number rose to 96,314 during FY 2012-13. During FY 2014-15, the number of revived and strengthened SHGs was 26,652 (up to Dec.’14). States which had transited early and those which have been implementing externally aided projects account for a larger number of new SHGs, besides bringing into NRLM fold a good number of pre-existing SHGs after revival and strengthening (Table-5.1). SHGs Per Block 5.4 On the average, 387 new SHGs were promoted per block up to Dec.’14. In addition, 351 pre-existing SHGs per block were revived, strengthened and brought under NRLM fold. Both the new and revived SHGs together account for 738 SHGs per block. As most of the project blocks are about 2 years old on the average, the number of SHGs promoted compares well with the normatively estimated number of 720 SHGs per block at the end of second year. Thus, the efforts made to promote new SHGs and revive pre-existing SHGs are yielding expected results, notwithstanding the fact that there is need for deepening and expanding mobilization in the intensive blocks. It may also be noted that the high block averages for Assam, West Bengal, Bihar and Gujarat appear to be due to the large scale promotion of SHGs undertaken under the state/EAP projects. 42 Table-5.1 SHGs Promoted and Revived Per Block: Intensive Blocks Dec.’14 Average New SHGs Promoted Average Existing SHG Revived/ Average SHGs Per Block in NRLM Sl. Per Block Strengthened Per Block Fold State Blocks No. Y1 Y2 Y3 Total Y1 Y2 Y3 Total Y1 Y2 Y3 Total 1 25 0 449 97 546 0 484 55 539 0 933 152 1085 Assam 2 77 118 350 286 755 0 6 164 169 118 356 450 924 Bihar 3 16 0 216 149 365 0 97 48 145 0 313 196 510 Chhattisgarh 4 20 0 175 130 304 0 488 39 527 0 662 169 831 Gujarat 5 29 22 115 172 308 29 110 37 176 50 224 210 484 Jharkhand 6 20 0 0 47 47 0 167 45 212 0 167 92 259 Karnataka 7 46 123 249 222 594 116 48 17 181 239 297 239 775 Madhya Pradesh 8 36 36 88 233 356 62 96 99 258 98 184 332 614 Maharashtra 9 28 0 14 19 33 0 658 34 692 0 672 53 725 Odisha 10 7 0 120 86 206 0 47 0 47 0 167 86 253 Rajasthan 11 16 0 0 167 167 0 126 207 333 0 126 374 500 Tamil Nadu 12 22 0 34 98 132 0 49 11 60 0 83 109 192 Uttar Pradesh 13 32 0 55 43 98 0 1200 10 1210 0 1255 53 1308 West Bengal 14 374 45 179 164 387 22 258 71 351 67 436 235 738 Total Notes: (1) Y1 is up to March 2013; Y2 refers to 2013-14; and Y3 covers Apr-Dec.’14; (2) Intensive blocks includes resource blocks. Source: State Information Reports; Computed from Annex Table-5.1. 43 Promotion of SHGs in Resource Blocks 5.5 The promotion of new SHGs as well as revived SHGs in resource blocks presents a slightly different picture. The average number of SHGs promoted per block is significantly higher than the number of pre-existing SHGs revived and strengthened in all the resource blocks. This is a reflection of the intensive work in progress in resource blocks with focus on mobilization of left out households. The average number of new SHGs promoted per resource block works out to 660, while the corresponding number for pre-existing SHG is 252 per block. On the whole, the 4 senior resource block states had on the average promoted 845 SHGs per block. The inter-state variations in the promotion of SHGs is a reflection of the age of the resource blocks and the number of external CRP rounds completed. Thus, the analysis suggests that with the deepening of implementation in intensive blocks, the proportion of new SHGs would gradually increase. Table-5.2 Average SHGs per Block in Resource Blocks Dec.’14 Sl. No. State No. of No. of Resource CRP Blocks Rounds Average Per CRP Round New Existing Total SHGs SHGs 1. 2. Average No. of SHGs per Block in NRLM Fold New SHGs 845 410 Existing SHGs 146 138 Total Chhattisgarh 4 12 282 49 331 992 Jharkhand 12 9 546 184 730 547 Madhya 3. 7 8 451 129 580 515 148 662 Pradesh 4. Maharashtra 8 10 463 174 637 579 218 797 5. Total 31 39 524 201 725 660 252 912 Note: In the states of Gujarat, Karnataka, Rajasthan, UP and West Bengal implementation of RB strategy started only in FY 2014-15. Source: State Information Report; Computed from Annex Table-5.2 Promotion of SHGs in Sample Villages 5.6 An examination of the composition of sample SHGs drawn from 10 states indicates that 57% of the total sample SHGs (502) are new SHGs, while the rest are preexisting SHGs in both intensive and resource blocks (including partnership blocks). In resource block alone, the ratio of new to pre-existing SHGs revived is 70: 30 and in intensive blocks, it is 41:59. 44 Table-5.3 Composition of Sample SHGs Dec.’14 S. No. 1. 2. 3. 4. 5. 6. 7. 8. 9. 10. State Assam Bihar Chhattisgarh Gujarat Jharkhand Madhya Pradesh Maharashtra Odisha Rajasthan Tamil Nadu SHGs in SHGs in Total Sample Intensive Block Resource Block New Pre NRLM Total New Pre NRLM Total New Pre NRLM Total 12 7 19 0 12 7 19 60 0 60 0 60 0 60 1 10 11 29 7 36 30 17 47 0 24 24 0 0 24 24 2 22 24 33 39 72 35 61 96 12 12 24 44 7 17 24 52 2 22 24 0 0 0 33 1 23 24 97 137 234 192 11. Total (41) (59) (100) (71) Note: Figures in parentheses are percentages Source: Sample data 10 20 5 81 (29) 54 56 72 59 0 2 38 33 0 1 272 289 (100) (57) 22 78 37 22 5 23 218 (43) 96 24 38 24 506 (100) Age Analysis of Sample SHGs 5.7 The age analysis of the sample SHGs indicates that 9% are about one year old, 31% are in the age bracket 12 to 18 months and 26% in the age group 18-24 months. The remaining 33% of the SHGs are above two years of age and most of them were from the revived and strengthened category. Thus, the sample SHGs represent the age distribution of the SHGs in the universe. Table-5.4 Age Analysis of Sample SHGs: All Block Sample S. No. 1. 2. 3. 4. 5. 6. 7. 8. 9. 10. 11. State Assam Bihar Chhattisgarh Gujarat Jharkhand Madhya Pradesh Maharashtra Odisha Rajasthan Tamil Nadu Total <52 3 0 6 0 8 4 7 6 7 0 41 (8) 52-76 0 27 13 9 31 25 32 5 12 4 158 (31) Age in Weeks 76-100 100-124 14 1 10 3 8 11 6 0 34 17 25 22 19 28 1 2 15 2 0 1 132 87 (26) (17) 124-148 0 5 9 3 1 0 9 0 0 0 27 (5) >148 1 15 0 6 5 2 1 9 0 18 57 (11) Total 19 60 47 24 96 78 96 23 36 23 502 (100) Source: Sample data 45 Functioning of SHGs Adherence to Panchsutra 5.8 All NRLM compliant SHGs are required to adhere to Panchsutras or five canons of democratic functioning. These are (i) regular conduct of weekly meetings; (ii) member attendance at meetings; (iii) regular subscription of savings by members; (iv) interlending of SHG funds; and (v) up to date bookkeeping. The frontline Mission staff and the social capital engaged are expected to guide the institutions to adhering to Panchsutras. The Mission units are also expected to take into account the adherence of the SHGs to Panchsutras for providing project funds in the form of RF and CIF. As part of the sample study, an attempt was made to examine the adherence of the SHGs to Panchsutras. The findings from the analysis are briefly summarized below: as per the books of sample SHGs, 93% of the stipulated meetings were conducted. Except in Assam and Gujarat, the percentage of stipulated meetings held exceeded 90%; on an average, 85% of the members attended the meetings of the SHGs. In respect of Assam, Bihar and Gujarat, however, the attendance was relatively low; 95% of the sample SHGs had subscribed the expected amount of savings during six months preceding the sample survey. Only sample SHGs of Assam had contributed 75% of the expected savings; 85% of the sample SHG members had borrowed from the internal funds of the SHGs. Internal lending covered a relatively smaller proportion of members in Rajasthan, Gujarat and Assam; and more than 75% of the sample SHGs had minutes book and 77% had savings registers prescribed by the Mission units along with other books and a very high proportion of them were being updated. Table-5.5 Adherence of SHGs to Panchsutras: Total Sample S. No. 1. 2. 3. 4. 5. 6. 7. 8. 9. 10. 11. State Assam Bihar Chhattisgarh Gujarat Jharkhand Madhya Pradesh Maharashtra Odisha Rajasthan Tamil Nadu Total No. of Sample SHG 19 60 47 24 96 78 96 23 36 23 502 Percentage Adherence to the Norm During Last 6 Months Member Coverage Meetings Attendance Savings of Internal Loans 81 79 75 71 92 79 89 90 99 91 97 89 66 67 97 38 96 85 97 96 90 83 94 88 97 90 98 92 96 96 93 85 92 92 97 49 92 --89 93 85 95 85 46 Notes: (i) -- indicates data is being verified; (ii) Computed from data furnished in Annex Tables 5.24, 5.25, 5.26 and 6.4 Source: Sample data 5.9 In the case of resource block sample, the adherence of SHGs to Panchsutras is higher in respect of all states except Rajasthan (coverage of internal loans). This is clearly due to the intensive nurturing support, capacity building and follow-up support provided to SHGs in the resource blocks. Table-5.6 Adherence of Sample SHGs to Panchsutras: Resource Block Sample Percentage Adherence to the Norm During Last 6 Months No. of Sample Member Coverage Meetings Attendance Savings SHG of Internal Loans 36 1. Chhattisgarh 99 89 95 100 72 2. Jharkhand 99 85 98 92 54 3. Madhya Pradesh 97 88 96 93 72 4. Maharashtra 97 90 98 97 36 5. Rajasthan 92 92 97 49 270 6. Total 97 88 97 89 Note: Computed from data furnished in Annex Tables-5.27 & 5.28 Source: Sample data S. No. State Training and Capacity Building of SHGs 5.10 The functional effectiveness and sustainability of SHGs depend inter alia on the knowledge and capacities of the SHG members in general and the leaders in particular. Recognizing the importance of capacity building of members, OBs and different types of social capital, the Mission states have adopted several innovative strategies. Basic SHG Training 5.11 In all resource blocks, a three-day basic training is provided by external CRPs to all SHGs promoted and revived on formation of SHGs, meeting processes and norms and maintenance of books of accounts. The external CRPs use the prescribed training module for this purpose. The training provided by CRPs is followed-up by the PRPs, cluster staff and active women. The same approach has been adopted in Chhattisgarh, Madhya Pradesh, Jharkhand and Maharashtra. A similar strategy is being adopted in the recently taken up resource blocks in Assam, West Bengal and Karnataka. The post-CRP round training provided by PRPs and internal staff in different states, however, needs to be standardized as different states have adopted different methodologies. As and when the VOs are formed and internal trainers prepared, the responsibility of follow-up training is expected to be taken over by the VOs. 5.12 In the state of Odisha, internal CRPs drawn from the ongoing TRIPTI project provide a three-day training to the newly formed SHGs. In Bihar, both internal CRPs and community mobilizers provide the training in basic SHG concepts to new SHGs, which is also followed up by dedicated CRPs and community mobilizers. In Tamil Nadu, specially trained teams along the lines of Pudhuvazhvu project provide training to new SHGs 47 using pre-designed modules. The training methodologies and processes adopted by the states are briefly summarized in Annex-9. Training in Bookkeeping 5.13 The second important type of training provided to SHGs in some states is the training in bookkeeping. In resource block states, MBKs are identified and trained before they undertake SHG bookkeepers and SHGs. However, there is a critical shortage of MBKs in all the states, affecting training in bookkeeping. MCP/MIP Training 5.14 The third important type of training provided/expected to be provided to all SHGs when the SHGs are around 6-month old is the training in the preparation of MIP/MCP, which is a pre-condition for sanction of CIF. The picture emerging from the resource blocks is that most of the SHGs promoted and revived/strengthened have been provided the three day participatory training at the community level in the resource blocks. However, there is a lag between the number of eligible SHGs to be trained in MCP/MIP and the number actually trained due to the shortage of MCP trainers. A similar approach is adopted in Assam, where active women train the SHGs in MCP using a six-day module. Odisha also employs trained internal CRPs to train SHG members in MCP preparation, internal lending and bank linkage. Modules 5.15 The state Missions have developed/customized and adopted the following modules. Table-5.7 Core Modules of SHG Member Training SHG Modules (3 days) Understanding poverty Gender and Poverty Panchsutra SHG Management Leadership Training Conflict Resolution Management of bank a/c Bookkeeping Modules (5 days) Introduction to SHG books of accounts Bookkeeping practices Importance of bookkeeping in SHGs MCP Modules (3 days) Purpose of MCP Individual member (household planning) Consolidation of household level plans at SHG and due review of household level plans Creating a SHG level plan Calculating the total investment required, estimating member contribution and expectation from Mission/ Bank. SHGs Provided Training 48 5.16 Sample data indicates that a significant proportion of SHGs remained to be trained in the basic concept of SHG, except in resource blocks. In resource blocks, 60% of the SHGs were provided training in basic concepts as part of the CRP rounds, followed by staff and PRPs (55%) and internal community cadre (24%). The proportion of SHGs provided this initial training is significantly lower in intensive and partnership blocks. Similar trends could be discerned in respect of training provided on SHG meeting processes and norms. The training on bookkeeping also exhibits similar trends, except in resource blocks. The percentage of sample SHGs trained on MCP is very less, considering the fact that all sample SHGs are one year old and need to be provided MCP training. Table-5.8 Training Provided to SHGs: Sample Percentage Percentage of SHGs Trained by No. of Sample External Community Cadres Staff/PRPs SHGs CRPs I. SHG Formation Training a) All Blocks 502 60 24 55 b) Resource Blocks 270 87 15 28 c) Intensive Blocks 184 27 4 22 d) Partnership 48 29 5 5 Blocks II. Training on SHG meeting processes & norms a) All Blocks 502 60 31 59 b) Resource Blocks 270 87 19 32 c) Intensive Blocks 184 27 6 22 d) Partnership 48 29 6 4 Blocks III. Maintenance of Books of Accounts a) All Blocks 502 49 32 66 b) Resource Blocks 270 74 18 43 c) Intensive Blocks 184 20 8 19 d) Partnership 48 17 6 4 Blocks IV. MCP Training a) All Blocks 502 13 25 48 b) Resource Blocks 270 17 16 26 c) Intensive Blocks 184 7 3 18 d) Partnership 48 13 5 4 Blocks V. Others a) All Blocks 502 13 25 48 b) Resource Blocks 270 10 3 10 c) Intensive Blocks 184 2 0 12 d) Partnership 48 2 2 1 Blocks Source: Computed from sample data presented in Annex Table-5.9 S. No. State 5.17 A good feature, however, is that about 80% of the sample SHG members had attended a three day basic training on SHGs either as part of external CRP rounds or as part of training organized by internal staff PRPs and active women. However, it is to be 49 noted that this constitutes only basic training on SHG processes and dynamics. This again emphasizes the need for strengthening training input in intensive and partnership blocks. Table-5.9 Members Attending Three-Day Basic Training: Sample S. Type No. 1. All Blocks 2. Resource Blocks 3. Intensive Blocks 4. Partnership Blocks Source: Sample data Total Members 5802 3082 2119 601 Members Trained for Three Days 4635 2743 1537 355 Percent of Members Trained for Three Days 80 89 73 59 5.18 Training is both formal and informal. Training inputs are also provided as part of the facilitation support provided to SHGs, although it is not a substitute for rigorous module- based training. In terms of facilitation, however, more than 90% of the sample SHGs reported to have received support in recent times. Table-5.10 Facilitation Support Provided to SHGs: Sample S. No. Type 1. All Blocks 2. Resource Blocks 3. Intensive Blocks 4. Partnership Blocks Source: Sample data Total no. of Sample SHGs SHGs being Facilitated 502 270 184 48 461 242 173 46 Percent of Meetings Facilitated 92 90 94 96 5.19 It is also interesting to note from the sample SHGs that the facilitation support comes primarily from the internally identified active women, while the role of the frontline staff is very limited. Table-5.11 Source of Facilitation Support: Sample S. Type No. 1. All Blocks 2. Resource Blocks 3. Intensive Blocks 4. Partnership Blocks Source: Sample data Total No. of Sample SHGs 502 270 184 48 SHGs Facilitated by Active Women 67 67 59 92 SHG Facilitated by NRLM Staff 32 17 15 1 Social Activities 50 5.20 A significant proportion of SHGs across the states have worked for prevention of certain common social activities such as domestic violence, child labour, illicit distillation and child marriages. An equally substantial number of SHGs have also participated in national and state programmes such as Swatch Bharat campaign, Aam Aadmi Bima Yojana, Hamari Gaon Hamari Yojana, Sanjay Gandhi Niradhay Yojana, Nasha Mukhti Abhiyan, Garib Kalyan Mela and Jan Dhan Yojana. Some sample SHGs indicated that they were able to take up issues of individual members relating to job cards, PDS cards, Aadhar cards, Janshree Bima Yojana, AABY, pensions, IAY and such other entitlement related issues with the support of PRIs and line departments. The number of SHGs indicating their active participation in different types of activities are summarized in Table-5.12. Table-5.12 Number of SHGs Taking up Different Issues: All Block Sample S. No. of SHGs State No. Analysed 1. Assam 24 2. Bihar 60 3. Chhattisgarh 49 4. Gujarat 12 5. Odisha 24 6. Rajasthan 38 7. Jharkhand 96 8. Madhya Pradesh 78 9. Maharashtra 96 10. Total 477 Note: -- data not available. Source: Sample data. Social Issues Entitlements Benefits 2 56 21 5 9 4 77 51 72 297 2 53 10 12 8 1 43 33 48 210 11 47 14 2 8 -57 17 21 177 Summary 5.21 SHGs are the building blocks on which the entire edifice of community institutions is designed to be built. Due to the initial delays in the transition of states to NRLM and in the establishment of institutional structures, the promotion of SHGs gathered momentum only during FY 2013-14. By Dec.’14, a total of about 1.56 lakh new SHGs were promoted besides reviving 1.42 lakh pre-project SHGs. States which transited early and those that had a history of strong SHG movements were ahead of others in the process of SHG promotion. On the average, about 800 SHGs were promoted per project block, while the expected number of SHGs at the end of the second year is 720 SHGs. The resource blocks supported by external CRP teams of NROs promoted a larger number of SHGs (826 new SHGs and 179 strengthened SHGs per block). With the deepening of resource block strategy, the numbers are expected to rise sharply. The study conducted in sample clusters also indicates that 57% of the total SHGs promoted are new, while this ratio is 71% in the resource block sub-sample. The age analysis of the sample reveals that 9% are about 1 year old, 31% 12 to 18 months, 26% 18 to 24 months and 33% above two years of age. 51 5.22 The sample study indicates that 75 to 90% of the SHGs were adhering to the five canons of good governance known as Panchsutras. However, there were minor interstate variations in adherence to the Panchsutras. The high rate of adherence to Panchsutras reflects the intensive nurturing support, training and capacity building support provided to SHGs, particularly, in the resource blocks. The project has been organizing basic SHG training (3 days) as well as training in bookkeeping (5 days) and MCP (3 days) using core modules. In the resource blocks, 60% of the SHGs were provided basic training as part of CRP rounds, which was followed-up by trainings by PRPs and internal cadre. However, the training of SHGs, both new and revived, needs to be increased in the other intensive blocks. Recognizing the importance of training, the state Missions are identifying and training community cadres who would in turn provide training to the SHGs in a cascading mode. The state Missions are also entering into partnerships with reputed training institutions to supplement their efforts. 52 Chapter-6 Finances of SHGs Introduction 6.1 Micro-finance constitutes the foundation of the SHGs. The long-term self-reliance and sustainability of the SHGs critically depend on the quality of their micro-finance practices. All SHGs are expected to save and inter-lend the funds to meet essential requirements of members. In order to strengthen the fund base of the SHGs, the Mission provides revolving fund (RF) and community investment fund (CIF) to SHGs fulfilling certain criteria. Further, after attaining certain experience in managing funds, the Mission expects them to leverage bank loans. Further, all funds of the SHGs are expected to be used for meeting the livelihood requirements of the member households. An attempt is made in this chapter to examine these aspects, using both sample and MIS data. SHG Bank Accounts 6.2 An essential pre-requisite for promoting financial inclusion of the poor is to link all the SHGs to the banks. As a first step, all SHGs are required to have a savings bank account opened with the banks. SHG-bank account is essential to make transfer of Mission funds in the form of RF and CIF to the SHGs. Saving bank accounts are also essential for leveraging loans from the banks. Therefore, all state Missions are required to ensure opening of bank accounts for all SHGs within 3 months of formation of the SHGs. However, due to several state specific bank level problems, bank accounts are not opened for all SHGs within 3 months. Apart from relatively low density of banking infrastructure in certain states such as Jharkhand, Bihar and MP, there are bank branch related problems such as lack of adequate bank staff and high time costs involved in banking with SHGs. The Mission states are required to facilitate opening of SHG bank accounts by undertaking several steps such as sensitization of bankers, use of retired bank staff and appointment of bank mitras to minimize the time cost of the bank staff. Despite certain steps being taken by the project states, the percentage of SHGs having bank accounts in Bihar continues to be very low at 64%, followed by Jharkhand, UP (76%) and Madhya Pradesh (77%) (Table-6.1). This is an area which requires the priority attention of the Mission states. Savings of SHGs 6.3 All SHGs in the intensive blocks have been undertaking weekly/monthly savings at variable rates ranging from Rs.5/- to Rs.100/- per member per week/month. The MIS data on SHG savings is presented in Table-6.2. 6.4 The data on savings of sample SHGs, both new and revived/strengthened indicates that average cumulative savings per SHG stood at Rs.14,353/- at the end of Dec.’14. In respect of revived and strengthened SHGs, the amount stood at Rs.30,311/per SHG and Rs.2,502/- per member. The savings per capita for both new and revived/strengthened SHGs stood at 1716/- per member (Table-6.3). The age-wise savings of sample SHGs is presented in Annex Table-6.1 indicates that there has been 53 regularity in the subscription of savings, notwithstanding the variability in the rates adopted. Table-6.1 SHGs with Saving Bank Accounts: All Intensive Blocks S. State Total No. of SHGs No. 1. Assam 27137 2. Bihar 71141 3. Chhattisgarh 8154 4. Gujarat 16625 5. Jharkhand 14035 6. Karnataka 5179 7. Madhya Pradesh 35627 8. Maharashtra 22094 9. Odisha 20306 10. Rajasthan 1771 11. Tamil Nadu 7993 12. Uttar Pradesh 4221 13. West Bengal 41865 14. Total 276148 Source: State Information Reports No. of SHGs with Saving Bank A/c 25447 46116 7245 14677 10735 4849 27429 19000 20171 1562 7993 3215 41065 229504 Dec.’14 Percent of SHGs with Bank A/c 94 65 89 88 76 94 77 86 99 88 100 76 98 83 Table-6.2 Per SHG and per Member Cumulative Savings: Sample of New SHGs Dec.’14 Average Average Average S. Sample SHGs Member Size Cumulative Cumulative State No. (No.) of SHGs Savings per Savings per (No.) SHG in Rs. Member in Rs. 1. Assam 8 10 7100 710 2. Bihar 57 12 13343 1111 3. Chhattisgarh 24 12 17977 1560 4. Jharkhand 21 12 11069 948 5. Madhya Pradesh 50 11 15341 1407 6. Maharashtra 46 11 19080 1635 7. Odisha 2 12 12640 1057 8. Rajasthan 26 10 7982 792 9. Total 234 11 14353 1259 Note: Sample includes only SHGs newly promoted by the Mission units after excluding SHGs in respect of which receipts and payments did not tally. Source: Sample SHG data 54 Table-6.3 Per SHG and per Member Cumulative Savings: Sample of New and Preexisting SHGs 6841 Dec.’14 Average Savings per Member in Rs. 680 12 13343 1111 41 11 21064 1835 Gujarat 9 10 18069 1651 5. Jharkhand 49 12 19946 1568 6. Madhya Pradesh 69 11 17180 1569 7. Maharashtra 78 11 23274 2101 8. Odisha 21 11 29293 2591 9. Rajasthan 30 10 9508 927 1. Assam Sample SHGs (No.) 12 2. Bihar 57 3. Chhattisgarh 4. S. No. State Average Member Size of SHGs (No.) 10 Average Savings per SHG in Rs. 10. Total 370 11 20116 1716 Note: Sample includes both SHGs newly promoted and Pre-Existing SHGs taken into NRLM fold, after excluding SHGs in respect of which receipts and payments did not tally. Source: Sample SHG data Revolving Fund for SHGs All Intensive Blocks 6.5 The project provides for distribution of revolving fund to all 3-month old SHGs which have not received the fund earlier and after necessary grading. The RF is meant to augment the internal resources of the SHGs from which members can meet their initial loan requirements and enable the SHG to institute transparent financial management practices. Each SHG is provided Rs.10,000/- to 15,000/- as one-time grant to the SHGs. As of Dec.’14, only 63% of eligible SHGs were provided RF. This constitutes only 43% of total SHGs. The process study conducted in different project states indicate that delays in opening of bank accounts, identification of SHGs for RF on the basis of eligibility criteria and administrative delays partly caused by multiple layers of financial control are driving the wedge between the number of eligible SHGs and those provided RF. Frequent changes in the top level of management, including high turnover of CEOs in some states has affected the timely release of RF. The methods adopted for disbursing RF is summarized in Annex-10. 55 Table-6.4 Eligible SHGs Provided RF in Intensive Blocks: MIS Dec.’14 S. No State 1. Assam 2. Bihar 3. Chhattisgarh 4. Gujarat 5. Jharkhand 6. Karnataka 7. Madhya Pradesh 8. Maharashtra 9. Odisha 10. Rajasthan 11. Tamil Nadu 12. Uttar Pradesh 13. West Bengal 14. Total Source: MIS data Total No. of SHGs No. of SHGs eligible for RF No. of SHGs Provided RF 27137 71141 8154 16625 14035 5179 35627 22094 20306 1771 7993 4221 41865 276148 19748 45775 7191 9159 9014 4849 27011 15837 6573 1558 4255 3126 36651 190747 13481 21257 5512 6141 8799 4320 18618 9426 4411 1067 3519 1360 21470 119381 Percent of Eligible SHGs Provided RF 68 46 77 67 98 89 69 60 67 68 83 44 59 63 Percent of All SHGs Provided RF 50 30 68 37 63 83 52 43 22 60 44 32 51 43 RF to Sample SHGs 6.6 Mission states are required to institute appropriate mechanism for undertaking grading of SHGs based on their adherence to Panchsutras. The first time grading results of sample SHGs indicates that about 60% have attained ‘A’ grade (Table-6.5). The Missions are expected to provide RF and later CIF only to those SHGs which are graded ‘A’. However, the process study conducted in Mission states indicates that all of them have not instituted mechanisms for periodic grading of SHGs. It is therefore imperative that the states ensure that all SHGs attain ‘A’ grade by putting in place an appropriate support system and a mechanism to periodically grade them. Table-6.5 Grading of SHGs: Sample S. No. 1. Block Type All Blocks 2. Resource Blocks 3. Intensive Blocks 4. Partnership Blocks No. of Sample SHGs 502 270 184 48 SHGs Graded 306 (61) 162 (60) 115 (63) 29 (60) 56 Note: Figures in parentheses are percentages Source: Sample SHG data see Annex Table-6.8 & 6.9 6.7 As pointed out earlier, all three month old SHGs are eligible for RF. However, only 75% of the sample SHGs (sample consists of more than one year old SHGs) were provided RF. The proportion of SHGs that receive RF is close to 90% in resource blocks, while it is only 55% in intensive blocks and 65% in partnership blocks. It is imperative from the sample data that all SHGs are graded and eligible SHGs provided RF. Table-6.6 No. of SHGs Provided with RF: Sample S. No. of SHGs Provided Block Type No. of Sample SHGs No. with RF 1. All Blocks 502 374 (75) 2. Resource Blocks 270 241 (89) 3. Intensive Blocks 184 102 (55) 4. Partnership Blocks 48 31 (65) Notes: (1) Figures in parentheses are percentages; (2) Only data for 502 SHGs is taken into account. Source: Sample SHG data see annex table-10 & 11 SHGs Provided CIF Support 6.8 CIF constitutes the major portion of project fund to the community institutions. CIF is meant to be a fund in perpetuity from which the SHGs could borrow and repay. The VOs are expected to disburse the CIF to the SHGs and recover from them. As the VOs can be promoted only after a minimum number of SHGs is promoted in each village, the Mission units are expected to disburse CIF to the SHGs, with the condition that the CIF loan be repaid to the VO along with interest charges as and when the VOs come into being. However, CIF can be disbursed to SHGs only after a micro-investment plan is prepared in a participatory manner in all SHGs and appraised by the VO/Mission units. The SHGs are also required to be trained in advance in the preparation of MIPs which essentially capture the priority fund requirements of the individual members of SHGs. The MIS data up to Dec.’14, however, indicates that only 33% of the eligible SHGs across the project states prepared MCP, of which only 57% received CIF. The process study findings indicate that shortage of MCP trainers, delays in training of SHGs in MCP and appraisal of MCPs by Mission units and VOs, administrative delays and fund routing related issues are responsible for the relatively low coverage of SHGs. However, the states are streamlining the disbursement process and are expected to catch-up by Mar. ‘15. The funds flow channels adopted in different states are summarized in Annex-11. 57 Table-6.7 Eligible SHGs Provided CIF in Intensive Blocks Dec.’14 S. No. Total No. of SHGs State 1. Assam 27137 2. Bihar 71141 3. Chhattisgarh 8154 4. Gujarat 16625 5. Jharkhand 14035 6. Karnataka 5179 7. Madhya Pradesh 35627 8. Maharashtra 22094 9. Odisha 20306 10. Rajasthan 1771 11. Tamil Nadu 7993 12. Uttar Pradesh 4221 13. West Bengal 41865 14. Total 276148 Source: State Information Reports No. of SHGs which are more than 6 months old No. of SHGs Prepared MCP Percent of SHGs Prepared MCP No. of SHGs Provided CIF Percent of SHGs Provided CIF 23257 62840 5652 12838 10169 4348 25273 13286 18447 1037 7993 4264 33320 2151 1128 6255 0 17568 4368 1340 216 2619 2279 32385 219804 0 11 73240 18 53 38 9 62 0 70 33 7 21 33 0 0 33 1383 20856 1858 690 5507 0 8446 2241 391 180 932 0 0 42484 31 63 86 61 88 0 48 51 29 83 36 0 0 57 CIF Support Provided to Sample SHGs 6.9 The sample data also indicates similar trends. Only 48% of the sample SHGs were provided CIF, while the percentage was relatively higher in resource blocks up to Dec.’14. The proportion of SHGs that was provided CIF from the intensive blocks was still less at 38%. As all the sample SHGs are one year old and eligible to receive CIF, the state Missions are required to take appropriate steps to identify SHGs, train them in MCP, facilitate preparation of MCP, appraise and sanction the CIF. It is equally important to streamline the funds flow by cutting down the layers involved in decision-making. Table-6.8 Sample SHGs Provided CIF S. No. 1. All Blocks 2. Resource Blocks Block Type No. of Sample SHGs 502 270 3. Intensive Blocks 4. Partnership Blocks 184 48 Dec.’14 No. of SHGs Provided CIF 243 (48) 145 (54) 69 (38) 29 (60) Note: Figures in parentheses are percentages 58 Source: Sample SHG data SHG-Bank Linkage 6.10 Project funds provided to the SHGs are only in the nature of seed money intended to prepare the SHGs for leveraging large funds, in repeat doses, from the banks to meet their livelihood requirements. However, this requires substantial efforts on the part of the Mission units to enable the SHGs access bank loans, year after year. The Mission staff are required to liaise with the banks, orient the bankers to NRLM and sensitize them to the needs of the SHG members, facilitate regular repayment of loans and subsidize the time cost of their transactions with the SHGs by providing the support of bank mitras/CRPs. A review of the MIS data, however, indicates that as of Dec.’14, only 35% of the 6 month old SHGs had accessed first dose of bank credit. As a percentage of the total SHGs, this figure is only 27%. This is another area which requires focused efforts. Several states have initiated measures to promote bank linkage. These include appointment of a large number of retired bankers to liaise with banks, use of bank mitras, promotion of community based recovery mechanisms, preparation of a larger number of SHGs for bank linkage etc. These measures are expected to yield results in months ahead. Table-6.10 SHG Bank Linkage in Intensive Blocks S. No. State Total No. of SHGs 1. Assam 27137 2. Bihar 71141 3. Chhattisgarh 8154 4. Gujarat 16625 5. Jharkhand 14035 6. Karnataka 5179 7. Madhya Pradesh 35627 8. Maharashtra 22094 9. Odisha 20306 10. Rajasthan 1771 11. Tamil Nadu 7993 12. Uttar Pradesh 4221 13. West Bengal 41865 14. Total 276148 Note: TBC – To be collected Source: State Information Reports No. of SHGs with Bank Account 25447 46116 7245 14677 10735 4849 27429 19000 20171 1562 7993 3215 41065 229504 No. of SHGs which are more than 6 months old No. of SHGs accessed Bank Credit (1st dose) 23257 62840 5652 12838 10169 4348 25273 13286 18447 1037 7993 2732 18615 4440 5899 1477 TBC 13127 4801 2083 82 3889 2279 32385 219804 1300 17485 75930 Dec.’14 Percent of more than 6 months SHGs accessed Bank Credit 12 30 79 46 15 TBC 52 36 11 8 49 57 54 35 Bank Linkage of Sample SHGs 6.11 The sample data also indicates that out of 502 more than one year old SHGs, only 34% have accessed bank credit. The proportion of SHGs accessing bank loans in the resource blocks was 27%, while a larger proportion of sample SHGs are credit linked in 59 the intensive and partnership blocks. This could be due to a larger proportion of preexisting SHGs in these categories. Table-6.11 No. of SHGs Accessed Bank Credit: Sample S. Block Type No. of Sample SHGs No. 1. All Blocks 502 2. Resource Blocks 270 3. Intensive Blocks 184 4. Partnership Blocks 48 Note: Figures in parentheses are percentages. Source: Computed from sample SHG data in Annex Tables-6.14 & 6.15. Dec.’14 No. of SHGs Accessed Bank Credit 172 (34) 72 (27) 78 (42) 22 (46) Leverage of Bank Loans 6.12 As indicated earlier, the purpose of RF and CIF to SHGs is to enable them to gain experience in fund management, besides meeting their immediate consumption and production requirements of credit. But the more important objective of funding support to the SHGs is to enable them to leverage funds from the formal financial institutions. From this perspective, an attempt has been made to compare the CIF actually disbursed to SHGs through all channels during FY 2014-15 and the bank loans accessed by the SHGs. It may be noted however, that the SHGs accessing bank loans and SHGs that have received CIF may not exactly overlap. The CIF data is taken from the IUFRs. The bank loan data is taken from MPRs of NRLM. The leverage ratio computed is 1.87, indicating that a rupee of CIF given to SHG is able to leverage 1.87 rupees of bank loan. This is for financial year FY 2014-15 (up to Dec.’14). With the establishment of larger number of VOs, higher amounts of CIF would be disbursed to the SHGs. Similarly, the states are rationalizing the funding channels and financial systems are getting strengthened. There is a great deal of focus on promoting SHG-bank linkage as well. All these developments are pointing to a higher leverage ratio. Table-6.12 CIF-Bank Loan Ratio in Intensive Blocks: 2014-15 Rs. Lakh; Dec.’14 S. No. 1. 2. 3. 4. 5. 6. 7. 8. 9. 10. State Assam Bihar Chhattisgarh Gujarat Jharkhand Madhya Pradesh Maharashtra Rajasthan Uttar Pradesh Total CIF 930 1970 536 155 1407 2224 1282 141 198 8843 Bank Loan Amount as Per MPR 1400 3334 1909 995 463 6072 2350 1.00 32 16556 Leverage Ratio 1.51 1.69 3.56 6.43 0.33 2.73 1.83 0.01 0.16 1.87 60 Notes: (1) Karnataka, Odisha, Tamil Nadu and Bengal data are being validated and hence not included; (2). CIF disbursed includes RF disbursed in intensive and resource blocks as per IUFRs; (3) Bank loan amount is taken from both NRLM-bank linkage portal and MPRs. Source: NRLM-MIS and NRLM-SHG bank linkage portal. Leverage Ratio in Sample SHGs 6.13 An attempt has been made to relate the total funds of the SHG including savings, RF and CIF with the bank loan to assess the extent of leverage in respect of all sample SHGs. The leverage ratio works out to 0.6, implying that the sample SHGs have been able to mobilize Rs.60/- has bank loan for every Rs.100/- of own funds. This is consistent with the field level observations as most of the SHGs are admitted to the first bank linkage, which is generally around Rs.50,000/-. Given the relatively low average age of SHGs, the ratio appears to be satisfactory. However, there is need for increasing the access of the SHGs to bank loans. The states have already initiated multiple strategies for this purpose. Table-6.13 Leverage Ratio (Own Fund to Bank Loan) in Sample SHGs: All Blocks S. No. 1. 2. 3. 4. 5. State No. of SHGs 12 57 40 9 47 Savings RF CIF Total In Rs; Dec.’14 Leverage Bank Loan Ratio 50000 0.4 877000 0.2 1310000 0.5 100000 0.4 484000 0.1 Assam 82090 45000 -127090 Bihar 760525 600000 2919000 4279525 Chhattisgarh 850410 435000 1320000 2605410 Gujarat 162619 70000 -232619 Jharkhand 954809 630000 2100000 3684809 Madhya 6. 68 1182812 855000 2555000 4592812 1452900 0.3 Pradesh 7. Maharashtra 75 1772648 754200 1496101 4022949 3309000 0.8 8. Odisha 21 615160 65000 -680160 3935500 5.8 9. Rajasthan 29 279140 435000 -714140 -0.0 10. Tamil Nadu 4 695700 25000 -720700 958500 1.3 11. Total 362 7355913 3914200 10390101 21660214 12476900 0.6 Notes: (1) -- Sample SHGs had not received CIF up to Dec.’14. (2) The leverage ratio is based on the cumulative total funds available with the SHGs and the bank loan accessed up to Dec.’14. Source: Sample data Idle Funds with the SHGs 6.14 While leveraging external funds is important but equally important is to ensure that own funds are efficiently used. Efficient use of funds requires that idle funds held in the form of cash in hand and cash at bank are the lowest. Efficient use implies a very high velocity of use of funds without keeping idle funds either in the bank or as in the cash. But computation of idle fund ratio requires data on cash balances as well as bank balances for each month. However, such data could not be collected. As an alternative, idle funds in the form of cash at bank and cash in hand at the end of Dec.’14 for all sample SHGs was computed and expressed as a proportion of total outstanding loans. 61 While this does not explain the idleness of funds over a long duration, it is certainly indicative of the extent of idle funds in Dec.’14. This ratio varied between 20 and about 50% in the sample SHGs across the states. 62 Table-6.14 Idle Funds with SHGs as Proportion of Total Outstanding Loans Dec.’14 S. Idle funds as Percent of State No. of Sample SHGs No. Outstanding loans 1. Assam 8 54 2. Bihar 57 27 3. Chhattisgarh 36 26 4. Gujarat 4 20 5. Jharkhand 43 39 6. Madhya Pradesh 45 45 7. Maharashtra 69 35 8. Odisha* 16 60 9. Rajasthan 26 40 Notes: (1) Ideally, the ratio of idle funds is computed as average reckoned on month on month basis. However, data is available only for the month of Dec.’14; (2) The idle funds including cash in hand and cash at bank is expressed as proportion of outstanding loans at the end of Dec.’14. (3) Odisha sample is lysed and therefore needs to be taken with a caution and efforts are being made to validate the sample. Source: Computed from sample SHG data and age wise distribution of SHGs vis-à-vis idle cash in Annex Tables-6.16 & 6.17 6.15 The distribution of SHGs by amount of idle cash and bank balances in Dec.’14 indicates that out of 307 SHGs for which complete receipts and payments data was available for Dec.’14, 153 SHGs had an idle fund of over Rs.10,000/- , 62 SHGs between Rs.5,000/- and Rs.10,000/- and 92 SHGs less than Rs.5,000/-. Notwithstanding the data limitations, the pointers are clear and the Mission units would be required to promote rotation of internal funds and minimize idle funds. Table-6.15 Distribution of Sample SHGs by Amount of Idle Funds in Dec.’14 Number S. No. 1. 2. 3. 4. 5. 6. 7. 8. 9. 10. 11. State Rs.0-5000 Assam Bihar Chhattisgarh Gujarat Jharkhand Madhya Pradesh Maharashtra Rajasthan Odisha Tamil Nadu Total 7 15 7 2 5 8 33 12 3 92 Rs.500010000 1 16 13 9 3 9 10 1 62 Rs.10000 and above 0 26 16 2 29 34 27 4 13 2 153 Total 8 57 36 4 43 45 69 26 16 3 307 Source: Computed from Annex Table-6.16 63 Velocity of Rotation of All SHG Funds 6.16 Almost all SHGs promoted and revived and strengthened under NRLP have been practising rotation of funds through lending among members. The velocity of lending, however, varied across the SHGs in different states depending on the size of the fund base (total of savings, RF received, CIF received, bank loans received and other income accrued) and the total loans disbursed out of such funds. The detailed state-wise and age-wise analysis of velocity of fund rotation is presented in Annex Table-6.20 and the state-wise summary in the following Table-6.16. The coefficient is estimated for all new SHGs promoted and pre-existing SHGs brought under NRLM fold. For new SHGs, the total fund base as well as loans advanced were taken from the date of formation up to Dec.’14 and for revived SHGs from the date of coming into NRLM fold and up to Dec.’14. The coefficient presented for different states indicates that Maharashtra, Chhattisgarh, Jharkhand, Bihar, Gujarat and Rajasthan have relatively higher coefficients, suggesting greater utilization of internal funds. As all the states are resource block states (except Bihar), it can be inferred that the rate of rotation of funds is relatively higher in resource block states. Table-6.16 Velocity of Fund Rotation in Sample SHGs: Up to Dec.’14 S. No. State 1. Assam 2. Bihar 3. Chhattisgarh 4. Gujarat 5. Jharkhand 6. Madhya Pradesh 7. Maharashtra 8. Odisha 9. Rajasthan 10. Tamil Nadu 11. Total Source: Sample SHG data Average Corpus (in Rs. Per SHG) 11793 32608 37604 30001 39800 33027 41403 30449 25464 199281 36384 Average of Funds Available (in Rs. Per SHG) 15960 110706 104074 43890 96928 92944 105590 222140 25464 438906 102248 Average Loan Amount Disbursed (in Rs. Per SHG) 15042 125109 166604 57313 137703 91428 158140 182900 27424 450550 125984 Velocity 0.9 1.1 1.6 1.0 1.2 0.9 1.9 0.7 1.0 0.8 1.3 Members Availing Loans 6.17 Proportion of SHG members that have accessed loans from SHGs, irrespective of the source of loan funds, is a measure of equity and fairness in access to funds. From this perspective, the sample data indicates that 84% of the members of the sample SHGs have accessed loans from SHGs. This includes the small as well as big loans made out of SHG corpus, CIF and bank loan proceeds. Clearly, the outcome is inclusive. Further, the proportion exceeds 90% in all resource blocks, except Rajasthan, owing perhaps to the close nurturing and follow-up support provided to the SHGs. 64 Table-6.17 Members Availing Internal Loans (At least once): Total Sample (All Blocks) Dec.’14 S. No. State 1. 2. 3. 4. 5. 6. 7. 8. Assam Bihar Chhattisgarh Gujarat Jharkhand Madhya Pradesh Maharashtra Odisha 9. Rajasthan 10. Tamil Nadu 11. Total Source: Sample data Total Members of Sample SHGs 191 714 542 256 1225 861 1062 265 377 309 5802 Members who have Availed Loans from SHG at least Once 130 639 483 96 1111 754 973 224 193 281 4884 Percentage of Members 68 89 89 38 91 88 92 85 51 91 84 Table-6.18 Members Availing Internal Loans (At least once): Total Sample (Resource Blocks) Dec.’14 S. State No. 1. Chhattisgarh 2. Jharkhand 3. Madhya Pradesh 4. Maharashtra 5. Rajasthan 6. Total Source: Sample data Expected 414 905 605 781 377 3082 Members who have taken loans 412 828 564 759 193 2756 Percentage of Members 100 91 93 97 51 89 Utilization of Loans 6.18 As part of sample study, an attempt was made to assess the purpose-wise utilization of individual loans borrowed by members through the agency of SHG. It may be noted that the analysis is based on the purpose of utilization of loan as indicated by the members. The actual purpose for which loan proceeds are utilized could be different. Another limitation is that the amount of loan received/utilized for each purpose could not be collected and analysed. Notwithstanding these limitations, an attempt has been made to analyse the number of loans by indicated purpose to examine the potential direction of use rather than the actual utilization. 65 6.19 The analysis carried out for the sample states (Table-6.19) indicates that out of 7,271 total loans borrowed by members, 5% were stated to have been utilized for debt redemption, 38% for meeting household expenses, 34% for asset creation and 23% for meeting health and educational requirements of the member households. The pointers are clear. Only 34% of the total loans (made out of all funds available with SHGs including CIF and bank loan) were intended to be used for creation of livelihood assets. As the SHGs mature and fund base grows, the proportion of loans used for promoting livelihood assets should increase and those of others should decline. Table-6.19 Purpose-wise Utilization of Loans As Indicated by Members: Sample Dec.’14 S. No. State 1. 2. 3. 4. 5. 6. 7. 8. Assam Bihar Chhattisgarh Gujarat Jharkhand Madhya Pradesh Maharashtra Odisha 9. Rajasthan 10. Tamil Nadu 11. Total Source: Sample data Total Loans Analysed 140 1305 615 131 1829 1008 1359 299 241 344 7271 Debt Redemption 1 10 2 4 2 6 3 0 3 12 5 Percent of Household Asset Expenses Creation 31 48 37 22 57 25 53 29 32 43 44 30 37 31 27 71 42 50 37 29 38 34 Health/ Education 20 31 16 14 24 21 29 2 5 22 23 Bookkeeping 6.20 Transparent and accountable bookkeeping practices are indispensable for promoting sound micro-finance practices in SHGs. The state Missions are required to promote good bookkeeping practices in all SHGs and their federations. All SHGs are therefore required to maintain certain basic books of accounts and update them regularly with the support of a trained bookkeeper. An examination of the bookkeeping practices in sample SHGs presented in the following tables indicates that bookkeeping leaves scope for improvement (Table-6.20). 6.21 All Missions have prescribed minutes book, cash book, general ledger, loan ledger, member passbook and saving register as essential for all SHGs. Some state Missions have also supplied the books of accounts to the SHGs at subsidized cost. However, not all of them had been maintaining all the books regularly by updating relevant entries. About 75% of the sample SHGs had been updating minutes book and savings register, while a relatively smaller percentage of SHGs were found updating cash book, general ledger, loan ledger and passbooks. The situation in the resource blocks was relatively better in respect of all types of books. There are significant interstate disparities in the status of bookkeeping as revealed by the sample SHGs (Table66 6.21). Overall, the status of bookkeeping in Assam, Gujarat, Odisha and Chhattisgarh appears to be relatively poor with a smaller percentage of books being updated. 67 6.22 Relative lack of updated books of accounts in states could be due to shortage of trained bookkeepers available and the regularity and quality of bookkeeping undertaken by them. An equally important factor affecting the quality of bookkeeping is the training input provided to the bookkeepers and the handholding support provided to them by project staff and master bookkeepers. The process study as well as the data from sample clusters indicates that in the resource blocks, the required number of bookkeepers are identified and trained and support provided. In the other blocks, the number of bookkeepers is disproportionately small and the training input provided inadequate. It is therefore imperative that the Missions focus on improving the supply of books, number and quality of bookkeepers and bookkeeping practices. Table-6.20 Status of Bookkeeping in Sample SHGs Dec.’14 S. No. Sample Block Type Sample SHGs 1. Percent of SHGs with Updated Books of Records Minutes Book Cash Book General Loan Members Savings Ledger Ledger Passbook Register Resource 270 83 57 53 79 Blocks 2. Intensive 184 65 48 29 46 Blocks 3. Partnership 48 65 88 79 77 Blocks 4. Total Blocks 502 75 57 47 67 Source: Computed from sample data furnished in Annex Tables—8.17 to 8.23. 80 87 47 61 83 83 68 77 Table-6.21 Status of Bookkeeping in Sample SHGs: Sample States Dec.’14 S. No. State Sample SHGs Percent of SHGs with Updated Books of Records Minutes Cash General Loan Members Savings Book Book Ledger Ledger Passbook Register 1. Assam 19 63 5 5 53 16 37 2. Bihar 60 75 57 7 27 45 78 3. Chhattisgarh 47 55 28 19 57 53 74 4. Gujarat 24 42 46 50 50 50 50 5. Jharkhand 96 80 56 55 97 97 98 6. MP 78 72 63 55 69 67 78 7. Maharashtra 96 88 77 73 70 70 82 8. Odisha 23 74 39 17 35 43 52 9. Rajasthan 36 67 58 56 75 86 58 10. Tamil Nadu 23 100 83 78 91 96 83 11. Total 502 75 57 47 67 68 77 Notes: (1) 3% of the SHGs (11 in Bihar, 1 in Jharkhand and 1 in Odisha) did not have minutes book; (2) 16% of the sample SHGs have not introduced cash book; (3) 23% of the sample SHGs have not introduced general ledger book; (4) 9% of the sample SHGs have not introduced loan ledger book; (5) 10% of the sample SHGs have not introduced member passbook; (6) 9% of the sample SHGs have not introduced member passbook. 68 Source: Computed from Annex Tables-6.18 & 6.19 Summary 6.23 Self-reliance and sustainability of the SHGs critically hinge on the quality of micro-finance activities undertaken by the SHGs. All SHGs are expected to undertake regular savings, inter-lending and leverage external funds, in addition to the revolving fund and CIF provided by the Mission. a necessary pre-requisite for all SHGs is to have savings bank accounts within three months of formation. As of Dec.’14, 84% of the SHGs under the project fold had savings bank accounts. The states of Bihar, Jharkhand, Madhya Pradesh and Uttar Pradesh with a relatively lower percentage of bank accounts need to promote bank accounts for all SHGs; the average cumulative savings per SHG stood at Rs.14,353/- (Rs.1,259/- per member) at the end of Dec.’14. The revived SHGs account for Rs.20,116/- per SHG (Rs.1,716/- per member); as of Dec.’14, 66% of eligible SHGs (6 month old and adhering to Panchsutras) were provided RF and efforts are afoot in the Mission states to cover all SHGs by Mar.’15. The sample data suggests that the RF coverage of SHGs is very high; the sample data indicates that 60% of the SHGs have attained ‘A’ grade and others are catching up rapidly; system of disbursing CIF through VOs is gradually being established in all Mission states, involving (i) identification and training of MCP trainers; (ii) training of SHGs in MCP preparation; and (iii) appraisal of MCPs and disbursement of CIF to SHGs and its recovery; up to Dec.’14, 43,254 SHGs were provided CIF and this constitutes 57% of the SHGs that had prepared MCPs. The sample data also suggests that 48% of the SHGs were providing CIF. Fund flow mechanisms are being streamlined in all states to speed-up disbursal of CIF; the MIS data indicates that 33% of the 6-month old SHGs had accessed first dose of bank credit which is a significant achievement, considering the fact that the project districts are located in areas with relatively low banking infrastructure and with a not so encouraging bank loan repayment history of SHGs. Interestingly, the sample data also indicates that 34% of SHGs have accessed bank credit; an attempt made to relate state-wise CIF disbursed (based on IUFRs) and bank loans mobilized by SHGs (MPR data) during FY 2014-15 indicates that the ratio is 1.87. As the data on CIF and bank loans are taken from two different sources, the leverage ratio was estimated using the sample data, which suggests that the ratio was 0.6 up to Dec.’14 (since formation of new SHGs and revival of pre-existing SHGs). The leverage ratio of 0.6 appears to be reasonable considering the fact that it is the first linkage for most of the sample SHGs; while leveraging external funds is important, but even more important is efficient utilization of own funds of the SHG by minimizing idle funds. From 69 this perspective, the analysis is made using sample data reveals that there is a considerable amount of idle fund as percent of outstanding loan in Dec.’14. The number of sample SHGs that had more than Rs.10,000/- as cash in bank and cash in hand was quite large (153 out of 307 sample SHGs for which detailed data was available); rotation velocity of all SHG funds including RF, CIF and bank loans varied between 0.7 to 1.6 across the 10 sample states, indicating scope for improving the fund rotation. On the average, the velocity was 1.3. Considering the average age of the SHGs, the velocity coefficient appears to be satisfactory. overall 84% of the sample members had accessed at least one loan (small or big) from the SHGs, irrespective of the source of funds. The proportion exceeds 90% in all resource blocks. This is a clear testimony to the inclusiveness in the use of SHG funds; and analysis of bookkeeping practices suggest that there is significant scope for improving the quality of bookkeeping (books, bookkeepers and bookkeeping) by facilitating engagement of adequate number of trained bookkeepers and providing handholding support to them. 70 Chapter–7 Promotion and Functioning of VOs Introduction 7.1 The Village Organization (VO) is the first level federation of the SHGs. As a village level federation, VO provides financial and non-financial support to the SHGs and guides their functioning. The principal form of financial support provided by VO to the SHGs is CIF which in turn facilitates leverage of bank loans. More importantly, VOs are expected to provide capacity building support to the SHGs and the community cadre. VOs provide a forum for SHGs to articulate and resolve common social issues affecting them. As federating units, SHG members constitute the general body of the VOs and participate in the election of executive committee and office bearers. Thus, the VOs and the SHGs are interlocked both organizationally and financially. An attempt is made in this chapter to present the functioning of the VOs promoted in the intensive blocks as democratic organizations providing financial and non-financial support to the SHGs, largely on the basis of sample data. Formation of VOs 7.2 As part of the NRLM design, all Mission states are required to promote VOs in all villages which have completed significant extent of social mobilization and have acquired a minimum number of NRLM compliant SHGs. In resource block states, the process of VO formation is entrusted to senior CRPs drawn from NROs. Some of the resource block states have promoted VOs in villages which have at least 5 SHGs adhering to Panchsutras and are ready/ have undertaken preparation of micro-credit plan. Senior CRP teams, comprising 3 members each, visit identified villages and undertake a 15-day process of promotion of VO and training of members, EC and OBs. The senior CRP team institutes all governance structures and systems during this period. While all members constitute the GB, two representatives from each SHG in the village represents their SHGs at the EC of the VO. The EC in turn elects a 4 to 5 member team of OBs who carry out the operations of the VO with the support of VO bookkeeper and activists/ animator. The frontline staff facilitate the overall process of formation of VO and the institution of governance and financial norms and systems. The states of Maharashtra, Chhattisgarh and Jharkhand have promoted VOs in some resource block villages up to Dec.’14. In Odisha, Madhya Pradesh, Rajasthan and Bihar, VOs exist in the EAP blocks. These states are planning to adopt structures and systems similar to the VOs existing in the EAP blocks. VOs in NRLP States 7.3 Though VOs have been promoted right from 2011-12, their formation peaked during 2013-14. A total of 12583 VOs were formed under the project up to Dec.’14. On an average, 2 VOs were formed up to 2012-13, while 18 VOs were formed during 201314 and 13 per block during 2014-15. As of Dec.’14, there were 34 VOs per block on the average. The average numbers presented here need to be taken with a caution. For example, the VOs promoted in West Bengal are pre-NRLM entities known as sansad level sanghas or federations which do not exactly correspond to VOs. Similarly, Assam 71 has promoted loosely-knit federations in a campaign mode. The VOs in respect of resource block states of Jharkhand, Maharashtra and Chhattisgarh reflect the growth of VOs that follow NRLM processes. In Madhya Pradesh, a resource block state, VOs have not been promoted in resource blocks but intensive blocks have promoted VOs following the DPIP model. In Tamil Nadu too, the PLFs promoted are based on the model promoted in Pudhuvazhvu project. The progress is relatively slow in Odisha and Rajasthan. Table-7.1 Growth of VOs per Block: NRLP No. of VOs Formed Per Block Total Up to Dec.’14 2012-13* 2013-14 2014-15 0 42 13 55 Assam 3 15 15 32 Bihar 0 6 6 12 Chhattisgarh 0 12 8 20 Gujarat 1 4 19 24 Jharkhand 0 0 10 10 Karnataka 11 19 17 48 Madhya Pradesh 3 9 15 27 Maharashtra 0 3 2 5 Odisha 0 5 4 9 Rajasthan 0 12 32 43 Tamil Nadu 0 0 0 0 Uttar Pradesh 0 83 17 100 West Bengal 2 18 13 34 14. Total (872) (6772) (4939) (12583) Notes: * includes VOs formed 2011-12; (ii) Figures in parentheses are total VOs formed in each year. Source: State Information Reports S. No. 1. 2. 3. 4. 5. 6. 7. 8. 9. 10. 11. 12. 13. State 7.4 Not all villages entered have VOs promoted. Out of the total NRLP villages in progress (34,172), only 12583 villages have established Village Organizations up to Dec.’14. This constitutes only 37% of the total villages. Further, only 43% of the SHGs mobilized were federated into SHGs by Dec.’14. Considering the fact that there are a large number of villages which have completed one year of implementation with at least 5 SHGs, it is imperative that the state Missions expedite the VO building process without compromising on the stipulated norms. Size of VOs 7.5 The average size of the VO measured in terms of the number of federating SHGs has remained around 9 during the last two years, indicating the scope for mobilizing newly formed and revived SHGs into the VO fold. 72 Table-7.2 Number of Villages with VOs: All Blocks Dec.’14 S. No. of Villages State No Implementing NRLP 1. Assam 3889 2. Bihar 3919 3. Chhattisgarh 1438 4. Gujarat 1069 5. Jharkhand 1957 6. Karnataka 2930 7. Madhya Pradesh 5925 8. Maharashtra 2713 9. Odisha 1924 10. Rajasthan 278 11. Tamil Nadu 2779 12. Uttar Pradesh 793 13. West Bengal 4558 14. Total 34172 Source: State Information Reports No. of villages with VOs 1369 2482 189 396 687 202 2188 975 144 63 692 0 3196 12583 Percent of Villages without VOs 35 63 13 37 35 7 37 36 7 23 25 0 70 37 Table-7.3 Formation of VOs in During the Project Period: NRLP Cumulative No. of VOs Formed Per Block 2014-15 2012-13* 2013-14 (Up to Dec.’14) 10 10 1. Assam -12 11 11 2. Bihar 7 7 3. Chhattisgarh -7 8 4. Gujarat -12 12 12 5. Jharkhand 10 6. Karnataka --5 5 5 7. Madhya Pradesh 11 9 9 8. Maharashtra 12 12 9. Odisha -9 9 10. Rajasthan -11 12 11. Tamil Nadu -12. Uttar Pradesh ---9 9 13. West Bengal -8 9 9 14. Average Size of VO 15. Cumulative No. of VOs 872 6772 12583 16. Cumulative No. of SHGs Federated 6856 (27) 62049 (38) 117563(43) 17. Cumulative No. of SHGs in NRLM 25050(100) 163116(100) 276148(100) Notes: * includes VOs formed 2011-12. Figures in parentheses are percentage of SHGs federated. Source: State Information Reports S. No. State 73 7.6 The sample data indicates that on the whole, 55% of the SHGs are holding membership in the VOs, while in the resource blocks, it is 34%. The higher proportion of SHGs getting federated into VOs in the intensive blocks needs to be taken with some caution. Most of these SHGs are relatively nascent and loosely-knit organizations which needs to be strengthened along the lines of VOs in the resource blocks. Table-7.4 SHGs Holding Membership in VO S. No. 1. Sample All Blocks Total No of SHGs in the sample Clusters No of SHGs Holding membership in the VO Percent of SHG memberships No of SHGs Following Panchsutra Percent of SHGs Following Panchsutras 17265 9449 55 14793 86 2030 34 5496 93 7419 65 9297 82 Resource 5893 Blocks 3. Intensive 11372 Blocks Source: Cluster sample data 2. Age Analysis of Sample VOs 7.7 The age analysis of sample VOs clearly indicates that 85% are less than 18 months of age, 4% are in the age group of 18-24 months and 11% above 24 months of age. This is broadly reflective of the situation in the NRLP states. As part of the strategy, VOs are expected to be formed one year after the entry of the Mission into the villages and after forming at least 5 functional SHGs. Table-7.5 Analysis of Sample VOs by Age: Total Sample S. No. 1. 2. 3. 4. 5. 6. 7. 8. 9. State Assam Bihar Chhattisgarh Gujarat Jharkhand Madhya Pradesh Maharashtra Odisha Rajasthan Age of Sample VOs (in Months) <18 18-24 14 2 13 1 10* -4 -17* + 5 -5 1 >=24 1 5 1* --2 Total 17 19 11 4 22 8 15* + 4$ 1* 4 24 8 --8 8* --8 103 5 13 121 10. Total (85%) (4%) (11%) (100%) Note: (1) $ indicates 1 very recently formed, VO is not included; (2) -- indicates nil; (3) * indicates sample VOs from resource blocks; (4) The sample does not include Tamil Nadu; Tamil Nadu sample data is being validated. Source: Sample VO data 74 Table-7.6 SHGs Federated into VOs: Sample Average Size of Sample VOs (No. of SHGs) 1. All Blocks 121 1430 12 2. Resource Blocks** 52 567 11 3. Intensive Blocks* 69 863 13 Notes: (1) Tamil Nadu sample data is not included in the analysis. (2) ** In the state of Madhya Pradesh, VOs were not formed in the resource blocks up to Dec.’14; (3) * in case of Chhattisgarh formation of VOs was not taken up in the intensive blocks up to Dec.’14. Source: Sample VOs S. No. Sample Sample VOs SHGs Federated into Sample VOs Governance 7.8 Each VO consists of a GB, an EC/sub-committees and OBs. Both the GB and EC are expected to conduct meetings as per norms. However, as the VOs are in the formative stage, the GB meetings is not yet standardized. ECs are expected to meet once in a month to deliberate on key activities. The data suggests that all sample VOs from resource blocks are holding all meetings as per norms. In intensive blocks, however, there is a shortfall of 15 to 25%. Table-7.7 Regularity of VO Meetings in Sample VOs Percent of Expected EC Meetings Conducted S. Sample Block Type Sample VOs No. Dec.’14 Nov.’14 Oct.’14 1. All Blocks 121 86 85 87 2. Resource Blocks** 52 96 107$ 100 3. Intensive Blocks* 69 80 75 80 Notes: (1) ** In the state of Madhya Pradesh, VOs remained to be promoted in the resource blocks; (2) * in case of Chhattisgarh, promotion of VOs remained to be taken up in the intensive blocks. (3) $ indicates additional meetings; and (4) The sample does not include Tamil Nadu; Source: Sample VO data SHG Participation in VO Meetings 7.9 Regular conduct of meetings is an important democratic principle. But SHG participation in the meetings conducted is even more significant. The sample data (Table-7.8) reveals that more than 90% of the members that were expected to attend, had actually attended the meetings, as per the records of the VO. 75 Table-7.8 SHGs Attending VO Meetings % of Attendance S. Total Sample Types No. Sample VOs Dec Nov Oct 1. All Blocks 121 95 90 93 2. Resource Blocks** 92 90 91 52 3. Intensive Blocks* 69 92 89 92 Notes: (1) ** In the state of Madhya Pradesh, VOs are not formed in the resource blocks; (2) * in case of Chhattisgarh VOs are not formed in the intensive blocks; and (3) the sample does not include Tamil Nadu Source: Sample VO data SHGs Reviewed by VO 7.10 One of the key functions of VO is to undertake a monthly review of the performance of the federating SHGs on the basis of a set of indicators usually furnished in the form of a Masik Prativedan/Nivedan. The sample data indicates that this practice was being adopted by more than 75% of the sample VOs in all blocks, while the relative percentage for the resource blocks is 83%. The percentage of SHGs reported to have been covered in all sample blocks was about 60%, while the proportion of SHGs in resource blocks was slightly less than 50%. But the method and intensity of review varies from state to state and across the blocks. Table-7.9 SHGs Reviewed by VOs: Oct-Dec.’14 Percentage of SHGs Reviewed by VOs Dec.’14 Nov.’14 Oct.’14 1. All Blocks 66 64 61 2. Resource Blocks 49 48 46 3. Intensive Blocks 76 74 69 Note: The relative percentage of SHGs reviewed in resource blocks is lower as the number of VOs. Source: Sample VO data S. No. Block Type VO Sub-Committees 7.11 The sample study of VOs indicates that out of 121 sample VOs for which data is available, 65 had social action committees, 49 had loan repayment committees and 51 had bank linkage committees (Annex Tables-8.6 & 8.7). As the VOs are relatively young, the sub-committees were nascent and the Mission units were making efforts to institute these committees and promote their functioning. The committees need to be oriented to and provided training to discharge their responsibilities. CIF Provided to SHGs in the Sample VOs 7.12 All 6-month old SHGs are eligible for CIF. The sample data from all blocks presented in Table-7.10 reveals that out of 1,268 eligible sample SHGs, 725 were provided CIF. This constitutes 57% of the total eligible SHGs. As the most of the VOs are 76 relatively young, VOs provided CIF only to a small proportion of eligible SHGs, while the Mission units directly provided CIF to most SHGs. The inter-state variations in the proportion of SHGs provided CIF reflects several issues in the Mission states such as shortage of MCP trainers, delays in training in MCP and appraisal of MCPs, administrative delays in the sanction and disbursal of CIF, lack of appropriate financial delegation etc. In the resource block sample, 64% of the eligible SHGs were provided CIF (Table-7.11). Table-7.10 SHGs Provided CIF: All Block Sample S. No. State Sample VOs Total Eligible SHGs for CIF 1. 2. 3. 4. 5. 6. 7. 8. 9. Assam Bihar Chhattisgarh Gujarat Jharkhand Madhya Pradesh Maharashtra Odisha Rajasthan 17 19 11 4 22 8 24 8 8 110 214 85 23 171 192 227 173 73 10. Total 121 1268 Percent of SHGs Provided CIF Directly by By VOs Total Mission 18 15 34 85 0 85 91 16 107 30 17 48 95 6 101 58 14 71 24 11 35 0 5 5 0 11 11 48 9 57 (613) (112) (725) Source: Sample VO data Table-7.11 SHGs Provided CIF in Resource Blocks 1. 2. 3. 4. 5. Chhattisgarh Jharkhand Madhya Pradesh Maharashtra Rajasthan 11 17 0 16 8 Total Eligible SHGs for CIF 85 142 134 156 73 6. Total 52 590 S. No. State Sample VOs Percent of SHGs Provided CIF Directly by By VOs Total Mission 91 9 100 99 11 110 60 0 60 35 3 38 0 0 0 60 5 64 (353) (27) (380) Note: In Jharkhand, some SHGs were provided CIF twice. Source: Sample VO data. 7.13 One of the bottlenecks in the process of disbursement of CIF is the appraisal of MIPs by VO-ECs after necessary training. However, the sample data reveals that only 41% of the VOs were involved in appraisal of MIP, primarily in Maharashtra, Madhya 77 Pradesh and Odisha. It is imperative that all VOs undertake MIP appraisal as per the protocol. This in turn calls for provision of appropriate training of select EC members. Table-7.12 MIP Appraisal Total Sample S. No. State No. of Sample VO 1 Assam 2 Bihar 3 Chhattisgarh 4 Gujarat 5 Jharkhand 6 Madhya Pradesh 7 Maharashtra 8 Odisha 9 Rajasthan 10 Total Source: Sample VO data. 17 19 11 4 22 8 24 8 8 121 No. of VOs Undertaking MIP Appraisal 2 1 3 2 9 8 17 8 0 50 Percentage 12 5 27 50 41 100 68 100 0 41 Average Amount of CIF per SHG 7.14 As indicated earlier, only 57% of the total eligible sample SHGs, received CIF at an average rate of Rs.39,368/- per SHG. In Maharashtra and Bihar, the average CIF disbursed is relatively higher exceeding Rs.50,000/- per SHG. In resource block sample, the average CIF disbursed works out to only Rs.31,986/- per SHG as CIF distribution through VOs has not started in Madhya Pradesh and Rajasthan. Table-7.13 CIF Amount Provided to SHGs: Total Sample S. No. 1 2 3 4 5 6 7 8 9 State Sample VOs Assam Bihar Chhattisgarh Gujarat Jharkhand Madhya Pradesh Maharashtra Odisha Rajasthan 17 19 11 4 22 8 24 8 8 Total 121 Total Eligible SHGs for CIF SHGs Provided CIF 110 214 85 23 171 192 227 173 73 1268 (100%) 37 181 91 11 173 137 79 8 8 725 (59%) CIF Amount Per SHG (in Rs.) 27027 56851 41753 1364 37514 15620 60848 0 0 39368 Source: Sample VO data 78 Table-7.14 CIF Amount Provided to SHGs: Resource Blocks S. No State 1. Chhattisgarh 2. Jharkhand 3. Madhya Pradesh 4. Maharashtra 5. Rajasthan 6. Total Source: Sample VO data Sample VOs Total Eligible SHGs for CIF 11 17 0 16 8 52 85 142 134 156 73 590 No. of SHGs Provided CIF 85 156 80 59 0 380 (64%) CIF Amount Per SHG (in Rs.) 44700 39679 0 36695 0 31986 CIF Recovery in VOs 7.15 The demand-collection ratio of CIF by the VOs during Oct-Dec.’14 indicates that 22% to 44% of the CIF due was recovered. The percentage of recovery in the resource blocks where VOs are relatively nascent is lower, while in the intensive blocks the percentage of recovery is higher. As the systems get strengthened and practices get streamlined, the CIF recovery would increase further. The SHGs which were provided CIF directly by the Mission units prior to the establishment of VOs need to be guided to making their CIF repayments to the VOs. This would in turn require engagement of trained bookkeepers by all VOs and regular maintenance of books of accounts. Once VOs establish their financial hegemony over the SHGs, and the SHGs realize that the CIF is a common community fund from which they could perpetually borrow and repay, the recovery percentage would improve. Table-7.15 CIF Recovery in VOs Amount Due (in Rs. Lakh) Dec.’14 Nov.’14 Oct.’14 1. All Blocks 121 52 47 42 2. Resource Blocks 52 33 30 24 3. Intensive Blocks 69 20 17 18 Note: The sample does not include Tamil Nadu Source: Sample VO data S. No. Block Type No. of Sample VOs Percentage of CIF Recovery Dec.’14 Nov.’14 Oct.’14 22 21 44 11 8 8 41 43 35 VO Receipts and Payments 7.16 As indicated before, a majority of the sample VOs were less than 18 months of age. As such, the cumulative receipts per VO at the end of Dec.’14 amounted to Rs.3.83 lakh, while the cumulative payments made by a VO on the average amounted to Rs.4.01 lakh. VOs which have received VRF and administering CIF indicate higher volume of transactions. This is clearly evident in Bihar, Jharkhand and Madhya Pradesh. Despite being relatively young VOs, financial accounting systems are slowly being instituted. 79 Most of the VOs have core books of accounts and a good proportion of them have also hired the services of paid VO bookkeepers. However, there is scope for strengthening the financial system in terms of introducing and maintaining all books of accounts by a trained bookkeeper, transfer of VRF, recovery of CIF from SHGs including CIF received directly from the Mission units and prudent management of funds by avoiding idle funds and improving the velocity of loans. Equally important is to improve the financial literacy of all federating SHGs. Table-7.16 Receipts and Payments of Sample VOs: Total Sample Cumulative Up to Dec.’14 S. Number of VOs Receipts Payments State Number of VOs No. Provided VRF Per VO in Rs. Per VO in Rs. -67538 67636 1. Assam 17 9 941374 940518 2. Bihar 19 -322034 390714 3. Chhattisgarh 11 -88175 88175 4. Gujarat 4 3 436930 489105 5. Jharkhand 22 7 443800 467056 6. Madhya Pradesh 8 -299073 300808 7. Maharashtra 24 -2008 4288 8. Rajasthan 8 19 383062 401953 10. Total/Average 113 Note: There is a small mismatch between receipts and payments due to lack of updated books of accounts in all sample VOs. However, the gap is not substantial. Source: Sample VO data Status of Bookkeeping 7.17 All the VOs promoted under NRLM are required to institute books of records listed in Table-7.17. However, as a majority of the VOs are relatively young, all books are not adopted. Most VOs had membership register. All other books need to be introduced in the remaining VOs. However, most of the VOs which have adopted the books are updating all entries as per the bookkeeping protocol. It was also found that the transactions entered meet the three dimensions of quality viz., completeness, correctness and consistency. With additional rounds of training to the VO bookkeepers, the quality of bookkeeping would improve. 80 Table-7.17 Status of Bookkeeping in VOs: Total Sample S. No. Books of Records No. of Sample VOs Percentage Introduced Percentage Updated (Out of those Adopted) 1. Membership Register 121 50 2. Minutes Book 121 88 3. Cash Book 121 65 4. Loan Ledger 121 57 5. General Ledger 121 46 6. Receipt & Payment Vouchers 121 53 7. Stock Register 121 45 8. CIF DCB Register 121 34 9. Bank Linkage DCB Register 121 26 Note: The sample does not include data relating to 16 sample VOs from Tamil Nadu Source: Sample VO data 98 93 95 97 95 97 91 95 88 7.18 As the VOs in the resource blocks are relatively younger, a substantial proportion of them have not introduced all the books except membership register and bank loan DC-B register. Adoption of required books is an essential pre-requisite and all the Mission states would do well to facilitate adoption of all books, position bookkeepers and introduce regular bookkeeping practices. All VOs should also be required to hire the services of trained bookkeepers. Table-7.18 Status of Bookkeeping in Sample VOs: Resource Blocks S. No. Books of Records 1. Membership Register 2. Minutes Book 3. Cash Book 4. Loan Ledger 5. General Ledger 6. Receipt & Payment Vouchers 7. Stock Register 8. CIF DCB Register 9. Bank Linkage DCB Register Source: Sample VO data No. of Sample VOs Percentage Introduced Percentage Updated (Out of those Adopted) 52 52 52 52 52 52 52 52 52 73 87 54 56 54 58 56 56 52 97 100 96 100 100 97 93 97 89 81 Role of VO in Mobilization of Left Out Poor 7.19 VOs are expected to undertake several activities such as mobilization of left out poor into SHGs, training of SHGs, convergent activities with PRIs and line departments. Sample data reveals that over 60% of the VOs were involved in different types of activities relating to mobilization of the poor. About 40% were engaged in training of SHGs, while 46% were working closely with PRIs. It may be noted that the intensity and duration of engagement of VO in different activities varies across the sample. Table-7.19 Role of VO in Mobilization, Training and Convergent Activities: Total Sample S. No. State 1. Assam 2. Bihar 3. Chhattisgarh 4. Gujarat 5. Jharkhand 6. Madhya Pradesh 7. Maharashtra 8. Odisha 9. Rajasthan 10. Total Source: Sample VO data. Sample VOs 17 19 11 4 22 8 24 8 8 121 Mobilization of POP 12 100 73 50 73 75 56 100 25 63 Percent of VOs Undertaking Training Convergence of SHGs with PRIs 0 12 84 74 9 18 50 50 50 27 38 63 36 84 100 50 25 0 43 46 Working with LDs 12 0 27 0 18 75 52 0 0 23 Capacity Building of VO-ECs 7.20 Mission units/VOs are expected to organize training of EC members (including OBs) in a wide range of areas which would enable them to discharge their functions effectively. Important among these trainings are conduct of VO meetings, VO management, bookkeeping, MCP and CIF and cadre management. The sub-committees of the EC are also expected to be trained in specific areas such as CIF recovery, bank loan repayment and SHG monitoring. Some states such as Bihar, Chhattisgarh, Jharkhand and Maharashtra were ahead of others in organizing training for the VO-ECs. It is important to organize training of VO-ECs and their sub-committees in all essential areas to improve their functional effectiveness. The Mission units need to plan and facilitate organization of the trainings as per the action plans. 82 Table-7.20 Capacity Building of EC Members: Total Sample Sub Committees MCP CIF Audit Cadre Management 7. 8. 9. 10. Book keeping 6. Sample VOs Management 1. 2. 3. 4. 5. State Exposure and Immersion S. No. Meetings Number No. of VOs that Organized Training and Exposure Visits and Immersion to EC Members 17 19 11 4 22 10 19 11 4 22 0 10 2 1 1 1 17 10 2 17 0 18 11 2 16 0 16 3 2 11 6 8 5 4 5 0 13 7 3 8 0 0 3 2 0 0 10 2 0 4 8 8 4 8 2 8 6 7 0 0 24 8 8 121 23 8 2 107 3 4 0 25 12 8 0 75 16 8 0 73 10 0 0 50 14 0 0 48 6 0 0 44 3 0 0 8 4 0 0 20 Assam Bihar Chhattisgarh Gujarat Jharkhand Madhya Pradesh Maharashtra Odisha Rajasthan Total Source: Sample data Social Activities 7.21 The nascent VOs have also been engaged in taking up certain common social issues for resolution with the PRIs and the line departments. Most of these issues have been escalated by the SHGs in the EC meetings. About 50% of the VOs had either taken up or resolved social issues affecting a large proportion of their members. These issues include eradication of illicit distillation, fight against domestic violence, prevention of child labour and mainstreaming of out of school children and sanitation issues. As the VOs mature and grow in experience, they are likely to articulate and resolve larger number of issues. Experience of other states such as AP, Telangana, Kerala and Bihar suggests that the intensity of social issues taken up by the VOs will increase with community cadres/social capital gaining ground. The sample study also indicates that a large proportion of VOs were getting engaged in mobilization of left out poor, training of SHGs and convergent activities with PRIs and line department agencies (Annex Table7.19 & 7.20). 83 Table-7.21 Social Issues Taken up by VOs: Sample S. No. 1. 2. 3. 4. 5. 6. 7. 8. 9. 10. State Assam Bihar Chhattisgarh Gujarat Jharkhand Madhya Pradesh Maharashtra Odisha Rajasthan Total Total Sample 17 19 11 4 22 8 24 8 8 121 No of VOs taking up Social Issues 4 10 9 2 16 7 14 4 1 65 Percent 24 52 82 50 73 88 56 50 13 55 Source: Sample data Summary all Mission states are required to promote VOs in all villages with a minimum number of SHGs. VOs have been promoted in the project states right from FY 2011-12, but their promotion gathered momentum during FY 2013-14; a total of 13,450 VOs were formed in all project states up to Dec.’14, at an average rate of 36 per block; out of the 34,172 villages in which the implementation is in progress, only 39% had VOs and all the villages are expected to form VOs during the next 3 to 4 months; a total of 1.26 lakh SHGs have federated into the VOs (42% of the total SHGs), at an average rate of 9 per VO (12 in the sample clusters), with the inter-state variation reflecting the overall progress of IB in the states; while in the sample clusters, 55% of the SHGs had federated into the VOs; most of the VOs were nascent with 85% being less than 18 months of age (sample data); the relatively young VOs were however, practising all democratic norms as indicated by the regular conduct of EC meetings and the high proportion of SHGs (89% to 92% during Oct-Dec.’14) participating in such meetings; as apex federations at the village level, the VOs (61%) were undertaking review of performance of SHGs on a monthly basis using monthly report cards (Masik Prativedan). The VOs were also found instituting the sub-committee system. A significant proportion of VOs had loan repayment and bank linkage subcommittees. However, the sub-committee system needs to be strengthened with suitable capacity building and conduct of agenda based reviews; as most of the VOs were relatively young, only a small proportion of eligible SHGs was provided CIF up to Dec.’14 (while a substantial proportion of SHGs were directly provided CIF prior to the establishment of VOs). The VOs need to overcome constraints in the disbursement of CIF by having adequate number of 84 MCP trainers and instituting rapid MCP appraisal protocols. It is equally important for the VOs to institute appropriate systems for recovery of CIF given to the SHGs both prior to and after the formation of VOs. on the average, sample VOs provided an amount of Rs.39,368/- per SHG; the VOs have also started recovering CIF from the SHGs. The demand-collection balance during Oct-Dec.’14 shows an increasing trend with about 40% of the demand being recovered; the sample data indicates that on the average, each sample VO had a cumulative total receipt of Rs.3.79 lakh up to Dec.’14, indicating that the VOs are handling substantial funds, largely received as CIF; it is therefore important that this community fund is efficiently managed following all prudential norms such that it becomes a community fund in perpetuity; the status of bookkeeping in VOs was satisfactory with most books adopted being regularly updated. However, there is need for VOs to adopt all books of accounts and engage the services of trained bookkeepers to maintain them; apart from managing CIF, the VOs were also undertaking other tasks expected of them viz., mobilization of left out poor (63% of VOs), organizing training of SHGs (43% of VOs), undertaking convergent activities with PRIs (46% of VOs) and working with line departments (23% of VOs); and in order to improve the functional capacity of the VOs, the Mission units were organizing systematic immersion and exposure and training in management of VOs, bookkeeping, MCP appraisal and CIF management. Some VOs are also found training the sub-committee members. With the VOs progressively gaining control over the community staff and social capital, the functional capacity of the VOs are expected to grow rapidly. 85 Chapter–8 Promotion of Social Capital Introduction 8.1 The functional efficiency and long term sustainability of SHGs and their federations critically depend on the stock and quality of different types of social capital supporting them. Social capital in the context of NRLP comprises the SHG and federation bookkeepers, master bookkeepers, women activists, community resource persons, trainers, master trainers, livelihood para professionals etc. The availability and quality of different types of social capital are an essential prerequisite for nurturing and building the capacities of community institutions and their functionaries. Identification, training and use of social capital therefore assume importance, particularly in the initial phase of the project. Generation of adequate quality social capital assumes greater significance in the context of scaling up of NRLM. The strategy of resource blocks is designed to generate adequate social capital to catalyse social mobilisation and institution building in other blocks. The NRO supported resource blocks are expected to identify, train and prepare internal community resource persons who would undertake social mobilisation and institution building in other blocks. The rate of generation of internal resource persons is thus a critical determinant of the rate of expansion of the Mission. From this perspective, this chapter examines the quantity of cognitive social capital identified, trained and used in the resource and intensive blocks for promoting bonding and bridging social capital (SHGs and their federations) on the basis of state MIS and sample data. Overall Availability of Social Capital in NRLP States 8.2 The availability of SHG bookkeepers, women activists and internal CRPs working with the SHGs in the project states is summarized in Table-8.1. Each SHG is required to have a trained bookkeeper, paid or honorary, to maintain the books of accounts of the SHGs. One of the members can be a bookkeeper. A trained bookkeeper can provide bookkeeping services for more than one SHG. Different states have different systems of deployment of bookkeepers. Some state Missions such as Bihar, Gujarat and Odisha hire the services of SHG-bookkeepers paid for by the Mission units or from out of the funds provided to the federations, while in most states bookkeepers are paid small honorarium by the SHGs. The MIS data suggests that in the states of Maharashtra, Assam and Tamil Nadu, each SHG has a separate bookkeeper. In Chhattisgarh, Jharkhand, Karnataka, Madhya Pradesh and Rajasthan, there is a bookkeeper for 2 to 3 SHGs. In Bihar, Gujarat and Odisha, the SHG bookkeeper ratio is adverse. The number of SHG bookkeepers reported to be working in each block on the average indicates a great degree of diversity. It may be noted that the resource blocks states of Chhattisgarh, Jharkhand, Madhya Pradesh and Maharashtra, besides Tamil Nadu have a favourable number of bookkeepers per block. This is clearly due to the special efforts made in the resource blocks of these states to identify, train and use the services of bookkeepers and the social capital generated under the EAPs implemented in some of these states. 86 8.3 All project states have adopted policies for identification and use of women activists who facilitate conduct of SHG meetings and build their capacities. However, there is variation across the states in the use of social capital. Not all women activists are paid regular honorarium by the Mission units or the SHGs. The inter-state picture indicates that in the states of Bihar, Jharkhand, Chhattisgarh, Gujarat, Madhya Pradesh and Maharashtra, the number of women activists identified and working is relatively large. In the resource block states as well as those with the legacy of EAPs, the presence of activists is larger. There is no uniformity in the terms and conditions of work of different types of women activists and the honorarium paid to them. 8.4 Internal CRPs identified, trained and working in NRLP states also reveals a great deal of diversity. In Assam, Bihar, Karnataka, Rajasthan and Tamil Nadu, the number of internal CRPs reported to be working is relatively higher. In the resource block states, however, the number is low, as most of the internal resource persons identified and trained in the resource blocks have not started their work in the native blocks or other blocks. Table-8.1 Social Capital Engaged in Project States Bookkeepers Working S. No. State Sample Blocks SHGs Per BK Bookkeeper s Per Block Women Activists Identified and Working Women SHGs Per Activist Women s Per Activist Block 0 0 Dec.’14 Internal CRPs Trained & Working Interna SHGs l CRPs Per Per CRP Block 68 28 1. Assam 25 1 1603 2. Bihar 77 10 96 39 24 34 27 3. Chhattisgarh 16 2 390 7 89 0 0 4. Gujarat 20 27 31 9 97 0 0 5. Jharkhand 29 3 169 10 50 100 5 6. 20 4 63 0 0 14 19 46 2 350 4 193 4 195 8. 9. Karnataka Madhya Pradesh Maharashtra Odisha 36 28 1 26 545 28 13 0 48 0 316 39 2 19 10. Rajasthan 7 2 123 22 12 13 20 11. Tamil Nadu 16 1 453 1 570 53 10 12. Uttar Pradesh 22 20 10 44 4 0 0 7. 39 34 0 0 361 4 13. West Bengal 32 3 284 11 71 22 35 14. Total 374 Note: Data for Madhya Pradesh and Tamil Nadu includes the social capital from the EAP areas of sample blocks as well. In Assam, SHG bookkeepers reported are not regularly providing services as their honorarium is not paid regularly. Source: State Information Reports 87 Availability of Bookkeepers in Resource Blocks: Sample Data 8.5 As stated before, each SHG ideally has a trained bookkeeper to maintain the books of accounts and other transactions regularly. Sample data collected from 30 resource block clusters in which implementation is in progress reveals that out of 5,893 SHGs requiring bookkeepers, only 4,711 bookkeepers were identified, of whom only 3,223 were reported to be providing bookkeeping services. This constitutes only 56% of the required number. Interaction with the block teams and CRPs indicates that a significant number of bookkeepers have withdrawn their services, some after receiving training due to low and irregular payment of honorarium, migration of bookkeepers, and other alternative work opportunities for the bookkeepers. FGDs with frontline staff in the sample districts also indicates that the quality of bookkeeping leaves a scope for improvement in three dimensions viz., completeness, correctness and consistency. The FGDs also brought out the need for training/re-training all bookkeepers besides instituting the system of master bookkeepers providing continuous handholding support. The methods and processes adopted for identification of bookkeepers is summarized in Annex-12. Table-8.2 SHG Bookkeeper Services Available: Sample Resource Block Clusters Dec.’14 No. of SHG Book Keepers S. No State Sample Blocks Chhattisgarh 2 1. Jharkhand 4 2. Maharashtra 4 3. MP 3 4. Rajasthan 2 5. Total 6. 15 Source: Cluster sample data Total Sample SHGs in Percent of Clusters Sample Required Identified Working BKs Clusters Working 4 8 8 6 4 30 983 1633 1324 1487 466 5893 983 1633 1324 1487 466 5893 918 1481 1192 915 205 4711 531 871 1044 693 84 3223 58 54 79 47 18 56 8.6 The availability of bookkeepers in the total sample (including resource blocks) also reveals similar trends. While Bihar, Chhattisgarh, Jharkhand, Maharashtra, MP, Odisha and Tamil Nadu are relatively better placed, the states of Gujarat, Rajasthan and Assam have very negligible proportion of bookkeepers working. In Assam, it is reported that a vast majority of bookkeepers have discontinued their services during the last 6 months due to a drastic change in the policy of payment of honorarium to the bookkeepers by the Mission unit. 88 Table-8.3 SHG Book Keepers Services Available: Total Sample No of SHG Book Keepers Total SHGs Sample Sample State in Sample Percent Blocks Clusters Required Identified Working Clusters Working 2 4 1 Assam 1431 1431 762 123 9 2 Bihar 5 10 4582 4582 513 469 10 3 Chhattisgarh 3 6 1310 1310 1198 781 60 4 Gujarat 2 3 989 989 60 NA NA 5 Jharkhand 6 10 2409 2409 2257 1172 49 6 Maharashtra 6 12 2056 2056 1920 1747 85 7 MP 5 10 2475 2475 1334 1075 43 8 Odisha 2 2 494 494 57 33 7 9 Rajasthan 2 4 466 466 205 84 18 10 Tamil Nadu 2 4 1053 1053 46 23 2 11 Total 35 65 17265 17265 8352 5507 32 Notes: (1) NA – Not Available; (2) In Tamil Nadu and Odisha, book-keepers maintained accounts for multiple SHGs. Source: Cluster sample data S. No MCP Trainers 8.7 The second important community cadre required for the Mission states is the MCP trainers. Each eligible SHG is required to be trained in MCP in a participatory manner to enable it to prepare an MCP for accessing CIF. The state Missions are required to identify and train one person per village in the preparation of MCP who would in turn undertake training of the SHGs in the village. Thus, in the 30 sample clusters of resource blocks, 200 MCP trainers are required to be identified and trained. However, only 159 persons were identified and trained, of whom only 80 were found to be working. This constitutes only 40% of the requirement. This could be due to delays in the identification of eligible SHGs for CIF as well. Table-8.4 MCP Trainers Availability: Sample Resource Block Clusters S. No. State Sample Blocks 2 1. Chhattisgarh 4 2. Jharkhand 4 3. Maharashtra 3 4. MP 2 5. Rajasthan 6. Total 15 Source: Cluster sample data Sample Clusters 4 8 8 6 4 30 No of MCP Trainers Required (villages) Identified Working Percent Working 30 40 73 37 20 200 25 32 66 24 12 159 17 18 27 18 0 80 57 45 37 49 0 40 8.8 The availability of MCP trainers and their working status also reveals similar trends when the total sample too is considered. Only 41% of the MCP trainers required 89 were found to be working in the sample clusters. The sample data for Bihar and Rajasthan indicates that the MCP trainers are not working in the sample clusters. Table-8.5 MCP Trainers Availability: Total Cluster Sample S. No State 1. 2. 3. 4. 5. 6. Sample Sample Blocks Clusters Total No of MCP Trainers SHGs in Sample Required Identified Working Clusters 1431 12 12 12 4582 16 10 0 1310 52 36 28 989 40 20 0 2409 136 63 49 2056 112 105 55 Percent Working Assam 2 4 100 Bihar 5 10 0 Chhattisgarh 3 6 54 Gujarat 2 3 0 Jharkhand 6 10 36 Maharashtra 6 12 49 Madhya 7. 5 10 2475 57 36 30 53 Pradesh 8. Odisha 2 2 494 63 63 34 54 9. Rajasthan 2 4 466 20 12 0 0 33 61 16212 508 357 208 41 10. Total Source: Cluster Sample Data, includes both intensive, partnership and resource block sample VO Bookkeepers 8.9 VO bookkeepers constitute another important form of social capital that needs to be identified, trained and used in all villages with VOs. In the resource blocks, the external CRPs and PRPs facilitate identification and initial training of VO bookkeepers. In the other blocks, the frontline staff are required to identify the VO bookkeepers through a transparent process and provide them training before making use of their services. The sample data from 187 VOs of 5 resource block states reveals that Chhattisgarh and Jharkhand, the two leading resource block states have 100% VO bookkeepers working, while Maharashtra is catching up slowly with 57% of the required bookkeepers in place. In MP, VOs were yet to be formed in the sample clusters and as such identification of bookkeepers was not taken up. In Rajasthan, identification of bookkeepers is completed in 15 VOs but the training needs to be undertaken. 90 Table-8.6 VO Bookkeepers Available: Sample Clusters in Resource Blocks Total VOs No of VO Book Keepers in the State Percent Sample Required Identified Working Working Clusters 2 4 Chhattisgarh 45 45 45 100 1. 45 4 8 65 36 36 36 100 2. Jharkhand 4 8 74 61 42 57 3. Maharashtra 62 3 6 0 0 0 0 0 4. MP Rajasthan 2 4 15 21 15 0 0 5. 187 176 157 123 70 6. Total 15 30 Notes: (1) In Madhya Pradesh, VOs were not promoted in the resource blocks up to Dec.’14. (2) In Rajasthan, bookkeepers were identified but remained to be trained and used. Source: Cluster Sample Data S. No Sample Sample Blocks Clusters 8.10 Overall sample also reveals similar trends with Assam, Gujarat, Rajasthan and Odisha lagging behind in the identification, training and use of bookkeepers. On the whole, however, the states are likely to catch up with the identification, training and use of bookkeepers in tune with the formation of VOs. Table-8.7 VO Bookkeepers Available: Total Cluster Sample S. No. 1. 2. 3. 4. 5. 6. State Sample Sample Blocks Clusters Total No of VO Book Keepers VOs in Percent the Required Identified Working Working Sample Clusters 98 98 17 0 0 284 284 56 55 19 45 45 45 45 100 23 23 11 0 0 95 95 54 49 52 111 111 107 81 73 Assam 2 4 Bihar 5 10 Chhattisgarh 3 6 Gujarat 2 3 Jharkhand 6 10 Maharashtra 6 12 Madhya 7. 5 10 99 99 83 47 47 Pradesh 8. Odisha 2 2 7 7 7 3 43 9. Rajasthan 2 4 15 15 15 0 0 33 61 777 777 395 280 36 10. Total Notes: (1) Sample includes both resource blocks and intensive and partnership blocks. (2) In Chhattisgarh, VOs were not formed in intensive blocks up to Dec.’14. (3) In Gujarat, Rajasthan and Assam, VO bookkeepers were identified but remained to be trained and used. Source: Cluster Sample 91 All Community Cadres 8.11 All community cadres required were estimated for 65 sample clusters in which field study was conducted. The estimated number as per the norms adopted was 16,457 of whom, 76% were reported to have been identified and 67% trained and 50% currently engaged. While this is promising, the real challenge is to ensure that all community cadres identified and trained continue to provide services to the institutions. 8.12 This in turn calls for a suitable policy to ensure payment of appropriate compensation to each cadre for the service rendered. However at present, there is lack of uniformity in the compensation system. For example, Bihar, Jharkhand, Chhattisgarh and MP are making payment of honorarium to the bookkeepers from funds provided by the project to the SHGs. In Odisha, payment to bookkeepers is done on task basis for which GPLF makes payment of honorarium from the IB, CB fund. A bookkeeper is paid Rs.20/- per meeting. In Rajasthan, only some SHGs pay Rs.10/- per meeting from their own funds. In Gujarat, West Bengal, Karnataka and Uttar Pradesh, there is no protocol at present. The methods and processes adopted for identification, training and deployment of internal CRPs and active women is summarized in Annex-13. Table-8.8 All Community Cadres Required, Identified, Trained and Engaged: Total Sample Dec.’14 S. No State Percent of All Cadres Total Sample Clusters Total Community Cadre Required* Identified Trained Engaged 1. Assam 4 1561 53 42 11 2. Bihar 10 911 90 85 74 3. Chhattisgarh 6 1675 90 85 60 4. Gujarat 3 213 58 34 0 5. Jharkhand 10 3786 84 73 48 6. Maharashtra 12 2878 90 78 75 7. MP 10 4088 59 54 42 8. Odisha 2 222 94 65 48 9. Rajasthan 4 608 53 38 16 10. Total 61 15942 76 67 50 Notes: (1) * includes SHG bookkeepers @ 1 per SHG, women activists @ 2 per village, MCP trainers @ 1 per village, PIP facilitators @ 1 per village, VO animator/facilitator @ 1 per VO, VO bookkeeper @ 1 per VO, MBKs @ 1 per cluster. Source: Cluster sample data. 92 Community Cadre Engaged by Sample VOs 8.13 All VOs promoted by the state Missions are expected to hire essential community cadre through a transparent process and make them suitable compensation. The VO cadre includes animators, VO bookkeepers, MCP trainers, and community auditors. The VOs are required to facilitate their training with the support of the Mission before engaging their services. Out of 125 sample VOs, 103 had community cadres. However, there were variations across the states in terms of the number as well as types of cadres engaged. Bookkeepers, MCP trainers and activists/facilitators are common across most VOs. Table-8.9 Community Cadre Engaged by Sample VOs No. of Community Cadre No. of VOs with Community Percentage Engaged Paid Cadre Paid 17 9 9 0 0 1. Assam 19 19 70 53 76 2. Bihar 11 11 33 24 73 3. Chhattisgarh Gujarat 4 0 0 0 NA 4. 17 16 84 47 56 5. Jharkhand 8 7 41 0 0 6. Madhya Pradesh Maharashtra 16 16 80 28 35 7. 8 0 0 0 NA 8. Odisha 8 8 45 0 0 9. Rajasthan Total 108 86 362 152 42 Notes: (1) VO community cadre includes VO animators, VO bookkeepers, MCP trainers, community auditors etc., who are paid for by the VO; Source: Sample VO data S. No. State Sample VOs Summary 8.14 The functional efficiency and sustainability of SHGs and their federations and the livelihood outcomes expected of them depend on the stock and quality of different types of social capital supporting them. The strategy of resource blocks has been designed to generate adequate social capital to catalyse social mobilization, institution building and livelihood promotion in other blocks. In the context of NRLM, the social capital required for the community institutions include: (i) SHG bookkeepers, (ii) MCP trainers; (iii) women activists; (iv) VO bookkeepers; (v) VO animators; and (vi) internal CRPs. The MIS data indicates that on the average there were: 284 SHG bookkeepers per block at the rate of 3 SHGs per bookkeeper; 71 women activists per block at the rate of 1 per 11 SHGs; and 35 internal CRPs per block at the rate of 1 per 22 SHGs (while Chhattisgarh has trained internal CRPs who will be deployed shortly). 93 8.15 Further, the sample data indicates that the following forms of social capital required were available: 56% of the SHG bookkeepers in resource blocks and 52% in intensive blocks; 40% of the MCP trainers in resource blocks and 41% in intensive blocks; 70% of VO bookkeepers in resource blocks and 37% in intensive blocks; and 50% of all community cadres. 8.16 Considering the age of the VOs and other institutions, the size and diversity of the social capital available in terms of SHG bookkeepers and VO bookkeepers appears to be satisfactory, if not adequate. However, the number of MCP trainers and internal CRPs needs to be augmented significantly to meet the growing requirements of the Mission. The internal CRPs and women activists identified in the resource blocks are also required to be trained fully and their services utilized optimally in the scaling-up process. Further, the real challenge is to ensure that all community cadres identified are adequately trained and those trained and engaged continue to provide services to the institutions. This in turn calls for a suitable policy to ensure payment of appropriate compensation to each cadre for the service rendered across the states. 94 PART-II MKSP & CMSA2 2 Contributed by Livelihoods Group of NMMU 95 Chapter 9: Process Study: MKSP Intervention Report on Focus Group Discussion in Bihar, Maharashtra, Odisha, West Bengal and Madhya Pradesh 96 1. Focussed Group Discussion Plan FGDs were conducted with women farmers in the MKSP areas wherein officials from NMMU, SMMU and teams of district and block were also present. In the FGD discussions were carried out on the issues relating to practices being adopted and challenges faced by women farmers in implementation of MKSP. The discussion focussed on understanding Ultra-poor strategy roll out protocols, as perceived by the targeted households. The objective of this exercise was to understand the perception of SHG members towards the existing protocols, and, also the factors that have fashioned the existing perceptions. In the course of discussions, the difference between the practices adopted under MKSP and traditional method of farming in the village, was discussed, with a focus on understanding the rationale for adopting or not adopting a given practice by a poor household. The MKSP intervention areas where the FGDs were conducted are as follows: S. No. 1 2 State MKSP partner ASA Madhyam Foundation District Block Jamui Malkangiri Madhya Pradesh PRADAN Mandla Maharashtra West Bengal MSSRF LKP Wardha Birbhum Chakai Rajasarai Kudumulugumma *FGD was conducted in PRADAN Office Narayanganj *FGD was conducted in Narayanganj PRADAN Office Wardha Sonegaon Mohammad Bhutara Bazar 3 4 5 Bihar Odisha Village 2. Participants This discussion was conducted with the randomly selected SHG members from each of the selected villages (selection of villages was done on the basis of systematic random sampling of 3 villages from each cluster of given block). This discussion was facilitated by the NMMU representative with the support of BMMU staff. The other officials from SMMU and DMMU were invited to the discussion as observers. 3. Process study based on the probing points 3.1 Topic 1: USP of the package of practices promoted under MKSP for the rural poor households Probe: Uniqueness of the package of practices, constraints etc. 97 3.1.1 Discussions: The key package of practices promoted by MKSP partners are around seed management, soil health management, in-situ moisture conservation, disease and pest management which vary across PIAs and states. The major discussion areas revolved around: 1. The different critical stages of cultivation of existing crops 2. Comparison of input requirements 3. Cost implications of adopting sustainable agriculture practices for a given crop, vis a vis, the existing practice 4. Seed management, soil health management, in-situ moisture conservation, disease and pest management 3.1.2 Observations During the FGD it emerged that sustainable agriculture practices were promoted at three levels; pre-production, production, post production. The Mahila Kisans have been practicing deep summer ploughing, local seed selection, seed treatment from Beejamruth and soil health management through Jeevamruth and compost. At production level crop specific protocol developed by MKSP PIAs like SRI, SWI, line sowing in maize, kitchen garden etc. are being practiced. As a part of postproduction process, sorting & grading of vegetables, zero energy cool chamber, proper and scientific method of harvesting are followed by the Mahila Kisans. For disease and pest management, plant, cow dung & urine based inoculants are being practiced. In many cases it was observed that these protocols were not universalized with all the farmers. It also emerged that the demonstration for 2-3 times helps women farmers to understand and adopt the eco-agriculture practices. 3.1.3 Issues With many of the PIAs a complete technical protocol is absent Understanding of the benefit of each component of protocol is not clear to the community. Understanding of the holistic view of agro-ecology as innovative concept in sustainable agriculture is not clear to the community and it appears as a piece meal approach in many cases. 3.2 Topic 2: Training & Capacity building of women farmers in the package of practices- Tools and methodologies adopted for training women farmers Probe: The different types of training (classroom, FFS, Field demonstrations etc.) received, Role of MKSP partners and trainers in building capacity, factors affecting training, perceived gaps in training 98 3.2.1 Discussions: 1. CRP selection process 2. The different techniques adopted by the CRPs and project staff for generating awareness around the existing protocols 3. The perception of Mahila Kisan, vis a vis the different training techniques adopted. 4. The perceived ease of understanding the different protocols through different tools/technique employed 5. The apprehension of households with respect to the different package of practices promoted 6. Issues 3.2.2 Observations The observations which are common across MKSP partners are as follows: 1. CRP identification and training process: Most of the PIAs are found to have a well - defined CRP identification, selection and training process 2. Community training is undertaken by CRPs and project staff In Odisha, Madhyam Foundation The criteria of CRP identification process is from the same village, active farmer, able to read & write, less than 50 years of old, attitude to convince and motivate others. The information for search for CRPs is given through SHGs in the Panchyat, Village, Community Hall, Project Office. The SHG leaders and the team of Madhyam Foundation is selecting the CRPs based on the discussion/interview with the interested CRPs and also a feedback from SHG women is also being taken. Training of trainers have been organized for the newly selected CRPs. The ToT includes class room training, audio visual shows, on-field demonstration and distribution & use of IEC materials. The CRPs are also going to best practicing cites for exposure and then deployed to train and handhold Mahila Kisans to adopt eco-agriculture practices. For every 50 Households a CRP is identified and placed. CRPs have also trained the Mahila Kisans for 2-3 days a month for all the 12 months in a year apart from handholding to adopt best practices on eco-agriculture practices. In ASA (Bihar), the women farmer were imparted classroom training, on field demonstration, demonstration and training during the crop cutting. The training is imparted by the field coordinator and staff on seed treatment, system of root intensification in rice, maize and wheat and kitchen gardening in the intervention villages. ASA (the MKSP partner) from each intervention village identifies at least 2 active farmers and train and groom them to be ‘VRPs’ who are basically community best practioner. The VRP selection is finally done based on small test on SHG and its concepts and agriculture practices. The selected VRPs are taken on 99 exposure visit and imparted a 7 days training at ASA office in Madhya Pradesh. The VRP is trained on SHG book keeping, different government programmes such as MNREGA and agriculture intervention. The VRPs provide handholding support to the community members for scaling up of agriculture intervention. The perceived gaps as emerged during discussions is of follow up training on agriculture interventions. On the training needs, it was suggested by FGD group members training on the methods for water conservation as water availability was the major issue in the intervention villages. In Maharashtra, MSSRF promotes good quality training programmes in class-rooms, audio visuals prepared by Digital Green, Practice Sessions, demonstration and handholding. A 2-3 days training per month for all the women farmers being imparted by the CRPs and similarly 2 days training programme per month for all the CRPs being imparted by MSSRF staffs. However, all the Mahila Kisans have spelt out clearly that demonstration and audio-visual based training programme are the most effective training programmes.The training is imparted around seed and soil management practices, bio-pesticide, proper time and method of harvesting, cleaning, grading and storage, soil and Water conservation, INM, IPM and postharvest management. At PRADAN (MP), the CRPs conducted farmer field schools for the farmers to learn techniques and also demonstrated in their field. They visited fields of the farmers periodically and helped farmers to solve problems with current practices and pest infestations. Project staff well equipped in social as well as agriculture science facilitated knowledge building/ capacity building of the farmers. CRPs were provided intensive trainings and they attend periodic review cum planning in the field offices. The CRPs were trained at different phases. Their training included in house training and as well as field training. This included classroom training sessions interspersed with field visit on knowledge dissemination on soil identification, plant structure, seed testing, nursery raising, transplanting of nursery, irrigation, pest management, disease identification etc. through audio, video and theoretical aids. Besides the theoretical training ‘Ek ropa dhaan’ movie was also shown to the CRPs for knowledge on POP for SRI. Besides that they were also provided technical skills which included use of machinery like thresher, weeder, treadle pump, paddy cutter etc. The CRPs were given on field training with live demonstration on identifying disease and pest. They also underwent a small test after the training to measure their understanding. After this they are given printed materials so that they can read, relate and use the knowledge. In West Bengal, training was provided through class room teaching, reading materials, audio visual kits, Field demonstration, exposure visits. For adoption input support was facilitated. The training was imparted by the Project staff and CRPs. 100 LKP facilitated community to select best practitioners as CRPs based on recommendation of federation and PRI. The selected CRPs were imparted training at district and the block levels by the expertise available with LKP as well as through external learning through exposure visit. The CRPs were trained on Preparations of Micro plans, Non – pesticide management, Soil fertility management Multi-tier / poly crop models, Root Intensifications, Effective utilization of inputs etc.The CRPs provided support to the Mahila Kisan in adoption of sustainable best practices, organize regular meeting with the women farmers, document the local innovative best practices / case studies in the area. On the training needs, it was suggested by FGD group members more training on the methods for water conservation as water availability was the major issue in the intervention villages. 3.2.3 Issues a. CRPs should be from the same village. b. In the selection process, the definition of best practicing farmer is not clear. c. CRP to Mahila Kisan ratio should be maintained and it was observed that at some places a single CRP was assigned for livelihoods, social and other issues. Also, in many cases it was observed one CRP is taking care of more than one village. d. CRPs need to be trained on all aspects of package of practice i.e. seed management, soil health management, in-situ moisture conservation, disease and pest management. e. Standardisation of training material for training of CRP, community and staff needs to be done as it was observed that communication material has been referred to training material in many cases. 3.3 Topic 3: Exposure of women farmers to best practice sites Probes: No. of exposure trips undertaken vis a vis the approved plan, Impact of exposure to best practice sites on boosting adoption of a package of practice, constraints, plans Most of the PIAs have exposure visit as part of the training program for Mahila Kisan and CRP to the nearby villages, districts and other states. In Madhyam Foundation (Odisha), the exposure program for women farmers have also been organized systematically. 1-2 women farmers have got the exposure to Jeevan Jyoti Vegetable Growers Cooperative in Kodabhata, Mathili block, Malkangiri district. Another set of group of Mahila Kisans have gone to Brundabati Vegetable Growers Cooperative in Maliguda Udulubeda, Mathili block, Malkangiri district. Few Mahila Kisans have also gone for exposure to individual farm on vegetable cultivation in Nandanban area, Chhattisgarh. Different kinds of exposure 101 is also organized during the System of Rice Intensification during panicle initiation & harvesting (operational area of Pragati in Kotpad), zero energy cool chamber, application and impact of Jeevamruta, Handikhata, Hadari, Amruta Mati & Amruta Pani. The PRPs for every 300 households have also gone to Sambhav, an organic farming institution at Rohibanka, Nayagarh. In MSSRF (Maharashtra), the identified CRPs and women farmers have visited model farm on sustainable agriculture of Subhash Sharma and Ramesh Sakharkar. Exposure is also being organized locally on poly-house, soil and water conservation, warehouse management, exposure to soil and water conservation field, IPM and INM practised field, Agriculture produce marketing committee management. Exposure on Subhash Sharma and Ramesh Sakharkar is found to be more effective expressed by all the active women farmers. At ASA (Bihar), 1-2 women farmers from each village were taken to the exposure visit to the nearby villages of the same block. The VRPs were taken to the best practice sites to other states (Jharkhand and MP). During the FGD discussion it emerged that on an average 15-20 days training in a year is imparted the VRP on agriculture intervention. The members who were taken on exposure visits had better understanding of the SHG processes and agriculture intervention concepts than their village counterparts. Issues: 1. It is not clear whether the PIA holds the exposure visit around the package of practice or it is a general exposure. The learning objectives of exposure visits are to be clearly defined and should be around a protocol of agroecology, The PIA needs to have frequent exposure visit of the community members and not just the CRPs to the best practicing sites. 3.4 Topic 4: Tools and methodologies adopted for training women farmers Probes: Different tools employed for training (charts, video films etc.), Efficiency of different training tools towards boosting adoption of package of practices MKSP partners have used wide array of tools and methodology for training CRPs and community members including the audio-visuals using pico-projectors, flipcharts, charts/posters, leaflets etc. The training was also of different types: class room training, on field training and exposure visits. Madhyam Foundation has used on-field demonstration, audio-visual shows, IEC materials on crop planning to break the mono-crop method of farming and on vegetable crop cycle. The audio-visuals prepared by Centre for World Solidarity and Madhyam Foundation are displayed through Projector and PICO-Projector. The PRPs and CRPs says the IEC materials such as leaflets and booklets remain a very 102 good ready reckoner for training and adoption be eco-agriculture practices and follow ups. Tools and methodologies used by MSSRF (Mah) includes audio-visuals, flip-charts, interactive sessions, exposure within clusters and demonstration is being adopted. At ASA (Bihar), it was observed that on field demonstration of equipment usage and agriculture practice was done by the project staff and village resource person (VRP). For class room based training, training through flip-charts were done and video-films of Digital GREEN were also demonstrated on lap tops and picoprojectors. It emerged from the discussions that on-field demonstration was more effective for understanding of the concept and adoption of best practices. At PRADAN (MP), classroom training sessions interspersed with field visit on knowledge dissemination on soil identification, plant structure, seed testing, nursery raising, transplanting of nursery, irrigation, pest management, disease identification etc is imparted supported with audio, video and theoretical aids. At LKP (West Bengal), it was observed that on field demonstration was done by the project staff and CRP. For class room based training, training through flip-charts were done and video-films were shown. Issues: 1. The training architecture (schedule, module and curriculum) appears to be missing in most cases. 2. Refresher training of the CRPs and the community members needs to be reinforced. 3.5 Topic 5: Benefits to a household covered under MKSP Probe: Reduction in the cost of cultivation, increase in household income, additional food security, any other benefit at the household level. During the FGDs, observation common to all PIAs the increase in income was due to: a. Increase in yield Increase in yield of paddy (1.5 to 2 times) from the same plot as it was observed in case of ASA (Bihar). b. Reduction in input cost due to less seed rate, high tiller count in case of paddy thereby reducing the input cost and increased yield. Saving in costs was also due to less expenditure on food grains and vegetable purchase from market. c. Due to crop planning; mono crops have been changed to multiple crops in 2 seasons and in some places, due to assured irrigation; 3 seasons crops also being grown. 103 d. Food security cover increased owing to increased yield and the grains produced from paddy, maize, wheat and vegetable cultivation. e. Nutrition level improved due to increase in vegetable consumption as more vegetable were produced. f. The Mahila Kisans also mentioned the drudgery reduction after using the cono-weeder compared to the earlier practice of weeding manually. Issue: 1. PIA should have a clear strategy to highlight the benefit to the community. Understanding of the benefit of each element of protocol is not clear to the community. A strong facilitation process should be introduced to discuss these points. 2. Mahila Kisan Card should be introduced at farmer level which will help to capture the details of benefit. 3. Understanding of the holistic view of agro-ecology as innovative concept in sustainable agriculture is not clear to the community and the benefits due to soil and in situ water conservation, bio-pesticides and bio-fertilizers need to be explained to community in Farmer Field School, SHG meeting etc. 3.6 Topic 6: Perceived progress of implementation Probes: No. of households covered against the population of all households in the village, No. of ultra-poor households covered under MKSP in the village vis a vis the no. of existing vulnerable households, No. of households adopting at least two package of practices etc. The agro-ecology practices under MKSP is not very widely spread in the intervention villages though adoption of 2 components of package of practices is almost universal for all the women farmers intervened. Issues: 1. The horizontal expansion is still not very encouraging. It is expected that by seeing the best practices being adopted by MKSP farmers other farmers in the same intervention village would adopt the practice but which is not being observed. 2. Similarly, the number of famers doing all package of practice promoted under agro-ecology protocol is very negligible. 3.7 Topic 7: No. of CRPs deployed in the village, for scaling up best practices to other areas Probes: Number of active women farmers identified, role of CRPs in boosting adoption of different package of practices, No. of days of training received by the active women, factors affecting selection and training of active women for greater role in scaling up Ultra-poor strategy etc. 104 Ideally there should be good number of active women farmers in every intervention village which was not observed. Also, there should be one CRP for every 50 Mahila Kisan which was also not universal. It was also observed that the role of the CRP is not restricted to supporting agriculture intervention but the SHG book keeping and accounting and social mobilization as well. However promotion and deployment of CRP is not happening as desired. 3.8 Topic 8: Perceived overall progress of implementation Probes: Perceived Key areas in which progress is not satisfactory, reasons thereof and tasks ahead. 1. For the start-up of any livelihood intervention in a village, a critical mass in terms of number of active women and community members taking up intervention needs to be achieved. It was observed women farmers are thinly spread across villages i.e. deepening of activities in a village needs to be strengthened. 2. It was observed that multipurpose CRPs may not be useful and a dedicated livelihood CRP is required for scaling up of livelihood intervention. 3. Besides, the farmer level tracking of information is missing and making Mahila Kisan card compulsory for tracking the benefit and impact may be done. 4. Institutionalizing Farmer Field School (FFS) should be a regular affair. 5. Embedding discussion of livelihood intervention in generic institution agenda may be useful. 6. Organizing producers (Mahila Kisan) around similar livelihood activity may be focussed. 3.9 Topic 9: Perceived overall benefits under MKSP Probes: Key benefits to the poor households covered under MKSP The perceived key benefits to the Mahila Kisans covered under MKSP programme was increased yield of foodgrains, decreased cost of cultivation in terms of reduced labour and input cost, enhanced food security and drudgery reduction. 3.10 Topic 10: Perceived constraints in implementation of MKSP Probes: Key constraints and obstacles that have affected the pace and progress of implementation 1. From the PIA point of view the perceived constraint in the pace and progress of MKSP was the lack of timely fund release (central share and the state share). 2. Natural calamities like Cyclone, delayed onset of monsoon and dry spell in the critical stages of crops. 105 3. It emerged from discussions that a dedicated community resource person for proposed agriculture intervention would have expedited the scaling up of agricultural activities. 4. Unavailability of quality bio pesticide and bio fertilizers, less availability organic manure (due to less number of cattle in that geographical area) 106 Chapter 10 Process Study: CMSA Intervention Report on Focus Group Discussion in Chhattisgarh, Jharkhand and Madhya Pradesh 107 1. Focussed Group Discussion (FGD) Plan FGDs were conducted with women farmers in the CMSA areas wherein officials from NMMU, SMMU and project teams of district and block were also present. The FGDs were carried out on the issues relating to practices being adopted and challenges faced by women farmers in implementation of CMSA. The discussion focussed on understanding Ultra-poor strategy roll out protocols, as perceived by the targeted households. The objective of this exercise was to understand the various processes taken up under the ‘ultra poor strategy’ roll out for livelihoods promotion in resource blocks and assess their effectiveness. In the course of discussions, the difference between the practices adopted under CMSA and traditional method of farming in the village, was discussed, with a focus on understanding the rationale for adopting or not adopting a given practice by a poor household. The key intervention strategy adopted by NRLM is to deploy best practicing farmers as CRPs to work as extension workers to promote agroecology. The FGD also tried to assess the effectiveness of the CRPs in terms of promoting the practices. The intervention areas where the FGDs were conducted are as follows: S. No. 1 State District Block Village Chhattisgarh Rajnandgaon Rajnandgaon 2 Jharkhand West Singhbhum Goilkera Mudpar and Mokhla Jhilrua Condcuted By Jnanesh Jha KK Jha 2. Participants This discussion was conducted with the randomly selected SHG members from each of the selected villages (selection of villages was done on the basis of systematic random sampling of 3 villages from each cluster of given block). This discussion was facilitated by the NMMU representative with the support of BMMU staff. The other officials from SMMU and DMMU were invited to the discussion as observers. 3. Process study based on the probing points 3.1 Topic 1: USP of the package of practices promoted under CMSA for the rural poorhouseholds Probe: Uniqueness of the package of practices, constraints etc. 3.1.1 Discussions: The participants compared the existing practices vis a vis the CMSA technique, for the cultivation of crops popularly grown in the villages. The major discussion areas revolved around: 108 1. The different critical stages of cultivation of existing crops 2. Comparison of input requirements in the two techniques 3. Cost implications of adopting CMSA for a given crop, vis a vis, the existing practice 4. Comparison of production details on account of adoption of the two techniques 5. Technology and rationale 3.1.2 Observations The farmers found the agroecology highly beneficial against the current chemical input intensive agriculture. Agroecology a. Seed requirements for a given size of land have reduced significantly, so there is reduced expenditure on seeds. As seed prices have soared by almost 200% over last 2-3 years, the community found the cost reduction quite substantial. b. Under this technique, Seed treatment was done by Beejamruth, which enhanced seed germination. Therefore the local varieties also result in better yields. These seeds are locally available and cheap. Community valued the benefit on this account. c. Production is more when paddy was grown under SRI. On an average, the production has improved by 3-5 quintals per acre in case of paddy. d. Reduced dependence on market for agriculture inputs because all the agricultural inputs are prepared using locally available materials in the village. e. Less expenditure on fertilizers and chemicals for plant protection due to the use of organic insecticides (neemastra, brahmastra etc.) and fertilizers like jeevamruth etc. Current Practice a. Cost of cultivation increases due to more input requirements, particularly seeds. b. Since, the local varieties do not show good growth under this technique, the market is therefore flooded with hybrid varieties of seeds, which require high dose of fertilizers and pesticides to save them from pest attack to which the hybrid seeds are highly susceptible. c. Production is less as compared to CMSA d. Farmers are dependent on market completely for the chemical inputs. Besides, there is a huge shady market of fertilizers and pesticides where the premium over the government prices is almost 50% e. Huge investment on purchase of chemical fertilisers and pesticides as everything has to be purchased from market. 3.1.3 Issues: Collection of cow urine is a challenge. 109 Farmers need more labour if their area under CMSA practices is more (particularly in case of SRI, where transplantation has been promoted). In the peak season, the labour cost for this activity soars up. Practices under CMSA are more time consuming than the traditional method. Preparation of the different ingredients is a time consuming activity. 3.2 Topic 2: Training & Capacity building of women farmers in the package of practices- Tools and methodologies adopted for training women farmers Probe: Different tools employed for training (charts, video films etc.), Efficiency of training through video films vis a vis other traditional techniques on boosting adoption of package of practices 3.2.1 Discussions: 1. The different techniques adopted by the external CRPs for generating awareness around the existing protocols 2. The perception of targeted households, vis a vis the different training techniques adopted. 3. The perceived ease of understanding the different protocols through different tools/technique employed 4. The apprehension of households with respect to the different package of practices promoted 5. Issues 3.2.2 Observations The observations which are common across SRLMs are as follows: a. External CRPs from AP have extensively employed on field demonstrations and video presentations for the SHG members in the village for training of women farmers. b. Conduction of FFS and on field demonstration by CRPs were more useful and effective than any other method of training. c. Farmers’ Field schools are interesting training tools, since there is indepth discussion on the different protocols. Moreover, the best practicing farmers find these as effective platforms to demonstrate their experience and ingenuity. d. Flip charts, wall paintings, dummy training kits etc. are other effective training tools which have aroused interest in the targeted households. 3.2.3 Issues The recall for video demonstration was poor, though the video was an interesting way of presenting the practices. This suffered from the inability of CRP team to handle audio-visual training material effectively. 110 The training process faced some difficulties on account of the language barrier in the initial phase. It was observed that the CRPs who can comprehend/speak Hindi can explain the techniques in a better way. These CRPs could develop rapport with the women farmers. 3.3 Topic 3: Benefits if any, to a household covered under Ultra-poor strategy Probe: Reduction in the cost of cultivation, increase in household income, additional food security 3.3.1 Discussions a. The benefits accrued to a household on account of reduced cost of cultivation b. The benefits accrued to a household on account of increased production c. The benefits accrued to a household on account of construction of homestead nutrition gardens 3.3.2 Observation The observations across SRLMs are: a. Production has increased after adoption of CMSA practices for the households on account of the use of inputs prepared from naturally available materials. On an average, the paddy production has increased by 3-5 quintals/acre as observed in Rajnandgaon (Chhattisgarh). In West Singhbhum (Jharkhand), there has been increase in income per household due to focused CMSA intervention through CRPs. Normally farmers in the village practice broadcasting method for paddy and therefore when SRI was done productivity enhanced. b. In Jharkhand, NTFP and livestock based livelihoods interventions initiated in the same blocks. The SHG members found the training in better practices of inoculation and capacity building in scientific package of practices including harvesting technique very useful. Under livestock intervention of CMSA, SHG members involved in goat rearing were identified and trained as Pashu Sakhi to provide doorstep animal care services which resulted in reduced morbidity and mortality. c. In all SRLMs it was observed that purchase of chemical pesticides is not required as all botanical extracts are prepared out of materials available at home. This is important because, in the traditional method, a farmer had to increase the dose/concentration of chemical fertilizers/pesticides to have increased production. Since, the cost of chemical inputs had increased tremendously, the agriculture was highly unprofitable. Now the people find the agroecological practices beneficial in reducing cost. d. The technique of producing agricultural inputs is suitable to the agricultural requirements of a poor tribal household. 111 e. On an average, each household (adopters) could save INR 2000-2500 per acre, due to reduction in the cultivation cost as observed in Chhattisgarh. f. Due to extensive use of cow dung based inoculants, it was observed that there was greater retention of moisture (it was observed that there were fewer cracks during summer months in the current season). 3.4 Topic 4: Progress of implementation Probe: In terms of coverage of Ultra-poor households in the fold of Ultra-poor strategy, issues with adoption of a package of practices 3.4.1 Discussions 1. 2. 3. 4. The coverage of rural households under Ultra-poor strategy in the villages The discussions on the CMSA protocols in the institutions of poor, role played by the external CRPs to promote discussions in the SHG and VO meetings Required strategies for promoting deepening of adoption in the village Issues with scaling up of Ultra-poor strategies in the villages 3.4.2 Observations The observations which are common across SRLMs are as follows: a. The practices under the CMSA protocols were gradually evoking the interest of SHG members. Gradually, discussions have started in the SHGs on account of the excellent results observed by the SHG members during the different crop cutting experiments carried out in the presence of concerned SHG. b. The current focus is to include at least one SHG member from each SHG under the protocols of CMSA. c. It was understood that the best practitioners of the previous seasons will shoulder the responsibility of spreading awareness on the package of practices (by initiating discussions in their SHGs and VOs) and demonstrate the same on their own fields. d. Each individual will target adding 2 members of her SHG into the fold. e. It is important to constitute a team of 2-3 best practitioners of each village, who can tag along with the external CRP team, to help in promoting awareness generation (on account of their fluency in the local language and better understanding of the village setting), monitoring the quality of adoption of package of practices and scaling up. 3.4.3 Issues I. Chhattisgarh 112 a. The coverage of Ultra-poor households was less. This was because the practices promoted under Ultra-poor strategy were suitable for households with some assured irrigation source. This was unavailable with the households who were actually very poor. b. Since the animal population has been dwindling over the years, it will be difficult to procure the inputs at village level, when the adoption of package of practices increases. Also, every potential practitioner may not have the amount of time required to produce the botanical extracts required under this technique. Therefore it is important to establish shops in the village to sell the botanical extracts. Establishment of such shops can be taken up by individual SHG member (with Livestock assets) or managed by the VO through its team. II. Jharkhand a. Lack of irrigation facility is however a big constraint in taking up Kitchen garden/vegetable garden b. Lack of quality seeds is another constraint. 3.5 Topic 5: Role played by external CRP team in boosting adoption of package of practices Probe: Capability of an external CRPs to mobilize households towards Ultra-poor strategy, Efficiency of external CRPs in handling different types of trainings- FFS, Field demonstrations, class-room training, video-demonstration etc., perceived constraints 3.5.1 Discussions 1. The efforts made by the external CRPs to mobilize households towards the package of practices promoted under Ultra-poor strategy. 2. The capability of the CRPs to handle the different training tools 3. Perceived bottle-necks 3.5.2 Observations The observation common to SRLMs are as: a. The external CRPs were hard-working farmers who demonstrated the package of practices in the field of targeted households. The amount of dedication shown by the team was commendable. b. The genuineness of their efforts was the major attraction for the small holder farmers in the village. The CRPs have made excellent efforts towards rapport building with the villagers. c. The CRPs were more comfortable in demonstrating the protocols; therefore this technique drew the strongest response from the target household. 113 d. Other training techniques failed to evoke stronger response from the poor households on account of the inability of CRPs to communicate effectively. e. There were 2-3 early adopters and fast learners in the village, who could be trained as the local resource for the dissemination of best practice in the village. 114 Annexes 115 Annex-1 Districts and Blocks S. No. 1. 2. 3. 4. 5. 6. 7. 8. 9. 10. 11. 12. 13. 14. State Assam Bihar Chhattisgarh Gujarat Jharkhand Karnataka Madhya Pradesh Maharashtra Odisha Rajasthan Tamil Nadu Uttar Pradesh West Bengal Total No of DMMUs Approved 8 19 12 9 12 5 10 10 8 7 4 22 8 134 No of DMMUs Established 8 19 9 9 10 5 9 10 8 7 4 22 8 128 Dec.’14 No of BMMUs Established 25 77 16 20 29 20 46 36 28 7 16 22 32 374 116 Annex-2 HR Structure Recommended by NMMU Years of Experience State Mission Management Unit (SMMU) Chief Executive Officer/State Mission Director COO (Program Functions) Post-Graduate degree or 10+ years Diploma Addl COO/Jt MD/Addl CEO Post-Graduate degree or 10+ years (System Functions) Diploma State Mission Managers Post-Graduate degree or 7+ years Diploma Mission Managers Post-Graduate degree or 5+ years Diploma Mission Executives Post-Graduate degree or 3+ years Diploma Young Professionals/NRLM Post-Graduate degree or < 2 years Fellows Diploma Retainer Consultants (Category Graduate 5+ years Wise) Data Entry Operators/MIS Graduate 2+ years Assistant + Accountant District Mission Management Unit (DMMU) District Mission Manager Post-Graduate degree or 3+ years Diploma District Thematic Experts Post-Graduate degree or 2+ years Diploma Data Entry Operators/MIS Graduate 1+ years Assistant + Accountant Block Mission Management Unit (BMMU) Block Mission Manager Post-Graduate degree or 2+ years Diploma Block Thematic Experts Post-Graduate degree or 1+ years Diploma Community/Cluster Coordinators Graduate 1+ year Data Entry Operators/MIS Graduate 1+ years Assistant + Accountant Level Qualification Indicative Numbers 1 1 1 1–2 5–9 8 – 12 3–5 1–4 1 4–8 1–3 1 2- 4 3–9 1 -2 The staff of the SRLMs come through routes: a) Through open market b) On deputation from the government; and c) Staff from Externally Aided Projects 117 Hiring Process Hiring through open market: The SRLM issues an advertisement for the positions it wishes to hire for. The applications are then scrutinised by the SRLM/HR agency and the candidates meeting the eligibility criteria for the position are called for the next round of the selection process. In most SRLMs, the preliminary screening process is followed by a written test, group discussion and personal interview. The candidates are tested for their domain knowledge and managerial ability. In Karnataka, Jharkhand and Bihar, a field attachment is a part of the selection process for the block and cluster level positions. The selection panel usually consists of the SMD (for personal interview round), COO, the relevant thematic SPM, a representative from NMMU and a thematic expert. Hiring Government Staff on Deputation: Government staff on staff are selected either through advertisement or through a selection committee set up for this purpose. Chhattisgarh Jharkhand, Bihar and Karnataka Advertisement issued, applications invited Candidates filtered according to eligibility criteria for the post Shortlisted candidates called for next round of selection o Written test o Group Discussion o Personal Interview o Skill Test (for Clerical Positions) o Advertisement issued, applications invited o Candidates filtered according to eligibility criteria for the post o Shortlisted candidates called for next round of selection o Written test o Group Discussion o Personal Interview Field Stay for Block/Cluster level positions o o o 118 Annex-3 HR Hygiene Practices in NRLP States: A Summary Dec.’14 S No. 1 2 Area ASM JH BH CH RAJ MP KR WB GUJ OD TN MH Salary/ Remune ration Lower than market rate; disburs ement on time Close to market rate disburs ement on time Based on market rate; disburs ement on time Based on market rate; disburs ement on time Lower than market rate and delay in disburs ement for 1-2 months Lower than market rate and disburse ment made on time As per market rates SMMU disburs ement made on time for DMMU/ BMMU delay was 2 months SMMU as per market rate and DMMU and BMMU lower than market rate; Disburs ement on time Low er mar ket rate but on time pay men t Less than market rates (very low) and delay in disburs ement up to 15-20 days SMMU as per market rates. Lower for DMMU and BMMU. Disburs ement is on time Based on market rates and disburs ement is on time TA/DA As per state govt. rates. No provisio n for hotel stay. Delay Based on market rates and reimbur sement is on time Based on market rate and reimbur sement on time Based on market rates and reimbur sement on time Based on market rates and delay in reimbur sement for 2-3 months Based on market rates and reimbur sement on time State Govt. rate and reimbu rsemen t for SMMU is on time State Govt. rate and delay in reimbur sement is for 23 months Stat e Govt . rate s and on time pay State Govt. rates and delay in disburs ement up to 2-3 State Govt rates and on time payme nt UP As per market rates and disbur sement on time for SMMU and delay as 1530 days for DMMU and BMMU Based As per on market market rate rates and and disbur delay sement upto 2- on 3 time months for for SMMU 119 S No. Area ASM JH BH CH RAJ MP upto 2-3 months in reimbur sement 3 4 5 Paymen t of Local Conveya nce/Fix ed Travel Allowan ces (FTA) Paymen t of Commu nication - Mobile & Data Card charges Other allowan cesMedical, Insuran KR WB and for DMMU/ BMMU getting delay for 2-3 months GUJ OD men t months TN MH UP DMMU / BMMU No Yes Yes No No No No No NO No No Yes and for DMMU and BMMU delay of up to 3-4 month s. No No Yes Yes Yes Yes Yes yes In place Yes Yes Yes Yes Yes No Yes Yes No No No no No No No No EPF No 120 S No. Area ASM JH BH CH RAJ MP KR WB GUJ OD TN MH UP Yes Yes Yes Yes Yes Yes yes Yes Yes yes Yes Yes Yes No No No Yes Yes Yes Yes Yes Yes Yes Yes yes No yes no Yes Yes No No No yes No No No No No No Yes Yes Yes No No Yes No No No General y extened but no formal contract issued except for SMMU Yes on time Yes on time Yes on time Yes on time Yes on time Yes on time No formal issuanc e of contract letter on extensi on. Only verbal commu nication . Howeve r, getting salary Not exte nded . Issue is with cour t No No Yes. 3% per annum Not on regular basis Yes on time Yes on time No formal issuan ce of contra ct letter on extensi on. Only verbal comm unicati on. Howev er ce, PF, Gratuity , etc. 6 7 8 9 10 Provisio n of Comput er/Lapt op GRM ASH Annual Increme nt Renewa l of contract 121 S No. 11 12 13 Area ASM JH BH CH RAJ MP KR WB GUJ OD TN MH UP Timely Approv al Leave Eligibilit y Delay Yes Yes yes yes Yes yes Yes Yes Delay Yes yes salarie s are being paid. Yes Yes Yes Yes yes Yes Yes yes Yes yes yes No Yes Yes No No leaves for contract staff No Yes HR Manual in place No leaves for contrac t staff No No No No No No No No 122 Performance Management System A model PMS was developed at Writeshop 2014 in consultation with the states The model has been tested in Jharkhand and it is expected to be rolled out in at least 5 states in FY 2015-16 Current PMS/Review System in the SRLMs State Assam Bihar Gujarat Jharkhand Karnataka PMS/Review System Annual performance appraisal is done for all staff However, no promotion/increment/incentives/contract renewal are given on the basis of the appraisal Performance appraisal has not happened for staff since 2011-12 Earlier, the SMMU would assess the performance of district and block level staff by going on field visits However, due to rapid expansion of the Mission, it is no longer feasible for the SMMU staff to visit all blocks and districts and assess their performance The SRLM now ranks the Blocks and Districts according to their progress in implementation as against the targets set in the AAP. The respective block and district teams would be ranked against this performance Individual staff performance is assessed by their contribution to the achievement of the expected outcomes. The top 15% of staff are considered “A” grade and are eligible for promotion Review Monthly reviews for all themes are held at SMMU, DMMU and BMMU, where the AAP v/s progress is reviewed There is no formal mechanism in place Review Taluka (block) level: All staff at the Taluka office prepare their weekly and monthly plans. These are reviewed twice a month by the District Managers State Level A monthly progress review meeting is held on the basis of data uploaded in the MIS. A joint State coordination review meeting is held between JSLPS and PRADAN is held every two months to assess the progress and iron out issues, if any Thematic Review meetings are also held on a regular basis District Level A joint monthly meeting is held with PRADAN. The meeting generally focuses on the performance of individual blocks on the basis A coordination meeting is held to iron out issues, if any Block Level BMMU holds a review meeting with Active Women, CCs, CLCs. Occasionally, the thematic head from the district also participates in this meeting Also holds a meeting with bookkeepers to assess the progress made during the month There is no formal mechanism in place Monthly review for SMMU is held 123 Madhya Pradesh Maharashtra There is no formal mechanism in place Review meeting are held monthly at the district and state level The SMMU holds VCs with the district level once a month for review PMS tracks village stay, no. of SHGs formed, attendance, achievement of expected outcomes Odisha Rajasthan Tamil Nadu Uttar Pradesh West Bengal Online PMS was introduced in August 2014 It is based on the Key Performance Indicators (as laid down in the contract) of each staff member SMD, District Project Directors and Admin staff are exempted from the PMS The PMS is conducted on a monthly basis Professionals who get a score of more than 80 are rewarded (monetary) annually There is no formal mechanism in place No system for appraisal is in place SMMU holds a weekly planning and review meeting. Work done report and plans are uploaded on the website for the reference of all staff. Monthly state level review of District Project Directors Review meeting with staff of resource block (including staff of the concerned district) is held once a month at SMMU DMMU holds a monthly review meeting with the BPM 124 Annex-4 Rationalised Structure SMMU Level S. No. Number of Persons Particulars 1 State Mission Director (SMD) / Chief Executive Officer (CEO) 1 2 Chief Operating Officer (COO)- Programme 1 3 Joint MD/Addl. CEO – Systems 1 4 State Mission Manager (SMM)/Mission Manager (MM) – Programme 2-5 5 State Mission Manager (SMM)/ Mission Manager (MM) – Systems 1-3 6 Mission Manager (MM)/Mission Executive (ME) 1-4 7 Young Professionals (YP)/Consultants 05-15 First three positions are fixed. Number of remaining positions are expected to be between 04-15, apart from YPs/NFs/ Consultants hired for a limited period or on a fellwoship basis. DMMU Level S. No. Number of Persons Particulars 1 1 District Mission Manager (DMM) 1-3 2 Manager/Executive (DMMU member) 3 MIS Officer/Accountant 1 Expected numbers are between 03-05 (Maximum number of professionals based on age of the programme) BMMU Level S. No. Number of Persons Particulars 1 Block Mission Manager (BMM) 1 2 Cluster Coordinator (CC)* (@ 1 CC/Cluster (or a set of clusters) based on size of the block) 1-4 3 MIS Officer/Accountant * also referred as Area Coordinator. Expected numbers are between 03 an 06; May place a YP/NF at the block level in resource blocks. 1 125 Annex-5 Efficiency Benchmarks for an Intensive Block (for 3 years) Indicator Target Y1 Y2 Y3 Block Level Indicators Coverage Villages entered 120 Villages saturated 120 Households 48 96 120 48 15000 2520 7560 11340 80% 20% 50% 80% SHGs formed through CRP Rounds 960 240 720 960 SHGs formed through VO/WA 240 %of SC/ST/Minorities Households Institutions SHGs 120 Total SHGs formed 1200 240 720 1080 SHGs following Panchasutra 1200 240 720 1080 29 72 Federations Village Organisations 120 VOs supporting and nurturing SHGs 96 9 VOs identifying left out poor and forming new SHGs 96 9 VOs conducting monthly review of VO level Cadre & paying their honorarium 96 9 SC/ST/Minority OB in VO 30% VOs implementing Social Action Agenda 40% 9 Cluster Level Federations 4 Block Level Federations 1 4 Communitisation Community Cadre Development Bookkeepers WA MCP trainers VOA Community Auditors 1200 216 648 972 240 96 192 240 20 6 18 20 29 72 120 20 4 Social Capital to Support 20 Other Blocks I.CRP 240 48 120 Master Bookkeepers 140 28 70 Total CRP Teams (3 iCRPs and 2 Master Bookkeepers) 80 16 40 R.bookkeepers/I.PRPs 80 16 48 Bank Mitra 12 4 8 Mandatory Trainings 126 Indicator Target Y1 Y2 Y3 SHG (Formation training, Training on meeting process & norms, Books of accounts, MCP training, Leadership) 1200 240 720 1080 VO (Formation training, Training on meeting process & norms, Exposure & immersion, CIF management, PIP, Sub-committee system, Audit & legal compliance) 120 0 29 72 1200 216 648 972 WA (attachment to CRP Rounds, Immersion, Exposure Visit to NRO/Resource Block, Classroom Inputs, On-the Job Training) 240 96 192 240 MCP trainers (attachment to Sr. CRP Rounds, basic MCP Preparation, Classroom Inputs, Exposure Visit to NRO/ Resource Block) 20 6 18 20 120 0 29 72 Resource bookkeeper/IPRP (experience in SHG bookkeeping, attachment to CRP Rounds, ToT on SHG formation and bookkeeping, on the job training, exposure visits) 40 0 16 48 Community Auditors training (experience in SHG bookkeeping, audit training, exposure visits, classroom inputs) 20 0 0 4 240 0 48 120 12 0 4 8 Mobilisation 10% 30% Training 10% 30% Development of Community Cadre 10% 30% Support to SHGs 10% 30% Review of Community Cadres 10% 30% 80% 80% 80% 5 5 5 Remuneration and TA/DA given on time 60% 60% 80% Block Staff Trained (Orientation, Immersion, Exposure visit, Classroom Inputs, Thematic Trainings) 50% 60% 80% Bookkeeper (basic bookkeeping of SHGs, refresher trainings) VOA training (Office management, office bookkeeping, staff and funds management, Exposure Visits) I.CRP training (experience as WA, training in Resource Block/NRO, exposure visits, SHG formation training, ToT) Bank Mitra (banking system, account opening, loan processing) Transfer of roles to institutions Financial Management Systems Block Staff in Place (BMM, Accountant, CCs) Block Training Centre 1 Resource Pool at Block level 1 1 Block Level MIS in place 1 1 Percentage of Blocks in which Community Procurement system instituted 20% 127 Indicator Target Y1 Y2 Y3 Capitalisation Total Savings of members (Rs., Lakh) 1143 8 38 129 3 months old SHGs having a bank account 1200 180 660 1020 3 month old SHGs received RF 1200 180 660 1020 27 99 153 Amount of RF disbursed (Rs., Lakh) 6 month old SHGs prepared MCP 1200 120 480 900 6 month old SHGs received CIF 1200 120 480 900 60 240 450 Amount of CIF disbursed (Rs., Lakh) 1 year old VOs received VRF 120 14 Amount of VRF disbursed (Rs., Lakh) 22 Total Interest Earned by SHG (@12%) (Rs., Lakh) 6 10 37 95 377 732 101 387 769 6770 20772 27626 171 1570 3133 4.06 4.07 0.10 0.17 4 4 3 Leverage of Bank Linkage v/s SHG Corpus 0.4 0.4 0.6 Repayment Rate of CIF to VO (%) 95 95 95 Total Funds (Rs., Lakh) Total SHG Corpus (Rs., Lakh) Total Credit accessed by member Total Credit Accessed (Rs., Lakh) (all members in a block) Rotation of Internal Funds (Credit:Funds) 1.69 Leverage of funds (RF, VRF and CIF) against savings 0.08 Leverage of Bank Linkage v/s Savings SHG bank linked 1200 100 200 500 Amount of Bank Linkages (Rs., Lakh) 8973 36 168 438 10% 10% 30% 2 2 2 SHGs having bank loan outstanding NPA on bank loans (%) % of poor households investing in retiring high cost debt or making productive investments 20% SC, ST and Minorities households accessing Community Investment Support or formal financial support through SHGs/Federations 15% 25% 35% VOs having a Bank account 120 29 72 VO handling CIF 120 29 72 128 Indicator Target Y1 Y2 Y3 Layering Food security 4950 450 Households with at least 2 viable Livelihoods (no.) 9500 500 50 10 120 20 Agriculture/Livestock/NTFP CFs SHGs of PwDs Elderly/PwD CFs 20 SHGs of Elderly 120 20 SHGs of PoPs 120 20 PoP CFs 50 10 Gender/Social Action CFs 50 10 PRI Convergence/Entitlements CFs 50 10 Health and Nutrition CFs 50 10 129 Annex – 6 Identification of Target Households: A Summary of Methods Adopted S. No. 1 Assam 2 Bihar Identification of Hamlets: Hamlets mostly inhabited by the SC and ST communities are prioritised. The habitations are identified on the basis of caste concentration - habitations with high concentration of extremely backward castes (EBCs), the Scheduled Castes (SC), and the Scheduled Tribes (ST) are targeted for community mobilization. State Identification Methods Social mapping with the support of SHGs/VOs is undertaken to identify excluded households in a village CRPs from SGSY areas and block staff facilitate this process Identification of Target Households in the Newer Blocks After entering a hamlet, 100% of SC, ST and EBC households and 60% of OBC households are considered as the target group. Identification of Target Households in Older Blocks, where VOs have been formed (18 blocks): 3 Chhattisgarh 4 Gujarat 5 Jharkhand The VOs conduct participatory rural appraisal (PRA) exercises to identify the extremely poor and vulnerable households that are excluded from SHGs in the village The VO creates a team of 3 CRPs and 1 Community Mobilizer for facilitating mobilization The team lists the poorest, left out households in the village after conducting the PRA. These households are then mobilized into SHGs by the CRPs. In resource blocks, external CRPs identify the target households, based on a door-door survey in the village and the CRPs prioritize the SC/ST and other vulnerable households In intensive and partnership blocks, besides strengthening existing SHGs the CCs identifies the households through a consultative process. In resource blocks, CRPs identify the target households, based on a door-door survey In other blocks, the staff identify the households using the annual survey of rural households conducted by the Shram Yogi programme of the Government of Gujarat. Vulnerable households (low income, landless, small farmers) which are excluded are identified and mobilized into SHGs. In resource blocks, the CRPs identify the households during the mobilization round. They identify the 130 S. No. State Identification Methods households through a survey and through consultations with the community. Jharkhand has initiated the PIP process in the resource blocks, where strong VOs have emerged. A pool of trainers for PIP from the community have been identified to scale up the process to other blocks. The SRLM staffs identify households for mobilization through consultations with the Panchayat leaders and other stakeholders in the village. Target households are identified through Participatory Identification of the Poor prior to the CRP rounds PIP is undertaken in three phases. A detailed wealth-ranking is also a part of the PIP process. So far, the SRLM has conducted in all 9 districts under the intensive approach. Odisha, an elaborate PIP process, including well-being ranking and situation analysis under the TRIPTI project. This approach has been adopted in the NRLP blocks as well. Based on the situation analysis, all households in a village are categorized into 4 groups: o well off o manageable, o poor and o extremely poor and vulnerability group (EPVG) This categorisation is then endorsed by the Panchayat. The last two categories, i.e. poor and EPVG constitute the target group. In the resource blocks, the CRP teams approached hamlets with predominantly SC/ST/ minority households to begin with and then gradually reach out to others. Identification of Villages/Habitations: o Villages with a higher concentration of SC/ST households are identified. Identification of Households: o The households are identified by the CRP teams. They prioritize the mobilization of SC/ST/Minority households. 6 Karnataka 7 Madhya Pradesh 8 Odisha 9 Rajasthan 10 Uttar Pradesh 131 Annex-7 Methods Adopted for Ensuring Social Inclusion in Different States State All Resource Block States Bihar, MP and Odisha State Rajasthan Maharashtra Madhya Pradesh Bihar Social Inclusion Strategy Purposeful selection of SC/ST households: SRLMs have selected districts and blocks with higher concentration of SC, ST and marginalised communities for implementation. After entering the block, villages/habitations where the highest population of marginalised communities are chosen for implementation. When CRPs conduct the mobilisation rounds, they spend 15 days in each village. During this period, they study the dynamics of the village and focus on including the poorest of the poor households in the SHGs. Despite these efforts, some extremely vulnerable households may still be left out of the institutions. These households are mobilised by Women Activists and the Village Organisation (once they are formed) Bihar, Madhya Pradesh and Odisha are using participatory techniques to identify target households. This has reduced exclusion errors by a great margin. Further, the PIP process has begun to roll-out. The PIP would be conducted by VOs once every two years to measure the changing patterns in poverty and include any left out households. Jharkhand has already piloted the PIP process in certain blocks and has already developed resource persons to train VOs, and community cadre in the PIP process. This standardised PIP process is expected to be deepened in Jharkhand and scaled-up to other states during 2015-16. State-specific Social Inclusion Strategies Social Inclusion Strategy The mobilization approach itself focused on forming SHGs of households from marginalized communities – SC/ST/minorities. This has resulted in the inclusion of 30% SC households, 19 % ST households, 1.3 % Minority households and 0.08 % Persons with Disabilities out of total mobilized households. Coverage of SC/ST/Minorities and persons with disabilities in the existing mobilization is 45.3% across the blocks. A wealth ranking exercise ins conducted in the habitation/village as a part of the PIP process. During the wealth ranking exercise, the households are categorised into various categories such as poorest of poor, poor and well-off. Households falling in the last two categories are mobilised on a priority basis. In 18 Phase 1 (Jeevika) blocks, VOs have been actively mobilising left out households, the results are as follows: o Nearly 70% of the SCs, STs and landless in the project blocks have been mobilized into SHGs; o 94% of the membership is from the Scheduled Caste, Scheduled Tribe and Backward Classes; 132 o o o o Nearly 41% SHG members that received the ICF and utilized the Food security funds are SC/STs; About 50% SHG Members reduced high cost debts from informal sources; About 90% of the SHG households report increased food Security by 3 months; and Large numbers of SC, ST households have accessed the pensions and health insurance services 133 Annex-8 Identification and Mobilization Resource Blocks Category A: Chhattisgarh, Jharkhand, Maharashtra, MP and Rajasthan States supported by NRO - SERP, AP. A five member external CRP team stays in a village for 15 days and identifies poorest of the poor and poor HHs and mobilizes them into SHGs. One CRP Rounds lasts for 45 days, covering 3 villages in one round. each CRP team is assigned a cluster in the resource block. Professional Resource Persons (PRP) placed at each cluster by NRO is also assisting in mobilizing the poor into SHGs. Two active women are identified in every village. They strengthen the SHGs in the village. Once the VO is formed, it takes over the responsibility of mobilising the left out poor. Madhya Pradesh: MPSRLM started mobilization activities even before the external CRP rounds. The mobilization was accelerated by the Mission staff (District and PFT members). They stayed in the villages for 2-3 days and conducted video shows, cultural activities and village meetings. In this manner, they created at least one SHG in the village before the CRP rounds. The capacity building of the SHGs was left to the CRPs. During 15 days CRP round, 40% eligible households are covered under SHGs. Rajasthan: For ensuring effective social mobilization, each resource block is divided into 4 clusters with 6-9 Gram panchayats each (30-50 villages). Social Mobilization efforts by RGAVP are spearheaded by CRP teams from Jeevika, Bihar. One CRP team of 5 members is positioned in each cluster. Each CRP team spends about 30-45 days in each round (4 rounds of 120-150 days annually) covering 2-3 villages. 1 block anchor person placed at the block level provides support to the CRP teams during the rounds. PFT members of the respective clusters work along with the CRP teams during the mobilization process and take the responsibility of the follow-up actions once the CRP round ends. The entry CRP team begins with a meeting with the key decision makers in the village like Sarpanch, village elderly etc. The CRPs also prepares a social map of the village to identify the hamlets with predominantly SC/ST/ minority population. After identification of the hamlets with population from the backward communities, CRP team starts the mobilization process from these hamlets with preparing a list of the poor households reported by villagers. The team also makes household visits to verify the same. Hamlet level meetings are conducted with the poor households for seeding the concept of SHG and explaining their own life stories how they have benefitted from SHGs. Willing Women from poor households are organized into groups. The CRP team also facilitates the initial meeting of these groups. After the initial meeting where members have contributed their compulsory savings, members are provided basic orientation training to reinforce the concept of SHG and group management. Each CRP team spends about 15 days in each village. After 4 rounds of SHG-CRP, Senior CRP teams are introduced in the resource blocks to facilitate promotion of Community Development Organizations (CDO) / Village Organizations (VO). A three member Sr. CRP team is introduced in each cluster to facilitate promotion of CDO/VO. Category B: West Bengal, Gujarat, Karnataka, UP and Assam West Bengal: The External CRPs are spending 15 days in one Village/Upa-Sangha area (GP level) and doing the same activities prescribed for RB – from social mobilization to formation of SHGs and its training. But in many villages there are very few SHGs only they could form. CRPs are providing training in the name of revival of SHGs. During SGSY period, Village organization was formed at gram sansad level called as Upa- 134 Sangha and Cluster Federations is at GP level called as Sangha. On an average 200 to 250 SHGs are there in one Sangha/GPLF. ASRLM has approved the provision of flight charges for the external CRPs to avoid the train journey time to reach Guwahati from AP Issues: o External CRPs faced communication problems initially. The community was not able to follow Hindi, so first round was not fruitful as planned. o Visit to SHGs also proved the same because the SHGs in first round villages are not able to follow all direction of CRPs especially the book keeping. For rectifying this issue it was decided in the first Debriefing meeting attended by AS (RL) that the External CRPs will be assisted by internal CRPs as translators. For this SRLM has selected 4 iCRPs from each GP and sent them to Kamareddy for induction and immersion for 15 days. Thus the second round onwards they could work in tandem so the impact was very high in training and reaching community. o The continuous and holding by PRPs after the CRP round yet to happen. The old SHGs who got training in the second CRP round onwards doing good practices but the newly formed SHGs need further handholding. o Need to review the process because already SHGs are there so formation of SHGs may be kept away then concentrate in second level of capacity building of SHGs and VOs, particularly on MCP and fund management. Assam: MoU singed between ASRLMS and BRLPS on 26th November, 2014 to roll-out Resource Block Strategy in four (4) blocks First CRP round started on 29th January, 2015 in three blocks. Gujarat: The first external CRP round of 60 days was completed on 27 Jan 2015. Intensive Blocks/Home grown Model Category A: Chhattisgarh, Jharkhand, Maharashtra, MP and Rajasthan: Other than resource blocks, SRLM field functionaries are mobilizing the poor into SHGs in targeted villages. Internal CRPs (active women) developed in the resource blocks would also be employed in the SRLM intensive blocks to seed the social mobilization and institution building process. Maharashtra: Wardha model (3 blocks): In Wardha district, the legacy of SGSY has been taken forward through ‘Wardhini’, who is from within the community and is a community cadre. The Wardhini mobilize the community and play a pivotal role in the formation of SHG. A team of 5 Wardhinis go to different village and mobilize the community members into SHGs. Category B: West Bengal, Gujarat, Karnataka, UP and Assam West Bengal: DRD Cell is mobilising households in the blocks. The DRDC has adopted the same strategies as under SGSY o Sangha (Cluster Level Federation) selects a community cadre of 3 women called community service providers (CSPs) one for institution building, one for fund management and one for Bank linkages; and one Sanga Coordinator (SC) in these blocks as well as in non-intensive blocks also. the majority of GPRPs under SGSY system became the CSPs or SCs. Assam: ASRLMS have been utilizing the strength of the community cadre such as the Community Resource Persons (CRPs). Prior to the implementation of the NRLM activities in the state, Active Women/CRPs were selected and deployed by the District Rural Development Agency (DRDA) of all the blocks in Assam. 135 While entering a village the concerned community cadres (CRP or 2 CRPs & Bank Mitra) along with the BC interact with the Village Headman, PRI members and the community level workers (AWW & ASHA)& others as a measure to generate awareness about NRLM, its importance and need and about the various process undertaken in brief. o Accordingly a community level meeting is organized that is attended by the BPM, BC, Community Cadre and at times DMMU representative. The villagers are oriented on the role of NRLM vis-a-vis SGSY, ASRLMS and its work with the community in this meeting. o The process is followed by small hamlet level meetings especially with the women with the objective to further provide information and share knowledge about NRLM and SHGs. o Social mappings are conducted to understand and identify PoP households, SHG households & left out poor households. Post this, group level meetings are held for formation of SHGs & in consecutive weekly meetings decisions are taken on name of the SHG, composition of the leaders, opening of saving account of the SHGs, orientation on panchasutra and introduction of Books of Records. Simultaneously, orientation and handholding process is initiated with existing SHGs for their strengthening and revival and making them NRLM complaint. o After formation of SHGs and validation of existing SHG, they are provided 3 days training on SHG Management and Gender Sensitivity that include sessions on Panchasutra. In their regular weekly meetings as well CRPs and BMMU staff regularly reiterate on Panchasutra. After completion of 3 months, the SHG is also graded on the basis of practice of Panchasutra. Gujarat: Implementation in Intensive Blocks is executed by GLPC staff at block level. In process of formation of new institution and revamp existing institutions, social capital are identified and trained. o In intensive blocks, after information dissemination and developing cognizance about NRLM, Cluster Coordinator organizes Aam Sabhas with the help of existing SHGs. During Aam Sabha 1st basic module briefing is given for 2 days after which institutions are formed. Departmental staffs at block level are also aware of Mission Mangalam and NRLM program. Local Sarpanch also provide support to conduct Aam Sabha in the intensive blocks. Uttar Pradesh: UPSRLM has assigned the work for revival of old SHGs in the intensive districts through the staff of the state government posted at Block/ District level. The officials visits the villages and make the process of revival of existing SHGs and after grading the SHGs, RF is released to these SHGs. o Partnership Blocks 1. Maharashtra, MAVIM model (6 blocks): MAVIM is the women development corporation of Maharashtra. MAVIM has ‘Sahayogini’ in the form of community cadre, who mobilizes the community. Jharkhand - PRADAN: Existing SHGs are strengthened and capitalised. Any left out households in the block are mobilised by Community Federations and cluster staff. Odisha The structure followed in Odisha is a bit different as the SHGs form a CLF which comprises of 5-15 SHGs and 10-15 CLFs clubbed together form a GPLF. The CLFs and GPLFs are formed within the first phase which is spread across one month. The CLF in Odisha acts like a Village Organization elsewhere and is a first level representative, aggregating and monitoring body which also houses a CRP who assists in preparation of MIP, bookkeeping and everything which goes to the GPLF goes through the scrutiny of the CLF for the SHGs falling under the purview of the CLF. At the Gram Panchayat level a GPLF is formed in Odisha which is similar to the CLF elsewhere as per its functions 136 For intensive blocks - Social mobilization starts in a village when the TRIPTI team (staff and CRPs) visits the intensive blocks and revives the old SHGs and forms new SHGs by involving block staff and community cadres, the local institutions like PRIs or local NGOs. In this process the community are informed about the Mission’s interventions. This is followed by interlocking of institutions by forming CLFs and GPLFs to strengthen and enable them to have a stronger voice. The formation and promotion of community institutions in Odisha is done in three phases. In the first phase the Community Resource Persons (CRPs) from TRIPTI blocks visits the intensive blocks and revive the existing SHGs and lock these institution by forming the Cluster Level Federations (CLFs) and GPLFs in order to strengthen them and to ensure their existence. The master bookkeepers (MBKs) and Internal CRPs are also identified in this phase only. A significant amount of time is also spent in undertaking situation analysis exercise of the area. Situational analysis is being taken up in NRLP region as it was being practiced in the TRIPTI region. It is in the second phase that the new SHGs are formed and the capacity building exercises for the SHGs are initiated. In the third phase the staff is taught how Micro Investment Plan (MIP) is to be prepared. 2. wherein the financial transactions are recorded for SHGs wherein the details of the CLF are mentioned in brackets for easy recognition. Internal CRP and staff from TRIPTI blocks act as resource persons in implementing NRLM in intensive blocks of OLMS. Bihar The SHGs are formed by the internal CRPs as well as by the project staff, number of which are fixed and mentioned in the Annual Action Plan. The CRPs are internal CRPs, drawn from the mature CBOs of 1st phase districts of Jeevika (Resource Districts). There are 4 rounds of CRP visits per year. Each round is of 30-day duration. The CRP round starts with a scoping study with the help of Participatory Rural Appraisal tools. Prior to the arrival of CRPs, a mobilization exercise is already been conducted by the staff (specifically by the Community co-ordinators and area co-ordinators) and during this exercise, at least 2 SHGs are formed by them. As of now, 231 rounds of CRP visits have been conducted and the number of internal CRPs deployed is 30256. The CRP team is 5-membered team with at least 2 book-keepers. 2-3 CRP teams are deployed within a Block. They cover 2 villages during the round and form 15-20 SHGs in those 2 villages. The team identifies 2 Community Mobilisers/ Women activists in each village. It also facilitates the preparation of documents required for bank account opening. CRP’s work is followed-up by the Community co-ordinators and community mobilisers. Currently, there are 1822 women activists who have been trained and positioned. It was felt that the training mechanism for CRPs needs to be strongly emphasized as there are no CRP quality control mechanisms. In addition to this, the expansion of BRLPS in all 534 blocks (which is supported/ mobilized by the CRPs drawn from 6 Resource districts i.e. 52 blocks) would require a huge force of CRPs, approximately 1602 teams of CRPs. Therefore, it is imperative to have the following modules and protocols in placeo Module on CRP selection o Protocol on CRP quality control 137 o Module on Community Cadre Appraisal A visioning exercise should be conducted for shaping up of BRLPS project for the coming 10 years and focus should be on building capacity of the staff, cadre and community institutions. This exercise will not only help in bringing a clarity on achieving the Mission’s goals, but would also go long way in determining the role of community institutions towards attaining self-sustainability. Mobilisation through VOs Mobilization of PRA teams of 3 CRPs and 1 CM in 18 phase1 blocks involved in inclusion of left out HHs with the quality VOs. Training VOs in conducting participatory rural appraisal (PRA) exercises to identify the extremely poor and vulnerable households that are excluded from SHGs Incentivizing community functionaries to ensure identification and inclusion of the left out households SC/STs and the landless. Caste wise Listing of PoP/ left out HHs by the VO by taking help of CMs and CRPs. Specially targeted mobilization of any left out households, based on improved understanding of barriers to inclusion Greater capacity building and role of VO subcommittees in promoting mobilization of left out and poor households Adoption of specific SHG norms tailored for ultra-poor households Results: More than 4000 such left out households have been identified and mobilized so far, using this approach. The project MIS, process monitoring studies and external impact assessments3 have shown the following outcomes for the key social groups 3 Nearly 70% of the SCs, STs and landless in the project blocks have been mobilized into SHGs; 94% of the membership is from the Scheduled Caste, Scheduled Tribe and Backward Classes; Nearly 41% SHG members that received the ICF and utilized the Food security funds are SC/STs; 35 to 40% beneficiaries of agriculture intervention were SC/STs and 76% were marginal farmers; About 50% SHG Members reduced high cost debts from informal sources; About 90% of the SHG households report increased food Security by 3 months; and Large numbers of SC, ST households have accessed the pensions and health insurance services External Impact assessments: Mid-term review of BRLPS was conducted 138 Annex-9 Capacity Building of Community Institutions: NRLP States Dec.’14 S. No. 1 State Chhattisgarh Type of Training/ Trainee Category Trainers SHGs in RBs External CRPs MCP Training 2 Madhya Pradesh SHGs in RBs SRLM staff, Active women, internal CRPs External CRPs 3 Jharkhand SHGs in RBs External CRPs SHGs follow-up training Active women, SRLM Staff, PRPs SHGs in RBs External CRPs 4 Maharashtra Training Strategy/ Methodology Initially as part of CRP rounds; followed up by PRPs and cluster staff Provided 6 months after formation of the SHG, Initially as part of CRP rounds; followed up by PRPs and PFT members Initially as part of CRP rounds; followed up by PRPs and cluster staff members Follow-up training to SHG members on basic SHG concepts after the CRP rounds in the village Initially as part of CRP rounds; Modules Developed/ Used CRP training module Duration of Training Training Location 3-day basic training Community MCP Training Module 3 days Community CRP training module 3-day basic training Community CRP training module 3-day basic training Community 3-day basic training Community Other Issues, if any Basic SHG concepts CRP training module 139 S. No. 5 6 State Assam West Bengal Type of Training/ Trainee Category Trainers SHG training in Intensive Blocks CRPs and BMMU staff Micro Credit Plan Active Women SHGs in RBs External CRPs SHGs in intensive blocks Community Service Providers 7 Karnataka SHGs in Intensive Blocks resource persons at taluka level and internal CRPs 8 Odisha SHGs in Intensive Blocks Internal CRPs Training Strategy/ Methodology followed up by PRPs and cluster staff members Training imparted during initial SHG meetings SHG members trained on preparing MCP, six months after the SHG is formed Initially as part of CRP rounds; followed up by PRPs and cluster staff members Training as part of CRP rounds, followed up by block staff SHG members trained immediately after the formation of the SHG, followup by Taluka staff SHG members trained immediately after the formation of Modules Developed/ Used Basic SHG concept, gender, Duration of Training Training Location MCP Module 3 days, spread over 3 weeks 6 days CRP training module 3-day basic training Community Basic SHG concepts 3 days Community Basic SHG concepts Basic SHG Concepts Other Issues, if any Community 3 days 140 S. No. 9 State Bihar Type of Training/ Trainee Category Trainers MCP and Financial Inclusion Internal CRPs SHG CRPs and Community Mobiliser SHG follow-up training CRPs and Community Mobiliser Training Strategy/ Methodology the SHG (phase 1) SHG members trained immediately after the formation of the SHG (phase 2) SHG members trained immediately after the formation of the SHG Village-level trainings during meetings, exposure visits Modules Developed/ Used Duration of Training Training Location MCP preparation, internal lending, bank linkage 3 days Basic SHG Concepts 3-4days Community Basic SHG concepts 3-4 days Community/best practice sites Other Issues, if any 141 Annex-10 Revolving Fund Disbursement Channel: A Summary S. State No. 1 Assam Process 2 Bihar SHGs completing 3 months are eligible for RF SHGs are graded by the block staff and active women The number of eligible SHGs are listed according grading Three-month old SHGs are graded on the basis of their adherence to ‘Panchsutras’ by the Loan Committee of the VO BMMU approves the grading and recommends the list of eligible SHGs to the DMMU Approving/Sanctioning Authority Deputy Commissioner through BDO and Project Director DRDA DMMU Transfer of Fund DMMU transfers RF directly to the SHG account DMMU releases the RF to the accounts of SHGs performing well (‘A’ category SHGs) Time taken for fund transfer 2 months (after grading) 2-3 months (after grading) Issues 142 S. State No. 3 Chhattisgarh 4 Gujarat 5 Jharkhand Process 3 month-old SHGs are graded for their adherence to Panchasutra 3-month old SHGs are graded for their for their adherence to Panchasutra 3-month old SHGs are graded by Active women/ Community Coordinators (CC) The CCs submit an application form to Cluster Coordinator (Cl.C), who recommends it to the BPM The application is validated using MIS data The application is discussed at the Approving/Sanctioning Transfer of Fund Authority CEO of the Zilla Janpad ‘Janpad’ transfers amount to SHG accounts Time taken for fund transfer 2-3 months (after grading) 15-20 days SMMU SMMU transfers amount to the SHG directly Issues 143 S. No. State Process 6 Karnataka 7 Maharashtra Approving/Sanctioning Authority Loan Committee Meeting of the VO The list is sent to the SMMU SMMU 3-month old SHGs are graded according to their adherence to Panchasutra by cluster/Taluka staff Grading of three- DMMU month old SHGs based on the Panchsutras. A gradation format has been developed to capture 5 additional indicators to the Panchsutras sanitation, girl child education etc. After the grading is done by the cluster coordinator, the proposal along with the grading Time taken for fund transfer Transfer of Fund Issues SMMU transfers funds directly Funds are directly transferred to the SHG account 8-15 days cumbersome file movement process at DMMU level causes delays 144 S. No. 8 State Madhya Pradesh Process sheet is submitted to the BMMU. 3-month old SHGs are graded by the PFT members on the Panchasutra. The SHG grading is done in the presence of the members. The SHGs are graded as A, B and C. The SHG receives the full quantum of RF Rs. 15,000 if it falls in Category A; and Rs. 12,000 for Category B; and Rs. 10,000 for Category C SHGs. The SHGs are graded only once at the time of providing RF. No grading happens thereafter. Approving/Sanctioning Authority DMMU Transfer of Fund Funds are directly transferred to the SHG account Time taken for fund transfer 15 days Issues 145 S. No. State Process 9 Odisha 10 11 Rajasthan West Bengal Approving/Sanctioning Authority Time taken for fund transfer Transfer of Fund Issues After the grading is done, the PFT coordinator submits the grading sheets to the DMMU. 3-month old SHGs are graded by cluster/block staff List of eligible SHGs is recommended to district The SHG files a simple application form to DMMU counter signed by PFT member verifying adherence to Panchasutra. SHGs are graded on the basis of Panchasutra SMMU on recommendation of DMMU DMMU Enormous delays in disbursement due to long winding procedures Funds are directly transferred to the SHG account by DMMU DMMU Funds are directly transferred to the SHG account o RF is disbursed only 8-12 months after SHG formation No system of grading is in place Some SHGs which had earlier received RF under SGSY were also provided under NRLM 146 Annex-11 CIF Disbursement Channel: A Summary S. No. 1 2 State Assam Bihar Process SHGs which are at least 6-month old are provided training on preparation of MCP Based on the training, SHGs prepare MCPs. The MCPs prepared by the SHGs are appraised and approved in the MCP appraisal and approval committee (consisting of VO EC member, SHG member and BPM). The BMMU then submits the list of eligible SHGs and the demand to the Deputy Commissioner Preparation of MCP Approving/Sanctioning Authority Deputy Commissioner through BDO and Project Director DRDA, for approval The BPM recommends Transfer of Fund DMMU transfers RF directly to the SHG account Amount is released Time taken for fund transfer 2 months (after MCP is approved) Issues Tedious and time-consuming approval process Lag in training SHGs in MCP preparation as there is a shortage of MCP Trainers 1.5 months (after 147 S. No. State Process by SHGs MCPs are then appraised by the LCM at the VO and submit to the BMMU. 3 Chhattisgarh 4 Gujarat 5 Jharkhand Approving/Sanctioning Authority eligible SHGs to the DPM Transfer of Fund directly from DMMU to the SHG account. Time taken for fund transfer MCP Preparation) on the average Issues Preparation of MCP by 6-month old SHGs Block office appraises MCPs and recommends to the district office CEO of the Zilla Janpad Janpad transfers amount to SHG account MCP preparation by 6-month old SHGs MCPs are appraised by VO/block office Block office recommends SHGs to DMMU 6-month old SHGs prepare MCPs The CCs submit MCP to Cluster DMMU DMMU transfers amount to SHG Account 1 month SMMU SMMU transfers amount to the SHG directly 15-20 days Cumbersome file movement process to get sanction approved Lag in training of SHG members in MCP Inadequate number of MCP trainers has led to lag in MCP preparation 148 S. No. State Process 6 Maharashtra Coordinator (Cl.C), who in turn recommends it to the BPM The MCP is validated using MIS data The MCP is discussed at the Loan Committee Meeting of the VO The list is sent to the SMMU Six-month old SHGs prepare their MCPs MCPs appraised by BMMU and recommended to DMMU for funds realse Approving/Sanctioning Authority DMMU Transfer of Fund DMMU transfers amount to SHG directly Time taken for fund transfer 8 – 15 days Issues Enormous delay in release of RF and CIF due to cumbersome file movement process at DMMU level Inadequate community cadre/trainers to facilitate MCP/MIP preparation in order to match with the pace of 149 S. No. State Process Approving/Sanctioning Authority Transfer of Fund Time taken for fund transfer Issues no.of SHGs becoming eligible to receive CIF 7 Madhya Pradesh six-month old SHGs prepare MCPs The SHG then submits the MCP to the PFT for appraisal. The PFT appraises it and suggests any changes to the SHG. The appraised MCP is recommended to the DMMU. In case where VOs have been formed, MCP is sent to VO for evaluation and approval. Demand of Compiled MCP sent to DMMU for verification and disbursement of fund, [team/committee DMMU SMMU transfers the fund through NEFT to districts. Districts transfer funds through NEFT to VO. CIF disbursement process takes maximum 10 days. 5 days for preparation of MCP, 5 days for DMMU and SMMU transfer of funds to VO. 15 days 150 S. No. State Process Approving/Sanctioning Authority of concerned PFT Coordinator, PFT Nodal, MF/IBCB District Manager would verify] Demand is consolidated in financial terms by DMMU and sent to SMMU. Money has been transferred to GPLFs, but no clear protocol is in place 8 Odisha 9 West Bengal SHGs prepare MCP and submit to Sangha (CLF) through UpaSangha (VO). Sangha verifies and assesses the MCP Transfer of Fund Sangha (CLF) Time taken for fund transfer Issues Transfer from GPLF has not taken place Sangha disburses CIF to SHGs The Sanghas have not disbursed any CIF to SHGs so far. 151 Annex-12 Methods and Processes Adopted for Bookkeepers S. No. 1 Assam 2 Bihar 3 Chhattisgarh SHG members select a literate member from among themselves State Identification Process SHG members select a literate member from among themselves, or choose a literate member they know and trust in the community SHG members select literate members from among themselves, or choose a literate member they know and trust in the community 4 Gujarat SHG members select a literate member from among themselves 5 Jharkhand SHG members select a literate Training Deployment Payment NA During every SHG meeting Not paid at the moment Duration: 18 days Modules: SHG Concept and Books of Accounts VO Concept and Books of Accounts VO MIS Other Need Based Training, Financial statement Resource Blocks: 5-day bookkeeping training during CRP rounds, followed by refresher trainings Modules: Introduction to SHG books of accounts Bookkeeping practices Importance of bookkeeping in SHGs Resource Blocks: 5-day bookkeeping training during CRP rounds Resource Blocks: 5-day During every SHG meeting Paid by the SHG (from funds received from the project) During every SHG meeting Paid by the SHG (not project fund) Rs. 30/meeting During every SHG meeting Paid by the the project During every SHG meeting Paid by the 152 S. No. State Identification Process member from among themselves 6 Karnataka SHG members select a literate member from among themselves 7 Maharashtra SHG members select a literate members from among themselves 8 MP SHG members select literate member from among themselves Training bookkeeping training during CRP rounds, followed by refresher trainings Modules: Introduction to SHG books of accounts Bookkeeping practices Importance of bookkeeping in SHGs Resource Blocks: 5-day bookkeeping training during CRP rounds Intensive Block: Trained by MYRADA Resource Blocks: 5-day bookkeeping training during CRP rounds, followed by refresher trainings Modules: Introduction to SHG books of accounts Bookkeeping practices Importance of bookkeeping in SHGs Resource Blocks: 5-day bookkeeping training during CRP rounds, followed by refresher training by PRPs, block staff, master trainers Modules: Deployment Payment SHG (from funds received from the project) During every SHG meeting During every SHG meeting During every SHG meeting In intensive blocks: paid by SHG (Rs. 10/meeting) Resource Block: Not paid Paid by the SHG (from funds received from the project) Paid by the SHG (from funds received from the project) 153 S. No. State Identification Process Training Deployment Introduction to SHG books of accounts Bookkeeping practices Importance of bookkeeping in SHGs 9 Odisha SHG members select a literate member from among themselves NA During every SHG meeting 10 Rajasthan SHG members select a literate member from among themselves During every SHG meeting 11 West Bengal SHG members select a literate members from among themselves Resource Blocks: 5-day bookkeeping training during CRP rounds, followed by refresher trainings by PRPs, block staff, master trainers Modules: SHG Concept and Books of Accounts Other Need Based Training, Financial statement NA During every SHG meeting Payment Rs. 10 before CIF and Rs. 20 after CIF is received Paid by GPLF from the project funds (Rs. 20/meeting) Not all are paid, some SHGs pay from their own funds NA 154 Annex-13 Internal CRPs Methods Adopted for Identification, Training and Deployment S. No. 1 2 State Bihar Identification Process Training Deployment Payment Best practicing SHG women, members who have saved, borrowed loans and repaid on time, taken up social action Duration: 22 days Modules: Social Mobilisation, SHG Concept and Formation VO Concept and Formation CLF Concept & Management Social Inclusion (PRA)/Scoping VO quality FSF/HRF Procurement Basic Modular Training to trainer CRP Other Need Based Training (FLCC) Mobilisation of left out households in the village and block Mobilisation in other blocks Identification (through PRA) of poor households Paid by project, based on number of days worked SHG women fulfilling the following criteria are identified as ICRPs: Should have attended at least 52 meeting, attendance in SHG meeting should be 90% or more, Should have taken small loan at least 3 times and big loan at least 2 times, prompt repayment. Good communication skills. Should belong to POP category. Not deployed yet, their services will used for scaling up in intensive blocks To be paid by VO, based on number of days deployed Attachment with external CRPS (45 days) residential training (30 days) exposure visit to SERP (NRO) Rs. 300 (food and travel charges are additional) 155 S. No. State Identification Process Training Deployment Payment 2 Jharkhand Maharashtra 3 MP 5 Odisha 6 West Bengal (CRPs in WB are known as Community Service Providers) Should have promoted other SHGs in her own village. Best practicing SHG women, members who have saved, borrowed loans and repaid on time, taken up social action, may have worked as active women earlier To be paid by VO, based on number of days deployed Attachment with external CRPS (45 days) residential training (30 days) exposure visit to SERP (NRO) Well performing and active SHG Women are identified by the block staff as CRPs Training is being provided by CRPs from TRIPTI block Well performing and active SHG Women from the SGSY promoted SHGs are identified by the block staff as CSPs Mobilisation and institution building in other blocks Each CRP Round lasts for 3 days only Supporting, nurturing SHGs in the village Forming new SHGs Assisting in bank account opening, grading, bookkeeping, etc. Paid by the project Paid by the the project Social Capital: Active Women S. No. 1 State Bihar (known as community mobiliser) Identification Process Any person (preferably woman) who is literate and willing to support SHGs in the village is identified. Training Duration: 35 days Modules: Facilitation, SHG Concept & Management Leadership Rotation of SHG & Role Supporting, nurturing SHGs in the village Forming new SHGs Assisting in bank account opening, grading, bookkeeping, MCP preparation etc. Payment Paid by project 156 2 Chhattisgarh Well-performing/active SHG members are identified by the PRP or SRLM Staff 3 Jharkhand SHG members select a literate members from among themselves 4 Maharashtra SHG members select a literate members from among themselves VO Book Keeping- Transaction Sheet Book Keeping- Others Books of Account Microplan (Including 2 days Field Practice) SHG MIS VO Concept and Management Food Security and HRF RSBY and other entitlements Micro- Insurance Other Need Based Training Exposure visit to NRO (15 days) Classroom training – SHG concept, bookkeeping, (1 month) Attachment with CRP Rounds (45 days) On-the-job training Follow-up training provided by the SRLM Supporting, nurturing SHGs in the village Forming new SHGs Assisting in bank account opening, grading, bookkeeping, etc. Supporting, nurturing SHGs in the village Forming new SHGs Assisting in bank account opening, grading, bookkeeping, etc. Supporting, nurturing SHGs in the village Forming new SHGs Assisting in bank account opening, grading, bookkeeping, etc. Paid by the project Paid by the the project Paid by the the project 157 5 MP SHG members select a literate members from among themselves 6 Odisha 7 Rajasthan 8 West Bengal SHG members select a literate members from among themselves 2-3 Active Women identified by CRPs. Active Women participate in mobilization drives with the CRPs PRPs and CRPs identify 2 Active Women during the CRP Rounds NA Duration: 20 days Modules: Exposure Visit Village level, on the job training NA Supporting, nurturing SHGs in the village Forming new SHGs Assisting in bank account opening, grading, bookkeeping, etc. Present during every SHG meeting Supporting, nurturing SHGs in the village Forming new SHGs Assisting in bank account opening, grading, bookkeeping, etc. Supporting, nurturing SHGs in the village Paid by the the project Paid by the the project Paid by the project, but there are delays in payment Not paid 158 Annex-14 Status of MIS, Procurement and FMS in Different States S. No. State 1 Assam 2 Bihar MIS 3 Chhattisgarh Monitoring and Evaluation All blocks are reporting the MPR by the 10th of every month Lack of MIS staff in most blocks NRLM MIS being used The community mobiliser (community cadre) collects the data for her village and submits the transaction sheet to the Community Coordinator and Area Coordinator. They compile the data of all SHGs in their area and submit it to the Block office Block level entry, data validated at block and district levels NRLM MIS being used, with help from NIC Process of Data Collection: Area Coordinators of blocks were used “Masik Prativedan” format to collect the monthly data from SHG. Data collected by area coordinators were compiled by BPM and entered the records indicator wise into the MIS Ver1 as block level user. District level user i.e. DPM was verifies the data provided by BPM. Reports were reflected progress of each blocks and district at state and national level once after the verification done by district level user. Modules: Master Database (i.e. Mapping of districts, blocks, GP and village) and Bank - Branch Mapping was already shared by NMMU for our State MIS. Profiles Details of SHG, Members and VO. Mapping Between SHG and VO. 159 S. No. State 4 5 Gujarat Jharkhand 6 Karnataka 7 Madhya Pradesh 8 Maharashtra 9 Odisha MIS Transaction based MIS in place (since Apr 2014) Transaction-based MIS in place (in 15 blocks) CC submits a weekly transaction sheet at the BMMU BMMU digitizes and uploads the data on the portal MIS is the single point of information, information collection by other verticals discouraged Data from Panchatantra (MIS of Ministry of Panchayati Raj , Govt. of Karnataka being used) National MIS operationalised in 20 blocks All blocks submit MPRs before 10th of the month Issues: Data validation, removal of duplicate entries NRLM MIS being used PFT Members collect the data of their Nodal Villages and make the necessary entries in the transaction sheet. One PFT Member is appointed as the MIS point person in the cluster. The data is then verified by the DMMU before being sent to the state office. The district also has a dedicated MIS person in place. National MIS being used Active Women fill the MPR-data sheet at the village level and submit it to the CC The CC validates and compiles the data for her/his cluster and submits the sheet to the BMMU The BMMU submits the Block consolidated sheet to the DMMU. The process is all done manually up to the district level. The MIS information is used regularly during review meetings with staff SHG Report Card being piloted MPR is updated online on the state MIS System on a monthly basis The data is verified by the district team and made available on a public Monitoring and Evaluation Baseline study Completed, move to include community members as enumerators yielded greaeat results. Baseline study being conducted with help of Nielsen Pvt Ltd o Sample size: 10,000 households, 10 districts 160 S. No. 10 11 State MIS Rajasthan West Bengal Monitoring and Evaluation forum Two types of MIS a) Sakh Darpan (developed by RGAVP) b) NRLM MIS PFT collects data and feeds them into the MIS The data is validated at the block level MIS is housed on the Department of Panchayati Raj Wbsitre MIS to be developed in-house using NIC NIC is hiring professionals to support the SRLM Status of Procurement S. No. State 1 Assam 2 Bihar 3 Chhattisgarh Procurement Procurement process for HR agency and agency for baseline study has been started No progress on other services There is no separate staff for procurement, FM staff doubling up as procurement staff Large scale procurement (state level): i. Infrastructure and Mission unit establishment procurement, completed in 80% new blocks ii. HR agency hired iii. MIS agency hired iv. Audit agency hired v. Process Monitoring, in process Approval for procurement of services is taken from ACS when procurement is initiated and secondly when agency is finalized. For Goods procurement at state level the procurement is done as per need. At DMMU & BMMU level as of now procurement of Goods is only done Agencies procured: Internal audit Office furniture 161 S. No. State 4 Gujarat 5 6 Jharkhand Karnataka 7 Madhya Pradesh 8 Maharashtra Procurement HR Agency Agency to study SHG quality (reports to be received) Statutory audit Agencies procured: Internal audit Office furniture HR Agency Agency to study SHG quality (reports to be received) Statutory audit 3 essential services have been procured 5 more are being processed The DMMU can purchase anything up to Rs. 5000 without having to follow the procurement process. It has to invite tenders/quotations to procure anything above Rs. 5000. Agencies procured: Baseline FMTSCA Internal audit Statutory audit Office furniture HR Agency Agency to study SHG quality (reports to be received) Procurement Progress At SMMU, 61% of consultancy procured, 100% of goods and civil works converted to contracts Draft community procurement manual is in place Procurement process: Status of procurement of various services is updated online Competitive bidding method adopted – expenditure saved Rate contract system for office supplies, transport facilities, training facilities 162 S. No. State 9 10 Odisha Rajasthan 11 12 Uttar Pradesh West Bengal Procurement Evaluating of technical bids and proposals outsourced, has resulted in unprecedented delays Agencies procured: Baseline (to be in place by Feb 2015) FMTSCA Internal audit Office furniture (partly purchased) HR Agency Statutory audit - All services procured during 2014-15, except process documentation and MIS. MIS will be done in-house. 163 Finance Management System in States Process of funds release: Release of 1st instalment: Central share is released by MoRD, based on approved AAP & budget in April of every year, matching grant is released by state. Release of 2nd instalment: released in the months of October-December, on fulfilment of the following conditions: i. ii. Utilization of at least 60% of the available funds including the opening balance; The opening balance of the SRLM should not exceed 10% of the allocation of the previous year (in case, the opening balance exceeds this limit, the Central share would be proportionally reduced) FM systems in various states S. No. 1 State Bihar Funds Release, other systems 2 Chhattisgarh Funds released to districts based on quarterly budget The district allots an impressed amount of 1 lakh/quarter to the block office, block submits bills every fortnight Funds utilised based on approved unit costs Training of all staff on Financial Management of Community Institutions Multiple projects, with different procedures for funds release delays the implementation Mode of flow/transfer of Funds from SMMU to DMMUs/ through bank e-transfer (RTGS). Transfers from District level to Block / SHG/VOs through bank etransfer (RTGS). Reverse flow of Expenditure on Accounting System Engaging services of ROLTA to roll-out a customised Tally Monitoring All the accounting centres are having Tally ERP9. Purchased 5 multi-user and 8 single user licenses from Tally solution. Service contract has also been signed with Tally for installation, initial sep-up of chart Internal audit conducted Financial statements based on internal audits are released on a half-yearly basis Manual IUFR being used, district submits IUFR once a quarter to State office SPMU reconciles expenditure monthly finance review meeting with finance head of all the districts Finance staff also participate in the monthly review meeting with the program team where we discuss on financial progress, budget & budgetary control, timely settlement of dues and 164 monthly basis from Block to DMMU. Consolidation of Block expenditure at DMMU and submission to SMMU. Consolidation of Monthly expenditure at SMMU for onwards submission to NMMU. All expenditure and third party payments are through RTGS. 3 Madhya Pradesh SRLM releases funds to Districts as per their requirement & budget allocation of the district of account, training and AMC. Standard chart of accounts have been developed as per IUFR heads and same are installed at each centre. Administrative right is with PMFinance to add a new account head or edit an existing account head. First phase of accounting centres was set-up in the month of August, 2013 with 3 DMMUs, SRC and Sanjivani project. Presently these centres are working independently and making all the payment including salary and transfer of RF / CIF to SHGs. Second phase of accounting centres set-up has been completed in the month of January, 2014. They have started transactions. Salary and transfer of RF / CIF are still been taken care-of from SMMU and will continue till they will be fully trained. Tally Software being used Accounting centres are SMMU and DMMU 4 Maharashtra FM handled by Dy. Director (from Tally software being used any other issue related with finance. Monthly meetings and review with DMMU finance team is done. Monthly progress report. Quarterly IUFR is another source of monitoring. Weekly expenditure review against budget and variance analysis is done. Concurrent audit of all districts is regularly undertaken. Monthly Financial Progress review of non-intensive area with team of CEOZP is done. Monthly review with FM staff, held by 165 Govt. of Maharashtra) FM manual approved Approval for release of funds at DMMU lie with CEO-ZP and DMMU. But, most matters are referred to the DRDA Resulted in excessive delays in releasing funds to community SMMU 166 Annex-15 State Information Report Each NRLP State is required to submit a brief report (15 pages) indicating the current status of the State Mission. The report should focus on the overall progress of the Mission, key processes adopted in each area, resulting outcomes, internal and external constraints that have affected the progress of the Mission and the plans/strategies for the rest of the project period. It may be noted that the report should focus on qualitative aspects, particularly on the issues and the constraints that have affected and how the Mission seeks to overcome them. The data may be furnished in the Tables. The report may adopt/customize the following as necessary. 1. Transition to NRLM 2. Architecture and Systems Established (at all levels) 3. Human Resources (at all levels) 4. Implementation Progress (in different components) a. Resource Blocks b. Intensive Blocks 5. Key Constraints and Issues faced 6. Plans for the remaining project period 7. Attachments (templates given) 167 NRLP State Information Schedule Table-1 Basic Information of the State: _____________________ S. No. 1. 2. 3. 4. 5. a) b) c) d) e) Item Value Number of Districts in the State Total Number of Blocks in the State Total Number of Gram Panchayats Total Number of Villages Rural Households (2011) Total SC ST Minority Others Table-2 Information on the State Mission S. No. 1. 2. 3. 4. 5. Items Response Date of transition to NRLM Present Chief Executive Officer/Mission Director Full time/Additional Charge No. of months since the current CEO/MD has been in office No. of CEOs/MDs prior to the present CEO/MD Table-3 Coverage of Intensive Districts and Blocks S. No. Intensive District Intensive Blocks Type (Intensive/Resource) Implementation Started in Month/Year 1. 2. 3. 4. 5. 6. 7. 8. 9. 10. 11. 12. 13. 14. 15. 168 Table-4 Human Resource Status S. No. 1. 2. 3. 4. No. of Staff Required Level No. of Staff Approved No. of Staff in position SMMU DMMU BMMU Total Table-5 Staff Required, Approved and in Position S. No 1. 2. 3. 4. 5. 6. 7. 8. 9. 10. 11. 12. 13. 14. 15. 16. 17. 18. 19. 20. 21. 22. Functional Area Number of Staff Required Number of Staff Approved Number of Staff in position Program Staff Institutional Building Training & Capacity Building Social Inclusion and Social Development Financial Inclusion/ Bank Linkage/ Micro Finance/ Insurance Livelihoods (Farm/Non-Farm/OffFarm) Innovation and Partnership Self-Employment/ Skill Development/ Placement Marketing Young Professional Retainer Consultants Management Staff Financial Management Human Resource Development Procurement Administration/Project Management Monitoring and Evaluation MIS / IT/ ICT Communication and Knowledge Management Support Staff Project Assistants/ Project Associates Admin Assistants / Office Assistants Data Entry Operators (DEOs)/ Data Assistants Accountants/Cashiers Other Assistants/Associates/Supports 169 Table-6 Resource Block Status S. No. 1. 2. 3. 4. 5. 6. 7. 8. 9. 10. 11. 12. 13. 14. 15. 16. 17. 18. 19. 20. 21. 22. 23. 24. No. of Districts Progress as on 31st Dec’14 No. of Resource Blocks No. of GPs covered No. of Clusters No. of Villages covered NRLM target HHs covered in Resource Blocks New SHGs formed Old & defunct SHGs revived Total SHGs adopting Pancha Sutras Total SHGs formed by CRP teams Total SHGs formed by PRPs Total SHGs formed by trained Women Activists SHG Bookkeeping introduced SHGs opened Bank accounts No. of SHGs eligible for Revolving fund No. of SHGs received Revolving Fund Revolving Fund amount released (Rs.in Lakhs) No. of SHGs eligible for preparing MCP to access CIF No. of SHGs prepared MCPs for CIF No. of SHGs received CIF through MCPs CIF amount received in SHGs (Rs.in Lakhs) No. of SHGs sanctioned Bank Linkage Bank loan amount received in SHGs (Rs.in Lakhs) No. of Women Activists identified Number of Resource Bookkeepers trained 170 Table-7 Staff Training Status S. No. 1. 2. 3. 4. 5. 6. SMMU Staff Module DMMU staff BMMU Staff Induction Initial Orientation Immersion Exposure Visit 30 day Classroom Training Attachment with CRP Rounds Table-8 Capacity Building Architecture S. No. 1. 2. 3. 4. 5. 6. 7. 8. 9. 10. 11. 12. Item Status Annual training needs assessment being conducted Induction modules for all levels of staff developed Thematic training modules for all levels of staff developed Resource pool in place Resource pool being used regularly Partnerships with capacity building agencies/academic institutions Annual capacity building plan for staff, community and community cadres Training calendars for staff at block, district and state levels Training calendars for community cadres Training calendars for community institutions and members Training infrastructure at block, district and state levels Capacity building being tracked in MIS 171 Table-9 Progress of the Mission S. No. 1. 2. 3. 4. a. b. c. d. e. 5. 6. 7. 8. 9. 10. 11. 12. 13. 14. 15. 16. 17. 18. 19. 20. Items Y1 Y2 Y3 Cumulative Progress (Dec’14) No. of “new” SHGs promoted No. of Pre-NRLM SHGs revived/strengthened Total No. of SHGs No. of HHs mobilized No. of SC HHs mobilized No. of ST HHs mobilized No. of Minority HHs mobilized No. of Other HHs mobilized No. of HHs with PwD mobilized No. of SHG bookkeepers placed No. of women activists trained and in position No. of Internal CRPs deployed No. of Internal CRP rounds conducted No. of SHGs with Saving Bank A/c No. of SHGs eligible for RF No. of SHGs provided RF No. of SHGs which are more than 6 months old No. of SHGs prepared MCP No. of SHGs provided CIF No. of SHGs accessed bank credit (1st dose) No. of VOs formed No. of SHGs federated into VOs No. of VOs provided startup fund No. of CLFs promoted No. of CLFs provided startup fund 172 Table-10 Financial Inclusion S. No. 1. 2. Item Yes/No Formation of sub-committee for SLBC Regular participation in SLBC meetings in the last six months Table-11 Training of Bank Staff and Community Cadre S. No. 1. 2. 3. 4. 5. Initiated (Y/N), (If yes, then year of commencement) Item Status (Number) Branch Managers in Intensive Blocks immersed in best practice sites Training Community cadre on Bank linkage processes (Documentation, Repayment etc.) Bank Linkage Camps Conducted Introduction of Community Based Recovery Management System (VOs) Community Members trained to be financially literate Table-12 Status of Livelihood Activities S. No. 1. 2. 3. 4. 5. Item Initiated (Y/N), (If yes, then Year of Commencement) Status (Beneficiary Household) SRI Cultivation MKSP CMSA Dairy Poultry Table-13 Status of Pilots S. No. 1. 2. 3. 4. Pilot Initiated (Y/N), (If yes, then year of commencement) Status (Beneficiary Households) Anti-Human Trafficking Persons engaged in Manual Scavenging PRI-CBO-NREGA Convergence Bonded Labour 173 Table-14 Progress in Establishment of Systems S. No. 1. 2. 3. Initiated (Yes/No) Item If Yes, Month and Year of Commencement Number Blocks submitting information through transaction based MIS system Districts generating automated IUFRs through FMTSA Procurement of Essential Services completed by districts Table-15 Status of NRLP Expenditure Component Number Component Name FY 14-15 Expenditure Approved Incurred Rs. Lakhs Cumulative Expenditure Approved Incurred A A1 A2 B B1 B2 B3 B4 C C1 C2 C3 D D2 D3 D4 D5 174 Annex-16: NRLP: MTR A Suggested Methodology for Process Study 1. The purpose of the process study is to assess the ‘efficiency’ of the processes adopted by Mission Management Units and the effectiveness of such processes in terms of outputs/ results. Only key processes adopted need to be assessed under each component. Some of the illustrative processes that need to be assessed could include the following: Mission Units adopt intensive efforts to saturate social mobilization (90% target households) in the first three years of entry; Mission Units undertake inclusive social mobilization efforts which would result in all eligible vulnerable groups (the SCs, the STs and the minorities) being mobilized into SHGs on a priority basis; Resource Blocks generate adequate quality social capital to meet the requirements of intensive blocks; Sustained project efforts result in most SHGs adhering to Panchsutras; Mission units disburse funds to community institutions following MCP/MIP guidelines; Mission units facilitate leveraging of optional amount of external funds by SHGs; SHGs emerge as viable community based and community managed banks with optimized capital base, efficient fund utilization and management practices; Mission staff promote and nurture VOs as efficient first level federations of SHGs; VOs identify, train and use the services of adequate number of social capital to facilitate scaling up of the Mission; and Mission Units provide adequate technical support to members of SHGs to strengthen and diversify their livelihoods. Efficiency of BMMU is to be reckoned with reference to year-wise benchmarks indicated for each Intensive Block. 2. The focus of the process study is to understand the key processes adopted, identify internal and external constraints faced and the results achieved and likely to be achieved and the persistent problems affecting Mission activities and their effectiveness. 3. Given the purpose of the study and the time limitations, it is proposed to assess efficiency of the process adopted by interacting with a small number of key professionals of SMMU, DMMU and BMMU involved in decision making and implementation. 4. It is proposed to conduct 2 to 3 small focus group discussions/ key interviews to assess the nature and quality of processes adopted, constraints experienced and the emerging results. The FGDs may be conducted with SMMU staff and DMMU/BMMU staff (sample) and select cadres, separately, to understand different perspectives. 5. An illustrative process checklist is attached to facilitate conduct of FGD/KII (Annex -3). In each area, the focus of the FGD should be on key process adopted, process deviations observed, internal and external constraints faced and overcame and the emerging results. 6. The FGDs/KIIs are to be conducted by a 2-3 member team drawn from NMMU and SMMU. The primary responsibility for conducting the assessment and documenting the findings rest with the SMMU members. 7. A reporting template will be furnished in shortly. 175 Annex-17:NRLP: MTR Checklist for Process Study S. No. 4 Processes to be examined 1 State Level Processes 2 Social Mobilization 3 Grading and release of RF 4 MCP and CIF release 5 SHG - Bank Linkage 5 VO Formation Areas to be Explored4 Establishment of implementation architecture Recruitment of HR, induction, immersion and training Policies, guidelines and business processes Provision of support to BMMU and community etc., Selection/prioritization of blocks, clusters and villages Strategies adopted for mobilization – CRP strategy etc., Identification, revival and strengthening of existing SHGs Institution of democratic and financial norms Training of new and old SHGs Nurturing of SHGs Progress towards saturation Other issues Opening of SHG bank accounts Identification of eligible SHG for RF Grading of SHGs Release of RF Mechanism for scaling up Identification of eligible SHGs for MCP Training in MCP Conduct of MCP Appraisal of MCP and release of CIF Follow up of MCP End use of funds, types of assets created Mechanism for scaling up Identification of SHGs for bank linkage Documentation support by Bank Mitra, liaison with bankers, promotion of CBRM, access to fresh loans and repeat loans, trends in amounts and repayments. Support for accessing interest subvention. Use of bank loans and interest subvention – typology of uses of loan funds Identification of villages for VO formation Respondent group/ level (FGD or KII) SMMU, DMMU and BMMU (BMMs) DMMU, BMMU – Block Manager and CCs/PFTs, select Cadre and SHG/VO leaders DMMU, BMMU – Block Manager and CCs/PFTs, select Cadre and SHG/VO leaders DMMU, BMMU – Block Manager and CCs/PFTs, select Cadre and SHG/VO leaders BMMU – Block Manager and CCs/PFTs, select Bank Mitras and SHG/VO leaders BMMU – Block For each area, explore all the processes adopted i.e. who undertook the processes and how, time taken, what worked and what did not worked, internal and external constraints and issues faced, support received and provided, problems in scaling up etc., 176 S. No. Processes to be examined 6 Functioning of VOs 7 Cadre development – Internal CRPs, PRPs, SHG Book keepers, VO Book keepers, VO Activists, Bank Mitra, Master Book keepers etc. Human Resources Staff Induction 8 Monitoring and review mechanism Systems in operation 9 Overall progress of the block Areas to be Explored4 Process of formation of VO Institution of norms Training of VO EC/OB/Sub committees Nurturing of VOs VO saturating mobilization Training of SHGs/Community Cadres Facilitating sub-committee functioning Appraisal of MCP and release of CIF Other functions Adequacy of trained Cadres for scaling up Identification Capacity building Preparation for deployment in other blocks Adequacy and quality Village stay, attachment with CRP rounds, resource block immersion, understanding processes, tagging with the counterparts, preparation of action plan Conduct of staff reviews MIS – MPR reporting, FMS – fund flow management and reporting HR – conduct of staff reviews, grievance redress mechanism Procurement management Progress in IB, CB, capitalization, bank linkage, cadre development vis-à-vis expected outputs and timeline Respondent group/ level (FGD or KII) Manager and CCs/PFTs, select Cadre and SHG/VO leaders BMMU – Block Manager and CCs/PFTs, select Cadre and SHG/VO leaders BMMU – Block Manager and CCs/PFTs, select Cadre and SHG/VO leaders BMMU – Block Manager and CCs/PFTs BMMU – Block Manager and CCs/PFTs, 177 Annex-18 : NRLM – MTR Process Assessment Study Focus Group Discussion Guide for SMMU/DMMU/BMMU Staff Part-A: Basic Information 1. Introduction The process assessment team (comprising NMMU staff, member from other SRLM) should introduce itself, state the purpose and relevance of the MTR and the process study. Also the team should clearly state that the information sought from the group would be used for understanding and assessing the key management and implementation processes adopted by the Mission, deviations if any in the processes adopted, reasons for such deviations, results of implementation or outputs, key constraints and issues faced etc. The team should therefore encourage a free and frank discussion on each key area listed in the checklist. (Annexure 2 & 3 to the MTR Note). Three focus groups may be conducted separately for: (i) SMMU and DMMU staff; (ii) BMMU staff and CCs; and (iii) cadres (CRPs, book keepers, trainers etc.,). There should be an adequate number of respondents in each group. If the number is less than 6, the discussion could be converted into a key interview. The ideal number for an FGD is 10. 2. Identification Details SRLM: 3. S. No FGD Group: FGD Date: Focus Group Details Name Position in the Mission Date of Joining Major Functional Responsibilities 1. 2. 3. 4. 5. 6. 7. 8. 9. 10. 11. 12. 178 Part-B : Focus Group Discussion Guide for use with SMMU/DMMU/BMMU Staff members 1. General Aspects 1. Overall status of the SRLM Probes: Establishment of the Mission, progress made and present status. 2. Mission Management Systems 1. Establishment of implementation architecture Probes: Expected vs actual establishment of Mission units, plans vis a vis progress, processes adopted, reasons for delays if any. 2. Recruitment, induction, immersion and training of human resources Probes: Number of approved positions vacant at all levels, number recruited and in position, adequacy and quality, attrition, processes adopted for recruitment and training, reasons for delays and constraints faced and persistent issues, status of HR manual adoption and practice 3. Business processes established Probes: Guidelines and procedures laid down for the functioning of the Mission units (SMMU, DMMU and BMMU), delegation of powers, guidelines vis a vis practice, deviation if any etc. 4. Performance monitoring and review Probes: Last review conducted, frequency of reviews of staff, performance assessment and grievance redress, timeless of payment of salary and reimbursement of travel etc. 5. MIS Probes: Number of blocks not reporting MPR before 10th of January 2015. MPR based reports generated and used by the Mission units, systems instituted for collection for recording, collecting, compiling and transmit MIS information. 6. Procurement Probes: Key procurements pending, reasons for delays, time overruns in contracts, issues in contract management, adequacy and quality of procurement staff, community procurement systems promoted, if any. 3. Mission Footprint 1. Rollout of Mission in resource blocks Probes: Coverage of resource blocks, pace of coverage, plans vis a vis progress, support from NROs, constraints experienced. 2. Implementation in intensive blocks Probes: Coverage of intensive blocks, phasing plan vis a vis progress, adequacy of generation of internal social capital, other constraints experienced 179 4. Social Mobilization 1. Social Mobilization Probes: Strategies adopted for saturating social mobilization, pace of mobilization since inception, plans vis a vis progress, constraints experienced and tasks ahead 2. Social Inclusion Probes: Strategies adopted for promoting inclusive social mobilization, proportion of vulnerable groups mobilized (the SC, ST, PVTG, the disabled, minorities etc) plans visà-vis progress, factors affecting inclusive mobilization efforts. 5. Promotion of Community Institutions 1. New SHGs promoted and preexisting SHGs revived Probes: New SHGs promoted by external CRPs and staff in resource blocks, strategies adopted for promotion and strengthening of SHGs in intensive blocks, plans vis a vis progress, constraints experienced and persisting problems. 2. Capacity building of SHGs Probes: Type of training provided, number of SHGs provided training ,plans vis a vis progress, factors affecting training, training infrastructure available, adequacy of trainers, perceived gaps in training 3. Promotion of Panchsutra Probes: Adherence of SHGs to Panchsutras, systems for grading SHGs, efforts made to promote adherence. 4. Promotion of VOs Probes: Villages without VOs, SHGs outside VOs, governance structure prompted for VOs, norms instituted, capacity building inputs provided, SHGs-VOs financial relations 6. Capitalization of Community Institutions 1. SHGs provided RF Probes: Reasons for eligible SHGs not provided RF, mechanism in place for identification for eligible SHGs, fund transfer mechanisms, factors affecting fund disbursal and plans for scaling up 2. SHGs provided CIF Probes: Eligible SHGs not provided CIF, SHGs not provided training in MCP/MIP, trainers available, appraisal process and duration, funds disbursement route, terms and conditions of CIF, trends in end use of CIF funds, trends in repayment of CIF 3. SHGs accessing bank loans Probes: Eligible SHGs not accessing bank loans, strategies adopted for promotion of SHGs bank linkage, bank mitras placed, CBRM promoted, trends in repayment of bank loans, steps taken to promote awareness of interest subvention scheme, eligible SHGs not accessing interest subvention 4. Fund management by SHGs Probes: Proportion of members that have not accessed internal loans, steps taken to reduce idle funds with SHGs and improve velocity of fund rotation, accountability promoted. 180 7. Social Capital Generation 1 Active women identified, trained and prepared for working as internal CRPs/ trainers/ bookkeepers Probes: Number of internal CRPs and other forms of social capital prepared, number required vis a vis number available, factors affecting selection and training of CRPs etc. 8. Perceived Progress and Challenges before the Mission 1. Perceived overall progress of the Mission Probes: Perceived Key areas in which progress is not satisfactory, reasons thereof and tasks ahead. 2. Perceived overall benefits from the Mission Probes: Key benefits to the poor households in the SHGs. 3. Perceived constraints faced by the Mission Probes: Key constraints and obstacles that have affected the pace and progress of the Mission 9. Any Other Relevant Areas FGD Interviewer Documenter Start Time Finish Time 181 Annex-19: NRLP: MTR Sampling Procedure 1. Participating States All states with blocks in which intensive implementation has been in progress for more than 1 year shall participate in the MTR studies. As the states of Karnataka, UP and WB which do not have such blocks, they are not required to administer SHG, VO and cluster schedules. However, they are required to conduct the process study. They may call a representative number of community cadre and staff from all levels to the State Mission Management Unit. 2. Selection of Sample Resource Blocks The states of Chhattisgarh, Jharkhand, MP, Maharashtra and Rajasthan implementing Resource block strategy for more than 1 year, will participate in the study. The states will adhere to the sample size and distribution, indicated in the Table-1. Table-1 NRLP:MTR Proposed Sample from Resource Blocks S. No. State 1. 2. 3. 4. 5. Chhattisgarh Jharkhand Madhya Pradesh Maharashtra Rajasthan Total Source: NRLM MIS Total No. of Resource Blocks No. of Resource Block > 1 year old No. of Sample Blocks No. of Sample Clusters 4 16 7 8 5 40 4 8 6 8 3 29 2 4 3 4 2 15 4 8 6 8 4 30 No. of Sample Villages (>1 year old) 12 24 18 24 12 90 No. of Sample SHGs (>1 year old) 36 72 54 72 36 270 Before selecting the sample blocks, each state will undertake ranking of resource blocks on the basis of number of SHGs promoted/ revived and brought under NRLM fold and are at least one year old either in ascending or descending order. Subsequently, the States may select the blocks at appropriate interval, using random number generator procedure. For example, Jharkhand has a universe of 16 blocks arranged in ascending or descending order of number of SHGs from which 4 blocks are to be selected. Assuming that the 16 blocks are arranged in the descending order of number of SHGs in each of them, then the blocks in the serial order 1, 5, 9 and 13 could be selected if the first block selected is no 1. 3. Sample Clusters In each sample resource block selected, the clusters may be arranged in a descending or ascending order, again based on the number of SHGs which are more than one year old as on 31st Dec, 2014. The required number of sample clusters may be identified using the same approach used for selecting sample blocks. Thus, for example, in a block with 4 clusters (arranged in descending order of SHGs), cluster numbers 1 and 3 could be selected, if the first cluster selected is no 1. 182 4. Sample Villages In each cluster, the villages in which intensive implementation is under progress, may be arranged, again based on the total number of SHGs promoted and revived and are more than one year old in each of them. Subsequently, three villages may be selected from each cluster using the following formula:If ‘N’ is the total number of villages and ‘m’ is the required number of sample villages, then, the sample should be selected as follows. 1, 1+(N/m), 1+(N/m)+(N/m), 1+(N/m)+(N/m)+(N/m) and so on where N=total number, m= number to be selected. Please take only integer portion only (do not round-off). For example, If 2 villages are to be selected, it will be village 1, Village 1+N/2; If N=10, then it is village 1 and 1+10/2 = 6. If N=11; 1, 1+11/2 = 6. If 3 villages are to be selected, it will be village 1, 1+N/3, 1+N/3+N/3; If N=10; 1, 1+10/3, 1+10/3+10/3 = 1, 4, 7. If N=11, 1+11/3, 1+11/3+11/3 = 1, 4, 8 All VOs in the selected villages will be subject to the sample study. However, if VOs are not formed in the sample villages, only the information pertaining to the village details (point no. 1) in the village schedule may be collected. 5. Sample SHGs All 1 year old sample SHGs will constitute the universe of SHGs in each sample village. The names of the SHGs may be listed alphabetically and the first, the middle [(n/2) or (n+1)/2] and the last one may be selected, using the random generator procedure. Table-2 Proposed Sample from Intensive Blocks (other than Resource Blocks) Sl. No 1 2 3 4 5 6 7 8 9 10 State No of Intensive Blocks No of Intensive Blocks > 1 year old No of No of No of Sample Sample Sample Villages (>1 Blocks Clusters year old) Assam 25 25 2 Bihar 77 69 5 Gujarat 15 15 2 Odisha 28 21 2 Tamil Nadu 16 16 2 Chhattisgarh 12 12 2 Jharkhand 14 14 2 Madhya Pradesh 39 39 2 Maharashtra 28 9 2 Rajasthan 2 0 Total 256 220 21 Source: NRLM MIS Notes: *Includes one Partnership Block with PRADAN ** Includes one Partnership Block with MAVIM 4 10 4 4 4 4 4 4 4 42 8 20 8 8 8 8 8 8 8 84 No of Sample SHGs (>1 year old) 24 60 24 24 24 24 24 24 24 252 183 6. Selection of sample Intensive Blocks The sample proposed from intensive blocks is furnished in Table-2. The method used in case of Resource blocks may be applied to identify the required sample blocks, clusters, villages and SHGs. The only difference is that in intensive blocks, two villages per cluster and two SHGs per villages are to be selected. As in the resource blocks, all one year old SHGs in the sample would form the universe. The names of the SHGs may again be listed alphabetically, and two SHGs may be selected using the random selection procedure. 7. Selection of Sample for Assessment of Livelihoods Component For assessing emerging outcomes of MKSP and CMSA interventions, the following purposive, but representative sample has been proposed. Table-3 Proposed Sample from MKSP Blocks S. No. 1. 2. 3. 4. 5. 6. 7. State Assam Bihar Maharashtra West Bengal Gujarat Odisha Madhya Pradesh Total MKSP Sample Blocks Villages Households 5 5 5 5 5 5 5 35 50 50 50 50 50 50 50 350 Dhemaji Chakai Wardha Mohammed Bazar Nasawadi Kudumulguma Narayanganj Table-4 Proposed Sample from CMSA Blocks S. No. 1. 2. 3. State Madhya Pradesh Jharkhand Chhattisgarh Total CMSA Sample Blocks Sheopur/Pushprajgarh Goilkera Rajnandgaon Villages Households 5 5 5 15 50 50 50 150 8. Survey Teams Each state participating in the MTR is required to constitute field study teams of adequate size. Apart from nominating nodal persons, the states are required to constitute district/block teams. DPM-M&E/MIS of the district or any other DPM may head the district/ block team. For each block, 1 internal CC and 1 external CC (to the block) may be nominated to administer the schedules and collect the information using the SHG, VO and Cluster schedules. The DPM leading the team in each district will be responsible for collection of information as per the norms prescribed. Each team comprising 1 DPM and 2 CCs can complete 4 to 6 SHG schedules and 2 VO schedules and 1 cluster schedule per day i.e., 1 cluster and 2 villages. The DPM may be given the responsibility for collecting information from the sample VOs and clusters, the CCs may be entrusted with the responsibility of collecting information from the sample SHGs. Based on the size of the sample, each state is required to constitute adequate number of members in the 184 teams. States of Bihar, Jharkhand, Chhattisgarh, Madhya Pradesh and Maharashtra with larger samples would be required to identify and field teams of larger size. States with smaller sample such as Assam, Gujarat, Odisha, Tamil Nadu and Rajasthan may require smaller teams. Team size can be suitably augmented or multiple teams constituted to complete the survey as per the timeline indicated. 9. Study teams and Training All SRLMs participating in MTR studies are required to identify the state nodal person and the district/ block teams in advance and provide necessary training. As part of training, DPMs/ CCs may be required to undertake field testing of the schedules. In order to identify the district teams, it would be necessary for the states to identify the sample blocks, clusters, villages and SHGs in advance. 185 Annexure-20: NRLP: MTR SHG Schedule Code No S D B C CBO X X X *SDBCxxx, First letter in the name of the State, District, Block, Cluster, CBO and give serial no. of the schedule State : GP : District : Village : : Date of Visit Name of SHG : Block Block Type : (RB/IB/PB/HGM) : Cluster: 1. Membership 1.1 Type of SHG (1=New; 2=Revived and brought under NRLM) 1.2 Date of formation (If formed under NRLM)/Date of Coming into NRLM Fold) (If Pre-existing SHG) 1.3 Present size of SHG (No. of Members) 1.4 Social composition of members (indicate number of each social category) 1.5 Does the SHG have a Bank A/c 1.6 Date of opening Bank A/c 1.7 Length of membership in VO (in months, if member of VO, otherwise ‘0’) Leadership (Details of Present Leaders of SHG) 2. S. No. 2.1 Name ST SC Min DDMMYYYY Others DDMMYYYY Social Category* Education$ 2.2 2.3 Notes: * Indicate Response as: 1= SC, 2=ST, 3=Minority, 4= Persons with Disability, 5=Others $Indicate Response as: 1=Illiterate/Neo-literate; 2=Primary; 3=Upper Primary; 4=Secondary; 5=Others. 3. 3.1 Adherence to Panchsutras (Last 6 Months) Regularity of Meetings, Attendance of members and Savings 186 S. No. 3.1.1 Meetings Item Expected Actual Percentage 3.1.2 Attendance 3.1.3 Savings 3.2 Number of members who have taken loan from the SHG since formation of SHG/ Coming into NRLM Fold 3.3 Repayment of Internal Loans (Up to Dec ’14) S. No. 3.3.1 3.3.2 3.4 S. No. 3.4.1 3.4.2 3.4.3 3.4.4 3.4.5 3.4.6 3.4.7 Item Amount (in Rs) Total Demand Total Collection Bookkeeping Books Response Minutes Book (Not Introduced – 1; Introduced but partly updated -2; Introduced & up to date -3) Cash Book (Not Introduced – 1; Introduced but partly updated -2; Introduced & up to date - 3) General Ledger (Not Introduced – 1; Introduced but partly updated -2; Introduced & up to date -3) Loan Ledger (Not Introduced – 1; Introduced but partly updated -2; Introduced & up to date -3) Member Pass Book (Not Introduced – 1; Introduced but partly updated -2; Introduced & up to date -3) Saving Cum Attendance Register (Not Introduced – 1; Introduced but partly updated -2; Introduced & up to date -3) Monthly Report (Not Introduced – 1; Introduced but partly updated -2; Introduced & up to date -3) 4. Training/Capacity Building Provided to Members 4.1 Details of Training Provided to Members during and after the CRP rounds S. Module/Subject No. 4.1.1 SHG Formation Training During CRP rounds By Community Cadres By Staff and PRPs 4.1.2 Training on SHG Meeting processes and norms 4.1.3 Maintenance of Books of Accounts 4.1.4 MCP Training 4.1.5 Others Notes: Indicate Response as: (Yes=1, No=2) 187 4.2 How many members have attended at least 3 days of training?(including training during CRP rounds) 4.3 SHG meeting facilitation/Capacity Building during SHG Meeting 4.3.1 Are the SHG meetings being facilitated? [Yes=1; No=2] 4.3.2 Who facilitates the SHG meetings? [1=Women Activists; 2=NRLM Staff] 4.3.3 Does any training/capacity building of SHG members happen during the meeting in last 3 months? [Yes=1; No=2] 5. S. No. SHG-Bank Linkage Details (Up to December, 2014) Loan Type (TL/CCL) Before Coming into NRLM Fold Loan Amount Received (Rs) Total Outstanding Amount (Rs) 5.1 5.2 5.3 Total Amount (in Rs.) After Coming into NRLM Fold 5.4 5.5 Total Amount (in Rs.) Note: TL = Term Loan; CCL= Cash Credit Limit 6. Micro Investment Plan (MCP/MIP) and Community Investment Fund (CIF) 6.1 Details of CIF received by SHGs and Repayment of CIF (up to Dec ’14) S. No. Dose 6.1.1 1st 6.1.2 2nd 6.1.3 3rd Date of MCP/ MIP Date of Disbursement of CIF Amount (in Rs.) Requested Actual as per disbursement MCP/MIP Amount repaid to / VO (in Rs.) Amount Outstanding (In Rs.) 6.1.4 6.1.5 188 7. Micro Finance 7.1 Has the SHG been graded by VO/ NRLM staff/Promoting NGO in the last six months? [Yes=1/No=2] 7.2 Has the SHG received Revolving Fund (RF)? [Yes=1/No=2] 7.3 If yes, how much RF has the SHG received? (in Rs.) 7.4 When did the SHG receive RF date DDMMYYYY 7.5 Receipts and Payments of SHG (As on 31st December, 2014) S. Receipts No 7.5.1 Cumulative Compulsory Savings of Members 7.5.2 Cumulative Other Savings of Members 7.5.3 Cumulative loan recoveries from members 7.5.4 Cumulative Interest Income Amount (in Rs.) Amount (in Rs.) Payments Cumulative Loan disbursed to Members Cumulative Deposit with VO CIF Loan Repaid Bank Loan Repaid 7.5.5 Revolving Fund (RF) Received 7.5.6 Cumulative CIF Received Other Loans Repaid 7.5.7 Cumulative Bank Loan Received 7.5.8 Other loans Received Interest Charges Paid on Bank Linkage Other Payments Made 7.5.9 Interest Subvention Amount Received (If any) 7.5.10 Other Receipts Total Interest Charges Paid on CIF Cash in Hand (closing balance) Cash at Bank (closing balance) [incl. deposits] Total Note: All figures as per the books of records 189 7.6 Details of Savings and Credit Accessed by Members (Up to 31st Dec 2014) S. No. Name of Member Social Category* Compulsory Savings (Rs) Total Other No. of small No. of big Total No. of Amount of Savings loans loans loans Credit (Rs) accessed accessed accessed Accessed (Rs) Loan Purpose$ Total Loan Outstanding (Rs) 7.6.1 7.6.2 7.6.3 7.6.4 7.6.5 7.6.6 7.6.7 7.6.8 7.6.9 7.6.10 7.6.11 7.6.12 7.6.13 7.6.14 7.6.15 Total Notes: * - Indicate Response as: 1= SC, 2=ST, 3=Minority, 4= Persons with Disability, 5=Others $ - More than one response may be recorded. Indicate Responses as: 1 = Debt Redemption; 2 = Household Expenses; 3 = Asset Creation (to augment income); 4 = Health /education 190 Assessment of the Investigator (Based on Perceptions of the Members) 8. Social Issues/Actions 8.1 Indicate Social/Collective issues that the SHG has resolved or represented to the VO for resolution: 8.2 Indicate Redemption of Rights and Entitlement Accessed of Members facilitated by SHG: 8.3 Other Benefits Received by the SHG [as perceived by the members] 191 9. Issues faced by the SHG (if any)[as perceived by the members] SHG Scheduled is be administered by 2 CCs (one internal and one external to the cluster). The Information is to be collected from the books of accounts and other records and in consultation with all/ majority of the members, preferably in the presence of book keeper. The data recorded is to be checked by the DPM accompanying the team. The DPM may also re-visit 1 sample SHG to check the quality of information collected. The data needs to be cleaned and entered in the electronic data sheet either on the same day or within 2 days of collection of information. Name of the CC1 Name of the CC2 District/ Block District/Block Mobile No Mobile No Date 192 Glossary SHG Schedule Reference Number in the SHG Schedule Term Explanation Block type Resource Block or Intensive Block or Partnership Block or Home Grown Model Block 1.1 Type of SHG New SHG promoted under NRLM/Revived SHG (preexisting SHGs brought into NRLM fold after strengthening / training) 1.2 Date of formation Date of resolution of members forming the SHG in case of new SHGs; date of coming into NRLM fold in case of pre-existing SHGs 1.7 Length of membership in VO Number of months since joining the fold of VO 3 Adherence to Panchsutras Include adherence of SHG to accepted norm of 3.1.1 Meetings (i) 3.1.2 Attendance (i) 3.1.3 Savings (i) i. ii. iii. iv. v. conducting regular meetings; regular subscription of savings by members; regular inter-lending among members; regular repayment of loans by members; and regular book-keeping to reflect all transactions correctly and consistently. Expected – No. of meetings expected to be conducted as per the norm during the preceding six months; (ii) Actual - No. of meetings actually conducted as per the norm during the preceding six months; (iii) Percentage – (ii) ÷ (i) X 100 Expected – No. of members expected to attend during the preceding six months in all meetings (Total SHG members X No. of Meetings to be Conducted as per norm) (ii) Actual – No. of members actually attended during the preceding six months in all meetings conducted (Total SHG members that attended in each meeting conducted) (iii) Percentage – (ii) ÷ (i) X 100 (ii) Expected – Amount of savings expected to be subscribed as per norm during the preceding six months by all members (Total SHG members X Amount per member as per norm X No. of weeks or months) Actual – Amount of savings actually subscribed by members during the preceding six months (Cumulative amount of savings subscribed by members in each meeting during the preceding 193 Reference Number in the SHG Schedule Term Explanation six months) (iii) Percentage – (ii) ÷ (i) X 100 3.2 No. of members who have taken internal loan No. of SHG members who have taken internal loan from the corpus of SHG since its formation (in respect of new SHG); since coming into NRLM fold in the case of revived SHGs 3.3.1 Total Demand Cumulative amount of demand of internal loans payable by members since formation of new SHGs / since coming into NRLM fold (revived SHG) 3.3.2 Total Collection Cumulative amount of internal loans collected from members since formation of new SHGs / since coming into NRLM fold (revived SHG) 4.3.1 Are the SHG meetings being facilitated? Has the conduct of SHG meetings been regularly facilitated during the last six months? (1=Yes/2=No) 4.3.2 Who facilitates SHG meetings? Has the SHG meetings been facilitated by women activists or NRLM staff during the last six months? (1=Women activists; 2=NRLM staff; 3=None) 5 Loan type: TL Term loan 5 Loan type: CCL Cash credit limit 5.1, 5.2, 5.3 Before coming into NRLM fold Relevant only to revived SHGs brought into NRLM fold. The total loan amount received and total outstanding amount may be indicated for the SHG at the time of coming into NRLM fold 6 Date of MCP/ MIP Indicate the date when Micro-credit plan/ Micro Investment plan was prepared 6 CIF Community Investment Fund 6.1.1 Actual disbursement Amount actually disbursed to SHG Amount repaid CIF loan repaid to Mission/VO Amount outstanding Balance amount of CIF loan outstanding 7.5 Receipts and Payments All receipts and payments since formation of new SHGs up to December 2014; since coming into NRLM fold in respect of pre-existing SHGs up to December 2014 7.5.2 Cumulative deposit with VO Includes all kinds of deposits including savings made by SHGs with VO 194 Reference Number in the SHG Schedule 7.6 Term Savings and Credit Explanation Savings subscribed by individual members from inception up to December 31, 2014 in respect of new SHGs; Savings subscribed by individual members from coming into NRLM fold in respect of revived SHGs Other savings Other than normal savings subscribed by members, if any Total amount of credit accessed Total amount of loans accessed by individual members from inception up to December 31, 2014 in respect of new SHGs; Total amount of loans accessed by individual members from coming into NRLM fold in respect of revived SHGs Loan purpose Purposes of loan as recorded in books which fall into one or more of the indicated response categories 7.6 Small loans All loans below Rs.5000/- given to individual members 8.2 Rights and entitlements of SHG members Include access of member households to PDS cards/ BPL cards, AAY cards, Job cards under MGNREGS, Old age/widow and other types of pensions, National Social Assistance Benefit etc. 195 Annexure–21: NRLP – MTR VO Schedule Code No S D B C CBO X X X * SDBCxxx, First letter in the name of the State, District, Block, Cluster, CBO and give serial number of the schedule State District Block Block Type (RB/IB/PB/HGM) 5 : Cluster : : GP : : Village : : Date of Visit : 1. Details of the Village 1.1 Date of entry into the village5 1.2 Total no. of households in the village 1.3 Total no. of households mobilized into new SHGs and existing SHGs (as on date of field study) ST SC Min Others Total 2. Details of VO 2.1 Name of VO (In Capital Letters) 2.2 Type of VO (1=New; 2=Revived and brought under NRLM) 2.3 Date of Formation 2.4 Total no. of SHGs in the VO 2.5 Total SHG Members in the VO 2.6 Does the VO have bank A/c [Yes=1/No=2] 2.7 Is the VO a member of CLF? [Yes=1/No=2] 2.8 Is the VO registered? [Yes=1/No=2] 3. Leadership ST DDMMYYYY SC Min Others Total DDMMYYYY Date of formation of first SHG in the village 196 3.1 S. No. 3.1.1 Details of Office Bearers (OBs) Name of OB Designation Social Category* 3.1.2 3.1.3 3.1.4 3.1.5 3.1.6 Note: *- Indicate Response as: 1= SC, 2=ST, 3=Minority, 4= Persons with Disability, 5=Others 3.2 Has there been any rotation of Office Bearers in the VO (if VO is more than 3 year old) [Yes=1/No=2] 3.3 Details of Sub-Committees S. No. 3.3.1 Name of Sub-Committee No. of Members 3.3.2 3.3.3 3.3.4 3.3.5 4. Performance of VO 4.1 Regularity of RGB/EC Meetings (during preceding 3 months) S. Item No. 4.1.1 No. of RGB/EC meetings expected to be held as per norm 4.1.2 No. of RGB/EC meetings actually held 4.2 Dec Nov Oct Regularity of SHGs attending VO meetings (during preceding 3 months) S. No. 4.2.1 No. of SHGs part of VO Item Dec Nov Oct 4.2.2 No. of SHGs actually attended the RGB/ EC meetings 4.3 Review of Performance of SHG (During preceding 3 months) 197 S. Item No. 4.3.1 No. of SHGs expected to be reviewed based on MPR/Masa Nivedika 4.3.2 No. of SHGs reviewed based on MPR/Masa Nivedika (including grading) 4.4 Dec Nov Oct Disbursement of CIF loan to SHGs by VO S. Item No. 4.4.1 No. of SHGs eligible to receive CIF Up to Dec.’14 4.4.2 No. of SHGs provided CIF by Mission 4.4.3 No. of SHGs provided CIF by VO, based on MIP 4.5 Status of Repayment of Funds (During preceding 3 months) S. Item No. 4.5.1 Total amount of CIF due from SHGs Dec Nov Oct 4.5.2 Total amount of CIF recovered from SHGs 4.6 Status of VO Bookkeeping S. Books of Records No. 4.6.1 Membership Register Introduced Record up to Date 4.6.2 Minutes Book 4.6.3 Cash Book 4.6.4 Loan Ledger 4.6.5 General Ledger 4.6.6 Receipt & Payment Vouchers 4.6.7 Stock Register 4.6.8 CIF DCB Register 4.6.9 Bank Linkage DCB Register Any Other 4.6.10 4.6.11 Note: Indicate the Response as: Yes=1, No=2 5. Role of VO 198 5.1 Has the VO or women activists under VO mobilized left out poor into SHGs (at least one SHG) [Yes=1/No=2] 5.2 Has the VO organized/conducted training for SHGs/members [Yes=1/No=2] 5.3 Has the VO undertaken any activities in convergence with the Panchayati Raj Institutions? [Yes=1/No=2] If yes, list out the activities below 5.3.1 5.3.2 5.3.3 5.3.4 5.3.5 5.4 Has the VO undertaken any activities in convergence with the line Departments/other stakeholders? [Yes=1/No=2] If yes, list out the activities below 5.4.1 5.4.2 5.4.3 5.4.4 5.4.5 5.5 Has the VO taken up/resolved any social issues? [Yes=1/No=2] If yes, list out the activities below 5.5.1 5.5.2 5.5.3 5.5.4 5.5.5 5.6 Has the VO initiated any Collective Livelihood Activities? [Yes=1/No=2] If yes, list out the activities below 5.6.1 5.6.2 5.6.3 5.6.4 5.6.5 199 5.7 Community Cadres6 being engaged by the VO S. No. 5.7.1 Type of Cadre Number Engaged Number being Paid Honorarium* 5.7.2 5.7.3 5.7.4 5.7.5 Total 5.8 Does the VO conduct review of the community cadres? [Yes=1, No=2] 5.9 Has the VO organized training for the cadres: 5.9.1 SHG Book keeper [Yes=1/No=2] 5.9.2 Women Activists [Yes=1/No=2] 5.9.3 Others [Yes=1/No=2] 5.10 Did the VO undertake appraisal of MIP, before releasing CIF? [Yes=1/No=2] 5.11 Does the VO facilitate opening of bank a/c of SHGs? [Yes=1/No=2] 5.12 Does the VO facilitate credit linkage of SHGs? [Yes=1/No=2] 6. S. No. 6.1 Capacity Building of EC Members Module/Subject 6.2 Formation, meeting processes and norms Exposure and immersion 6.3 Training on VO management 6.4 Training on VO Book keeping 6.5 Training of Sub-committees 6.6 Training on MCP Appraisal 6.7 Training on CIF & Fund Management 6Community Yes=1; No=2 Place* Duration (Days) Trainers** Cadres expected to be paid by VO namely – VO Animators, VO Book keepers etc. 200 S. No. 6.8 6.9 Module/Subject Yes=1; No=2 Duration (Days) Place* Trainers** Training on Audit and legal compliance Training on Cadre Management Other Trainings (specify) 6.10 6.11 6.12 6.13 6.14 Note: * Indicate the Response as: 1=within the village, 2=outside the village but within the block; 3=outside the block ** Indicate the Response as: 1=By CRPs; 2=By Community Cadre; 3=By Staff 7. Financial Details of VO 7.1 Receipts and Payments of the VO (Up to 31st Dec. ’14) S. No. Receipts Amount (in Rs.) Payments 7.1.1 SHG savings held in VO CIF loans disbursed to SHGs 7.1.2 CIF recoveries from member SHGs VRF loan disbursed to SHGs 7.1.3 Interest earned on loans Deposits made with CLF (if any) 7.1.4 CIF received from CLF/SRLM CIF loan repaid to CLF 7.1.5 VRF recovered from SHGs Other loans repaid 7.1.6 VRF received from CLF/ SRLM Interest paid to CLF 7.1.7 Other loans received (if any) VO expenditure* 7.1.8 Other receipts (if any) Other payments 7.1.9 Cash in Hand (closing balance) 7.1.10 Cash at Bank (closing balance) [incl. deposits] Total Amount (in Rs.) Total 201 7.2 Details of Savings made and Credit Accessed by SHGs from VO (As on Dec 31st) S. No. Name of SHG Do the SHGs Save in the VO (Y/N)7 No. of doses of CIF loans disbursed to SHGs CIF Total Amount of CIF Loan Disbursed (Rs.) Total CIF loan Outstanding (Rs.) 7.2.1 7.2.2 7.2.3 7.2.4 7.2.5 7.2.6 7.2.7 7.2.8 7.2.9 7.2.10 7.2.11 7.2.12 7.2.13 7.2.14 7.2.15 Total The VO schedule is to be administered by the DPM and supported by one of the external CCs. The information required should be collected from records of VO and in consultation with the VO OB/EC members in the presence of VO bookkeeper. After collection of data, the DPM needs to ensure that the information collected is correct, complete and consistent. The data collected should entered in the electronic data sheet on the same day or on the following day using the electronic data sheet. Name of the CC Name of the DPM District/ Block District/ Mobile No Mobile No Date 7 Other than one time membership fee 202 Glossary VO Schedule Reference Number in the VO Schedule Term Explanation Block type Resource Block or Intensive Block or Partnership Block or Home Grown Model Date of entry into the village Date of formation of the first SHG in the village or date of entry of external CRPs into the village 2.2 Type of VO 1. New = New VO promoted under NRLM 2. Revived VO = Pre-existing VO brought under NRLM after training and strengthening 2.4 No. of SHGs that have paid membership fee and join the VO 2.8 Total no. of SHGs in the VO Registered VO 3.1 Office Bearers 3.3 VO subcommittees 4.1.1 No. of RGB/EC meetings expected to be held as per norm Regularity of SHGs attending VO meetings Present Office Bearers The designation could be President or Vice-President or Secretary or Joint Secretary or Treasurer; A person with disability could belong to the SC, the ST, minority or others. Both should be indicated Sub-Committees could be i. Bank linkage sub-committee ii. Loan recovery sub-committee iii. Monitoring sub-committee iv. Social audit sub-committee v. Review sub-committee vi. Indicate any other No. of meetings to be conducted during the preceding three months. No. of meetings actually conducted during the preceding three months as per records. 4.2.1 4.3.1 Review of Performance of SHGs 4.4.1 Number of SHGs eligible to receive CIF VO registered under appropriate State Act No. of SHGs part of VO – Number of SHGs that have paid membership fee. No. of SHGs actually attended – Number of SHGs that have actually attended and representatives signed in the EC/RGB meeting register. No. of SHGs expected to be reviewed – Number of SHGs to be reviewed based on MPR/Masanivedika as per the established norm in each month. No. of SHGs actually reviewed based on MPR/Masanivedika in each month No. of six month SHGs that have applied for CIF/submitted MCPs/MIPs up to December, 2014. No. of SHGs disbursed CIF by the Mission up to December, 2014. No. of SHGs disbursed CIF by the VO up to December, 2014. 203 Reference Number in the VO Schedule 4.5.1 4.5.2 4.6 5.2 5.3 Term Total amount of CIF due from SHGs Total amount of CIF recovered from SHGs Status of VO bookkeeping Has the VO organized/ conducted training? Has the VO undertaken any activities under convergence? 5.4 Has the VO undertaken any activities in convergence with line departments? 5.5 Has the VO taken up or resolved any social activities? 5.6 Collective Livelihood Activities 5.7 Community Cadres 5.10 Did the VO undertake Explanation Total amount of CIF due from all SHGs at the end of each month (December, November, and October 2014). Total amount of CIF recovered from all SHGs at the end of each month (December, November, and October 2014). For all books of records indicate the status in terms of one of the three options viz., 1=Introduced; 2=Record up to date; 3=Not introduced Has the VO or women activist or CRP under the VO conducted any type of training (1=Yes; 2=No) The activities that could be undertaken in convergence with PRIs could include activities relating to road access, water and sanitation, organization of health camps, MGNREGS related works, running of Anganwadi, mid-day meals, identification of program beneficiaries etc., The activities could include identification of beneficiaries, support for organization of health camps, running of Anganwadi and mid-day meal kitchens, MGNREGS related support works such as organization of crèche centers, labour groups, and supply of implements. Mobilization of ANCs and PNCs for appropriate pre-natal and post-natal support etc., These could include (i) Problems with functioning of public facilities – anganwadi, primary/elementary school, health sub-center, access to grazing lands or commons, PDS; (ii) Access to drinking water; (iii) Campaign against child labour; (iv) Prevention of illicit distillation; (v) Prevention of Atrocities against vulnerable communities/caste based violence; (vi) Prevention of Child marriages; (vii) Promotion of road access and common facilities etc. These are only illustrative. Collective livelihood activities could be one which isi. Undertaken collectively by the members of one or more SHGs; or ii. Undertaken by VO in which members from more than one SHG are involved. iii. These could include common procurement centers (e.g. milk, agricultural commodities, NTFP etc.,), marketing activities, supply of agricultural inputs and activities in the value chain that could benefit the members Could include activists, animators, bookkeepers, CRPs, trainers, para-professionals (health, agriculture, animal husbandry, NTFP etc.,) To be answer with reference to the most recent practice. 204 Reference Number in the VO Schedule 5.11 5.12 7.1 7.2 Term appraisal of MIP before releasing CIF? Does the VO facilitate opening of bank account of SHGs? Does the VO facilitate credit linkage of SHGs? Receipts and Payments of VO Details of savings made and credit accessed by SHGs Explanation Answer with reference to the more recent experience. Answer with reference to the more recent activities taken up such as using the services of bank mitras, promotion of CBRM etc., All receipts and payments of the VO as on 31st December, 2014 and as per books of accounts Cumulative as on 31st December, 2014. 205 Annex-22 Cluster Schedule Code No S D B C CBO X X X * SDBCxxx, First letter in the name of the State, District, Block, Cluster, CBO and give serial no. of the schedule : District : Block Type (RB/IB/PB/HGM) Cluster Block : Date of Visit State : : : Date of Commencement of Implementation in Block8 1. Coverage 1.1 Total no. of GPs in the Cluster 1.2 Total no. of villages in the Cluster 1.3 Total no. of rural Households in the Cluster 1.4 Total no. of villages in which Mission Implementation is in progress in the cluster 1.5 Social Composition of Households in Mission Villages S. No. Category Total Households Target Households (2/3rds of Total) DDMMYYYY Households Mobilized (Up to Dec’14) 1.5.1 SC 1.5.2 ST 1.5.3 Minorities 1.5.4 Others 1.5.5 Total 8 Resource Block: Inception of CRP Rounds Intensive Blocks: Full complement of staff inducted and placed in the block Partnership Blocks: Date of signing MoU 206 2. 2.1 Institutions of the Poor Promoted Institutions Promoted in the Cluster S. No. 2.1.1 SHG Institution Number 2.1.2 VO 2.1.3 CLF 2.1.4 BLF 2.1.5 Other Collective 2.1.6 Total 2.2 SHGs Formed/Revived and Strengthened in the Cluster S. No. Type No. Formed/ Revived during CRP Rounds No. Formed/ Revived by Community Cadre No. Formed/ Revived by Institutions/ Staff Total 2.2.1 New SHGs formed 2.2.2 SHGs revived/ Strengthened 2.2.3 Total 2.3 Capacity Building undertaken for SHG Members in Core Modules (including capacity building undertaken CRP Rounds) S. Module No. 2.3.1 SHG Concept and Management Number of SHGs Trained 2.3.2 Agenda Setting and Meeting process 2.3.3 Importance of Bookkeeping 2.3.4 MCP and fund rotation 2.3.5 Leadership and Conflict management 2.3.6 Any other Note: Indicate Response as: 1 = All trained, 2 = Some trained, 3 = None trained 2.4 Number of SHGs under NRLM fold in the cluster following Panchasutra 2.5 Number of SHGs holding membership in Village Organisations in the Cluster 207 2.6 Social Category-wise SHG membership in VOs and VO Office Bearers in the Cluster No. of Office S. No. of Members Category Bearers No. in all VOs in all VOs 2.6.1 Total members [ 2.6.2 SC members 2.6.3 ST members 2.6.4 Members belonging to Minority groups 2.6.5 Others 2.6.6 Total 2.7 Capacity Building of VO Office Bearers in Core Modules in the Cluster S. Module No. 2.7.1 Why VO? Status 2.7.2 Functions of VO 2.7.3 Structure of VO 2.7.4 Meeting process 2.7.5 Leadership 2.7.6 Fund management 2.7.7 Sub-committee System 2.7.8 MCP/MP Appraisal Any Other 2.7.9 2.7.10 2.7.11 2.7.12 2.7.13 Note: Indicate Response as: (1 = All trained, 2 = Some trained, 3 = None trained) 2.8 Types of Social Issues Taken up/Resolved by VOs in the Cluster 2.8.1 2.8.2 2.8.3 208 3. Communitisation 3.1 Total number of SHG members/community members identified and engaged to provide services to community Instituiions institutions 3.2 Community Cadre Identified, Trained and Engaged for Providing Services S. No. Cadre Type No. Required for Cluster No. Identified for Cluster No. Trained in Core Modules Fully Trained Partially Trained No. actually Providing Services in Nov/ Dec. ‘14 3.2.1 SHG Bookkeepers 3.2.2 Women Activists 3.2.3 MCP Trainers 3.2.4 PIP Facilitators 3.2.5 VO Activist/ Animator/ Community Facilitator 3.2.6 VO Bookkeeper 3.2.7 Master Bookkeepers Others 3.2.8 3.2.9 3.2.10 3.2.11 3.3 Capacity Building of Community Cadres in Specific Modules S. No. Module Number Trained up to Dec. 31st Bookkeepers 3.3.1 Basic training on Community Institutions 3.3.2 Classroom Training on Bookkeeping 3.3.3 Refresher Training Women Activists 3.3.4 Attachment to CRP Rounds 3.3.5 Immersion / Exposure visit 3.3.6 Classroom Training 209 3.3.7 TOT 3.3.8 On –the-Job Training MCP Trainers 3.3.9 Classroom Training 3.3.10 Exposure Visit to NRO/Resource Blocks VO Activist/Animator/Community Mobiliser 3.3.11 SHG Formation 3.3.12 VO Office Management 3.3.13 Exposure Visit to NRO/Resource Block 3.3.14 TOT Bank Mitra 3.3.15 Banking System 3.3.16 Account Opening 3.3.17 Loan Processing 3.3.18 Exposure Visit to NRO/Resource Block Community Auditors 3.3.19 Classroom Training on SHG Audit 3.3.20 On the Job Training Master Bookkeepers 3.3.21 Classroom training 3.3.22 ToT on Bookkeeping VO Bookkeeper 3.3.23 Basic VO Bookkeeping 3.3.24 Refresher Training Any Other 3.3.25 3.3.26 3.3.27 3.3.28 210 4. S. No. 4.1 4.2 4.2.1 4.2.2 4.2.3 4.2.4 4.2.5 4.2.6 4.3 5. Development of Internal CRPs, Internal CRP Bookkeepers and PRPs to Support other Blocks (applicable to Resource Blocks only) [Information to be collected at the Block Level] No. of CRPs Item No. of CRP Bookkeepers No. of PRPs Identified Training Exposure Visit Immersion Attachment to CRP Rounds Classroom training Deployment for local work Deployment for local training Deployed/Ready for Deployment Number of Block Staff provided capacity building [Information to be collected at the Block Level] S. No. Module No. of BMMs No. of Accountants No. of MIS Operators No. of CCs Any Other No. (Specify -------) 5.1 Initial Orientation 5.2 Village Immersion (Individual Village Stay) 5.3 Exposure Visit 5.4 Attachment with CRPs 5.5 Attachment with frontline Professionals 5.6 Attachment with peers 5.7 Classroom Training 5.8 Individual Action Plan The Cluster schedule is to be administered by the DPM and supported by one of the external CCs. The information required should be collected from records of VO and in consultation with the VO OB/EC members in the presence of VO bookkeeper. After collection of data, the DPM needs to ensure that the information collected is correct, complete and consistent. The data collected should entered in the electronic data sheet on the same day or on the following day using the electronic data sheet. Name of the CC Name of the DPM District/ Block District/ Mobile No Mobile No Date Glossary 211 Cluster Schedule Reference Number in the Cluster Schedule Term Block type Resource Block or Intensive Block or Partnership Block or Home Grown Model Cluster A cluster is a sub-block unit comprising certain GPs. The division of block into clusters in only for facilitating Mission implementation Indicate date of commencement of implementation in the sample cluster. In case of resource block, it is the date of commencement of first CRP round. In the case of intensive block, it is the date from which the cluster staff are placed. In the case of partnership block, it is the date of signing MOU. No. of villages in which mobilization has commenced Date of commencement of implementation 1.4 1.5 2.1 Explanation Mission implementation in the villages Social composition of households The number of total households under each category could be taken from 2011 District Census Handbook or from the records of the Mission or the estimates made by the Mission staff. A household said to be mobilized if at least one member from the household is mobilized into new or revived SHG. Include revived (pre-existing) SHGs/VOs and brought into NRLM fold 2.1.3 Institutions promoted in the cluster CLF 2.1.4 BLF Block Level Federation is a federation of Clusters 2.2 SHGs formed/ revived and strengthened in the cluster 2.3 Capacity Building undertaken for SHG members Number of SHGs following Panchsutra Number of SHGs holding Number formed/revived during CRP rounds are those promoted and revived by external CRPs. Number formed/revived by community cadre are those that have been promoted after the CRP rounds by internal community cadre. Number formed/revived by staff include those that are promoted/revived by either frontline staff or higher level institutions (VOs/CLFs) Includes number of SHGs trained in the core module by external CRPs, internal trainers/CRPs as well as staff. It can be community based or outside training. 2.4 2.5 Cluster Level Federation is a federation of VOs Number of SHGs adhering to Panchsutras in the cluster as per the records of Cluster Coordinators/BMMU Number of SHGs holding membership in VOs as per the records of cluster coordinators/BMMU 212 Reference Number in the Cluster Schedule 2.6 2.7 2.8 3 3.1 3.2 3.2.4 3.3 4 4 Term membership in VOs Social category of VO members and Office Bearers Capacity building of VO Office Bearers Types of social issues Explanation Number as per records of Cluster Coordinators/BMMU Number as per records of Cluster Coordinator/BMMU These could include (i) Problems with functioning of public facilities – Anganwadi, primary/elementary school, health sub-center, access to grazing lands or commons, PDS; (ii) Access to drinking water; (iii) Campaign against child labour; (iv) Prevention of illicit distillation; (v) Prevention of Atrocities against vulnerable communities/caste based violence; (vi) Prevention of Child marriages; (vii) Promotion of road access and common facilities etc. These are only illustrative. Communitization Refers to the transfer of responsibility of managing community staff and cadre to CBOs Number of SHG Number of active women identified and engaged as per members/ records of Cluster Coordinators and BMMU (SHG community bookkeepers, women activists, MCP trainers, PIP members facilitators, VO animators, VO bookkeepers, MBKs and identified and others) engaged Community Number required is the minimum number required for cadre identified, all institutions in the cluster. trained and Number identified is the number of women identified up engaged to December 31, 2014 for different functions Number trained includes those who are fully trained (in all modules) for the minimum no. of days and partially trained includes those who are not trained all modules for the minimum number of days. Number actually providing service as per records during November-December, 2014. PIP Facilitator Persons identified and made responsible for facilitating the conduct of Participatory Identification of the Poor Capacity building Indicate number of each cadre trained in specific of community modules as per the records of Cluster cadre Coordinators/BMMU Internal CRPs Internal CRPs are active women identified, trained and prepared for undertaking social mobilization, institution building, capacity building activities both in the native block and other blocks. PRPs Professional Resource Person is a staff from NRO who does the preparatory ground work for CRP rounds and 213 Reference Number in the Cluster Schedule 5 5.5 5.6 5.8 Term Capacity Building of Block Staff Attachment with frontline professionals Attachment with peers Individual action plan Explanation later follows-up the work done by the CRPs when they move to other villages. Indicate number of each category of staff provided training in specific modules It refers to on the job training with CCs/ Community mobilisers etc. It refers to attachment with other CRPs or similar cadres An action plan clearly indicating the activities to be undertaken by each block staff 214 Annex-23 Implementation Processes in a Typical Block During the first three years, intensive implementation in a block involves the following processes: Placing inducted BMMU team and PRPs to prepare ground for implementation SHG formation - Village entry by block/cluster team - Preparation of village for CRP round - CRP round Conduct of aam sabha to introduce CRPs to the village Brief survey by the CRPs to ascertain number of poor households Identification of households and formation of SHGs Basic SHG training (for 5-6 SHGs, 3 days per SHG) Identification of bookkeepers and their training (5 days) Identification of Women Activists in the village (or immediately after CRP round) Presentation of status on mobilisation and SHG formation during the round to aam sabha Follow-up facilitation and capacity building of SHGs done by PRPs, women activists and trainer CRPs Opening of bank account for SHGs Release of funds - Grading of 3-month old SHGs - Release of RF (Rs. 10,000-15,000/SHG) to SHGs - Micro-Credit Plan (MCP) preparation by 6-month old SHGs SHG member profiles prepared Individual family plans developed Member-wise plans discussed and consolidated at the SHG level Prioritisation of members’ needs (poorest given preference) Plan submitted to a committee of SHG leaders Release of CIF - Plan appraised by committee of SHG leaders and recommended to SRLM - CIF (Rs. 75,000-1,10,000) released to SHG - CIF meant for CLF, in absence of CLF it is released to VO. In absence of VO, it is released to SHG. - SHG repays the CIF amount to the VO, when it is formed, and VO repays the amount to the CLF when it is formed. - Only 5-6 SHGs in a village receive CIF directly from NRLM, other SHGs receive it from the VO, from the repaid amount VO Formation - VO Formation through Senior CRP Rounds in villages which have completed at least 9 months after the first CRP rounds One-day workshop for all SHG members on VO SHG leaders trained in VO management Appointment of VO Animator Selection of VO office bearers by VO Executive Committee; EC meets once a month 215 Repayment of CIF amount to VO by SHGs Constitution of VO Sub-committees One woman activist in the village identified as VO Animator Vulnerability Reduction Fund (Rs. 1,50,000) released to VO Conduct of PIP by VO to assess status of poverty in the village, done every two years Mobilising left out households into SHGs by VO, with focus on poorest and most marginalised households Identification and Training of Community Cadres - Continuous capacity building and nurturing of SHGs, members and leaders in core modules by local social capital and resource persons in the SHG meetings, village, non-residential and residential - Women Activists’ training includes immersions and exposure visit at NRO/best practice site (15 days), attachment with CRP rounds (15 days) and Classroom training (15 days) over a period of one-year - Best performing SHG women (completed 75 weeks of regular meetings, borrowed at least Rs. 25,000 and repaid loans on time, may have served as Woman Activist) identified as Internal CRP (during the 2nd year); trained for 15 days additionally - Best performing SHG bookkeepers identified as CRP Bookkeepers; trained for 15 days additionally. A proportion of CRP Bookkeepers would go on to become internal PRPs in the new blocks. - SHG Bookkeeper basic training conducted during CRP round itself; follow-up training provided by SRLM over a period of one year - MCP trainers, Trainer CRPs, Community auditors identified from among the SHG bookkeepers and Women Activists and trained additionally CLF is formed in the 2nd or 3rd year and BLF in the 3rd or 4th year. From year three onwards, various layering interventions such as health, nutrition, interventions for Persons with Disability (PwD), livelihoods, etc. are introduced in the block. In resource blocks, the social capital generated begins to support other blocks from year 3. 216 Annex-24 Expansion from Resource Blocks to Newer Blocks S. No State No.of NRLP resource blocks which have completed 2 years of implementation 1 Chhattisgarh 4 2 Maharashtra 8 3 Jharkhand 5 4 Madhya Pradesh 6 5 Rajasthan 10 Total No.of new blocks taken for expansion (cumulative) 33 6 Date of 1st CRP round May 2012 July 2012 Oct 2012 Nov 2012 Jan 2013 No.of new blocks taken up during 2014-15 No.of new blocks taken up during 2015-16 Internal CRPs available in March 2015 Internal CRPs available in March 2016 Internal CRPs available in March 2017 Internal CRPs available in December 2017 18 12 360 610 910 4000 0 15 0 300 900 1800 3 30 0 600 1600 2600 1 18 0 600 1400 2000 0 30 0 1200 2400 4800 22 22 105 105 360 18 3310 165 7210 360 15800 790 217 Annex Table-3.1 NRLP Implementation in Progress: Districts, Blocks and Villages Entered S. No. States Total NRLP Districts Blocks GPs Dec.’14 NRLP Implementation Started Villages Districts Blocks GPs Villages 1. Assam 8 25 358 4853 8 25 357 3889 2. Bihar 19 77 1592 9546 19 77 1167 3919 3. Chhattisgarh 9 16 1109 1960 9 16 912 1438 4. Gujarat 9 20 1178 1825 9 20 713 1069 5. Jharkhand 12 30 540 4034 12 29 453 1957 6. Karnataka 5 20 550 3068 5 20 550 2930 7. Madhya Pradesh 10 46 2900 6067 10 46 2826 5925 8. Maharashtra 10 36 2890 5038 10 36 1839 2713 9. Odisha 8 33 566 6294 7 28 200 1924 10. Rajasthan 7 7 200 1119 7 7 104 278 11. Tamil Nadu 4 16 458 3846 4 16 458 2779 12. Uttar Pradesh 22 22 1636 4368 22 22 703 793 13. West Bengal 8 32 313 4968 8 32 313 4558 14. Total 131 380 1429 0 56986 130 374 1059 5 34172 Source: NRLM-MIS 218 Annex Table-4.1 Social Mobilisation in Resource Blocks (Sample) S. No. State Sample Blocks No of Sample Clusters Total HHs in the Sample Clusters Potential Target HHs in Sample Clusters (2/3rd of Total) SC ST Minorities Others % HH Mobilised Total SC ST Minorities Others Total 1. Chhattisgarh 2 4 16637 546 10931 208 2813 14498 51 80 83 72 51 2. Jharkhand 4 8 33729 1795 20053 505 5579 27932 63 72 83 38 63 3. Madhya Pradesh 3 6 55986 5623 23952 724 5645 35944 44 52 34 36 44 4. Maharashtra 4 8 49599 3891 9711 956 19836 34394 54 43 34 40 54 5. Rajasthan 2 4 20535 5488 2042 181 4538 12249 34 18 10 54 34 6. Total: 15 30 176486 17343 66689 2574 38411 125017 45 60 46 43 45 Source: Cluster Schedule 219 Annex Table-4.2 Social Mobilisation in Intensive Blocks S. No. 1. 2. 3. 4. 5. State Sample Blocks No of Sample Clusters Total HHs in the Sample Clusters 29075 109290 30208 20071 10470 Potential Target HHs in Sample Clusters (2/3rd of Total) SC ST Assam 2 4 2257 2380 Bihar 5 10 23364 420 Chhattisgarh 1 2 4911 1015 Gujarat 2 3 534 3683 Jharkhand 2 2 1320 5844 Madhya 6. Pradesh 2 4 28231 1020 16190 7. Maharashtra 2 4 19007 1639 2375 8. Odisha 2 2 11842 1720 3426 9. Tamil Nadu 2 4 45123 6595 969 10. Total 20 35 303317 43360 36302 Note: Including Partnership blocks in Jharkhand and Maharashtra; Source: Cluster Schedule Total HH Mobilised Minorities Others SC 5029 13515 72 508 140 10224 40250 16646 10162 2225 19890 77549 22644 14887 9529 78 57 25 53 89 81 403 334 912 20994 2006 8257 4022 8426 102218 19297 12674 9502 16902 202874 46 65 72 91 61 ST Minorities Others Total 84 56 20 70 92 94 59 32 88 88 60 71 14 67 82 78 57 25 53 89 52 72 74 17 64 94 76 74 100 71 37 81 79 96 63 46 65 72 91 61 220 Annex Table-4.3 Social Mobilisation: Sample Clusters S. No State Sample Blocks No of Sample Clusters Total HHs in the Sample Clusters Potential Target HHs in Sample Clusters (2/3rd of Total) Percent of HH Mobilised SC ST Minorities Others Total SC ST Minorities Others Total 1. Assam 2 4 29075 2257 2380 5029 10224 19890 78 84 94 60 78 2. Bihar 5 10 109290 23364 420 13515 40250 77549 57 56 59 71 57 3. Chhattisgarh 3 6 46845 5457 11946 280 19459 37142 28 75 70 23 28 4. Gujarat 2 3 20071 534 3683 508 10162 14887 53 70 88 67 53 5. Jharkhand 6 10 44199 3115 25897 645 7804 37461 74 76 84 51 74 6. Madhya Pradesh 5 10 84217 6643 40142 805 7651 55241 44 52 40 36 44 7. Maharashtra 6 12 68606 5530 12086 1359 28093 47068 57 49 46 52 57 8. Odisha 2 2 11842 1720 3426 334 4022 9502 72 74 74 79 72 9. Rajasthan 2 4 20535 5488 2042 181 4538 12249 34 18 10 54 34 10. Tamil Nadu 2 4 45123 6595 969 912 8426 16902 91 17 100 96 91 11. Total: 35 65 479803 60703 102991 23568 140629 327891 57 61 68 58 57 Note: Including Partnership blocks in Jharkhand and Maharashtra Source: Cluster Schedule 221 Annex Table-4.4 Social Composition of Members Mobilized in Intensive Blocks Dec.’14 S. No. 1. 2. 3. 4. 5. Total SHG Members* 273807 880294 81646 178879 ST 77844 20703 38986 112559 173029 112751 15752 7818 36708 Karnataka 98605 Madhya Pradesh 392934 Maharashtra 252894 Odisha 236922 Rajasthan 23004 Tamil Nadu 115078 Uttar Pradesh 56120 West Bengal 452677 Total 3215889 Source: State Information Reports 13596 297771 66567 133082 4302 13986 471 45627 938245 25350 30447 43467 32375 6792 21460 15245 176971 688308 6164 4301 7699 17161 296 7134 5301 67825 295427 53495 60415 135161 54304 11614 72498 35103 162254 1293909 State Assam Bihar Chhattisgarh Gujarat Jharkhand 6. 7. 8. 9. 10 11. 12. 13. Total No. of Households SC Minority 32746 51017 260750 113678 10588 581 16365 6452 Others 112200 485163 31491 43503 Annex Table-4.5 Social Composition of Members Mobilized in Resource Blocks Dec.’14 S. No. 1. 2. 3. 4. 5. State Chhattisgarh Gujarat Jharkhand Karnataka Madhya Pradesh 6. Maharashtra 7. Rajasthan 8. Uttar Pradesh 9. West Bengal 10. Total Source: NRLM MIS Total Resource Blocks 4 3 12 3 7 8 5 12 1 55 Total SHG Members Total No. of Households ST SC Minority Others 36862 27084 73814 30456 21615 11816 50031 5462 2810 4014 6326 9197 341 3987 5203 1487 12096 7267 12254 14310 91553 69304 10875 2049 9325 69375 30548 19425 2208 31663 396 32435 297 412667 191677 9508 6220 9532 7857 66339 1985 396 3144 1819 20411 27334 10601 18591 22462 134240 222 Annex Table-4.6 Social Composition of SHG Members: Total Sample Dec.’14 S. No. State Members Belonging to SC Minority ST 1. Assam 2. Chhattisgarh 3. Gujarat 4. Jharkhand 5. Madhya Pradesh 6. Rajasthan 7. Maharashtra 8. Bihar 9. Odisha 10. Tamil Nadu 11. Total Source: Sample Data 56 302 89 965 627 12 324 31 71 34 24 61 227 158 132 67 26 831 168 50 2593 Total Others 30 74 169 126 179 158 138 530 442 30 233 2079 7 51 15 50 140 0 293 191 542 256 1219 861 377 1062 714 265 309 5796 Annex Table-4.7 Social Composition of Members in Resource Blocks: Sample Dec.’14 S. No. State 1. Chhattisgarh 2. Jharkhand 3. Madhya Pradesh 4. Rajasthan 5. Maharashtra 6. Total Source: Sample Data ST 287 698 417 12 284 1698 Members Belonging to SC Minority 33 22 59 227 125 466 51 15 47 113 Others 94 128 114 138 325 799 Total 414 899 605 377 781 3076 Annex Table-4.8 Social Composition of Sample Members in Intensive Blocks Dec.’14 S. No. State 1. Assam 2. Chhattisgarh 3. Gujarat 4. Madhya Pradesh 5. Bihar 6. Odisha 7. Tamil Nadu 8. Total Source: Sample data Total Sample SHG Members 56 15 89 210 168 50 588 Percentage of Members belonging to ST SC Minority Others 31 38 34 2 132 67 26 330 30 74 75 126 44 442 30 233 1024 191 128 256 256 714 265 309 2119 7 140 0 177 223 Annex Table-4.9 Social Composition of Sample SHG Leaders: All Blocks Dec.’14 S. State No. 1. Assam 2. Bihar 3. Chhattisgarh 4. Gujarat 5. Jharkhand 6. Madhya Pradesh 7. Maharashtra 8. Odisha 9. Rajasthan 10. Tamil Nadu 11. Total Source: Sample data ST SC 10 32 15 7 8 12 36 12 62 7 201 12 0 52 17 225 118 57 29 6 9 525 Leaders from Minority PWD 8 36 0 1 17 3 4 0 1 2 72 Others 0 0 0 0 3 0 1 0 0 0 4 13 112 29 23 34 32 101 7 56 34 441 Total 43 180 96 48 287 165 199 48 125 52 1243 Annex Table-4.10 Social Composition of Sample SHG Leaders: Resource Blocks Dec.’14 S. State No. 1. Chhattisgarh 2. Jharkhand 3. Madhya Pradesh 4. Maharashtra 5. Rajasthan 6. Total Source: Sample data ST SC 49 161 76 50 6 342 Leaders from Minorities 7 7 12 28 62 116 0 17 3 4 1 25 PWD Others 0 3 0 1 0 4 18 27 25 61 39 170 Total 74 215 116 144 108 657 Annex Table-4.11 Social Composition of Sample SHG Leaders: Intensive Blocks (%) Dec.’14 S. No. 1. 2. 3. 4. 5. 6. 7. 8. 9. State Assam Bihar Chhattisgarh Gujarat Madhya Pradesh Odisha Rajasthan Tamil Nadu Total Total 43 180 22 48 0 49 0 48 459 ST Leaders from SC Minorities 28 0 14 35 86 60 0 17 24 23 18 36 15 0 25 0 13 17 19 20 0 2 0 0 0 4 10 Others 30 62 50 48 14 15 100 65 49 224 Source: Sample data 225 Annex Table-5.1 New & Revived SHGs in NRLM fold in Intensive Blocks Dec.’14 S. No. State New SHGs Promoted Y1 Y2 Y3 Existing SHG Strengthened Total Y1 11225 2435 13660 1 Assam 9094 26970 22057 58121 0 2 Bihar 3461 2380 5841 3 Chhattisgarh 3490 2591 6081 4 Gujarat 627 3326 4992 8945 827 5 Jharkhand 0 947 947 6 Karnataka 5669 11436 10205 27310 5315 7 Madhya Pradesh 1282 3164 8374 12820 2236 8 Maharashtra 388 538 926 9 Odisha 843 600 1443 10 Rajasthan 2664 2664 11 Tamil Nadu 743 2163 2906 12 Uttar Pradesh 1756 1384 3140 13 West Bengal 14 Total 16672 66802 61330 144804 8378 Note: Y1 is up to March 2013; Y2 refers to 2013-14; and Y3 covers Apr-Dec.’14 Source: State Information Reports Y2 12112 429 1551 9758 3179 3340 2212 3469 18434 328 2016 1073 38413 96314 Y3 1365 12591 762 786 1084 892 790 3569 946 3313 242 312 26652 Total 13477 13020 2313 10544 5090 4232 8317 9274 19380 328 5329 1315 38725 131344 Total SHGs in NRLP Fold Y1 0 9094 0 0 1454 0 10984 3518 0 0 0 0 0 25050 Y2 23337 27399 5012 13248 6505 3340 13648 6633 18822 1171 2016 1816 40169 163116 Y3 3800 34648 3142 3377 6076 1839 10995 11943 1484 600 5977 2405 1696 87982 Total 27137 71141 8154 16625 14035 5179 35627 22094 20306 1771 7993 4221 41865 276148 226 Annex Table-5.2 New SHGs and Revived/Strengthened SHGs under NRLM Fold in Resource Blocks Sl. State No. 1. Chhattisgarh 2. Gujarat 3. Jharkhand 4. Karnataka 5. Madhya Pradesh 6. Maharashtra 7. Rajasthan 8. Uttar Pradesh 9. West Bengal 10. Total Source: State Information Reports New SHGs Promoted 3381 738 4914 593 3604 4629 1267 1242 87 20455 Existing SHG Strengthened 585 1838 1655 272 1033 1743 176 37 485 7824 Dec.’14 Total SHGs in NRLM Fold 3966 2576 6569 865 4637 6372 1443 1279 572 28279 Annex Table-5.3 CBOs Promoted: Total Sample S. No. Type of CBO State 1. Assam 2. Bihar 3. Chhattisgarh 4. Gujarat 5. Jharkhand 6. Madhya Pradesh 7. Maharashtra 8. Odisha 9. Rajasthan 10. Tamil Nadu 11. Total Source: Sample data SHG VO CLF BLF 1431 4582 1310 989 2409 2056 2475 494 466 1053 17265 98 284 45 23 95 111 99 7 15 191 968 0 4 0 0 0 2 0 41 0 0 47 0 0 0 0 2 0 0 1 0 0 3 Other Collectives 0 9 0 0 1 0 2 11 0 0 23 Total 1529 4879 1355 1012 2507 2169 2576 554 481 1244 18306 Annex Table-5.4 CBOs Promoted in Resource Blocks S. No. Type of CBO State 1. Chhattisgarh 2. Jharkhand 3. Madhya Pradesh 4. Maharashtra 5. Rajasthan 6. Total Source: Sample data SHG VO CLF BLF 983 1633 1324 1487 466 5893 45 65 62 0 15 187 0 0 0 0 0 0 0 0 0 0 0 0 Other Collectives 0 0 0 0 0 0 Total 1028 1698 1386 1487 481 6080 227 Annex Table-5.5 SHGs Formed/Revived and Strengthened: Total Sample S. No. Formed during CRP Rounds New Revived 0 0 898 26 663 110 0 0 821 563 668 265 694 168 40 0 425 0 217 639 4426 1771 State 1 Assam 2 Bihar 3 Chhattisgarh 4 Gujarat 5 Jharkhand 6 Maharashtra 7 Madhya Pradesh 8 Odisha 9 Rajasthan 10 Tamil Nadu 11 Total Source: Sample data Formed by Community Cadre New Revived 588 588 839 59 154 18 0 0 584 342 540 216 169 4 10 100 0 0 23 2 2907 1329 Formed by Institutions/ Staff New Revived 95 160 2743 17 244 121 465 524 43 56 236 131 1093 347 19 325 11 30 140 32 5089 1743 Total New 683 4480 1061 465 1448 1444 1956 69 436 380 12422 Revived 748 102 249 524 961 612 519 425 30 673 4843 Annex Table-5.6 SHGs Formed/Revived and Strengthened in Resource Blocks: Sample S. No. 1. 2. 3. 4. 5. 6. Formed during CRP Rounds State Chhattisgarh Jharkhand Madhya Pradesh Maharashtra Rajasthan Total Formed by Community Cadre Formed by Institutions/Staff Total No of SHGs in NRLM Fold Percent of New SHGs Formed/Revived New Revived New Revived New Revived New Revived Total 663 821 110 563 154 123 18 27 37 43 1 56 854 987 129 646 983 1633 During CRP Rounds 79 85 694 168 73 4 443 105 1210 277 1487 58 5 37 668 425 3271 265 0 1106 131 0 481 33 176 11 710 51 30 243 975 436 4462 349 30 1431 1324 466 5893 70 91 74 12 0 10 17 9 16 82 By Community Cadre 17 9 By Staff 4 6 228 Source: Sample data 229 Annex Table-5.7 Training Provided to SHGs: All Blocks S. No. 1. 2. 3. 4. 5. 6. 7. 8. 9. 10. 11. Total no. Sample SHGs 19 60 47 24 96 78 96 23 36 23 502 States Assam Bihar Chhattisgarh Gujarat Jharkhand Madhya Pradesh Maharashtra Odisha Rajasthan Tamil Nadu Total During CRP Rounds 16 31 1 76 45 64 21 34 11 299 By Comm. Cadres 6 18 54 10 23 5 6 122 By Staff/PRPs 4 50 25 22 44 74 46 2 2 7 276 Annex Table-5.8 Training Provided to Sample SHGs During CRP Rounds: Resource Blocks S. No. 1. 2. 3. 4. 5. 6. States Chhattisgarh Jharkhand Madhya Pradesh Maharashtra Rajasthan Total Total No. Sample SHGs 36 72 54 72 36 270 During CRP Rounds 31 63 45 63 34 236 By Comm. Cadres 26 47 8 14 95 By Staff/ PRPs 30 43 51 31 7 162 Annex Table-5.9 Training Provided to Sample SHGs on Meeting Processes: All Blocks S. No. 1. 2. 3. 4. 5. 6. 7. 8. 9. 10. 11. States Assam Bihar Chhattisgarh Gujarat Jharkhand Madhya Pradesh Maharashtra Odisha Rajasthan Tamil Nadu Total Total no. Sample SHGs 19 60 47 24 96 During CRP Rounds 78 96 23 36 23 502 45 64 21 34 11 299 16 31 1 76 By Comm. Cadres 12 2 26 64 9 26 5 10 154 By Staff/ PRPs 6 51 31 19 47 75 49 2 7 7 294 230 Annex Table-5.10 Sample SHGs Trained Maintenance of Books of Accounts: All Blocks S. No. 1. 2. 3. 4. 5. 6. 7. 8. 9. 10. 11. States Assam Bihar Chhattisgarh Gujarat Jharkhand Madhya Pradesh Maharashtra Odisha Rajasthan Tamil Nadu Total Total No. Sample SHGs 19 60 47 24 96 78 96 23 36 23 502 During CRP Rounds 28 52 44 55 30 20 17 246 By Comm. Cadres 6 16 28 54 11 32 5 11 163 By Staff/ PRPs 4 43 27 15 64 71 64 2 34 8 332 Annex Table-5.11 Sample SHGs Trained Maintenance of Books of Accounts: Resource Blocks S. No. 1. 2. 3. 4. 5. 6. States Chhattisgarh Jharkhand Madhya Pradesh Maharashtra Rajasthan Total Total no. Sample SHGs 36 72 54 72 36 270 During CRP Rounds 28 45 44 54 30 201 By Comm. Cadres 28 37 8 18 91 By Staff/ PRPs 27 60 50 47 34 218 Annex Table-5.12 MCP Training Provided to Sample SHGs: All Blocks S. No. 1. 2. 3. 4. 5. 6. 7. 8. 9. 10. 11. States Assam Bihar Chhattisgarh Gujarat Jharkhand Madhya Pradesh Maharashtra Odisha Rajasthan Tamil Nadu Total Total no. Sample SHGs 19 60 47 24 96 78 96 23 36 23 502 During CRP Rounds 3 By Comm. Cadres 4 5 23 26 12 9 13 2 48 8 34 1 65 123 By Staff/ PRPs 4 56 20 11 56 55 38 240 231 Annex Table-5.13 MCP Training Provided to Sample SHGs: Resource Blocks S. No. 1. 2. 3. 4. 5. 6. States Chhattisgarh Jharkhand Madhya Pradesh Maharashtra Rajasthan Total Total No. Sample SHGs 36 72 54 72 36 270 During CRP Rounds 3 21 12 8 2 46 By Comm. Cadres 23 32 4 23 By Staff/ PRPs 20 51 36 25 82 132 Annex Table-5.14 Other Types of Training Provided to Sample SHGs: All Blocks S. No. 1. 2. 3. 4. 5. 6. 7. 8. 9. 10. 11. States Assam Bihar Chhattisgarh Gujarat Jharkhand Madhya Pradesh Maharashtra Odisha Rajasthan Tamil Nadu Total Total no. Sample SHGs 19 60 47 24 96 78 96 23 36 23 502 During CRP Rounds 3 By Comm. Cadres 4 5 23 26 12 9 13 2 48 8 34 1 65 123 By Staff/ PRPs 4 56 20 11 56 55 38 240 Annex Table-5.15 Other Types of Training Provided to Sample SHGs: Resource Blocks S. No. 1. 2. 3. 4. 5. 6. States Chhattisgarh Jharkhand Madhya Pradesh Maharashtra Rajasthan Total Total no. Sample SHGs 36 72 54 72 36 270 During CRP Rounds 7 7 10 2 By Comm. Cadres 5 6 4 1 By Staff/ PRPs 18 14 12 5 26 16 49 232 Annex Table-5.16 Members Provided Three Day Basic Training: All Blocks S. No. 1. 2. 3. 4. 5. 6. 7. 8. 9. 10. 11. State Total Members Assam Bihar Chhattisgarh Gujarat Jharkhand Madhya Pradesh Maharashtra Odisha Rajasthan Tamil Nadu Total 191 714 542 256 1225 861 1062 265 377 309 5802 Members who have undergone three days of training 125 670 403 173 894 677 930 254 317 192 4635 Annex Table-5.17 Members Provided Three Day Basic Training: Resource Blocks S. No. 1. 2. 3. 4. 5. 6. State Total Members Chhattisgarh Jharkhand Madhya Pradesh Maharashtra Rajasthan Total 414 905 605 781 377 3082 Members who have undergone three days of training 402 778 555 691 317 2743 Annex Table-5.18 SHGs Provided Facilitation Support: All Blocks S. No. 1. 2. 3. 4. 5. 6. 7. 8. 9. 10. 11. States Assam Bihar Chhattisgarh Gujarat Jharkhand Madhya Pradesh Maharashtra Odisha Rajasthan Tamil Nadu Total Total No. of Sample SHGs 19 60 47 24 96 78 96 23 36 23 502 SHGs being Facilitated 17 60 45 17 85 71 92 22 29 23 461 233 Annex Table-5.19 SHGs Provided Facilitation Support: Resource Blocks S. No. 1. 2. 3. 4. 5. 6. States Total No. Sample SHGs SHGs being facilitated 36 72 54 72 36 270 34 63 48 68 29 242 Chhattisgarh Jharkhand Madhya Pradesh Maharashtra Rajasthan Total Annex Table-5.20 SHGs Provided Facilitation Support by Active Women and Staff: All Blocks S. No. 1. 2. 3. 4. 5. 6. 7. 8. 9. 10. 11. State Assam Bihar Chhattisgarh Gujarat Jharkhand Madhya Pradesh Maharashtra Odisha Rajasthan Tamil Nadu Total No. of Sample SHGs 19 60 47 24 96 78 96 23 36 23 502 SHGs facilitated by Active Women 17 60 23 2 87 21 71 11 25 17 334 SHG facilitated by NRLM Staff 2 24 22 5 57 25 11 11 6 163 Annex Table-5.21 SHGs Provided Facilitation Support by Active Women and Staff: Resource Blocks S. No. 1. 2. 3. 4. 5. 6. State Chhattisgarh Jharkhand Madhya Pradesh Maharashtra Rajasthan Total No. of Sample SHGs 36 72 54 72 36 270 SHGs facilitated by Active Women 23 65 19 49 25 181 SHG facilitated by NRLM Staff 13 4 35 23 11 86 234 Annex Table-5.22 SHGs Providing Training During Preceding Three Months: All Blocks S. No. 1. 2. 3. 4. 5. 6. 7. 8. 9. 10. 11. State Assam Bihar Chhattisgarh Gujarat Jharkhand Madhya Pradesh Maharashtra Odisha Rajasthan Tamil Nadu Total No. of Sample SHGs 19 60 47 24 96 78 96 23 36 23 502 SHGs Trained in Last 3 Months 4 16 26 13 59 49 36 21 12 5 241 Annex Table-5.23 SHGs Providing Training During Preceding Three Months: Resource Blocks S. No. 1. 2. 3. 4. 5. 6. State Chhattisgarh Jharkhand Madhya Pradesh Maharashtra Rajasthan Total SHGs Trained in Last 3 Months 25 44 32 24 12 137 No. of Sample SHGs 36 72 54 72 36 270 Annex Table-5.24 Attendance of Members at Sample SHG Meetings: All Blocks S. No. State 1. 2. 3. 4. 5. 6. 7. 8. 9. 10. 11. Assam Bihar Chhattisgarh Gujarat Jharkhand Madhya Pradesh Maharashtra Odisha Rajasthan Tamil Nadu Total Expect. 4966 19872 13697 5344 33295 24129 20623 3600 10134 Total Act. Attend 3946 15739 12446 3560 28186 19960 18633 3449 9365 % 79 79 91 67 85 83 90 96 92 135660 115284 85 235 Annex Table-5.25 Savings Subscribed by Members: All Blocks S. No. 1. 2. 3. 4. 5. 6. 7. 8. 9. 10. 11. State Assam Bihar Chhattisgarh Gujarat Jharkhand Madhya Pradesh Maharashtra Odisha Rajasthan Tamil Nadu Total Expected Total Conducted Percentage 57610 194280 245580 120218 406240 548085 421625 117790 150690 43252.5 172830 237520 116168 392725 514295 414675 109870 146115 75 89 97 97 97 94 98 93 97 2262118 2147450.5 95 Annex Table-5.26 Stipulated Meetings Conducted During Last Six Months: Sample SHGs S. No. State 1. Assam 2. Bihar 3. Chhattisgarh 4. Gujarat 5. Jharkhand 6. Madhya Pradesh 7. Maharashtra 8. Odisha 9. Rajasthan 10. Tamil Nadu 11. Total Source: Sample data Total SHG Meetings During Preceding 6 Months Expected Conducted Percentage 494 402 81 1689 1561 92 1209 1198 99 520 344 66 2526 2427 96 2187 1975 90 1906 1847 97 315 303 96 974 899 92 1480 1361 92 13288 12329 93 236 Annex Table-5.27 Number of Meetings held Vis-à-vis Expected During Last Six Months: Sample SHGs S. No. 1. 2. 3. 4. 5. 6. 7. 8. 9. 10. 11. State Assam Bihar Chhattisgarh Gujarat Jharkhand Madhya Pradesh Maharashtra Odisha Rajasthan Tamil Nadu Total Intensive Blocks Expect. Held. 494 402 1689 1561 265 261 520 344 Resource Blocks Expect. Held. % 81 92 98 66 624 457 73 303 315 104 1480 5375 1361 4701 92 87 Partnership Blocks Expect. Held. % 944 937 99 1887 1416 1906 1860 1375 1847 99 97 97 974 899 92 7127 6918 97 % 639 147 567 143 89 97 786 710 90 237 Annex Table-5.28 Average Member Attendance at Meetings: All Blocks S. No. 1. 2. 3. 4. 5. 6. 7. 8. 9. 10. 11. State Assam Bihar Chhattisgarh Gujarat Jharkhand Madhya Pradesh Maharashtra Odisha Rajasthan Tamil Nadu Total Intensive Blocks Act. Expect. Attend 4966 3946 19872 15739 2850 2799 5344 3560 % 79% 79% 98% 67% 6656 4462 67% 3600 3449 96% 23062 66350 40705 74660 177% 113% Resource Blocks Act. Expect. Attend % 10847 9647 89% 25064 15757 20623 21343 13923 18633 85% 88% 90% 10134 9365 92% 82425 72911 88% Partnership Blocks Act. Expect. Attend % 8231 1716 6843 1575 83% 92% 9947 8418 85% 238 Annex Table-6.1 SHG Savings both Old and New SHGs: All Sample Blocks S. No. 1 2 3 4 5 6 7 State/ Age in Weeks Assam 52-76 76-100 100-124 >148 Bihar 52-76 76-100 100-124 124-148 >148 Chhattisgarh <52 52-76 76-100 100-124 124-148 Gujarat 52-76 76-100 124-148 >148 Jharkhand <52 52-76 76-100 100-124 124-148 >148 Madhya Pradesh 52-76 76-100 100-124 >148 Maharashtra <52 52-76 76-100 100-124 124-148 No. of SHGs 12 2 8 1 1 57 27 9 3 5 13 41 6 11 8 8 8 9 3 2 2 2 49 4 20 18 3 1 3 69 25 22 21 1 78 6 26 16 21 8 Average Size of SHG 10 10 10 10 11 12 12 12 12 12 12 11 11 11 11 12 13 10 10 11 10 12 12 12 13 12 14 10 12 11 11 11 11 12 11 12 11 12 11 10 Average Savings 6841 10925 6400 3100 5940 13343 6615 10132 13107 15430 28789 21064 23867 12773 16333 18992 37164 18069 13160 23640 9600 28330 19946 9634 16252 15749 78565 26955 22547 17180 13206 17846 21100 19550 23274 25881 23498 15569 24827 30629 Average Savings/Capita 680 1093 640 310 540 1111 568 854 1125 1222 2371 1835 2258 1210 1470 1610 2968 1651 1316 2259 960 2237 1568 714 1249 1326 5683 2696 1801 1569 1202 1639 1930 1629 2101 2290 2108 1330 2287 2950 239 S. No. 8 9. 10 State/ Age in Weeks >148 Odisha <52 52-76 76-100 100-124 >148 Rajasthan <52 52-76 76-100 100-124 Tamil Nadu 52-76 100-124 >148 Total 1 21 6 5 1 2 7 30 6 9 14 1 4 1 1 2 Average Size of SHG 14 11 13 10 11 12 11 10 10 10 10 11 15 13 16 16 Average Savings 33600 29293 32838 22062 3300 20525 37639 9508 6137 9533 11100 7220 173925 20150 165850 254850 Average Savings/Capita 2400 2591 2632 2099 300 1800 3459 927 598 937 1080 656 10551 1550 10366 15144 370 11 20116.3 1716.0 No. of SHGs Annex Table-6.2 Amount of Savings Collected by SHGs During Preceding 6 Months In Rs. S. No. 1. 2. 3. 4. 5. 6. 7. 8. 9. 10. 11. State Assam Bihar Chhattisgarh Gujarat Jharkhand Madhya Pradesh Maharashtra Odisha Tamil Nadu Rajasthan Total 19 60 47 24 96 Expected 57610 194280 245580 120218 406240 Amount Collected 43252.5 172830 237520 116168 392725 78 548085 514295 94 96 24 38 24 506 421625 117790 414675 109870 98 93 150690 2262118 146115 2147450.5 97 95 No. of Sample SHGs Percentage 75 89 97 97 97 240 Annex Table-6.3 Savings Undertaken by Sample SHGs in All Blocks S. No. 1. 2. 3. 4. 5. 6. 7. 8. 9. 10. 11. State Assam Bihar Chhattisgarh Gujarat Jharkhand Madhya Pradesh Maharashtra Odisha Rajasthan Tamil Nadu Total Intensive Blocks Expect. Act. Sav 57610 194280 76200 120218 43252.5 172830 75950 116168 % 75% 89% 100% 97% 117560 94100 80% 117790 109870 93% 1655374 2339032 1611756 2223926.5 97% 95% Resource Blocks Expect. Act. Sav % 169380 161570 95% 341030 261625 421625 334725 251695 414675 98% 96% 98% 150690 146115 97% 1344350 1308780 97% Partnership Blocks Expect. Act. Sav % 65210 168900 58000 168500 89% 100% 234110 226500 97% 241 Annex Table-6.4 No. of members who have taken loans: All Blocks S. No. 1. 2. 3. 4. 5. 6. 7. 8. 9. 10. 11. State Assam Bihar Chhattisgarh Gujarat Jharkhand Madhya Pradesh Maharashtra Odisha Rajasthan Tamil Nadu Total Total Members 191 714 542 256 1225 861 1062 277 397 321 5846 Members who have taken loans 135 640 485 96 1182 754 974 236 193 286 4981 % 71% 90% 89% 38% 96% 88% 92% 85% 49% 89% 85% Annex Table-6.5 No. of members who have taken loans: Resource Blocks S. No. 1. 2. 3. 4. 5. 6. State Chhattisgarh Jharkhand Madhya Pradesh Maharashtra Rajasthan Total Total Members 414 905 605 781 397 3102 Members who have taken loans 414 830 564 760 193 2761 % 100% 92% 93% 97% 49% 89% 242 Annex Table -6.6 Savings of Sample SHGs (New) by Age: All Blocks S. No. 1. 2. 3. 4. 5. 6. 7. 8. 9. State/ Age in Weeks Assam 52-76 76-100 100-124 Bihar 52-76 76-100 100-124 124-148 >148 Chhattisgarh 52-76 76-100 100-124 124-148 Jharkhand <52 52-76 76-100 Madhya Pradesh 52-76 76-100 100-124 Maharashtra <52 52-76 76-100 100-124 >148 Odisha <52 Rajasthan <52 52-76 76-100 100-124 Total No. of SHGs 8 2 5 1 57 27 9 3 5 13 24 7 6 6 5 21 1 8 12 Average Member Size of SHGs 10 10 10 10 12 12 12 12 12 12 12 11 12 12 12 12 11 12 12 Average Savings per SHG 7100 10925 6370 3100 13343 6615 10132 13107 15430 28789 17977 11029 15838 16967 31482 11069 4280 11451 11380 Average Savings per Member 710 1093 637 310 1111 568 854 1125 1222 2371 1560 997 1394 1477 2646 948 389 974 978 50 11 15341 1407 23 14 13 46 1 15 15 14 1 2 2 26 6 7 12 1 234 11 11 11 11 15 11 12 11 14 12 12 10 10 10 10 11 11 11746 15904 21095 19080 19800 16588 14942 25094 33600 12640 12640 7982 6137 7757 9100 7220 14353.6 1057 1496 1931 1635 1320 1405 1268 2243 2400 1057 1057 792 598 776 910 656 1259 243 Annex Table -6.7 Savings of Sample SHGs (New) by Age: Resource Blocks S. No. 1. 2. 3. 4. 5. 6. State/ Age in Weeks Chhattisgarh 52-76 76-100 100-124 124-148 Jharkhand <52 52-76 76-100 Madhya Pradesh 52-76 76-100 100-124 Maharashtra 52-76 76-100 100-124 >148 Rajasthan <52 52-76 76-100 100-124 Total No. of SHGs 23 6 6 6 5 19 1 7 11 38 19 12 7 39 11 13 14 1 26 6 7 12 1 145 Average Member Size of SHGs 12 12 12 12 12 12 11 12 12 11 11 11 11 11 10 11 11 14 10 10 10 10 11 11.1 Average Savings per SHG 17981 9888 15838 16967 31482 10396 4280 9613 11450 15854 12903 15388 24664 17724 12986 12575 25094 33600 7982 6137 7757 9100 7220 14567.6 Average Savings per Member 1557 892 1394 1477 2646 892 389 797 998 1430 1151 1428 2189 1593 1240 1128 2243 2400 792 598 776 910 656 1309 244 Annex Table -6.8 Grading of Sample SHGs: All Blocks S. No. 1. 2. 3. 4. 5. 6. 7. 8. 9. 10. 11. State No. of Sample SHGs SHGs graded 19 60 47 24 96 78 96 23 36 23 502 9 30 33 20 50 52 71 22 9 10 306 No. of Sample SHGs SHGs graded 36 72 54 72 36 270 30 39 31 53 9 162 Assam Bihar Chhattisgarh Gujarat Jharkhand Madhya Pradesh Maharashtra Odisha Rajasthan Tamil Nadu Total Annex Table-6.9 Grading of Sample SHGs: Resource Blocks S. No. 1. 2. 3. 4. 5. 6. State Chhattisgarh Jharkhand Madhya Pradesh Maharashtra Rajasthan Total Annex Table-6.10 Sample SHGs Provided RF: All Blocks S. No. 1. 2. 3. 4. 5. 6. 7. 8. 9. 10. 11. State Assam Bihar Chhattisgarh Gujarat Jharkhand Madhya Pradesh Maharashtra Odisha Rajasthan Tamil Nadu Total No. of SHGs 19 60 47 24 96 78 96 23 36 23 502 SHGs Provided with RF Number Percentage 8 41 35 23 88 70 68 7 36 374 42% 68% 77% 96% 92% 90% 0% 75% 245 Annex Table-6.11 Sample SHGs Provided RF: Resource Blocks S. No. 1. 2. 3. 4. 5. 6. State Chhattisgarh Jharkhand Madhya Pradesh Maharashtra Rajasthan Total No. of SHGs SHGs provided with RF Number Percentage 36 72 54 72 36 270 32 68 49 56 36 241 89% 94% 91% 78% 100% 89% Annex Table–6.12 No. of Sample SHGs Provided with CIF: All Blocks S. No. 1. 2. 3. 4. 5. 6. 7. 8. 9. 10. 11. State Assam Bihar Chhattisgarh Gujarat Jharkhand Madhya Pradesh Maharashtra Odisha Rajasthan Tamil Nadu Total No. of SHGs 19 60 47 24 96 78 96 23 36 23 502 SHGs provided with CIF Number Percentage 1 5% 56 93% 26 55% 0% 85 89% 48 62% 27 243 0% 48% Annex Table–6.13 No. of Sample SHGs Provided with CIF: Resource Blocks S. No. 1. 2. 3. 4. 5. 6. State Chhattisgarh Jharkhand Madhya Pradesh Maharashtra Rajasthan Total No. of SHGs 36 72 54 72 36 270 SHGs provided with CIF Number Percentage 26 72% 67 93% 36 67% 16 22% 0% 145 54% 246 Annex Table-6.14 No. of Sample SHGs Accessed Bank Credit: All Blocks S. No. 1. 2. 3. 4. 5. 6. 7. 8. 9. 10. 11. State Assam Bihar Chhattisgarh Gujarat Jharkhand Madhya Pradesh Maharashtra Odisha Rajasthan Tamil Nadu Total No. of SHGs 19 60 47 24 96 78 96 23 36 23 502 SHGs Accessed Bank Credit Number Percentage 1 20 17 7 36 20 36 19 5% 33% 36% 29% 38% 26% 16 172 70% 34% Annex Table-6.15 No. of Sample SHGs Accessed Bank Credit: Resource Blocks S. No. 1. 2. 3. 4. 5. 6. State Chhattisgarh Jharkhand Madhya Pradesh Maharashtra Rajasthan Total No. of SHGs 36 72 54 72 36 270 SHGs accessed Bank Credit Number Percentage 13 32 9 18 72 36% 44% 17% 25% 0% 27% 247 Annex able – 6.16 Idle Funds with Sample SHGs by Age: All Blocks S. No. 1. 2. 3. 4. 5. 6. 7. 8.. State/Age Assam 52-76 76-100 >148 Bihar 52-76 76-100 100-124 124-148 >148 Chhattisgarh <52 52-76 76-100 100-124 124-148 Gujarat 76-100 124-148 >148 Jharkhand <52 52-76 76-100 100-124 >148 Madhya Pradesh 52-76 76-100 100-124 >148 Maharashtra <52 52-76 76-100 100-124 124-148 >148 Odisha <52 Name of SHG 8 2 5 1 57 27 9 3 5 13 36 5 9 8 7 7 4 1 2 1 43 3 17 17 3 3 45 11 16 17 1 69 6 23 13 18 8 1 16 4 Average of Idle Cash Percentage 54% 49% 59% 42% 27% 36% 22% 38% 25% 10% 26% 21% 26% 44% 24% 13% 20% 52% 13% 4% 39% 48% 37% 40% 31% 49% 45% 66% 35% 42% 29% 35% 57% 26% 44% 26% 54% 24% 60% 86% 248 S. No. 9. 10. 11. State/Age Average of Idle Cash Percentage 14% 51% 77% 40% 15% 47% 50% 29% 42% 1 4% 23% 37% Name of SHG 52-76 100-124 >148 Rajasthan <52 52-76 76-100 100-124 Tamil Nadu 52-76 100-124 >148 Total 4 2 6 26 6 7 12 1 3 1 1 1 307 Annex Table-6.17 Average Idle Cash with Sample SHGs: Resource Blocks Number S. No. 1. 2. 3. 4. 5. 6. 0-5000 (Rs.) 5 4 3 24 12 48 State Chhattisgarh Jharkhand Madhya Pradesh Maharashtra Rajasthan Total 5000-10000 (Rs.) 10 6 2 8 10 36 10000 and Above (Rs.) 12 21 24 16 4 77 Total 27 31 29 48 26 161 Annex Table-6.18 Status of Bookkeeping in Sample SHGs: Intensive Blocks S. No. 1. 2. 3. 4. 5. 6. 7. 8. State Assam Chhattisgarh Gujarat Madhya Pradesh Bihar Odisha Tamil Nadu Total No. of SHGs 19 11 24 24 60 23 23 184 Minutes Book 63% 9% 42% 46% 75% 74% 100% 65% Cash Book 5% 0% 46% 58% 57% 39% 83% 48% General Ledger 5% 0% 50% 58% 7% 17% 78% 29% Loan Members Ledger Passbook 53% 16% 0% 9% 50% 50% 71% 46% 27% 45% 35% 43% 91% 96% 46% 47% Savings Register 37% 18% 50% 58% 78% 52% 83% 61% 249 Annex Table-6.19 Status of Bookkeeping in Sample SHGs: Resource Blocks S. No. 1. 2. 3. 4. 5. 6. State Chhattisgarh Jharkhand Madhya Pradesh Maharashtra Rajasthan Total No. of SHGs 36 72 Minutes Book 69% 90% Cash Book 36% 42% General Ledger 25% 42% Loan Ledger 75% 97% Members Passbook 67% 97% Savings Register 92% 97% 54 83% 65% 54% 69% 76% 87% 72 36 270 90% 67% 83% 78% 58% 57% 76% 56% 53% 74% 75% 79% 69% 86% 80% 88% 58% 87% Annex Table-6.20 Velocity of Fund Rotation in Sample SHGs: Up to Dec.’14 State Assam 52-76 76-100 100-124 >148 Bihar 52-76 76-100 100-124 124-148 >148 Chhattisgarh <52 52-76 76-100 100-124 124-148 Gujarat 52-76 76-100 124-148 >148 Jharkhand <52 52-76 76-100 100-124 >148 Average Corpus Per SHG in Rs. 11793 19225 11518 3460 7465 32608 23024 25537 18557 26111 63148 37604 31097 25212 31519 39667 62734 30001 20848 32394 20573 50769 39800 27112 32869 36097 116310 44410 Average Loan Disbursed 15042 15750 16350 5300 12900 125109 76101 86471 104717 144390 250933 166604 43340 104254 121089 215628 318074 57313 4000 24750 81500 119000 137703 38102 91053 149106 456683 160900 Velocity 0.9 0.8 0.7 1.5 1.7 1.1 1.0 1.2 1.0 1.2 1.3 1.6 1.1 1.0 1.6 2.9 1.5 1.0 0.1 0.8 1.0 2.7 1.2 0.6 1.1 1.3 2.1 1.6 250 Madhya Pradesh 52-76 76-100 100-124 >148 Maharashtra <52 52-76 76-100 100-124 124-148 >148 Odisha <52 52-76 76-100 100-124 >148 Rajasthan <52 52-76 76-100 100-124 Tamil Nadu 52-76 100-124 >148 Grand Total 33027 28607 33956 37038 34430 41403 35975 36153 32667 50515 54240 65651 30449 33529 20079 3350 21598 41617 25464 21310 25740 27232 23410 199281 19590 164024 306755 36384 91428 55551 104285 115953 154600 158140 52742 107655 121658 258842 194373 447153 182900 182917 98139 1200 91500 295500 27424 22217 25885 30962 25000 450550 40000 371800 695200 125984 0.9 0.7 1.0 1.0 0.9 1.8 1.1 1.9 1.8 2.2 1.4 1.7 0.7 0.7 0.8 0.4 1.0 0.8 1.0 1.0 1.0 1.0 1.1 0.8 0.6 0.8 1.0 1.3 251 Annex Table-6.21 Leverage Ratio (Own Fund to Bank Loan) in Sample SHGs: All Blocks S. No 1. 2. 3. 4. 5. 6. 7. State Assam 52-76 76-100 100-124 >148 Bihar 52-76 76-100 100-124 124-148 >148 Chhattisgarh <52 52-76 76-100 100-124 124-148 Gujarat 52-76 76-100 124-148 >148 Jharkhand <52 52-76 76-100 100-124 >148 Madhya Pradesh 52-76 76-100 100-124 >148 Maharashtra <52 52-76 76-100 100-124 124-148 No. of SHGs Savings 12 2 8 1 1 57 27 9 3 5 13 40 5 11 8 8 8 9 3 2 2 2 47 3 20 18 3 3 82090 21850 51200 3100 5940 760525 178605 91190 39320 77150 374260 850410 130000 140505 130660 151935 297310 162619 39479 47280 19200 56660 954809 35735 332265 283474 235695 67640 68 1182812 24 22 21 1 75 6 26 15 19 8 327545 392620 443097 19550 1772648 155287 610952 229705 498072 245032 RF CIF 45000 15000 30000 Total In Rs; Dec.’14 Lever Bank Loan age Ratio 50000 0.4 0.0 50000 0.6 0.0 0.0 877000 0.2 50000 0.0 0.0 99000 0.5 178000 0.5 550000 0.5 1310000 0.5 100000 0.7 230000 0.4 100000 0.2 100000 0.2 780000 0.9 100000 0.4 0.0 0.0 100000 2.6 0.0 484000 0.1 24000 0.2 98000 0.1 274000 0.2 88000 0.2 0.0 2100000 50000 900000 850000 150000 150000 127090 36850 81200 3100 5940 4279525 2043605 561190 188320 342150 1144260 2605410 145000 605505 460660 571935 822310 232619 59479 62280 39200 71660 3684809 130735 1502265 1373474 430695 247640 855000 2555000 4592812 1452900 0.3 305000 285000 255000 10000 754200 40000 188000 210000 279000 22200 860000 760000 885000 50000 1496101 1492545 1437620 1583097 79550 4022949 195287 948952 805806 1427072 537232 130000 574900 668000 80000 3309000 50000 1485000 270000 942000 422000 0.1 0.4 0.4 1.0 0.8 0.3 1.6 0.3 0.7 0.8 600000 375000 90000 15000 120000 435000 15000 105000 90000 120000 105000 70000 20000 15000 20000 15000 630000 45000 270000 240000 45000 30000 2919000 1490000 380000 149000 250000 650000 1320000 360000 240000 300000 420000 150000 366101 650000 270000 252 S. No 8. 9. 10 11 State >148 Odisha <52 52-76 76-100 100-124 >148 Rajasthan <52 52-76 76-100 100-124 Tamil Nadu 52-76 100-124 >148 Total No. of SHGs 1 21 6 5 1 2 7 29 6 8 14 1 4 1 1 2 362 Savings RF CIF 33600 615160 197030 110310 3300 41050 263470 279140 36820 79700 155400 7220 695700 20150 165850 509700 7355913 15000 65000 15000 20000 60000 30000 435000 90000 120000 210000 15000 25000 25000 3914200 10390101 Total 108600 680160 212030 130310 3300 41050 293470 714140 126820 199700 365400 22220 720700 20150 165850 534700 21660214 Bank Loan 140000 3935500 1082500 473000 145000 2235000 958500 50000 325500 583000 12476900 Lever age Ratio 1.3 5.8 5.1 3.6 0.0 3.5 7.6 0.0 0.0 0.0 0.0 0.0 1.3 2.5 2.0 1.1 0.6 253 Annex Table–7.1 Growth of VOs Per Block: NRLP S. No. State Intensive Blocks 1. 2. 3. 4. 5. 6. 7. 8. 9. 10. 11. 12. 13. 14. Assam Bihar Chhattisgarh Gujarat Jharkhand Karnataka Madhya Pradesh Maharashtra Odisha Rajasthan Tamil Nadu Uttar Pradesh West Bengal Total 25 77 16 20 29 20 46 36 28 7 16 22 32 374 No. of VOs formed Y1 Y2 Y3 Total 1049 320 1369 1118 1160 2482 88 101 189 230 166 396 117 540 687 0 202 202 522 866 800 2188 116 323 536 975 96 48 144 32 31 63 507 692 204 30 185 872 2668 528 3196 6772 4939 12583 Average No. of VOs Per Block 55 32 12 20 24 10 48 27 5 9 43 0 100 34 No. of SHGs federated into VOs Y1 Y2 Y3 Total 10555 3211 13766 12050 13444 27939 633 725 1358 1713 1342 3055 1404 6480 8244 0 2061 2061 2780 4683 4237 11700 1271 2855 4862 8988 1152 528 1680 2445 360 289 568 279 2016 5977 7993 Average No. of SHGs Per VO 10 11 7 8 12 10 5 9 12 9 12 0 6856 24699 5512 30211 62049 48658 117563 9 9 254 Annex Table-7.2 SHGs Holding Membership in Sample VOs: All Blocks S. No. State Total No. of SHGs in the Sample Clusters 1. 2. 3. 4. 5. 6. 7. 8. 9. 10. 11. Assam Bihar Chhattisgarh Gujarat Jharkhand Maharashtra Madhya Pradesh Odisha Rajasthan Tamil Nadu Total 1431 4582 1310 989 2409 2056 2475 494 466 1053 17265 No. of SHGs Following Panchsutra 1205 4211 1198 265 2321 1968 1995 359 394 877 14793 No of SHGs Holding Membership in the VO 976 3377 621 177 967 1330 543 488 124 846 9449 Percent of SHG Memberships 68.20 73.70 47.40 17.90 40.14 64.69 21.94 98.79 26.61 80.34 54.73 Annex Table-7.3 SHGs Holding Membership in Sample VOs:: Resource Blocks S. No. 1. 2. 3. 4. 5. 6. State Chhattisgarh Jharkhand Maharashtra Madhya Pradesh Rajasthan Total Total No of SHGs in the sample Clusters 983 1633 1324 1487 466 5893 No of SHGs Following Panchsutra No of SHGs Holding membership in the VO Percent of SHG memberships 982 1569 1266 1285 394 5496 621 552 733 0 124 2030 63.17 33.80 55.36 0.00 26.61 34.45 Annex Table-7.4 SHGs Federated into Sample VOs: All Blocks S. No. 1. 2. 3. 4. 5. 6. 7. 8. 9. 10. State Assam Bihar Chhattisgarh Gujarat Jharkhand Madhya Pradesh Maharashtra Odisha Rajasthan Total Sample VOs SHGs Federated in Sample VOs Size of VO 17 19 11 4 22 8 24 8 8 121 172 217 135 30 230 64 303 208 71 1430 10 11 12 8 10 8 12 26 9 12 255 Annex Table-7.5 SHGs Federated into Sample VOs: Resource Blocks S. No. State Sample VOs SHGs Federated in Sample VOs Size of VO 1. Chhattisgarh 11 135 2. Jharkhand 17 174 3. Madhya Pradesh** 0 4. Maharashtra 16 187 5. Rajasthan 8 71 6. Total 52 567 Note: ** In the state of Madhya Pradesh, VOs are not formed in the resource blocks 12 10 0 11 9 11 Annex Table -7.6 Regularity of Sample VO Meetings: All Blocks S. No 1. Sample Types All Blocks Total Sample VOs 121 VO Meetings Dec Nov Oct E A P E A P E A P 179 152 85 166 139 84 168 150 89 2. Resource 52 56 54 96 44 47 107 47 47 100 Blocks** 3. Intensive 69 123 98 80 122 92 75 121 103 85 Blocks* Note: (1) ** In the state of Madhya Pradesh, VOs are not formed in the resource blocks. (2) * in case of Chhattisgarh VOs are not formed in the intensive blocks. (3) E-Expected; A-Actual; P-Percent 256 Annex Table -7.7 Regularity of Sample VO Meetings: Intensive and Resource Blocks S. No. State 1. 2. 3. 4. 5. 6. 7. 8. 9. Assam Bihar Chhattisgarh Gujarat Jharkhand Madhya Pradesh Maharashtra Odisha Rajasthan Sample VOs Dec E A 17 19 14 7 22 8 25 32 8 17 17 13 6 22 8 26 16 6 10. Total 121 152 Note: E-Expected; A-Actual; P-Percent 131 17 19 11 4 22 8 24 8 8 Nov P E A 100 89 93 86 100 100 104 50 75 17 19 10 7 22 8 23 32 2 13 17 10 6 22 7 25 16 3 86 140 119 Oct P E A P 76 89 100 86 100 88 109 50 150 17 18 15 7 21 8 24 32 0 16 17 13 6 21 8 25 16 1 94 94 87 86 100 100 104 50 0 85 142 123 87 Annex Table-7.8 SHGs Attending VO Meetings: Total Sample No of SHGs in the VOs Dec Nov Oct 1. Assam 162 162 162 2. Bihar 217 215 213 3. Chhattisgarh 132 126 125 4. Gujarat 30 30 30 5. Jharkhand 208 196 189 6. Madhya Pradesh 64 64 64 7. Maharashtra 318 312 307 8. Odisha 208 195 188 9. Rajasthan 73 12 0 10. Total 1412 1312 1278 Note: Including partnership blocks Source: VO Sample S. No. Sate No of SHGs Attending VO meetings Dec Nov Oct 147 118 128 185 200 191 128 123 124 28 30 28 203 190 195 61 52 62 331 264 272 202 195 193 61 12 0 1346 1184 1193 % of attendance Dec 91 85 97 93 98 95 104 97 84 95 Nov 73 93 98 100 97 81 85 100 100 90 Oct 79 90 99 93 103 97 89 103 0 93 257 Annex Table-7.9 SHGs Attending VO Meetings: Resource Blocks S. No. 1. 2. 3. 4. 5. 6. Sate Chhattisgarh Jharkhand Madhya Pradesh Maharashtra Rajasthan Total No of SHGs in the No of SHGs Attending VOs VO Meetings Dec Nov Oct Dec Nov Oct 132 126 125 128 123 124 172 160 153 167 154 159 0 0 0 0 0 0 181 175 172 202 145 149 73 12 0 61 12 0 558 473 450 558 434 432 % of attendance Dec 97 97 0 112 84 100 Nov 98 96 0 83 100 92 Oct 99 104 0 87 0 96 Annex Table-7.10 SHG Reviewed by Sample VOs: All Blocks S. No. 1. 2. 3. 4. 5. 6. 7. 8. 9. 10. State Assam Bihar Chhattisgarh Gujarat Jharkhand Madhya Pradesh Maharashtra Odisha Rajasthan Total Total No of SHGs expected to be reviewed by the VO Dec Nov Oct 0 215 31 0 80 50 261 0 0 637 0 215 30 0 80 50 260 0 0 635 0 215 29 0 77 50 250 0 0 621 Total No. of SHGs actually Reviewed Percentage of SHGs reviewed Dec Dec 0 178 17 0 44 29 152 0 0 420 Nov 0 182 15 0 44 33 132 0 0 406 Oct 0 172 17 0 37 27 124 0 0 377 0 83 0 0 55 58 58 0 0 66 Nov 0 85 0 0 55 66 51 0 0 64 Oct 0 80 0 0 48 54 50 0 0 61 Annex Table-7.11 SHG reviewed by Sample VOs: Resource Blocks S. No. State 1. 2. 3. 4. 5. 6. Chhattisgarh Jharkhand Madhya Pradesh Maharashtra Rajasthan Total Total No. of SHGs expected to be reviewed by the VO Dec Nov Oct 31 30 29 67 67 64 0 0 0 145 145 137 0 0 0 243 242 230 Total No. of SHGs actually Reviewed Dec 17 43 0 60 0 120 Nov 15 43 0 58 0 116 Oct 17 36 0 53 0 106 Percentage of SHGs reviewed by VOs Dec 55 64 0 41 0 49 Nov 50 64 0 40 0 48 Oct 59 56 0 39 0 46 258 Annex Table-7.12 Status of CIF Recovery in Sample VOs: All Blocks S. No. 1. 2. 3. 4. 5. 6. 7. 8. 9. 10. State Assam Bihar Chhattisgarh Gujarat Jharkhand Madhya Pradesh Maharashtra Odisha Rajasthan Total Dec Amount of CIF due Nov 121050 941608 76700 0 3251025 463825 390751 0 0 5244959 107900 824338 69500 0 2999772 384213 338946 0 0 4724669 Oct Amount of CIF recovered Dec Nov Oct 94670 733207 55000 0 2497430 595542 284270 0 0 4260119 0 560350 68300 0 225580 108947 186151 0 0 1149328 0 525950 68300 0 123213 88941 185346 0 0 991750 Recovery Percentage Dec Nov Oct 0 441758 54000 0 105685 103736 141870 0 0 847049 0 60 89 0 7 23 48 0 0 22 0 64 98 0 4 23 55 0 0 21 0 60 98 0 4 17 50 0 0 20 Annex Table-7.13 Status of CIF Recovery in Sample VOs: Resource Blocks S. No. 1. 2. 3. 4. 5. 6. State Chhattisgarh Jharkhand Madhya Pradesh Maharashtra Rajasthan Total Amount of CIF due Dec Nov 76700 2951025 0 264630 0 3292355 69500 2699772 0 207730 0 2977002 Oct 55000 2197430 0 185630 0 2438060 Amount of CIF recovered Dec Nov Oct 68300 225580 0 60030 0 353910 68300 123213 0 54130 0 245643 54000 105685 0 43230 0 202915 Recovery Percentage Dec Nov Oct 89 8 0 23 0 11 98 5 0 26 0 8 98 5 0 23 0 8 259 Annex Table-7.14 MIP Appraisal in Sample VOs: Resource Blocks S. No. 1. 2. 3. 4. No. of Sample VO 11 22 24 57 State Chhattisgarh Jharkhand Maharashtra Total No. of VOs Undertaking MIP Appraisal 3 8 10 21 Percentage 27 41 68 21 Annex Table-7.15 SHGs Provided CIF by Sample VOs: All Blocks S. No. 1. 2. 3. 4. 5. 6. 7. 8. 9. State Assam Bihar Chhattisgarh Gujarat Jharkhand Madhya Pradesh Maharashtra Odisha Rajasthan Sample VOs No. of SHGs Provided CIF Total Eligible SHGs for Directly by By VOs Total CIF Mission 17 19 11 4 22 110 214 85 23 171 20 181 77 7 162 17 0 14 4 11 37 181 91 11 173 8 192 111 26 137 25 8 8 227 173 73 55 0 0 24 8 8 79 8 8 Percent of SHGs Provided CIF Directly by By VOs Total Mission 18 15 34 85 0 85 91 16 107 30 17 48 95 6 101 58 24 0 0 48 10. 122 1268 613 112 725 Total (613) Note: Tamil Nadu sample will be included after getting the field data revalidated. Source: Sample VO data 14 71 11 5 11 9 (112) 35 5 11 57 (725) Annex Table-7.16 SHGs Provided CIF by Sample VOs: Resource Blocks No of SHGs Provided Percent of SHGs CIF Provided CIF S. Sample State Directly Directly No. VOs By By by Total by Total VOs VOs Mission Mission 11 85 77 8 85 91 9 100 1. Chhattisgarh 17 142 141 15 156 99 11 110 2. Jharkhand 0 134 80 80 60 0 60 3. Madhya Pradesh 16 156 55 4 59 35 3 38 4. Maharashtra 8 73 0 0 0 0 0 5. Rajasthan 52 590 353 27 380 60 5 64 6. Total Note: In Jharkhand, some SHGs have received CIF twice. Source: Sample VO data. Total Eligible SHGs for CIF 260 Annex Table-7.17 CIF Amount Provided to SHGs by Sample VOs: Total Sample S. No. State Sample VOs 17 Assam 19 Bihar 11 Chhattisgarh 4 Gujarat 22 Jharkhand Madhya 8 6. Pradesh 24 7. Maharashtra 8 8. Odisha 8 9. Rajasthan 121 10. Total Note: Excluding Tamil Nadu 1. 2. 3. 4. 5. Total Eligible SHGs for CIF 110 214 85 23 171 192 227 173 73 1268 SHGs Provided CIF CIF Amount Provided Rs. CIF Amount Per SHG (in Rs.) 37 181 91 11 173 1000000 10290000 3799500 15000 6490000 27027 556851 41753 1364 37514 137 79 8 8 725 2140000 4807000 0 28541500 15620 60848 0 0 39368 Annex Table-7.18 CIF Amount Provided to SHGs by Sample VOs: Resource Blocks S. No 1. 2. 3. 4. 5. 6. State Chhattisgarh Jharkhand Madhya Pradesh Maharashtra Rajasthan Total CIF Amount Provided Rs. 85 142 No. of SHGs Provided CIF 85 156 3799500 6190000 CIF Amount Per SHG (in Rs.) 44700 39679 134 80 0 0 156 73 590 59 0 380 2165000 0 12154500 36695 0 31986 Sample VOs Total Eligible SHGs for CIF 11 17 16 8 52 261 Annex Table-7.19 Role of Sample VOs in Other Activities: Total Sample S. No. 1. 2. 3. 4. 5. 6. 7. 8. 9. 10. VOs Engaged in State Assam Bihar Chhattisgarh Gujarat Jharkhand Madhya Pradesh Maharashtra Odisha Rajasthan Total Sample VOs 17 19 11 4 22 8 24 8 8 121 SM Training 2 19 8 2 16 6 14 8 2 77 16 1 2 11 3 9 8 2 52 Percent of VOs Undertaking Other Activities Convergence with PRI Working with LDs 2 14 2 2 6 5 21 4 2 3 4 6 13 56 28 SM Training Convergence with PRI Working with LDs 12 100 73 50 73 75 56 100 25 63 0 84 9 50 50 38 36 100 25 43 12 74 18 50 27 63 84 50 0 46 12 0 27 0 18 75 52 0 0 23 Annex Table-7.20 Role of Sample VOs in Other Activities: Resource Blocks VOs Undertaking Other Activities S. No State 1. 2. 3. 4. Chhattisgarh Jharkhand Maharashtra Total Sample VOs 11 17 16 44 Percent of VOs Undertaking Other Activities SM Training Convergence with PRI Working with LDs SM Training Convergence with PRI Working with LDs 8 12 1 9 5 15 2 3 13 18 3 3 7 13 73 71 0 60 9 53 29 33 18 18 76 40 27 18 41 29 27 262 Annex Table-7.21 Capacity Building of EC Members in Sample VOs: Intensive Blocks S. No. 1. 2. 3. 4. 5. 6. 7. 8. 9. 10. State Assam Bihar Chhattisgarh Gujarat Jharkhand Madhya Pradesh Maharashtra Odisha Rajasthan Total Sample VOs 17 19 No of VOs that provided Training and Exposure and Immersion to EC members: Intensive Blocks Exposure Book Sub Cadre Meetings and Management MCP CIF Audit keeping Committees Management Immersion 10 1 6 19 10 17 18 16 8 13 10 4 5 4 5 1 2 4 2 4 2 2 4 3 2 8 8 4 8 2 8 6 7 8 8 8 8 3 4 8 8 8 8 5 8 4 1 4 69 62 22 48 42 33 32 27 3 14 263 Annex Table-7.22 Capacity Building of EC Members in Sample VOs: Resource Blocks S. No. 1. State Sample VOs No of VOs that provided Training and Exposure and Immersion to EC members: Resource Blocks Exposure Book Sub Cadre Meetings and Management MCP CIF Audit keeping Committees management Immersion 11 2 10 11 3 5 7 3 2 11 2. 3. 4. 5. Chhattisgarh Gujarat Jharkhand Maharashtra Rajasthan 17 16 8 17 15 2 1 6. Total 52 45 3 13 4 12 8 9 5 5 6 8 2 4 2 27 31 17 16 17 5 6 Annex Table-7.23 Receipts and Payments of Sample VOs: All Blocks In Rs. Cumulative Up to Dec.’14 S. No. 1. 2. 3. 4. 5. 6. 7. 8. 9. State Assam Bihar Chhattisgarh Gujarat Jharkhand Madhya Pradesh Maharashtra Rajasthan Total Number of VOs 17 19 11 4 22 8 24 8 113 Total Receipts of VO 1148152 17886113 3542369 352700 9612457 3550396 7177754 16060 43286001 Receipts Per VO 67538 941374 322034 88175 436930 443800 299073 2008 383062 Total Payments of VO 1149812 17869844 4297858 352700 10760302 3736450 7219382 34300 45420648 Payments Per VO 67636 940518 390714 88175 489105 467056 300808 4288 401953 264 Annex Table-8.1 Social Capital Available: All States S. No. State Blocks 1. Assam 25 2. Bihar 77 3. Chhattisgarh 16 4. Gujarat 20 5. Jharkhand 29 6. Karnataka 20 7. Madhya Pradesh 46 8. Maharashtra 36 10. Odisha 28 11. Rajasthan 7 12. Tamil Nadu 16 13. Uttar Pradesh 22 14. West Bengal 32 15. Total 374 Source: State Information Reports Total SHGs 27137 71141 8154 16625 14035 5179 35627 22094 20306 1771 7993 4221 41865 276148 No. of SHG Bookkeepers Placed BKs Per Block 40084 7377 6246 612 4915 1261 16083 19613 782 861 7252 213 1086 106385 1603 96 390 31 169 63 350 545 28 123 453 10 34 284 No. of SHGs Per BK No. of Women Activists Trained and Position No. of Women Activists Per Block No. of SHGs Per Women Activist No. of Internal CRPs Deployed 1 10 2 27 3 4 2 1 26 2 1 20 39 3 0 1822 1428 1944 1450 0 8886 1711 0 84 9120 95 0 26540 0 24 89 97 50 0 193 48 0 12 570 4 0 71 0 39 7 9 10 0 4 13 0 22 1 44 0 11 703 2081 0 0 140 383 8957 70 526 140 152 0 116 13268 Internal CRPs Per Block 28 27 0 0 5 19 195 2 19 20 10 0 4 35 No. of SHGs per CRP 68 34 0 0 100 14 4 316 39 13 53 0 361 22 265 Annex Table-8.2 SHG Bookkeepers Services Available in Intensive Blocks S. No 1. 2. 3. 4. 5. 6. 7. 8. 9. 10. State Assam Bihar Chhattisgarh Gujarat Jharkhand Maharashtra Madhya Pradesh Odisha Tamil Nadu Total Total SHGs in Sample Clusters 1431 4582 327 989 776 732 988 494 1053 11372 No. of SHG book keepers Required 1430 523 296 88 776 732 828 59 46 4778 No. Actually Identified 762 513 280 60 776 728 419 57 46 3641 No. Actually Serving 123 469 250 0 301 703 382 33 23 2284 Percent of BKs available (No actually serving/ No required) 8.60 89.67 84.46 0.00 38.79 96.04 46.14 55.93 50.00 47.80 Annex- Table-8.3 MCP Trainers Available: Intensive Blocks S. No 1. 2. 3. 4. 5. 6. 7. 8. 9. 10. State Assam Bihar Chhattisgarh Gujarat Jharkhand Maharashtra Madhya Pradesh Odisha Tamil Nadu Total Total SHGs in Sample Clusters 1431 4582 327 989 776 732 988 494 1053 11372 No. of MCP Trainers Required No. of MCP Trainers Identified No. Actually Serving 12 16 22 40 96 39 20 63 0 308 12 10 11 20 31 39 12 63 0 198 12 0 11 0 31 28 12 34 0 128 Percent of MCP Trainers available (No actually serving/ No required) 100.00 0.00 50.00 0.00 32.29 71.79 60.00 53.97 0.00 41.56 266 Annex Table-8.4 VO Book Keepers Available: Intensive Blocks S. No. State Total VOs in the Sample Clusters 1. 2. 3. 4. 5. 6. 7. 8. 9. 10. Assam Bihar Chhattisgarh Gujarat Jharkhand Maharashtra Madhya Pradesh Odisha Tamil Nadu Total 98 284 0 23 30 49 99 7 191 781 No. of VO Book Keepers Required No. of VO Book Keepers Identified No. Actually Serving 82 73 0 30 18 49 128 7 23 410 17 56 0 22 18 46 83 7 23 272 0 55 0 0 13 39 47 3 23 180 Percent of VO Book Keepers Available (No. actually serving/ No required) 0.00 75.34 0.00 0.00 72.22 79.59 36.72 42.86 100.00 43.90 267 Annex Table -8.5 All Community Cadres Required, Identified, Trained and Engaged: Total Sample Dec.’14 S. No. State Total Sample Clusters Total Community Cadre Required Total Identified Percent Identified No of Cadre Trained in Core Modules Fully Partially No Actually Providing Services % of Cadre Servicing (Total required/ Actually working) 1. Assam 4 1561 828 53.04 149 503 168 10.76 2. Bihar 10 911 821 90.12 584 186 671 73.66 3. Chhattisgarh 6 1675 1503 89.73 1192 237 998 59.58 4. Gujarat 3 213 123 57.75 0 73 0 0.00 5. Jharkhand 10 3786 3174 83.84 2629 133 1820 48.07 6. Maharashtra 12 2878 2598 90.27 1752 495 2170 75.40 7. MP 10 4088 2417 59.12 1481 713 1733 42.39 8. Odisha 2 222 209 94.14 144 0 106 47.75 9. Rajasthan 4 608 325 53.45 87 141 96 15.79 10. Tamil Nadu 4 515 515 100.00 492 0 492 95.53 11. Total 65 16457 12513 76.03 8510 2481 8254 50.15 268 Annex Table-8.6 VO Sub-Committees in Intensive Blocks S. No. 1. 2. 3. 4. 5. 6. 7. 8. State Sample VOs Number of VOs having Loan Social Action Bank Linkage Repayment Committee Committee Committee 11 7 16 18 16 11 4 4 3 1 Assam Bihar Gujarat Jharkhand 17 19 4 5 Madhya Pradesh Maharashtra Odisha 8 8 8 8 3 8 6 5 8 5 4 Total 69 51 47 40 Annex Table-8.7 VO Sub-Committees in Resource Blocks S. No. 1. 2. 3. 4. 5. State Sample VOs Number of VOs having Social Action Loan repayment Bank Linkage Committee committee Committee Chhattisgarh Jharkhand Maharashtra Rajasthan 11 17 16 8 5 7 2 2 3 4 4 Total 52 14 2 11 269 Annex Table –9.1 Status of SRLMs Submitting System Generated IUFRS (Tally IUFR) S. No 1. 2. 3. 4. 5. State Assam Bihar Chhattisgarh Gujarat Jharkhand System Generated IUFR for Dec.’14 Manual IUFR Manual IUFR System generated System generated System generated Remarks 6. 7. Karnataka Maharashtra System generated System generated 8. 9. 10. MP Odisha Rajasthan System generated System generated Manual IUFR Under trail run. 11. Tamil Nadu Not Submitted Under trail run. 12. 13. Uttar Pradesh West Bengal Not Submitted Not Submitted Under trail run. Under trail run. Under trail run. Tally FMS not being implemented 270 Annex Table – 9.2 Status of Procurement of Essential Services: NRLP States As on 6th March 2015 Sl. No 1 1. 2. 3. 4. 5. 6. 7. 8. 9. 10. 11. 12. 13. State Completed TOR/EOI RFP Final Stage Total Key services 2 3 6 8 7 7 7 4 6 6 3 6 4 2 6 4 2 5 6 7 8 8 8 8 8 8 8 8 8 8 8 8 8 72 13 Assam Bihar Chhattisgarh Gujarat Jharkhand Karnataka Maharashtra MP Odisha Rajasthan Tamil Nadu Uttar Pradesh West Bengal Total 1 1 1 0 1 3 1 2 2 1 2 2 1 2 2 2 10 9 1 2 3 104 271 Annex Table –9.3 NRLP Expenditure Up to Dec. ‘14 S. No State 1. 2. 3. 4. 5. 6. 7. 8. A.P. (NRO) Assam Bihar Chhattisgarh Gujarat Jharkhand Karnataka Kerala (NRO) M.P. Maharashtra Orissa Rajasthan T.N. U.P. West Bengal Sub Total NMMU Grand Total 9. 10. 11. 12. 13. 14. 15. 16. 17. 18. Actual Exp during 2012-13 0.00 259.76 905.34 301.91 179.56 376.84 138.26 Actual Exp during 2013-14 912.30 1891.83 11320.98 1518.66 1358.01 3848.99 568.55 Actual Up to Dec. 2014 (1415) 624.62 3312.82 10719.81 2279.85 1068.00 5156.02 882.16 0.00 3391.97 832.65 1004.96 38.31 813.09 10.17 0.00 8252.82 1432.03 9684.85 485.98 7475.76 3442.93 1123.82 331.72 2455.44 312.00 2852.55 39899.52 1665.42 41564.94 517.99 6378.03 3859.83 1328.95 402.49 2127.60 1068.15 1214.90 40941.22 1090.37 42031.59 Rs. Lakh Total Expenditure 1536.92 5464.41 22946.13 4100.42 2605.57 9381.85 1588.97 1003.97 17245.76 8135.41 3457.73 772.52 5396.13 1390.32 4067.45 89093.56 4187.82 93281.38 272
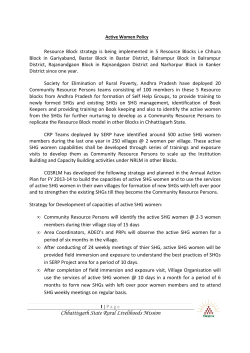
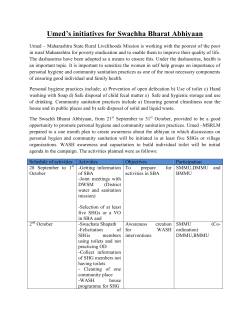
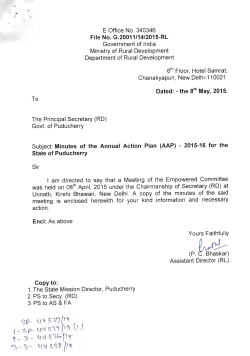


© Copyright 2026