
Curtin University Annual Report 2014
2014 ANNUAL REPORT CURTIN UNIVERSITY FOUNDATION ANNUAL REPORT 2014 We’re making tomorrow better. Curtin strives to meet global challenges by supporting practical research and teaching that addresses issues and creates solutions for healthy, sustainable and successful societies. Curtin’s goal is to benefit the community locally, nationally and internationally, today and in the future. Help us make tomorrow better, together. Curtin University Foundation give.curtin.edu.au L-R – His Excellency Malcolm McCusker, Vice-Chancellor Professor Deborah Terry and Chancellor Colin Beckett. Cover image: Still from Curtin University’s 2014 television commercial. Curtin’s 2014 television commercial uses thousands of paper shapes to create a morphing effect, demonstrating the diversity of the university’s students around the world and the positive impact that attaining a degree from Curtin can have on their life. Professor Deborah Terry officially became Curtin’s Vice-Chancellor at a ceremony on 24 February 2014. Originally from Western Australia, Professor Terry had forged a distinguished career at the University of Queensland, initially as an internationally recognised scholar, before progressing through a number of senior leadership roles to the position of Senior Deputy Vice-Chancellor. Curtin University Annual Report 2014 CONTENTS STATEMENT OF COMPLIANCE Statement of Compliance...................................................1 The Honourable Peter Collier MLC Minister for Education; Aboriginal Affairs; Electoral Affairs 10th Floor, Dumas House 2 Havelock Street WEST PERTH WA 6005 About Curtin........................................................................2 Chancellor’s Foreword.......................................................4 Vice-Chancellor’s Report...................................................5 Vision, Mission and Values................................................6 Strategic Plan 2013–2017...................................................7 Report on Performance – 2014 Activity Highlights.........8 Strategic Theme 1 People and culture..........................................................8 Strategic Theme 2 Research.........................................................................10 Strategic Theme 3 Teaching and learning.....................................................14 Strategic Theme 4 Engagement and impact.................................................18 Dear Minister In accordance with section 61 of the Financial Management Act 2006, we hereby submit for your information and presentation to Parliament the Annual Report of Curtin University of Technology for the year ended 31 December 2014. The Annual Report has been prepared in accordance with the provisions of the Financial Management Act 2006. Yours sincerely Report on Operations.........................................................22 Governance of the University..........................................22 Administrative structure...................................................28 Staffing matters...............................................................30 Significant issues and trends..........................................33 Other disclosures and legal requirements.......................34 Curtin Key Statistics...........................................................44 Colin BeckettDeborah Terry ChancellorVice-Chancellor On behalf of the University Council Independent Auditor’s Report...........................................46 Financial Report 2014 .......................................................49 Performance Indicators ....................................................113 Dated this 18th day of March 2015 1 2 Curtin University Annual Report 2014 Curtin University Annual Report 2014 ABOUT CURTIN CURTIN LOCATIONS BENTLEY PERTH KALGOORLIE Bentley Campus Kent Street, BENTLEY WA 6102 Postal address: GPO Box U1987, PERTH WA 6845 Website address: curtin.edu.au Perth Perth City Campus Graduate School of Business 78 Murray Street, PERTH WA 6000 Kalgoorlie Curtin Western Australian School of Mines (WASM) Egan Street, KALGOORLIE WA 6430 (WASM is also located at the Bentley campus) Margaret River Margaret River Education Centre 272 Bussell Highway, MARGARET RIVER WA 6285 MARGARET RIVER Curtin University is Western Australia’s largest university, with more than 53,600 students. Of these, approximately 31 per cent are international students, and more than 2,300 are research students. Established in 1986, the University takes its name from the influential and widely respected former Prime Minister of Australia, John Curtin, and continues to embrace his philosophy to “look ever forward”, instilling a culture of innovation in its teaching and research, and inspiring staff and students to make tomorrow better. Curtin is an internationally focused institution which offers a wide range of undergraduate and postgraduate courses in business, humanities, health sciences, resources, engineering and related sciences. A culturally diverse university, Curtin fosters tolerance and encourages the development of the individual. A combination of first-rate resources, staff and technology makes Curtin a major contributor to tertiary education, both within Australia and internationally. The University’s main campus is in the suburb of Bentley, six kilometres south of the centre of Perth, Western Australia’s capital city. Curtin has two additional metropolitan campuses and regional campuses in Kalgoorlie and Margaret River. Curtin also has campuses in Sydney, Malaysia and Singapore. The University’s educational and research programs are divided across five teaching areas. Each teaching area equips its graduates with the knowledge, skills and industry experience needed to excel in their chosen profession: Shenton Park Health research campus Selby Street, SHENTON PARK WA 6008 • Centre for Aboriginal Studies • Curtin Business School • Faculty of Health Sciences • Faculty of Humanities • Faculty of Science and Engineering. The University is recognised for high-impact research, including in minerals and energy, ICT and emerging technologies, health and sustainable development. Curtin has close links with business, industry, government and the community, and its courses have a strong practical focus, with many involving vocational or work experience components. As a result, Curtin graduates are more desirable to employers, with skills that enable them to make a genuine and positive influence in a continuously changing world. Curtin University is a trademark of Curtin University of Technology, a body corporate established under the Curtin University of Technology Act 1966, an Act of the Western Australian Parliament. It is domiciled in Australia. The University is not an incorporated company under the Corporations Act 2001. Therefore it does not have an Australian Company Number, nor does it have a Certificate of Incorporation. curtin.edu.au SHENTON PARK SYDNEY Sydney Curtin University Sydney Curtin House 39-47 Regent Street, CHIPPENDALE NSW 2008 Miri, Malaysia Curtin Sarawak Senadin, MIRI, SARAWAK, MALAYSIA MALAYSIA Singapore, Republic of Singapore Curtin Singapore 90 and 92 Jalan Rajah, SINGAPORE 329162 SINGAPORE 3 4 Curtin University Annual Report 2014 Curtin University Annual Report 2014 CHANCELLOR’S FOREWORD Professor Deborah Terry joined the University at a landmark time in Curtin’s history. Since she was invested as ViceChancellor in February, I have been extremely impressed by how seamlessly she has taken over the leadership reins, quickly gaining the full confidence of Council and demonstrating her capabilities and commitment to helping Curtin achieve its new vision. In her hectic first year, she has established strong local networks, made visits to all of Curtin’s local and international campuses and cemented contacts with current and potential partners, at home and overseas. I know the University can look forward to strong but empathetic leadership from Professor Terry in these transformational times, which I will now address. Curtin, like other universities across the nation, operated in an environment of policy uncertainty in 2014. The federal government’s proposals for higher education reform – including plans to substantially cut funding for Commonwealth supported student places and allow universities to set their own fees – were some of the most significant the sector had seen in recent decades. Not surprisingly, they generated much political debate, with the initial legislation rejected by the Senate at the end of the year. Curtin Council strongly supports the greater funding certainty that fee deregulation offers. We encourage our federal politicians to remove the uncertainty which hangs over the higher education sector, including students, by supporting reform legislation early in 2015. VICE-CHANCELLOR’S REPORT We continued with our program of investments to improve our facilities. As an example, Curtin’s world-class science and engineering faculty received a further boost this year with significant investment made in the University’s Kalgoorlie campus, home to the Curtin Western Australian School of Mines (WASM). In June, the campus received $20 million in funding from the State Government’s Royalties for Regions program to rebuild and expand its current student housing facilities, enabling more students from around the state, Australia and the world to benefit from the unique educational experience the campus offers. This has been complemented by Curtin’s $10 million investment in the upgrading of WASM’s library and laboratory facilities – a clear signal of the University’s strong commitment to providing world-class education and research for the resources sector. The campus’s presence now extends from Kalgoorlie, where its operations began, to Bentley and to Curtin’s Malaysian campus in Sarawak, where increasing numbers of students are studying resources-related engineering programs. As a newcomer to Curtin, my first year as Vice-Chancellor has been, not surprisingly, an extremely busy and memorable one. When I gave the Orientation Week address to Curtin’s new students at the end of February 2014, I had only just joined the University myself and genuinely shared the students’ sense of excitement and anticipation: there was so much to learn, so many new people to meet and so many opportunities to explore. It has been another interesting and inspiring year for Curtin. I take this opportunity to thank my fellow Council members for their support, particularly departing members: Professor Sue Fyfe, Ms Eva Przenioslo and Ms Cairney Lucks. I would also like welcome Ms Cathryn Carver to Council. I also thank the Curtin senior executive for their continued support; and I reiterate my support for our new Vice Chancellor, Professor Deborah Terry, and the excellent leadership she has provided the University this year. At all of Curtin’s major sites, both new and established, the University’s reputation for looking forward is evident, with substantial planning and construction work in progress to maintain their vibrancy, relevance and attractiveness. Even our relatively new campus in Malaysia benefited from significant building work this year, while our oldest campus – the Western Australian School of Mines in Kalgoorlie – was a site of much activity with the official opening of a new multi-purpose library and student learning centre, and groundwork beginning on the $30 million redevelopment of its student accommodation facilities. Despite this backdrop of uncertainty, Curtin made significant achievements in 2014. As reported last year, a number of projects were instituted at Curtin in 2013 to support the university’s ambitious change agenda. These included the reshaping of its academic workforce, the transformation of teaching practices and learning environments, the redesign of administrative processes and the revisiting of organisational values. These projects are critical to Curtin’s future. Council appreciates these changes can be challenging for staff. Council has supported the new ViceChancellor as she has implemented these changes whilst seeking to mitigate their impacts on staff. I very much look forward to representing the University again in 2015. In March, Council endorsed a new set of values for the University. This followed widespread consultation throughout the Curtin community. These values are now being embedded into all of Curtin’s activities through the University’s ‘Living our values’ project. It will take time before these values are evident throughout the University but ultimately these values will differentiate the University and build Curtin’s reputation and its success as an international leader in teaching and research. 18 March 2015 Our reputation is already changing rapidly. Curtin’s rise up the international university rankings in 2014 – it now ranks in the top two per cent of world universities and is ranked equal tenth in Australia – certainly provides outstanding evidence its strategies are working and it is destined for even greater things. Colin Beckett Chancellor I have undertaken a significant journey of discovery over the past year and continue to be deeply impressed by the calibre of the organisation that I now have the privilege to lead. One of my most important tasks this year has been visiting Curtin’s different campuses, locally and internationally, to familiarise myself with their operations and their communities. I believe it is a great asset for the University that it has a number of diverse, strategically positioned campuses beyond its main operations in Perth, including its overseas campuses in Malaysia and Singapore. Curtin’s main campus continues to evolve in most significant ways. Stage One of the Curtin Master Plan, which will see the campus transformed into a vibrant urban hub, was approved by Council in December. Work has now begun on a new road at the northern entry to create greater public access for the transport interchange, accommodation and retail outlets planned for the northwest corner of the campus. Also, as part of this master plan, the first stage of a million-dollar business education precinct opened near the high-traffic Curtin Business School buildings and work has begun on a five-storey health sciences building. A diverse place activation program is already changing the overall look and feel of the campus, with pop-up food vans, performance spaces and recreation facilities creating a real buzz for students and staff in the previously idle spaces between buildings. It has definitely been an exciting time in Curtin’s history to join the University and I was of course very pleased to learn of Curtin’s significant rise up the ladder in the highlyregarded Academic Ranking of World Universities. Curtin rose in position from 429 to 303 – the biggest increase of any Australian university, described by one commentator as not so much an improvement but a transformation. This places Curtin amongst the top two per cent of universities worldwide. As these rankings are driven largely by research performance, it pays tribute to the enormous effort of staff to build Curtin’s reputation as a research-intensive university, undertaking world-leading research in areas of global significance. One of Curtin’s highest profile research endeavours remains the international Square Kilometre Array astronomy project, arguably the largest science project in the world. I believe the magnitude of Curtin’s contribution to this complex and ambitious scientific undertaking – looking deeper than ever before into time and space to help answer questions about the early history of the universe – is yet to be fully appreciated. Of course, no Vice-Chancellor, new or long-serving, can expect the administration of a major university to be all smooth sailing. The Chancellor has already described the challenges created by the proposed higher education reforms and we will continue to deal with the uncertainties created by these proposals into 2015. The financial implications of the ‘half-cohort’ scenario, which will see fewer high school students applying for university entry in 2015, will also start playing out next year. Curtin has already implemented a series of strategies to minimise the expected reduction in enrolments during the half-cohort years, including vigorous domestic and international student recruitment campaigns for our courses and pathway programs. Our strong market share amongst school leavers and the record crowds at our Open Day in 2014 give us optimism but we must still expect a drop in student enrolments and income. We are well placed financially to mitigate the effects of the half cohort, with a 2014 surplus which will be reinvested to ensure our core activities are delivered to their optimum. Getting to know the character of Curtin and its people has been a real privilege for me this year. The great energy and enthusiasm I detected upon arrival has not abated, despite the challenges of the reshaping of Curtin’s academic and administrative areas. Transformations of this magnitude test the strongest of institutions so I would like to pay tribute to the ongoing professionalism and commitment of staff for keeping their eyes on our longer-term goals. I am confident that together we will achieve great things in the years ahead. Professor Deborah Terry Vice-Chancellor 18 March 2015 5 6 Curtin University Annual Report 2014 Curtin University Annual Report 2014 VISION, MISSION AND VALUES The University upholds the philosophy of its namesake, former Prime Minister of Australia, John Curtin, who said: Our Mission “The great university … should look ever forward; for it the past should be but a preparation for the greater days to be.” Values To change minds, lives and the world through leadership, innovation and excellence in teaching and research. Integrity - to act ethically, honestly and with fairness Vision 2030 Respect - to listen, value and acknowledge A recognised international leader in research and education. Courage - to lead, take responsibility and question Curtin will be a beacon for positive change, embracing the challenges and opportunities of our times to advance understanding and change lives for the better. We will provide richly interactive and personalised learning experiences for our students, equipping them with leadership skills for the future and valuing them as partners in education and research – and as long-term influencers of change within society. Through high-impact research in areas of strategic importance, we will deliver outcomes of significant value to our communities locally, nationally and globally. Excellence - to strive for excellence and distinction Impact - to empower, enable and inspire STRATEGIC PLAN 2013–2017 Curtin’s current strategic plan was approved by the University Council in December 2012 and was officially launched in February 2013. Capitalising on the outcomes achieved in the previous plan, the 2013–2017 Strategic Plan presents an ambitious goal to align with the University’s vision, positioning Curtin on the international stage as a leader in the provision of quality teaching and research. The University’s mission is to effect change through worldclass research and teaching focused on making a real difference. Curtin’s values underpin all activities, and the University has begun to further strengthen this valuesbased culture. Curtin is pursuing its vision and mission in a climate of aggressive global competition, rapidly changing technology, financial uncertainty and a new government agenda. The new strategic plan addresses these major opportunities and challenges to support the University’s ongoing sustainability. It details a series of strategic objectives presented under four themes: People and culture Curtin will: • evolve as an agile, responsive and versatile organisation, committed to leadership, innovation and excellence • excel through dynamic staff with shared values and a common purpose • engage students and staff as partners in a flexible, inspiring and technologically advanced environment. Research Curtin will: • strengthen as a research-intensive university • attract and retain iconic scholars to undertake worldleading research in areas of global significance • change lives in Western Australia, the nation and the world through high-impact research. Teaching and learning Curtin will: • lead in innovative education globally • provide a richly interactive and personalised learning experience • provide opportunity for graduates, equipping them with skills for the future. Engagement and impact Curtin will: • address the major challenges facing society and meet the needs of the communities we serve • expand its international outreach with globally relevant networks and partnerships in both teaching and research • change the world and its workforce through our research and our graduates. The strategic plan provides a framework for the development of major initiatives within enabling and faculty plans, in key areas such as research, teaching and learning, people and culture, student experience and international activities. Each year, the strategic plan and the associated enabling and faculty plans are subject to an annual review process that provides for the re-examination of plans in light of the progress in implementation and changes in the environment. The ‘2014 Activity Highlights’ section of this annual report presents Curtin’s major achievements for the year and underscores the momentum the University has achieved in moving towards its vision. 7 8 Curtin University Annual Report 2014 Curtin University Annual Report 2014 REPORT ON PERFORMANCE STRATEGIC THEME 1: PEOPLE AND CULTURE Curtin will: • evolve as an agile, responsive and versatile organisation, committed to leadership, innovation and excellence • excel through dynamic staff with shared values and a common purpose • engage students and staff as partners in a flexible, inspiring and technologically advanced environment. Curtin owes its historical success to the contribution made by staff over many years. The University is pursuing its new vision and mission in a climate of aggressive global competition and rapidly changing technology. To meet these challenges, the composition of Curtin’s workforce, as well as the University’s workplace values and culture, are evolving. 2014 saw the reshaping of Curtin’s workforce, changes in the systems and processes supporting the operations of the University, and promotion of a culture built on values that reflect strategic themes. Academic reshaping In 2014, academic reshaping enabled the University to to ensure schools have the positions, structure and staff needed to meet strategic objectives for excellence in both research and teaching in a rapidly changing environment. The reshaping will provide for new academic career paths in teaching focused and research academic roles. This will enable Curtin to provide teaching and research staff with greater access to research time, at the same time as enhancing the quality of our teaching programs through the appointment of academic staff with a focus on teaching and teaching innovation. 20 of 24 schools in the University were involved in the reshaping. 171 positions were created for teaching focused academics, including 58 staff new to the University. 114 research academic positions were created for outstanding researchers, including 75 for the University’s existing top achieving researchers and 39 new positions. Professional support and development was provided to our new teaching focused staff. EQUIP Curtin undertook a redesign of its administrative job roles, services and structures, which was progressively implemented over the year. Many functions undertaken in generalist job roles were consolidated into more focused roles organised around professional streams such as finance, human resources, research administration, student services and marketing. Staff undertaking these new roles now report into the professional stream rather than to local business unit managers. Accompanying these changes was the creation of a “hub and spoke” service delivery model and improvements to a large number of administration processes and systems. The result of these combined changes has been an increase in productivity which has enabled a reduction in annual costs for the provision of these services of over $15 million per annum. The University committed to increasing support for teaching academics with the creation of 69 continuing professional positions, primarily based in the schools, to assist with teaching administration and help ensure a consistently high quality learning experience for our students. This represents an increase of approximately 30 FTE over previous allocations into similar support roles. Training and professional development has been provided and will continue to be developed and provided into 2015 as staff transition into these new roles. Academic workload model implementation 2014 saw the piloting of a new system for allocating and measuring academic workload. The system allows for integration of timetabling and staff teaching allocation information. It will provide greater flexibility for heads of schools to take account of differences in staff experience, the nature of the teaching and the different size and types of student cohorts. It will also allow for greater transparency of workloads. Lessons learned during the pilot phase will shape refinements for 2015. Living Our Values Curtin undertook a university wide program to revisit the University values that engaged a broad number of staff. The result was a recasting of the agreed values in March and the creation of signature behaviours that support the values. The Living Our Values initiative is an important longterm component of Curtin culture and will continue to be developed over time. Your Voice survey Curtin’s biennial Your Voice survey is an important source of feedback on how staff feel about working at Curtin. The 2014 response rate was 67 per cent which is comparable to the response rate of 71 per cent achieved in 2012. There were significant improvements in core areas of teaching, research and community engagement. Positive trends were also evident in satisfaction with local management, rewards and recognition, discrimination, safety and local management. Areas needing significant improvement included some long-standing issues, including perceptions of the Senior Executive Team, management of change, capacity for innovation, efficiency of processes and cross-unit cooperation. Understanding and addressing the survey results was a core focus of the Senior Executive Team in late 2014 and will continue to be in 2015. Looking forward A post-implementation review of the EQUIP project will take place in early 2015, in order to improve the management of future large-scale projects and to ascertain the extent to which the intended outcomes of the project were achieved. More broadly, the focus for 2015 will be on responding to the outcomes of the 2014 Your Voice survey and working to strengthen Curtin’s culture. 9 10 Curtin University Annual Report 2014 Curtin University Annual Report 2014 REPORT ON PERFORMANCE (CONTINUED) STRATEGIC THEME 2: RESEARCH Curtin will: • be a research-intensive university • attract iconic scholars to undertake worldleading research in areas of global significance • change lives in WA, the nation and the region through high-impact research Curtin’s research remains concentrated on four broad areas of focus as it becomes a more research-intensive university: minerals and energy, ICT and emerging technologies, health, and sustainable development. Fundamental to achieving our objectives in Strategic Theme 2 will be researchers, including a cohort of iconic scholars, undertaking world-leading research in areas of global significance. To this end, the University seeks to retain existing high-quality research staff and proactively attract world-leading scholars to further develop their research careers at Curtin. The following enabling initiatives will advance this strategy: • acquire high-quality research capability • leverage international partnerships • build research culture and performance expectations • align research incentives with international indicators. Strategic Theme 2 is principally supported by initiatives contained in the Research Enabling Plan 2013–2017, which provides the framework for the University to progress towards its objectives. Highlights of Curtin’s achievements in 2014 include the following: • Curtin’s reportable research income increased 14.3 per cent for the 2014 Higher Education Research Data Collection (HERDC) for 2013 income. This included continued strong growth in the amount of Australian Competitive Grant income, which increased 17.7 per cent. Publications for the 2014 HERDC (on 2013 data) comprised 1,458 publication points across books, book chapters, journals and conferences, with the proportion of journal articles continuing to increase from 65 per cent to 75 per cent. Completions by Higher Degree by Research (HDR) students have increased by 34 per cent over the past 4 years, from 224 in 2011 to 300 in 2014, reflecting the strong growth in HDR commencers since 2009. • Curtin University’s rank in the 2014 Academic Ranking of World Universities (ARWU) increased to 303 worldwide from 429 in 2013 – an unprecedented increase of 126 places. Curtin had previously ranked in the range 401-500 since entry into the ARWU in 2008. Curtin is now placed equal 10th nationally with only one other ATN university (UTS, ranked 385, up from 425 in 2013) featuring in the top 500. • Success in 2014 under prestigious Australian Competitive Grant processes included: a. $5.5 million under the ARC Discovery program b. $3.2 million under the ARC Linkage program c. $2.8 million under the ARC Future Fellowship program for four fellowships d. $1.3 million under the ARC Linkage Infrastructure Equipment Facilities program e. One ARC Discovery Early Career Research Award f. $2.2 million in direct funding from the NHMRC across project grants, Early Career Fellowships and Translating Research into Practice (TRIP) Fellowships. • Curtin published 16 papers across two pre-eminent academic journals, Science (seven papers) and Nature (nine papers) during 2014. • Curtin University and the Grains Research Development Corporation (GRDC) entered into a bilateral agreement to fund the Centre for Crop and Disease Management to the value of $29.3 million over five years with an option to extend to ten years. Along with in-kind and capital development associated with the proposal, the total outlay will be approximately $100 million over the first five years. In addition, further projects worth $2.7 million were awarded by GRDC to Curtin in 2014. • Curtin continued to be successful in the CRC program with major grants including: a. $2.6 million funding from the CRC for Spatial Information (CRCSI) through Professor Peter Teunissen as research leader in global navigation satellite systems b. $731,000 funding from CRCSI for Professor Geoff West for research in Semantic Web Technologies for Supply Chain Management of Spatial Infrastructures c. $805,000 for a Deep Exploration Technologies CRC (DET-CRC) project led by Professor Brian Evans to explore new generation drilling techniques d. $909,000 secured for a project led by Associate Professor Anton Kepic, Exploration Geophysics, for developing sensors for rapid down-hole rock characterisation, under the DET-CRC e. $348,000 for a project led by Associate Professor Brett Harris, Exploration Geophysics, for joint inversion of 3D seismic and MT data under the DETCRC. • The WA collaboration on population health received $1.1 million for the Population Health Research Network as part of the National Collaborative Research Infrastructure Strategy (NCRIS) which was originally funded as an Education Investment Fund Super Science Initiative. • The WA Office of Road Safety awarded a grant of $3 million to the Curtin-Monash Accident Research Centre (C-MARC) for a period of five years. C-MARC is a joint venture between Curtin University and Monash University. 11 12 Curtin University Annual Report 2014 Curtin University Annual Report 2014 REPORT ON PERFORMANCE (CONTINUED) St John Ambulance Australia (WA) awarded $1.4m to Curtin for two projects for the Prehospital, Resuscitation and Emergency Care Research Unit (PRECRU) at the School of Nursing and Midwifery. • A project led by Curtin’s Dr Andrew Maiorana secured $350,000 from the Department of Health WA for a trial on nurse-supported telehealth for chronic heart failure. • The WA Museum Foundation donated $170,000 towards the investigation and photographing of the World War II wrecks of HMAS Sydney (II) and the HSK Kormoran. Other key sponsors of the project are the GMA Garnet Group and the Honorary Consul of the Federal Republic of Germany in Western Australia ($150,000 in total), as well as Founding Sponsor DOF Subsea, which is donating the expedition vessel, engineering maritime operational expertise, two days vessel travel time and the equivalent of one day on the water. • In an alliance with Australian Scientific Instruments Pty Ltd, Professor Brent McInnes negotiated a $780,000 industry grant for a sponsored post-doctoral fellowship to develop techniques and applications for in-situ ELAICP-He mass spectrometry in geoscience. This project further reinforces strong industry partnerships for the John de Laeter Centre. In a related area, Professor Brent McInnes received $600,000 from Auscope towards a project entitled “Earth Composition and Evolution from Auscope”. • Associate Professor Rob McCauley from the Centre for Marine Science and Technology received $1.5 million for an international joint industry partnership project entitled “Phase 4 Joint Industry Partnership Project on Sound and Marine Life”. • The Curtin Office of IP Commercialisation initiated the 11 week student entrepreneurship program, INCUBATE. The program originated through the Sydney University Student Union and a national rollout is being supported by Google. The program provides seed funding, co-working space, mentoring and relevant workshops to assist four selected teams to develop their business concepts. • The Curtin OzAPP Awards were held in February 2014 as part of West Tech Fest. Initiated by Curtin’s Office of IP Commercialisation to identify the best new mobile, web or cloud computing app in the South East Asian region, the awards promote and support entrepreneurship in the digital market. 180 applicants from across the country and South East Asia competed for a $100,000 convertible note provided by Qualcomm Ventures to develop their product. The final judging and conference event was hosted at Bankwest Plaza and attracted an audience of 170 including a significant number of national and international investors and entrepreneurs from the tech sector. • Curtin was shortlisted for two awards in the inaugural Research Commercialisation Awards organised by Knowledge Commercialisation Australia Inc. Curtin was a finalist in the Best Creative Engagement Strategy category with the West Tech Fest/OzAPP initiative, and in the Best Commercial Deal category for the sale of spin out company Scanalyse to Finnish company Outotec. • In May, Professor Jeffery Sachs, internationally renowned economist and senior advisor to the United Nations, delivered the keynote address at Curtin’s Inaugural Sustainability Lecture and Showcase, held at Government House. 350 people attended the lecture, which was simulcast to ten other universities. • In August, Dr Jean-Paul Hobbs, Research Fellow, Department of Environment and Agriculture, travelled to the Hawaii Institute of Marine Biology, University of Hawaii, under a Fulbright Postdoctoral Scholarship. Dr Hobbs’ project, conserving marine biodiversity by determining and mitigating the risk of extinction for endemic species, is being conducted under the mentorship of Professor Brian Bowen, a world expert in marine conservation research. • Curtin University researchers achieved a number of awards for achievements in research in 2014: • Two Curtin University Researchers received WA Science Awards from the Premier, Hon. Colin Barnett. Mr Mark Zammit received the ExxonMobil Student Scientist of the Year and Dr Ryan Loxton received the Woodside Early Career Scientist of the Year. Professor Steven Tingay and PhD Candidate Mr Thomas Russell were also finalists in the awards. • Curtin PhD student, Sarah Marley, was named the 2014 Three Minute Thesis Champion at the TransTasman final in Perth against 47 of her peers from across Australia, New Zealand, Malaysia, Singapore and Hong Kong. • Dr James Miller-Jones is the WA winner of the 2014 Young Tall Poppy Science Awards which recognise the achievements of Australia’s outstanding young scientific researchers and communicators. • Curtin has a substantial representation on the ARC College of Experts with 6 out of 167 total members. Young achievers: Mr Mark Zammit, ExxonMobil Student Scientist of the Year and Dr Ryan Loxton, Woodside Early Career Scientist of the Year. • The 2014 Tribology Gold Medal has been awarded to Professor Gwidon Stachowiak, Department of Mechanical Engineering. Professor Stachowiak is the first Australian to win this prestigious international award which is awarded annually for outstanding achievement in the field of tribology, and funded by the Tribology Trust Fund UK. • Professor Richard Oliver and his team from Curtin’s Centre for Crop and Disease Management were selected as finalists for the 2014 Australian Museum Eureka Prizes within the sustainable agriculture category. • A joint ARC Linkage project by the Curtin University Sustainability Policy Institute (CUSP) and the City of Greater Geraldton (CGG) won three categories at the International Association of Public Participation Australasia Awards. The project, Transitions to a Sustainable City, Geraldton WA won the flagship ‘Project of the Year’ award, and secured the ‘Research’ and ‘Planning’ awards. • Professor John Mamo, Vascular Biology Research Unit, Faculty of Health Sciences, was awarded the Marshall and Warren Award for the most innovative and potentially transformative research project from the NHMRC’s most recent Project Grant round at the annual National Health and Medical Research Council’s (NHMRC) Excellence Awards. • Professor Graeme Wright, Deputy Vice-Chancellor, Research and Development was awarded the Chair’s Award by the Cooperative Research Centre for Spatial Information (CRCSI) for his sustained and exemplary contribution to the governance, research and academic leadership of the CRCSI since its inception in 2003. Looking forward In research, the focus in the future will be on continuing to use strategic recruitment and support to strengthen Curtin’s research profile. Preparation for the Square Kilometre Array will see continued emphasis on radio astronomy and ‘big data’ processing, which will be supported by the Pawsey Supercomputing Centre located in adjacent Technology Park. Advances in data modelling that result from SKA projects will benefit other research endeavours, such as global climate change analysis and GPS optimisation. 13 14 Curtin University Annual Report 2014 Curtin University Annual Report 2014 REPORT ON PERFORMANCE (CONTINUED) STRATEGIC THEME 3: TEACHING AND LEARNING Curtin will: • lead in innovative education globally • provide a richly interactive and personalised learning experience • provide opportunity for graduates, equipping them with skills for the future. Curtin’s objectives in Strategic Theme 3 are underpinned by the Teaching, Learning and Student Experience Plan 2013-2017. The Learning for Tomorrow strategy entered its second year in 2014 and continues to be a key priority of the plan. The University-wide strategy aims to transform the design and delivery of education at Curtin and help realise the vision to be an international leader in education and research. Highlights of Curtin’s achievements in 2014 included the following: • The Learning for Tomorrow - Transforming Learning at Curtin strategy continued with a range of improvements to the student experience. 72 per cent of Curtin’s top 200 courses now have elements of transformed learning, including the ‘flipped classroom’. Other improvements to the student experience included Curtin101, conditional status campaigns and new-look Orientation Week. • All of Curtin’s courses were reviewed and the University achieved 100 per cent compliance with the Australian Qualifications Framework ready for 1 January 2015. • Assessment Quality Panels were implemented and are now active in each school, to help ensure moderation and academic integrity are adhered to, to reduce risks associated with assessment and to assure the quality of assessment. • Curtin’s inaugural Festival of Learning was held. The program of professional development, sharing and demonstrations culminated in an industry event officially launching the Learning for Tomorrow strategy and announcing the first suite of Curtin’s flagship courses available in 2015 to learners anywhere in the world. • Curtin hosted a week-long Transmedia in Education and Research conference with internationally renowned transmedia storytelling guru Mr Jeff Gomez, Chief Executive of Hollywood’s Starlight Runner Entertainment. • Gamified and transmedia learning is taking hold: • The Curtin Challenge has attracted international recognition, shortlisted from 400 entries for the QS Wharton Reimagine Education Awards 2014. Challenge is a serious challenge-based game platform, allowing learners to undertake a series of learning challenges at their own pace. • The AHEAD program developed an orientation style game to lift aspirations of equity groups and improve student success at university. The game will launch in 2015. • A library orientation game was created, designed to help students learn to use the library. The library also won the Australian 2014 VALA Award for its Curtin Library App, providing users with personalised, context-sensitive information and mobile access to services. • Dr Janet Beilby of the School of Psychology and Speech Pathology created the Empathy Simulator, featuring an avatar named Jim, providing valuable clinical communication skills training. • Curtin’s third MOOC – Participating in the Digital Age – was launched. • A learning analytics project began, this Student Discovery Model is helping the University to better understand its students, their needs and personal drivers. This underpins Curtin’s commitment to a personalised, adaptive learning experience. • Curtin Student Services won a national recognition for a new Fast Track ID system that significantly reduces waiting time for student identification cards. • A major change was completed in Student One from system generated study package codes (unit/thesis, course, major, stream) to meaningful, user defined codes and required 410,000 student study plans to be updated. This provides a more flexible and streamlined experience for students and enables ‘pick and mix’ courses, the first of which are five new graduate certificates within which students can build their own course from a range of unit options. Additionally, 36 minors have been created in courses. • The Curtin Leadership Centre continued to facilitate excellent leadership development opportunities with more than 10,600 engagements in 2014, which represents a vast increase over previous years and saw the centre meet its target. • Expanded opportunities for work integrated learning continued, contributing to excellent student outcomes. The Cockburn Integrated Health Facility and Juniper Simulation Suite were officially opened and allow students from a range of health disciplines to undertake innovative placements. • A team of students were among six finalists presenting their idea to a panel of business leaders in an Australiawide undergraduate student competition. The Big Idea, co-ordinated by magazine The Big Issue calls for new ideas to benefit the underprivileged. Curtin’s team presented ‘Moving Feast,’ a food truck that collects unsold food and employs disadvantaged people. • PhD student Sarah Marley from the Centre for Marine Science and Technology won the 2014 Three Minute Thesis competition ahead of 47 contestants from Australasia. 15 16 Curtin University Annual Report 2014 Curtin University Annual Report 2014 REPORT ON PERFORMANCE (CONTINUED) • Cordelia Gibbs from the School of Design and Art won the Supreme Award and Young Designer Award at the 2014 Australian Wool Fashion Awards. • Student equity initiatives included support for the first indigenous team to reach the Rowing WA All Schools State Championships, and a bicycle repair program aimed at engaging students excluded from the traditional education system. • The UniReady Enabling course continued to provide opportunities for equity groups to enter university. Since 2010, student enrolments have increased 534 per cent and course completions have increased 674 per cent. Growth from 2013 to 2014 was 77 per cent. • Following introduction of new teaching focused academic roles, a comprehensive program of professional development was put in place, including a Peer Review of Teaching program and an ‘Open Door’ program. 109 staff have already participated in these programs. • Curtin Academy was launched and eleven outstanding teachers were inducted as inaugural Curtin Academy Fellows. The academy promotes a “community of practice” to support academic staff and encourage the development and sharing of teaching excellence. • Curtin’s excellent teaching staff continued to be recognised: • Undergraduate unit Indigenous Culture and Health won an Office of Learning and Teaching Excellence Award for partnerships between Aboriginal and non-Aboriginal staff and the Aboriginal community. Since its inception in 2011 almost 7,500 future health professional students have completed the unit, contributing to a health workforce that provides culturally safe health care, critical for improving health outcomes for Aboriginal and Torres Strait Islander people. • Dr Paul Murray and Professor Sue Trinidad were awarded citations for Outstanding Contributions to Student Learning in the Australian Awards for University Teaching. Dr Murray for contemporary curricular leadership in pharmaceutical chemistry and Professor Trinidad for her work in championing technology in education and leadership to help educators transform their practice. • Professor Jeff Hughes was awarded the 2014 Australasian Pharmaceutical Sciences Association Medal. Professor Hughes’ commitment to teaching and learning has established his international reputation as a pharmacy educator. • Teaching Focused Scholarship Seed Grants were awarded to Ms Emily Castell, School of Psychology and Speech Pathology, Faculty of Health Sciences; Dr Audrey Cooke, School of Education, Faculty of Humanities; and Ms Debbie Gilchrist, School of Accounting, Curtin Business School. • Teaching Excellence Development Funding funded 32 Curtin projects, relating to English Language Proficiency, improvement of assessment practices and student outcomes, development of engaging and interactive approaches to learning, and development of teaching with a global reach. • Curtin’s second Reconciliation Action Plan was launched to help address the shortcomings that exist between indigenous and non-indigenous Australians within the University’s framework. • The Centre for Aboriginal Studies, in conjunction with Elder in Residence, Associate Professor Simon Forrest and Dr Michelle Johnston delivered for the first time the “Nyungar Culture and Identity” residential unit on country at Roelands Village. Twenty-five students undertook the unit in both semesters, giving overwhelmingly positive feedback. • The creation of innovative learning spaces across all campuses continued. Along with major refurbishments, early construction work commenced on a new teaching and learning building. Curtin also partnered with Wesfarmers to create a million-dollar business education precinct at the main campus. • Library facilities at Bentley and Kalgoorlie were transformed through major upgrades. Enhancements include contemporary computing facilities, upgraded Wi-Fi and flexible study areas. The Robertson Library began operating 24 hours a day, seven days a week throughout semester 2, resulting in increased student satisfaction. Looking forward The University will continue its focus on transforming teaching and learning in an effort to proactively harness the impact of technology on higher education and to improve student satisfaction and graduate outcomes. Traditional lecture style teaching will be reduced, with greater emphasis placed on opportunities for collaboration and active engaged learning. By 2016 all Curtin courses will combine collaborative learning techniques with new and emerging technologies that will enable students to enjoy a genuine Curtin University education from all over the world. 17 18 Curtin University Annual Report 2014 Curtin University Annual Report 2014 REPORT ON PERFORMANCE (CONTINUED) STRATEGIC THEME 4: ENGAGEMENT AND IMPACT Curtin will: • address the major challenges facing society and meet the needs of the communities we serve • expand its international outreach with globally relevant networks and partnerships in both teaching and research • change the world and its workforce through our research and our graduates. Curtin University’s networks and partnerships with industry, government and the broader community are at the heart of its activities. These connections ensure our graduates advance the needs of industry, and our research addresses issues of real-world significance. Highlights of Curtin’s achievements in 2014 included the following: • 54 international agreements were signed including articulation agreements, MOUs, sponsored student agreements, and student and staff exchange agreements. These agreements focused on collaborative research, student exchange and student recruitment pathways through articulation to Curtin campuses. Ocean University in China was an outstanding example of a new partnership with significant research opportunities. • Curtin continued to be a leading destination for students sponsored under the Brazilian Science without Borders program. In 2014, 90 students enrolled in study abroad programs in the Faculty of Science and Engineering and the Faculty of Health Sciences. A key component of their program is an internship or work integrated learning experience over the summer period. All participating students are successfully placed to date. • 15 new student and staff exchange agreements were signed, including agreements with University of Essex, the Indian Institute of Technology Madras and University of Leeds. These agreements allow for increased participation in exchange and study abroad programs across the University by students in each faculty. • 914 international students sponsored by the Australian Government’s Australia Award (previously known as AusAID), foreign governments and universities, and international companies, were enrolled at Curtin in 2014. Australia Award student numbers have continued to hold firm. Source countries include Indonesia, Papua New Guinea, Vietnam, Iraq, Bangladesh, Philippines, Bhutan, East Timor and the African continent. The largest cohort of sponsored students other than Australia Award students continues to be the Saudi Arabian Cultural Mission. • In 2014, 142 Curtin students participated in full semester student exchange opportunities. Curtin continued to provide travel grants to assist students who participated in student exchange programs. Successful applications for additional Commonwealth funding continued to support these programs. • Curtin was successful in securing grant funding for the first and second tranche of the New Colombo Plan mobility pilot, which helped fund several short-term study programs in Asia. A further $215,500 was secured in Asiabound grants. • 8,656 international students were enrolled onshore at Curtin, compared with 8,742 the previous year – a decline of 1 per cent. The Western Australian international onshore tertiary student market is also showing a decline of 1.57 per cent based on YTD September national enrolment data (Austrade Market Information Package). The market overall has been impacted by increased competition, particularly from the eastern seaboard. Curtin enrolments were reduced by a sharp decline in the numbers of students coming through pre-university pathways in WA. • 2014 saw Curtin International Admissions undergo significant and exciting change, with the engagement of Hobsons International to provide services in enquiry and student application management. With additional support in this area, the Curtin International Admissions team can focus on extending services and support to key stakeholders, and most importantly, students. As the full capacity of the Hobsons team is integrated, Curtin International will continue to refine the process and take advantage of the opportunities, continuing to innovate in this area. • Curtin courses continued to be offered in collaboration with partners in China, Singapore, Hong Kong, Malaysia, Mauritius, Vietnam and Sri Lanka. Due to declining enrolments with a long term partner in Malaysia, a mutual decision was made to end that partnership, with Curtin planning comprehensive teachout arrangements to ensure current students are able to complete their studies. • The Collaborative Education Services (International) Policy and Procedures were reviewed to align with the University’s RACI framework of accountabilities, and to include procedures for licensing of Curtin course materials to international institutions. • Curtin College continued to be the major pathway provider for international students, however a decrease in students enrolling at the college in recent years impacted the number of students progressing to Curtin in 2014. 385 Curtin College graduates articulated to Curtin in 2014, corresponding to 95 per cent of the total cohort. Recent increases in pre-university pathway visa applications and a move to introduce a postgraduate pathway during 2015 indicate that this pathway will continue to be a significant source of onshore international enrolments as numbers recover. 19 20 Curtin University Annual Report 2014 Curtin University Annual Report 2014 REPORT ON PERFORMANCE (CONTINUED) • Curtin received the Employer of Choice for Gender Equality Citation (one of only 76 organisations, including 11 Universities, nationally to be assessed as meeting the criteria) and the Workplace Gender Equality Agency Notification of Compliance. • Curtin University, along with universities across Australia, began a collaborative alliance with the Australia Defence Science and Technology Organisation to undertake research activities of mutual benefit. • Curtin was the highest ranked University and second overall in the Top 20 Employers for LGBTI People nationally in the Pride in Diversity Australian Workplace Equality Index. • Curtin hosted an innovation roundtable as part of West Tech Fest in February. The event was attended by the State Minister for Commerce, the Hon Michael Mischin MLC, State Shadow Minister for Commerce, Hon Kate Doust MLC, and senior representatives from industry, investment markets and academia. Discussion focused on nurturing a thriving technology sector. • The process of implementation and monitoring of the quality management system ISO 9001:2008 was continued by all Curtin campuses in 2014, with each campus receiving ongoing accreditation as part of major surveillance audits. Curtin International underwent a major surveillance audit for the ongoing maintenance of ISO 9001:9008 accreditation to cover the systems and procedures in relation to quality assurance for onshore processes and procedures, and offshore partner contract development. • Curtin International participated in a number of internal audits in 2014, ensuring that quality and compliance processes are aligned with TEQSA Higher Education Thresholds and other regulatory requirements. These processes demonstrated that Curtin International has a systematic cycle of reviewing and managing the risks and compliance activities required to ensure University quality objectives are met. • Curtin continued to participate in the Streamlined Visa Processing scheme overseen by Department of Immigration and Border Protection. Curtin has maintained its Assessment Level 1 risk rating based on the student visa statistics for 2014, which is evidence of the effectiveness of the University’s management of student visa risks. • In October, Curtin submitted an application for CRICOS re-registration documentation to TEQSA. Included in the application were summaries of the compliance planning and activities performed over the last five years which have allowed the University to maintain its compliance with Education Services for Overseas Students (ESOS) Act and the National Code. The outcome of the process is expected in early 2015. • Curtin now has four major research collaborations in China. In October, the University established partnerships with two Chinese institutions: The SinoAustralian Centre in Ocean Engineering and the Joint Research Centre of Structural Monitoring and Protection (with Tianjin University). Curtin also elevated its relationship with the Huazhong University of Science and Technology to university-university level, which will foster continued collaboration in the areas of renewable energy research and building information modelling. Looking forward Gaining the support of the Federal Government and Australian Medical Council for the establishment of a medical school at the Bentley campus will remain a priority for the University in 2015. The proposed school would help address growing demand for more doctors in Western Australia and would provide the only avenue for WA school leavers to begin medical studies straight from high school. 21 22 Curtin University Annual Report 2014 Curtin University Annual Report 2014 REPORT ON OPERATIONS GOVERNANCE OF THE UNIVERSITY The Council is the governing body of the University and its powers are set out in the Curtin University of Technology Act 1966 (WA). It has “the management and control of the property and affairs of the University and may do all such acts and things as it may think best calculated to promote the interests of the University”. The Act provides for a Council comprising the Chancellor, Vice-Chancellor, members appointed by the Governor, a nominee of the State Minister for Education, co-opted members, members elected by the academic and general staff, members elected by students, members who are members of bodies that represent the interests of the University in places other than at the Bentley Campus, a member of the Academic Board, and a member of the Alumni Association. Council met on eight occasions in 2014, including one meeting held at Kalgoorlie. A Council members’ forum was also conducted on the strategic positioning of the University in a deregulated market. Dr Michael Schaper, Deputy Chairman of Australian Consumer and Competitor Commission, spoke at the forum on the implications of the Competition and Consumer Act for universities in a fee de-regulated market. In June, Council members undertook a tour of the new Juniper Simulation Centre for healthcare students. Professional development sessions were provided to Council members on: • interpreting financial statements • duties and responsibilities At its meeting on 22 October 2014, Council elected Dr Michael Stanford CitWA to the position of Pro Chancellor for a second term that commenced on 2 December 2014 and ceases on 1 December 2017. Key governance-related activities considered by Council in 2014 included: • approval of the following: • Organisational Structure Policy • Disestablishment of Greater Curtin Committee • teaching and learning • Kalgoorlie Campus Council Charter • indigenous issues in higher education • Constitution of the Curtin Student Advisory Forum. • research • noting the following: • Reports on the University’s performance against key performance indicators, measures and targets identified in the Strategic Plan 2013–2017 • health sciences • Curtin WA School of Mines • Investment reports Properly constituted committees help Council to meet its broad responsibilities by enabling matters to be appropriately scrutinized prior to coming before Council for resolution. • Report on the health and safety due diligence obligations of Council members The current standing committees established by resolution of Council are the: • Financial management reports • Report on the operations of the Kalgoorlie Campus in 2013 • Report on the activities of the Curtin Foundation in 2013 • Reports on Health and Safety Performance • Reports on Equal Employment Opportunity • Reports on Professional Standards and Conduct • Reports on the application of the Common Seal. Major strategic issues considered by Council in 2014 included the approval of the following: • Various honorary awards • Development of road infrastructure for Stage One of the Greater Curtin project • Transforming Curtin Information Technology and Learning for Tomorrow – Digital Experience Program • Budget for 2015 To inform and enhance Council’s role in shaping the strategic direction of the University, a series of strategic conversations and portfolio presentations were undertaken in 2014 as part of Council’s meeting program. Strategic conversations included: • Curtin ‘Values and Signature Behaviours’ • strategic risk • Key performance indicators for assessing the ViceChancellor’s performance in 2014 • Living our Values initiative • Investments and Treasury Management Policy and Procedures • Greater Curtin • Banking Management Procedures Portfolio presentations included: • international strategy • • • • Executive Committee Finance Committee Audit and Compliance Committee Legislative Committee Special purpose committees established by resolution of Council include: • Health and Safety Due Diligence Committee The Academic Board is also a committee of Council and forms part of the overall governance framework of the University. The Academic Board is responsible to Council for helping to ensure the academic quality and integrity of the University’s operations as an academic institution. The Academic Board is also assisted in the performance of its responsibilities by a number of sub-committees. An external review of Council’s performance was conducted in 2014. The review was led by Mr Alan Cameron AO of Cameron Ralph. 23 24 Curtin University Annual Report 2014 Curtin University Annual Report 2014 REPORT ON OPERATIONS (CONTINUED) MEMBERS OF COUNCIL FOR 2014 Commenced Terminated Due to expire Members appointed by Governor in Council Mr Chris Bennett BCom (UWA) C.A Mr Kim Bridge BBus (WACAE) Ms Cathryn Carver BBus (Curtin) Mr Michael Lishman BA BJuris LLB (UWA) LLM (Melb) Mr Keith Spence BSc Hons (Tas) FAIM Dr Michael Stanford CitWA MB BS (UNSW) MBA (MacqU) Grad Cert LCC (ACU) FAFPHM FAIM FAICD BJuris LLB (UWA) FAICD FGIA 1/4/2012 current 1/4/2009 31/3/2012 25/5/2006 31/3/2009 31/3/2015 15/11/2014 current 15/11/2011 14/11/2014 BA (ANU) PhD (ANU) FASSA FAPS Professor Colin Stirling (Acting Vice-Chancellor) BSc (Edin) PhD (Glas) BEd, BSc, BAppSc, PhD (UWA) Professor Dale Pinto PhD (Melb) M Tax (Hons) (Sydney) CPA FTIA AFAIM FTMA MAICD Professor Glennda Scully BCom (Melb) MAcc (UWA) PhD (UWA) FCA Ms Cairney Lucks 1/1/2014 31/12/2014 Ms Eva Przenioslo 1/1/2014 31/12/2014 1/1/2013 31/12/2013 11/11/2014 current 10/11/2017 18/6/2013 current 17/6/2016 31/5/2016 1/4/2013 current 20/4/2010 31/3/2013 1/4/2012 current 1/4/2009 31/3/2012 1/4/2013 current 31/12/2015 20/6/2006 31/3/2009 2/12/2014 current 13/12/2011 1/12/2014 2/12/2008 1/12/2011 Member elected by full-time salaried (general) staff Mr Andy Sharp B Larch (Canberra) MBA (Curtin) Co-opted Members 31/3/2015 Mr Colin Beckett (Chancellor from 1/01/2013) MA (Cantab) MICE Previously appointed by the Governor in Council 19/10/2010 – 31/3/2013 2/12/2017 Mr Steve Scudamore BA Hons, MA (Oxon), FCA, SF Fin, FAICD Mr Gene Tilbrook BSc DipComp MBA (UWA) AMP (Harvard) FAICD 3/5/2013 current 1/4/2014 current 1/4/2011 31/3/2014 1/4/2012 current 1/4/2009 31/3/2012 31/3/2017 31/3/2015 2/5/2016 Member who is a member of the Academic Board elected by and from the Academic Board Associate Professor Linley Lord DBA (Curtin) Postgrad Dip Bus (Human Resource Development) (Curtin) BSc (UWA) 17/2/2014 current Ex-officio 9/8/2013 16/2/2014 1/4/2014 31/7/2014 22/8/2014 current 31/3/2017 1/4/2013 current 31/3/2016 Members elected by full-time academic staff Professor Sue Fyfe Due to expire 14/11/2017 Member who is the Chief Executive Officer Professor Deborah Terry Terminated Members elected by students Member nominated by the Minister for Education and Training Ms Sue Wilson Commenced 1/4/2014 current 1/4/2012 31/3/2014 31/3/2016 25 26 Curtin University Annual Report 2014 Curtin University Annual Report 2014 REPORT ON OPERATIONS (CONTINUED) MEMBERS OF COUNCIL FOR 2014 (continued) COUNCIL KALGOORLIE CAMPUS COUNCIL ACADEMIC BOARD FINANCE COMMITTEE VICE-CHANCELLOR AUDIT AND COMPLIANCE COMMITTEE PLANNING AND MANAGEMENT COMMITTEE CURTIN FOUNDATION BOARD ACADEMIC BOARD EXECUTIVE CURTIN STUDENT ADVISORY FORUM ACADEMIC SERVICES COMMITTEE INTERNATIONAL COMMITTEE LEGISLATIVE COMMITTEE UNIVERSITY GRADUATE STUDIES COMMITTEE UNIVERSITY TEACHING AND LEARNING COMMITTEE HEALTH AND SAFETY DUE DILIGENCE COMMITTEE COURSES COMMITTEE STUDENT SERVICES AND AMENITIES FEES EXPENDITURE ADVISORY COMMITTEE CURTIN INDIGENOUS POLICY COMMITTEE UNIVERSITY HEALTH AND SAFETY COMMITTEE Members of Council: Back row from left to right: Cairney Lucks, Chris Bennett, Eva Przenioslo, Sue Wilson, Andy Sharp, Keith Spence, Associate Professor Linley Lord, Professor Dale Pinto Front row from left to right: Dr Michael Stanford (Pro Chancellor), Colin Beckett (Chancellor), Professor Deborah Terry (Vice-Chancellor) Absent: Cathryn Carver, Kim Bridge, Michael Lishman, Steve Scudamore, Professor Glennda Scully and Gene Tilbrook UNIVERSITY RESEARCH AND DEVELOPMENT COMMITTEE EXECUTIVE COMMITTEE HONORARY AWARDS NOMINATIONS COMMITTEE JOHN CURTIN GALLERY ADVISORY BOARD CURTIN ABORIGINAL AND TORRES STRAIT ISLANDER ADVISORY COMMITTEE 27 28 Curtin University Annual Report 2014 Curtin University Annual Report 2014 REPORT ON OPERATIONS (CONTINUED) ADMINISTRATIVE STRUCTURE ORGANISATIONAL CHART Vice-Chancellor Professor Deborah Terry (17 February 2014 – 31 December 2014) Professor Colin Stirling (Acting 1 January 2014 – 16 February 2014) Provost & Senior Deputy Vice-Chancellor Professor David Wood (Acting) Deputy Vice-Chancellor, International Professor Simon Leunig (Acting 6 October 2014 – 31 December 2014) Professor Simon Ridings (Acting 1 January 2014 – 5 October 2014) Deputy Vice-Chancellor, Research and Development Professor Graeme Wright Deputy Vice-Chancellor, Education Professor Jill Downie Vice-President, Corporate Relations and Development Ms Valerie Raubenheimer Vice-President, Corporate Services Mr Ian Callahan Pro Vice-Chancellor, Curtin Business School Professor Tony Travaglione Pro Vice-Chancellor, Health Sciences Professor Michael Berndt Pro Vice-Chancellor, Humanities Professor Majella Franzmann Pro Vice-Chancellor, Science and Engineering Professor Andris Stelbovics Pro Vice-Chancellor, Sarawak Professor James Mienczakowski Pro Vice-Chancellor, Singapore Professor Robert Evans Chief Financial Officer Mr David Menarry Chief Strategy Officer Mr Marco Schultheis VICE-CHANCELLOR DIRECTOR INTERNAL AUDIT PROVOST AND SENIOR DEPUTY VICE-CHANCELLOR DEPUTY VICE-CHANCELLOR RESEARCH & DEVELOPMENT DEPUTY VICE-CHANCELLOR EDUCATION DEPUTY VICE-CHANCELLOR INTERNATIONAL VICE-PRESIDENT CORPORATE SERVICES VICE-PRESIDENT CORPORATE RELATIONS & DEVELOPMENT PRO VICECHANCELLOR CURTIN BUSINESS SCHOOL ASSOCIATE DEPUTY VICE-CHANCELLOR RESEARCH & DEVELOPMENT ASSOCIATE DEPUTY VICE-CHANCELLOR CURTIN TEACHING & LEARNING PRO VICECHANCELLOR CURTIN SARAWAK CAMPUS CHIEF FINANCIAL OFFICER FINANCIAL & COMMERCIAL SERVICES CHIEF MARKETING OFFICER UNIVERSITY MARKETING PRO VICECHANCELLOR FACULTY OF SCIENCE & ENGINEERING ASSOCIATE DEPUTY VICE-CHANCELLOR RESEARCH & DEVELOPMENT GRADUATE STUDIES ASSOCIATE DEPUTY VICE-CHANCELLOR STUDENT EXPERIENCE & ACADEMIC REGISTRAR PRO VICECHANCELLOR CURTIN SINGAPORE CAMPUS CHIEF INFORMATION OFFICER CURTIN INFORMATION TECHNOLOGY SERVICES DIRECTOR STRATEGIC COMMUNICATIONS PRO VICECHANCELLOR FACULTY OF HEALTH SCIENCES DIRECTOR MINERAL RESEARCH INITIATIVES UNIVERSITY LIBRARIAN UNIVERSITY LIBRARY DEAN INTERNATIONAL DEVELOPMENT DIRECTOR PROPERTIES, FACILITIES & DEVELOPMENT PROPERTIES DIRECTOR EXTERNAL RELATIONS PRO VICECHANCELLOR FACULTY OF HUMANITIES EXECUTIVE DIRECTOR AUSTRALIAN SUSTAINABLE DEVELOPMENT INSTITUTE DIRECTOR CORPORATE VALUES & EQUITY DIRECTOR CURTIN ENGLISH DIRECTOR HUMAN RESOURCES DIRECTOR PUBLIC RELATIONS CHIEF STRATEGY OFFICER STRATEGY & PLANNING DIRECTOR ENERGY RESEARCH INITIATIVES DIRECTOR CENTRE FOR ABORIGINAL STUDIES DIRECTOR LEGAL & COMPLIANCE DIRECTOR ADVANCEMENT ASSOCIATE DEPUTY VICE-CHANCELLOR ACADEMIC QUALITY ENHANCEMENT DIRECTOR STRATEGIC PROJECTS DIRECTOR SUPPORT SERVICES DIRECTOR HEALTH & SAFETY DIRECTOR INTEGRITY & STANDARDS UNIT DIRECTOR BUSINESS SUPPORT UNIT DIRECTOR IP COMMERCIALISATION ACADEMIC LEAD CURTIN LEARNING INSTITUTE DIRECTOR RISK MANAGEMENT DIRECTOR STRATEGIC ENGAGEMENT DIRECTOR RESEARCH & DEVELOPMENT DIRECTOR ORGANISATIONAL DEVELOPMENT UNIT DIRECTOR SECRETARIAT & COUNCIL SECRETARY 29 30 Curtin University Annual Report 2014 Curtin University Annual Report 2014 REPORT ON OPERATIONS (CONTINUED) STAFFING MATTERS Reshaping of the academic workforce The University completed the reshaping of its academic workforce in June 2014. The resulting changes will improve workforce capabilities to meet strategic plan outcomes and create new academic career pathways for academic staff. Over the two year period of academic reshaping, 230 teaching academic and research academic continuing positions were created. With the introduction of specialist academic roles, the need for blended or integrated academic roles has reduced from 100 per cent to 60 per cent of the academic workforce. In consequence, some 150 academic staff either accepted early redundancy or were notified of redundancy and exited the organisation. EQUIP Proposal for Major Change The implementation of the EQUIP Proposal for Major Change impacted upon approximately 700 University staff in the areas of Research and Teaching Administration, Human Resources, Finance, Corporate Relations and Development, School Administration, Student Services and Graduate Studies. Approximately 750 staff members have been confirmed in continuing positions, with approximately 30 vacancies remaining across the eight functional areas. Most of the new roles have been filled from existing continuing and fixed-term staff members. The ultimate outcome of EQUIP has been a reduction in the number of generalist roles in the University’s organisational structure and an increase in focused or specialist roles. This has provided additional and more diverse career and development opportunities for Curtin staff. EQUIP dispute In July 2014, the University was in dispute with the National Tertiary Education Union (NTEU) and the Community and Public Sector Union (CPSU) regarding its change management process, in particular, the University’s right to transfer a staff member to a suitable alternative position. Through intensive negotiation, an understanding of the operation of the Enterprise Agreement change management and consultation clause was agreed upon and captured in a memorandum of understanding made between the NTEU and CPSU on 11 August 2014. This was important in setting up dispute free change management processes for the coming years. Individual staff disputes Health, safety and emergency management Workers’ compensation and injury management Four claims were brought before the Fair Work Commission (FWC) during 2014, with three of these being resolved by agreement or dismissal and one being discontinued. One such dispute, claiming a contravention of a general protection order, was resolved through mediation. Another dispute, related to a claim for redundancy payment, was eventually withdrawn. Only one unfair dismissal (constructive dismissal) claim, lodged in 2013, was dealt with in 2014, with the application being dismissed by the FWC. The fourth matter, involving a dispute of the redundancy process, was discontinued in the FWC, with recommendation that the parties resolve the broader issues in dispute outside of the commission. This matter is proceeding through the University Redundancy Review Committee process. Health and safety The University continues to provide a dedicated service to assist staff return to work following injuries or illness through its early intervention Injury Management Service. This service ensures the University meets its obligations under the Workers’ Compensation and Injury Management Act, 1981 and demonstrates best practice in relation to injury management practices for non-compensable conditions. Enterprise bargaining – Early Childhood Centre In March 2014, Curtin University began bargaining with United Voice and nominated Early Childhood Centre (ECC) staff representatives to negotiate a new enterprise agreement for the centre. All parties reached agreement in principle for the Curtin University Early Childhood Centre Enterprise Agreement 2014-2017 on 30 October 2014. An electronic vote for the agreement was conducted amongst eligible ECC staff in early December 2014, resulting in a majority voting in favour of the agreement. The new agreement was subsequently submitted to Fair Work Australia (FWA) and it commences operation seven days after the date of FWA approval. The new agreement meets the business needs of this service of the University, supporting the attraction and retention of high quality staff and maintaining a strong and viable business. The agreement provides a 4 per cent pay increase per year (up to 30 June 2017) for ECC staff. All Log of Claims items tabled by the University were attained, including the removal of salary increase alignment with the Curtin University Academic, Professional and General Staff Enterprise Agreement 2012 – 2017; an increase in the span of ordinary hours of work; removal of triple time weekend overtime payment; alignment with non-Curtin public holidays; and modernisation and clarification of many existing ECC conditions. The University is committed to providing and maintaining high standards of health and safety in the workplace. This is achieved, in consultation with staff and safety and health representatives, through such mechanisms as area/ faculty health and safety committees and the overarching University Health and Safety Committee, with the aim to continually improve processes for managing health and safety in the workplace. 2014 saw the merger of the Emergency Management portfolio with the Health and Safety department to form a team focused on health, safety and emergency risk management practices across the University. The department was renamed Health, Safety and Emergency Management. An emergency management framework was developed to oversee the response and initial management of emergencies across Curtin’s WA campuses through the implementation of emergency management plans. An Emergency Planning Committee and Emergency Management Teams were formed and are made up of Curtin personnel across various key functions. Curtin emergency management representatives are now also active members on both Local and District Emergency Management Committees, continuing to strengthen our emergency management position within the community, as well as relationships with external key stakeholders and agencies. The 2014 Health, Safety and Emergency Management Plan focused on strategies to deliver sustained health and safety performance in all areas and key objectives were achieved. A number of projects were implemented including, but not limited to: • development of a chemical safety management system • 2014 Safety and Health Representative elections • development of a health monitoring program and database • development of emergency management plans for Bentley, CBD and Kalgoorlie Campuses • emergency risk management workshops and resulting plans, including pandemic and heatwave • emergency management drills and exercises in consultation with hazard management agencies including DFES and WA Police. The service continued to provide workplace adjustment for staff with disability and expert human factors and ergonomic advice related to manual handling and job design. The portfolio was enhanced in 2014 with the inclusion of Curtin’s wellness program for staff. This proactive, preventative approach to injury and illness has been a key feature of several holistic injury management reviews across Curtin to improve health and safety. The University has seen an improvement in staff wellness from 2012 in its recent staff satisfaction survey, and it’s anticipated that this approach will result in further improvements in the coming years. 31 32 Curtin University Annual Report 2014 Curtin University Annual Report 2014 REPORT ON OPERATIONS (CONTINUED) SIGNIFICANT ISSUES AND TRENDS 2014 reportable key performance indicators Measure Number of fatalities * Lost time injury/disease (LTI/D) incidence rate 2012 2013 2014 0 0 0 0 Meets target 0.44 0 or 10% improvement on the previous 3 years Consistent with the last 3 years figures 0 0 or 10% improvement on the previous 3 years Consistent with 2013 Greater than or equal to 80% return to work within 26 weeks A total of 83% of staff returned to work within 26 weeks in 2014 0.39 ** Lost time injury/disease (LTI/D) severity rate Effect of economic and other factors Results against target Actual results 7 0.42 0 Comment on result *** Percentage of injured workers returned to work within (i) 13 weeks 87% 64% 61% (ii) 26 weeks 100% 86% 83% Percentage of managers trained in occupational safety, health and injury management responsibilities * Lost Time Injury Incidence Rate calculation: # of LTI/Ds # of employees (FTE) x 100 ** Lost Time Injury Severity Rate calculation: # of injuries ≥ 60 days # of LTI/Ds x 100 *** Return to Work (RTW) Within 13 / 26 Weeks calculation: 74% 88% Greater than or equal to 80% 60% # of LTI/Ds with a RTW outcome within 13 / 26 weeks # of LTI/Ds reported x 100 This is a biennial course, hence fluctuation from 2013. This has been an interesting year for higher education policy with the sector facing uncertainty and engaging in lively debate as a result of the Government’s proposed higher education reforms. The legislation contains wideranging changes including the deregulation of domestic undergraduate university fees and an expansion of the demand driven funding system. Potential policy changes would significantly affect the university landscape, creating a diversified, highly competitive market for existing universities and nonuniversity higher education providers as well as new entrants including private and/or fully online providers. The reforms will be further debated in 2015. Curtin undertook analysis and planning in preparation for the higher education policy changes and is well positioned to respond to the reforms should they be passed by the Senate. Global competition for talented students and staff continued to intensify in 2014. International education remained Australia’s fourth largest export and a forthcoming national strategy is anticipated to strengthen the policy environment. An upturn in international student commencements has coincided with the softening Australian dollar. Growth has been marginal in Western Australia this year however the outlook for 2015 and beyond is positive. With advances in technology, more universities are venturing into online education provision, blending oncampus with online courses and using the massive open online course (MOOC) trend as a catalyst to explore alternative teaching and business models. There has also been a focus on strengthening the link between higher education and industry. WA remains a top performing state in terms of economic environment and population growth however the resources boom has shifted from its construction phase to a production phase resulting in a shift in labour requirements. At the same time, commodity prices have softened further and consequently, unemployment rates rose in 2014. Although increases in unemployment have traditionally had a positive impact on student demand, this did not materialise during 2014. This could be a result of the reliance on interstate and overseas migration during the resources boom. During 2014, Curtin continued to ensure its operations remained highly competitive, and considerable work was undertaken to position the University to meet emerging market and regulatory challenges. Curtin experienced growth in domestic intake in 2014. Domestic bachelor degree new enrolments increased from 9,503 in 2013 to 10,063 in 2014, with the majority of the increase (9 per cent) stemming from the school-leaver market segment. Overall, Curtin achieved 7 per cent growth in total domestic undergraduate student enrolments. While the WA unemployment rate increased during 2014, Curtin’s domestic postgraduate coursework enrolments fell by 2 per cent, compared to a 2 per cent growth between 2012 and 2013. Domestic Higher Degree by Research (HDR) enrolments recorded 2 per cent growth in 2014, and International HDR enrolments grew by 6 per cent. International offshore enrolments increased 1 per cent in 2014 over the prior year, while international onshore enrolments fell by 1 per cent. CHANGES TO THE LEGAL ENVIRONMENT AFFECTING THE UNIVERSITY IN 2014 Commonwealth Legislation From 1 January 2014, a worker who reasonably believes that he or she has been bullied at work can apply to the Fair Work Commission for an order to stop the bullying. The Fair Work Act 2009 provides that bullying at work occurs when a person or a group of people repeatedly behaves unreasonably towards a worker or a group of workers and the behaviour creates a risk to health and safety. This legislative amendment applies not only to Curtin’s employees but also contractors/sub-contractors, apprentices/trainees, work experience students and volunteers. Western Australian Legislation There were no significant State legislation changes that applied to the University in 2014. 33 34 Curtin University Annual Report 2014 Curtin University Annual Report 2014 REPORT ON OPERATIONS (CONTINUED) OTHER DISCLOSURES AND LEGAL REQUIREMENTS Capital works Humanities - Building 501 refurbishment Greater Curtin – Stage One analysis Act of grace payments The Greater Curtin vision is for the Curtin Bentley campus to be transformed into a vibrant and connected environment that brings education, research, industry and culture together to create a world class knowledge and innovation hub that extends beyond just buildings. It’s a place that allows staff, students, stakeholders, researchers, businesses, entrepreneurs and the community to meet, share and learn together in a way which supports the economic development of Western Australia. A $20 million refurbishment of Building 501, a major existing building in the Humanities precinct housing the School of Education, is due for completion by the start of first semester 2015 and will deliver teaching, research and staff accommodation to bring the faculty up to contemporary University standards. Under the University’s policy on Act of Grace Payment, Curtin undertakes to report through its Annual Report all Act of Grace payments made in each financial year. In 2014 no Act of Grace payments were made. Advertising – Electoral Act 1907 Under section 175ZE of the Electoral Act 1907, the University is required to disclose expenditure for advertising agencies, market research organisations, polling organisations, direct mail organisations and media advertising organisation costs. For 2014 the following costs were recorded against these items: Sum of GST Exclusive amount $ Advertising agencies Campaign Non-campaign Market research organisations Media advertising organisations Direct mail organisations Grand total A Greater Curtin Project Control Group chaired by Mr John Langoulant was established in 2014 to direct planning for the implementation of Stage One of the Greater Curtin Master Plan. Key to this was the completion of a market demand and business case analysis by Ernst & Young. The study concluded that Stage One is commercially viable over a 10-15 year period and that it is reasonable to continue to pursue the Greater Curtin strategy. Key components of Greater Curtin Stage One include: • roads and other infrastructure 3,551,282 • a central bus interchange 2,721,815 • 1,500 student accommodation beds 829,467 79,320 3,183,165 58,605 6,872,372 • up to 100 room short stay hotel accommodation • Curtin University occupied space for teaching and learning, academic, research and/or administration needs • University partner aligned commercial space • village, retail and recreational facilities. The business case recognised that Stage One is inherent to the University’s strategic objective to be an international leader in research and education. We must create a “great place” to become a destination of choice to attract high quality students, researchers, businesses and industries to foster collaboration and innovation. The business case assumed that many of the proposed lot developments would be funded and constructed by third parties although at this stage the University retains the flexibility to make decisions about this on a case-by-case basis. Discussions with possible partners, including the Department of Food and Agriculture Western Australia, have run parallel to the Ernst & Young process. Teaching and medical – Building 410 construction Building 410 is planned to house the proposed Curtin Medical School and to support contemporary teaching and learning activities. Construction is currently underway with occupation planned for the commencement of 2016 at a capital cost of approximately $48 million. The project also includes the construction of a new road designed as a slow speed laneway environment that will link the University Main Street and Building 410 to the Campus Corso. Research facilities – Building 304 construction Construction has commenced for Building 304 which will provide PC2/QC 3 laboratories and research facilities to support the University’s initiatives. The Building will have an estimated cost of $40 million, a gross floor area of approximately 4,500m2 and is to be located on the eastern edge of the Bentley Campus adjacent to the bus terminus and other research facilities in Building 300 and Building 311. Project completion is planned for mid 2017. Business education – Wesfarmers Court Located adjacent to Angazi Café and Curtin Business School (Building 408), the first stage of the Wesfarmers Court Redevelopment was officially opened in December 2014. Planning has been completed for the second stage of the project and construction is planned to commence in early 2015. The project is designed to bring technology into the outside realm and provide an active informal space. The creation of the space has been made possible through the generosity of Wesfarmers whose financial support has allowed the design to proceed to its next stage. Infrastructure Significant performance improvements have been achieved through upgrades to mechanical infrastructure with a total project value of $8.9 million. Upgrades to the chilled and heating water infrastructure will satisfy recent and future demand increases and reduce energy consumption in the delivery of chilled and heating water on campus. Upgrades to electrical infrastructure have a total project value of $8 million. Projects included transformer and main switchboard upgrades to improve the overall integrity of the network. Internal and external lighting upgrades improve performance and reduce power demand. The maintenance of compliant fire safety systems was also an essential program. Other projects included the improved management of hazardous materials and dangerous goods in Bentley and Kalgoorlie, supporting the University’s Disability and Access Inclusion Plan, and rationalising the delivery of mains water services to the southern end of the Bentley Campus. The total program had a value of $4 million. Kalgoorlie Campus student housing, library and laboratories The project to replace the existing student housing at Kalgoorlie with the construction of facilities accommodating 180 new beds and 48 refurbished beds is underway with construction due to commence in early 2015. To meet the constraints of the regional location it is anticipated that innovative modular construction will be used. The anticipated total cost is $30 million with $20 million being contributed from Royalties for Regions funding. During the year, major upgrades to the library and laboratory facilities at the Kalgoorlie Campus were also completed. Student services - B101 refurbishment B101 will transform the student experience by providing a one-stop-shop for all student services needs. The upgrade also provides significantly improved staff accommodation through the use of contemporary open plan design. The refurbishment forms part of the University’s broader Professional Staff Accommodation planning for buildings 101, 109, 200B, 105 and 599. The anticipated project cost, which includes roofing repairs, is $13 million. Preliminary test fits have been undertaken to analyse design opportunities and space requirements. It is expected that the project will be delivered in 2015. 35 36 Curtin University Annual Report 2014 Curtin University Annual Report 2014 REPORT ON OPERATIONS (CONTINUED) Directors’ and Officers’ Liability Insurance An indemnity agreement has been entered into between the University and the directors and officers named in this report. Under the agreement, the University has agreed to indemnify those directors and officers against any claim to the extent allowed by the law, for any expenses or costs which may arise as a result of work performed in their respective capacities. In 2014, the University paid a premium in respect of a contract of insurance for the directors and officers of the University and all related bodies corporate, against liabilities incurred in acting in such capacities to the extent permitted under the Corporations Act 2001. The contract prohibits the disclosure of the nature of the liabilities and/or the amount of the premium. Disability Access and Inclusion Plan outcomes Good progress was made on the major initiatives of the University’s Disability Access and Inclusion Plan (DAIP), most notably the Curtin Physical Access Plan and support for students on the autism spectrum. A successful pilot of a specialist mentoring program for students on the autism spectrum was completed and is now in the evaluation phase. The DAIP Implementation Committee Advisory Members are ‘buddied’ with senior Curtin staff and have been approached to assist in benchmarking our access and inclusion practices in 2015. Curtin was the major sponsor for the 2014 Pathways 12, the national conference for Disability professionals working in the Australian and New Zealand tertiary sector. Outcome 1: People with disabilities will have the same opportunities as other people to access the services of, and events organised by, Curtin. Counselling and Disability Services staff were located part-time in the Centre for Aboriginal Studies to support indigenous students and staff. Professional development opportunities were also increased to improve understanding and collaboration with Aboriginal and Torres Strait Islander students and staff. Curtin supported the First Peoples Disability Network Australia, a national organisation that aims to be a strong voice of and for Aboriginal and Torres Strait Islander people with disability and their families. Outcome 2: People with disabilities will have the same opportunities as other people to access Curtin’s buildings and facilities. The initial planning phase began for the Curtin Physical Access Plan, based on universal design principles for access and inclusion. The project has seen the appointments of a Community Access and Inclusion Advisor and Consultants to run the project. The 2014 Universal Design competition was open to undergraduate students in Occupational Therapy who gained credit for their entries. Outcome 3: People with disabilities receive information from Curtin in a format that will allow them to access the information as readily as other people are able to access it. Curtin Survey Approvals for research involving students includes DAIP access and inclusion requirements. A process was developed for the removal and archiving of old, non-compliant web content. The QA checklist for web content developers has been reviewed and disseminated. The 2014 procurement process for a new University-wide web content management system enshrined accessibility compliance as an essential functional requirement. All software vendors have reported regarding their ‘roadmaps’ to meet accessibility standards. Outcome 4: People with disabilities receive the same level and quality of service from Curtin staff as other people receive from Curtin staff. Curtin staff education continues with the nationally accredited Mental Health First Aid Course, mindfulness workshops for improving mental health awareness, disability awareness workshops, Mental Health in the Workplace and Managing Stress. Outcome 5: People with disabilities will have the same opportunities as other people to make complaints to Curtin. The Integrity and Standards Unit (previously the Professional Standards and Conduct Unit) reviewed its processes in assisting people with disability to make a complaint or resolve a conflict. The Curtin complaints website has been externally tested for accessibility by a member organisation of the DAIPIC Advisory body. Outcome 6: People with disabilities will have the same opportunities as other people to participate in any public consultation by Curtin. The Guidelines for Accessible Public Consultation were adopted. Outcome 7: People with disabilities will have the same opportunities as other people to participate in employment at Curtin. A Curtin talent pool for open employment opportunities for people with disability was piloted in 2014. Staff with Disability education included training for Occupational Safety and Health Managers and their Supervisors. Agents and contractors The Agents and Contractor Disability Services Act (WA) 1993 reporting requirement was included in new Procurement Governance Framework. 37 38 Curtin University Annual Report 2014 Curtin University Annual Report 2014 Groundwater Use Kilolitres kL per irrigated m2 800,000 1.20 700,000 REPORT ON OPERATIONS (CONTINUED) 1.00 600,000 0.80 500,000 400,000 0.60 300,000 0.40 200,000 0.20 100,000 Environmental sustainability Energy efficiency Curtin has a strong focus on energy efficiency to reduce greenhouse emissions and energy costs. To achieve the best possible energy efficiencies, the University continually reviews opportunities to improve building performance. The 2014 lighting upgrade of sections of levels five and six at the Robertson Library resulted in a 65 per cent (approx.) reduction in electricity use and associated greenhouse gas emissions due to lighting. The LED lighting refit has a calculated payback period of only three years and has not only resulted in significant energy savings but has also achieved better lighting quality (reduced shadows on bookshelves), improved user satisfaction, lower maintenance costs (replacement is required every 20 years as opposed to every four) and more environmentally friendly end-of-life disposal (LEDs do not contain mercury). These remarkable results have prompted the refit of levels two to four and the remaining sections of levels five and six for 2015, where state-of-the-art LED lighting with dimmed controls linked to motion sensors will be introduced. It is expected that when the refit is completed, the Library will be using approximately 75 per cent less energy due to lighting. Since the start of the program, the University has diverted 48 tonnes of electronic equipment from landfill. Curtin University’s initiative is the most comprehensive and effective e-waste collection program run by a Western Australian university. Pricing policies on outputs provided Fees are charged in accordance with Australian Government guidelines and University policy. Students in Commonwealth-supported places are required to contribute towards the cost of their education. The Use for each study student contributionGroundwater amount is calculated Kilolitres kL irrigated mcontribution 2 period from their student load and theper annual 800,000 1.20 amounts that apply for that year. In common with most 700,000 universities, Curtin charges the maximum student 1.00 contribution amount permitted by legislation. 600,000 Four bi-monthly evening counts confirm that Carnaby’s black cockatoos continue to feed and roost on the Bentley campus and Technology Park. They also utilise a number of troughs that were installed on campus in 2012 to provide them with reliable and safe access to water in summer. The award recognises Curtin’s electronic waste recycling program, which has been in place since 2010. The twotier program targets not only the ongoing electronic waste generated by the University’s own teaching and research business functions, but also the recycling of staff and students’ personal household items through free community collections. 2008/09 2009/10 2009/10 2010/11 2010/11 2011/12 2011/12 2012/13 2012/13 2013/14 2013/14 2008/09 0.80 500,000 0.20 Approved 100,000 fees are published online at fees.curtin.edu.au. Scheme Water use (Bentley campus) GHG (t) Kilolitres 0 2008/09 2009/10 2010/11 2011/12 2012/13 2013/14 -‐ GroundwaterU Use Groundwater se Kilolitres 800,000 700,000 kL per irrigated m2 Scheme Water use (Bentley campus) 1.20 Kilolitres Kilolitres per m2 of Gross Floor Area 2600,000 50,000 1.00 1.0 500,000 200,000 400,000 0.80 0.8 0.60 1300,000 50,000 0.6 0.40 200,000 100,000 100,000 0.4 0.20 0 50,000 -‐ 0.2 -‐ 2008/09 2009/10 2010/11 2011/12 2012/13 2013/14 2008/09 2009/10 2010/11 2011/12 2012/13 2013/14 0.0 Campus) Kilolitres (Bentley Kilolitres per m2 of Gross Floor Area Greenhouse Gas Emissions (Bentley Campus) GHG (t) kg GHG per m2 of Gross Floor Area 1.0 00,000 420,000 0.8 180 35,000 150,000 30,000 160 0.6 140 215,000 00,000 120 0.4 100 20,000 50,000 1 5,000 80 0.2 60 10,000 -‐ 5,000 40 0.0 20 -‐ 2008/09 2008/09 2009/10 2009/10 2010/11 2010/11 2011/12 2011/12 2012/13 2012/13 2013/14 2013/14 0 Greenhouse Gas Emissions (Bentley Campus) GHG (t) 40,000 kg GHG per m2 of Gross Floor Area Waste to Landfill (Bentley Campus) 420,000 50,000 180 1.0 35,000 200,000 30,000 160 0.8 140 120 0.6 100 115,000 00,000 80 0.4 60 10,000 50,000 5,000 40 0.2 20 -‐ -‐ 2008/09 2009/10 2010/11 2011/12 2012/13 2013/14 2008/09 2009/10 2010/11 2011/12 2012/13 2013/14 180 0 0.0 Waste to Landfill Greenhouse (Bentley Gas Emissions (Bentley Campus) Waste to Landfill (Campus) Bentley Campus) GHG (t) 40,000 1,000 35,000 Kg per m2 of Gross Floor Area 180 4 160 140 120 3 100 20,000 500 15,000 80 10,000 40 60 0 • Renovations of the Records and Information Management (RIM) warehouse facility at Technology Park commenced, to allow for more efficient use of the space. Rationalisation of a second warehouse also occurred to accommodate the expansion of the Curtin Institute for Radio Astronomy. • A total of 1,230 boxes of University records were processed, approved and securely and legally destroyed. • A total of 4,022 boxes of inactive legacy information were processed and transferred from business areas to Curtin’s offsite storage provider. • A major review of the records management training was conducted. Improved group training was developed and implemented. • Significant progress was made on improving the quality of data contained in the Contracts and Agreements Register. 5,644 contracts and agreements previously held in the RIM vault were processed, boxed up and archived. • Training, support and advice were provided for several significant inactive records projects involving Research Ethics and the Centre for Aboriginal Studies. 2 • RIM worked with areas to review and provide advice on the structure of shared network drives to improve useability and compliance. • The Electronic Document Management System (eDRMS) strategy, business case and road map were submitted to the senior executive. 20 1 5250 ,000 -‐ • Enhancements were made to the Curtin Records and Information System (CRIS) to improve functionality and efficiency. • Guidelines for the use of cloud computing at Curtin were developed and disseminated to staff. kg GHG per m2 of Gross Floor Area tonnes 30,000 750 25,000 Scheme Water use (Bentley campus) Greenhouse Gas Emmissions 250,000 kg GHG per m2 of Gross Floor Area Kilolitres per m2 of Gross Floor Area 25,000 150,000 20,000 Significant improvements and developments • Work continued on improving records management at the Curtin WA School of Mines in Kalgoorlie. The capture and recording of archival and historical material in various formats also continued. Scheme Water Use Campus) Greenhouse (Bentley Gas Emissions (Bentley Campus) 200,000 Waste Curtin University was Highly Commended at the 2014 Infinity Awards organised by the WA Waste Authority. The Awards provide public recognition to individuals, business, local and state government agencies and community organisations that demonstrate innovation and commitment to reducing waste and increasing re-use and recycling. Curtin is committed to the reliable and systematic management of its documents and records in accordance Scheme Water use Bentley campus) Groundwater Use University with good practice standards. As (Curtin was kL m per 2 Area Kilolitres Kilolitres Kilolitres per 2 oirrigated f Gross Fm established under an Act of the Parliament ofloor Western 1.20 1.0 2800,000 50,000 it is also subject to the provisions of the State Australia, 700,000 Act 2000 (WA). In accordance with this Act, Records 1.00 200,000 Curtin works under an approved Recordkeeping Plan 0.8 600,000 0.80 for (RKP). The RKP contains timelines and responsibilities 1500,000 50,000 0.6 improving recordkeeping practices at Curtin. The Records 400,000 0.60 & Information Management (RIM) team develops policies, 0.4 1300,000 00,000 0.40 processes, training and tools to assist staff to meet the 200,000 requirements of the plan. The RKP was reviewed in 0.2 50,000 0.20 100,000 and a revised version was approved by the State 2013-14 -‐ 0 Commission on 1 August 2014. -‐ 0.0 Records Tuition fees for other students are determined by taking 400,000 0.60 into account a number of factors, such as cost of delivery, 300,000 ‘market’ factors and legislative requirements. 0.40 Biodiversity 2014 saw more than 100 trees planted along Kent Street and at the corner of Manning Road and Kent Street as part of our tree offset commitment under the University’s Urban Forest Plan. Our aging tree population has necessitated some trees to be felled, however we are planting four new trees for every black cockatoo roosting and/or feeding in a tree that needs to be cut. 0 -‐ Recordkeeping – compliance with the State 2008/09 2009/10 2010/11 2011/12 2012/13 2013/14 Records Act 2000 (WA) 2008/09 2008/09 2009/10 2009/10 2010/11 2010/11 2011/12 2011/12 2012/13 2012/13 2013/14 2013/14 0 0 Waste to Landfill (Bentley Campus) 1,000 tonnes Kg per m2 of Gross Floor Area 4 750 3 500 2 45 39 40 Curtin University Annual Report 2014 Curtin University Annual Report 2014 REPORT ON OPERATIONS (CONTINUED) Ongoing records training • Training modules, run on a monthly basis, were made available to all staff and covered topics such as creating and keeping records, sentencing, retention, disposal of information and managing email. A total of 270 staff attended in 2014. • A further 120 one-on-one CRIS training and support sessions were provided to staff. • A total of 33 staff were trained in the use of the Contracts and Agreements Register. • More than 1,900 staff completed online information management awareness training in 2014. All staff are required to complete this training within two months of starting at Curtin, and are required to repeat the training after two years. The content and delivery of the training was reviewed in 2014 with a new version to be released in 2015. • Education and training was provided to 155 staff on freedom of information responsibilities. Education sessions on the Australian Privacy Principles, which came into force in March 2014, were delivered to 250 staff. Risk management Curtin’s Risk Management Framework supports the University to achieve its strategic objectives by: • assisting business areas to make prudent risk-based decisions • enabling high performance across business activities within an agreed risk appetite promoting risk-aware behaviours and continuous disclosure • supporting a healthy, safe and environmentally sustainable University community • enabling timely resumption of core services in the event of a major disruption • providing assurance to students, industry, staff, Council, regulators, government, the community and other stakeholders that the University has a systematic proactive approach to risk as part of overall University governance. In 2014 a three-year Risk Management Plan was adopted which includes the following three delivery horizons, with a view to 2017: • Horizon One - Culture and Appetite - A shared understanding of Curtin’s risk appetite and an embedded risk-aware culture • Horizon Two - Governance and Oversight - Governance and process frameworks are fit-for-purpose, efficient and effective • Horizon Three - Strategy and Insight - Intelligence is shared, decisions are explicitly risk-adjusted and risk insight informs strategy. 2014 also saw Curtin’s risk appetite and risk reference tables revised by Council. The three categories listed below were added to the consequence table in the risk reference tables: • Project risk as part of objectives and performance • Environment risk • Stakeholder risk including students, staff, agents, suppliers and contractors. Additional risk tools developed during 2014 include a fieldwork risk framework for staff and students which covers: • travel risk • health, safety and emergency management disaster recovery time was outside the agreed risk appetite of three days, Curtin now runs two active data centres. In the event of an issue with one of the data centres. load can be transferred to the centre that remains functional. Work also began to address another data dependency identified as outside the agreed three-day turnaround. Work commenced in 2014 to identify and implement systems to improve reporting and analysis across both operational risk and business continuity. Improved dashboard reporting now integrates key performance indicators, key risk indicators, and project and risk performance. • learning outcomes • research outcomes • contract arrangements • insurance • compliance and approvals. Work continued on implementation of a University-wide approach to business continuity with improved templates and tools covering: • business impact assessments • business continuity plan and recovery strategies • preparation of battle boxes • incident exercises. Significant progress has occurred in IT business continuity and disaster recovery processes. During 2014 the response team participated in several exercises which simulated IT incidents. To address a concern that the University’s IT The Critical Incident Management Framework was further enhanced through on campus exercises with external agencies and testing of Curtin’s emergency notification systems. In 2009, policy and system changes were introduced to better manage Curtin’s travel risk. The graph below shows the outcomes of a continuous improvement approach to travel risk. Despite the number of overseas and domestic trips reaching almost 9,000 in 2014, there has been a continual decline in the number of travel insurance claims. Consequently, Curtin’s travel insurance premium has also reduced significantly over this time. Curtin University Travel Claims 41 42 Curtin University Annual Report 2014 Curtin University Annual Report 2014 REPORT ON OPERATIONS (CONTINUED) Senior officer disclosures The senior officers of the University have declared: • they do not hold (as a nominee or beneficially) any shares in any subsidiary body of the University; and • they (or a firm of which they are a member, or an entity in which they have a substantial interest) do not hold any interests in any existing or proposed contracts with the University, or subsidiary, related or affiliated body of the University. Strategic procurement Curtin continues to deliver improved commercial processes, practices and systems through a strategic procurement approach. Contracts have been executed in many separate expenditure categories, achieving substantial savings. Strategic supplier–relationship management is used to maximise opportunities from commercial relationships, for added value and innovation. Subsidiary bodies From time to time, the University invests in companies that are set up for the purposes of commercialising intellectual property. For a short period after the companies are established, the University may be in the position whereby it has control of the company, in which case the company may be regarded as a subsidiary of the University. However, in these cases the University’s interest in the company is not financially material and will be diluted in time through investment from third parties. At 31 December 2014, the University has no subsidiaries. University publications and marketing activities Curtin International Future Students website • engaging with more than 40,000 prospective students and their influencers at 414 career events, including: The Strategic Marketing and Engagement Plan, built around the three pillars of recruitment, reputation and impact, together with a restructure of the Corporate Relations and Development portfolio, saw significant change to marketing and publications functions in 2014. This has given the University a clear direction for its marketing activity and improved workflows. • 229 visits to high schools • 96 on-campus group visits • 89 career expos. • managing more than 33,000 future student enquiries across phone, email and face-to-face Publications and marketing activity has been improved through the addition of faculty marketing teams within University Marketing. This will serve to improve collaboration between University Marketing and the faculties, and ultimately strengthen Curtin’s integrated marketing activity. • launching the new International Future Students responsive website, accessible across mobile, tablet and desktop with refreshed content and a focus on rich video • a strong focus on social media platforms, which resulted in Curtin dominating social media amongst WA universities. The University ended 2014: A key achievement in 2014 was a record attendance for the biggest recruitment event of the year, Open Day, which attracted more than 21,000 visitors, despite a reduced number of school leavers reaching university age in 2015. • first in WA and third nationally for Facebook followers and engagement University Marketing launched the University’s new positioning campaign in 2014: Awesome Awaits. This was developed in response to market insights of the growing lack of differentiation between university communications here in Western Australia. The clearly unique creative platform, underpinned by a value proposition centered on how Curtin can help someone unlock their potential, has helped reinforce the University’s market share position as the most preferred university in WA. 2014 also saw a move toward digital publications, with University Marketing creating a digital offering of the University’s research magazine, R&D Now, and working towards digital undergraduate prospectuses, expected to be available from the Apple App Store in January 2015. This shift acknowledges a trend in consumer behaviour, and helps ensure efficient global distribution of the University’s marketing communications. Other highlights in 2014 included: • second most views on YouTube behind UWA, with more than 1.3 million video views • first in WA for Twitter, LinkedIn and Instagram followers. • identifying and executing key sponsorship opportunities to support Curtin’s brand positioning and reputation objectives, including: • TEDxPerth – continuing as Principal Partner for the third year • Fringe World Festival – commencing as Key Partner for 2015. TEDxPerth in 2014 Voluntary Code of Best Practice for the Governance of Australian Universities At its meeting on 7 December 2011, Council adopted the Voluntary Code of Best Practice for the Governance of Australian Universities as a best practice governance benchmark. A compliance report for 2014 was noted by Council at its meeting on 10 December 2014. The University complies with all 14 protocols. Fringe World Festival 43 44 Curtin University Annual Report 2014 Curtin University Annual Report 2014 CURTIN KEY STATISTICS 2010 STUDENT HEADCOUNT Total Curtin Enrolments 2011 2012 2013 2014 2010 Total Curtin Enrolments 64,042 61,724 60,762 STUDENT HEADCOUNT EXCLUDING NON-AWARD OPEN UNIVERSITIES AUSTRALIA (OUA) STUDENTS * Total Curtin Enrolments Attendance: Full-time ratio 46,911 73% 47,318 72% 50,106 69% 51,595 68% 53,617 68% Course Level Postgraduate Research Postgraduate Coursework Undergraduate Non-Award 2,099 8,611 34,435 2,786 2,257 8,270 34,111 3,673 2,329 8,522 37,303 2,638 2,306 8,597 38,362 3,071 2,396 8,579 39,825 3,814 75,000 60,000 45,000 30,000 15,000 0 2010 2011 2012 2013 2014 Demography and Equity Student Citizenship Gender Female Students Female Proportion Curtin Enrolments by Course Level Indigenous Australian Students Postgraduate Research Low Socio-Economic Status (SES) Students Postgraduate Coursework Demography and Equity Student Citizenship Domestic Students International Students studying in Australia from : China (%) Malaysia (%) Indonesia (%) India (%) Singapore (%) International Students studying outside Australia from : Malaysia (%) Singapore (%) Mauritius (%) Hong Kong (%) Indonesia (%) 279 2,155 2,140 1,666 6,161 8,066 887 16,294 3,065 6,815 1,093 219 2,268 1,390 4,231 6,484 8,617 871 15,300 3,262 7,626 819 197 2,309 1,064 4,675 6,541 9,313 718 14,407 3,693 8,894 886 212 2,366 988 4,531 6,965 9,788 600 14,373 3,809 10,486 900 10,736 29% 15% 8% 4% 5% 9,198 38% 20% 9% 11% 4% 10,365 31% 15% 7% 3% 5% 9,159 42% 17% 11% 9% 4% 9,267 32% 15% 7% 2% 5% 8,016 38% 19% 13% 8% 6% 35,229 8,742 32% 14% 7% 3% 5% Total Curtin Completions 40,000 Course Level Postgraduate Research Postgraduate Coursework Undergraduate 30,000 20,000 10,000 7,818 37% 20% 14% 8% 7% 7,926 37% 18% 15% 9% 6% 22,000 22,000 2010201120112012 20122013 20132014 2014 2010 25,110 54% 446 25,237 53% 456 27,925 56% 440 29,121 56% 410 29,887 56% Curtin Indigenous Indigenous Curtin Australian Enrolments Enrolments Australian 460 460 440 440 420 420 400 400 380 380 2010 2010 2011 2011 2012 2012 2013 2013 2014 2014 431 6,000 6,000 3,057 3,261 4,451 4,959 5,469 5,000 5,000 4,000 4,000 2,000 2,000 1,000 1,000 11,251 202 3,362 7,687 11,780 224 3,378 8,178 11,473 250 3,320 7,903 11,267 284 3,178 7,805 10,919 2010 2010 2011 2011 2012 2012 2013 2013 2014 2014 Curtin Award Completions by Course Level 299 2,994 7,626 Postgraduate Research Postgraduate Coursework Undergraduate 12,000 0 2010 37,218 8,656 30% 13% 6% 4% 4% 24,000 24,000 0 0 2011 2012 2013 2014 International Onshore 32,823 26,000 26,000 50,000 International Offshore 27,794 28,000 28,000 AWARD COMPLETIONS Curtin Enrolments by Citizenship 26,977 Curtin Female Enrolments Curtin Female Enrolments 3,000 3,000 60,000 350 2,083 3,446 1,653 5,766 7,753 962 17,159 3,018 4,673 1,293 2014 Curtin Curtin Low Low SES SES Enrolments Enrolments Non-Award Undergraduate Broad Field of Education Agriculture, Environmental and Related Studies Architecture and Building Creative Arts Education Engineering and Related Technologies Health Information Technology Management and Commerce Natural and Physical Sciences Society and Culture Non-Award 2013 STUDENT HEADCOUNT EXCLUDING NON-AWARD OPEN UNIVERSITIES AUSTRALIA (OUA) STUDENTS * (continued) Curtin Award Courses Students 63,479 2012 30,000 30,000 Non-Award OUA Students 59,627 2011 Domestic 60,000 50,000 40,000 10,000 Total Curtin Staff 3,555 3,658 3,771 3,950 4,020 Work Function Academic Teaching Research Teaching and Research Other Professional 1,657 493 227 817 120 1,897 1,740 559 239 802 140 1,918 1,791 606 262 784 139 1,980 1,788 612 279 798 138 2,122 1,845 629 361 719 137 2,175 8,000 6,000 4,000 2,000 0 2010 2011 20,000 Staff figures are calculated as the full-time equivalent of continuing and fixed term staff captured as at 31 March, plus the full-time equivalent of casual staff as at 31 December. An estimate of casual staff is reported for 2014, while the prior year published in the 2013 Annual Report has now been updated with actual casual staff data. Includes staff from Bentley and WA campuses only. # 10,000 2010 2011 2012 2013 2014 2012 2013 2014 Curtin Staff (Full-Time Equivalent) Academic * Students who have multiple enrolments or a change of citizenship during the year are counted multiple times therefore the sum of the categories does not necessarily equal the overall total enrolment. Includes students from all campuses. Data reported is consistent with the HEIMS data collection with the exception of OUA students who are not reported to government. 30,000 0 STAFF (FULL-TIME EQUIVALENT) # Professional 4,000 3,500 3,000 2,500 2,000 1,500 1,000 500 0 2010 2011 2012 2013 2014 45 46 Curtin University Annual Report 2014 Curtin University Annual Report 2014 INDEPENDENT AUDITOR’S REPORT Auditor General Report on Controls I have audited the controls exercised by the Curtin University of Technology during the year ended 31 December 2014. Controls exercised by the Curtin University of Technology are those policies and procedures established by the University Council to ensure that the receipt, expenditure and investment of money, the acquisition and disposal of property, and the incurring of liabilities have been in accordance with legislative provisions. INDEPENDENT AUDITOR’S REPORT To the Parliament of Western Australia CURTIN UNIVERSITY OF TECHNOLOGY Report on the Financial Statements I have audited the accounts and financial statements of the Curtin University of Technology. The financial statements comprise the Statement of Financial Position as at 31 December 2014, the Statement of Comprehensive Income, Statement of Changes in Equity and Statement of Cash Flows for the year then ended, and Notes comprising a summary of significant accounting policies and other explanatory information. University Council’s Responsibility for the Financial Statements The University Council is responsible for keeping proper accounts, and the preparation and fair presentation of the financial statements in accordance with Australian Accounting Standards and the Treasurer’s Instructions, and for such internal control as the University Council determines is necessary to enable the preparation of financial statements that are free from material misstatement, whether due to fraud or error. Auditor’s Responsibility As required by the Auditor General Act 2006, my responsibility is to express an opinion on the financial statements based on my audit. The audit was conducted in accordance with Australian Auditing Standards. Those Standards require compliance with relevant ethical requirements relating to audit engagements and that the audit be planned and performed to obtain reasonable assurance about whether the financial statements are free from material misstatement. An audit involves performing procedures to obtain audit evidence about the amounts and disclosures in the financial statements. The procedures selected depend on the auditor’s judgement, including the assessment of the risks of material misstatement of the financial statements, whether due to fraud or error. In making those risk assessments, the auditor considers internal control relevant to the University’s preparation and fair presentation of the financial statements in order to design audit procedures that are appropriate in the circumstances. An audit also includes evaluating the appropriateness of the accounting policies used and the reasonableness of accounting estimates made by the University Council, as well as evaluating the overall presentation of the financial statements. I believe that the audit evidence obtained is sufficient and appropriate to provide a basis for my audit opinion. Opinion In my opinion, the financial statements are based on proper accounts and present fairly, in all material respects, the financial position of the Curtin University of Technology at 31 December 2014 and its financial performance and cash flows for the year then ended. They are in accordance with Australian Accounting Standards and the Treasurer’s Instructions. University Council’s Responsibility for Controls The University Council is responsible for maintaining an adequate system of internal control to ensure that the receipt, expenditure and investment of money, the acquisition and disposal of public and other property, and the incurring of liabilities are in accordance with the Financial Management Act 2006 and the Treasurer’s Instructions, and other relevant written law. Auditor’s Responsibility As required by the Auditor General Act 2006, my responsibility is to express an opinion on the controls exercised by the Curtin University of Technology based on my audit conducted in accordance with Australian Auditing and Assurance Standards. An audit involves performing procedures to obtain audit evidence about the adequacy of controls to ensure that the University complies with the legislative provisions. The procedures selected depend on the auditor’s judgement and include an evaluation of the design and implementation of relevant controls. I believe that the audit evidence obtained is sufficient and appropriate to provide a basis for my audit opinion. Opinion In my opinion, the controls exercised by the Curtin University of Technology are sufficiently adequate to provide reasonable assurance that the receipt, expenditure and investment of money, the acquisition and disposal of property, and the incurring of liabilities have been in accordance with legislative provisions during the year ended 31 December 2014. Report on the Key Performance Indicators I have audited the key performance indicators of the Curtin University of Technology for the year ended 31 December 2014. The key performance indicators are the key effectiveness indicators and the key efficiency indicators that provide information on outcome achievement and service provision. University Council’s Responsibility for the Key Performance Indicators The University Council is responsible for the preparation and fair presentation of the key performance indicators in accordance with the Financial Management Act 2006 and the Treasurer’s Instructions and for such controls as the University Council determines necessary to ensure that the key performance indicators fairly represent indicated performance. Auditor’s Responsibility As required by the Auditor General Act 2006, my responsibility is to express an opinion on the key performance indicators based on my audit conducted in accordance with Australian Auditing and Assurance Standards. Page 1 of 3 7th Floor Albert Facey House 469 Wellington Street Perth MAIL TO: Perth BC PO Box 8489 Perth WA 6849 TEL: 08 6557 7500 FAX: 08 6557 7600 Page 2 of 3 47 48 Curtin University Annual Report 2014 Curtin University Annual Report 2014 INDEPENDENT AUDITOR’S REPORT (CONTINUED) An audit involves performing procedures to obtain audit evidence about the key performance indicators. The procedures selected depend on the auditor’s judgement, including the assessment of the risks of material misstatement of the key performance indicators. In making these risk assessments the auditor considers internal control relevant to the University Council’s preparation and fair presentation of the key performance indicators in order to design audit procedures that are appropriate in the circumstances. An audit also includes evaluating the relevance and appropriateness of the key performance indicators for measuring the extent of outcome achievement and service provision. I believe that the audit evidence obtained is sufficient and appropriate to provide a basis for my audit opinion. Opinion In my opinion, the key performance indicators of the Curtin University of Technology are relevant and appropriate to assist users to assess the University’s performance and fairly represent indicated performance for the year ended 31 December 2014. Independence In conducting this audit, I have complied with the independence requirements of the Auditor General Act 2006 and Australian Auditing and Assurance Standards, and other relevant ethical requirements. Matters Relating to the Electronic Publication of the Audited Financial Statements and Key Performance Indicators This auditor’s report relates to the financial statements and key performance indicators of the Curtin University of Technology for the year ended 31 December 2014 included on the University’s website. The University’s management is responsible for the integrity of the University’s website. This audit does not provide assurance on the integrity of the University’s website. The auditor’s report refers only to the financial statements and key performance indicators described above. It does not provide an opinion on any other information which may have been hyperlinked to/from these financial statements or key performance indicators. If users of the financial statements and key performance indicators are concerned with the inherent risks arising from publication on a website, they are advised to refer to the hard copy of the audited financial statements and key performance indicators to confirm the information contained in this website version of the financial statements and key performance indicators. COLIN MURPHY AUDITOR GENERAL FOR WESTERN AUSTRALIA Perth, Western Australia 19 March 2015 Page 3 of 3 FINANCIAL REPORT 2014 Certifications 50 Statement of Comprehensive Income 51 Statement of Financial Position 52 Statement of Changes in Equity 53 Statement of Cash Flows54 Notes to the Financial Statements 55 Report by the Members of the University Council 107 49 50 Curtin University Annual Report 2014 CERTIFICATIONS Curtin University Annual Report 2014 STATEMENT OF COMPREHENSIVE INCOME for the year ended 31 December 2014 CERTIFICATION OF THE FINANCIAL STATEMENTS The accompanying financial statements of Curtin University of Technology have been prepared in compliance with the relevant provisions of the Financial Management Act 2006 from proper accounts and records to present fairly the financial transactions for the financial year ended 31 December 2014 and the financial position as at 31 December 2014. At the date of signing, we are not aware of any circumstances which would render any particulars included in the financial statements misleading or inaccurate. Colin BeckettDeborah TerryDavid Menarry Chancellor Vice-Chancellor Chief Finance Officer Dated this 18th day of March 2015 CERTIFICATION OF THE FINANCIAL STATEMENTS REQUIRED BY THE DEPARTMENT OF EDUCATION AND TRAINING We declare that the amount of Australian Government financial assistance expended during the financial year ended 31 December 2014 was for the purpose(s) for which it was intended and that Curtin University of Technology has complied with applicable legislation, contracts, agreements and program guidelines in making expenditure. Curtin University of Technology charged Student Services and Amenities Fees strictly in accordance with the Higher Education Support Act 2003 and the Administration Guidelines made under the Act. Revenue from the fee was spent strictly in accordance with the Act and only on services and amenities specified in subsection 19-38(4) of the Act. Note Revenue from Continuing Operations Australian Government financial assistance: Australian Government grants HELP – Australian Government payments State and Local Government financial assistance HECS-HELP – student payments Fees and charges Investment revenue Royalties, trademarks and licences Consultancy and contracts Other revenue Total Revenue from Continuing Operations Net (loss)/gain on disposal of non-current assets Total Income from Continuing Operations Expenses from Continuing Operations Employee related expenses Depreciation and amortisation Repairs and maintenance Finance costs Impairment of assets Deferred superannuation expense Other expenses Total Expenses from Continuing Operations 4 4 5 6 7 8 9 10 16 11 12 13 14 15 11 17 Net result for the Year Other Comprehensive Income Items that may be reclassifed to profit or loss: Net investment revaluation gain/(loss) Total Comprehensive Income 30(a) 2014 $’000 2013 $’000 329,460 162,465 13,993 27,636 218,967 32,115 38,945 35,089 30,977 889,647 (7) 889,640 306,053 143,967 13,590 26,868 217,596 27,965 34,569 32,766 45,915 849,289 1,501 850,790 505,096 46,303 18,284 3,965 1,569 398 264,307 839,922 486,315 39,752 14,213 4,105 (123) 505 243,624 788,391 49,718 62,399 11,453 61,171 32,635 95,034 The Statement of Comprehensive Income should be read in conjunction with the accompanying notes. Colin Beckett Deborah Terry ChancellorVice-Chancellor Dated this 18th day of March 2015 51 52 Curtin University Annual Report 2014 Curtin University Annual Report 2014 STATEMENT OF FINANCIAL POSITION STATEMENT OF CHANGES IN EQUITY for the year ended 31 December 2014 for the year ended 31 December 2014 2014 $’000 Note ASSETS Current Assets Cash and cash equivalents: Unrestricted Restricted Trade and other receivables Inventories Other financial assets: Unrestricted Restricted Other non-financial assets 2013 $’000 19(a) 19(b) 20 21 36,115 1,874 27,225 98 49,005 1,822 22,730 1,655 22 23 24 812 109,055 33,545 1,088 89,268 29,898 208,724 195,466 64,065 415,507 799,226 60,788 412,602 759,069 Total Non-Current Assets 1,278,798 1,232,459 Total Assets 1,487,522 1,427,925 17,206 1,767 61,565 72,945 13,864 2,292 84,110 62,789 153,483 163,055 56,349 103,144 58,116 93,379 Total Non-Current Liabilities 159,493 151,495 Total Liabilities 312,976 314,550 1,174,546 1,113,375 127,266 1,047,280 100,802 1,012,573 1,174,546 1,113,375 Total Current Assets Non-Current Assets Trade and other receivables Other financial assets – unrestricted Property, plant and equipment LIABILITIES Current Liabilities Trade and other payables Borrowings Provisions Other liabilities 20 22 25 26 27 28 29 Total Current Liabilities Non-Current Liabilities Borrowings Provisions 27 28 Net Assets EQUITY Reserves Retained earnings Total Equity 30 30 The Statement of Financial Position should be read in conjunction with the accompanying notes. Balance at 1 January 2013 Net result for the year Other comprehensive income for the year Transfers from retained earnings Transfers to retained earnings Balance at 31 December 2013 Net result for the year Other comprehensive income for the year Transfers from retained earnings Transfers to retained earnings Balance at 31 December 2014 Note Reserves $’000 Retained Earnings $’000 Total Equity $’000 30(a) 30(b) 30(b) 57,851 – 32,635 28,033 (17,717) 960,490 62,399 – (28,033) 17,717 1,018,341 62,399 32,635 – – 30 100,802 1,012,573 1,113,375 30(a) 30(b) 30(b) – 11,453 35,448 (20,437) 49,718 – (35,448) 20,437 49,718 11,453 – – 30 127,266 1,047,280 1,174,546 The Statement of Changes in Equity should be read in conjunction with the accompanying notes. 53 54 Curtin University Annual Report 2014 Curtin University Annual Report 2014 STATEMENT OF CASH FLOWS NOTES TO THE FINANCIAL STATEMENTS for the year ended 31 December 2014 for the year ended 31 December 2014 Note Contents 2014 $’000 2013 $’000 492,745 13,993 27,636 219,687 39,837 36,341 2,597 1,532 24,228 30,796 12,526 455,131 13,590 26,440 221,206 31,903 34,331 4,682 1,320 17,731 49,071 11,346 (517,189) (295,113) (3,982) 85,634 (481,927) (269,375) (4,125) 111,324 CASH FLOWS FROM INVESTING ACTIVITIES Payments for property, plant and equipment Proceeds on sale of property, plant and equipment Payments for investments Proceeds on redemption of investments Net Cash Used in Investing Activities (88,782) 195 (69,699) 62,106 (96,180) (77,313) 3,468 (107,605) 43,642 (137,808) 19 20 21 22 23 24 25 CASH FLOWS FROM FINANCING ACTIVITIES Repayment of borrowings Proceeds from borrowings Cash (Used in)/Provided by Financing Activities (2,292) – (2,292) (2,308) – (2,308) 26 27 28 29 (12,838) 50,827 37,989 (28,792) 79,619 50,827 Note CASH FLOWS FROM OPERATING ACTIVITIES Receipts Australian Government grants received State and Local Government financial assistance HECS-HELP – student payments Fees and charges Royalties, trademarks and licences Consultancy and contract research Interest received Dividends received Distributions received Other GST refunds received Payments Payments for employee benefits Payments to suppliers Interest and other costs of finance paid Net Cash Provided by Operating Activities 4(g) 40(b) 1 2 3 4 5 6 7 8 9 10 11 12 13 14 15 16 17 18 30 Net increase/(decrease) in cash and cash equivalents Cash and cash equivalents at the beginning of the financial year Cash and Cash Equivalents at the End of the Year 40(a) The Statement of Cash Flows should be read in conjunction with the accompanying notes. 31 32 33 34 35 36 37 38 39 40 41 42 43 44 45 Summary of significant accounting policies Critical accounting estimates and judgements Disaggregated information Revenue Australian Government financial assistance including Australian Government Loan Programs (HELP) State and Local Government financial assistance Fees and charges Investment revenue Royalties, trademarks and licences Consultancy and contracts Other revenue Expenses Employee related expenses Depreciation and amortisation Repairs and maintenance Finance costs Impairment of assets Net loss/(gain) on disposal of non-current assets Other expenses Discontinued operations Assets Cash and cash equivalents Trade and other receivables Inventories Other financial assets - unrestricted Other financial assets - restricted Other non-financial assets Property, plant and equipment Liabilities Trade and other payables Borrowings Provisions Other liabilities Equity Equity Other Notes Financial instruments Financial risk management Fair value Remuneration of members of the accountable authority and senior officers Remuneration of auditors Contingent liabilities and contingent assets Commitments Defined benefit superannuation plans Events occurring after reporting date Notes to the Statement of Cash Flows Non-cash financing and investing activities Related parties Joint operations and associates Supplementary financial information Acquittal of Australian Government financial assistance Page 56 64 64 65 67 67 67 67 68 68 69 69 69 69 70 70 70 71 71 71 73 73 74 74 75 78 78 81 82 83 84 86 87 89 91 92 92 93 97 98 98 99 100 100 101 55 56 Curtin University Annual Report 2014 Curtin University Annual Report 2014 NOTES TO THE FINANCIAL STATEMENTS (continued) for the year ended 31 December 2014 1 SUMMARY OF SIGNIFICANT ACCOUNTING POLICIES 1 SUMMARY OF SIGNIFICANT ACCOUNTING POLICIES (CONTINUED) The principal accounting policies adopted in the preparation of the financial report are set out below. These policies have been consistently applied to all the years presented, unless otherwise stated. (d) Revenue recognition (a) Basis of preparation This general purpose financial report has been prepared in accordance with Australian Accounting Standards, other authoritative pronouncements of the Australian Accounting Standards Board (AASB), the requirements of the Department of Education and Training, applicable sections of the Financial Management Act 2006 and applicable Western Australian Government Treasurer's Instructions. The financial statements and notes thereto comply with Australian Accounting Standards, some of which contain requirements specific to not-for-profit entities that are inconsistent with International Financial Reporting Standards requirements. Date of authorisation for issue The financial statements were authorised for issue by the members of the University Council on 18 March 2015. Historical cost convention The financial statements have been prepared under the historical cost convention except for certain financial assets which are reported at fair value (refer to Note 33). Accrual basis of accounting The financial statements, except for cash flow information, are prepared using the accrual basis of accounting. Critical accounting estimates The preparation of financial statements in conformity with Australian Accounting Standards requires the use of certain critical accounting estimates. It also requires management to exercise its judgement in the process of applying the University’s accounting policies. The estimates and underlying assumptions are reviewed on an ongoing basis. The areas involving a higher degree of judgement or complexity, or areas where assumptions and estimates are significant to the financial statements, are disclosed in Note 2. The financial report is presented in Australian dollars and all values are rounded to the nearest thousand dollars ($'000). (b) Not-for-profit status For the purpose of the application of Australian Accounting Standards and Interpretations, the University is considered to be a not-for-profit entity. (c) Principles of consolidation Consolidated financial statements are prepared by combining the financial statements of all entities that comprise the consolidated entity, being the University (the parent entity) and any controlled entities, in accordance with AASB 127 "Consolidated and Separate Financial Statements" and modified by Treasurer's Instruction 1105 "Consolidated Financial Statements". Consolidated financial statements are not required as there are no material controlled entities. Revenue from the sale of goods and disposal of other assets and the rendering of services is recognised when the University has passed control and the significant risks and rewards of ownership have passed to the buyer of the goods or other assets, or when a service has been provided to a customer. Student fees Student fees are recognised when the University has provided the service(s) to the student. Commonwealth supported student income Income for Commonwealth Supported students is recognised when the University has provided the service(s) to the student. Research income Research grants from governments are recognised as revenue when the University obtains control over the asset comprising the contributions. When the University does not have control of the contribution, does not have the right to receive the contribution or, in the case of reciprocal grants, has not fulfilled grant conditions, the grant contribution is treated as deferred income as a liability in the Statement of Financial Position. Reciprocal research income from other entities is recognised as revenue when the University has provided the service to the customer. Non-reciprocal research income from other entities is recognised as revenue when the University obtains control over the asset comprising the contributions. Unspent non-reciprocal research grant funds at the end of each financial year are recognised by way of a Research Grants Reserve (refer to Note 30(b)). This reserve is released as expenditure is incurred. Other government grants Other grants from government are recognised as revenue when the University obtains control over the asset comprising the contributions. When the University does not have control over the contribution, does not have the right to receive the contribution or, in the case of reciprocal grants, has not fulfilled grant conditions, the grant contribution is treated as deferred income as a liability in the Statement of Financial Position. Consultancy fees Consultancy fees are recognised as revenue when the University has provided the service(s) to the customer. Royalties Revenue from royalties is recognised when the University has provided the service(s) to the customer through their use of the University's intellectual property. Other contributions revenue Donations, gifts and other non-reciprocal contributions are recognised as revenue when the University obtains control over the assets comprising the contributions. Contributions of assets are recognised at their fair value. Contributions of services are only recognised when a fair value can be reliably determined and the services would be purchased if not donated. 57 58 Curtin University Annual Report 2014 Curtin University Annual Report 2014 NOTES TO THE FINANCIAL STATEMENTS (continued) for the year ended 31 December 2014 1 SUMMARY OF SIGNIFICANT ACCOUNTING POLICIES (CONTINUED) 1 SUMMARY OF SIGNIFICANT ACCOUNTING POLICIES (CONTINUED) (e) Property, plant and equipment (h) Intangible assets All property, plant and equipment with a cost of greater than $5,000 (excluding GST) is recorded as a non-current asset at cost, less subsequent depreciation and impairment. An intangible asset shall be recognised if, and only if: (i) it is probable that expected future economic benefits are attributable to the asset and will flow to the University; and Borrowing costs that are directly attributable to the acquisition, construction or production of an asset that necessarily takes a substantial period of time to get ready for its intended use or sale are capitalised as part of the cost of that asset. Assets acquired at no cost or for nominal consideration are initially recognised at their fair value at the date of acquisition. Gains and losses on disposals are determined by comparing the disposal proceeds with the carrying amount and are included in the Statement of Comprehensive Income. (f) Depreciation of non-current assets All non-current assets having a limited useful life are depreciated or amortised over their estimated useful lives, in a manner which reflects the consumption of their future economic benefits. Depreciation is calculated on a straight-line basis from the time the asset becomes available for use. Estimated useful lives are as follows: • • • • • • • Land Buildings Leasehold land and improvements Computing equipment Other equipment and furniture Motor vehicles Works of art Not depreciated Lower of 50 years or remaining useful life Lower of 50 years or remaining lease period 3 years 8 years 5 years Not depreciated Land and works of art controlled by the University are classified as non-current assets. They are anticipated to have indeterminate useful lives since their service potential is not, in any material sense, consumed. As such, no amount for depreciation is recognised. Assets’ residual values and useful lives are reviewed, and adjusted if appropriate, at each reporting date. Library collection The total cost of the last three years’ acquisition of library books and journals is considered to represent an acceptable carrying value of the library collection. In each year, that year’s cost of acquisition is added onto the carrying value and the earliest year’s cost of acquisition within the carrying value is written-off as an acceptable estimate of the depreciation of the library collection for the current year. (g) Impairment of property, plant and equipment Where the recoverable amount of an asset is less than its carrying amount, the carrying amount is reduced to the recoverable amount. That reduction is an impairment loss, which is recognised as an expense to the Statement of Comprehensive Income. In most cases recoverable amount is based on "value in use" and is determined as the depreciated replacement cost of the asset. (ii) the cost of the asset can be measured reliably. Intangible assets are recognised when the ongoing benefit to the University has been demonstrated and a useful life established. (i) Leases In accordance with AASB 117 “Leases”, leased assets classified as "finance leases" are recognised as assets. The amount initially brought to account as an asset is the present value of minimum lease payments. An equivalent finance lease liability is brought to account at the same time. Finance leased assets are amortised on a straight-line basis over the estimated useful life of the asset. Finance lease payments are allocated between interest expense and reduction of lease liability over the term of the lease. The interest expense is determined by applying the interest rate implicit in the lease to the outstanding lease liability at the beginning of each lease payment period. Operating lease payments are recognised as an expense in the Statement of Comprehensive Income on a basis which reflects the pattern in which economic benefits from the leased asset are consumed. (j) Inventories Inventories are valued at the lower of cost and net realisable value. Costs are assigned by the method most appropriate to each particular class of inventory, with the majority being measured on a weighted average cost basis. (k) Receivables Current accounts receivable are recognised at nominal amounts receivable as they are due for settlement no more than 30 days from the date of recognition. Non-current accounts receivable are recognised at fair value. Collectibility of receivables is reviewed on an ongoing basis. Debts which are known to be uncollectible are written-off as bad debts. A provision for impaired receivables is raised when there is objective evidence that the University may not be able to collect the debt. 59 60 Curtin University Annual Report 2014 Curtin University Annual Report 2014 NOTES TO THE FINANCIAL STATEMENTS (continued) for the year ended 31 December 2014 1 SUMMARY OF SIGNIFICANT ACCOUNTING POLICIES (CONTINUED) 1 SUMMARY OF SIGNIFICANT ACCOUNTING POLICIES (CONTINUED) (l) Investments (q) Employee benefits In accordance with AASB 139 “Financial Instruments" investments, other than unlisted shares, are classified as availablefor-sale and gain and losses arising from changes in fair value are recognised directly in other comprehensive income until the security is disposed of or is determined to be impaired, at which time the cumulative gain or loss previously recognised in equity is transferred to the Net Result for the period. Annual leave This benefit is recognised at the reporting date in respect of employees’ service up to that date and is measured at the amounts expected to be paid when the liabilities are settled, including anniversary increments and anticipated salary increases. Annual leave that is not expected to be settled wholly within 12 months after the end of the reporting period and is therefore considered to be 'other-long-term employee benefits'. The provision for annual leave is classified as a current liability as the University does not have an unconditional right to defer settlement of the liability for at least 12 months after the end of the reporting period. Any decline in the fair value of previously impaired available-for-sale investments is to be recognised in the Net Result for the period. Any increase in the fair value of previously impaired available-for-sale debt investments is to be recognised in the Net Result for the period to extent of the initial impairment and thereafter taken to the Investments Revaluation Reserve. Any increase in the fair value of previously impaired available-for-sale equity investments is to be recognised in the Investment Revaluation Reserve in Equity. Included within the unlisted shares are investments in a number of unlisted companies which were established to commercialise intellectual property. Unlisted shares are stated at historical cost unless there has been a permanent diminution in value, in which event a recoverable amount write-down is made. The University’s associates (refer Note 43 have not been equity accounted for in the University’s financial statements because they are not considered material. Interest revenue and other investment income is recognised when earned. (m) Joint research activities The University participates in a number of joint research activities, such as Cooperative Research Centres. The University recognises within its financial statements: the assets that it controls, the liabilities that it incurs, the expenses that it incurs and its share of the income that it earns from the Joint research activities. Long service leave Long service leave is not expected to be settled wholly within 12 months after the end of the reporting period. When assessing expected future payments, consideration is given to expected future wage and salary levels, experience of empoyee departures and periods of service. Expected future payments are discounted using market yields at the reporting date on national government bonds with terms to maturity and currency that match, as closely as possible, the estimated future cash outflows. Unconditional long service leave provisions are classified as current liabilities as the University does not have an unconditional right to defer settlement of the liability for at least 12 months after the reporting date. The liability for conditional long service leave expected to be settled more than 12 months from the reporting date is recognised in the provision for employee benefits as a non-current liability and is measured at the present value of expected future payments to be made in respect of services provided by employees up to the reporting date. (n) Loans receivable Superannuation The University contributes to a number of superannuation schemes including both defined contribution and defined benefit schemes. Loans receivable are initially recognised at fair value, net of transaction costs incurred. Loans are subsequently measured at amortised cost. Payments to defined contribution schemes are charged as an expense as they fall due. The University’s obligation is limited to these contributions. Loans receivable are classified as current assets unless the counterparty has an unconditional right to defer settlement of the asset for at least 12 months after the reporting date, in which case they are classified as non-current. Defined benefit schemes provide a defined lump sum benefit to scheme members based on years of service and final average salary. A defined benefit liability is included in the Statement of Financial Position equal to the present value of the defined benefit obligation at the reporting date (less any past service costs not yet recognised) less the fair value of scheme assets at the reporting date. (o) Payables Payables, including accruals (expenses incurred but not yet billed), are recognised when the University becomes obliged to make future payments as a result of a purchase of assets or services received. Payables are generally settled within a 30 day term. (p) Borrowings Borrowings are initially recognised at fair value, net of transaction costs incurred. Borrowings are subsequently measured at amortised cost. Borrowings are removed from the Statement of Financial Position when the obligation specified in the contract is discharged, cancelled or expired. The difference between the carrying amount of a financial liability that has been extinguished or transferred to another party and the consideration paid, including any non-cash assets transferred or liabilities assumed, is recognised in other income or other expenses. Borrowings are classified as current liabilities unless the University has an unconditional right to defer settlement of the liability for at least 12 months after the reporting date, in which case they are classified as non-current. The cost of providing benefits is determined using the projected unit credit method, with actuarial valuations being carried out on an annual basis. Actuarial gains and losses are recognised in other comprehensive income. Where appropriate the University has adopted the multi employer provisions of AASB 119 "Employee Benefits". This is currently relevant to the Unisuper Defined Benefit scheme. Unfunded superannuation An arrangement exists between the Commonwealth Government and the Western Australian Government to meet the unfunded liability for the University’s beneficiaries of the State Superannuation Schemes on an emerging cost basis. The unfunded liabilities have been recognised in the Statement of Financial Position under Provisions, with a corresponding asset recognised under Receivables. The recognition of both the asset and the liability concurrently does not affect the year end net asset position of the University. The liability and equivalent receivable are measured actuarially on an annual basis. 61 62 Curtin University Annual Report 2014 Curtin University Annual Report 2014 NOTES TO THE FINANCIAL STATEMENTS (continued) for the year ended 31 December 2014 1 SUMMARY OF SIGNIFICANT ACCOUNTING POLICIES (CONTINUED) 1 SUMMARY OF SIGNIFICANT ACCOUNTING POLICIES (CONTINUED) (q) Employee benefits (continued) (t) Other expenses Termination benefits Termination benefits are payable when employment is terminated before the normal retirement date, or when an employee accepts an offer of benefits in exchange for the termination of employment. The University recognises termination benefits either when it can no longer withdraw the offer of those benefits or when it has recognised costs for restructuring within the scope of AASB137 “Provisions, Contingent Liabilities and Contingent Assets” when it is demonstrably committed to terminating the employment of current employees according to a detailed formal plan without possibility of withdrawal. Finance costs Finance (or borrowing) costs expense is recognised on an accrual basis. Accrued or prepaid salaries Accrued salaries represent the amount due to staff but unpaid at the end of the financial period, as the end of the last pay period for that financial year does not always coincide with the end of the financial period. The University considers that the nominal carrying amount approximates net fair value. If the payroll is paid on a date prior to the end of the financial year, the amount prepaid which overlaps the year end is treated as a current asset. (r) Foreign currency Transactions denominated in a foreign currency are translated at the rates in existence at the dates of the transactions. Foreign currency monetary items, which include cash, receivables and payables, are translated at exchange rates current at the reporting date. Exchange gains and losses are brought to account in the Net Result. (s) Taxes Income tax Curtin University is exempt from income tax as per Subdivision 50-B of the Income Tax Assessment Act 1997. Goods and services tax (GST) Revenue, expenses and assets are recognised net of the amount of GST except: • • Where the GST incurred on a purchase of goods and services is not recoverable from the taxation authority, then the GST is recognised as part of the cost of acquisition or as part of the expense item as applicable; and Receivables and payables are stated with the amount of GST included. Finance costs for qualifying assets are capitalised net of any investment income earned on the unexpended portion of the borrowings. Other finance costs are expensed when incurred. Repairs and maintenance All repairs and maintenance expenditure is charged to the Statement of Comprehensive Income during the financial period in which it is incurred. Research and development Research and development costs, other than costs that meet the criteria for recognition as an intangible asset arising from development, are expensed to the Statement of Comprehensive Income as incurred. (u) Comparative figures Comparative figures have been, where appropriate, reclassified so as to be comparable with the figures presented in the current financial year. (v) Fair value Fair value measurement of investments and other financial assets are based on quoted prices in an active market. If the market for a financial asset is not active (including unlisted securities), the University establishes fair value by using valuation techniques that maximise the use of relevant data. These include reference to the estimated price in an orderly transaction that would take place between market participants at the measurement date. Other valuation techniques used are the cost approach and the income approach based on the characteristics of the asset and the assumptions made by market participants. (w) Externally operated campuses The University provides its educational services through a number of campuses and other locations. The three campuses outside of Western Australia are managed and operated by third parties through contractual arrangements with the University. The University has no ownership or financial interest in these third party companies other than by way of the contractual arrangements. The net amount of GST recoverable from, or payable to, the taxation authority is included as part of receivables or payables in the Statement of Financial Position. OPERATOR CAMPUS Cash flows are included in the Statement of Cash Flows on a gross basis. The GST component of cash flows arising from investing activities, which is recoverable from or payable to the taxation authority, is classified as an operating cash flow. Colleges of Business and Technology (NSW) Pty Ltd (100% subsidiary of Navitas Limited) Sydney, New South Wales, Australia Fringe benefits tax The University is liable to pay Fringe Benefits Tax, and it is included in ‘Other Expenses’ in the Statement of Comprehensive Income. Curtin Education Centre Pte Ltd (90% subsidiary of Navitas Limited) Singapore Curtin (Malaysia) Sdn Bhd Miri, Sarawak, Malaysia Payroll tax The University is liable to pay Payroll Tax, and it is included in ‘Employee related expenses’ in the Statement of Comprehensive Income. 63 64 Curtin University Annual Report 2014 Curtin University Annual Report 2014 NOTES TO THE FINANCIAL STATEMENTS (continued) for the year ended 31 December 2014 1 SUMMARY OF SIGNIFICANT ACCOUNTING POLICIES (CONTINUED) Note (x) New Accounting Standards and Interpretations Certain new Accounting Standards and Interpretations have been published that are not mandatory for the 31 December 2014 reporting period. The University’s assessment of the new Standards and Interpretations that have been finalised is that there is no significant impact to the University’s financial statements. Relevant Standards are as follows: • AASB 11 – Joint Arrangements; and • AASB 12 – Disclosure of Interests in Other Entities 4 AUSTRALIAN GOVERNMENT FINANCIAL ASSISTANCE INCLUDING AUSTRALIAN GOVERNMENT LOANS PROGRAMS (HELP) (a) Commonwealth Grants Scheme (CGS) and Other Grants Commonwealth Grants Scheme Indigenous Support Program Disability Support Program Partnership and Participation Program Total Commonwealth Grants Scheme and Other Grants 45(a) (b) Higher Education Loan Programs HECS-HELP FEE-HELP SA-HELP Total Higher Education Loan Programs 45(b) (c) Scholarships Australian Postgraduate Awards Indigenous Access Scholarships International Postgraduate Research Scholarships Commonwealth Education Costs Scholarships Commonwealth Accommodation Scholarships Total Scholarships 45(c) (d) Department of Education and Training Research Joint Research Engagement Program JRE Engineering Cadetship Sustainable Research Excellence Research Training Scheme Research Infrastructure Block Grants Total Department of Education and Training Research Grants 45(d) Note disclosures have been amended to reflect the new Standards. 2 CRITICAL ACCOUNTING ESTIMATES AND JUDGEMENTS Estimates and judgements are continually evaluated based on historical experience and other factors, including expectations of future events that are believed to be reasonable under the circumstances. (a) Critical accounting estimates and assumptions The key assumptions made concerning the future, and other key sources of estimating uncertainty at the reporting date that have a significant risk of causing a material adjustment to the carrying amounts of assets and liabilities within the next financial year are: • • • • • Provision for impairment of receivables; Superannuation benefits and associated assets/liabilities; Discount and cost escalation rates used in estimating non-current provisions – discount rates are based on market yields on government bonds; Assessing impairment of assets including receivables, property, plant and equipment and investments; and Estimating useful lives of non-current assets – the useful life reflects the consumption of the assets' future economic benefits. (b) Critical judgements in applying the University’s accounting policies The judgements that have been made in the process of applying accounting policies that have the most significant effect on the amounts recognised in the financial report include: • • • • • (e) Estimating the useful life of key assets; Impairment of property, plant and equipment; Impairment of receivables; Impairment of other financial assets (including investments); and Recognition of intangible assets. 3 DISAGGREGATED INFORMATION Revenue 2014 $’000 Results 2013 $’000 2014 $’000 Assets 2013 $’000 2014 $’000 2013 $’000 Geographical Australia Asia Other 872,205 14,616 2,826 832,923 13,891 2,475 37,221 9,715 2,782 50,925 9,057 2,417 1,474,934 9,806 2,782 1,416,333 9,157 2,435 Total 889,647 849,289 49,718 62,399 1,487,522 1,427,925 Australian Research Council (ARC) Grants (i) Discovery Project Fellowships Total Discovery 2014 $’000 2013 $’000 231,099 1,427 63 5,579 238,168 218,971 1,641 66 4,884 225,562 134,311 25,595 2,559 162,465 120,220 21,296 2,451 143,967 6,778 75 537 92 55 7,537 6,528 61 545 101 80 7,315 9,131 114 1,992 16,464 2,975 30,676 8,820 74 1,974 16,294 2,865 30,027 6,453 4,318 10,771 5,775 3,903 9,678 1,905 2,137 4,042 2,029 2,283 4,312 457 457 34 34 45(e)(i) (ii) Linkages Infrastructure Projects Total Linkages 45(e)(ii) (iii) Other Projects Total Other 45(e)(iii) 65 66 Curtin University Annual Report 2014 Curtin University Annual Report 2014 NOTES TO THE FINANCIAL STATEMENTS (continued) for the year ended 31 December 2014 Note 4 (f) 2013 $’000 AUSTRALIAN GOVERNMENT FINANCIAL ASSISTANCE INCLUDING AUSTRALIAN GOVERNMENT LOANS PROGRAMS (HELP) (CONTINUED) Other Australian Government financial assistance Non-capital CRC Cooperative Research Centres Funding CSIRO Flagship Collaborative Research Program National Drug Law Enforcement Research Fund NHMRC Grants Other Commonwealth Research Income Other Teaching Grants Other Commonwealth Grants Research funds from other universities – 11 464 180 97 752 37,809 491,925 70 – 1,419 932 11 2,432 29,126 450,021 329,460 134,311 25,595 2,559 162,465 491,925 306,053 120,220 21,296 2,451 143,967 450,020 45 (a) 45 (b) 45 (c) 45 (d) 45 (e)(i) 45 (e)(ii) 45 (e)(iii) 239,817 162,600 7,615 30,676 10,371 3,640 457 29,787 484,963 227,846 147,442 5,029 30,027 8,709 3,027 34 26,197 448,311 45 (f) 45 (g) 1,659 6,123 492,745 464 6,356 455,131 Reconciliation Australian Government grants [a+c+d+e+f] HECS-HELP payments FEE-HELP payments SA-HELP payments Total Australian Government Financial Assistance Australian Government grants received – cash basis CGS and Other Department of Education and Training Grants Higher Education Loan Programs Scholarships Department of Education and Training Research ARC grants – Discovery ARC grants – Linkages ARC grants – Other Other government grants Total Australian Government Grants Received – Cash Basis OS-Help (Net) Superannuation Supplementation Total Australian Government Funding Received – Cash Basis 2013 $’000 20 13,771 13,791 266 13,055 13,321 202 13,993 269 13,590 Course Fees and Charges Fee-paying onshore overseas students Fee-paying offshore overseas students Continuing education Fee-paying domestic postgraduate students Fee-paying domestic undergraduate students Fee-paying domestic non-award students Total Course Fees and Charges 159,164 7,564 1,789 13,687 – 14,901 197,105 157,576 6,542 1,806 13,217 2 18,611 197,754 Other Non-Course Fees and Charges Examination fees Late fees Library fines Parking fees Registration fees Ancillary fees Student accommodation Student services and amenities fees Other fees and charges Total Other Non-Course Fees and Charges 1 237 102 3,837 194 249 10,114 4,128 3,000 21,862 110 378 114 3,472 236 267 9,785 2,586 2,894 19,842 218,967 217,596 26,112 594 2,965 19,974 406 3,105 2,444 32,115 4,480 27,965 38,945 38,945 34,569 34,569 STATE AND LOCAL GOVERNMENT FINANCIAL ASSISTANCE Non-capital Local Government State Government 6,654 1,364 102 1,939 8,743 463 5,926 1,503 26,694 Total Other Australian Government Financial Assistance Total Australian Government Financial Assistance 2014 $’000 Note 5 7,334 454 150 2,851 7,850 444 16,484 1,490 37,057 Capital CRC Cooperative Research Centres Funding CSIRO Flagship Collaborative Research Program Other Commonwealth Research Income Other Commonwealth Grants Research funds from other universities (g) 2014 $’000 Capital State Government Total State and Local Government Financial Assistance 6 FEES AND CHARGES Total Fees and Charges 7 INVESTMENT REVENUE Distributions and dividends from available-for-sale investments Gain/(loss) on disposal of available-for-sale investments Cumulative gain/(loss) reclassified from equity on disposal of available-for-sale investments Interest received Total Investment Revenue 8 ROYALTIES, TRADEMARKS AND LICENCES Royalties Total Royalties, Trademarks and Licences 67 68 Curtin University Annual Report 2014 Curtin University Annual Report 2014 NOTES TO THE FINANCIAL STATEMENTS (continued) for the year ended 31 December 2014 Note 9 Revenue from sale of goods 2 Cost of sales: Opening inventory Purchases: Closing inventory Cost of goods sold 3 Gross margin before selling and administrative expenses 2013 $’000 Academic Salaries Contribution to superannuation and pension schemes Long service leave Annual leave Payroll tax Worker’s compensation Total Academic 208,239 30,094 3,330 15,778 14,771 706 272,918 204,070 29,260 5,698 12,599 13,187 237 265,051 Non-Academic Salaries Contribution to superannuation and pension schemes Long service leave Annual leave Payroll tax Worker’s compensation Total Non-Academic 176,064 25,479 3,354 14,418 12,312 551 232,178 169,745 24,454 5,373 10,982 10,732 (22) 221,264 Total Employee-Related Expenses 505,096 486,315 398 505 505,494 486,820 27,450 209 2,118 9,699 203 6,624 46,303 24,348 209 1,705 6,884 172 6,434 39,752 5,098 12,096 1,090 18,284 4,915 8,422 876 14,213 3,965 – 3,965 4,105 – 4,105 Note 11 11,954 23,135 35,089 13,686 19,080 32,766 10,349 798 7,794 9,283 569 1,637 50 271 226 30,977 14,372 1,611 7,946 12,540 6,644 2,052 52 387 311 45,915 3,509 6,619 1,544 966 2,510 999 1,507 4,628 (1,544) 4,591 2,028 OTHER REVENUE Trading income Donations Rental income Non-government grants 1 Insurance claims Staff salary recoveries Proceeds from sale of minor equipment Conference income Other Total Other Revenue 2014 $’000 2013 $’000 CONSULTANCY AND CONTRACTS Consultancy Contract research Total Consultancy and Contracts 10 2014 $’000 EMPLOYEE-RELATED EXPENSE Deferred superannuation expense Total Employee Related Expenses including Deferred Government Employee Benefits for Superannuation 12 38 (b) DEPRECIATION AND AMORTISATION 1 Non-government grants include revenue for scholarships, sponsorships, training workshops and other sundry income 2 Revenue from sale of goods is included under "Trading Income" 3 Costs of goods sold are included under "Other Expenses – Inventory used and sold" (see Note 17) Buildings Leasehold land and improvements Computing equipment Other equipment and furniture Motor vehicles Library collection Total Depreciation Expense Inventory of $0.556 million was sold as part of the disposal of the Bookshop (see Note 18). The proceeds were recorded against Inventory used and sold. 4 13 REPAIRS AND MAINTENANCE Building repairs General infrastructure maintenance Parks and Gardens Total Repairs and Maintenance 14 FINANCE COSTS Interest on borrowings Less: Amount capitalised Total Borrowing Costs 69 70 Curtin University Annual Report 2014 Curtin University Annual Report 2014 NOTES TO THE FINANCIAL STATEMENTS (continued) for the year ended 31 December 2014 Note 15 18 (7) 813 763 1,569 DISCONTINUED OPERATIONS Disposal of Curtin Bookshop The University operated the Curtin Bookshop until 15 April 2014, at which point the operations transferred to The University Co-operative Bookshop Limited. There was no significant financial impact from the transfer. Because the financial results of the Bookshop operations prior to disposal are not material, they have not been classified separately on the face of the Statement of Comprehensive Income as Discontinued Operations. (17) 27 (133) (123) NET LOSS/(GAIN) ON DISPOSAL OF NON-CURRENT ASSETS Carrying amount of disposed non-current assets Property, plant and equipment Proceeds from disposal of non-current assets Property, plant and equipment Net Loss/(Gain) on Disposal of Non-current Assets 17 2013 $’000 IMPAIRMENT OF ASSETS Bad debts written off/(recoveries) Movement in provision for impaired receivables Impairment less impairment reversal of other financial assets Total Impairment of Assets 16 2014 $’000 Note 202 (195) 7 1,967 7,761 7,627 4,781 19,435 12,336 52,272 (35) 19,283 4,396 925 3,055 3,076 3,571 4,401 8,359 523 15,402 963 666 42,483 473 4,284 4,664 6,519 2,026 14,746 17,433 2,882 264,307 CASH AND CASH EQUIVALENTS (a) Cash and Cash Equivalents – Unrestricted Cash at bank and on hand 1 Fixed Term Deposits 2 Total Cash and Cash Equivalents – Unrestricted (b) Cash and Cash Equivalents – Restricted Trust cash at bank 1 Trust Fixed Term Deposit 2 Total Cash and Cash Equivalents – Restricted (3,468) (1,501) OTHER EXPENSES Advertising, marketing and promotional Agency staff costs Books Computer peripherals and parts Consumables Contract work Exchange rate (gains)/losses Fees and commissions Financial assistance provided/research support Graduations Hospitality Insurance Inventory used and sold Lease and rental Non-capitalised equipment Occupational health, safety and welfare Partner service fees Postage and courier Publications Scholarships, grants and prizes Security Staff development and training Staff recruitment Subscriptions Telecommunications Travel Utilities and cleaning Other Total Other Expenses 19 7,369 4,832 3,501 19,321 12,036 46,619 7 19,796 3,780 1,119 2,937 2,765 5,934 4,111 6,790 735 13,169 1,212 796 37,012 338 4,504 2,117 6,160 2,226 14,497 17,348 2,593 243,624 Total Cash and Cash Equivalents 1 2 20 2014 $’000 2013 $’000 21,115 15,000 36,115 31,505 17,500 49,005 112 1,762 1,874 65 1,757 1,822 37,989 50,827 Cash on hand is non-interest bearing. Cash at bank is subject to variable interest rates (refer Note 31). Deposits are interest bearing at variable interest rates (refer Note 31) TRADE AND OTHER RECEIVABLES Current Student receivables Less: Provision for impaired receivables 8,255 (979) 7,276 5,076 (321) 4,755 16,109 (215) 15,894 14,562 (60) 14,502 38(b) 4,055 27,225 3,473 22,730 38(b) 64,065 91,290 60,788 83,518 General receivables Less: Provision for impaired receivables Deferred government contribution for unfunded superannuation Total Current Non-Current Deferred government contribution for unfunded superannuation Total Receivables 71 72 Curtin University Annual Report 2014 Curtin University Annual Report 2014 NOTES TO THE FINANCIAL STATEMENTS (continued) for the year ended 31 December 2014 Note 20 2014 $’000 2013 $’000 TRADE AND OTHER RECEIVABLES (CONTINUED) 20 Impaired receivables As at 31 December 2014, current receivables for student fees with a nominal value of $0.979 million (2013: $0.321 million) were impaired. The amount of the provision was $0.979 million (2013: $0.321 million). 492 487 979 69 252 321 21 1,169 271 1,440 1,544 98 98 111 1,655 24 788 812 613 475 1,088 Non-Current Available-for-Sale Funds under management (at fair value) Unlisted shares and warrants (at cost) 413,647 1,837 410,052 2,502 Loans receivable Interest bearing loans Total Non-Current Other Financial Assets 23 415,507 48 412,602 Total Other Financial Assets – Unrestricted 416,319 413,690 1 22 321 658 – – 979 249 72 – – 321 As at 31 December 2014, current general receivables with a nominal value of $0.215 million (2013: $0.06 million) were impaired. The ageing of these receivables is as follows: 138 77 215 – 60 60 10,722 30 10,752 10,717 62 10,779 As at 31 December 2014, current general receivables of $10.752 million (2013: $10.779 million) were past due date but not impaired. The ageing of these receivables is as follows: Less than 12 months Greater than 12 months – INVENTORIES Inventories not held for resale: General stores Total Inventories 3,541 – 3,541 Movements in the provision for impaired student fees receivables are as follows: Less than 12 months Greater than 12 months 105 – – (45) 60 Inventories held for resale: Merchandise 1 The ageing of these receivables is as follows: Balance at start of year Provision for impairment recognised during the year Receivables written-off during the year as uncollectible Unused amount reversed Balance at end of year 60 – 155 – 215 TRADE AND OTHER RECEIVABLES (CONTINUED) Balance at start of year Receivables written-off during the year as uncollectible Provision for impairment recognised during the year Unused amount reversed Balance at end of year As at 31 December 2014, current receivables for student fees of $1.440 million (2013: $3.541 million) were past due date but not impaired. Less than 12 months Greater than 12 months 2013 $’000 Movements in the provision for impaired general receivables are as follows: The ageing of these receivables is as follows: Less than 12 months Greater than 12 months 2014 $’000 Note The Curtin Bookshop operations and assets were disposed during the year (refer Note 18). OTHER FINANCIAL ASSETS – UNRESTRICTED Current Loans receivable Interest bearing loans Other loans Total Current Other Financial Assets 73 74 Curtin University Annual Report 2014 Curtin University Annual Report 2014 NOTES TO THE FINANCIAL STATEMENTS (continued) for the year ended 31 December 2014 Note 23 2014 $’000 2013 $’000 OTHER FINANCIAL ASSETS – RESTRICTED 25 Current Available-for-Sale Restricted funds under management Research activities Donations and prizes Trusts Total Restricted Funds Under Management (at fair value) 75,731 26,789 6,535 109,055 60,720 23,200 5,348 89,268 Total Restricted Other Financial Assets 109,055 89,268 Restricted funds are held as cash (refer Note 19(b)) or invested as managed funds. 24 Note Land ¹ At cost Accumulated impairment Buildings At cost Accumulated depreciation and impairment All available-for-sale financial assets are denominated in Australian currency. For an analysis of the credit risk and sensitivity of available-for-sale financial assets to price and interest rate risk, refer to Note 31. OTHER NON-FINANCIAL ASSETS Work in progress At cost 25,996 7,549 33,545 18,380 11,518 29,898 2013 $’000 78,998 – 78,998 78,998 – 78,998 784,236 (203,815) 580,421 747,643 (176,364) 571,279 5,423 (1,864) 3,559 5,423 (1,655) 3,768 49,195 29,685 16,953 (10,548) 6,405 16,531 (12,367) 4,164 112,532 (62,975) 49,557 96,770 (58,592) 38,178 1,317 (843) 474 1,544 (879) 665 24,691 (6,624) 18,067 26,253 (6,434) 19,819 12,550 12,513 799,226 759,069 PROPERTY, PLANT AND EQUIPMENT Leasehold land and improvements At cost Accumulated depreciation Current Prepayments Accrued income Total Other Non-Financial Assets 2014 $’000 Computing equipment At cost Accumulated depreciation Other equipment and furniture At cost Accumulated depreciation Motor vehicles At cost Accumulated depreciation Library collections At cost Accumulated depreciation Works of art At cost Total Property, Plant and Equipment ¹ Parts of the sites upon which the University is located at, in particular the Bentley and Kalgoorlie campuses, are vested in the University by the Government of Western Australia. 75 76 Curtin University Annual Report 2014 Curtin University Annual Report 2014 NOTES TO THE FINANCIAL STATEMENTS (continued) for the year ended 31 December 2014 25 PROPERTY, PLANT AND EQUIPMENT (CONTINUED) Reconciliations of the carrying amounts of property, plant and equipment at the beginning and end of the current financial year are set out below. Land $’000 Buildings $’000 Leasehold land and improvements $’000 Work in progress $’000 Computing equipment $’000 Other equipment and furniture $’000 Motor vehicles $’000 Library collection $’000 Works of art $’000 Total $’000 2014 Carrying amount at start of year Additions Cost of Disposals Impairment loss reversals on disposals Accumulated depreciation on disposals Transfers in/(out) Depreciation charge 78,998 – – – – – – 571,279 405 – – – 36,187 (27,450) 3,768 – – – – – (209) 29,685 70,687 – – – (51,177) – 4,164 2,736 (3,932) – 3,938 1,617 (2,118) 38,178 7,896 (5,507) – 5,316 13,373 (9,699) 665 29 (256) – 239 – (203) 19,819 4,872 – – – – (6,624) 12,513 37 – – – – – 759,069 86,662 (9,695) – 9,493 – (46,303) Carrying amount at end of year 78,998 580,421 3,559 49,195 6,405 49,557 474 18,067 12,550 799,226 Land $’000 Buildings $’000 Leasehold land and improvements $’000 Work in progress $’000 Computing equipment $’000 Other equipment and furniture $’000 Motor vehicles $’000 Library collection $’000 Works of art $’000 Total $’000 2013 Carrying amount at start of year Additions Cost of disposals Impairment loss reversals on disposals Accumulated depreciation on disposals Transfers in/(out) Depreciation charge 80,356 – (1,652) 294 – – – 554,628 782 (11,335) 8,010 3,323 40,219 (24,348) 3,977 – – – – – (209) 23,030 53,390 – – – (46,735) – 2,098 1,926 (182) – 182 1,845 (1,705) 26,037 14,847 (2,835) – 2,379 4,634 (6,884) 542 329 (220) – 186 – (172) 19,799 6,454 – – – – (6,434) 12,296 297 (117) – – 37 – 722,763 78,025 (16,341) 8,304 6,070 – (39,752) Carrying amount at end of year 78,998 571,279 3,768 29,685 4,164 38,178 665 19,819 12,513 759,069 77 78 Curtin University Annual Report 2014 Curtin University Annual Report 2014 NOTES TO THE FINANCIAL STATEMENTS (continued) for the year ended 31 December 2014 Note 26 2014 $’000 Current 27 17,206 13,864 BORROWINGS Current Treasury loans – secured Non-Current Treasury loans – secured 1,767 2,292 56,349 58,116 Total Borrowings 58,116 60,408 Average Interest rate Maturity date 2014 $’000 2013 $’000 Capital works -- quarterly principal and variable rate interest repayments 5.41% 15.10.2017 48 81 Muresk Campus housing -- fixed rate interest only quarterly repayments with the loan principal to be repaid at date of maturity 6.50% 15.07.2018 2,050 2,050 7.05% 15.01.2018 16,800 16,800 5.41% 15.10.2017 182 310 5.69% 15.10.2014 – 586 6.77% 5.11% 01.07.2029 01.07.2029 35,000 4,036 36,364 4,217 58,116 60,408 Chemistry Centre of WA building -- monthly principal and fixed rate interest repayments -- monthly principal and fixed rate interest repayments Total Treasury Loans 58,116 60,408 Facilities used at reporting date: -- Treasury Loans 58,116 60,408 – – Financing facilities available At reporting date, the following financing facilities had been negotiated and were available: Facilities unused at reporting date: -- Treasury Loans The University has not pledged any assets as security against the borrowings. The loans are secured by a State Government Treasurer's Guarantee. Principal outstanding Goldfields Arts Centre -- quarterly principal and variable rate interest repayments Total facilities: -- Treasury Loans BORROWINGS (CONTINUED) Assets pledged as security Treasury Loans The University has the following loans with the WA Treasury Corporation: Bentley Campus housing -- fixed rate interest only quarterly repayments with the loan principal to be repaid at date of maturity -- quarterly principal and variable rate interest repayments 2013 $’000 Note 27 TRADE AND OTHER PAYABLES Trade payables 2014 $’000 2013 $’000 79 80 Curtin University Annual Report 2014 Curtin University Annual Report 2014 NOTES TO THE FINANCIAL STATEMENTS (continued) for the year ended 31 December 2014 27 BORROWINGS (CONTINUED) 2014 $’000 2013 $’000 37,272 12,814 3,256 4,064 32,985 23,999 3,418 20,140 4,055 104 61,565 3,473 95 84,110 35,931 2,335 29,999 1,800 64,065 813 103,144 60,788 792 93,379 164,709 177,489 Employment on-costs provision Balance at beginning of year Addition/(reduction) in provisions recognised Reduction arising from payments Balance at end of year 5,218 2,793 (2,420) 5,591 4,867 2,165 (1,814) 5,218 Redundancy costs provision Balance at beginning of year Addition/(reduction) in provisions recognised Reduction arising from payments Balance at end of year 20,140 483 (16,559) 4,064 3,806 16,593 (259) 20,140 Fair value Note The carrying amounts and fair values of borrowings at balance date are: 28 2014 Capital works -- quarterly principal and variable rate interest repayments Muresk campus housing -- fixed rate interest only quarterly repayments with the loan principal to be repaid at date of maturity Bentley campus housing -- fixed rate interest only quarterly repayments with the loan principal to be repaid at date of maturity -- quarterly principal and variable rate interest repayments Goldfields Arts Centre -- quarterly principal and variable rate interest repayments Chemistry Centre of WA building -- monthly principal and fixed rate interest repayments -- monthly principal and fixed rate interest repayments Total Treasury Loans 2013 Carrying Amount $’000 Fair Value $’000 Carrying Amount $’000 Fair Value $’000 48 49 81 85 2,050 2,342 2,050 2,304 16,800 19,217 16,800 19,169 182 188 310 324 – – 586 601 35,000 43,515 36,364 41,320 4,036 4,533 4,217 4,303 58,116 69,844 60,408 68,106 The fair value of the loans have been prepared assuming hypothetical settlement dates of 31 December 2014 and 31 December 2013. PROVISIONS Current Employee benefits provisions Annual leave¹ Long service leave² Employment on-costs Redundancy costs Superannuation: -- Deferred employee benefits for unfunded superannuation -- Other University pension liabilities Total Current Provisions Non-current Employee benefits provisions Long service leave Employment on-costs Superannuation: -- Deferred employee benefits for unfunded superannuation -- Other University pension liabilities Total Non-current Provisions Total Provisions 38(b) 38(a) 38(b) 38(a) Movements in Other Provisions Movements in each class of provision during the financial year other than employee benefits, are set out below: 81 82 Curtin University Annual Report 2014 Curtin University Annual Report 2014 NOTES TO THE FINANCIAL STATEMENTS (continued) for the year ended 31 December 2014 Note 28 2014 $’000 Annual leave liabilities (including employment on-costs) have been classified as current as there is no unconditional right to defer settlement for at least 12 months after balance sheet date. Actual settlement of the current liabilities is expected to occur as follows: 26,880 12,815 39,695 24,635 10,329 34,964 5,441 8,206 13,647 8,312 17,126 25,438 36,518 28,018 8,409 72,945 33,635 21,984 7,170 62,789 (a) Long service leave liabilities have been classified as current where there is no unconditional right to defer settlement for at least 12 months after balance sheet date. Actual settlement of the current liabilities is expected to occur as follows: OTHER LIABILITIES Current Income received in advance Accrued expenses Monies held in trust Total Other Liabilities 40,082 60,720 100,802 1,047,280 1,012,573 Movement in reserve Balance at beginning of year 40,082 7,447 Unrealised valuation gain/(loss) Realised (gain)/loss on sale of financial assets Impairment reversal/(impairment) of financial assets Movement for the year Balance at end of year 15,566 (3,371) (742) 11,453 51,535 32,719 (217) 133 32,635 40,082 60,720 35,448 (20,437) 75,731 50,404 28,033 (17,717) 60,720 30(a) 30(b) Retained earnings ² Long service leave (including employment on-costs) 29 51,535 75,731 127,266 EQUITY Reserves Investments revaluation reserve Research grants reserve Total Reserves ¹ Annual leave (including employment on-costs) Within 12 months of the end of the reporting period More than 12 months after the end of the reporting period 2013 $’000 Note 30 PROVISIONS (CONTINUED) Within 12 months of the end of the reporting period More than 12 months after the end of the reporting period 2014 $’000 2013 $’000 (b) Investments revaluation reserve The investments revaluation reserve arises on the revaluation of available-forsale financial assets. Where a revalued financial asset is sold, that portion of the reserve which relates to that financial asset and is effectively realised, is recognised in the Net Result. Where a revalued financial asset is impaired, the portion of the reserve which relates to that financial asset is transferred to the Net Result. Research grants reserve Non-reciprocal research grants are required by Accounting Standards to be recognised as income when the University obtains control over the asset comprising the contributions. This reserve is provided for the balance of unspent research grants at the end of each financial year. Balance at beginning of year Transfer to reserves Transfers from reserves Balance at end of year 83 84 Curtin University Annual Report 2014 Curtin University Annual Report 2014 NOTES TO THE FINANCIAL STATEMENTS (continued) for the year ended 31 December 2014 31 FINANCIAL INSTRUMENTS FOREIGN EXCHANGE RISK SENSITIVITY 2 MATURITY PROFILE -10% WEIGHTED AVERAGE EFFECTIVE INTEREST RATE % NONINTEREST BEARING $’000 VARIABLE INTEREST RATE $’000 FIXED INTEREST RATE $’000 TOTAL CARRYING AMOUNT $’000 LESS THAN 1 YEAR 1-5 YEARS $’000 $’000 MORE THAN 5 YEARS $’000 NET RESULT $’000 INTEREST RATE RISK SENSITIVITY +10% OTHER EQUITY $’000 NET RESULT $’000 -200 BPS OTHER EQUITY $’000 NET RESULT $’000 PRICE RISK SENSITIVITY 3 +200 BPS OTHER EQUITY $’000 NET RESULT $’000 -15% OTHER EQUITY $’000 NET RESULT $’000 +15% OTHER EQUITY $’000 NET RESULT $’000 OTHER EQUITY $’000 CREDIT RISK $’000 2014 Financial assets Cash and cash equivalents Receivables Loans receivable Unlisted securities (unrestricted) Funds under management (unrestricted)1,4 Funds under management (restricted)4 2.78% 6 37,983 – 37,989 37,989 – – – – – – (1,473) – 1,473 – – – – – – – 23,170 – – 23,170 23,170 – – – – – – – – – – – – – – 23,170 0.31% 788 47 – 835 812 23 – – – – – (1) – 1 – – – – – 788 – 1,837 – – 1,837 - 1,837 – – – – – – – – – – – – – – 0.0005% 411,729 1,918 – 413,647 93 23,756 389,798 – 5,109 – (5,109) (2) – 2 – (509) (61,561) 138 61,931 1,918 – Total financial assets 109,055 – – 109,055 - – 109,055 – – – – – – – – (134) (16,230) 37 16,328 546,585 39,948 – 586,533 62,064 25,616 498,853 – 5,109 – (5,109) (1,476) – 1,476 – (643) (77,791) 175 78,259 – 25,876 Financial liabilities Payables Borrowings – 17,206 – – 17,206 17,206 – – – – – – – – – – – – – – – 6.72% - 230 57,886 58,116 1,767 26,758 29,592 – – – – 4 – (4) – – – – – – 17,206 230 57,886 75,322 18,973 26,758 29,592 – – – – 4 – (4) – – – – – – Total financial liabilities 2013 Financial Assets Cash and cash equivalents Receivables Loans receivable Unlisted securities (unrestricted) Funds under management (unrestricted)1,4 Funds under management (restricted)4 2.96% 20 50,807 – 50,827 50,827 – – – – – – (2,189) – 2,189 – – – – – – – 19,257 – – 19,257 19,257 – – – – – – – – – – – – – – 19,257 3.11% 475 661 – 1,136 1,088 48 – – – – – (8) – 8 – – – – – 475 – 2,502 – – 2,502 – 2,502 – – – – – – – – – – – – – – 0.003% 407,791 2,261 – 410,052 – 57,692 352,361 – 4,163 – (4,163) (12) – 12 – (6,716) (54,831) 236 61,311 2,261 – Total Financial Assets 89,268 – – 89,268 – – 89,268 – – – – – – – – (1,462) (11,937) 51 13,347 – 519,313 53,729 – 573,042 71,172 60,242 441,629 – 4,163 – (4,163) (2,209) – 2,209 – (8,178) (66,768) 287 74,658 21,993 Financial Liabilities Payables Borrowings Total Financial Liabilities 6.70% 13,864 – – 13,864 13,864 – – – – – – – – – – – – – – – – 978 59,430 60,408 2,292 26,379 31,737 – – – – 30 – (30) – – – – – – 13,864 978 59,430 74,272 16,156 26,379 31,737 30 (30) ¹ Funds under management mainly comprise investments in unit-based funds. Credit risk exposure relates only to funds under management not in unit-based funds. 2 A positive number indicates an increase in operating surplus and equity where the Australian dollar weakens against the foreign currency. 3 Net Result would not be affected if prices increased by 15% as the equity investments are classified as available-for-sale with gains recognised directly in equity. However, Net result would be affected if prices decreased by 15% with further decreeses in value of previously impaired available – for – sale assets recognised in the Net Result. 4 Funds under management in unit-based funds receive income by way of distributions and do not attract interest. 85 86 Curtin University Annual Report 2014 Curtin University Annual Report 2014 NOTES TO THE FINANCIAL STATEMENTS (continued) for the year ended 31 December 2014 32 FINANCIAL RISK MANAGEMENT 32 FINANCIAL RISK MANAGEMENT (CONTINUED) Financial instruments held by the University are cash and cash equivalents, receivables, available-for-sale financial assets, borrowings and payables. The University has exposure to financial risks. The University’s overall risk management program focuses on managing the risks identified below. (b) Credit Risk (a) Market Risk Market risk is the risk that the fair value or future cash flows of financial instruments will fluctuate because of changes in market prices. Components of market risk to which the University is exposed are: (i) Interest Rate Risk The University is exposed to interest rate risk from its use of interest bearing financial assets and liabilities. Non-derivative interest bearing assets are predominantly short term liquid assets, i.e. cash, cash deposits, interest-bearing loans advanced and some funds under management. The University's main interest rate liability risk arises from borrowings issued at fixed rates, which give exposure to fair value interest rate risk, and from borrowings at a variable interest rate, which give rise to cash flow interest rate risk. The University manages its borrowings in accordance with targeted interest rate, liquidity and debt portfolio maturity profiles. Notes 27 and 31 provide further detail. Credit risk is the risk that a contracting entity will not complete its obligations under a financial instrument resulting in a financial loss to the University. The University has exposure to credit risk and financial loss on financial assets included in the Statement of Financial Position, comprising trade and other receivables, and other financial assets. Procedures are in place to minimise exposure to credit risk associated with students and other debtors. The credit risk on funds under management and derivative financial instruments is limited as the counterparties are generally either with banks or investment grade fund managers. For an analysis of credit risk of the University refer to Note 31. The University’s funds under management subject to credit risk has reduced and certain zero coupon bonds held are endowed with capital protection mechanisms. At reporting date, some previously impaired available-for-sale debt investments increased in value resulting in reversal of impairments to the Net Result of $0.113 million, (2013: $0.133 million). (c) Liquidity Risk Liquidity risk refers to the risk of financial loss to the University as a result of insufficient funds being available to meet its short and long term liabilities. Note 31 details the University’s sensitivity to a 200 basis point increase or decrease in interest rates assuming the change took place at the beginning of the financial year and held constant throughout the reporting period. There is no significant exposure to interest rate risks. The University manages liquidity risk by maintaining adequate cash and cash equivalent balances, monitoring forecast and actual cash flows and matching the maturity profiles of financial assets and liabilities. (ii) Foreign Currency Risk 33 FAIR VALUE The University is exposed to foreign currency risk when income from overseas operations, such as royalties and offshore partner fees, is received in foreign currency. (a) Fair Value Measurements The University manages this risk by conducting its contracts and business in Australian dollars where it is commercially practical to do so. Furthermore, the University seeks to hedge any material, highly probable, foreign currency transactions by way of permitted instruments with appropriate counterparties. The University does not undertake speculative positions on movements in foreign currency exchange rates. The University holds available-for-sale investments whose underlying assets include some investments denominated in foreign currency which are unhedged. The fair values of financial assets and financial liabilities shown in Note 31 are determined as follows: • Due to the short-term nature of current trade and other receivables and payables, their carrying value is assumed to approximate fair value and, based on credit history, it is expected that the receivables that are neither past due date nor impaired will be received when due. • Available-for-sale equity financial assets are traded on an active market. Hence, the fair value of these investments is based on quoted market prices at the reporting date (Level 1). The fair value of available-for-sale debt financial assets are determined based on market prices of financial assets with similar maturity and risk profiles due to the illiquidity of these financial assets (Level 2). • Unlisted shares are measured at cost as their fair value cannot be measured reliably. Unlisted shares are not traded on an active market. • The fair value of loans to related entities are estimated for disclosure purposes by discounting the future contractual cash flows at the University's weighted average interest rate of cash and cash equivalents. • The fair value of borrowings is based on cash flows discounted using borrowing rates provided by the Western Australian Treasury Corporation. The rates vary between 5% to 8% depending on the purpose of the borrowing (2013: 5% to 7%). The fair value of the borrowings equals the carrying amount including additional charges and adjustments provided by the Western Australian Treasury Corporation, had the University terminated the loans at 31 December of each year. At 31 December 2014, the University held no foreign currency forward exchange contracts. (iii) Price Risk Price risk arises when there is a possibility of decline in the value of investments. It refers to the risk that the value of an investment will fluctuate due to changes in market prices. Investments include unlisted securities and funds under management. Note 31 details the University’s sensitivity to a 15% increase or decrease in prices at reporting date on its funds under management. At reporting date, if the inputs to valuation of funds under management had been 15% higher, Equity would have been $78.259 million higher (2013: $74.658 million) and the Net Result would have been $0.175 million (2013: $0.287 million) higher due to the reversal of previously impaired available-for-sale debt investments. However, if the inputs to the valuation of the funds under management had been 15% lower, the devaluation would have reduced the Equity Reserve by $77.791 million (2013: $66.768 million) and the impairment loss that would have been recognised through the Net Result on previously impaired assets would have been $0.643 million (2013: $8.178 million). The University's sensitivity to price risk has increased over the period due to the higher fair value of equity investments held and additional investments made during the year. 87 88 Curtin University Annual Report 2014 Curtin University Annual Report 2014 NOTES TO THE FINANCIAL STATEMENTS (continued) for the year ended 31 December 2014 33 FAIR VALUE (CONTINUED) 34 2014 2013 2014 2013 2014 Fair Value Hierarchy Carrying amount $’000 Carrying amount $’000 Fair value Fair value Level 1 Level 2 Level 3 Level 1 Level 2 Level 3 $’000 $’000 $’000 $’000 $’000 $’000 $’000 $’000 (a) Remuneration of Members of the Accountable Authority 2013 Fair Value Hierarchy Names of people who were members of the Accountable Authority during the financial year For the purposes of the Financial Management Act 2006, the University Council is the Accountable Authority of the University. Financial Assets Cash and cash equivalents 37,989 50,827 37,989 50,827 – – – – – – Receivables 23,170 19,257 23,170 19,257 – – – – – – 835 1,136 815 1,544 – – – – – – 1,837 2,502 1,837 2,502 – – – – – – Funds under management (unrestricted) 413,647 410,052 413,647 410,052 411,729 1,918 – 407,800 2,252 – Funds under management (restricted) 109,055 89,268 109,055 89,268 109,055 – – 89,268 – – Total Financial Assets 586,533 573,042 586,513 573,450 520,784 1,918 – 497,068 2,252 – Loans advanced Unlisted securities (unrestricted) REMUNERATION OF MEMBERS OF THE ACCOUNTABLE AUTHORITY AND SENIOR OFFICERS Financial Liabilities Members Appointed by Governor in Council Mr Chris Bennett Mr Kim Bridge Ms Cathryn Carver (commenced 11 November 2014) Mr Michael Lishman Mr Keith Spence Dr Michael Stanford, Pro Chancellor Co-opted Members Mr Colin Beckett, Chancellor Mr Steve Scudamore Mr Gene Tilbrook Member Nominated by the Minister for Education and Training Ms Sue Wilson Members who are members of bodies that represent the interests of the University in places other than the University's principal campus Vacant Member who is the Chief Executive Officer Professor Colin Stirling, Acting Vice–Chancellor Member who is a member of the Academic Board elected by and from the Academic Board Associate Professor Linley Lord Payables 17,206 13,864 17,206 13,864 – – – – – – Borrowings 58,116 60,408 69,844 68,106 69,844 – – 68,106 – – Professor Deborah Terry, Vice–Chancellor Total Financial Liabilities 75,322 74,272 87,050 81,970 69,844 – – 68,106 – – (commenced 17 February 2014) (c) Valuation Techniques The Fair Value Hierarchy reflects the following level of inputs used in measuring the fair value of financial assets and financial liabilities: Level 1: The fair value of assets and liabilities are determined based on quoted market prices (unadjusted) in active markets for identical assets or liabilities. The fair valuation of borrowings is primarily based on the net present value of the borrowing using the variable rate for lending at year end. Where the variable rate is lower than the fixed rate, the fair value is greater than the face value. Level 2: The fair value of assets and liabilities have been determined from inputs other than quoted prices that are observable for the asset or liability, either directly (i.e. as prices) or indirectly (derived from prices); this includes directly held fixed income securities of the University (classified as Funds under Management) being derived from observable market data. Level 3: Inputs for the Assets or Liabilities that are not based on observable market data. (ceased 16 February 2014) Members Elected by Full-time Academic Staff Professor Sue Fyfe (commenced 1 April 2014 and ceased 31 July 2014) Professor Dale Pinto (commenced 22 August 2014) Professor Glennda Scully Member Elected by Full-time General Staff Mr Andy Sharp Members Elected by Students Ms Cairney Lucks (elected 1 January 2014 and ceased 31 December 2014) Ms Eva Przenioslo (ceased 31 December 2014) 89 90 Curtin University Annual Report 2014 Curtin University Annual Report 2014 NOTES TO THE FINANCIAL STATEMENTS (continued) for the year ended 31 December 2014 34 REMUNERATION OF MEMBERS OF THE ACCOUNTABLE AUTHORITY AND SENIOR OFFICERS (CONTINUED) 34 REMUNERATION OF MEMBERS OF THE ACCOUNTABLE AUTHORITY AND SENIOR OFFICERS (CONTINUED) Remuneration of Members of the Accountable Authority The number of members of the Accountable Authority whose total fees, salaries, superannuation and other benefits for the financial year, fall within the following bands were: Nil – $10,000 $10,001 – $20,000 $20,001 – $30,000 $30,001 – $40,000 $60,001 – $70,000 $80,001 – $90,000 $130,001 – $140,000 $160,001 – $170,000 $170,001 – $180,000 $200,001 – $210,000 $240,001 – $250,000 $250,001 – $260,000 $280,001 – $290,000 $580,001 – $590,000 $590,001 – $600,000 $640,001 – $650,000 $650,001 – $660,000 Aggregate Remuneration of Members of the Accountable Authority(a) (a) 2014 Number 2013 Number 6 4 – 1 2 1 – – – 1 – 2 – 1 – 1 – 7 5 1 – 1 – 1 1 1 – 1 – 1 1 – 1 2014 $’000 2013 $’000 2,268 2,445 Includes accrued leave (b) Remuneration of Members of Senior Officers The number of Senior Officers other than Senior Officers reported as Members of the Accountable Authority, whose total of fees, salaries, superannuation and other benefits for the financial year, fall within the following bands were: Nil – $10,000 $80,001 – $90,000 $100,001 – $110,000 $140,001 – $150,000 $230,001 – $240,000 $270,001 – $280,000 $300,001 – $310,000 $310,001 – $320,000 $330,001 – $340,000 $340,001 – $350,000 $350,001 – $360,000 $360,001 – $370,000 2014 Number 2013 Number 1 1 – – – – – 1 – 1 – 1 – 1 1 1 1 1 – 1 2 1 1 2014 Number 2013 Number 1 1 1 1 – 1 1 1 2 1 – – – 1 1 1 – – 2014 $’000 2013 $’000 5,051 4,544 $370,001 – $380,000 $380,001 – $390,000 $390,001 – $400,000 $400,001 – $410,000 $430,001 – $440,000 $440,001 – $450,000 $460,001 – $470,000 $470,001 – $480,000 $480,001 – $490,000 Aggregate Remuneration of Senior Officers(a) (a) Includes accrued leave 35 REMUNERATION OF AUDITORS During the year, the following fees (excluding GST) were payable for services provided by the auditor of the University and non-related audit firms: 2014 $’000 2013 $’000 (a) Audit and review of the Financial Statements Fees paid to the Office of the Auditor General 277 273 (b) Other audit and assurance services 1 Fees paid to the Office of the Auditor General AQIS Canberra Casilli Holdings Pty Ltd Council of Ambulance Authorities Inc QAP Quantum Assurance SAI Global Limited Sutherland Rose Pty SV McLean Total fees paid for other audit services Total Remuneration of Auditors 13 1 19 3 – 8 6 4 – 54 331 13 3 9 – 2 – 5 – 4 36 309 1 Other audit and assurance services are related to compliance audits and research project audits. 91 92 Curtin University Annual Report 2014 Curtin University Annual Report 2014 NOTES TO THE FINANCIAL STATEMENTS (continued) for the year ended 31 December 2014 36 CONTINGENT LIABILITIES AND CONTINGENT ASSETS 37 COMMITMENTS (CONTINUED) (a) Contingent Liabilities Legal Actions The University is exposed to legal actions that arise in the course of the University’s normal operations. The University does not believe that these legal actions, if successful, would result in material loss. There are no other contingent liabilities. (b) Contingent Assets 37 COMMITMENTS 2014 $’000 2013 $’000 2013 $’000 100 – – 100 660 100 – 760 (d) Loans commitment to related parties Loans committed at the reporting date but not recognised as liabilities are as follows: Within one year Between one and five years Later than five years Total The University had no contingent assets at the reporting date. 2014 $’000 All the above commitments are inclusive of GST. 38 DEFINED BENEFIT SUPERANNUATION PLANS (a) Capital commitments (a) Curtin University pension obligations Capital expenditure contracted for at the reporting date but not recognised as liabilities is as follows: Until 30 June 2006, a group of former employees was entitled, on retirement, death or disablement, to defined benefits under the Curtin University Superannuation Scheme. In some circumstances the scheme provided pension benefits. All members of the Scheme had retired, and had either received a pension or were entitled to receive a pension at a future date under certain circumstances. The scheme was wound up on 30 June 2006. Some former members of the wound-up Scheme entered into a contractual relationship direct with the University. The University now provides benefits to those individuals, consistent with their entitlements under the wound-up scheme. The University meets the benefits directly as they fall due. Property, Plant and Equipment Within one year Later than one year Total 44,145 8,070 52,215 18,027 482 18,509 2014 $’000 2013 $’000 Reconciliation of the Present Value of the Defined Benefit Obligation Present value of defined benefit obligations at beginning of the year Current service cost Interest cost Actuarial loss/(gain) Benefits paid Present value of defined benefit obligations at end of the year 887 – 38 86 (94) 917 1,020 – 33 (79) (87) 887 Reconciliation of the Fair Value of Assets Fair value of assets at beginning of the year Employer contributions Benefits paid Fair value of assets at end of the year – 94 (94) – – 87 (87) – Reconciliation of the Assets and Liabilities Recognised in the Statement of Financial Position Present value of defined benefit obligation Fair value of assets Net liability 917 – 917 887 – 887 (b) Lease commitments Operating leases A lease is classified as an operating lease if it does not transfer substantially all the risks and rewards incidental to ownership. Operating leases at the University are related to computer leases, network leases, motor vehicle leases and building leases. Commitments for minimum lease payments in relation to non-cancellable operating leases are payable as follows: Within one year Between one and five years Later than five years Total future minimum lease payments 9,653 16,722 27,252 53,627 9,519 12,699 28,564 50,782 (c) Other expenditure commitments Commitments in relation to purchase orders are payable as follows: Within one year 16,027 16,270 93 94 Curtin University Annual Report 2014 Curtin University Annual Report 2014 NOTES TO THE FINANCIAL STATEMENTS (continued) for the year ended 31 December 2014 38 DEFINED BENEFIT SUPERANNUATION PLANS (CONTINUED) 38 DEFINED BENEFIT SUPERANNUATION PLANS (CONTINUED) Liability recognised in the Statement of Financial Position as: Current Non-current Expense Recognised in the Statement of Comprehensive Income Interest cost Actuarial loss/(gain) Superannuation expense/(benefit) 2014 $’000 2013 $’000 104 813 917 95 792 887 38 86 124 33 (79) (46) Assets There are no assets held specifically to meet the University's obligations with regard to this liability. Nature of asset/liability The University has recognised a liability in the Statement of Financial Position under Provisions in respect of its defined benefit superannuation arrangements. The University has no legal obligation to settle this liability with an immediate contribution or additional one-off contributions. The University intends to continue to meet the cost of the benefits as they fall due. (b) Government Employees Superannuation Board (GESB) Scheme Information The Scheme operates under the State Superannuation Act 2000 (Western Australia) and the State Superannuation Regulations 2001 (Western Australia). GESB is the Scheme’s Trustee and is responsible for the governance of the Scheme. As Trustee, GESB has a legal obligation to act solely in the best interests of the Scheme beneficiaries. Pension Scheme members receive pension benefits on retirement, death or invalidity. The Fund Share of the pension benefit, which is based on the member’s contributions plus investment earnings, may be commuted to a lump sum benefit. The University does not bear the cost associated with indexation of any pension arising from the Fund Share. The State share of the pension benefit, which is fully employer-financed, cannot be commuted to a lump sum benefit. Some former Pension Scheme members have transferred to the Gold State Super Scheme. In respect of their transferred benefit, the members receive a lump sum benefit at retirement, death or invalidity which is related to their salary during their employment and indexed during any deferral period after leaving public sector employment. The weighted average duration of the defined benefit obligation for the whole of the Pension Scheme is 9.6 years. The following disclosures are in respect of the employer-financed benefits only. The Pension Scheme and Gold State Super Scheme have been combined in the Note disclosure to the right. Reconciliation of the Present Value of the Defined Benefit Obligation Present value of defined benefit obligations at beginning of the year Current service cost Interest cost Actuarial loss/(gain) arising from changes in financial assumptions Actuarial loss/(gain) arising from liability experience Benefits paid Present value of defined benefit obligations at end of the year 2014 $’000 2013 $’000 64,260 – 2,554 5,692 2,017 (6,403) 68,120 73,586 – 2,194 (6,094) 921 (6,347) 64,260 These defined benefits obligations are wholly unfunded, such that there are no Assets. The University contributes any shortfall of reimbursement rights, as required, to meet the benefits paid (refer Note 11) Reconciliation of the Fair Value of Scheme Assets Fair value of scheme assets at beginning of the year Employer contributions Benefits paid Fair value of scheme assets at end of the year – 6,403 (6,403) – – 6,347 (6,347) – Reconciliation of the net liability recognised in the Statement of Financial Position Present value of defined benefit obligations Fair value of the scheme assets Net liability 68,120 – 68,120 64,260 – 64,260 Fair value of reimbursement rights Total net liability/(asset) in the Statement of Financial Position 68,120 – 64,260 – 4,055 64,065 68,120 3,473 60,788 64,261 Expense Recognised in the Statement of Comprehensive Income Current service cost Interest cost Reimbursement rights adjustments Deferred superannuation expense – 2,554 (2,156) 398 – 2,194 (1,689) 505 Actuarial loss/(gain) recognised in Other Comprehensive Income Actuarial loss/(gain) arising from changes in financial assumptions Actuarial loss/(gain) arising from liability experience Reimbursement rights adjustments Net Actuarial loss/(gain) recognised on defined benefit obligations 5,692 2,017 (7,709) – (6,094) 921 5,173 – Present value of defined benefit obligations/reimbursement rights is recognised as: Current Non-current 95 96 Curtin University Annual Report 2014 Curtin University Annual Report 2014 NOTES TO THE FINANCIAL STATEMENTS (continued) for the year ended 31 December 2014 38 DEFINED BENEFIT SUPERANNUATION PLANS (CONTINUED) 38 DEFINED BENEFIT SUPERANNUATION PLANS (CONTINUED) Scheme Assets There are no assets in the Pension Scheme to support the state share of the benefit or in the Gold State Super Scheme for current employees to support the transferred benefits. Hence, there is: Nature of asset/liability The University has recognised a liability in the Statement of Financial Position under Provisions in respect of its defined benefit superannuation arrangements (refer Note 28). • • • • • No fair value of Scheme assets; No asset allocation of Scheme assets; No financial instruments issued by the employer; No assets used by the employer; and No asset -liability matching strategies. An arrangement exists between the Australian Government and the Government of Western Australia to meet the unfunded liability for beneficiaries of the State Superannuation Schemes on an emerging cost basis. Accordingly, a corresponding asset is recognised under Receivables for the reimbursement rights (refer Note 20). The recognition of both the asset and the liability consequently do not affect the year end net asset position of the University, therefore no sensitivity analysis is relevant. Significant actuarial assumptions used in determining defined benefit obligation 2014 2013 Discount rate (active members) 3.12% 4.17% Discount rate (pensioners) 3.12% 4.17% Expected salary increase rate 5.00% 5.00% Expected pension increase rate 2.50% 2.50% % per annum (c) Unisuper Defined Benefit Plan Scheme information The UniSuper Defined Benefit Plan (DBP) is a multi-employer defined benefit plan under superannuation law. However, it is considered to be a multi-employer defined contribution plan under the Accounting Standard AASB 119 – Employee Benefits. This is because, where there are or may be insufficient funds to provide benefits payable, the Trustee must reduce the benefits payable on a fair and equitable basis. The employer’s legal or constructive obligation is limited to the amount that it agrees to contribute to the funds and the actuarial and investment risks rest with the employee. The discount rate is based on the Government bond maturing in April 2023. The decrement rates used (eg. mortality and retirement rates) are based on those used at the last actuarial valuation for the Schemes. (d) Superannuation Employer contributions 2014 2013 2012 2011 2010 $’000 $’000 $’000 $’000 $’000 68,120 64,261 73,586 72,242 66,210 – – – – – 68,120 64,261 73,586 72,242 66,210 Experience adjustments (gain)/loss – scheme assets – – – – – Experience adjustments (gain)/loss – scheme liabilities 2,017 921 (1,591) 928 1,484 Historical Information Present value of defined benefit obligation Fair value of Scheme assets Deficit in Scheme assets The experience adjustment for Scheme liabilities represents the actuarial loss/(gain) due to a change in the liabilities arising from the Scheme’s experience (eg. membership movements, unit entitlements) but excludes the effect of the changes in assumptions (eg. movements in the bond rate and changes in pensioner mortality assumptions). 2015 2014 Expected Contributions $’000 $’000 Expected employer contributions 6,086 6,027 Employer contributions for all superannuation plans of $55.573 million (2013: $53.714 million) were charged as an expense under employee benefits (refer Note 11) as they fell due. 39 EVENTS OCCURRING AFTER REPORTING DATE No events have occurred after the reporting date that are likely to have a material impact on the financial report of the University. 97 98 Curtin University Annual Report 2014 Curtin University Annual Report 2014 NOTES TO THE FINANCIAL STATEMENTS (continued) for the year ended 31 December 2014 40 NOTES TO THE STATEMENT OF CASH FLOWS 42 RELATED PARTIES 2014 $’000 2013 $’000 (a) Accountable authority and senior officers’ remuneration and retirement benefits (a) Reconciliation to cash Details of remuneration and retirement benefits are disclosed in Note 34. Cash at the end of the year as shown in the Statement of Cash Flows is reconciled to the related items in the Statement of Financial Position as follows: Unrestricted cash and cash equivalents (Note 19(a)) Restricted cash and cash equivalents (Note 19(b)) Balance as per Statement of Cash Flows (b) Other transactions with specified accountable authority and senior officers 36,115 1,874 37,989 49,005 1,822 50,827 Changes in assets and liabilities: (Increase)/decrease in trade and other receivables (Increase)/decrease in inventories (Increase)/decrease in other current assets Increase/(decrease) in trade and other payables Increase/(decrease) in provisions Increase/(decrease) in other current liabilities Net Cash provided by Operating Activities University Council members, or their related entities, may conduct transactions with the University that occur within a normal employee, customer or supplier relationship on terms and conditions that are no more favourable than those with which it is reasonable to expect the University to adopt if it was dealing at arm’s length in similar circumstances. These transactions include the following and have been quantified below where the transactions are considered likely to be of interest to users of these financial statements: (b) Reconciliation of net result to net cash provided by operating activities Net result for the year Depreciation expense Net loss/(gain) on disposal of non-current assets Impairment of assets Other non-cash items Net exchange differences Transactions with specified accountable authority and senior officers 49,718 46,303 7 1,569 (2,784) (35) 62,399 39,752 (1,501) (123) (4,346) 7 (7,772) 1,557 (3,647) 3,342 (12,780) 10,156 85,634 11,180 426 280 3,086 13,097 (12,933) 111,324 41 NON-CASH FINANCING AND INVESTING ACTIVITIES During the year, the University received and re-invested non-cash distributions net of fees from the available-for-sale investments of $0.5m (2013: $0.3m). The investment revenue was not reflected in the Statement of Cash Flows. Transaction Type Related party Purchases Revenue Receivable at 31 December Payable at 31 December Curtin Student Guild Curtin Student Guild Curtin Student Guild Curtin Student Guild 2014 $’000 2013 $’000 4,579 1,290 1,534 2,900 4,053 1,617 1,239 2,586 475 313 – – – 188 288 – – – (c) Loans to Related Parties Balance at beginning of year Loans advanced Loans repayment received Interest charged Interest received Balance at end of year 788 475 The University invests in a number of unlisted companies which are established to commercialise intellectual property. Loans were advanced to some of these entities. 99 100 Curtin University Annual Report 2014 Curtin University Annual Report 2014 NOTES TO THE FINANCIAL STATEMENTS (continued) for the year ended 31 December 2014 43 JOINT OPERATIONS AND ASSOCIATES 45 ACQUITTAL OF AUSTRALIAN GOVERNMENT FINANCIAL ASSISTANCE Companies (a) Department of Education – CGS and Other Education Grants Details of the University’s significant associates at 31 December 2014 are listed below. Carrying value of Investment Name of entity Country of incorporation Associates HiSeis Pty Ltd iCetana Pty Ltd Australia Australia Commonwealth Grants Scheme1 2014 2013 $’000 $’000 Equity holding 2014 $’000 2013 $’000 2014 % 2013 % 275 600 275 390 44 39 40 32 Financial assistance received in CASH during the reporting period 219,647 1,427 1,641 63 66 Net accrual adjustments (1,231) (676) - - - - Revenue for the period 231,099 218,971 1,427 1,641 63 66 - - - - - (62) 231,099 218,971 1,427 1,641 63 4 (231,099) (218,971) (1,427) (1,641) (186) (4) - - (123) - Surplus/(deficit) from the previous year Less expenses including accrual expenses 2014 $’000 2013 $’000 Write-offs Public property written off by the Minister during the financial year – – Losses through theft, defaults and other causes Losses of public monies and, public and other property through theft or default – – Amounts recovered – – Disability Support Program 2014 2013 $’000 $’000 232,330 Total revenue including accrual revenue 44 SUPPLEMENTARY FINANCIAL INFORMATION Indigenous Support Program 2014 2013 $’000 $’000 Surplus/(deficit) for reporting period - - Partnership & Participation Program2 2014 2013 $’000 $’000 Total 2014 $’000 2013 $’000 Financial assistance received in CASH during the reporting period 5,997 6,492 239,817 227,846 Net accrual adjustments (418) (1,608) (1,649) (2,284) Revenue for the period 5,579 4,884 238,168 225,562 Surplus/(deficit) from the previous year 1,407 97 1,407 35 4,981 239,576 225,597 Total revenue including accrual revenue Less expenses including accrual expenses Surplus/(deficit) for reporting period 6,986 (4,644) 2,342 (3,574) (237,356) (224,189) 1,407 2,219 1,407 Includes the basic CGS grant amount, CGS – Regional Loading, CGS – Enabling Loading, Maths and Science Transition Loading and Full Fee Places Transition Loading. 2 Includes Equity Support Program 1 101 102 Curtin University Annual Report 2014 Curtin University Annual Report 2014 NOTES TO THE FINANCIAL STATEMENTS (continued) for the year ended 31 December 2014 45 ACQUITTAL OF AUSTRALIAN GOVERNMENT FINANCIAL ASSISTANCE (CONTINUED) 45 ACQUITTAL OF AUSTRALIAN GOVERNMENT FINANCIAL ASSISTANCE (CONTINUED) (b) Higher Education Loan Programs (excl OS-HELP) (c) Scholarships HECS-HELP 2014 2013 $’000 $’000 Financial assistance received in CASH during the reporting period Net accrual adjustments Revenue for the period Surplus/(deficit) from the previous year Total revenue including accrual revenue Less expenses including accrual expenses Surplus/(deficit) for reporting period FEE-HELP3 2014 2013 $’000 $’000 SA-HELP 2014 2013 $’000 $’000 134,353 123,106 25,188 21,909 3,059 2,427 (42) (2,886) 407 (613) (500) 24 134,311 120,220 25,595 21,296 2,559 2,451 – – – – – – 134,311 120,220 25,595 21,296 2,559 2,451 (134,311) (120,220) – – (25,595) (21,296) (2,559) (2,451) – – – – Australian Postgraduate Awards 2014 $’000 2013 $’000 2014 $’000 2013 $’000 2014 $’000 2013 $’000 6,778 6,528 108 (28) 537 545 – – (33) 89 – – Revenue for the period 6,778 6,528 75 61 537 545 Surplus/(deficit) from the previous year (533) (558) – – (363) (120) Financial assistance received/(refunded) in CASH during the reporting period Net accrual adjustments Total revenue including accrual revenue Less expenses including accrual expenses Total 2014 $’000 Financial assistance received in CASH during the reporting period Net accrual adjustments Revenue for the period Surplus/(deficit) from the previous year Total revenue including accrual revenue Less expenses including accrual expenses Surplus/(deficit) for reporting period 3 2013 $’000 162,600 147,442 (135) (3,475) 162,465 143,967 – – 162,465 143,967 (162,465) (143,967) – – Program is in respect of FEE-HELP for higher education only and excludes funds received in respect of VET FEE-HELP. International Postgraduate Research Scholarships Indigenous Access Scholarships Surplus/(deficit) for reporting period 6,245 5,970 75 61 174 425 (7,026) (6,503) (75) (61) (1,002) (788) (781) (533) – – (828) (363) Commonwealth Education Costs Scholarships 4 Financial assistance received/(refunded) in CASH during the reporting period Net accrual adjustments Revenue for the period Total revenue including accrual revenue Less expenses including accrual expenses Surplus/(deficit) for reporting period Commonwealth Accommodation Scholarships 4 2014 $’000 2013 $’000 101 (968) (9) 2014 $’000 Total 2013 $’000 2014 $’000 2013 $’000 91 (1,048) 7,615 5,029 1,069 (36) 1,128 (78) 2,286 92 101 55 80 7,537 7,315 – – – – (896) (678) 92 101 55 80 6,641 6,637 (92) (101) (55) (80) (8,250) (7,533) – – – – (1,609) (897) Includes Grandfathered Scholarships, National Priority, National Accommodation Priority Scholarships and Indigenous Scholarships (ICECS, IECECS, ICAS and IECAS) respectively. 4 103 104 Curtin University Annual Report 2014 Curtin University Annual Report 2014 NOTES TO THE FINANCIAL STATEMENTS (continued) for the year ended 31 December 2014 45 ACQUITTAL OF AUSTRALIAN GOVERNMENT FINANCIAL ASSISTANCE (CONTINUED) 45 ACQUITTAL OF AUSTRALIAN GOVERNMENT FINANCIAL ASSISTANCE (CONTINUED) (d) Department of Education Research (e) Australian Research Council Grants Joint Research Engagement Program 2014 2013 $’000 $’000 Financial assistance received in CASH during the reporting period Net accrual adjustments Revenue for the period Surplus/(deficit) from the previous year Total revenue including accrual revenue Less expenses including accrual expenses Surplus/(deficit) for reporting period Net accrual adjustments Revenue for the period Surplus/(deficit) from the previous year Total revenue including accrual revenue Less expenses including accrual expenses Surplus/(deficit) for reporting period Sustainable Research Excellence 2014 2013 $’000 $’000 9,131 8,820 114 74 1,992 1,974 – – – – – – 9,131 8,820 114 74 1,992 1,974 – – – – (317) 36 9,131 8,820 114 74 1,675 2,010 (9,131) (8,820) (114) (74) (1,992) (2,327) – – – – (317) (317) Research Training Scheme 2014 2013 $’000 $’000 Financial assistance received in CASH during the reporting period JRE Engineering Cadetship 2014 2013 $’000 $’000 16,464 16,294 Research Infrastructure Block Grants 2014 2013 $’000 $’000 2,975 2,865 (i) Discovery Projects 2014 $’000 Financial assistance received in CASH during the reporting period Net accrual adjustments Revenue for the period Surplus/(deficit) from the previous year Total revenue including accrual revenue Less expenses including accrual expenses Surplus/(deficit) for reporting period Total 2014 $’000 30,676 5 2013 $’000 – – – – – – 16,294 2,975 2,865 30,676 30,027 – – – – (317) 36 16,464 16,294 2,975 2,865 30,359 30,063 (16,464) (16,294) (2,975) (2,865) (30,676) (30,380) – – – – (317) (317) Total 2014 $’000 2013 $’000 6,053 4,806 4,318 3,903 10,371 8,709 400 969 – – 400 969 6,453 5,775 4,318 3,903 10,771 9,678 139 1,714 2,106 787 2,244 2,501 6,592 7,489 6,424 4,690 13,016 12,179 (5,748) (7,350) (3,298) (2,584) (9,046) (9,934) 844 139 3,126 2,106 3,970 2,245 Includes Early Career Researcher Award (ii) Linkages Infrastructure 2014 2013 $’000 $’000 30,027 16,464 2013 $’000 Fellowships 5 2014 2013 $’000 $’000 Financial assistance received in CASH during the reporting period Projects 2014 $’000 2013 $’000 Total 2014 $’000 2013 $’000 1,280 1,610 2,360 1,417 3,640 3,027 625 419 (223) 866 402 1,285 Revenue for the period 1,905 2,029 2,137 2,283 4,042 4,312 Surplus/(deficit) from the previous year 1,297 980 (1,218) (381) 79 599 Total revenue including accrual revenue 3,202 3,009 919 1,902 4,121 4,911 (2,238) (1,712) (1,773) (3,120) (4,011) (4,832) 964 1,297 (854) (1,218) 110 79 Net accrual adjustments Less expenses including accrual expenses Surplus/(deficit) for reporting period (iii) Other Projects 2014 $’000 Financial assistance received in CASH during the reporting period Net accrual adjustments Revenue for the period Surplus/(deficit) from the previous year Total revenue including accrual revenue Less expenses including accrual expenses Surplus/(deficit) for reporting period 2013 $’000 Total 2014 $’000 2013 $’000 457 34 457 34 – – – – 457 34 457 34 7 – 7 – 464 34 464 34 (231) (27) (231) (27) 233 7 233 7 105 106 Curtin University Annual Report 2014 Curtin University Annual Report 2014 NOTES TO THE FINANCIAL STATEMENTS (continued) REPORT BY THE MEMBERS OF THE UNIVERSITY COUNCIL 45 ACQUITTAL OF AUSTRALIAN GOVERNMENT FINANCIAL ASSISTANCE (CONTINUED) MEMBERS for the year ended 31 December 2014 The members of the University Council present their report for the year ended 31 December 2014 (f) OS-HELP 2014 $’000 2013 $’000 Cash received during the reporting period 1,659 464 (1,659) (464) Net cash received – – Cash surplus/(deficit) from the previous period – – Cash surplus/(deficit) for the reporting period – – Cash spent during the reporting period 6,123 6,356 398 505 6,521 6,861 527 520 7,048 7,381 (6,814) (6,854) 234 527 683 309 SA-HELP revenue earned 2,559 2,452 Student services fees direct from students 4,120 2,574 Total revenue expendable in period 7,362 5,335 (6,680) (4,652) 682 683 University contribution in respect of current employees Cash available Cash surplus/(deficit) from the previous period Cash available for current period Contributions to specified defined benefit funds Cash surplus/(deficit) for the reporting period (h) Student Services and Amenities Fee Unspent/(overspent) revenue from previous period Student Services expenses during period Unspent/(overspent) student services revenue Members appointed by Governor in Council Mr Chris Bennett Mr Kim Bridge Ms Cathryn Carver (commenced 11 November 2014) Mr Michael Lishman Mr Keith Spence Dr Michael Stanford, Pro Chancellor Member nominated by the Minister for Education and Training Ms Sue Wilson (g) Higher Education Superannuation Program Cash received during the reporting period The following persons were members of the Council of Curtin University of Technology during the year ended 31 December 2014: Member who is the Chief Executive Officer Professor Colin Stirling, Acting Vice-Chancellor (ceased 16 February 2014) Professor Deborah Terry, Vice-Chancellor (commenced 17 February 2014) Members elected by full-time academic staff Professor Sue Fyfe (commenced 1 April 2014 and ceased 31 July 2014) Professor Dale Pinto (commenced 22 August 2014) Professor Glennda Scully Member elected by full-time general staff Mr Andy Sharp Co-opted members Mr Colin Beckett, Chancellor Mr Steve Scudamore Mr Gene Tilbrook Members elected by the Alumni Association Vacant Members who are members of bodies that represent the interests of the University in places other than the University’s principal campus Vacant Member who is a member of the Academic Board elected by and from the Academic Board Associate Professor Linley Lord Members elected by students Ms Cairney Lucks (elected 1 January 2014 and ceased 31 December 2014) Ms Eva Przenioslo (ceased 31 December 2014) 107 108 Curtin University Annual Report 2014 Curtin University Annual Report 2014 REPORT BY THE MEMBERS OF THE UNIVERSITY COUNCIL (continued) The members of the University Council present their report for the year ended 31 December 2014 REPORT BY THE MEMBERS OF THE UNIVERSITY COUNCIL (continued) The members of the University Council present their report for the year ended 31 December 2014 Meetings of members The number of meetings of the University Council and of each committee of Council held during the year ended 31 December 2014, and the number of meetings attended by each member were: MEETINGS OF COMMITTEES1 MEMBERS COUNCIL MEETINGS ATTENDED HELD Mr Gary Angove (co-opted) AUDIT AND COMPLIANCE ATTENDED HELD 6 Mr Colin Beckett, Chancellor4 8 8 Mr Chris Bennett 7 8 Mr Kim Bridge 6 8 Ms Cathryn Carver 0 1 FINANCE ATTENDED HELD HEALTH AND SAFETY DUE DILIGENCE ATTENDED HELD 0 6 Mr Mario D’Orazio (co-opted) 0 7 8 8 8 0 Professor Paul Fairall (co-opted) Professor Sue Fyfe 2 2 Mr Michael Lishman 6 8 Assoc Professor Linley Lord 7 8 Ms Cairney Lucks 8 8 Professor Dale Pinto 3 3 Ms Eva Przenioslo 6 8 2 7 Mr Bernard Salt (co-opted) 2 0 0 0 0 0 0 0 0 8 0 Mr Steve Scudamore5 5 8 Professor Glennda Scully 7 8 Mr Andy Sharp 8 8 2 2 Mr Keith Spence5 8 8 2 2 Dr Michael Stanford, Pro Chancellor 5 8 Professor Deborah Terry6 8 8 0 2 2 Mr Gene Tilbrook4 5 8 0 Ms Sue Wilson 8 8 3 5 4 7 5 8 6 7 0 8 8 6 7 0 5 8 7 7 6 The number of meetings held represents the number of regular and special meetings held during the time a member was a member of the Council or a committee of Council during the year. The number of meetings held does not include matters considered by circular resolution by respective committees, and site visits conducted by the Health and Safety Due Diligence Committee. The Greater Curtin Committee was disestablished by Council at its meeting on 6 August 2014 1 2 0 6 LEGISLATIVE3 ATTENDED HELD 6 0 6 EXECUTIVE ATTENDED HELD GREATER CURTIN2 ATTENDED HELD The Legislative Committee only meets when necessary Also a member of the Curtin University Foundation Board 5 Also a member of the Kalgoorlie Campus Council 6 Also a member of the Curtin University Foundation Board and Kalgoorlie Campus Council 3 4 109 110 Curtin University Annual Report 2014 Curtin University Annual Report 2014 REPORT BY THE MEMBERS OF THE UNIVERSITY COUNCIL (continued) The members of the University Council present their report for the year ended 31 December 2014 REPORT BY THE MEMBERS OF THE UNIVERSITY COUNCIL (continued) The members of the University Council present their report for the year ended 31 December 2014 Principal activities During the year, the principal and continuing activities of the University are: Insurance of Members of Council and Officers The University provides Directors and Officers Liability and Employers Practices Insurance and Supplementary Legal Expenses Cover through contracts with external insurance providers. The cover applies to Members of Council and Officers of the University. a. to provide courses of study appropriate to a university, and other tertiary courses, and to aid the advancement, development and practical application of knowledge; b. to encourage and participate in the development and improvement of tertiary education whether on a full or part-time basis; and Proceedings on behalf of Curtin University of Technology No material legal proceedings were initiated by the University during 2014. c. to encourage and undertake research and to aid directly or indirectly the application of science and technology to industry. This report is made in accordance with a resolution of the members of the University Council. No significant changes in the nature of the activities of the University occurred during the year. Review of operations The net result for the year ended 31 December 2014 was $49.718 million (2013: $62.399 million). The operations of the University during the financial year are reviewed in the following accompanying sections of the Annual Report: • Chancellor’s Foreword • Vice-Chancellor’s Report • Report on Operations • 2014 Activity Highlights. Significant changes in the State of Affairs No significant changes in the University’s state of affairs occurred during the year. Matters subsequent to the end of the financial year No events have occurred since balance date that are likely to have a material impact on the financial report of the University. Likely developments and expected results of operations The University will continue to further its objectives, consistent with the principal activities outlined above. To provide further detail would result in unreasonable prejudice. Environmental regulation The members of the University Council are not aware of any breaches of environmental regulations. Relevant legislation that Curtin is subject to includes: • Environmental Protection Act 1986 (WA) • Environmental Protection Regulations 1987 • Environmental Protection (Controlled Waste) Regulations 2004 • Environmental Protection (Noise) Regulations 1997 • Environmental Protection (Unauthorised Discharges) Regulations 2004 • Contaminated Sites Act 2003 (WA) • National Greenhouse and Energy Reporting Act 2007 (Cth) • National Greenhouse and Energy Reporting Regulations 2008. The University is committed to protecting, preserving as well as improving the environment in which the University operates. Colin Beckett Chancellor Curtin University of Technology, Bentley, Perth, WA Dated this 18th day of March 2015 111 112 Curtin University Annual Report 2014 Curtin University Annual Report 2014 CURTIN’S KEY PERFORMANCE INDICATORS Certification 114 Introduction115 Teaching and Research 116 Engagement and Impact 118 People and Culture 119 Financial Security121 113 114 Curtin University Annual Report 2014 Curtin University Annual Report 2014 CERTIFICATION OF KEY PERFORMANCE INDICATORS CURTIN’S KEY PERFORMANCE INDICATORS We hereby certify that the performance indicators are based on proper records, are relevant and appropriate for assisting users to access Curtin University of Technology’s performance, and fairly represent the performance of Curtin University of Technology for the financial year ended 31 December 2014. The institutional effectiveness and efficiency Key Performance Indicators used by Curtin are designed to demonstrate progress towards meeting Teaching and Learning, and Research and Development objectives, and targets as espoused in the University’s Strategic Plan and Enabling Plans. The University uses a Balanced Scorecard framework to present its Key Performance Indicators. This framework capitalizes on the interdependences of outcome components and Key Performance Indicators to provide a holistic and balanced view of the University’s performance. Colin BeckettDeborah Terry ChancellorVice-Chancellor Performance Indicators are classified as either effectiveness or efficiency. A summary of the Outcome, Outcome Components and Key Performance Indicators is presented below in the Balance Scorecard framework. On behalf of the University Council 1 TEACHING AND RESEARCH Outcome component Dated this 18th day on March 2015 Key Performance Indicator Student experience To be a destination of choice for students, Curtin will offer an educational experience that is richly interative, engaging and fully prepares students for the complex environments they will live and work in. Research output To enhance Curtin’s research performance to strengthen as a research-intensive university. 2 ENGAGEMENT AND IMPACT Outcome Key Performance component Indicator Graduate reputation To contribute to the workforce through Curtin’s graduates. International engagement To expand Curtin’s international outreach through global collaborations. 2.1 Domestic graduate employment rates – AGS (GDS) (Effectiveness) 2.2 % of research outputs with international co-authors (Effectiveness) Curtin’s Outcome: Curtin University’s Mission Statement outlines the University’s purpose and overarching outcome. Curtin’s Mission is: To change minds, lives and the world through leadership, innovation and excellence in teaching and research. To achieve its Mission the University measures its performance across a series of Outcome Components related to the experience of its students and the reputation of its graduates, research outputs and international research collaboration, performance of its academic workforce and the efficiency of its teaching and learning activities. 1.1 Unit satisfaction (eVALUate) (Effectiveness) 1.2 Retention rates • Commencing UG • All UG retained at Curtin (Efficiency) 1.3 Total research income (Cat 1–4 (Effectiveness) 1.4 HDR enrolled load (Effectiveness) CURTIN VISION 2030 3 PEOPLE AND CULTURE Outcome Key Performance component Indicator A recognised international leader in research and education. MISSION To change minds, lives and the world through leadership, innovation and excellence in teaching and research. 4 FINANCIAL SECURITY Outcome component T&L expenditure To provide an excellent learning experience which is financially sustainable. Financial Sustainability Performance To enhance the performance of our academic workforce to improve the student experience and Curtin’s research performance Key Performance Indicator 4.1 T&L Expenditure per Equivalent Full-Time Student Load (EFTSL) (Efficiency) 4.2 Net operating result (Effectiveness) 3.1 % of academic staff with doctoral qualifications (Effectiveness) 3.2 Research income (Cat 1–4) per research staff (using the RPI database) (Efficiency) 3.3 Weighted research publications per research staff (using the RPI database) (Efficiency) 115 116 Curtin University Annual Report 2014 Curtin University Annual Report 2014 CURTIN’S KEY PERFORMANCE INDICATORS (CONTINUED) 1. Teaching and research Curtin has exceeded the target in 2014 by achieving 84 per cent in Semester 1 and 83 per cent for Semester 2. Outcome component: Student experience Table a: Percentage agreement in overall satisfaction To be a destination of choice for students, Curtin will offer an educational experience which is richly interactive, engaging and fully prepares students for the complex environments they will live and work in. Key Performance Indicators: 1.1 Unit satisfaction (eVALUate) Classification: Effectiveness measure Benchmark gauge: No benchmarking data is available as this survey is only conducted at Curtin University The Curtin eVALUate Unit Survey is automatically available for all students who are enrolled in Curtin’s coursework units. The survey focuses on student achievement of unit learning outcomes and the percentage agreement of the survey statement “Overall, I am satisfied with this unit”, which provides an indicator of student satisfaction with the quality of the teaching and learning experiences of the unit. This indicator provides a measure of teaching effectiveness. 80 per cent satisfaction is considered an acceptable target for this measure. A target in excess of 80 per cent may lead to less innovation in teaching and learning as changes to practice often result in reduced initial student satisfaction. Semester 1 Semester 2 ≥ 80.0% ≥ 80.0% 2014 83.6% 82.6% 2013 83.5% 83.6% 2012 83.9% 84.4% 2011 83.1% 83.6% 2014 Target Note: Semester 1 2014, number of survey responses 42,216, population 112,822; response rate of 37 per cent. Semester 2 2014, number of survey responses 36,909, population 109,438; response rate of 34 per cent. Table b: Retention rates – commencing and total undergraduate Curtin 2013-14 Target Total Undergraduates ≥ 87.0% - - 82.9% 83.7% - - 2012-13 82.4% 83.7% 82.2% 82.6% 2011-12 85.0% 84.8% 83.0% 83.2% 2010-11 84.6% 85.2% 83.1% 83.1% Note: First Year Bachelor benchmark considered comparable to Commencing Undergraduates. Outcome component: Research output To enhance Curtin’s research performance to strengthen as a research-intensive university. Classification: Efficiency measure 1.3 Total research income (Categories 1-4) Retention rates are affected by a multitude of factors including a student’s personal circumstances. As such, targets for retention rates are set to be equal or above the sector average to ensure Curtin’s performance remains at an acceptable level. The commencing and total undergraduates in 2013 retained in for 2014 are recorded at 83 and 84 per cent respectively, both below the University’s target, however, the 2013-14 outcome for commencing undergraduate students has improved against the prior year; a positive result from an initiative commenced in 2014 to address retention. It is expected that the continuation of this initiative in 2015 and beyond will allow Curtin to continue to progress towards achieving the 87 per cent target in the longer term. All Undergraduates ≥ 87.0% Key Performance Indicators: Resources devoted to teaching students during a year are not efficiently expended if students do not return to their studies in the following year. Minimising any loss of students allows Curtin to optimise its student load and revenue and ensures students can fulfil their ambitions to obtain a University qualification. High efficiency is achieved when high numbers of students return (are retained) into the following year. 1st Year Bachelor 2013-14 1.2 Retention rates – commencing and total undergraduate (UG) Benchmark gauge: Benchmark sourced from Department of Education and Training. Benchmark data for 2014 is not available due to timing of data collection and release by the Government. All Australian Universities Commencing Undergraduates Classification: Effectiveness measure Benchmark gauge: Australian Technology Network (ATN) Universities and All Australian Universities National Rank sourced from Department of Education and Training’s Higher Education Research Data Collection (HERDC) submitted data. Research income is an indicator of the University’s effectiveness in attracting research funding in a competitive environment and provides a proxy measure for national and international research reputation. The measure is provided from the income reported for HERDC by the Department of Education and Training totalling categories 1-4 in the subsequent year in which it is earned. The HERDC categories are: • Category 1 - Australian Competitive Grants • Category 2 - Other Public Sector Funds • Category 3 - Industry and Other Funds • Category 4 - Cooperative Research Centres Curtin has set a target to increase research income by 100 per cent over 2013-2017. This represents a realistic high growth position required to secure Curtin’s position as a top 10 university in Australia. Curtin’s research income for 2013, reported under the 2014 Higher Education Research Data Collection (HERDC) increased by 14 per cent. This increase was the culmination of: solid and continuing increases in Australian Competitive Grant income of 19 per cent over the prior year (representing 34 per cent of total income); increase of 13 per cent in Other Public Sector Funding (representing 28 per cent of total income); 21 per cent increase over the prior year of Industry and Other income (representing 30 per cent of total income); and a decline of 14 per cent in income from the Cooperative Research Centre (CRC) (representing 9 per cent of total income) on the back of a significant increase (83 per cent) in CRC income in the prior year. Table c: Total research income (Categories 1-4) Curtin All Australian Average Universities ATN National Universities Rank 2014 Target $72.0m - - 2013 Target $64.0m - - 2013 $72.4m $65.2m 12 2012 $63.4m $59.6m 13 2011 $62.5m $57.3m 14 2010 $58.5m $51.1m 14 Note: Data is reported with a year lag due to timing of the Government HERDC data collection. A target for the current year has been disclosed in line with the University’s Strategic Plan. 117 118 Curtin University Annual Report 2014 Curtin University Annual Report 2014 CURTIN’S KEY PERFORMANCE INDICATORS (CONTINUED) 1.4 Higher Degree Research (HDR) enrolled load 2. Engagement and impact Outcome component: Graduate reputation Classification: Effectiveness measure Benchmark gauge: Ranking sourced from the Department of Education and Training, Selected Higher Education Student Statistics. The benchmark data for 2014 is not yet available due to the timing of benchmark data collection and release by the Government. Curtin’s research performance is dependent on its capacity to conduct research activities. Increased higher degree by research load provides an indicator of research intensity. HDR students are also needed to support increased research grant successes and provide Curtin with the opportunity to benchmark its research capacity to other leading Australian universities. Higher degree by research load grew by 3.3 per cent in 2014. This increase is below target due to slower growth than anticipated when the targets were established. The growth achieved is in line with the sector which is experiencing lower overall growth compared to previous years. In Australia, Curtin’s ranking in total research enrolled Equivalent Full-Time Student Load (EFTSL) remained at 10th in 2013. Table d: Higher Degree Research (HDR) enrolled load Curtin All Australian Universities National Rank 2014 Target 1,667 - 2014 1,515 - 2013 1,466 10 2012 1,458 10 2011 1,397 10 To contribute to the workforce through Curtin’s graduates. To expand Curtin’s international outreach through global collaborations. Key Performance Indicator: Key Performance Indicator: 2.1 Domestic graduate employment rates – Australian Graduate Survey (AGS): Graduation Destination Survey (GDS) 2.2 Percentage of research outputs with international co-authors Classification: Effectiveness measure Benchmark gauge: National GDS Ranking (institutions with >300 survey respondents). The benchmark data is not available for 2014 due to the timing of benchmark data collection and release by the Government. The GDS is a component of the annual AGS which measures the employment rates of graduates following the completion of their degree. This indicator measures Curtin’s effectiveness in both assisting students to reach their full potential and in producing graduates who are of productive value to employers and the community. Curtin has an aspiration to have graduate employment rates ranked number one in Western Australia. The vision for Teaching and Learning is to be ‘sought after by students’ and ‘sought after by employers’. Hence, a measure of GDS is critical to measuring success. The 91.8 per cent outcome in 2013 for Domestic Graduate Employment retained Curtin’s rank within Western Australia at 2nd, while the national rank rose from 14th to 13th. The Curtin domestic graduate employment rate of 88.8 per cent represents a 3 percentage point fall from 2013. This fall is consistent with a drop in employment rates nationally. Table e: Domestic graduate employment rates Survey Year 2014 Target Curtin Employment Rate Outcome component: International engagement National Employment Rate Western Australian Rank (number of WA institutions in brackets) National Rank (number of national institutions in brackets) - - 1 - 2014 88.8% - - - 2013 91.8% 90.6% 2 (n=5) 13 (n=42) 2012 93.5% 92.2% 2 (n=5) 14 (n=41) 2011 92.0% 92.4% 5 (n=5) 30 (n=40) Note: The year refers to the survey year and is relevant to graduates from the prior year. The measure used is based on those who are available for paid work, i.e. includes those in full-time and part-time work, and excludes those unavailable for work. Number of survey responses 3,896, population size 5,687; response rate of 69 per cent. Classification: Effectiveness measure Benchmark gauge: No benchmark available as no comparable data is available for other Universities or the sector Research outputs with international co-authors provide an indication as to the level of international engagement of staff with their peers overseas. Steady and cumulative growth in research outputs incorporating co-authorship with international colleagues enhances the visibility of Curtin research and cements key relationships which are key drivers for reputation, collaboration and citations. The proportion of outputs reported under the Department of Education and Training’s Higher Education Research Data Collection (HERDC) which included at least one international co-author has increased each year since 2010, with 2013 at 41 per cent. In 2013, Curtin exceeded the target established under the new Strategic Plan. The targets provide for continued graduated increase towards the 2017 target of 45 per cent. Table f: Percentage of research outputs with international co-authors International CoAuthorship 2014 Target 39.0% 2013 Target 37.0% 2013 40.9% 2012 37.6% 2011 35.2% Note: Data is reported with a year lag due to timing of the Government HERDC data collection. A target for the current year has been disclosed in line with the University’s Strategic Plan. 3. People and culture Outcome component: Performance To enhance the performance of our academic workforce to improve the student experience and Curtin’s research performance. Key Performance Indicators: 3.1 Percentage of academic staff with doctoral qualifications Classification: Effectiveness measure Benchmark gauge: Australian Higher Education Industrial Association (AHEIA) Human Resource Benchmarking Program provides sector benchmark data. Benchmark data is not available for 2014 due to the timing of benchmark data collection and release by the Government. The measure of percentage of academic staff with doctoral qualifications is a significant lead indicator of capacity for achieving strategic goals in research and teaching. Curtin’s percentage of academic staff with doctoral qualifications increased from 68.1 per cent in 2013 to 72.1 per cent in 2014 due to a specific recruitment initiative, exceeding the 2014 target. Table g: Percentage of academic staff with doctoral qualifications Curtin All Australian Universities 2014 Target 70.0% - 2014 72.1% - 2013 68.1% 70.5% 2012 65.5% 69.1% 2011 63.1% 66.6% Note: For 2014, this measure has been sourced from internal systems to provide a current rather than lagged outcome in alignment with the University’s strategic plan. The historical data has been restated accordingly. 119 120 Curtin University Annual Report 2014 Curtin University Annual Report 2014 CURTIN’S KEY PERFORMANCE INDICATORS (CONTINUED) 3.2 Research income (Categories 1-4) per research staff (using the RPI database) 3.3 Weighted research publications per research staff (using RPI database) Classification: Efficiency measure Classification: Efficiency measure Benchmark gauge: No benchmark available as no comparable data is available for other Universities or the sector Benchmark gauge: No benchmark available as no comparable data is available for other Universities or the sector Note both this measure and the Weighted Publications per Research Staff measure will be altered to align with the relevant measures in the University’s Strategic Plan following determination of the definition of quality research and the availability of the appropriate data. Note both this measure and the Research Income per Research Staff measure will be altered to align with the relevant measures in the University’s Strategic Plan following determination of the definition of quality research and the availability of the appropriate data. To be a leading international university Curtin must have a strong research cohort. Research income is an indicator of the University’s ability to attract research funding in a competitive environment and this measure provides an indication of cohort performance. Research Income comprises total income for the Department of Education and Training’s Higher Education Research Data Collection (HERDC) categories 1-4 in the year in which it is reported while the cohort of research staff is those defined as active within the Research Performance Index (RPI) database. The Research Performance Index (RPI) is an internal initiative that collects information on research performance on an annual basis, at the level of an individual staff member, and verified research performance under the RPI classifies a staff member as active. This measure provides an indication of research productivity of Curtin research staff. Weighted research publications are those defined under the Department of Education and Training’s Higher Education Research Data Collection (HERDC) submission while the cohort of research staff is those defined as active within the Research Performance Index (RPI) database. In 2013, the measure decreased by 10 per cent due to an increase in the number of active staff within the RPI database and a decrease in conference publications. Strategies to focus academic staff on producing quality publications rather than quantity started to take effect in 2013 and this contributed to a decrease that was not expected at the time the target was developed and as such, the target was not met. Targets are based on a premise that increased research capacity and research concentration will improve the research income per researcher. In 2013, there was a 10 per cent increase in research income per researcher. Although Curtin grew its total research income from 2012 to 2013 above expectations, the number of staff registered through the RPI database as being research active increased during this period as well. This increase impacted the research income per research staff ratio and therefore, the target was not met. Table h: Research income (Categories 1-4) per research staff (using the RPI database) Research Cohort Performance (Income/ Research Staff) 2013 Target $55,000 2013 $46,244 2012 $41,975 2011 $44,683 2010 $43,121 Note: Data is reported with a year lag due to timing of the Government HERDC data collection. Table i: Weighted research publications per research staff (using RPI database) Research Cohort Performance (Publications/Research Staff) 2013 Target 1.26 2013 0.93 2012 1.03 2011 1.07 2010 1.21 Note: Data is reported with a year lag due to timing of the Government HERDC data collection. 4. Financial security Outcome component: Financial sustainability To provide an excellent learning experience which is financially sustainable. Key Performance Indicators: 4.1 Teaching and Learning (T&L) expenditure per Equivalent Full-Time Student Load (EFTSL) Classification: Efficiency measure Benchmark gauge: No benchmark available as no comparable data is available for other Universities or the sector Due to the changing nature of business models for the delivery of Teaching and Learning, e.g. development of Massive Open Online Courses (MOOCs) and other online offerings, a target for this measure has not been set. T&L expenditure relates to the teaching of coursework (that is, non-research) programs. Utilising the measures of the average cost of teaching each EFTSL provides an insight into the efficiency with which monies directed towards the T&L objective have been spent. It is important to note that average expenditure per EFTSL is largely dependent on the mix of disciplines taught by an institution. Curtin’s high representation of laboratory-based courses raises service delivery costs when compared to institutions where non-laboratory-based courses feature more prominently. Also, Curtin incurs higher than average costs in supporting the delivery of regional higher education programs through its presence in Kalgoorlie, Margaret River, Albany and Port Hedland. Student load in 2014 increased by more than 1 per cent while T&L Expenditure increased by 4 per cent over 2013. As a result, 2014 T&L Expenditure per EFTSL has grown by 2 per cent over the previous year. Table j: Teaching and learning expenditure per EFTSL T&L Expenditure ($’000) EFTSL T&L Expenditure per EFTSL 2014 $627,778 38,525 $16,295 2013 $605,914 38,056 $15,922 2012 $568,841 38,650 $14,718 2011 $527,701 38,948 $13,549 4.2 Net operating result ($’m and percentage of total revenue from continuing operations) Classification: Effectiveness measure Net Operating Result has been added as a new Key Performance Indicator in 2014 to provide further information on the University’s financial sustainability within performance indicator section of the Annual Report. Maintaining financial sustainability is critical to the University’s ongoing operations. The University aims to maintain a surplus net operating result and a positive percentage of total revenue from continuing operations which is reinvested into operations to ensure core activities are delivered to their optimum. Please refer to the Financial Statement of this Annual Report for further information regarding the financial performance of the University during 2014. Table k: Net operating result ($’m and percentage of total revenue from continuing operations) Net Operating Result Net Operating Result $’m Percentage of total revenue from continuing operations 2014 $49.7 5.6% 2013 $62.4 7.3% 2012 $80.4 10.1% 121 This page has been left blank intentionally. 124 Curtin University Annual Report 2014 CONTACT: Curtin University Kent Street Bentley 6102 GPO Box U1987 Perth WA 6845 Tel: +61 8 9266 9266 CRICOS Provider Code 00301J (WA), 02637B (NSW) Curtin University is a trademark of Curtin University of Technology © Curtin University 2015 curtin.edu.au Disclaimer Information in this publication is correct at the time of printing but may be subject to change. This material does not purport to constitute legal or professional advice. Curtin accepts no responsibility for and makes no representations, whether express or implied, as to the accuracy or reliability in any respect of any material in this publication. Except to the extent mandated otherwise by legislation, Curtin does not accept responsibility for the consequences of any reliance which may be placed on this material by any person. Curtin will not be liable to you or to any other person for any loss or damage (including direct, consequential or economic loss or damage) however caused and whether by negligence or otherwise which may result directly or indirectly from the use of this publication. Copyright information Except as permitted by the Copyright Act 1968 this material may not be reproduced, stored or transmitted without the permission of the copyright owner. All enquiries must be directed to Curtin University. This publication is available in alternative formats on request.


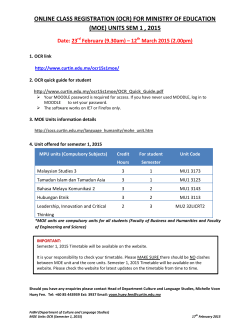


© Copyright 2026