
KWAME NKRUMAH UNIVERSITY OF SCIENCE AND TECHNOLOGY, KUMASI COLLEGE OF ENGINEERING
KWAME NKRUMAH UNIVERSITY OF SCIENCE AND TECHNOLOGY, KUMASI COLLEGE OF ENGINEERING AMBIENT AIR QUALITY AND THE HEALTH OF COMMUNITIES AROUND CHIRANO GOLD MINES LIMITED By Michael Ntim (BSc. Biological Sciences) A thesis submitted to the Department of Materials Engineering of the Faculty of Materials and Chemical Engineering, in partial fulfillment of the requirement for the degree of Master of Science, in Environmental Resources Management. JANUARY, 2011 DECLARATION I Michael Ntim hereby declare that the submission is my own work towards the MSc. and that, to the best of my knowledge, it contains no material previously published by another person nor material which has been accepted for the award of any other degree of the University, except where due acknowledgement has been made in the text. Michael Ntim Candidate ……………………………… Signature …………………….. Date Certified by: Mr. Godfred Owusu Boateng Supervisor Dr. Jacob Plange- Rhule Co- Supervisor …………………………… Signature …………………………… Signature …………………….. Date .………………….. Date Certified by: Prof. S. Kwofie Head of Department ……………………………… …………………….. Signature Date i DEDICATION To the Almighty God for His guidance and continuous provision for me throughout my life. ii ABSTRACT In communities where mining operations take place there are lot of environmental problems that comes with their processes. One of the greatly affected parts is ambient air quality. This studies aims at investigating the pollution status of the ambient air and the state of health of the communities living within its catchments. With the vitalograph, lung function tests namely; Forced Vital Capacity, Forced Expiratory Volume in 1 sec., Peak Expiratory Flow and Forced Expiratory Flow were performed on inhabitants of Paboase and Akoti communities in the concession of the Chirano Gold Mines Limited. The PM10 and Total Suspended Particles (TSP) in the ambient air were also monitored for a period of 8 months at 7 sampling stations. Results show that the mean PM10 level (64.04 μgm-3) was below the EPA- Ghana standard (70 μgm-3) but above the WHO standard (50 μgm-3). Also the levels of PM10 were below these standards except at all sampling stations except at the Rom Pad (166.72 μgm-3) possibly due to the crushing of rocks and its feeding into the processing plant causing greater liberation of particulate matter into the atmosphere. Mean TSP level (138.93 μgm-3) was also below both the EPA- Ghana standard (230 μgm-3) and WHO standard (200 μgm-3). For similar reasons, higher levels (367.62 μgm-3) than the standards were recorded at the Rom Pad. There was a statistical difference (p<0.00) between the predicted and the measured ling functions suggesting that the ambient air is not polluted and hence, there are health effects associated with the prevailing ambient air quality. iii TABLE OF CONTENTS Page Declaration ……………………………………………………………………… i Dedication ……………………………………………………………………….. ii Abstract ………………………………………………………………………….. iii Table of Contents………………………………………………………………… iv List of Figures ……………………………………………………………………. viii List of Tables …………………………………………………………………….. ix List of Photos ……………………………………………………………………. x List of Abbreviation ……………………………………………………………… xi Acknowledgement ………………………………………………………………. xii 1.0 INTRODUCTION…………………………………………………………… 1 1.1 Background ..………………………………………………………………… 1 1.2 Justification .....……………………………………………………………… 2 1.3 Objectives ………………………………………………………………….. … 3 1.4 Hypothesis ……………………………………………………………………. 3 1.5 Research Questions ...………………………………………………………… 4 2.0 LITERATURE REVIEW ….………………………………………………. 5 2.1 Mining ……………………………………………………………………….. 6 2.2 Mining and Ambient Air Pollution …..……………………………………… 7 2.3 Physical Properties Of Ambient Air Pollutants ……………………………… 8 2.4 Physiological Effects Of Ambient Air Pollutant …………………………….. 8 2.5 Natural Protection By The Lung …..…………………………………………. 9 2.6 Health Effects ………………………………………………………………….. 10 iv 2.6.1 Premature Mortality..………………………………………………………… 12 2.6.2 Chronic Obstructive Pulmonary Disease …………………………………….. 12 2.6.3 Respiratory And Hospital Admission ..……………………………………… 13 2.6.4 Aggravated Asthma …………………………………………………………. 14 2.6.5 Respiratory Symptoms ………………………………………………………. 14 2.6.6 Change In Lung Function….…………………………………………………. 15 2.7 Effects Of Physical Characteristics On Lung Function …..…………………… 17 2.8 Effects Of Smoking And Lung Function ……………………………………… 18 3.0 METHODOLOGY AND PROCEDURES .………………………………… 20 3.1 Study Area ...…………………………………………………………………… 20 3.1.1 Geographic Area ..…………………………………………………………….. 20 3.1.2 Climate..………………………………………………………………………. 20 3.1.3 Chirano Gold Mines Limited .………………………………………………… 21 3.2 Sampling Method .……………………………………………………………… 26 3.2.1 Inclusion Criteria.…………………………………………………………….. 26 3.3 Consenting Process..…………………………………………………………… 26 3.4 Questionnaire…………………………………………………………………… 26 3.5 Lung Function Tests…………………………………………………………….. 27 3.6 Anthropometrics...………………………………………………………………. 28 3.6.1 Weight………………………………………………………………………… 28 3.6.2 Height…………………………………………………………………………. 28 3.6.3 Age….…………………………………………………………………………. 29 3.7 Temperature…………………………………………………………………….. 29 3.8 Ambient Air Quality……………...…………………………………………….. 29 3.9 Rainfall………..……………………………………………………………….. v 31 4.0 RESULTS ........................................................................................................ 32 4.1 Trends Of Ambient Air Quality In The Chirano Gold Mines Limited (Cgml)...... 32 4.1.1 PM10 Trend .................................................................................................... 32 4.1.2 A Comparison The Measured PM10 Trends With The Environmental Protection Agency (EPA)-Ghana And WHO Standards................ ............................................ 33 4.1.3 PM10 Concentrations Measured At Various Locations .................................. 34 4.2 Total Suspended Particles (TSP)....................................................................... 35 4.3 PM10 And TSP……………………………………………………………….. 38 4.4 PM10 And Rainfall……………………….…………………………………… 39 4.5 TSP And Rainfall……………………………………………………………….. 40 4.6 Lung Function Test…..…………………………………………………………… 41 4.8 Comparing Lung Function In The Various Communities…..…………………… 42 5.0 DISCUSSIONS………………...……………………………………………… 47 5.1 Status Of PM10 In The Chirano Gold Mines Ltd………….……………………. 47 5.2 PM10 Compared With Who And Epa-Ghana Standards……………………....... 47 5.3 PM10 Emission By Location…………….………………………………………… 49 5.4 TSP Status In Chirano Gold Mines Ltd………..………………………………….. 50 5.5 TSP Compared With WHO And EPA-Ghana Standards…………………………. 50 5.6 TSP Emission By Location……..…………………………………………………. 51 5.7 Relationship Between PM10 And TSP………………………………………….. 52 5.8 PM10 And TSP Trends Compared With Rainfall Patterns………..…………… 52 5.9 Predicted And Measured Lung Function In Akoti And Paboase……………… 53 5.10 State Of Lung Function In Paboase And Akoti …...…………………………... 54 5.11 Lung Function And Respiratory Symptoms……………………...……………. 55 5.12 Anthropometrics And Lung Function………………………………………….. 56 vi 5.13 Smoking, Activity Level And Lung Function In Akoti And Paboase………… 57 6.0 CONCLUSIONS AND RECOMMENATIONS….………………………….. 60 6.1 Conclusion………………………………………………………………………. 60 6.2 Recommendations …………………………………………………………….. 61 References……..……………………………………………………………………. 63 Appendices……..……………………………………………………………………. 72 vii List of Figures Figure 3.1: A Map Showing The Gold Deposits In Ghana And The Location Of The Chirano Gold Mines Ltd. …………………………………………………………… 23 Figure 3.2 Site Map Of The Concession Of The Chirano Gold Mines Ltd. ………... 25 Figure 4.1: The General Trend Of Pollution By PM10 In The CGML ……………….32 Figure 4.2: Measured PM10 Trends In The CGML Compared With The (EPA)-Ghana And WHO Standards .....................................................................................................33 Figure 4.3: PM10 Concentrations At Various Locations In The CGML .........................34 Figure 1.4: The General Trend Of Pollution By TSP In The CGML…………………35 Figure 4.2: Measured TSP Trends In The CGML Compared With The (EPA)-Ghana And WHO Standards.......................................................................................................36 Figure 4.3: TSP Concentrations At Various Locations In The CGML..........................37 Figure 4.4: Distribution Of PM10 And TSP From April-December 2009 ……………38 Figure 4.5: Monthly Distribution Of PM10 And Rainfall Pattern From April-December 2009 …………………………………………………………………………………..39 Figure 4.6: Monthly Distribution Of TSP And Rainfall Pattern From April-December 2009 ………………………………………………………………………………… 40 viii List of Tables Table 4.1 Measured And Predicted Lung Function Tests For Both Paboase And Akoti……………………………………………………………………………………41 Table 4.2: Measured And Predicted VC, FVC And PEF Compared In Both Communities…………………………………………………………………………..42 Table 4.3: Measured VC, FVC And PEF Compared In Both Communities …………42 Table 4.4: Occurrences Of Respiratory Symptoms In The Two Communities ………44 Table 4.5: Effects Of Anthropometrics On Measured VC, FVC And PEF………….. 44 Table 4.6: Effects Of Certain Social Behaviors On Measured VC, FVC And PEF……45 ix List Of Plate Plate 1: Environmental Particulate Air Monitor ..........................................................30 x List of Abbreviations WHO - World Health Organisation PM - Particulate Matter PM10 - Particulate Matter with diameter 10µm TSP - Total Suspended Particulates CGML - Chirano Gold Mines Limited USEPA - United States Environmental Protection Agency EC - European Commission EPA - Environmental Protection Agency PM2.5 - Particulate Matter with diameter 2.5µm PM1.0 - Particulate Matter with diameter 1.0µm SIDS - Sudden Infant Disease Syndrome COPD - Chronic Obstructive Pulmonary Disease URTI - Upper Respiratory Tract Infection PEF - Peak Expiratory Flow FEV1 - Forced Expiratory Volume in 1 second NAAQS - National Ambient Air Quality Standard AQI - Air Quality Index PSI - Pollution Standard Index FVC - Forced Vital Capacity PEFR - Peak Expiratory Flow Rate FEF - Forced Expiratory Flow EPAM - Environmental Particulate Air Monitor xi ACKNOWLEDGEMENT Many people have contributed immensely to the success of this thesis and filled with so much joy to acknowledge their invaluable support. I am very grateful to my supervisors Mr. Godfred Owusu- Boateng of the Faculty of Renewable Natural Resources Management, KNUST and Prof. Jacob Plange- Rhule of the Department of Physiology, SMS who showed profound interest in this research and meticulously guided me through all the stages of my work, to the preparation of the final thesis. I am equally grateful to Mr. Koduah Dapaah, the Environmental Manager of Chirano Gold Mines Limited for his guide, patience and insightful comments. I am also grateful to Mrs. Patricia Basoah and Mr. Oppong Kyekyeku for giving me all the resources needed to collect data from the field. I am also grateful to the Chiefs and Unit Committee members of Paboase and Akoti for their support. I cannot forget about all the participants in this study for offering their time to take part in this study. I cannot also forget the immense input of Stephen Ntim, my younger brother, for serving as my research assistant and also for his encouragements to move on in difficult times. I am grateful to Dr. Samuel Blay- Nguah and the entire Staff of the Physiology Department for making great impact in my research skills. Lastly, I am grateful to my ‗friend‘ Mrs. Lawrencia Afoley Ntim and my mum, Madam Gladys Otoo for inspiring me to come this far. xii CHAPTER ONE 1.0 INTRODUCTION 1.1 BACKGROUND The air we breathe is a mixture of gases and small solid and liquid particles. Certain substances, some from natural sources while others are caused by human activities such as our use of motor vehicles, domestic, industry and business activities pollute the air. Air pollution occurs when the air contains substances in quantities that could harm the comfort or health of humans and animals, or could damage plants and materials. These substances (pollutants) can be either particles, liquids or gaseous in nature (http://www.epa.qld.gov.au/environmental_management/). The World Health Organization (WHO) has identified ambient air quality pollution as a high public health priority, based on estimates of air pollution related death and disability-adjusted life years derived in its Global Burden of Disease initiative. Epidemiologic studies have demonstrated positive relationships between current levels of air pollution and a variety of adverse health effects, including mortality and hospital admissions for cardiorespiratory conditions (Schwartz, 1991; Bascom et al., 1996; Thurston and Ito, 2001). Although the health effects resulting from short-term increases in air pollution appear to be relatively small (Schwartz, 1991), the health impact on the general population may be substantial given the ubiquity of exposures. Despite the extensive research on health and air pollution, there remains considerable uncertainty as to which population subgroups may be more susceptible to deleterious health effects. PM is one of the six damaging air pollutants that have been identified under the clean air act of 1970 and regulated for the sake of protecting human health. The WHO 1 estimates that more than 4.6 million people die annually from the direct impact of air pollution—more than from car accidents every year. (WHO, 2006) 1.2 JUSTIFICATION The importance of good air quality for promotion of metabolism and hence good health cannot be underestimated. Despite regulatory efforts over the past years to improve air quality, the protection of public health with adequate margin of safety is constrained by the inability of scientists to determine a safe level of exposure to poor air quality below which populations are safe as noted by Daniels et al, 2004; DiBattista and Bruno, 2003; Schwartz et al, 2002. Given the likely heterogeneity of individual tolerance to air pollution, the severity of health effects experienced by a susceptible sub-group may be much greater than that experienced by the population at large (Zanobetti et al, 2000). Hence, against the background of the current lack of an accepted threshold level for adverse health effects, any nonzero ambient air quality standard represents airpollution- related health burden that policy makers considers acceptable. Further, there is the need to study the variation in PM- health outcome associated with different subgroups and for different geographic locations which will further boost the standard setting process for specific areas. 2 The quality of air in the communities around the Chirano Gold Mines Limited, which is relatively new among the mining companies in Ghana, has not been extensively studied in the light of anthropogenic perturbation (mainly mining operations). It will therefore be very useful if a series of studies in this direction are carried out especially when tied to its effect on the health of the communities within its catchment. 1.3 OBJECTIVES The objectives of the study are: To assess the levels of PM10 and TSP in ambient air quality of the Chirano Gold Mines Limited. To determine the health risks affecting the people in the communities within the Chirano Gold Mines Limited. To determine the areas/ stages of mine operation where the greatest concentration of PM10 and TSP are liberated. 1.4 HYPOTHESIS Exposure to poor air quality conditions poses health risks to people who live within it catchment. 3 1.5 RESEARCH QUESTIONS The following are the research questions to be addressed by this research: What are the levels of PM10 and TSP in the ambient air of communities within the Chirano Gold Mines Limited concession? What are the health effects of the air pollution status in the communities? Where or which process liberate high concentrations of PM10 and TSP in the mining operation? 4 CHAPTER TWO 2.0 LITERATURE REVIEW Particulate matter (PM) is the term used for a mixture of solids particles and liquid droplets suspended in the air. These particles originate from a variety of sources, such as power plants, industrial processes, and diesel trucks and they are formed in the atmosphere by transformation of gaseous emissions. Their chemical and physical compositions depend on locations, time of the year, and weather. Particulate matter is composed of both course and fine particles. Course particles (PM10) have an aerodynamic diameter between 2.5µm and 10µm. They are formed by mechanical disruption (e.g. crushing, grinding, abrasion of surfaces); evaporation of sprays, and suspension of dust. PM10 is composed of aluminosilicate and other oxides of crystal elements, and major sources including fugitive dust from roads, industry, agriculture, construction and demolition, any ash from fossil fuel combustion. The lifetime of PM10 is from minutes to hours, and its travel distance varies from <1km to 10km. Fine particles have an aerodynamic diameter less than 2.5µm (PM 2.5). They differ from PM10 in origin and chemistry. These particles are formed from gas and condensation of high temperature vapors during combustion and they are composed of various combinations of sulphate compounds, nitrate compounds, carbon compounds, ammonium, hydrogen ion, organic compounds, metals and particle bound water. The major sources of PM2.5 are fossil fuel combustion, vegetation burning, and the smelting 5 and processing of metals. Their life time varies from days to weeks and travel distance ranges from 100s to >1000s km. Fine particles are associated with decreased visibility impairment in cities. Total suspended particulate (TSP) refers to all particles in the atmosphere. TSP was the first indicator used to represent suspended particles in the ambient air. In July 1987, United State Environmental Protection Agency (USEPA) began using a new indicator, PM10, which includes only those particles with aerodynamic diameter smaller than 10µm. Ten microns is approximately one seventh the diameter of a human hair. This fraction of TSP is responsible for most of the adverse human health effects of particulate matter because of the particles' ability to reach the lower regions of the respiratory tract. Recent data suggests that particles of 2.5µm or smaller may pose the greatest threat to human health because, for the same mass, they absorb more toxic and carcinogenic compounds than larger particles and penetrate more easily deep into the lungs. USEPA is considering adopting a new standard for PM2.5 to better address the potential health problems associated with particles of this nature. (http://www.dnr.state.wi.us/org/aw/air/health/tspart.htm) 2.1 Mining The resurgence in the mining industry in Ghana since 1989 cannot be considered an isolated phenomenon. Ghana, long regarded as the African trailblazer, was an obvious laboratory for these reforms. After all, a comparative geological ranking of African countries placed Ghana third after South Africa and Zimbabwe. 6 The historical importance of mining in the economic development of Ghana is considerable and well documented, with the country‘s colonial name, Gold Coast, reflecting the importance of the mining sector. Since mining projects are usually located in remote sites, mining companies have had to invest in considerable physical and social infrastructure such as roads, schools, hospitals, electricity and water supplies. Communities within mine locations have generally been beneficiaries of some of these facilities. At the same time, these communities have been victims of air and water pollution as well as other forms of environmental degradation resulting from mining operations. 2.2 Mining and Ambient Air Pollution Mining activities and mining support companies release particulate matter into the ambient air. The concerns of the affected communities on air quality have been the airborne particulate matter, emissions of black smoke, noise and vibration. The activities that generate this particulate matter include site clearance and road building, open-pit drilling and blasting, loading and haulage, vehicular movement, ore and waste rock handling as well as heap leach crushing by companies doing heap leach processing. Others include fumes from the roasting of sulphide ores by assay laboratories and in refining processes. Results of air quality monitoring for dust in the Tarkwa area showed values far above the acceptable, detectable limits for health safety. The EC, WHO and EPA levels for the pollutants were 50gm-3, 70gm-3 and 70gm-3 respectively but the EPA monitoring station located at the Tarkwa Government Hospital recorded as high as 199gm-3. This indicated 7 that the pollution at mining towns have been quite high and not very safe for the health of the inhabitants of communities around the mines (Akabzaa and Darimani, 2001). 2.3 Physical Properties of Ambient Air Pollutants The capacity of particulates matter to produce adverse health effects in humans depends on its deposition in the respiratory tract. Particle size, shape and density affect deposition rates. The most important of the characteristics influencing the deposition of particles in the respiratory system are size and aerodynamic properties. The aerodynamic diameter of particles is the diameter of a unit density sphere having the same settling velocity as the particle in question, whatever its size, shape or density. Particles between 2.5µm and 10µm in aerodynamic diameter corresponded to the inhalable particles capable to be deposited, in the upper respiratory tract. Particles with aerodynamic diameter smaller than 2.5µm (PM2.5) called fine particles correspond to the respirable particle fraction capable of penetrating the alveolar region of the lung. 2.4 Physiological effects of Ambient Air Pollutant The inhaled particles come in contact with surface of the respiratory system. These particles pass the proximal airway (throat and larynx) of the respiratory tract, and deposit in the tracheobronchial conductive airway of the lungs or in the gas exchange region (respiratory bronchioles, alveolar ducts and alveoli of the lung parenchyma). There are five mechanisms that influence particle deposition within the respiratory tract. The primary mechanisms are gravitational settling, impaction and Brownian motion whereas the secondary mechanisms are electrostatic attraction and interception. These 8 last two are of minimal importance for inhalation and deposition of particulate matter. Deposition by gravitational settling occurs as a result of the influence of gravity on particles suspended in the air. The settling rate of particles is directly proportional to particle size. This process is most important in the distal region of the bronchial airway and in proximal portions of the gas exchange region. Another mechanism of particle deposition is impaction. Due to inertia airborne particles do not follow changes in direction or speed of airflow and they may impact on the wall of the airway. This mechanism occurs primarily in the throat and larynx with particles larger than 3µm and increases with increasing particle size. Brownian diffusion involves collision between gas molecules and micrometer-sized particles, which push the particle in an irregular manner. It depends on the diffusive or thermodynamic diameter of the airborne particle rather than on the aerodynamic diameter. Due to this, Brownian diffusion increases with decreasing particle size. This mechanism is predominant in the gas exchange alveolar region of the lung for particles smaller than 0.5µm. There are other factors that also influence particle deposition, including mode of breathing (oral breathing permit the passage of particles greater than 10µm to the lung), physical activity (exercise), age, lung diseases (chronic obstructive lung disease), and ambient conditions (increase in temperature or the presence of other pollutants). 2.5 Natural Protection by the Lung The ability of the lung trying to protect itself against inhaled particles, clearance, will determine the adverse health effects of particulate matter. There are two clearance mechanisms: the mucociliary system and the alveolar macrophages. Particles deposited 9 in the ciliated region of the tracheobronchial airway, rise on the mucociliary ladder to be expelled by coughing or swallowing. Particles deposited on the terminal bronchioles are cleared by lung macrophages. An early cellular response to an acute particulate exposure is damage to epithelial cells of respiratory tract, which also produce many different types of inflammatory mediators. The local pulmonary inflammation induced by PM10 could impact on the cardiovascular system via the local production of procoagulant factors in the lung or as a result of the effects of mediators released from the lungs which act on the liver, to increase the levels of procoagulant factors which could promote myocardial infarction. 2.6 Health effects Epidemiological and toxicological studies have demonstrated that air pollution is associated with a wide range of adverse health outcomes, ranging from mortality to subclinical respiratory symptoms. Some investigations have provided estimates of the population health impact of ambient air pollution in terms of the outcomes given in the air pollution health effects. Several epidemiological studies have linked ambient air pollutants both PM10 and specially PM2.5 with significant health problems, including: premature mortality, chronic respiratory disease, respiratory emergency room visits and hospital admissions, aggravated asthma, acute respiratory symptoms, and decreased lung function. Like the other criteria pollutants, the elderly, whose physiological reserves decline with age and who have higher prevalence of cardiorespiratory conditions, and children, whose respiratory systems‘ are still developing and who spend more time outdoors, are most at risk from exposure to particulate matter. Also, individuals with preexisting heart or lung disease and asthmatics are sensitive to PM 10 effects. Fine particulate pollution (PM2.5), is of specific concern because it contains a high proportion of various toxic metals and acids, and aerodynamically it can penetrate deeper into the respiratory tract. The harmful effects an outdoor PM have been well established and include premature death (Samet et al, 2000) and unseeing asthma morbidity (Mar et al, 2004; Pope et al, 1991; Rabinovitch et al, 2006; Romieu et al, 1996, Yu et al, 2000). A study by Ugwuanyi and Obi, 2002 showed that the lower atmosphere of some areas in Benue State in Nigeria is polluted by particles, and that this is already affecting the quality of life and the productivity of the people. The rock formation in which gold is found in Tarkwa area has a very high silica content and therefore dust generated from these rocks contains silica which is responsible for the causes of silicosis, tuberculosis and silico-tuberculosis diseases (Akabzaa and Darimani, 2001). Kunzli et al. (2000) found that air pollution accounted for more than 25,000 new cases of chronic bronchitis (adults), more than 290,000 episodes of bronchitis (children), more than 0.5 million asthma attacks, and more than 16 million person-days of restricted activities in Austria, France and Switzerland. Several studies carried out in Canada, Germany, Switzerland, and the United States have found an association between respiratory symptoms and exposure to long term ambient particulate concentrations of about 30–35μg/m3, without any evidence of a threshold level below which health effects do not occur. Far lower prevalence levels of respiratory symptoms of 0.1% have been found in copper miners of Zimbabwe. Lower 11 prevalence levels of 2.3% of chronic bronchitis in 852 South African gold miners were reported to be associated with low cigarette smoking rates and/or the smoking of pipe with very little or no inhalation of smoke(Sluis-Cremer et al, 1981). 2.6.1 Premature Mortality Historically, the association between PM10 and mortality has been manifested in many air pollution episodes such as those which occurred in Belgium (1930), Pennsylvania (1948), London (1952), New York (1953), and London (1962), where the number of deaths attributed to air pollution was 63, 20, 4000, 200 and 700, respectively. Several studies have demonstrated the relationship between low concentrations of PM10 and PM2.5 and increase in daily mortality. A study conducted by Pope et al., 1996, demonstrated the association between PM10 air pollution and cardiopulmonary and lung cancer mortality. The relationship was stronger for PM2.5 than PM10. PM2.5 was associated with a 36% increase in death from lung cancer and 26% in cardiopulmonary deaths, the risk being higher for people over the age of 65. PM10 was not associated with lung cancer death (Ponka et al, 1998). In addition, another study conducted by Ostro, 1993 demonstrated the association between PM10 levels with Sudden Infant Disease Syndrome (SIDS) (Woodruff et al, 1997). 2.6.2 Chronic Obstructive Pulmonary Disease Worldwide, COPD is among one of the fastest growing chronic diseases in both the developed and developing world (Calverly and Walker, 2003). Epidemiological studies have showed the relationship between PM10 exposure and an increase in bronchitis, chronic cough, and respiratory symptoms in persons with COPD (Pope et al, 1995). 12 There is strong epidemiological evidence that exposure to ambient air pollutants causes exacerbations of pre-existing COPD, but very little evidence that it actually causes the development or progression of COPD. Recent cross-sectional studies showed an association between exposure to ambient PM10 in particular urban traffic related PM, a decline in forced expiratory volume in one second, and the development of COPD (Schikowski et al, 2005). The prevalence of chronic bronchitis in the general population in most developed countries is between 3% and 17%, while higher rates of between 13% and 27% exist in the developing countries (Ball and Make, 1998). However, at present there is no reliable data on the prevalence of chronic bronchitis in the general Ghanaian population. The overall prevalence of chronic bronchitis found in the present study was 21.2%, while that of breathlessness ≥2 was 31.3%. 2.6.3 Respiratory and Hospital Admission In a number of studies, investigators have observed an increased incidence of respiratory diseases in association with PM10 air pollution. For example, in a study conducted in the United Kingdom, an association between emergency hospital admissions for respiratory and cardiovascular disease and PM10 was found (Atkinson et al, 1999). Another study conducted in Seattle, Washington, demonstrated association with emergency room visits for asthmatics and PM10 air pollution (Schwartz et al, 1993). Also, PM10 was associated with an increase in hospital admission of the elderly for COPD and asthma as well as lower respiratory tract infections including bronchitis and pneumonia (Schwartz, 1993). In addition, a study conducted in Canada by Burnett 13 et al., in 1980, found that increases of 10mg/m3 in PM10 and PM2.5 were associated with 1.9% and 3.3% respective increases in respiratory and cardiac hospital admission. The relationship was strongest between PM2.5 and cardiac disease (Liao et al, 1999). In the Benue state study, it was found that air-borne diseases were found to be common in the areas and its was indicated in the fact that 1,171 patients were treated for airborne diseases at the General hospital at Gboko, from 1993 to 1994 out of which 36 lost their lives and 513 patients who were also treated at Federal Medical Centre, Makurdi, 15 lost their lives (Ugwuanyi and Obi, 2002). A report by Akabzaa and Darimani, 2001 indicates that there was an increasing trend for respiratory diseases in the Tarkwa area due to the presence of the mines. Pneumonia and pulmonary tuberculosis were also reported to have annual reported cases of 199 and 109 respectively. (Akabzaa and Darimani, 2001) 2.6.4 Aggravated Asthma Persons with asthma, especially children, are more susceptible to PM air pollution. Recent studies have associated PM10 at low concentrations with an increase in bronchodilator and asthma medication use (Am, 1996). The relationship between PM10 air pollution and asthma is stronger than for PM2.5 (Choudhury et al, 1997). 2.6.5 Respiratory symptoms A series of analyses in adults and children demonstrated an association between exposure to PM and respiratory symptoms severe to restrict their activities. Respirable particulate matter from combustion sources (PM2.5) was associated with increased 14 respiratory symptoms, including cough, wheeze and shortness of breath (Koren, 1995; Naes et al, 1995; Roemer et al, 1993). In two studies in Utah Valley, upper and lower respiratory symptoms increased with PM10 concentrations (Pope et al, 1992; 1995). PM2.5 levels and H+ were associated with moderate to severe cough and shortness of breath (Liao et al, 1999). In the Tarkwa area, incidence of upper respiratory tract infections (URTI) was relatively high with an annual average of 850 reported cases (Akabzaa and Darimani, 2001). A study also demonstrated small but significant effects of pollution on ear, nose and throat symptoms in the study population (Harre et al, 1997). In the lungs, particulates slow the exchange of oxygen and carbon dioxide in the blood, causing shortness of breath. The heart may be strained because it must work harder to compensate for oxygen loss. Laboratory studies show that high concentrations of components of particulate matter cause persistent cough, phlegm, wheezing and physical discomfort. Particulate matter can also alter the immune system and affect removal of foreign material from the lung (i.e., bacteria and pollen) (http://www.qld.gov.au/) 2.6.6 Change in Lung Function An association between PM10 air pollution and pulmonary function reduction was reported in several epidemiological studies. In a study conducted in Utah Valley in 1989, Pope et al., found a relationship between elevated PM10 levels and reduction in lung function as measured by peak expiratory flow (PEF) (Pope et al, 1991). Becklake et al. observed an increasing FEV1 decline with increasing dust exposure in both smokers and non-smokers. Sluis-Cremer et al. have reported that any disabling 15 ventilatory function loss is more likely to be due to cigarette smoking (active or passive), and that the slope was steeper with increasing exposure level to increasing risk. Hnizdo also found non-smoking miners in the highest dust category to have better FEV1 than even non-miners smoking one pack a day. According to the National Ambient Air Quality Standards (NAAQS) and the Air Quality Index (AQI), PM10 levels of 150m g/m³ increase the likelihood of respiratory symptoms and aggravation of lung disease. However, numerous studies have showed that PM10 health effects can be observed with PM10 levels below give values, although the Pollution Standard Index (PSI) does not describe health effects or offer cautionary statements at these levels. In a study, indoor fine and coarse PM concentrations were associated with increases in respiratory symptoms that were clinically significant in terms of their magnitude (McCormack et al, 2009). This was in consistence with what is known about the effects of indoor PM on childhood asthma and provides new evidence of detrimental health effects of indoor coarse PM. In another study, Delfina et al (2004) investigated PM exposures among 19 school-age children with asthma living in California and found that Forced Expiratory Volume in 1 second was inversely associated with personal, indoor and ambient PM2.5 and PM10. It was found that there were stronger associations with indoor than the ambient PM concentrations among these children but did not evaluate the effects of PM on symptoms or medication use. Studies of school- age children in Seatle, Washinton, have 16 shown that indoor PM2.5 exposure was associated with decrease pulmonary function in a subgroup of 11 children not taking inhaled corticosteroids, but this study did not include indoor measurements of PM2.5-10 (Koenig et al, 2005; Trenga et al, 2006). In-vitro studies have shown that coarse PM preferentially induces inflammatory mediators in bronchial epithelial cells and alveolar macrophages compared with fine PM and bacterial and endotoxin components of coarse PM may play a key role in this process (Becker et al, 2003; 2005). 2.7 Effects of Physical Characteristics on lung function Regression analysis demonstrated the importance of height and sex in determining level of lung function (Malik and Jindal, 1985). There was also a small but significant association between lung function and the child's weight and age. However, for clinical evaluation of a child's lung function, height is the most significant parameter, the effect of weight and age do not substantially influence the predicted pulmonary function. (Vohra et al, 1984) Concerning pulmonary function parameters in both groups (welders and control), the variables have a positive correlation with age, and height (P < 0.0001). According to this model, it has found verified that the decrease of lung functions is linked to the age among welders and controls. Lung function impairment in the welders was higher than controls, and results of multiple regression indicated that, age was not a confounding 17 factor. (Gholamhossein et al, 2009) These lung function variables also show positive correlation when compared with age. Boys show higher values for lung function than girls. The difference is more significant when these lung function variables are compared with age. (Chowgule et al, 1995) Schoenberg (1973) studied white and black population from USA over age 7 years. Chowgule et al (1995) compared data for age group 7-9 and 10-14 years. FVC and FEV1 in their study was significantly lower (p <0.005) than white population for both sexes and age groups. However, they do not reveal any significant difference when compared with black population. Peak flow rate (PEFR) is comparable with our values for both sexes and races except for boys in age group 10-14 years where our study show significantly higher values for PEFR than an earlier report (Schoenberg, 1973)). Mid expiratory flow rate (FEF 50%) in our study is significantly lower than white and black population. 2.8 Effects of Smoking and Lung Function According to Sluis-Cremer et al. what is important in the causation of chronic bronchitis is the fact that one smokes, but not the daily tobacco consumption. They observed a major increase in the incidence of chronic bronchitis between the ‗no smoking‘ and ‗light smoking.‘ The present study has also observed a statistically significant effect of smoking on chronic bronchitis. For miners who had never smoked, no significant relationship was found between chronic bronchitis and age, mining experience (total duration of underground service) or the personal respirable dust exposure levels (both current and cumulative). 18 The occupational effect on breathlessness in the miners was therefore much more pronounced in smokers than non-smokers. Despite the low prevalence (23%) of the ever smoked, and with a mean daily consumption of 4 cigarettes in the present study, the prevalence of chronic bronchitis in smokers was significantly higher than in the never smoked. Mokotetle et al., 1994 and Sluis-Cremer et al., 1981 have found that chronic bronchitis tends to increase sharply with smoking in gold miners. Mokoetle et al.1994, Oleru, 1980, and Becklake et al.,1990 in various parts of Africa, found that smokers have larger mean vital FVC and FEV1 at earlier ages than non-smokers do. This they said was due to the ―healthy smoker‖ effect, because the individual who takes up smoking has lungs, which are relatively resistant to the effects of smoking, as they have lower levels of airway responsiveness to inhaled materials. This phenomenon, according to Becklake et al. is not limited to person, place or time, and that it is most frequent in the ever smoked (current and ex-) before the age of 40. Seltzer, 1963 found the chest circumference relative to height of smokers in the 1942 Harvard University entrants to be greater than the non-smokers. The present study found the mean height of the ever smoked (170.2 cm) to be 1 cm taller than the never smoked (169.1 cm). 19 CHAPTER THREE 3.0 METHODOLOGY AND PROCEDURES 3.1 Study Area 3.1.1 Geographic Area Ghana has a land area of 238,539 km2 and lies on the south central coast of West Africa between latitudes 4.5oN and 11.5oN and longitude 3.5oW and 1.3oE (Ghana EPA, 2000). It shares a common border with the Republic of Togo on the east, Burkina Faso on the north and La Cote d‘Ivoire on the West. 3.1.2 Climate The tropical climate in Ghana is dominated by two major air masses: the dry and warm North East Trade Winds and the moist South-Westerlies or the monsoons. The moist maritime monsoons are associated with rainfall while the dry Trade Winds bring dry conditions. Thus the country has distinct dry and wet seasons depending on the dominant wind in the area. Temperatures throughout the country are typically high. The mean annual temperature is generally above 24ºC, a consequence of the low latitude position of Ghana and the absence of high altitude areas. Average figures range between 24 and 30oC although temperatures ranging from 18 to 40ºC are common in the southern and northern parts respectively. Spatial variability of temperature is experienced in terms of the diurnal and annual ranges as a result of distance from the modifying influence of the sea breeze. 20 Generally, rainfall in Ghana decreases from south to north. The wettest area is the extreme southwest where annual rainfall is about 2000 mm. In the extreme north, the annual rainfall is less than 1100mm. The driest area is the wedge-like strip from east of Sekondi-Takoradi, extending eastward up to 40km where the annual rainfall is about 750 mm. The dry conditions in the south eastern coastal strip are anomalous and are the cause of important differences in ecology and land use from the rest of the country. The seasonal distribution of rainfall is particularly important to the ecology and land use. Two main rainfall regimes are identified: a) Double maxima regime occurring south of latitude 8º30`N. The two maximum periods are from May to August and from September to October. b) The single maximum regime found north of latitude 8º30`N where there is only one rainy season from May to October, followed by a long dry season from November to May. 3.1.3 Chirano Gold Mines Limited The Chirano Gold Mine Limited is situated in south western Ghana (Figure 3.1), 100 kilometers southwest of Kumasi, which is Ghana's second largest city. The township of Bibiani, the site of an existing large gold mine, lies 15 kilometers north-northeast of the project area (37 kilometers by road). Access to the mine from the capital Accra is via a sealed highway to Kumasi and then sealed highway running southwest towards Bibiani and onwards to Sefwi-Bekwai. The final approach is either by a 22 kilometer gravel road from Tanoso Junction (15 kilometers south of Bibiani) or by a 13 kilometer gravel road whose junction is approximately 9 kilometers beyond Sefwi-Bekwai. The project 21 area is dominated by steep terrain and dense vegetation interspersed with small agricultural plots of palm oil, cassava and cocoa. 22 Figure 3.1: Gold deposits in Ghana and the location of the Chirano Gold Mines Ltd. 23 The study area comprised of the mine site and two communities within the mines namely Paboase and Akoti. These communities are of different distances to the major sources of pollution by the mining activities. 24 Figure 3.2 The concession of the Chirano Gold Mines Ltd. 25 3.2 Sampling Method There were two study groups. The members of Paboase community formed one study group whiles members of Akoti constituted the other group. In all 89 participants were recruited 46 from Paboase and 43 from Akoti. 3.2.1 Inclusion criteria Participants were resident of the Catchment communities not less than 5 years since the mining activities began. Participants were between 18 years but not more than 45 years.( Lung Function general reduces with age necessitating the exclusion of the older ones) 3.3 Consenting Process Participants were briefed on the need and benefits of the study and the entire procedure that were to be followed. After this their consent were sought for through signing of consent form (Appendix 10) before being part of the study. 3.4 Questionnaire Questionnaire was pre-tested, both by self administration as well as by interview in the local language, ‗Asante Twi‘. No Ghanaian language version of the questionnaire was developed, but the questionnaire was read in English and translated in Twi. Respondents were administered with questionnaire to ascertain their demographics, medical history, 26 activity levels information and general household characteristics. The questionnaire (Appendix 12) was administered to 89 respondents by researcher. 3.5 Lung Function Tests An instrument (vitalograph) was used to measure the lung function of study participants. Patients‘ information such as the patients‘ reference numbers, height, age, sex and ethnic origin were recorded. The parameters measured were Forced Vital Capacity (FVC), Forced Expiratory Volume in 1 second (FEV1), Forced Expiratory Volume (FEV1%), Peak Expiratory Flow (PEF) and Forced Expiratory Flow (FEF25-75) (Appendix 13). Spirometry was carried out at an ambient room temperature of between 23oC and 27oC, depending on the time of the day. The participants were made to relax after taking all the anthropometric information whiles these details were being entered into the Vitalograph. A demonstration is made to the participant as how the test will be done and made to rehearse to check if the test can be done well without any reading. Participants were made to wear nose clips to prevent air from coming out through the nose. After certifying that the test can be done well, participants were allowed to carry out the tests. The test is done on a number of times (at least twice) to obtain the best test. The vitalograph prints out the test result and were attached to the Participant‘s questionnaire. The accuracy of the tests depends on 27 the participant‘s ability to follow all instructions. The tests took between 5 and 30 minutes depending on the number of tests done. 3.6 Anthropometrics 3.6.1 Weight The measurements were done with an analogue scale which recorded readings in both kilograms and pounds. Participants were made to remove any outer clothing and shoes so that only light clothing and thin (no socks) are worn. Participants then stood on the centre of the platform and recorded the weight in the kilograms to the nearest 0.1kg. 3.6.2 Height The heights of participants were also measured using a stadiometer, a tall wood with a steel ruler on it and sitting on a flat wooden base. The steel rule is only 100cm long, hence the 100cm was measured from the base to the 100cm mark and the steel rule made to read from the 100cm mark to the top since the targeted group was not shorter than 100cm. Participants stood erect with their back against the wall with back straight, heels together and toes slightly apart at an angle of about 60 degrees. Again this posture was such that the weight of participants was evenly distributed on their feet. The arms hang freely at the sides of the trunk with palms facing the thighs. Participants were approached from the front and asked to breathe normally and stand fully erect without altering the position of the heels. Their heads were maintained in the frankfort horizontal plane whiles a straight edge was used to trace the crown of the head to the 28 steel rule to obtain accurate measurements of the height. These heights were noted and recorded. 3.6.3 Age The age of participants were needed to inform the study, the normal range of values. Participants were made to give their age which were then categorized based on the actual ages or estimated ages. The actual ages were those that were based on the date of birth of the participants. 3.7 Temperature Ambient temperature was measured using the mercury in glass thermometer. This was hanged in the room with the help of an adhesive. The thermometer gave reading of the environment in which the tests were done. 3.8 Ambient Air quality The ambient air quality parameters namely PM10 and TSP were measured within the communities (Paboase and Akoti) and the mine site using an Environmental Particulates Air Monitor (Model: EPAM-5000) a devise configured to sample TSP, PM1.0, PM2.5 and PM10 dust. The devise is manufactured by HAZ-DUST TM (Photo 1). They were compared with previous data on air quality to determine the trend of ambient air quality that pertains within the area. The various geographic locations of the communities relative to the pollution sources were determined. 29 Plate 1: Environmental Particulate Air Monitor In sampling PM10, the special function is selected from the main menu and the inlet inserted into the sensor head of the monitor. The filter cassette holder is attached to the sensor. The manual zero process is done. The monitor was then ready to sample. The monitor was set to run and set to either continue previous sampling or set to overwrite 30 the previous data. The date and time were set and sampling rate selected to sample at every second. The process was repeated for the TSP with a different inlet inserted into the sensor head. Seven sampling locations were set; Rom Pad, Mine village, Exploration pad, Construction camp, Processing plant, Akwaaba pit and Paboase camp. The monitor was moved from one location site to another for sampling. Within every month, at least one sampling is done up to a maximum of three sampling. The measurement of PM10 is followed by measurement of TSP. The concentrations from these sites were averaged to obtain the overall air quality of the entire area for that particular month. The measurements throughout the period (April to December, 2009) for a particular location were averaged to represent the concentration at that site for the period. 3.9 Rainfall Rainfall was measured using a copper 5" standard rain gauge. It consists of a 127 mm diameter funnel with a sharp rim, the spout of the funnel inserted into a glass collecting jar. The jar is in an inner copper can and the two are contained in the main body of the gauge, the lower part of which is sunk into the ground. The gauge was set vertical so that the rim of the funnel is horizontal. The whole gauge was set into the ground to keep it secure and upright with the rim 304.8 mm above the surrounding short grass or gravel, a height chosen so that no rain splashes from the surroundings into the funnel. 31 CHAPTER FOUR 4.0 RESULTS 4.1 Trends of ambient Air Quality in the Chirano Gold Mines Limited (CGML) 4.1.1 PM10 trend The PM10 trend observed over the study area CGML depicts an uneven spread of particulate matter (Figure 4.1). The lowest (36.9 μgm-3) observed was recorded in July and occurred at the peak of the rainy season while the highest(87.68 μgm-3) occurred in November, which is just about the beginning of the harmattan. Figure 4.1: The general trend of pollution by PM10 in the CGML 32 4.1.2 Comparison of the measured PM10 trends with the Environmental Protection Agency (EPA)-Ghana and WHO standards A comparison of the PM10 trends for the study area with that of the EPA-Ghana and World Health Organisation (WHO) standards (Figure 4.2) indicates that the level of PM10 in the study was generally higher than the WHO standard (50 μgm-3) but generally lower than the Ghana EPA standards. (Figure 4.2) the WHO standard appear to be stricter than that of Ghana EPA (70μgm-3). Figure 4.2: Measured PM10 trends in the CGML Compared with the (EPA)-Ghana and WHO standards 33 4.1.3 PM10 level measured at various locations Generally, it can be observed that the various sampling locations had their concentration lower than even the much stricter WHO standard (50 μgm-3). The highest concentration was recorded at the Rom Pad (166.72 μgm-3) and the lowest concentration was recorded at the Exploration Pad (35.27 μgm-3) (Figure 4.3). Figure 4.3: PM10 concentrations at various sampling locations in the CGML PM10 formed clouds in the vicinity and the scare of it was evident as there was strict compliance to safe health measures such as wearing of nose mask. 34 4.2.1 Total Suspended Particles (TSP) The spread of TSP observed was also uneven. The lowest concentration (84.60 μgm-3) was recorded also in July, following a similar trend as that of PM10. The lowest was recorded in the month of July while the highest (185.51μgm-3)was also recorded in October. (Figure 4.4). Figure 7.4: The general trend of pollution by TSP in the CGML 35 Comparing the trend of TSP with the standards of EPA-Ghana and WHO (Figure 4.5), all the readings recorded were below the EPA-Ghana standard (230μgm-3) and generally below the WHO standard (200μgm-3) (figure 4.5). This suggests that the whole area is as far as TSP is concerned, a safe place or convenient for human interaction or habitation. Figure 4.8: Measured TSP in the CGML Compared with the (EPA)-Ghana and WHO standards 36 As per the sampling location for TSP (Figure 4.6), it was also observed that Rom Pad recorded the highest concentration (367.62μgm-3). The lowest concentration (67.82μgm3 ) was observed at the Mine Village. It was also observed that the recording at the Rom Pad was above the allowable or permisible levels of 230μgm-3 and 200μgm-3 by EPA – Ghana and WHO standards respectively. The construction camp recorded the second highest. (Figure 4.6). Figure 4.9: TSP concentrations at various sampling locations in the CGML 37 4.3 PM10 and TSP From April to the end of August there was a direct relationship between the trends of PM10 and TSP (figure 4.7). The subscequent months i.e. September to December was observed to have an inverse relationship. The highest of the PM10 (87.68μgm-3) was recorded in November whereas the highest for the TSP (185.51μgm-3)was recorded in October. Figure 4.10: Distribution of PM10 and TSP from April-December 2009 38 4.4 PM10 and Rainfall There appear to be an inverse relationship between PM10 and rainfall patterns. The higher the rainfall the lower the levels of PM10 (Figure 4.8). Pattern correlates from April to May, June to July and October to November. PM10 is lowest in July during the peroid when much rainfall was received. Monthly Distribution Of PM10 and Rainfall Pattern from April-December 2009 200 350 175 300 250 Rainfall (mm) PM10 (ug/m3) 150 125 100 75 200 150 100 50 25 50 PM10 Rainfall (mm) 0 Apr 0 Jun Aug Oct Figure 4.11: Monthly distribution of PM10 and rainfall pattern from AprilDecember 2009 39 Dec 4.5 TSP and Rainfall Looking at the TSP trend and that of the rainfall received over their entire area (Figure 4.9), there seems to be a close relationship between TSP and rainfall. April to May had a positive relationship, likewise June to July, August to October and November to December. Monthly Distribution Of TSP and Rainfall Pattern from April-December 2009 200 350 175 300 250 Rainfall (mm) TSP (ug/m3) 150 125 100 75 200 150 100 50 25 50 TSP Rainfall (mm) 0 Apr 0 Jun Aug Oct Dec Figure 4.12: Monthly distribution of TSP and rainfall pattern from AprilDecember 2009 40 4.2 Lung Function Test Table 4.7 Measured and Predicted Lung Function Tests for Both Paboase and Akoti lung function VC FVC FEV1 FEV1% PEF FEF25-75 FEF25 FEF50 FEF75 Measured Mean (sd) 95% CI 1.90 (0.48) 1.80 - 2.01 2.46 (0.64) 2.33 - 2.60 2.31 (0.66) 2.16 - 2.46 91.65 (13.91) 88.53 - 94.76 304.82 282.22 (106.06) 327.43 3.22 (1.08) 3.00 - 3.45 4.76 (-1.58) 4.42 - 5.10 3.49 (1.15) 3.24 - 3.74 1.85 (0.74) 1.69 - 2.01 Predicted Mean (sd) 95% CI 3.41 (0.68) 3.26 - 3.56 3.30 (0.62) 3.17 - 3.43 2.84 (0.51) 2.72 - 2.95 82.14 (-1.47) 81.81 - 82.47 475.03 (79.18) 458.16 - 491.91 4.22 (0.50) 4.11 - 4.33 6.88 (1.01) 6.67 - 7.10 4.60 (0.51) 4.49 - 4.71 2.07 (0.28) 2.01 - 2.13 p-values <0.00 <0.00 <0.00 <0.00 <0.00 <0.00 <0.00 <0.00 <0.003 The lung function test covered Vital Capacity (VC), Forecd Vital Capacity (FVC), Forced Expiratory Volume 1 (FEV1), Forced Expiratory Volume 1% (FEV1%), Peak Expiratory Flow (PEF), Forced Expiratory Flow 25%- 75% (FEF Expiratory Flow 25% (FEF Expiratory Flow 75% (FEF 25%), 75%). Forced Expiratory Flow 50% (FEF 25-75%), 50%) Forced and Forced Of all the measurements taken the predicted from the study population and actual measured for the study conducted were significantly different as all with the exception of FEF 75% which had p-value of <0.003, had p-value <0.00 as seen in Table 4.1. 41 Table 4.8: Measured and Predicted VC, FVC and PEF compared in both Communities Lung function Measured Predicted p-values Paboase Akoti Mean (sd) 95% CI 1.98 (0.56) 1.81 - 2.14 1.82 (0.38) 1.71 - 1.94 Mean (sd) 95% CI 3.54 (0.69) 3.33 - 3.75 3.26 (0.65) 3.06 - 3.48 <0.00 <0.00 FVC Paboase Akoti 2.64 (0.73) 2.25 - 2.68 2.46 (0.53) 2.29 - 2.63 3.41 (0.63) 3.23 - 3.60 3.17 (0.59) 2.99 - 3.36 <0.00 <0.00 VC PEF Paboase 296.73(126.76) 259.10-334.38 487.10(80.23) Akoti 313.90(77.13) 289.56-338.254 61.49(76.69) 463.28-510.94 <0.00 437.28 - 485.69 <0.00 There was a significant difference between the predict and measured values of VC, FVC and PEF for both communities, Akoti and Paboase(table 4.2) at 5% level of significance. For Peak Expiratory Flow, there was also a significant difference between the measured and the predicted values for both communities Paboase and Akoti. Both Paboase and Akoti had a p-value of <0.00. 4.7 Comparing Lung function in the various communities Table 4.9: Measured VC, FVC and PEF compared in both communities Lung Function VC FVC PEF Paboase Mean (sd) 95% CI 1.98 (0.56) 1.81 - 2.14 2.64 (0.73) 2.25 - 2.68 296.74 259.10 (126.76) 334.38 Akoti Mean (sd) 95% CI 1.82 (0.38) 1.71 - 1.94 2.46 (0.53) 2.29 - 2.63 313.90 289.56 (77.13) 338.25 42 pvalues <0.146 <0.974 <0.443 Results indicate that mean and standard devaition of VC for inhabitants of Paboase and Akoti were 1.98 (0.56) and 1.82 (0.38) respectively with a p-value of less than 0.146, indicating that there was no significant difference between the measured of Paboase and Akoti. FVC could also be observed not to be significantly different for inhabitants in Paboase and Akoti with a p-value of less than 0.974. Paboase and Akoti had a mean and standard deviation of 2.64 (0.73) and 2.46 (0.53) respectively. They were also within a 95% confidence interval with values 2.25 - 2.68 and 2.29 – 2.63 respectively. PEF was not significantly different between Paboase and Akoti with a p-value less than 0.443. Paboase and Akoti also had a mean and standard deviation of 296.74 (126.76) and 313.90 (77.13) respectively. They were also within a 95% confidence interval with values 259.09 - 334.38 and 289.56 – 338.25 respectively. 43 Table 4.10: Occurrences of Respiratory Symptoms in the two communities Symptoms Paboase Akoti χ 2 Pvalue Shortness of Breath No Yes 24 22 24 19 0.12 0.73 Coughing No Yes 39 7 39 4 0.72 0.4 Wheezing No Yes 44 2 42 1 0.28 0.6 Chest Pains No Yes 35 11 29 14 0.82 0.37 There was no significant difference among the results for all the symptoms of shortness of breath, coughing, wheezing and chest pains between the two communities, Paboase and Akoti. Table 4.11: Effects of Anthropometrics on Measured VC, FVC and PEF. VC Variable Weight Height Age Sex Occupants per Room FVC PEF Beta -0.000 -0.028 -0.110 -8.420 se 0.17 0.25 0.16 3.38 pvalue 0.98 0.91 0.49 0.02 Beta -0.10 -0.10 0.17 -7.13 se 0.18 0.26 0.17 3.52 pvalue 0.58 0.7 0.32 0.05 Beta -0.12 -0.18 -0.60 -13.78 se 0.24 0.34 0.22 4.65 pvalue 0.62 0.59 0.8 0.004 0.85 0.99 0.39 -0.32 1.03 0.76 2.4 1.36 0.081 Investigation of the effect of weight, height, age sex and room occupancy on VC, FVC and PEF (Figure 4.5) reveals that with the exception of sex, there were no significant differences among these factors. With respect to VC and the recorded p-values for 44 weight, height and age were 0.98, 0.91, 0.49 and 0.39 respectively while for FVC, they were 0.58, 0.7, 0.32 and 0.76 respectively. P-values of 0.62, 0.59, 0.22 and 0.081were recorded for these three parameters in the case of PEF. Sex for which the lung functions VC, FVC and PEF showed a significant deference recorded p-values of 0.02, 0.05 and 0.004 respectively. Table 4.12: Effects of certain social behaviors on measured VC, FVC and PEF VC Variable mean (se) Ever smoked Currently Smoking Vigorous Activity FVC pvalue mean (se) PEF pvalue mean (se) pvalue No 56.97 (1.49) Yes 54.04 (4.36) 0.52 73.89 (1.54) 80.30 (1.47) 0.18 62.59 (2.11) 71.02 (3.79) 0.19 No 56.97 (1.44) Yes 50.57 (5.96) 0.34 73.87 (1.47) 88.84 (3.67) 0.03 63.21 (2.03) 68.61 (5.56) 0.57 No 60.30 (2.84) Yes 55.88 (1.58) 0.23 72.85 (3.93) 74.91 (1.56) 0.59 60.28 (5.10) 64.12 (2.11) 0.46 Smoking (formerly or currently) and vigorous activities had no significant effect on the measured VC, FVC and PEF of respondents from both Paboase and Akoti (table 4.6). Those who used to smoke and are currently smoking did not have a significantly different VC, with p-values of 0.52 and 0.34 respectively. Those who were engaged in vigorous activity also did not have a significantly different VC with a p-value of 0.23. The effect on FVC of those who use to smoke and those who engage in vigorous activity was not significantly different (p-values of 0.18 and 0.59 respectively). Currently smoking, with a p-value of 0.03, did have a significant effect on the FVC. 45 All the three (ever-smoked, currently smoking and vigorous activity) did not significantly affect the PEF. Their p-values were 0.19, 0.57 and 0.46 respectively. 46 CHAPTER FIVE 5.0 DISCUSSIONS 5.1 Status of PM10 in the Chirano Gold Mines Ltd The level of PM10 over the period was not constant. This is consistent with a study by Masitah et al (2007) which showed that particulate matters are not constant over a period of time due to the nature of the weather and the different times of the day at which sampling and measurements and that concentrations tend to be higher during the day and continue till midnight. Relative humidity varies with time at the place. It tends to be lower during the day and early hours of the morning and higher at night. There is therefore the tendency for precipitation of PM10 to a lesser extent during the day and to a greater extent during the night and early mornings. This therefore may explain the observed higher levels of PM10 during the day and lower levels during the night and early mornings. Again in the study, the concentrations of particulate matter were found to be lower during the period between 3:00am and 8:00am. This perhaps may be due to no human or reduced activities including that of mining. The different concentrations at different times may also contribute to the different activities that take place at the different times. 5.2 PM10 compared with WHO and EPA-Ghana Standards Standards are derived from other standards based on the realistic economic benefits from meeting those standards. A comparison of PM10 levels in this study with the WHO standards (50μgm-3) suggests that the study area is polluted. The only deviation 47 from this observation occurred in July when the concentration fell within the standard allowable level (36.91μgm-3) for human interaction (figure 4.2). However concentration fell below the EPA- Ghana standard (70μgm-3). May, June and November where concentrations of 76.25μgm-3, 73.67μgm-3 and 87.68μgm-3 respectively were recorded being exceptional and very remarkable. This observation as view against the EPAGhana standards at the background, suggests that the study area is unpolluted. The WHO standard is therefore very strict and may not be realistic to the economic benefits of Gold mining processes in Ghana. The EPA-Ghana however, might have considered a standard that is realistic to the economic benefits of the Gold mines. However, according to Schwartz (1993) there is a significant association between daily average PM10 levels and mortality at concentrations below the current U.S. Standard of 150µg/m3 for short-term PM10 levels. This suggests that although companies might meet both WHO and EPA- Ghana standards there might still be some health implications. Again despite the study recording concentrations below the WHO and EPA- Ghana standards, a study conducted on over half a million people in 151 U.S metropolitan areas during 1982- 89 by Pope et al (1995) noted that death rates in the area most polluted with fine particulates were about 17% higher than in the least polluted areas. Ostro (1994) suggested an increase in human mortality rates ranging from 0.3% to 1.6% for each 10 µg/m3 increase in average annual PM10 concentrations. These send signals that even though the area may be classified as relatively unpolluted, the health effect on the inhabitants could still be a matter of concern. 48 Periods where the concentrations of PM10 were above the EPA-Ghana were April – May and November – December (Figure 4.2). These were the periods of intense heat in the atmosphere where relative humidity is lowest leading to little or no moisture to precipitate the liberated particulate matter and may therefore explain such observation. Schwartz et al (1993) found a significant increase in emergency rooms/ hospitals visits among people under the age 65 in areas with daily average PM10 concentration that were less than 70% of the US air quality standard of 150µg/m3. Several studies carried out by Villeneuve et al, in Canada (2003), Wichmann et al in Germany (1989), Katsouyanni (1993) in Switzerland and Schwartz (1992) in the United States indicate an association between respiratory symptoms and exposure to long term ambient particulate matter concentrations of about 30 - 35µg/m3, without any evidence of a threshold level below which health effects do not occur. 5.3 PM10 Emission by Location The Rom Pad, is the location for dusts-generating activities. These activities include haulage of rocks, off-loading and crushing of rocks. The average concentration (166.72µg/m3) of PM10 at the Rom Pad was highest during the period of monitoring and was well above the WHO and EPA- Ghana permissible levels of (50 µg/m3) and (70µg/m3) respectively. Pollutants in this area are transported long distances to other places including villages or communities within the mine. This was worsened by the poor road condition corroborating the study by (Masitah et al, 2007) who noted that 49 pollution owing to transportation activities is further compounded by the poor conditions of the roads in and around mining areas. 5.4 TSP status in Chirano Gold Mines Ltd TSP trends were also not constant throughout the period. This is in consonance with a study by Masitah et al, (2007) who reiterated that the spread of particulate matters is not constant over a period of time. The lowest concentration occurred in July. The peak of the rainy season in July and the occurrence of forest cover may share this attribute. In other locations, the forest cover appears to restrict the movement of particulate matter causing the particulate matter to settle easily and faster and therefore escape detection by the monitoring device. This is consistent with a study by Georgiadis and Rossi (1989) which indicated that course particles, such as dust are directly deposited on leaf surfaces and as a result reduce exchange of gases between plants and the atmosphere thereby reducing photosynthesis. 5.5 TSP compared with WHO and EPA-Ghana Standards Lower concentrations of TSP were observed in this study as compared with the WHO and EPA- Ghana standards. This however do not necessarily indicate safe health since several studies in developed nations including those by Schwartz (1992) and Villeneuve et al (2003) have found an association between respiratory symptoms and exposure to 50 long term ambient particulate concentrations even within the range of 30-35µg/m3. Also there has not been any evidence that there is a threshold level below which health effects do not occur. 5.6 TSP Emission by Location The trend of the TSP concentrations recorded in the study is not different from that for PM10. Rom pad location recorded the highest concentration of TSP due to activities such haulage, off-loading and crushing of rocks which take place in this location. The average concentration of TSP (367.62µg/m3) over the period at the Rom Pad also exceeded the WHO and EPA- Ghana standards (Figure 4.6). The mine village recorded one of the lowest average concentration of TSP. This may be due to the location of the village. The mine village is located in-between two hills covered by the thick forest. The reason is consistent with the study which showed that coarse particles such as dust are directly deposited on the leaf surface which tends to reduce gas exchange and photosynthesis (Masitah et al, 2007). The other places had average concentrations relatively lower due to a similar reason and also frequent watering of the roads which are already in deplorable states as also indicated in the study by Masitah et al, 2007 that roads in deplorable state are major contributing factor to atmospheric pollution. 51 5.7 Relationship between PM10 and TSP A study by Masitah et al (2007) revealed that PM10 and TSP measured in different plants locations produce different results. Although PM10 and TSP are closely related as far as ambient air pollution is concern. There was a direct relationship in the trends of PM10 and TSP (figure 4.7), although different concentration were measured. The generation of PM10 and TSP in mining area are from the same source driven by the same factors such as precipitation. The similarity in trend is therefore not surprising. However after the rainy season the lighter particles other than PM10 might have settled leaving PM10 still suspended. The health effects on humans via respiratory impedance and on plant via reduction in photosynthesis as they are deposited on leaves to obstruct sunlight penetration are therefore disturbing phenomena. 5.8 PM10 and TSP trends compared with Rainfall pattern The spread of particulates matter and its concentrations are influenced by factors including the wind, temperature and humidity. PM10 levels were found to decrease with increasing amount of rainfall received. This is in agreement with Masitah et al, (2007) in a study in Malaysia which pointed out that heavy rainfall causes reduction in the amount of particulates in the air because most of it are carried by the rain water. TSP trends with rainfall pattern look very similar (figure 4.9). Caution should however be exercised in predicting the levels of PM10 in accordance with rainy season since climate change, a global concern continues to pose difficulty and is crowded by uncertainty in prediction of climate-driven events. The trend of TSP 52 was quite similar except between August and October where higher concentrations were recorded probably due to reduced rainfall in accordance with Twomey et al, 1984; Borys et al, 1998 who stated that air pollution generally resulted in increase in the number of small clouds condensation nuclei, which led to smaller cloud droplets. 5.9 Predicted and Measured Lung Function in Akoti and Paboase Exposure to particles with an aerodynamic diameter smaller than or equal to a nominal ten microns (which are also to retain deep in the lungs) may cause health problems. These health effects of atmospheric particulates matter are related to its ability to penetrate the respiratory system. The lung function test of participants, measured and that predicted were significantly different from each other at 5% level of significance. The difference might be as a result of the ability of the particulates matter to penetrate the respiratory system. However, it must be noted that, in general, respiratory defense mechanisms are able to remove 99 percent of particles larger than 10µm from inhaled air stream (Environmental Monitoring Program - Air, 2002). The measured lung function result takes into consideration the airways obstruction. The reduction in lung function tests indicates that the airways have been obstructed. This is a potential cause of many health disorders such as coughing, wheezing and chest pains and compares favourably with Kunzli et al (2000) who recounted that epidemiological and toxicological studies demonstrate that air pollution is associated with a range of adverse health outcomes ranging from mortality to sub-clinical respiratory symptoms. 53 5.10 State of Lung Function in Paboase and Akoti The measured lung function results in Paboase were not significantly different from that in Akoti (Table 4.3). Paboase comparatively had better lung function than Akoti. The exposure to pollutants in Paboase was generally lower than the exposure in Akoti as seen in the measurements of both PM10 and TSP concentrations. This may be explained by the fact that, sampling locations within the catchment of Paboase Vilage (Paboase camp and Akwaba) recorded lower concentrations of 39.62µg/m3 and 40.38µg/m3 respectively for PM10 and 95.82µg/m3 and 79.17µg/m3 respectively for TSP whereas those of Akoti (Rom Pad, Mine Village, Processing Plant, Construction camp, Exploration pad) were 166.72µg/m3, 52.52µg/m3, 41.54µg/m3, 38.76µg/m3 and 35.27µg/m3 respectively for PM10 and 367.62µg/m3, 67.82µg/m3, 81.53µg/m3, 121.44µg/m3, 71.76µg/m3 respectively for TSP. It was also observed that the frequency of watering of roads in Paboase was relatively more than in Akoti. In addition, there was a branch road from Akoti to Chirano and other communities. This increased vehicular movements and hence promoted dust liberation. There was again a by-pass road uphill behind Akoti, which generated dust due to the haulage of rocks by huge trucks from the other pits to the Rom Pad. Although the bypass road was frequently watered, total elimination of dust liberation and its impact cannot be ascertained. 54 5.11 Lung Function and Respiratory Symptoms Identification of symptoms, in addition to lung function test are very important in diagnosing respiratory diseases. When in the lungs, particulates slow the exchange of oxygen and carbon dioxide in the blood, causing shortness of breath. The heart may be strained because it must work harder to compensate for the oxygen loss. Fewer respondents gave negative responses to the occurrence of symptoms. The differences in responses from the communities were however not related to the lung function tests in the two communities. There were relatively higher numbers of positive responses from participants from Akoti than from Paboase compared to lung function results in Akoti and Paboase (Table 4.4). The prevalence of chronic bronchitis in the general population in most developed countries is between 3% and 17% while higher rates of between 13% and 27% exist in developing countries (Ball and Make, 1998). However, at present there is no reliable data on the prevalence of chronic bronchitis and breathlessness in the general Ghanaian population but that which was found in a study by Bio et al, 2007 were respectively 21.2% and 31.3%. Lower prevalence levels of respiratory symptoms of 0.1% have been found in copper miners of Zimbabwe (Paul, 1965). It can however be inferred from results (Table 4.4) that the lung function of participants in both communities (Paboase and Akoti) were not affected so much to cause breathing or respiratory problems. This is at variance with study by Schwartz (1991) which suggested that ambient particulates 55 concentrations of about 30-35µg/m3 may enable an association between respiratory symptoms and exposure to long-term to be seen. 5.12 Anthropometrics and Lung Function Weight, height, age and sex are believed to have effect on the lung function. In this study, age and height of participants did not significantly affect the lung function of participants. However, sex did probably due to the small numbers involved. In a study on miners by Cotes et al, (1966), it was found that there was a statistically significant effect of increasing age, mining experience and total cumulative respirable dust exposure on the prevalence of breathlessness (which represents a defect in lung function). All measured lung function indices decline with age as expected as the functional efficiency of the lung deteriorates with age. Also Gholamhossein et al (2009) observed a positive correlation between age and height (P<0.0001). The results observed in this study (Table 4.5) are therefore not consistent with this finding. Lung function variables also show positive correlation when compared with age. Boys showed higher values for the lung function than girls. The difference became more significant when these lung function variables were compared with age (Chowgule et al, 1995). Ethnic origin also plays a role in determining the lung function of individuals. As noted by Schoenberg (1973) who studied white and black populations from the USA over 7 years. Chowgule et al (1995) compared data for age group 7- 9 years and 10- 14 years and observed that FVC and FEV1 were significantly lower (p<0.005) than white 56 population for both sexes and age groups. However, they did not reveal any significant difference when compared with the black population. A regression analysis also demonstrated the importance of height and sex in determining lung function (Malik and Jindal, 1985). For clinical evaluation of children‘s lung function, height is the most significant parameter. The effect of weight and age do not substantially influence predicted pulmonary function (Vohra et al, 1984). Room occupancy was also considered in this study and it was found that room occupancy had no significant influence on the various lung function parameters (table 4.5). This contradicts the fact that having too many people occupying a room affects the air quality in the room and hence long term exposure to such condition tends to affect the lung function of its occupants. In a number of studies at elevated concentrations of indoor air pollutants, about 5% CO2 in air or 90,000mg/m3, have been performed and the lowest level at which effects have been seen in humans and animals is about 1%, that is 18,000 mg/m3 and that indoor CO2 concentration will not reach these unless ventilation is very low (EPA, 1991). 5.13 Smoking, Activity level and Lung Function in Akoti and Paboase Mokotelle et al, 1994 recounted a significantly higher prevalence of chronic bronchitis in smokers than in the never smoked. Sluis-Cremer et al, 1981 in a study among Gold miners, found that chronic bronchitis tends to increase sharply with smoking though most participants had never smoked but the few who had smoked tend to show that there was no significant influence on their lung function. This is inconsistent with the 57 results of the study above. This might be due to the small number of participants involved. According to Sluis- Cremer et al(1981), what was important in causation of chronic bronchitis was the fact that one smoked, but not the daily tobacco consumption. They observed also a major increase in the incidence of chronic bronchitis between the ‗no smoking‘ and the ‗light smoking‘ groups. They observed a statistically significant effect of smoking on chronic bronchitis. This finding is also inconsistent with the study. In addition, occupational breathlessness in some miners was much more pronounced in smokers than non-smokers. In non-smokers who are passive smokers also their lung function affected after long-term exposure. According to Jindal et al, 1996 in a study in which airflow mechanics in asymptomatic healthy women was done to evaluate the effects of long term exposure to Environmental Tobacco Smoke (ETS), it was found that although FEV1 and PEF of passive smokers were only marginally lower than the controls, their FEF25-75% were significantly impaired. Mokoettle et al, 1994, Oleru, 1980 and Becklake et al, 1990 in various parts of Africa, found that smokers have larger mean FVC and FEV1 at earlier ages than non- smokers. The finding is consistent with the result of this study, which found that smoking has no significant effect on the FVC of those who currently do. In this study, FVCs of those who previously and currently smoked were larger than those who had never smoked. This may be due to the ‗healthy smoker‘ effect, because the individuals who take up smoking have lungs which are relatively resistant to the effects of smoking, as they have 58 lower levels of airway responsiveness to inhaled materials. This phenomenon, according to Becklake et al (1990) is not limited to person, place or time and that it is most frequent in the ever smoked (current and Ex-) before the age 40. Seltzer (1963) found chest circumference relative to height of smokers in 1942 Harvard University entrants to be greater than non-smokers. The fact that nearly all smokers can be shown to have some functional impairments should not overshadow the equally important observation that the individual susceptibility to the deleterious effects of cigarette smoke is extremely viable (Peters and Ferris, 1967). This would suggest that cigarette smoking is not the sole determinant of COPD and those other factors, genetic or environmental, are also of etiologic important as has already been shown for alpha- 1 antitrypsin deficiency (Willhelmsen and Tibblin, 1966). When ambient air is polluted, one‘s level of activity has an effect on the health. In this study, how vigorous the participants‘ activity level was, had no significant effect on the lung function of participants. This finding is in variance with the study by (Santo et al, 1998). In their study (Santos et al, 1998), pulmonary mechanics, minute‘s volume was statistically related to the physical activity, that is, even with mechanical change established by this disease and generating chest rigidity, the volume of air that passes through airways every minutes is better maintained in individuals who have practiced physical activities regularly. This may be explained by the fact that activity that is more vigorous increases the breathing rate, hence more air (polluted) is taken in and this deteriorates the lung‘s function. 59 CHAPTER SIX 6.0 CONCLUSIONS AND RECOMMENDATIONS This section presents the conclusions which are drawn from the study of ambient air quality and the health of communities around the Chirano Gold Mines Limited. 6.1 Conclusion The measured concentrations in this study of PM10 were generally below the EPA Ghana standards (70μgm-3) with the only exceptions occurring in May and November. The exceptions observed may possibly be due to low relative humidity. However, the concentrations were above the WHO standard limit of 50μgm-3. Although the WHO standard is stricter than that of EPA-Ghana, in June intense and frequent rainfall might have suppressed the liberation of particulate matter and therefore concentration lower than both EPA-Ghana and WHO recorded. TSP concentrations were below both EPAGhana and WHO standards of 230μgm-3 and 200μgm-3 respectively. These observations suggest that the ambient air in the study area is not polluted in terms of PM10 and TSP. The study also showed that results obtained from the measured lung functions were significantly different from the predicted lung function indicating that there are health effects associated the study population. They differed for Paboase and Akoti on the other hand marginally, with Paboase having higher standard deviations than Akoti. This does not indicate pollution-free or healthy environment. 60 The highest concentration of PM10 and TSP occurred at the Rom Pad where a lot of dust generating activities namely haulage, offloading and crushing of rocks occur. This therefore calls for greater attention to be paid at these areas as measures aimed at curbing their contribution to atmospheric pollution. 6.2 Recommendations Based on the outcome of this study, the following recommendations are proposed: 1. There is the need for the EPA to conduct regular periodic monitoring of ambient air quality in the communities within the mine concession for the needed remedial action aimed at improving the health of the inhabitants of the communities to be implemented. 2. There is the need for EPA to intensify education on environmental issues within mining communities. 3. More dust suppressing techniques should be put in place by the mining company, Chirano Gold Mines Limited (CGML) especially at the Rom pad in the bid to reduce the contribution of particulate matter concentrations resulting from bad road and dust generating activities including blasting, hauling and crushing of rocks. This will in turn reduce the effects on inhabitants, plants and the community as a whole. 4. The Chirano Gold Mines Limited should upgrade the roads within its catchment to feeder road status to prevent liberation of dust which adds up to the ambient air pollution. 61 5. There should further studies that take into consideration the following parameters: continuous sampling of particulate matter; extended study duration; the medical history of respondents and sensitization of the study communities on the importance of issues involving environmental monitoring (for the purpose of easy entry and enhancement of participation). 62 REFERENCES 1. Air_quality_in_South_East_Queensland http://www.epa.qld.gov.au/environmental_management/ 2. Airborne particulates retrieved in 30th July, 2010 at http://www.qld.gov.au/ 3. Akabzaa T., and Daramani A. (2001). Impact of mining sector in Ghana: A study of the Tarkwa Mining Region. Report to SAPRI. 4. Am J (1996) Res Crit Care Med 1996; 153: 4-50. 5. Atkinson R, Bremner S, Anderson H, Strachan D and Bland JM. (1999) Shortterm Association between Emergency Hospital Admissions for Respiratory and Cardiovascular Disease and Outdoor Air Pollution in London. Arch Environ health 1999; 54(6): 399-411 6. Ball P and Make B. (1998) Acute exacerbation of chronic bronchitis. An international comparison. Chest 1998; 113(3 suppl): 199s-204s. 7. Bascom R., BrombergP.A., and Costa D.L. (1996) Health effects of outdoor air pollution. Part 2. Committee of the Environmental and Occupational Health Assembly of the American Thoracic Society. Am J Respir Crit Care Med 1996: 153: 477-498. 8. Becker S, Mundandhara S, Devlin RB and Madden M. (2005) Regulation of cytokine production in human alveolar macrophages and airway epithelial cells in response to ambient air pollution particles: further mechanistic studies. Toxicol Appl Pharmacol 207:269-275. 9. Becker S, Soukup JM, Sioutas C and Cassee FR. (2003) Response of human 63 alveolar macrophages to ultrafine, fine, and coarse urban air pollution particles. Exp Lung Res 29:29-44. 10. Becklake MR and Lalloo U. (1990) The 'healthy smoker': A phenomenon of health selection? Respiration 1990; 57: 137-144. 11. Bio FY, Sadhra S, Jackson C and Burge PS. (2007) Respiratory Symptoms and lung function impairment in underground gold miners in Ghana. Ghana Medical Journal 2007; 41(20): 38- 47. 12. Borys, R. D., D. H. Lowenthal, M. A. Wetzel, F. Herrera, A. Gonzalez, and J. Harris. (1998) Chemical and microphysical properties of marine stratiform clouds in the North Atlantic. J. Geophys. Res., 103, 22,073-22,085. 13. Burnett R, Cakmak S, Brook J and Krewaki D. (1997) The Role of Particulate Size and Chemistry in the Association between Summertime Ambient Air Pollution and Hospital for Cardiorespiratory Diseases. Environ Health Perspec 1997; 105(6): 614-620. 14. Burnett R, Smith-Doiron M, Stieb D and Cakmak S. (1999) Effects of Particulate and Gaseous Air Pollution on Cardiorespiratory Hospitalizations. Arch Environ health 1999; 54(2): 130-139. 15. Calverley PM and Walker P. (2003) Chronic obstructive pulmonary disease. Lancet. 2003; 362(9389):1053-1061. 16. Choudhury A, Gordian ME and Morris S. (1997) Associations Between Respiratory Illness and PM10 Air Pollution. Arch Environ health 1997; 54(2): 113117. 17. Chowgule RV, Shetye VM and Parmar JR. (1995) Lung function tests in normal Indian children. Indian Pediatr 1995; 32: 185-191. 12. 64 18. Clean Air Act of 1970. 1970. Public Law 91-604. 19. Cotes JE, Russiter CE, Higgins ITT and Gilson JC. (1966) Average normal values for the forced expiratory volume in white Caucasian males. Br Med J 1966; 18(88 suppl.): 128-136. 20. Cowie RL and Mabena SK. (1991) Silicosis, chronic airflow limitation and chronic bronchitis in South African gold miners. Am Rev Respir Dis 1991; 143(1): 80-84. 21. Daniels MJ, Dominici F, Zeger SL and Samet JM. (2004) The National Morbidity, Mortality, and Air Pollution Study, Part III: PM10 Concentration-Response Curves and Threshold for the 20 Largest US Cities. Research Report 94. Boston, MA:Health Effects Institute. 22. Delfino RJ, Quintana PJ, Floro J, Gastanaga VM, Samimi BS and Kleinman MT. (2004). Association of FEV1 in asthmatic children with personal and microenvironmental exposure to airborne particulate matter. Environ Health Perspect 112:932-941. 23. DiBattista C and Brown DR. (2003) Editorial: quality of life and attainment of National Ambient Air Quality Standards (NAAQS). Are they compatible? More questions than answers. The challenge for risk assessment. Hum Ecol Risk Assess 9:637-640. 24. Dockery DW, Pope CA III, Xu X, Spengler JD, Ware JH, Fay ME, Ferris BG Jr, and Speizer FE (1995). An Association Between Air Pollution and Mortality in Six U.S. Cities. N Engl J Med329, 1753-1759. 25. Environmental Monitoring Program -Air (2002) Annual Environmental Report Federal Environmental Monitoring Hand Book, US. Department and Energy Office of environmental policy and assistant RCRA/CERCLA, 1997 65 26. Gholamhossein P, Hossein K, Mohammad S, Farideh P and Mohammadali L. (2009) Pulmonary Effects of Occupational Exposure to Welding Fumes, Australian Journal of Basic and Applied Sciences, 3(4): 3291-3296, 2009 ISSN 1991-8178 27. Harre ES, Price PD, Ayrey RB, Toop LJ, Martin IR and Town GI. (1997) Respiratory effects of air pollution in chronic obstructive pulmonary disease: a three month perspective study. Thorax 1997, 52 (12): 1040- 1044. 28. Hnizdo, E. Sluis-Cremer, G.K., Baskind, E and Murray, J. (1994). Emphysema and air way obstruction in non-smoking south African gold miners with long exposure to silica dust. Occup. Environ. Med. 1994:51:557-63. 29. Jindal SK, Gupta D, D'souza GA and Kalra S. (1996) Bronchial responsiveness of non-smoking women exposed to environmental tobacco smoke or biomass fuel combustion. Indian Journal of Medical Research 1996; 104: 359 -364. 30. Katsouyanni K (Ed). (1993). Study designs. Commission of the European Communities, Air Pollution Epidemiology Report Series. Report No. 4. Luxembourg Office for Official Publications of the European Communities, 1993. 31. Koenig JQ, Mar TF, Allen RW, Jansen K, Lumley T and Sullivan JH. (2005) Pulmonary effects of indoor- and outdoor-generated particles in children with asthma. Environ Health Perspect 113:499-503. 32. Koren H. (1995) Association between Criteria Air Pollutants and Asthma. Environ Health Perpec 1995; 103(6): 235-242. 33. Laura Irvine (1991). Euromoney, September 66 34. Liao D, Creason J, Shy C, Williams R, Randal W and Zweidinger. (1999) Daily Variation od Particulate Air Pollution and Poor Cardiac Autonomic Control in the Elderly. Environ Health Perspec 1999; 107(7): 521-25. 35. Malik SK and Jindal SK. (1985) Pulmonary function tests in healthy children. Indian Pediatr 1985, 22: 677-681. 36. Masitah A., Zaini H. and Lee See K. (2006) PM10 And Total Suspended Particulates (TSP) Measurements In Various Power Stations, The Malaysian Journal of Analytical Sciences, Vol. 11. No. 1(2007):255-261 37. McCormack MC, Breysse PN, Hansel NN, Matsui EC, Williams D, CurtinBrosnan J, Eggleton P and Diette G. (2009) In-Home Particle Concentrations and Childhood Asthma Morbidity. Environ Health Pespect 117:294-298. 38. Mokoetle KE, de Beer M and Becklake MR. (1994) A respiratory survey in a black Johannesburg workforce. Thorax 1994; 49: 340-346. 39. Neas LM, Dockery DW, Koutrakis P, Tollerud D and Speizer F. (1995) The Association of Ambient Air Pollution with Twice Peak Expiratory Flow Rate Measurements in Children. Am J Epidemiol 1995; (141(2): 111-122. 40. Oleru UG. (1980) Pulmonary function of control and industrially exposed Nigerians in asbestos, textile and toluene disocyanate foam factories. Environ Res 1980; 23: 137-148. 41. Ostro B. (1993) The Association of Air Pollution and Mortality: Examining the Case for Inference. Arch Environ Health 1993; 48(5): 336-42. 42. Paul R. (1961) Silicosis in Northern Rhodesia copper mines. Arch Envtal Hlth 1961; 2: 96-109. 43. Peters JM and Ferris BG (1967) Jr: Smoking, pulmonary function and respiratory 67 symptoms in a college-age group. Am Rev Resp Dis 95:774, 1967 44. Ponka A, Savela M and Virtanen M. (1998) Mortality and Air Pollution in Helsinki. Arch Environ health 1998; 53(4): 281-86. 45. Pope CA III, Dockery DW, Spengler JD and Raizenne ME. (1991) Respiratory health and PM10 pollution. A daily time series analysis. Am Rev Respir Dis 144:668-674. 46. Pope CA III, Dockery DW, Spengler JD, Raizenne ME. (1991). Respiratory health and PM10 pollution. A daily time series analysis. Am Rev Respir Dis 144:668-674. 47. Pope CA, Bates D and Raizenne M. (1995) Health Effects of Particulate Air Pollution: Time for Reassessment? Environ Health Perspec 1995; 103: 472-480. 48. Pope CA, Dockery DW, Spengler JD and Raizenne ME. (1991) Respiratory Health and PM10 Pollution. Am Rev Respir Dis 1991; 144: 668-674. 49. Pope CA and Dockery DW. (1992) Acute Health Effects of PM10 Pollution on Symptomatic and Asymptomatic Children. Am Rev Respir Dis 1992; 145: 11231128. 50. Rabinovitch N, Strand M and Gelfand EW. (2006) Particulate levels are associated with early asthma worsening in children with persistent disease. Am J Respir Crit Care Med 173:1098-1105. 51. Roemer W, Hoek G and Brunekreef B. (1993) Effect of Ambient Winter Air Pollution on Respiratory Health of Children with Chronic Respiratory Symptoms. Am Rev Respir Dis 1993; 147: 1187-124. 52. Romieu I, Corts Lugo M, Ruiz Velasco S, Sanchez S, Meneses F, Hernadez M.(1992) Air pollution and school absenteeism among children in Mexico City. Am J Epidemiol 1992; 136: 1524–1531. 68 53. Samet JM, Dominici F, Curriero FC, Coursac I and Zeger SL. (2000) Fine particulate air pollution and mortality in 20 U.S. cities, 1987-1994. N Engl J Med 343:1742-1749. 54. Santos H, Brophy S and Calin A. (1998) Exercise in ankylosing spondylitis: how much is optimum? J Rheumatol 1998;25(11):2156-60. 55. Schikowski T, Sugiri D and Ranft U. (2005) Long-term air pollution exposure and living close to busy roads are associated with COPD in women.Respir Res. 2005; 6:152. 56. Schoenberg JB, Beck GJ and Bouhuys A. (1978) Growth and decay of pulmonary function in healthy blacks and whites. Resp Physiol 1978, 33: 367-393. 57. Schwartz J. (1993) Particulate Air Pollution and Hospital Emergency Room Visits for Asthma in Seattle. Am Rev Respir Dis 1993; 147: 826-831. 58. Schwartz J. (1991) Particulate air pollution and daily mortality: a synthesis. Public Health Rev 1991: 19: 39–60. 59. Schwartz J and Dockery DW. (1992) Particulate air pollution and daily mortality in Steubenville, Ohio. Am J Epidemiol 1992; 135: 12–19. 60. Schwartz J, Laden F and Zanobetti A. (2002). The concentration response relation between PM2.5 and daily deaths. Environ Health Perspect 110:1025-1029. 61. Schwartz J. (1993) Air Pollution and Hospital Admissions for Elderly in Birmingham, Alabama. Am J Epidemiol 1993; 139(6): 589-598. 62. Seltzer CC. (1963) Morphologic constitution and smoking. JAMA 1963; 183: 639. 63. Sluis-Cremer G.K., Harrison W.O. and Pearson R.C. (1981) Respiratory symptoms and lung function in black and white mining and non-mining industrial workers in South Africa. S Afr Med J 1981; 59(19): 672-675. 69 64. Sluis-Cremer GK, Walters LG and Sichel HS. (1967) Chronic bronchitis in miners and non-miners: An epidemiological survey of a community in the gold mining area in the Transvaal. Br J Ind Med 1967a; 24: 1-12. 65. Thermal Power: Guideline for new plants, Pollution Prevention Abatement handbook, 1998 PART 50-National Primary and secondary ambient air quality retrieved in 30th July, 2010 at http://www.washingtonwatchdog.org/documents/cfr/index.html 66. Thurston G.D., and Ito K. (2001) Epidemiological studies of acute ozone exposures and mortality. J Expo Anal Environ Epidemiol 2001: 11: 286-294. 67. Total suspended particulates, Wisconsin Dept. of Natural Resources, retrieved at 30th July, 2010 at http://www.dnr.state.wi.us/org/aw/air/health/tspart.htm 68. Trenga CA, Sullivan JH, Schildcrout JS, Shepherd KP, Shapiro GG, Liu LJ. (2006) Effect of particulate air pollution on lung function in adult and pediatric subjects in a Seattle panel study. Chest 129:1614-1622. 69. Twomey, S., M. Piepgrass, and T. L. Wolfe, (1984): An assessment of the impact of pollution on global cloud albedo. Tellus, 36, 256-366. 70. Ugwamanyi, J.U. and Obi F.C. (2002) A Survey Of Health Effects Of Air Pollution On Peasant Farmers In Benue State, Nigeria. International journal of Environmental Studies 2002; 59: 6, 665- 677. 71. Vohra RS, Shah SC and Shah GS. (1984) Pulmonary function in normal children. Indian Pediatr 1984, 21: 785-790. 72. Wichmann HE, Mueller W, Allhoff P, (1989) Health effects during a smog episode in West Germany in 1985. Environ Health Perspect 1989; 79: 89-99. 73. Wilhelmsen L and Tibblin G(1966): Tobacco smoking in fifty-year old men. 70 Respiratory symptoms and ventilatory function tests. Scand J Resp Dis 47: 121, 1966 74. Woodruff T(1997). The Relationship between Select Causes of Postneonatal infant Mortality and Particulate Air Pollution in the United States. Environ Health Perspec 1997; 105(6): 608-612. 75. World Health Organization (WHO). WHO Air Quality Guidelines for Particulate Matter, Ozone, Nitrogen Dioxide and Sulfur Dioxide: Global Update 2005 (Geneva: WHO, 2006). 76. www.epa.gov/ttn/oarpg/naaqsfin/pmfact.html 77. Yu O, Sheppard L, Lumley T, Koenig JQ and Shapiro GG. (2000) Effects of ambient air pollution on symptoms of asthma in Seattle-area children enrolled in the CAMP study. Environ Health Perspect 108:1209-1214. 78. Zanobetti A, Schwartz J and Gold D (2000). Are there sensitive subgroups for the effects of airborne particles? Environ Health Perspect 108:841-845. 71 APPENDICES Appendix 1. The general trend of pollution by PM10 in the CGML MONTH April May June July Aug. Sept. Oct. Nov. Dec. Mean PM10 55.03 76.25 73.67 36.91 56.22 63.89 57.49 87.68 69.25 Appendix 2. Measured PM10 trends in the CGML Compared with the (EPA)-Ghana and WHO standards MONTH April May June July Aug. Sept. Oct. Nov. Dec. Mean PM10 55.03 76.25 73.67 36.91 56.22 63.89 57.49 87.68 69.25 EPA 70 70 70 70 70 70 70 70 70 WHO 50 50 50 50 50 50 50 50 50 Appendix 3. PM10 concentrations at various locations in the CGML Sampling location Rom Pad Mine Village Mean Concentration 166.72 52.52 Processing Plant Akwaaba 41.54 40.38 Paboase Camp Construction camp Exploration Pad 39.62 38.76 35.27 72 Appendix 4. The general trend of pollution by TSP in the CGML Months April May June July Aug. Sept. Oct. Nov. Dec. Mean TSP 150.79 155.75 142.75 84.6 163.54 112.5 185.51 116.62 138.34 Appendix 5. Measured TSP trends in the CGML Compared with the (EPA)-Ghana and WHO standards Months April May June July Aug. Sept. Oct. Nov. Dec. Mean TSP 150.79 155.75 142.75 84.60 163.54 112.50 185.51 116.62 138.34 EPA 230 230 230 230 230 230 230 230 230 WHO 200 200 200 200 200 200 200 200 200 Appendix 6. TSP concentrations at various locations in the CGML Sampling location Rom Pad Mean TSP 367.62 Construction Camp 121.44 Paboase Camp 95.82 Processing Plant 81.53 Akwaaba 79.17 Exploration Camp 71.76 Mine Village 67.82 73 Appendix 7. Distribution of PM10 and TSP MONTH April May June July Aug. Sept. Oct. Nov. Dec. PM10 55.03 76.25 73.67 36.91 56.22 63.89 57.49 87.68 69.25 TSP 150.79 155.75 142.75 84.60 163.54 112.50 185.51 116.62 138.34 Appendix 8. Monthly distribution of PM10 and rainfall pattern MONTH April May June July August September October November December Average PM10 55.03 76.25 73.67 36.91 56.22 63.89 57.49 87.68 69.25 Rainfall 132.80 164.40 300.70 112.00 42.60 25.96 94.80 106.50 117.80 Appendix 9. Monthly distribution of TSP and rainfall pattern Months April May June July August September October November December Average (TSP) 150.79 155.75 142.75 84.6 163.54 112.5 185.51 116.62 138.34 Rainfall 132.80 164.40 300.70 112.00 42.60 25.96 94.80 106.50 117.80 74 Apendix 10. Ethics Approval letter 75 Appendix 11: Information Sheet and Informed Consent Form Participant Information Leaflet and Consent Form What every prospective participant should know before deciding to or not to participate Title of Research: Ambient Air Quality And The Health Of Communities Around Chirano Gold Mines Limited Name(s) and affiliation(s) of researcher(s): Michael Ntim, Department of Materials Engineering (MSc. Enviromental Resource Management) Purpose(s) of research: The purpose of this research is to find out whether there is pollution in the communities and also whether any deteriorating air quality affects on the health of the inhabitants of the communities. Procedure of the research, what shall be required of each participant and approximate total number of participants that would be involved in the research: Study Area The study area will be the mine site and the two communities within the mines namely Poboase, Etwebo and Akoti. Sampling Method There will be two study groups. The workers of the Chirano Gold Mines Limited will be one study group with members of the two communities forming the second study group. Random sampling will be used in getting these two study groups. Each study group will comprise of 100 subjects irrespective of gender. In total, 200 subjects will be involved in this study. Questionnaire Study subjects will administered with questionnaire to ascertain their demographics, medical history, activity levels information, general household characteristics and their lung function tests. The questionnaire will be administered to subjects by student researcher. (Find attached) 76 Lung Function Tests An instrument (vitalograph) will be used to measure the lung function of study participants and the value compared with the predicted values. Risk(s): There is no risk in taking part of this study. Benefit(s): The goal of this study is to help reduce incidences of respiratory problems caused by air pollution and hence the results of the study will inform policy makers to take action in favour of the communities. The participants of this study will have the opportunity to know their Lung function status after their participation in the study. Confidentiality: All information collected in this study will be given code numbers. Though names will be recorded they will only be used to aid give result of the tests to participants. No name or identifier will be used in any publication or reports from this study. However, as part of our responsibility to conduct this research properly, ethics committees can have access to your records. Voluntariness: Taking part in this study should be out of your own free will. You are not under obligation to participate in this research. Taking part in this research is entirely voluntary. Alternatives to participation: If you choose not to participate in this study, nothing or no punishment will be meted out to you. Withdrawal from the research: You may choose to withdraw from the research at anytime without having to explain yourself. You may also choose not to answer any question you find uncomfortable or private. Consequence of Withdrawal: There will be no consequence, loss of benefit to you if you choose to withdraw from the study. Please note however, that some of the information that may have been obtained from you with identifiers (name etc) will not be used in the analysis of the result. We do promise to make good faith effort to comply with your wishes as much as practicable. Costs/Compensation: There is no compensation for participating in this study. Contacts: If you have any question concerning this study, please do not hesitate to contact Dr. Jacob Plange-Rhule of the Physiology Department of School of Medical Sciences and Mr. Godfred Owusu-Boateng of Renewable Natural Resources, all of KNUST). 77 Further, if you have any concern about the conduct of this study, your welfare or your rights as a research participant, you may contact: The Chairman Committee on Human Research and Publication Ethics Kumasi Tel: 22301-4 ext 1098 or 020 5453785 78 CONSENT FORM Statement of person obtaining informed consent: I have fully explained this research to ____________________________________ and have given sufficient information, including that about risks and benefits, to enable the prospective participant make an informed decision to or not to participate. DATE: _____________________ SIGNATURE: _____________________________ NAME: ______________________________________________ Statement of person giving consent: I have read the information on this study/research or have had it translated into a language I understand. I have also talked it over with the interviewer to my satisfaction. I understand that my participation is voluntary (optional). I know enough about the purpose, methods, risks and benefits of the research study to judge that I want to take part in it. I understand that I may freely stop being part of this study at any time. I have received a copy of this information leaflet and consent form to keep for myself. Name___________________________________________________________________ DATE: ____________ SIGNATURE/THUMB PRINT: ___________________ WITNESS’ SIGNATURE (maintain if participants could be non-literate): ______________ WITNESS’ NAME: ______________________________________________________ 79 Appendix 12. Participants‘ Questionnaire KWAME NKRUMAH UNIVERSITY OF SCIENCE AND TECHNOLOGY, KUMASI DEPARTMENTS OF MATERIALS ENGINEERING/ PHYSIOLOGY RESPIRATORY HEALTH QUESTIONNAIRE SUBJECT ID______________________ NAME OF SUBJECT___________________________________________________ AGE___________ ( Actual / Estimated ) BIRTH_____________________ SEX: DATE OF MALE / FEMALE HEIGHT________________( in centimeters) WEIGHT________________(in kilograms) PHONE NUMBER (IF ANY)__________________________________________________ HOME ADDRESS _________________________________________________________ RACE/ ETHNICITY__________________ PROFESSION___________________________ PLACE OF WORK________________________ SYMPTOMS 1. Do you currently have any of the following symptoms of pulmonary or lung illness? a. Shortness of breath: Yes / No b. Shortness of breath when walking fast on level ground or walking up a slight hill or incline: Yes / No c. Shortness of breath when walking with other people at an ordinary pace on level ground: Yes / No 80 d. Have to stop for breath when walking at your own pace on level ground: Yes / No e. Shortness of breath when walking or dressing yourself: Yes / No f. Shortness of breath that interferes with your job: Yes / No g. Coughing that produces phlegm (thick sputum): Yes / No h. Coughing that wakes you early in the morning: i. Coughing that occurs when you are mostly lying down: Yes / No j. Coughing up blood in the last month: Yes / No k. Wheezing: l. Wheezing that interferes with your job: No Yes / No m. Chest pain when you breath deeply: n. Yes / Yes / No Yes / No Any other symptoms that you think would be related to lung problems: Yes / No 2. Are you now under the care of a health care provider for any breathing problem? Yes / No 3. Are you now taking any medicines or using inhalers for breathing problems? Yes / No 4. If you have any of the symptoms above, do you think they are caused by dust, smoke or chemicals at work? Yes / No / Not Sure 81 SMOKING HISTORY 1. 2. 3. Have you ever smoked in your entire life? Yes / No a. If yes, for how long have you been smoking__________________ Do you currently smoke? Yes / No a. If Yes, how many per day? _______________ b. If Yes, how many per week? ________________ Which area do you smoke most? Indoors / Outdoors PHYSICAL ACTIVITY 1. Does your work involve vigorous- intensity activity that causes large increases in breathing or heart rate (like carry or lifting heavy load, digging or construction for at least 10 mins) Yes / No a. In a typical week, how many days do you do these activities as part of your work? _________ b. How much time do you spend to do these activities? __ __: __ __ (hrs:mins) 2. Does your work involve moderate- intensity activity that causes small increases in breathing or heart rate such as brisk walking or carrying light loads for at least 10 mins? Yes / No a. In a typical week, how many days do you do these activities as part of your work? _________ b. How much time do you spend to do these activities? __ __: __ __ (hrs:mins) 3. How often do you travel out of this community to other places? ____________ Per week ____________ Per month ____________ Per year HOUSEHOLD CHARACTERISTICS 1. How many people are part of this household, including yourself, and what gender are they? [The household is defined as people who normally live and eat together in the household, sleeping at least 4 nights per week in the household on a regular basis] __ __ (1) males __ __ (2) females 82 2. How many of the household members are in the following age ranges. Include yourself. ___ (1) 0-2 years old ___ (2) 3-15 ___ (3) 16-40 ___ (4) 40-65 ___ (5) over 65 3. How many of the household members are currently enrolled in school? __ __ 4. How many rooms are used by your household? ________ 5. Where do your household cook? Open Space / Indoor 6. How much time is used in cooking in your household? ______ 7. What is the main fuel used for cooking? __ (1) Firewood __ (2) Charcoal __ (3) Kerosene/oil __ (4) Gas __ (5) Electricity __ (6) Crop residue/ saw dust __ (7) Animal waste __ (8) Other (please name other fuel:_____________________________) 8. What is the main fuel used for lighting? __ (1) Kerosene/paraffin __ (2) Gas __ (3) Electricity __ (4) Generator __ (5) Battery __ (6) Candles __ (7) Firewood __ (8) Other (please name other fuel:_____________________________) 9. What is the material of the roof of the house? __ (1) Mud __ (2) Thatch __ (3) Wood __ (4) Iron/ Aluminum sheets __ (5) Cement/ concrete __ (6) Roofing tiles __ (7) Asbestos 83 __ (8) Other (please name other roofing material:_________________________) 10. What is the material of the walls of the house? __ (1) Mud/ mud brick __ (2) Stone __ (3) Burnt bricks __ (4) Iron/ Aluminum sheets __ (5) Cement/ sandcrete __ (6) Wood/Bamboo __ (7) Cardboard __ (8) Other (please name other wall material:___________________________) 11. Do you use electric fan in your room? Yes / No 12. What do you think about the ventilation in your room? __ (1) Excellent __ (2) Very Good __ (3) Good __ (4) Fair __ (5) Poor __ (6) Very Poor 13. What type of toilet facility does your household have? __ (0) None __ (1) Flush to sewer __ (2) Flush to septic tank __ (3) Pan/bucket __ (4) Covered pit latrine __ (5) Uncovered pit latrine __ (6) Ventilation improved pit latrine __ (7) Other (please name other type:_____________________________) a. If Public, how long do you have to walk before you get to the fac ility? ____________ 84 LUNG FUNCTION TESTS RESULT Date of Measurements: ________________________ Results PREDICTED ACTUAL 85 Appendix 13. Result of two participants as printed by the vitalograph 86

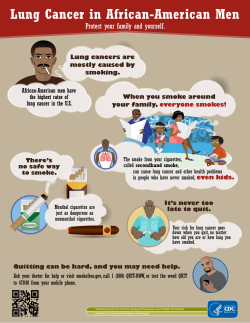


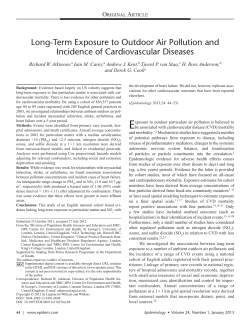


© Copyright 2026