
Document 2634
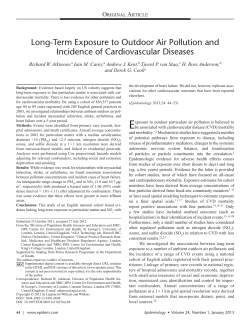
Nature Reviews Cancer | AOP, published online 8 August 2013; doi:10.1038/nrc3572 SCIENCE AND SOCIETY Air pollution: a potentially modifiable risk factor for lung cancer Laís Fajersztajn, Mariana Veras, Ligia Vizeu Barrozo and Paulo Saldiva Abstract | Economic growth and increased urbanization pose a new risk for cancer development: the exposure of high numbers of people to ambient air pollution. Epidemiological evidence that links air pollution to mortality from lung cancer is robust. An ability to produce high-quality scientific research that addresses these risks and the ability of local health authorities to understand and respond to these risks are basic requirements to solve the conflict between economic development and the preservation of human health. However, this is currently far from being achieved. Thus, this Science and Society article addresses the possibilities of expanding scientific networking to increase awareness of the risk of lung cancer that is promoted by air pollution. Determining the contribution of potentially modifiable risk factors (also known as cause-specific analysis for cancer) is crucial to implement cancer-preventive health policies1. Air pollution — household air pollution from burning solid fuels (for heating and cooking) and ambient particulate matter — was listed as one of the ten leading risk factors for the global burden of disease in 2010 (REF. 1). Most of these diseases are due to respiratory and cardiovascular events2–5, but cancer is also an important outcome1,3,5–11. Lung cancer has the most robust association with prolonged exposure to air pollution, particularly when pollution is expressed in terms of particulate matter or gaseous components of air pollution. In fact, as exposure to higher concentrations of particulate matter increases, lung cancer becomes proportionally more important than cardiovascular events to the burden of disease11. For lung cancer mortality, excess risks rose nearly linearly throughout the full range of exposure to particulate matter, with a median aerodynamic diameter of less than 2.5 μm (PM2.5; fine particulate matter), whereas the slope of the curve for cardiovascular mortality was less steep. Currently, 8% of global lung cancer deaths can be attributed to exposure to fine particulate matter alone3, although this estimate can be much higher (12.8%; confidence interval (CI) 95% = 5.9–18.5) if fine particles that are generated from human activity (as determined from satellite-derived assessments) are taken into account 12. The dose– response relationship relating lung cancer and ambient particulate matter might be higher then previously estimated, particularly if only adenocarcinomas of the lung are considered. A recent European report that combined 17 long-term cohort studies in nine European countries identified a risk of 1.55 per 5 μg per m³ of PM2.5 (hazard ratio 1.55; 95% CI = 1.05–2.29)51. There is also a growing body of evidence that associates air pollution exposure to an increased risk of cancer in other tissues, such as the breast 13–16, haematopoietic tissues17,18 and the urinary tract 7,19–22. Air pollution and global burden of disease Exposure to outdoor air pollution is expected to become the top environmental cause of premature mortality globally by 2050, overtaking malaria and water quality, which are traditional environmental risks for premature deaths, and the numbers of deaths from both of these are expected to fall over the same period23. The effect will be greater in developing countries that are not members of the Organization for Economic Cooperation and Development (OECD): these countries include Brazil, Russia, India, Indonesia, China and South Africa (BRIICS), as well as developing countries in the rest of the world23. There are densely populated regions in the world that have high air pollution concentrations (FIG.1), especially megacities of developing nations. Fast urban and industrial development in these countries has resulted in growing demands for energy and rising expectations of material goods24. Therefore, megacities combine both concentrated emissions of air pollutants and large numbers of exposed people25. NATURE REVIEWS | CANCER PERSPECTIVES On a minor scale, hot spots of vulnerability can even occur in developed urban settings26. It is important to note that most of the epidemiological evidence relating air pollution to lung cancer has reported a linear dose–response effect 3,9,10,27–35,51 (TABLE 1). However, these studies were carried out in the United States3,9,10,31,32 or Europe27–30,51, which are areas with substantially lower levels of air pollution than those of developing countries. Studies in areas with higher pollution levels and high population levels are scarce33–35 (TABLE 1) and are badly needed. Thus, this Science and Society article addresses the possibility of expanding scientific networking to increase awareness of the risk of lung cancer that is promoted by air pollution, especially in areas of the world where pollution is likely to be a substantial risk factor for lung cancer development and death. Air pollution and cancer risk Although the relative risk of developing cancer as a result of exposure to air pollution is generally small, the attributable risk (relative risk multiplied by the number of exposed people) is high, transforming ambient air pollution into the most significant environmental risk factor for lung cancer 1. Indeed, lung cancer burden from air pollution is probably underestimated. Most of the long-term exposure studies for this pollutant have been carried out in areas where annual average concentrations range between 5 μg and 35 μg per m3; however, the average concentrations of particulate matter in the major population centres of China, India and other developing countries are often much higher, and can exceed 100 μg per m3 according to recent estimates25. Specific pollutants or complex mixtures? Particulate matter can be considered as a mixture of air pollution sources that are present in the urban atmosphere rather than as a single pollutant. Particulate matter represents a complex mixture of solid and liquid components, which can vary substantially in composition and size depending on the emission source and prevailing weather conditions36. The composition and size of these particles determine the potential for deposition in the respiratory tract and the health effects that are associated with exposure37. Particles are classified according to their size, which can range from 0.005 μm to 100 μm in diameter. The smaller the size of the particle the greater its potential to penetrate deep into the respiratory tract 36. ADVANCE ONLINE PUBLICATION | 1 © 2013 Macmillan Publishers Limited. All rights reserved PERSPECTIVES PM10 (μ per m3) No data 5–20 21–30 31–50 51–70 71–142 Population density (people per square km of land area) No data 0.1–15.1 15.2–40.4 40.5–67.9 68.0–101.7 101.8–158.0 158.1–313.6 313.7–19,416.3 Figure1 | Global annual mean PM10 concentrations in 2009 by population density. The map comNature Reviews | Cancer pares the population density in 2009 (data from the World Bank49) with the annual mean concentration of particulate matter of 100 μm or less (PM10) in 2009 (data from the World Bank50). The composition of these particles includes different classes of organic and inorganic chemicals, such as heavy and transition metals, organic compounds, hydrocarbons, ions, condensed reactive gas products and microorganisms. At higher concentrations the particles can also include micro organismal products (such as endotoxins), nitrates, sulphates and elemental carbon. Some of these particulates, such as polycyclic aromatic hydrocarbons, are known carcinogens37,38. Recently, diesel emissions, a substantial contributor to urban particles, were considered to be class I carcinogens by the International Agency of Research on Cancer 38, meaning that there is scientific evidence of carcinogenicity in humans. In European and some Asian studies, significant associations were obtained relating lung cancer risk to gaseous components of air pollution, such as NO2 and SO2 (REFS 28–30,34,35). NO2 has been shown to be a good indicator of traffic-related pollution39, and SO2 can be used to estimate diesel and industrial emissions. It is important to note that large cohort studies on lung cancer and air pollution rely on measures of specific pollutants. However, the atmosphere contains many compounds with known carcinogenic potential, such as polycyclic aromatic hydrocarbons and heavy metals, levels of which are not routinely measured. Thus, in such a complex mixture, it is difficult to ascribe the responsibility of causing lung cancer to a single component. Until a clear patho genetic mechanism is defined, it would be prudent to consider the pollutants mentioned above as possible substitute markers of sources of air pollution, such as traffic or industrial pollution. Air pollution control The National Ambient Air Quality Standards (NAAQS), set up in the United States as part of the Clean Air Act, has been effective in controlling air quality 40, and it is a policy that has been recommended by the World Health Organization since 1987 (REF. 41). The stringency of air pollution control procedures varies substantially worldwide42. Indeed, a comprehensive global analysis that reviewed the 24‑hour NAAQS for PM10 (particulate matter with a median aerodynamic diameter of less than 10 μm) revealed a positive correlation between the stringency of the NAAQS and the average annual exposure to PM10, meaning that less stringent air quality standards lead to higher air pollution concentrations42. Efforts to control the sources of ambient air pollution should be considered a public health strategy to reduce lung cancer incidence, similar to the strategies that apply to tobacco and asbestos. 2 | ADVANCE ONLINE PUBLICATION The process of reducing the use of asbestos and tobacco raised considerable public health controversies, which were driven by political, economic and individual liberty arguments. In the case of air pollution, the adoption of effective policies to control emission levels will be conceivably more challenging, as these policies will call into question our present use of energy and our apparently unbreakable dependence on personal motorized vehicles. Energy production — including oil and thermoelectric power — and the automobile industry represent enormous economic interests, and ‘modern life’ is based on increased energy use, which has become incorporated into our culture. Thus, a reduction in particulate matter levels will demand a considerable behavioural change. Traffic is one of the major sources of particulate matter 39. Substantial technological advances have improved the efficiency of the nineteenth century internal combustion engine, leading to a reduction of air pollution concentrations. However, although air pollution from motorized vehicles has decreased in cities in Europe and North America as a result of more efficient petrol and diesel engines, it has not decreased as much as was hoped25. This is because the increase in road traffic and the resulting decrease in vehicle velocity are offsetting the gains that have been made by better car technology. In São Paulo, Brazil, particulate matter concentrations were decreasing progressively from 1996 to 2004, but they have remained unchanged since 2004 (REF. 43), indicating that technology alone will not be a solution if the numbers of vehicles and their intensity of use continue to increase. The same is true for the generation of electricity based on fossil fuels (coal, petroleum and gas); 40% of the electricity produced worldwide is currently generated from the combustion of coal, and this percentage is expected to rise in the next few decades as worldwide energy demands increase44. Thus, this will offset any improvements to levels of particular matter that have been gained through the use of modern thermoelectric power plants45,46. Moreover, the technological benefits of more advanced combustion engines and energy generation processes are not evenly distributed across the globe. One particularly difficult challenge is to tackle the lack of access to clean energy and the dependence of many people in low-income settings on inefficient and inadequately ventilated burning of biomass for household energy needs44,47,48. In this scenario, there are links between indoor and outdoor sources www.nature.com/reviews/cancer © 2013 Macmillan Publishers Limited. All rights reserved PERSPECTIVES Table 1 | Key studies relating air pollution to lung cancer Study Setting N (follow-up period) Pollutant considered Estimated risk Adjustments Black smoke concentration RR (95% CI) = 1.47 (1.01–2.16) for never smokers; 0.91 (0.68–1.23) for ex-smokers; and 0.85 (0.70–1.03) for current smokers Age, sex, smoking status and SES Black smoke (10 μg per m3) RR (95% CI) = 1.03 (0.78–1.34) NO2 (30 μg per m3) RR (95% CI) = 0.86 (0.57–1.29) PM2.5 (10 μg per m ) RR (95% CI) = 0.65 (0.41–1.04) SO2 (20 μg per m3) RR (95% CI) = 1.01 (0.67–1.54) Black smoke (10 μg per m3) RR (95% CI) = 1.03 (0.88–1.20) NO2 (30 μg per m3) RR (95% CI) = 0.91 (0.72–1.15) PM2.5 (10 μg per m ) RR (95% CI) = 1.06 (0.82–1.38) SO2 (20 μg per m3) RR (95% CI) = 1.00 (0.79–1.26) Europe Beelen et al.27 Netherlands 111,378 (1986–1997) 3 Brunekreef Netherlands 120,000 (1987–1996) et al.28 3 Age, sex, smoking status and SES Cesaroni et al.29 Italy 1,265,058 (2001–2010) NO2 (10 μg per m ) HR (95% CI) = 1.04 (1.02–1.07) Age, sex, marital status, place of birth, education, occupation and area-based socioeconomic position Heinrich et al.30 Germany 4,800 (1980–2008) NO2 (16 μg per m3) HR (95% CI) = 1.25 (0.72–2.17) Age, smoking status and education PM10 (7 μg per m3) HR (95% CI) = 1.97 (0.59–6.57) RaaschouNielsen et al.51 Nine European countries PM10 (10 μg per m3) HR (95% CI) = 1.22 (1.03–1.45) for Age, sex, smoking status and SES all lung cancers; 1.51 (1.10–2.08) for adenocarcinomas of the lung PM2.5 (5 μg per m3) HR (95% CI) = 1.18 (0.96–1.46) for all lung cancers; 1.55 (1.05–2.29) for adenocarcinomas of the lung 312.944 (mean of 12.8 years) 3 North America Dockery et al.31 United States 8,111 (1974–1991) PM2.5 (18.6 μg per m3) AMR (95% CI) = 1.37 (0.81–2.31) Age, sex, smoking status, education, occupational exposure and medical history Jerrett et al.32 United States 22,905 (1982–2000) PM2.5 (10 μg per m3) HR (95% CI) = 1.44 (0.98–2.11) Forty-four individual level covariates, including income, race and SES Krewski et al.9 United States 1,200,000 (1999–2000) PM2.5 (10 μg per m3) HR (95% CI) = 1.142 (1.057–1.234) Forty-four individual level covariates, including income, race and social factors Pope et al.3 United States 1,200,000 (1979–1983) PM2.5 (10 μg per m3) RR (95% CI) = 1.08 (1.01–1.16) 1,200,000 (1999–2000) PM2.5 (10 μg per m3) RR (95% CI) = 1.13 (1.04–1.22) 1,200,000 (1982–1998) PM2.5 (10 μg per m3) RR (95% CI) = 1.14 (1.04–1.23) 188,699 (1979–1983) PM2.5 (10 μg per m3) HR (95% CI) = 1.15 (0.99–1.35) 188,699 (1999–2000) PM2.5 (10 μg per m ) HR (95% CI) = 1.27 (1.03–1.56) 188,699 (1982–2008) PM2.5 (10 μg per m3) HR (95% CI) = 1.19 (0.97–1.47) China 70,947 (1991–2000) SO2 (10 μg per m3) ΔM (95% CI) = 4.2 (2.3–6.2) Age, sex, smoking status, education, BMI, alcohol consumption, physical activity and hypertension Kantanoda Japan et al.34 63,520 (1974–1983) PM2.5 (10 μg per m3) HR (95% CI) = 1.23 (1.09–1.38) SO2 (10 μg per m3) HR (95% CI) = 1.19 (0.97–1.45) Age, sex, smoking status, diet and indoor charcoal or briquette braziers used for heating NO2 (10 μg per m3) HR (95% CI) = 1.15 (1.06–1.24) NO2 (10 μg per m3) HR (95% CI) = 1.20 (1.03–1.40) Turner et al.10 United States 3 Age, sex, smoking status, marital status, education, occupational exposure, race, BMI, alcohol consumption and diet Age, sex, passive smoking, marital status, education, occupational exposure, race, BMI, diet, prevalent lung disease and radon exposure Asia Cao et al.33 Yorifuji et al.35 Japan 14,001 (1999–2009) Age, sex, smoking status, BMI, hypertension, diabetes, financial capability and area mean income AMR, adjusted mortality rate ratio; BMI, body mass index; CI, confidence interval; ΔM, percentage increase in mortality; HR, hazard ratio; PM2.5, particulate matter with a median aerodynamic diameter of less than 2.5 μm; PM10, particulate matter with a median aerodynamic diameter of less than 10 μm; RR, relative risk; SES, socioeconomic status. NATURE REVIEWS | CANCER ADVANCE ONLINE PUBLICATION | 3 © 2013 Macmillan Publishers Limited. All rights reserved PERSPECTIVES a PM10 (μ per m3) b No data 5–20 21–30 31–50 51–70 71–142 Air pollution articles c Water quality articles 1 10 1,000 d 1 10 Malaria articles 1,000 Figure 2 | A comparison of scientific research output on various global health issues. Global annual mean PM 10 (particulate matter with a median aerodynamic diameter of less than 10 μm) concentration (μg per m3) in 2009 (part a)49. Number of articles in environmental public health published between March 1983 and March 2013 on air of pollution, as a substantial proportion of outdoor air pollution may derive from poor household fuel combustion, particularly in Asia44. Science-based control of air pollution? Theoretically, good scientific research is necessary to provide the basis for the implementation of policies that aim to control harmful environmental agents, helping society to decide a course of action once the apparent dilemma between preservation of human health and economic growth becomes more widely appreciated. In fact, governments that have a greater expenditure on health care have more stringent air quality standards, probably because of greater governmental 1 10 1,000 pollution (part b), water quality (part c) and malaria (part d), according Nature Reviews | Cancer to data from the Web of Science database. Search terms used were air pollution (part b), water quality (part c) and malaria (part d). The public environmental and occupational health filter was used for all searches. awareness of the adverse health effects of air pollution and the consequent establishment of air pollution control measures to avoid increased health costs42. In this context, it would be interesting to know whether there is enough scientific research in air pollution hot spots to drive public policies that aim to reduce the problem. FIGURE 2 depicts a comparative panel of the number of papers produced from 1983 to date on malaria, water quality and air pollution, using the Web of Science database. There is a marked imbalance between levels of air pollution and local scientific production: a more balanced scenario emerges when waterborne diseases and malaria are considered. Developing rest of the world countries contribute to almost 4 | ADVANCE ONLINE PUBLICATION 20% of all the research on water quality and to approximately 70% of the research on malaria, but to only 5% of all air pollution papers. A 2012 report from the World Meteorological Organization25 about the effects of megacities on air pollution and climate identified 11 international collaborative research projects, but only 50% focused on developing regions. Conclusions and future directions Sources of air pollution are unequivocally linked to economic activities; therefore, it is important to devise strategies to increase the collaboration between developed and developing nations to address the health effects of air pollution. Gains in scientific www.nature.com/reviews/cancer © 2013 Macmillan Publishers Limited. All rights reserved PERSPECTIVES knowledge and global partnerships were effective in reducing the cancer risks associated with other environmental health issues, such as tobacco smoke and asbestos. Is now the time to do the same for air pollution? Laís Fajersztajn, Mariana Veras and Paulo Saldiva are at the Laboratory of Experimental Air Pollution (LIM05), Department of Pathology, School of Medicine, University of São Paulo, São Paulo 01246-903, São Paulo State, Brazil. Ligia Vizeu Barrozo is at the Department of Geography, School of Philosophy, Literature and Human Sciences, University of São Paulo, São Paulo 05508-009, São Paulo State, Brazil. Correspondence to P.S. e-mail: [email protected] doi:10.1038/nrc3572 Published online 8 August 2013 1.Lim, S. S. et al. A comparative risk assessment of burden of disease and injury attributable to 67 risk factors and risk factor clusters in 21 regions, 1990–2010: a systematic analysis for the Global Burden of Disease Study 2010. Lancet. 380, 2224–2260 (2012). 2. Clancy, L., Goodman, P., Sinclair, H. & Dockery, D. W. Effect of air-pollution control on death rates in Dublin, Ireland: an intervention study. Lancet 360, 1210–1214 (2002). 3. Pope, C. A. et al. Lung cancer, cardiopulmonary mortality and long-term exposure to fine particulate air pollution. JAMA 287, 1132–1141 (2002). 4. Pope, C. A., Ezzati, M. & Dockery, D. W. Fine-particulate air pollution and life expectancy in the United States. New Engl. J. Med. 360, 376–386 (2009). 5. Lepeule, J., Laden, F., Dockery, D. & Schwartz, J. Chronic exposure to fine particles and mortality: an extended follow-up of the Harvard six cities study from 1974 to 200. Environ. Health Persp. 120, 965–970 (2012). 6.Vineis, P. et al. Lung cancers attributable to environmental tobacco smoke and air pollution in nonsmokers in different European countries: a prospective study. Environ. Health 6, 1–7 (2007). 7.Vineis, P. et al. Genetic susceptibility according to three metabolic pathways in cancers of the lung and bladder and in myeloid leukemias in nonsmokers. Ann. Oncol. 18, 1230–1242 (2007). 8. Fang, Y., Naik, V., Horowitz, L. W. & Mauzerall, D. L. Air pollution and associated human mortality: the role of air pollutant emissions, climate change and methane concentration increases from the preindustrial period to present. Atmos. Chem. Phys. 13, 1377–1394 (2013). 9.Krewski, D. et al. Extended follow-up and spatial analysis of the American Cancer Society study linking particulate air pollution and mortality. Res. Resp. Health Eff. Inst. 5–114 (2009). 10. Turner, M. C. et al. Long-term ambient fine particulate matter air pollution and lung cancer in a large cohort of never-smokers. Am. J. Respir. Crit. Care Med. 184, 1374–1381(2011). 11.Pope, C. A. et al. Lung cancer and cardiovascular disease mortality associated with ambient air pollution and cigarette smoke: shape of the exposureresponse relationships. Environ. Health Perspect. 119, 1616–1621 (2011). 12.Evans, J. et al. Estimates of global mortality attributable to particulate air pollution using satellite imagery. Environ. Res. 120, 33–42 (2013). 13. Crouse, D. L., Goldberg, M. S., Ross, N. A., Chen, H. & Labrèches, F. Postmenopausal breast cancer is associated with exposure to traffic-related air pollution in Montreal, Canada: a case–control study. Environ. Health Persp. 118, 1578–1583 (2010). 14. Chen, F. & Bina, W. F. Correlation of white female breast cancer incidence trends with nitrogen dioxide emission levels and motor vehicle density patterns. Breast Cancer Res. Treat. 132, 327–333 (2012). 15.Nie, J. et al. Exposure to traffic emissions throughout life and risk of breast cancer: the Western New York Exposures and Breast Cancer (WEB) study. Cancer Causes Control 18, 947–955 (2007). 16. Wei, Y., Davis, J. & Bina, W. F. Ambient air pollution is associated with the increased incidence of breast cancer in US. Int. J. Environ. Health Res. 22, 12–21 (2012). 17. Whitworth, K. W. Symanski, E. Coker, A. L. Childhood lymphohematopoietic cancer incidence and hazardous air pollutants in southeast Texas, 1995–2004. Environ. Health Persp. 116, 1576–1580 (2008). 18. Weng, H. H., Tsai, S. S., Chiu, H. F., Wu, T. N. & Yang, C. Y. Childhood leukemia and traffic air pollution in Taiwan: petrol station density as an indicator. J. Toxicol. Environ. Health A 72, 83–87 (2009). 19. Liu, C. C., et al. Ambient exposure criteria pollutants risk death from bladder cancer Taiwan. Inhal. Toxicol. 21, 48–54 (2009). 20.Castaño-Vinyals, G. et al. Air pollution and risk of urinary bladder cancer in a case-control study in Spain. Occup. Environ. Med. 65, 56–60 (2008). 21. Tsai, S. S., Tiao, M. M., Kuo, H. W., Wu, T. N. & Yang, C. Y. Association of bladder cancer with residential exposure to petrochemical air pollutant emissions in Taiwan. J. Toxicol. Environ. Health A 72, 53–59 (2009). 22. Colli, J., Lee, B. R. & Thomas, R. Population densities in relation to bladder cancer mortality rates in America from 1950 to 1994. Int. Urol. Nephrol. 44, 443–449 (2012). 23. OECD. Environmental outlook to 2050: the consequences of inaction. The Organisation for Economic Co-operation and Development [online], http://www.oecd.org/environment/oecdenvironmental outlookto2050theconsequencesofinaction.htm (2012). 24. Wilkinson, P., Smith, K. R., Beevers, S., Tonne, C. & Oreszczyn, T. Energy and Health 4: Energy, energy efficiency, and the built environment. Lancet. 370, 1175–1187 (2007). 25. WMO/IGAC. Impacts of Megacities on Air Pollution and Climate [online], http://www.wmo.int/pages/prog/ arep/gaw/gaw-reports.html (2012). 26. James, W., Jia, C. & Kedia, S. Uneven magnitude of disparities in cancer risks from air toxics. Int. J. Environ. Res. Publ. Health. 9, 4365–4385 (2012). 27.Bellen, R. et al. Long-term exposure to traffic-related air pollution and lung cancer risk. Epidemiology. 19, 702–710 (2008). 28.Brunekreef, B. et al. Effects of long-term exposure to traffic-related air pollution on respiratory and cardiovascular mortality in the Netherlands: the NLCS-AIR study. Res. Rep. Health Eff. Inst. 5–71 (2009). 29.Cesaroni, G. et al. Long-term exposure to urban air pollution and mortality in a cohort of more than a million adults in Rome. Environ. Health Persp. 121, 324–331 (2013). 30.Heinrich, J. et al. Long-term exposure to NO2 and PM10 and all-cause and cause-specfip mortality in a prospective cohort of women. Occup. Environ. Med. 70, 179–186 (2013). 31.Dockery, D. W. et al. An association between air pollution and mortality in six US cities. New Engl. J. Med. 329, 1753–1759 (1993). 32.Jerret, M. et al. Spatial analysis of air pollution and mortality in Los Angeles. Epidemiology. 16, 727–736 (2005). 33.Cao, J. et al. Association between long-term expousure to outdoor air pollution and mortality in China: a cohort study. J. Hazard. Mater. 189, 1594–1600 (2011). 34.Kantanoda, K. et al. An association between long-term exposure to ambient air pollution and mortality from lung cancer and respiratory diseases in Japan. J. Epidemiol. 21, 132–143 (2011). NATURE REVIEWS | CANCER 35.Yorifuji, T. et al. Long-term expousure to traffic-related air pollution and the risk of death from hemorrhagic stroke and lung cancer in Shizuoka, Japan. Sci. Total Environ. 443, 397–402 (2013). 36. Health Effects Institute. Understanding the Health Effects of Components of the Particulate Matter Mix: Progress and Next Steps. (HEI, 2002). 37. Pope, C. A. & Dockery, D. W. Health effects of fine particulate air pollution: lines that connect. J. Air. Waste. Manag. Assoc. 56, 709–742 (2006). 38.Benbrahim-Tallaa, L. et al. Carcinogenicity of dieselengine and gasoline-engine exhausts and some nitroarenes. Lancet Oncol. 13, 663–664 (2012). 39.Beckerman, B. et al. Correlation of nitrogen dioxide with other traffic pollutants near a major expressway. Atmospher. Environ. 42, 275–290 (2008). 40. Van Erp, A. M., O’Keefe, R., Cohen, A. J., Warren, J. Evaluating the effectiveness of air quality interventions. J. Toxicol. Environ. Health A 71, 583–587 (2008). 41. World Health Organization. Air quality guidelines: global update 2005. (WHO, 2006). 42. Vahlsing, C. & Smith, K. R. Global review of national ambient air quality standards for PM10 and SO2 (24 h). Air Qual. Atmos. Health 5, 393–399 (2012). 43. Companhia Ambiental do Estado do São Paulo. Qualidade do ar no estado de São Paulo 2012. (in Portugese) [online], http://www.cetesb.sp.gov.br/ar/ qualidade-do-ar/31-publicacoes-e-relatorios (2013). 44.Smith, K. R. et al. Energy and Human Health. Annu. Rev. Publ. Health 34, 159–188 (2013). 45. Coal Industry Advisory Board. Power generation from coal: measuring and reporting efficiency performance and CO2 emissions. [online], http://www.iea.org/ciab/ papers/power_generation_from_coal.pdf (2010). 46. EURACOAL. Coal Industry across Europe. [online], http://www.euracoal.be/pages/medien. php?idpage=917 (2013). 47. Wilkinson, P., Smith, K. R., Beevers, S., Tonne, C. & Oreszczyn, T. Energy and Health 4: Energy, energy efficiency, and the built environment. Lancet 370, 1175–1187 (2007). 48. Markandya, A. & Wilkinson, P. Energy and Health 2: Electricity generation and health. Lancet 370, 979–990 (2007). 49. World Bank. Population density (people per sq. km of land area). [online], http://data.worldbank.org/ indicator/EN.POP.DNST?order=wbapi_data_ value_2010+wbapi_data_value+wbapi_data_valuelast&sort=asc (2012). 50. World Bank. PM10, country level (micrograms per cubic meter). [online], http://data.worldbank.org/ indicator/EN.ATM.PM10.MC.M3?order=wbapi_data_ value_2009 wbapi_data_value+wbapi_data_valuelast&sort=desc (2012). 51.Raaschou-Nielsen, O. et al. Air pollution and lung cancer incidence in 17 European cohorts: prospective analyses from the European Study of Cohorts for Air Pollution Effects (ESCAPE). http://dx.doi.org/10.1016/ S1470-2045(13)70279-1 (2013). Acknowledgements This work was partly supported by grants (number 573813/2008‑6) from CNPq (Conselho Nacional de Desenvolvimento Científico e Tecnológico) and by grant (number 12/19266‑8) from FAPESP (Fundação de Amparo a Pesquisa do Estado de São Paulo). P.S., L.V.B. and L.F. developed the ideas in the article. L.F. and L.V.B. designed the maps. L.F. and M.V. carried out the literature review, and L.F., M.V., L.V.B. and P.S. wrote the article. The authors collected the relevant literature on cancer effects and air pollution by searching the Web of Science database for papers published from 1981 to date using the terms air pollution and cancer, and by applying the public environmental and occupational health filter. Competing interests statement The authors declare no competing financial interests. DATABASES Web of Science: http://thomsonreuters.com/web-of-science/ ALL LINKS ARE ACTIVE IN THE ONLINE PDF ADVANCE ONLINE PUBLICATION | 5 © 2013 Macmillan Publishers Limited. All rights reserved


© Copyright 2026