
WHO Air Quality Newsletter: Clean Air Plans, Health Risks, EU Legislation
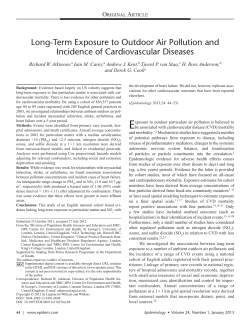
NEWSLETTER WHO COLLABORATING CENTRE FOR AIR QUALITY MANAGEMENT AND AIR POLLUTION CONTROL at the FEDERAL ENVIRONMENT AGENCY GERMANY No. 44 December 2009 Contents Evaluation of Clean Air Plans in North Rhine-Westphalia, Germany Exposure and Health Effects in the Ruhr District and in Düsseldorf 2 Case Study of Human Health Risk Assessment due to transport-related Air Pollution in Ukraine 5 Harmonisation with EU Legislation in the 10 Field of Air Quality Measurements in Bulgaria Notes and News 12 Meetings and Conferences 13 Publications 17 Coming Events 19 NEWSLETTER ________________________________________________________________________ Evaluation of Clean Air Plans in North Rhine-westphalia, Germany – Exposure and health effects in the ruhr district and in düsseldorf Diana Hein Framework and Project Contents The environmental policy of North RhineWestphalia (NRW) is focussed on the implementation of the EU-Directives on Air Quality and Ambient Noise. Particularly the exceedances of the health relevant limit values for particulate matter (PM10) and nitrogen dioxide (NO2) lead to considerable efforts to improve the situation regarding ambient air quality. Within the framework of the Action Programme Environment and Health NRW (APUG NRW) a number of practice-oriented projects have been carried out on the topic of transport in the last years to assess and evaluate the potentials of PM10 and NO2 emission reductions and the impact on environment and health linked to them (Ministry of the Environment 2003, 2004 and 2006). They provided basic information and tools for action and clear air plans. On 4 August 2008 the Ruhr District Clean Air Plan, the first clean air plan in the EU on regional scale (with three concerted component plans) has been established (Partial Plans 2008). The effectiveness of more than 80 measures for each of the component plans will be appraised in a comprehensive evaluation programme. The results of this evaluation will be available at the end of 2010 and they will show the direction for an update of the Ruhr District Clean Air Plan. In addition to the effects on the environment and changes in the transport sector, the impacts on populations health will be reassessed. Therefore, this study has been carried out to provide a suitable database for this part of the evaluation procedure (Ministry of the Environment 2009). The project has created a database that offers a possibility to evaluate the existing air pollution load and the desired reduction of immissions to improve public health through measures of air pollution control by linking data on air pollution and population affected by it, using existing dose-response relationships of epidemiologic studies (Annesi-Maesano et al. 2007; Krzyzanowski 2008; US EPA 2008; WHO 2005). Results and Conclusions In this study the description of exposure and health effects is based on “Traffic Light Charts” (maps, in which the colours green, yellow and red mark the intensity of air pollution according to the limit values of the EU directive on air quality). They cover mainly substantial sectors of areas with data on air pollution load in roads. Air pollution and population data referring to the year 2006. 13% of the total population (425,000 inhabitants) of the Ruhr District Clean Air Plan were encountered in the study, living along the “Traffic Light Chart” road net of 453 km. In the Düsseldorf Clean Air Plan a length of 230 km roads representing the “Traffic Light Chart” net. 32% (nearly 200,000 inhabitants) of the total city population live along these roads. A considerable part of the population in the surveyed areas are exposed to an increased air pollution load due to road traffic. The following figures show the number and percentage of the population affected by PM10 and NO2 in the Ruhr District and in the City of Düsseldorf. The health findings show that PM10 and NO2 impacts coming from road traffic lead to an increased number of premature fatal casualties and present a serious health risk. The results of this project are in accordance with those from other studies related to the problems of The Düsseldorf Clean Air Plan (Düsseldorf fine particles, which has been compiled and District Government 2008), which turned into assessed by the World Health Organization, force on 01 January 2009, has been included in the European Union and other organisations in this survey study as an example for a clean air Europe. plan for large cities. _______________________________________________________________________ 2 No. 44, WHO Collaborating Centre for Air Quality Management and Air Pollution Control NEWSLETTER ________________________________________________________________________ Ruhr District "Traffic Light Chart" net (total population: 425,000) 17,000 4% 35,900 8% Impact-Categories in µg/m3 ≤40 >40-≤44 >44 372,100 88% City of Düsseldorf "Traffic Light Chart"net (total population: 186,400) 35,600 19% Impact-Categories in µg/m3 ≤40 >40-≤44 >44 31,900 17% 118,900 64% Figure 1: Pollution Load NO2, persons affected in absolute numbers (rounded up to 100) and in % Ruhr District" Traffic Light Chart" net (total population: 425,000) 121,100 28% Impact-Categories in µg/m3 <29 >29-<30 >30 232,900 55% 71,000 17% City of Düsseldorf "Traffic Light Chart" net (total population: 186,400) Impact-Categories in µg/m3 29,700 16% <29 ≥29-<30 8,300 4% >30 148,500 80% Figure 2: Pollution Load PM10, persons affected in absolute numbers (rounded up to 100) and in % _______________________________________________________________________ No. 44, WHO Collaborating Centre for Air Quality Management and Air Pollution Control 3 NEWSLETTER ________________________________________________________________________ The package of measures in the clean air plans indicate to be appropriate to reduce high exposure levels and health-related impacts. To be able to attain the necessary reductions of air pollution these measures have to be implemented forcefully. A reduction of traffic-derived PM10 and NO2 air pollution will contribute to a reduction of the number of premature deaths correlated with these immissions and will lead to a gain of life expectancy for the whole population. It should be stressed that particularly the combination of regional and city action and clean air plans – as put into practice in North Rhine-Westphalia – will lead to an improvement of the air quality situation not only at hot spots but in larger areas too. Therefore, the pollution of road transport presented in the “Traffic Light Charts” depicts only a part of the whole burden and leads to a conservative estimate of the effects. With the evaluation of clean air plans, it is possible to assess the effectiveness of air pollution control measures implemented to improve the environment and health situation step by step and to react according to the results attained. The project report was published as hard-copy broschure in German and English language in May 2009, which can be obtained from the author. Additionally the report is available in the web: http://www.apug.nrw.de/pdf/APUG_ Evaluation_LRP_Broschuere.pdf. Partial Project 4 (2006): Joint effects of communal and regional planning instruments in the field or environmental, town and transport planning to improve the protection of health related to the environment Project reports: see under: www.apug.nrw.de/inhalte/verkehr.htm. Arnsberg District Government: Ruhr District CleanAir Plan, Partial Plan „Ruhr District East“, Duesseldorf District Government: Ruhr District Clean-Air Plan, Partial Plan „Ruhr District West“, Muenster District Government: Clean Air Plan Ruhr District, Partial Plan „Ruhr District North“, 2008. Ministry of the Environment, Conservation, Agriculture and Consumer Protection of the State of North Rhine-Westphalia; Action Program Environment and Health North RhineWestphalia (APUG NRW) Evaluation of the clean air plans Ruhr District and Duesseldorf – Exposure and Health Effects - 2009. Duesseldorf District Government: Clean-Air Plan Duesseldorf 2008. Annesi-Maesano, I., Forastiere, F., Kunzli, N., Brunekref, B. 2007: Particulate Matter, Science and EU Policy. European Respiratory Journal, No. 29:428-431. Krzyzanowski, M. 2008: WHO Air Quality Guidelines for Europe, Journal of Toxicology and Environmental Health A, No. 71:47-50. US EPA 2008: Integrated Science Assessment for Particulate Matter (External Review Draft), Online: http://cfpub.epa.gov/ncea/cfm/recordisplay. cfm?deid=201805. WHO (World Health Organization) 2005: Particulate Matter Air Pollution: How it harms Health, Fact sheet EURO/04/05, Online: http://www.euro.who.int/ document/mediacentre/fs0405e.pdf. References Ministry of the Environment, Conservation, Agriculture and Consumer Protection of the State of North RhineWestphalia; Action Programme Environment and Health North Rhine-Westphalia (APUG NRW) Preventive Health protection by mobilization of reduction potentials in road traffic noise and air pollution project Partial Project 1 (2003): Calculation of the impacts of technical emission reducing measures for motor vehicles as well as traffic control measures on road traffic noise and air pollution Partial Project 2 (2004): Calculation of risks regarding the influence of air pollution due to traffic and of road traffic noise on the health on exposed persons. Correspondence and request for materials should be addressed to: Diana Hein Ministry of the Environment and Nature Conservation, Agriculture and Consumer Protection of the State of North-Rhine Westphalia, Düsseldorf, Germany e-mail: [email protected] _______________________________________________________________________ 4 No. 44, WHO Collaborating Centre for Air Quality Management and Air Pollution Control NEWSLETTER ________________________________________________________________________ Case study of human health risk assessment due to transport-related air pollution in ukraine O. Voznyuk, O. Turos, O. Kartavtsev, A. Petrosian, Ya. Markevych and O. Gavrikova Introduction Under the WHO London Charter on Transport, Environment and Health, adopted at the Ministerial Conference on Environment and Health (June 1999), Governments have underlined the growing concern in raise of motorized transport. Increased fuel consumption, greater emissions of air pollutants, greater exposure of people to hazardous pollution cause serious health problems (Charter 1999). Transport has become an indispensable part of modern life that opens horizons for economic, social, technological, professional and personal development. Unfortunately, these positive aspects are much related to environmental and human health hazards posed by transport, in particular, by road transport (Dora and Phillips 2000). Recent studies indicate the influence of outdoor air pollution on human health, and transport is proved to be a significant contributor to the problem (Europe’s Environment 2007). A multitude of air pollution and pollutants of different toxicity emitted from transport worsening the situation, especially in highly industrialized cities. These air pollutants originate from the tailpipes of vehicles with internal combustion engines and other vehicle components like fuel tanks, tires, brakes or clutch lining. Road transport can be ranked as one of the main sources for such pollutants as nitrogen oxide, carbon monoxide, PM and benz(a)pyrene, which are of great concern (Krzyzanowski et al. 2005). In recent years, a growing number of road transports and the assessment of its impacts on human health are likely to become an urgent issue for many cities in Ukraine. National Zaporizhia Technical University have started to research the transport structure and transport emissions impacts on health of the population of Zaporizhia (Ukraine). Zaporizhia is a highly industrialized city in the southeastern part of Ukraine. Objective The aim of the study was to estimate the potential risk formed by transport-related ambient air pollution on the health of Zaporizhia’s inhabitants. The attention was focused on nine of the most hardly loaded intersections of the city, passed by 89 per cent of all city traffic every day. The rest is concentrated on the suburban city districts. Materials and Methods Since 2004 the Ambient Air Pollution and Risk Assessment Lab works on the development of human health risk assessment approaches for cities in Ukraine taken from the specimen U.S. EPA Human Health Risk Assessment Methodology (HHRA) (Guidelines 2001). This study has been conducted at nine intersections of the city of Zaporizhia by means of computer modeling (namely, programme product CaLRoads View v. 3.8.0 by Lakes Environmental Software) and HHRA methodology. Transport as one main source of emission is more specific than immobile source as it can not be described with permanent location and surrounding conditions. Turbulent transfer may be effected by transport flow and enforce atIn 2007 scientists of the Ambient Air Pollutimospheric mixing. When transport flow moves on and Risk Assessment Lab of State Institutithrough urban areas, the canyon effect appears on Marzeev Institute of Hygiene and Medical (Berliand 1985). Transport flow does not have Ecology of the Academy of Medical Sciences the initial elevation in relation to the ground of Ukraine in collaboration with staff of the level. _______________________________________________________________________ No. 44, WHO Collaborating Centre for Air Quality Management and Air Pollution Control 5 NEWSLETTER ________________________________________________________________________ cessed to build the situational model for the In conditions when the wind speed approaches city of Zaporizhia: zero, the turbulent exchange coefficient becomes close to zero as well, leading to increasing • Street characteristics data: number of lines, concentrations. So, even in situations when width street, intersection parameters and emissions are low but weak turbulence and schemes (Figure 1 and 2); calms predominate, it will be very difficult to • Traffic intensity data: transport flow intenforesee concentrations. The time of transporsity and structure, speed regime, time of tation from emission source to receptor increbreaks (Table 1 and 2); ases. • One full year of meteorological observation data (station WMO Station Index Number For these reasons, the parameters which chaUKDE 34601) was preprocessed into to racterize the situation (meteorological and compatible with CALRoads View requireemission data) can not be described as stable ments format that allowed to estimate weaduring longer time periods as either calms or ther conditions for the studied territory for vertical inversion in the surface layer last only the investigation period (Figure 3, 4, 5); for several hours. Taking into account the specifics of inner city conditions and peculiarities of transport as source of emission itself, a computer model embracing nine city intersections has been developed. The following input databases and data layers were prepared and pro- Figure 1: Traffic Network of Zaporizhia • Nine intersections and 120 transport routes were located on the high-resolution satellite image (Quick Bird) of Zaporizhia in the graphical module of the CalRoads View programme (Figure 6). Figure 2: Scheme of Intersection 3 Figure 4: Wind Class Frequency Distribution Figure 3: Wind Rose for Zaporizhia in 2007 _______________________________________________________________________ 6 No. 44, WHO Collaborating Centre for Air Quality Management and Air Pollution Control NEWSLETTER ________________________________________________________________________ Table 1: Transport Flow Structure Data for Intersection 3 INTERSECTION 3 8.00 – 9.00 a.m. Direction 1 2 3 4 5 6 7 8 9 10 11 12 13 Total Motorcycles Cars Lorries with Carrying 2 Tons/ Small Buses 2-5 Tons 5-8 Tons Buses Trolleybuses Roadtrain Total >8 Tons 0 0 0 0 0 0 0 0 0 0 0 0 0 768 30 564 114 0 0 162 144 150 126 60 18 18 342 6 330 30 0 0 36 12 0 12 6 0 0 0 12 0 0 0 0 6 0 18 12 12 0 0 0 0 0 0 0 0 0 0 0 0 0 0 0 0 0 0 0 0 0 0 0 0 0 0 0 0 60 0 30 0 0 0 0 0 0 0 0 0 0 12 0 6 0 24 30 0 0 0 0 0 0 24 0 0 0 0 0 0 0 0 0 0 0 0 0 1182 48 930 144 24 30 204 156 168 150 78 18 42 0 2154 774 60 0 0 90 96 0 3174 Table 2: Emission Characteristics of the studied Intersections Intersection Daily Fuel Consumption Fuel Diesel Oil (Tons/Day) (Tons/Day) (Tons/Day) (Tons/Day) (Tons/Day) (Tons/Day) 162.38 147.85 115.93 90.93 208.5 0.22 103.57 80.23 49.03 1.85 0.575 1.03 0.83 0.8 0.002 0.34 0.8 0.53 71.68 65.12 51,13 40.1 91.85 0.1 45.62 35.4 21.65 13.10 11.86 9.33 7.33 16.72 0.02 8.3 6.48 3.95 4.13 3.72 2.93 2.3 5.25 0.005 2.61 2.03 1.25 0.13 0.096 0.09 0.07 0.14 0.0002 0.06 0.08 0.04 37.93 34.18 27.0 21.18 48.20 0.05 23.93 18.7 11.45 (Tons/Day) 1 2 3 4 5 6 7 8 9 Daily Pollutants Emission of Transport Steam СО Figure 5: Distribution of Atmospheric Stability Classes according to Pascuill-Gifford Classification С хН у NO2 TSP C20H12 Figure 6: Public Transport Routes of Zaporizhia _______________________________________________________________________ No. 44, WHO Collaborating Centre for Air Quality Management and Air Pollution Control 7 NEWSLETTER ________________________________________________________________________ Results CO HQ (Hazard Quotient)=0,038÷2,34; NO2 HQ=0,49÷2,94 (medium level). Non-cancer risk for carbohydrates was not estimated due to substance complex nature. These levels of non-cancer risks state the probability of 2.3 for carbon monoxide and almost 3 times for nitrogen dioxide increase in pathologies of respiratory system. Street characteristics, route schemes, traffic intensity, emissions and meteorological data were the base for building each intersection computer model and calculation prioritized pollution concentrations in ambient air. Calculations were made for the following substances: carbon monoxide, nitrogen dioxide, benz(a) pyrene, PM10 and carbohydrates at each of nine intersections in 441 receptor points. Individual cancer risk levels during lifetime indicate the probability of 10-4-10-3 appearances of cancer pathologies related to benz(a)pyren emissions. Risk levels attributed to PM10 emissions are 10-7 - 10-5, which are defined as an acceptable level but demand periodic control according to WHO (Table 4). Sulfurous anhydride emissions were not estimated due to the high level of this substance emissions coming from industrial enterprises that complicated differentiation of its quota related to motor-transport. Average diapasons of concentration were estimated: CO 0,08-2,78 mg/m3, NO2 0-0,118 mg/m3, CxHy 0-0,79 mg/ m3, PM10 0-7,7 mg/m3, benzpyrene 0,000032,46 mg/m3 (Table 3, Figure 7). Concentration levels for all substances except PM10 exceed the reference level (Guidelines 2004). Conclusions This study is the first in Ukraine which combines the on-field dynamic observation data studies with computer modeling of transportrelated air pollution. Concentrations of dominant ambient air pollutants were calculated for nine main intersections of the city Zaporizhia. This allowed estimating human health risk le- Human cancer and non-cancer risk levels were estimated according to HHRA methodology. Non-cancer risk were within diapasons: Table 3: Concentration Levels of studied Substances near each Intersection; exceeding mean Values are marked Substance Intersection RfC (mg/m3) 1 2 3 4 5 6 7 CO 3 0.11-4.7 0.06-1.9 0.05-2.11 0.11-2.78 0.03-1.97 0.05-2.08 0.15-7.02 NOx 0.04 0-0.079 0-0.039 0-0.039 0-0.059 0-0.039 0 0-0.118 РМ10 0.05 0.11-7.77 0.02-1.98 0.07-2.65 0.11-3.19 0.05-2.43 0 0.12-7.75 0.07-2.24 0.06-3.89 CxHy 0.2 0.01-0.79 0.006 -0.248 0.01-0.25 0.01-0.32 0.01-0.29 0 0.02-0.96 0.02-0.96 0.006-0.359 C20H12* 10-6 0.04-2.46 0.02-0.74 0.02-0.76 0.04-0.93 0.02-0.86 3*10 --3 1.65*10 0.05-2.77 0.02-0.96 0.02-1.05 8 9 0.03-1.52 0.08-2.63 0-0.0393 0-0.0393 -5 Table 4: Individual Cancer Risk during Lifetime; exceeding mean Values are marked Substance Intersection 1 2 3 РМ10 6,7×10⁷-÷ 4,7×10⁻⁵ 1,22×10⁻⁷÷ 1,21×10⁻⁵ 4,3×10⁻⁷÷ 1,63×10⁻⁵ Benz(a)pyrene 1,83×10⁻⁵÷ 1,05×10⁻³ 7,47×10⁻⁶÷ 3,1×10⁻⁴ 1,0×10 -5 ÷ 3,2 × 10⁻⁴ 4 5 6 7 8 9 6,7×10⁻⁷÷ 1,95×10⁻⁷ 3,07×10⁻⁷÷ 1,49×10⁻⁵ 2,07×10⁻⁷÷ 1,39×10⁻⁵ 7,36×10⁻⁷÷ 4,75×10⁻⁵ 4,29×10⁻⁷÷ 1,37×10⁻⁵ 3,68×10⁻⁷÷ 2,38×10⁻⁵ 1,69×10⁻⁵÷ 3,9×10⁻⁴ 9,4×10⁻⁶÷ 3,7×10⁻⁴ 1,28×10⁻⁸÷ 7,06×10⁻⁷ 2,04×10⁻⁵÷ 1,2×10⁻³ 1,06×10⁻⁵÷ 2,2×10⁻⁴ 8,09×10⁻⁶÷ 4,5×10⁻⁴ _______________________________________________________________________ 8 No. 44, WHO Collaborating Centre for Air Quality Management and Air Pollution Control NEWSLETTER ________________________________________________________________________ References Charter on Transport, Environment and Health, World Health Organization Regional Office for Europe, Copenhagen, Denmark1999 (EUR/ICP/EHCO 020205/9 Rev. 409009), http://www.euro.who.int/document/peh-ehp/ charter_transporte.pdf. Dora, C. and Phillips, M.: Transport, Environment and Health, World Health Organization, Regional Office for Europe, Copenhagen, Denmark 2000, European Series, No. 89, www.euro.who.int/document/e72015.pdf. Europe’s Environment: The Fourth Assessment: Sixth Ministerial Conference on Environment and Health, 10 12 October 2007), Belgrade, Serbia, UNECE, p. 55. Figure 7: Concentration Field for C20H12, Intersection 3 vels for the inhabitants of the districts near the studied intersections. These figures are equal from 2.5 to 3.0 increase in respiratory system pathologies due to carbon monoxide and nitrogen dioxide emissions and 1 case per 1000 probability of cancer during lifetime. Existent levels of non-cancer risk indicate the possibility of 2.5 to 3.0 times increase in occurances of respiratory system pathologies related to carbon monoxide and nitrogen dioxide. Levels of cancer risk point to one case per thousand probability of respiratory system cancer development during human lifetime. The study has helped define zones of potential health hazards and proved the urgent need for interventions to decrease transport emissions and impacts on human health. The second phase of the research will be focused on risk management (Guidelines 2001), namely on practical development of interventions and instruments of preventive measures. Krzyzanowski, M., Kuna-Dibbert, B. and Schneider J., 2005: Health Effects of Transport-Related Air Pollution, World Health Organization Regional Office for Europe, Copenhagen, Denmark 2005, pp.7-29, http://www.euro. who.int/document/e86650.pdf. Guidelines: Health Risk Assessment and Valuation of Human Health, US Environmental Protection Agency. Washington, USA 2001, p. 32. Berliand, M.: Forecast and Regulation of Air Pollution. Leningrad, Russian Federation 1985, pp.20-26. Guidelines on Human Health Risk Assessment related to Chemicals, Polluting Environment, Federal Center for Epidemiological Monitoring, Ministry of Health, Moscow, Russian Federation 2004, pp. 64-72. Authors O. Turos, O. Kartavtsev, O. Voznyuk and A. Petrosian Marzeev Institute of Hygiene and Medical Ecology Academy of Medical Sciences, Kiev, Ukraine Ya. Markevych Marzeev Institute of Hygiene and Medical Ecology Academy of Medical Sciences, Kiev, Ukraine and National Technical University, Zaporizhia, Ukraine O. Gavrikova Ecological Risk Assessment Center Zaporizhia, Ukraine Acknowledgements Correspondence and request for materials We thank the Center of Environmental Health should be addressed to: and Risk Assessment (Kiev, Ukraine) for assistance in research, the Transport Department of Oksana Voznyuk Zaporizhia National Technical University, to Marzeev Institute of Hygiene and Medical Ecology V. Yudin namely for providing transport rouAcademy of Medical Sciences Popudrenko St. 50, 03660 Kiev 94, Ukraine tes and structure, demographic, health and air pollution dynamic observation data and local phone: +38 044 559 25 90 authorities for substantial governmental supfax: +38 044 296 87 15 e-mail: [email protected] port. _______________________________________________________________________ No. 44, WHO Collaborating Centre for Air Quality Management and Air Pollution Control 9 NEWSLETTER ________________________________________________________________________ harmonisation with eu legislation in the field of air quality measurements in bulgaria Milena Parvanova According to the Environmental Protection Act, the Ministry of Environment and Water (MoEW) is in charge of organizing and conducting the monitoring of the environmental components including air quality, which is of great importance for the human health and sustainable development. The Executive Environment Agency (EEA) is established at the Ministry of Environment and Water and carries out the management of the National Automatic System for Environmental monitoring. The Agency is a National Reference Centre for the European Environment Agency. A number of European Union Directives in the field of air quality have been transposed and implemented over the past ten years. The existing Bulgarian legislation transposes very well the EU requirements on air quality assessment and management. The EU Ambient Air Quality Framework Directive and its Daughter Directives are implemented by the Bulgarian legislation as follows: • Framework Directive 96/62/EC from 27 September 1996 on AAQ assessment and management (Clean Air Act, Regulation No. 7 from 3 May 1999 on Ambient Air Quality Assessment and Management); • Directive 1999/30/EC from 22 April 1999 relating to limit values for sulphur dioxide, nitrogen dioxide and oxides, particulate matter and lead in ambient air (Regulation No. 9 from 3 May 1999 on limit values for sulfur dioxide, nitrogen dioxide, fine particulate matter and lead in ambient air); • Directive 2000/69/EC of the European Parliament and of the Council from 16 November 2000 relating to limit values for benzene and carbon monoxide in ambient air (Regulation No. 1 from 16 January 2004 on limit values for benzene and carbon monoxide in ambient air); • Directive 92/72/EC relating to ozone in ambient air (Regulation No. 8 from 3 May 1999 on ambient air quality limit values for ozone); Table 1: Harmonisation of Air Pollution Monitoring Methods Pollutant Method used in Bulgaria Reference Method according to Directive/EC Sulphur Dioxide UV-Fluorescence Directive 99/30/EC; Directive 2008/50/EC; EN 14212:2005 Nitrogen Oxides Chemiluminiscence Directive 99/30/EC; Directive 2008/50/EC; EN 14211:2005 Ozone UV-Absorption Directive 2002/3/EC; Directive 2008/50/EC; EN 14625:2005 Carbon Monoxide Infrared Spectroscopy Directive 2000/69/EC; Directive 2008/50/EC; EN 14626:2005 Benzene Manual Sampling and GC Analysis Directive 2000/69/EC; Directive 2008/50/EC; EN 14662(2):2005 PM10 Gravimetric Method Directive 99/30/EC; Directive 2008/50/EC; EN 12341:1999 PM2.5 Gravimetric Method Directive 99/30/EC; Directive 2008/50/EC; EN 14907:2005; Pb, Cd, As, Ni in the PM10 Fraction Manual Sampling and AAS Directive 99/30/EC (for Pb); Directive 2004/107/EC (for As, Cd, Hg, Ni and PAH), Directive 2008/50/EC; EN 14902:2005; ISO 9855:1993 (for Pb) Ozone Precursor Substances Manual Sampling and GC/ MS Analysis Directive 2002/3/EC; Directive 2008/50/EC; EN 16017(1): 2000 _______________________________________________________________________ 10 No. 44, WHO Collaborating Centre for Air Quality Management and Air Pollution Control NEWSLETTER ________________________________________________________________________ • Directive 2002/3/EC relating to ozone in ambient air (Regulation No. 4 from 5 July 2004 relating to ozone in ambient air); • Directive 2004/107/EC relating to arsenic, cadmium, mercury, nickel and polycyclic aromatic hydrocarbons in ambient air (Regulation No. 11 from 14 May 2007 on ambient air quality limits for arsenic, cadmium, mercury, nickel and polycyclic aromatic hydrocarbons). The “new air quality Directive” 2008/50/EC of the European Parliament and of the Council of 21 May 2008 on ambient air quality and cleaner air for Europe enters into force on 11 June 2008. The new Directive merges Directives 96/62/EC, 1999/30/EC, 2000/69/EC and 2002/3/EC. The date of transposition of the new Directive will be 11 June 2010. The used methods for air quality measurements in Bulgaria are the reference methods, which are described in the relative Directives (presented in Table 1). The Daughter Directives (1999/30/ EC, 2000/69/EC, 2002/3/EC and 2004/107/ EC) specify the principles of the reference methods, which are used for the measurement of concentrations of relative pollutants. The Air Quality Framework Directive is stating in Article 3 under “Implementation and responsibilities” that Member States shall designate at the appropriate levels the competent authorities and bodies, which are responsible for the following points: • assessment of ambient air quality; • approval of the measuring devices (methods, equipment, networks, laboratories); • ensuring accuracy of measurement; • analysis of assessment methods; • coordination of Community-wide quality assurance programmes on their territory organized by the Commission. The competent authorities and bodies should also comply with the requirements of Section C of Annex I of New Directive 2008/50/EC. The Air Quality Laboratory in the EEA is a National Reference Laboratory, a member of the Network of European Air Quality Reference Laboratories (AQUILA). The main task is to verify and support the correct implementation of the air quality directives. The laboratory in the EEA was accredited as a testing laboratory under EN 45001 in the period 1999-2002. At the moment, the laboratory is accredited according to EN ISO/IEC 17025:2001 “General requirements for the competence of testing and calibration laboratories”. In addition, from 2007, we received the certificate for accreditation as a calibration laboratory according to EN ISO/IEC 17025:2001. Accreditation according to EN ISO/IEC 17025:2000 includes the implementation of a quality system and traceability to national/ international standards. Quality System is defined in the Quality Manual, which includes: calibration and methodology; quality control of the results, obtained from different measurements; validation of methods; test methods; sampling equipment, laboratory equipment and automatic analysers /instructions for use/; audits of staff capability and competence; a record of errors and corrective actions, etc. Regarding the accreditation of the MoEW laboratories, the main introduced elements of QA/QC procedures are the following: 1. Harmonisation of measurements methods and ISO/CEN standardization 2. Method validation 3. Type approval of instruments 4. Reference materials 5. Intercomparison exercises 6. Uncertainty of measurements Corrspondence and request for materials should be addressed to: Milena Parvanova Executive Environment Agency (EEA) Sofia, Bulgaria phone: +359 2 940 64 61 fax: +359 2 955 90 15 e-mail: [email protected] _______________________________________________________________________ No. 44, WHO Collaborating Centre for Air Quality Management and Air Pollution Control 11 NEWSLETTER ________________________________________________________________________ NOTES AND NEWS WHO Indoor Air Quality Guidelines: Selected Pollutants Living in damp or mouldy buildings increases the risk of respiratory symptoms and asthma up to 75%. This is the conclusion of the first guidelines on dampness and mould released today, which offer guidance on how to ensure safe and healthy buildings. They are the first in a series of WHO guidelines for indoor air quality which will also cover pollution from selected chemicals and from combustion products. Preparing WHO Indoor air quality guidelines: selected pollutants, a first meeting took place in November 2009 in Bonn, Germany. The purpose of this meeting was to agree on the risk evaluation for each of the selected pollutants (formaldehyde, benzene, naphthalene, nitrogen dioxide, carbon dioxide, radon, tri- and tetrachloroethylene and benzo-a-pyrene), and to recommend WHO guidelines for protection of public health from these risks. The guidelines will take into consideration various levels of economic development, cover all relevant population groups, and enable feasible approaches to reduce health risks from exposure to the selected pollutants in various regions of the world. Existing national and international guidelines, experiences in indoor air quality regulation and results of completed international reviews will support the discussion and its conclusions. The meeting gathered experts reviewing the evidence and preparing the background papers as well as members of the steering group. It also involves selected representatives of national agencies potentially interested in using WHO Indoor Air Quality Guidelines to shape policies and actions addressing health risks of indoor air pollutants. Background based on the recommendations of the 2006 planning meeting, the evidence on health risks of indoor exposures to the selected pollutants was reviewed and summarized by invited experts in the form of background papers. The papers cover: • • • • indoor sources of the pollutant, levels of exposure indoors, kinetics and metabolism of the pollutant and its health effects observed in experimental and epidemiological research. Congestion Tax in Stockholm improved Air Quality and Health EU legislation on air quality sets limits for Member States for air pollutants including NOX and the PM10. Meeting the limit values of PM10 is proving challenging for EU Member States and the deadlines for complying with the PM10 standards have been postponed until 2011. Measures such as congestion taxes could help meet these targets. Few studies have examined the impact of congestion charges on emissions, air pollutants and health. This research investigated all three for the Stockholm Trial road pricing system. This trial took place between January and July 2006 and charged vehicles entering and exiting a congestion area. Based on measured and modelled changes in road traffic, the researchers estimated that the tax reduced total road use by 15 per cent within the charge area. An evaluation of the effects of a congestion tax trial in Stockholm, designed to reduce traffic levels, reveals that there was a decrease of 8.5 % in nitrogen oxide (NOX) emissions and of 13 % in coarse particle (PM10) emissions in the congestion zone. Improvements of this level could avoid 27 premature deaths due to road traffic emissions a year for Stockholm. The study demonstrates that even modest improvements in air quality can lead to health benefits, and the researchers argue that it is important to make quantitative estimates of The amount of the charge varied, but was highhealth impacts in order to justify actions to reest during rush hour, with the maximum charge duce air pollution (Source: European Comission DG at 60 Swedish Kronor (about € 6) per day. ENV, News Alert Issue 172, November 2009). _______________________________________________________________________ 12 No. 44, WHO Collaborating Centre for Air Quality Management and Air Pollution Control NEWSLETTER ________________________________________________________________________ The Large Analysis and Review of European Housing and Health Status (LARES) Project The available evidence on the relationship between housing and health is still insufficient to adequately describe the health impact of housing, although several projects were carried out in the recent years. The LARES project, coordinated by WHO/Europe, aimed at assessing the quality of the housing stock in a holistic way and to achieve a more comprehensive understanding of housing and health in the Region, with a view to setting priorities and developing recommendations for policy-making. In addition to evidence reviews, LARES carried out a pan-European survey on housing and health in eight cities. The study provides evidence on two key issues: • inadequate housing can be considered as one of the possible mechanisms through which poverty can affect health and well-being of the population, especially for vulnerable and marginalized population groups; • irrespective of poverty and socioeconomic issues, housing problems with direct or indirect health relevance are linked to both insufficient construction and maintenance and to residential lifestyle. Housing features affecting health were found to be often linked with thermal comfort, indoor conditions (air quality, dampness, moulds, indoor emissions, infestations etc.), noise, environmental barriers, home safety, and the social and physical quality of the housing as well as the immediate environment. Action on housing and health should aim at: 1. Improving inadequate housing as a means to mitigate social and health inequities; 2. Improving specific key housing problems as a preventive strategy against housing-related health effects and injuries. housing stock conditions. LARES calls for immediate action by local and national housing authorities and health agencies. In 2009 a data report based on the WHO LARES database has been published, which is focused on social inequalities and their influence on housing risk factors and health. Housing conditions have an influence on residents’ health. As different financial capacities - or social determinants in general - may lead to different housing conditions, they can be a potential source of inequalities. For the presented analysis the WHO LARES data set was used, providing data on housing and health for 8519 individuals in 3373 households compiled from eight European cities. The study used an exploratory design and identified the magnitude of inequality for a selected number of social determinants, housing factors, and health outcomes. Within the LARES survey, less affluent residents are more exposed to and affected by inadequate housing conditions. It is shown that inadequate housing conditions have a significant impact on several health outcomes, and that there is a social gradient for both the housing quality and the housing-related exposure, and for housing-associated health outcomes. Within the social category groups, increased exposure to environmental risks was often but not always associated with an increased health outcome. Multiple exposure scores showed the strongest associations. Housing conditions must be considered as one of the mechanisms through which social inequality translates into health inequality. For the LARES cities, these results indicate a strong need for policymakers and local stakeholders to intervene and develop programmes to overcome such inequalities and provide adequate housing conditions for everyone. A review of evidence on housing and health supported the proposals presented at the 2004 Fourth Ministerial Conference on Environment and Health in Budapest on potential ways forward for ministers of health and of environment The full report can be obtained from http://www.euro. who.int/Document/E92729.pdf. as well as for local authorities in charge of the _______________________________________________________________________ No. 44, WHO Collaborating Centre for Air Quality Management and Air Pollution Control 13 NEWSLETTER ________________________________________________________________________ Protecting Children‘s Health in a changing Environment The coming fifth Ministerial Conference on Environment and Health in Parma More than ever, children‘s health is at risk from a changing environment. The health impacts of environmental risk factors - inadequate water and sanitation, unsafe home and recreational environments, lack of spatial planning for physical activity, indoor and outdoor air pollution, and hazardous chemicals - are amplified by recent developments such as financial constraints, broader socioeconomic and gender inequalities and more frequent extreme climate events. They pose new challenges for health systems to reduce deaths and diseases through effective environmental health interventions. The Fifth Ministerial Conference on Environment and Health, organized by WHO/Europe and hosted by Italy on 10 to 12 March 2010, is the next milestone in the European environment and health process, now in its twentieth year. Focused on protecting children‘s health in a changing environment, the Conference will drive Europe‘s agenda on emerging environmental health challenges for the years to come. European Union set to miss 2010 Air Pollutant Limits With 2010 now quickly approaching, updated emission estimates for that year show just 14 Member States expect to meet their respective 2010 air pollutant limits set under the EU National Emission Ceilings Directive (NEC Directive). A small group of Member States anticipates missing two or more of their legally-binding emission ceilings. The NEC Directive sets pollutant-specific and legally-binding emission ceilings that each Member State must meet by 2010. The NEC Directive status report from the European Environment Agency presents information from the latest reporting round for both Member States and the EU as a whole for the four pollutants covered by the directive: sulphur dioxide (SO2), nitrogen oxides (NOX), non-methane volatile organic compounds (NMVOCs) and ammonia (NH3). These pollutants harm both human health and the environment by contributing to formation of ozone and particulate matter and leading to acidification and eutrophication. ceilings. Of the four ceilings, NOX remains by far the most difficult for many Member States to achieve — 12 Member States now estimate they will miss the ceiling for this pollutant. Similar to last year‘s situation, some Member States including the Netherlands, Sweden and Germany expect to emit only slightly more NOX than their ceilings. Others, such as Ireland, Austria and Belgium, are projected to miss their limits by as much as up to 60%. Several Member States plan to implement additional measures to reduce emissions which would reduce the number projected to exceed their ceilings. Still, five Member States (Austria, Belgium, France, Ireland and Spain) would still under these circumstances miss their ceilings by significant amounts. The progress toward meeting ceilings for the other pollutants remains largely on track. The latest data available only covers past emissions up until 2007 and few Member States have yet fully incorporated the effects of the Only Spain anticipates missing three emission recession into their projections for 2010. Howceilings — those for NOX, NMVOC and NH3. ever, based on informal information received Additional forecasts published separately by from countries, it seems certain that for certain Spain in July, and which take into account the pollutants and sectors, emissions for 2008 will economic slowdown, confirm further that even be lower than for previous years — as a result if additional actions were implemented to reof the recession. Decreased economic activity duce emissions of these pollutants, the ceilings might also improve the chances of those Memwould still be missed. Three Member States ber States close to the level of the ceilings, in (France, Germany and the Netherlands) each meeting their 2010 ceilings. anticipate missing two of their four emission _______________________________________________________________________ 14 No. 44, WHO Collaborating Centre for Air Quality Management and Air Pollution Control NEWSLETTER ________________________________________________________________________ MEETINGS AND CONFERENCES Final Conference of the EU project PRONET 3 November 2009, Brussels, Belgium On 3 November, the final conference of the EU-funded project PRONET took place in the Representation of the State of North RhineWestphalia in Brussels. The meeting was open for all stakeholders that were interested in the results generated by the project. Around 65 people from a wide variety of fields and organisation types, such as ministries, provinces, communities, public health organisations or research institutes from 14 European Member States, attended the workshop. During the meeting, the project results were presented in the form of oral and poster presentations, distributed materials and discussions. Background and Aim PRONET started in January 2007. The project was initiated because it turned out there is a lack of systematic exchange of information and experiences among Member States in the field of environmental health protection. The main objective of PRONET was to facilitate exchange and evaluation of interventions on environment and health exposure reduction measures on a regional level and promote implementation of successful initiatives in other regions of Europe. Useful practices were collected for two main areas in the field of environmental health: • Indoor environment and health • Transport, environment and health improve environmental health conditions and on the contact person of the case study. Project results The final result of the indoor environment work consists of 30 fact sheets, created by summarising and sometimes combining the information from 48 case studies. These fact sheets can be divided in nine different categories, related to the main stressors in the indoor environment that were identified within the project: Allergens, Moisture, Moulds, Volatile Organic Compounds, Environmental Tobacco Smoke, Combustion, Radon, Noise, Lack of Ventilation. Out of the complete selection of almost 500 case studies, 56 case studies were processed into fact sheets. These case studies were derived from a variety of different European countries, and covered the following ten categories: Traffic Restrictions, Low Emission Vehicles, Traffic or Spatial Planning, Promotion of Cycling, Logistic Concepts, Awareness Raising, Public Transport, Comprehensive Approaches, Administrative or Political Instruments, Networks and Databases. Final Conference Case studies have been identified by the use of questionnaires, performing a scientific literature search, contacting other EU projects and organising workshops together with different stakeholders. A selection was then made on those case studies that have been effective in reducing exposure and improving health, or studies that were very promising. The programme of the final PRONET conference consisted of several parts. The representatives of both coordinating organisations (“Public Health Services Gelderland Midden” and “Ministry of the Environment and Nature Conservation, Agriculture and Consumer Protection of the State of North Rhine-Westphalia”), opened the conference with general presentations on Basic information derived from these the project and the main results. One of the case studies has been summarised in fact project partners (Stockholm County Council) sheets. These fact sheets provide interested presented the Swedish Environment and organisations with information on the Health Targets, which has been adopted by the background, on solutions that were chosen to Swedish Parliament. _______________________________________________________________________ No. 44, WHO Collaborating Centre for Air Quality Management and Air Pollution Control 15 NEWSLETTER ________________________________________________________________________ A keynote presentation on the various aspects of ventilation was given. In addition, several speakers were invited to give an overview of the measures in relation to transport and health that were taken in their respective cities: London, Bottrop and Barcelona. The presentations were given on examples such as congestion charging, low emission zones, noise reduction and comprehensive approaches. • Closing the gap between emission stan dards and ambient air quality standards on EU level; During an indoor related session, one of the issues discussed was: who is responsible for a healthy indoor living environment? This is a complex question, since there are various aspects associated with this, such as sources of exposure (quality of consumer goods and construction materials), behaviour of the residents and performance of the building (ventilation possibilities). When trying to improve the indoor environment, measures that are taken can be in the form of (more) regulation on what is permitted, trying to change how residents use their houses, or organising additional training on the design of healthy houses to designers of houses, such as architects. The meeting was closed with a panel discussion, in which several persons from different working areas (EU Commission, NGO, Ministry, Province) stated there opinion on PRONET and the fields it relates to. The results of PRONET were recognised as valuable and a continuation of the network was considered worthwhile. Guiding questions for the transport related workshop were: • What are the success factors to achieve health promoting traffic? • What is the importance of networks? • What are future challenges in the field of transport, environment and health? During the transport discussion, there was an agreement on the fact that transport related noise and air pollution have a serious effect on health as well as on quality of the environment. Therefore, the policy recommendations which were derived within PRONET were confirmed: • Improving the harmonisation of EU policy strategies on air quality, noise, mobility management and urban environment; • More knowledge is needed on the effects of certain components, on economic eva luation of transport-related health effects, and on the economic and health effects of particular measures. Future Activities There are several ways in which interested people can still benefit from the project’s results. The project website (www.proneteurope.eu) will remain in the air for several more years. Also, during the project, several workshops have been organised by the project team, for stakeholders in various countries in Europe. During such workshops, the results from either indoor, transport or both areas were presented. A survey showed that most participants were enthousiastic about the results. If you are also interested in having such a workshop, it can still be organised. In that case, please contact the project coordinator, Peter van den Hazel. In addition, new case studies of interventions or measures can be added to the database of fact sheets by using the respective form on the PRONET website. Peter van den Hazel Public Health Services Arnheim, The Netherlands phone: +31 26 377 3915 e-mail: [email protected] _______________________________________________________________________ 16 No. 44, WHO Collaborating Centre for Air Quality Management and Air Pollution Control NEWSLETTER ________________________________________________________________________ PUBLICATIONS WHO WHO Guidelines for Indoor Air Quality: Dampness and Mould Edited by: E. Heseltine and J. Rosen, WHO Regional Office for Europe, Copenhagen, Denmark 2009, 228 pages, ISBN 978 92 890 4168 3, Order-No.: 13400088, US$ 50.00, in developing countries US$ 35.00, also available through the web: http://www.euro.who.int/document/E92645.pdf. Microbial pollution is a key element of indoor air pollution. It is caused by hundreds of species of bacteria and fungi, in particular filamentous fungi (mould), growing indoors when sufficient moisture is available. This document provides a comprehensive review of the scientific evidence on health problems associated with building moisture and biological agents. The review concludes that the most important effects are increased prevalences of respiratory symptoms, allergies and asthma as well as perturbation of the immunological system. The document also summarizes the available information on the conditions that determine the presence of mould and measures to control their growth indoors. The WHO guidelines for protecting public health are formulated on the basis of the review. The most important means for avoiding adverse health effects is the prevention (or minimization) of persistent dampness and microbial growth on interior surfaces and in building structures.This book provides a comprehensive overview of the scientific evidence on the health problems associated with this ubiquitous pollution and provides WHO guidelines to protect public health. It also describes the conditions that determine the presence of mould and provides measures to control its growth indoors. OTHERS European Exchange of Monitoring Information and State of the Air Quality in 2007 ETC/ACC Technical Paper 2009/3 Assessment of the Health Impacts of Exposure to PM2.5 at a European Level ETC/ACC Technical Paper 2009/1 This technical report presents the results of the data reporting cycle for 2007. A total of 33 countries, including 26 EU Member States, have provided air quality data for SO2, NOX, NO2, PM10, PM2.5, O3, CO and benzene. Over the last eleven monitoring years pollution by SO2, NOX, PM10 and CO shows a decreasing trend in the ambient concentrations. At traffic stations concentrations on NO2 are nearly constant notwithstanding the NOX concentration reductions. The reduction of CO on rural stations is very small. The ozone concentrations are constant on the rural level and show increasing levels at urban and traffic stations. Exceedances of the halth related limit values are observed at a limit number of stations only for SO2, CO and benzene. Compliance with the health related limit values of NO2, PM10 and ozone is a serious problem in many urban and traffic areas. The target value for PM2.5 has been exceeded for 10 to 15% of the stations. In 10 Member States one or more exceedances are observed. A European PM2.5 concentrations map has been prepared on the basis of PM10 concentrations maps using PM2.5/ PM10 ratios inferred from measurements. Different PM2.5/ PM10 ratios are used depending on location and type of station. The resulting PM2.5 map is used to compare the current (2005) concentrations with the limit and target values as laid down in the Air Quality Directive. An annual mean concentration of 25 µg/m3 (target value for 2010, limit value for 2015) is exceeded in 12 out of the 27 EU Member States. As the map has a spatial resolution of 10x10 km, more exceedances are to be expected at hot-spot locations (city centres, traffic situation, close to local sources). A first estimate of the health related Averaged Exposure Indicator (AEI) has been made for each of the Member States. This AEI is the averaged level at urban background locations throughout the territory of a Member State and it reflects the population exposure. By 2020 the AEI has to be reduced with a certain percentage depending on its value in 2010. This exposure reduction target ranges from 10% in the Nordic countries to more than 25% in Eastern European countries. Estimates of health impacts attributable to the exposure to PM2.5 has been made for the 2005 situation and for two sensitivity cases assuming that the limit value is met everywhere and the exposure reduction target has been met by all countries. W. Mol, P. van Hooydonk and F. de Leeuw, ETC/ACC, Bilthoven, The Netherlands 2009, 62 pages, available through the web: http://air-climate.eionet.europa.eu/ docs/ETCACC_TP_2009_3_eoi2008_2007aqdata.pdf. Urban air quality indicators have been defined for PM10 and ozone. These indicators reflect population weighted concentrations. For both indicators the time series does not show a clear increasing or decreasing tendency. F. de Leeuw and J. Horálek, ETC/ACC, Bilthoven, The Netherlands 2009, 21 pages, available through the web: http://air-climate.eionet.europa.eu/reports/ETCACC_ TP_2009_1_European_PM2.5_HIA. _______________________________________________________________________ No. 44, WHO Collaborating Centre for Air Quality Management and Air Pollution Control 17 NEWSLETTER ________________________________________________________________________ Assessment of Ground-Level Ozone in EEA Member Countries, with a Focus on LongTerm Trends, Technical Report 7/2009 European Environment Agency, Copenhagen, Denmark 2009, 52 pages, ISBN 978 92 9213 003 9, available through the web: http://www.eea.europa.eu/publications/ assessment-of-ground-level-ozone-in-eea-membercountries-with-a-focus-on-long-term-trends/at_download/file. This publication examines the influence of anthropogenic and natural emissions, meteorology, inter-continental transport of ozone precursor gases and link to climate change. Trends in measured and modelled ground-level ozone concentrations in Europe were presented. Ensuring Quality of Life in Europe’s Cities and Towns, EEA Report 5/2009 European Environment Agency, Copenhagen, Denmark 2009, 108 pages, ISBN 978 92 9167 994 2, Order-ID: TH-AL-09-005-EN-C, € 10,-, also available through the web: http://www.eea.europa.eu/publications/quality-of-lifein-Europes-cities-and-towns/at_download/file. This report aims to raise awareness of the various perspectives on, and perceptions of, quality of life with a specific focus on cities and towns. It stresses the challenges ahead to ensure quality of life in the long run for all social groups, and the crucial importance of sustainability and the environment as our life supporting system. The report sheds light on certain aspects of the current quality of life discussions in order to illustrate how different conceptions of quality of life influence the quality of life of others, and provides ideas for ways to meet the challenges that lie ahead. It aims to support individuals and politicians to discover a balanced concept for quality of life compatible with sustainable development. IUAPPA: Members‘ Directory 2008 IUAPPA, Brighton, United Kingdom 2008. Available through the web: http://www.iuappa.com/newsletters/ MembersDirectory2008.pdf. The International Union of Air Pollution Prevention and Environmental Protection Associations is committed to bringing together governmental and non-governmental organizations throughout the world to share scientific and technical information to help develop more effective air pollution control policies. Geographies of Health – An Introduction, 2nd Edition A.C. Gatrell and S.J. Elliott, Wiley-Blackwell Publications 2009, 304 Pages, ISBN 978 1 4051 7576 0, US$ 99,95 (Hardback), also available as Paperback: ISBN 978 1 4051 7575 3, US$ 39,95. This revised second edition highlights the ways in which health may be studied from geographical perspectives, setting out the debates and reviewing the evidence that links health outcomes with social and physical environments. Air Pollution: Health and Environmental Impacts B. Gurjar, L. Molina and C. Ojha, expected to be published in April 2010, ISBN 143 980 962 3, 696 pages, US$ 103.96. Rapid growth in energy consumption, driven by increasing world population and economic prosperity, is resulting in an unprecedented increase in pollutant emissions, making air pollution one of the most important environmental problems in urban areas. Air pollution has serious impacts on public health, causes urban and regional haze, and has the potential to contribute significantly to global climate change. Unique in its wide range of content and international authorship, this book discusses the impacts of air pollution on population health. A comprehensive overview, it provides policy makers and government officials the tools they need to make effective and informed decisions. Radioactive Air Sampling Methods M. Maiello, Wyeth Research, Pearl River, New York, USA and M. Hoover, Morgantown, West Virginia, USA, expected to be published in April 2010, 350 pages, ISBN 978 0849 39717 2, US$ 116,95. Designed for industrial hygienists, air quality experts, and heath physicists, Radioactive Air Sampling Methods presents specific techniques for sampling radioactivity in the air. The authors discuss radionuclides found in nature, develop during industrial operations, and those that appear in the aftermath of a catastrophe, such as a nuclear reactor release. They detail step-by-step methods for measuring airborne radioactive substances and include information on sensitivity, possible interferences, and safety precautions for each method and provide the tools needed to perform complete safety analyses. _______________________________________________________________________ 18 No. 44, WHO Collaborating Centre for Air Quality Management and Air Pollution Control NEWSLETTER ________________________________________________________________________ COming events 2010 March 2010 Climate Change – Global Risks, Challenges and Decisions 10-12 March, Copenhagen, Denmark. For more information, see: http://climatecongress.ku.dk. 2010 AAAR Air Pollution and Health International Speciality Conference 22-26 March, San Diego, California, USA. For more information, see: http://www.aaar.org/2010Spec/. Forest Fires 2010 – Second Int. Conference on Modelling, Monitoring and Management Forest Fires 23-25 June, Kos, Greece. For more information, see: http://www.wessex.ac.uk/fires2010cfp.html. August 2010 Seventh International Conference on Indoor Air Quality, Ventilation and Energy Conservation in Buildings April 2010 15-18 August, Syracuse, New York, USA. For more information, see: http://www.IAQVEC2010.org/. Sustainable City 2010 – Sixth International Conference on Urban Regeneration and Sustainability September 2010 14-16 April, La Coruña, Spain. For more information, see: http://www.wessex.ac.uk/city2010rem1.html. 15th World Clean Air and Environmental Protection Congress May 2010 12-16 September, Vancouver, Canada. More information will be available soon at: http://iuappa.com/index.htm. Third International Conference on Environmental Toxicology 2010 Oktober 2010 4-6 May, Cyprus. For more information, see: http://www.wessex.ac.uk/toxicology2010rem3.html. 16th Urban Transport 2010 5-7 May, Cyprus. For more information, see: http://www.wessex.ac.uk/urban2010. Fourth Central and Eastern European Conference on Health and the Environment 10-13 October, Prague, Czech Republic. For more information, see: www.ceeche.org. December 2010 June 2010 HARMO 13 - 13th Int. Conference on Harmonisation within Atmospheric Dispersion Modelling for Regulatory Purposes 1-4 June, Paris, France. For more information, see: http://www.aria.fr/harmo/. Health and Solidarity - 10th International Seminar on Medical Geography 16-18 December, Rome, Italy. More information will be available soon. 2011 10th Urban Environment Symposium 9-11 June, Gothenburg, Sweden. For more information, see: http://www.hues.se/. June 2011 Urban Environmental Pollution Indoor Air 2011 20-23 June, Boston, Massachusetts, USA. For more information, see: http://www.uep2010.com/index.asp. 5-10 June, Austin, Texas, USA. For more information, see: http://lifelong.engr.utexas.edu/2011/. Air Pollution 2010 – 18th International Conference on Modelling, Monitoring and Management of Air Pollution October 2011 21-23 June, Kos, Greece. For more information, see: http://www.wessex.ac.uk/air2010cfp.html. Air Quality Eight 24-27 October, Arlington, Virginia, USA. For more information, see: http://www.undeerc.org/AQ8/. _______________________________________________________________________ No. 44, WHO Collaborating Centre for Air Quality Management and Air Pollution Control 19 NEWSLETTER ________________________________________________________________________ EDITORS‘ NOTE We appreciate submissions to NOTES AND NEWS regarding programmes and projects within the field. Notes (100-500 words) should be sent directly to the WHO Collaborating Centre for Air Quality Management and Air Pollution Control. The NEWSLETTER is published twice a year, circulated in 2000 issues, and distributed to readers in more than 50 countries. The NEWSLETTER does not constitute formal publications; it should not be reviewed, abstracted or quoted without prior permission. Authors alone are responsible for their articles. Cover Cartoon by Prof Michael Wagner, Berlin published by WHO COLLABORATING CENTRE FOR AIR QUALITY MANAGEMENT AND AIR POLLUTION CONTROL at the - FEDERAL ENVIRONMENT AGENCY GERMANY Postal address: P.O. Box 330022 D-14191 Berlin Germany Office: Corrensplatz 1 D-14195 Berlin Germany Telephone: + 49-30-8903-1280/81/82 Telefax: + 49-30-8903-1283 www.umweltbundesamt.de/whocc/titel/titel21.htm _______________________________________________________________________ 20 No. 44, WHO Collaborating Centre for Air Quality Management and Air Pollution Control


© Copyright 2026