
Whatcom Docs Position Statement on Coal Shipments to Cherry Point
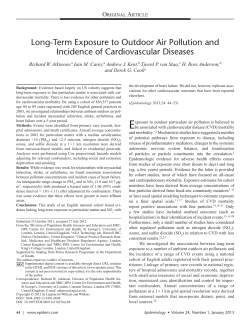
Whatcom Docs Position Statement on Coal Shipments to Cherry Point The proposed coal shipping terminal at Cherry Point will mean eighteen or more one-and-a-half mile long trains traveling across the state and through our communities each day and nearly 400 enormous ships traversing our waterways each year, releasing significant amounts of diesel particulate matter and coal dust, causing significant delays at many rail crossings, increased risk of vehicle and pedestrian injuries along the tracks, and increased noise pollution. As a group of local physicians, we are deeply concerned about the health and safety impacts of this proposal. Our careful review of the data published in peer-reviewed medical journals shows that: Diesel particulate matter is associated with (See Appendix A, C): -impaired pulmonary development in adolescents; -increased cardiopulmonary mortality and all-cause mortality; -measurable pulmonary inflammation; -increased severity and frequency of asthma attacks, ER visits, and hospital admissions in children; -increased rates of myocardial infarction (heart attack) in adults; -increased risk of cancer. Coal dust contains toxic heavy metals and has been associated with (See Appendix B): -emphysema, chronic bronchitis, and malignancy. Noise exposure causes (See Appendix D): - cardiovascular disease, including increased blood pressure, arrhythmia, stroke, and ischemic heart disease; -cognitive impairment in children; -sleep disturbance and resultant fatigue, hypertension, arrhythmia, and increased rate of accidents and injuries; -exacerbation of mental health disorders such as depression, stress and anxiety, and psychosis. Frequent long trains at rail crossings will mean (See Appendix E): -delayed emergency medical service response times; -increased accidents, traumatic injury and death. The effects of air pollution are not hypothetical, but real and measureable. Many of the reviewed studies, some of which were conducted in the Seattle area, show significant health effects of exposure to everyday airborne pollutant levels that are below national U.S. Environment Protection Agency (EPA) guidelines. The data show a linear effect with no specific "safe threshold." The conclusion that airborne pollutants pose a significant and measurable health risk was also found by the American Lung Association, in their review "State of the Air 2011", and by the American Heart Association, in their 2011 review "Particulate Matter Air Pollution and Cardiovascular Disease”. Puget Sound is in particular danger from diesel air pollution. A recent study from the NationalScale Air Toxics Assessment released by the EPA states that, "The Puget Sound region ranks in the country's top five percent of risk for exposure to toxic air pollution." A study in 2010 by the Puget Sound Clean Air Agency and the University of Washington showed that "Diesel emissions remain the largest contributor to potential cancer risk in the Puget Sound area". . http://www.pscleanair.org/news/newsroom/releases/2011/03_11_11_NATA.aspx As physicians, we feel the risks to human health from massive coal shipments across our state and through our communities are significant, and we call for a comprehensive Health Impact Assessment, in addition to an Environmental Impact Statement, addressing these issues along the entire rail corridor. While these studies are highly complex and require substantial resources and oversight, we feel they will, if done correctly, reveal that the potential for harm to human health and our environment are considerable and should not be ignored. A scientific review of these health issues is available in the Appendices A-E to this Statement. Key References: American Heart Association statement: http://circ.ahajournals.org/content/121/21/2331.full.pdf American Lung Association statement: http://www.stateoftheair.org/2011/assets/SOTA2011.pdf Whatcom Docs Review of Peer-Reviewed Medical Literature available at: http://www.ToBeDetermined.org --this latter reference/link can be included in published versions where Appendices cannot be printed With Respect, Whatcom Docs Camilla Allen, MD Daniel Austin, MD Diane Arvin, MD Barbara Bachman, MD Laura Backer, MD Kristi Bailey, MD Terri Blackburn, MD Pete Beglin, MD Claire Beiser, MD, MPH Don Berry, MD Richard Binder, MD Nancy Bischoff, MD Allan Buehler, MD David Cahalan, MD Soren Carlsen, MD Joshua Cohen, MD Andrew Coletti, MD Paul Conner, MD Kirstin Curtis, ARNP Jan Dank, MD Marc Davis, MD Joe Deck, MD Katherine Dickinson, MD Peter Dillon, MD Thang Do, MD Mark Doherty, MD Kevin Dooms, MD Jim Eggen, MD Jerry Eisner, MD David Elkayam, MD Laurie Emert, MD Anneliese Floyd, MD Ryan Fortna, MD, PhD Dianne Foster, ARNP Randy Frank, DO Eric Frankenfeld, MD Jonathan Franklin, MD Anthony Gargano, MD Ken Gass, MD, PhD Jeremy Getz, MD Robert Gibb, MD Stan Gilbert, MD Martha Gillham, MD Lorna Gober, MD David Goldman, MD Aaron Gonter, MD Erin Griffith, MD Deborah Hall, MD Tom Hall, MD William Hall, MD David Hansen, MD James Harle, MD Emil Hecht, MD Grayce Hein, ARNP Michael Hejtmanek, MD Harry Herdman, MD Marcy Hipskind, MD John Holroyd, MD Jim Holstine, DO Sherry Holtzman, MD Will Hong, MD John Hoyt, MD Bao Huynh, MD Kellie Jacobs, MD Meg Jacobson, MD Gertrude James, ARNP Frank James, MD Helen James, MD Lisa Johnson, ARNP David Jessup, MD Mitchell Kahn, MD Cary Kaufman, MD Daniel Kim, MD Annie Kiesau, MD Carter Kiesau, MD Gail Knops, MD Joost Knops, MD Ann Knowles, MD Andrew Kominsky, MD Pamela Laughlin, MD Sandy George Lawrence, MD Josie Lee, MD Tyler Leedom, DO Kathy Leone, MN, ARNP Rick Leone, MD, PhD Linda Leum, MD Hank Levine, MD Chris Lewis, DO Serge Lindner, MD Kelly Lloyd, MD Bill Lombard, MD Jonathan Lowy, MD Leasa Lowy, MD Thomas Ludwig, MD Bruce Mackay, MD Margaret Mamolen, MD Vincent Matteucci, MD Dick McClenahan, MD Marianne McElroy, PA Monica Mahal, MD Scott McGuinness, MD Judson Moore, PA David Morison, MD Gib Morrow, MD Larry Moss, MD Sara Mostad, MD, PhD Ward Naviaux, MD John Neutzmann, DO Deborah Oksenberg, MD David Olson, MD Rob Olson, MD Patricia Otto, MD Tracy Ouellette, MD Mark Owings, MD, PhD Evelyn Oxenford, ARNP Clark Parrish, MD Mike Pietro, MD Trevor Pitsch, MD Denise Plaisier, PA Ronda Pulse, MD Gita Rabbani, MD Andris Radvany, MD Jon Ransom, MD Christoph Reitz, MD Niles Roberts, MD William Scott Sandeno, MD Paul Sarvasy, MD Neal Saxe, MD James Schoenecker, MD Julie Seavello, MD R. Milton Schayes, MD Barbara Schickler, ARNP, CNM Melana Schimke, MD Miriam Shapiro, MD Janine Shaw, MD John Shaw, MD Mary Ellen Shields, MD Hannah Sheinin, MD Russell Sheinkopf, MD Lora Sherman, MD Alan Shurman, MD Bonnie Sprague, ARNP Berle Stratton, MD Jenny Sun, MD Gregory Sund, MD Mary Swanson, MD Warren Taranow, DO Michael Taylor, MD M. Greg Thompson, MD, MPH Teresa Thornberg, MD Loch Trimingham, MD Elizabeth Vennos, MD Steve Wagoner, MD April Wakefield Pagels, MD Heather Whitaker, ARNP Sara Wells, ARNP Anne Welsh, MD Greg Welsh, MD Susan Willis, ARNP David Wisner, MD Steven Wisner, MD Todd Witte, MD Chao-ying Wu, MD Greg Wolgamot, MD, PhD Stephen Woods, MD Darla Woolman, PA Jessica Yoos, MD APPENDIX A: Pulmonary Impacts of Airborne Pollutants (including diesel particulate matter): The notion that air pollution can have a direct and measurable impact on human health is not a new one. On Dec. 5, 1952, a London temperature inversion led to an increase in airborne fossil fuel pollutants that caused an estimated excess 4000 deaths. Similar acute events have been observed in Belgium and Pennsylvania (Schenker, M. editorial 1993, New Engl J Med 329(24):1807-1808). Since that time, and particularly in the 1990's and 2000's, numerous studies have been conducted that demonstrate measurable adverse effects associated with pollutant levels, not just associated with severe inversions, but at ongoing levels that currently exist in the United States. Airborne pollution can be measured by multiple parameters, including carbon monoxide, ozone, NO2, NO3, and particulate matter (PM). Much focus has been on PM2.5, which refers to particulate matter with particle diameter < 2.5 microns. These particles appear to be particularly deleterious to health, as the small size enables deposition in the distal pulmonary air spaces. The EPA has recognized this, and strengthened PM2.5 standards 2006 to 35ug/mm3 daily, and 15ug/mm3 annual average. PM2.5 in the Puget Sound area is usually between 10 and 30, often 40, with spikes up to 60 ug/mm3. The majority of particulate matters is derived from combustion of fossil fuels, particularly diesel. Coal dust also contributes to particulate matter. The pulmonary health impact of air pollution has been measured in many ways. These include measurements of lung function (pulmonary function studies), measurements of lung inflammation, increased rate and severity of asthma attacks, increased ER visits and hospital admissions, and remarkably, even increased death rates (mortality rates). These studies show data of statistical significance, and some of the studies have even been done in the Puget Sound area, with exposure to everyday pollutant levels that are often below national EPA guidelines. Listed below are key findings of relevant studies, divided into sections regarding A) impaired pulmonary development and function; B) increased childhood asthma attacks, ER visits, and hospitalizations; and C) increased mortality and decreased life expectancy. These studies are not relegated to obscure journals; most of these are in major peer-reviewed medical journals. A more complete description of each listed study can be found at the end of this appendix in "Summary of Studies," and further details can be found in the primary references. A. Impaired pulmonary development and function: Airborne pollution has been associated with: Reduction in pulmonary development in adolescents, measured by decreased pulmonary function test (PFT) results in adolescents. (Gauderman, W. et al. 2004. The effect of air pollution on lung development from 10 to 18 years of age. New Engl J Med 351(11):1057-1067). Decreased pulmonary function in young, healthy people, measured at pollution levels far below EPA standards. (Thaller, E. et al. 2008. Moderate increases in ambient PM 2.5 and ozone are associated with lung function decreases in beach lifeguards. J Occup Environ Med. 50:202-211.) Measurable pulmonary inflammation, induced by airborne particulate matter, which may be undetectable by symptoms or pulmonary function tests. (Ghio, A. J et al. 2000. Concentrated ambient air particles induce mild pulmonary inflammation in healthy human volunteers. Am J Respir Crit Care Med 162: 981-2000). B. Childhood asthma attacks, ER visits, and hospital admissions: Airborne pollution has been associated with: Increased frequency and severity of asthma attacks in children; a 10ug/m 3 increase in PM2.5 was associated with a 1.2 fold increase chance of having a severe attack (including a prolonged attack lasting >2 hr). Study done in Seattle; Seattle area shown to range between 10 and 60 ug/m3, with most days between 10 and 40. (Slaughter, J. C. et al. 2003. Effects of ambient air pollution on symptom severity and medication use in children with asthma. Ann Allergy Asthma & Immunol 91:346-353.) Increased ER visits in children, with a relative risk of 1.15 for every increase in PM 10 of 11ug/mm3. This study was conducted in Seattle, and the effect was observed even when PM2.5 was below the National Ambient Air Quality Standards of 15ug/mm 3. (Norris, G. et al. 1999. An association between fine particles and asthma emergency department visits for children in Seattle. Environ Health Perspect 107:489-493.) Increased hospital admissions for children with asthma, with an odds ratio of 1.93 for those living within 200m of roads traveled by diesel trucks. Diesel trucks are noted to produce as much as 100x as much particulate matter as gasoline-powered vehicles. (Lin, S. et al. 2002. Childhood asthma hospitalization and residential exposure to state route traffic. Environ Res Sect A 88:73-81.) Increased risk of hospital admissions for pneumonia, acute bronchitis, and asthma. Children < 5 were particularly susceptible. Increased risk of 4-7% were observed for each interquartile range. (Ostro, B. et al. 2009. The effects of fine particle components on respiratory hospital admissions in children. Environ Health Perspect 117(3):475480.) C. Increased mortality and decreased life expectancy: Airborne pollution has been associated with: Increased mortality in more heavily polluted cities. A relative risk of 1.26 was identified for living in the most heavily polluted city than the least polluted city. This relative risk was equivalent to that of a 25 pack-year smoking history. (Dockery, D. et al. 1993. An association between air pollution and mortality in six US cities. New Engl J Med 329(24): 1753-1759.) Increased cardiopulmonary mortality in cities with higher particulate matter, with relative risk of 1.26-1.31, corresponding to 8 to 10 deaths/year/100,000 people in metropolitan areas (Pope, C. A. III et al. 1995. Particulate air pollution as a predictor of mortality in a prospective study of U.S. adults. Am J Respir Crit Care Med 151: 669674.) Increased cardiopulmonary mortality, with a linear relationship of 4%, 6%, and 8% increased risk of all-cause, cardiopulmonary, and lung cancer mortality for each 10 ug/m3 increase in PM 2.5 (Pope, C. A. III et al. 2002 Lung cancer, cardiopulmonary mortality, and long-term exposure to fine particulate air pollution. JAMA 287: 1132-1141.) Increased risk of all-cause and cardiopulmonary mortality associated with long term exposure to PM 2.5 and constituents. A 10 ug/mm3 increase in PM 2.5 was associated with a mortality hazard ratio of 2.05. The ranges of PM 2.5 in this study are similar to those observed in the Seattle area. (Ostro. B. et al. Long-term exposure to constituents of fine particulate air pollution and mortality: results from the California Teachers Study. Environ Health Perspect 118(3):363-369.) Decreased life expectancy, of 0.7 to 1.6 years of life expectancy due to long-term exposure to PM2.5 of 10 ug/mm3. Accordingly, improving air quality can result in a measurable increase in life expectancy, demonstrating that public policy regarding protection of air quality can have a measurable impact on life expectancy. (Pope, C. A. et al. 2009. Fine-particulate matter air pollution and life expectancy in the United States. New Engl J Med 360(4):376-386.) The conclusion that airborne pollutants pose a significant and measurable health risk was also found by the American Lung Association, in its review "State of the Air 2011". Specifically, they concluded that the data collectively shows increased risk of death from respiratory and cardiovascular causes, including strokes and lung cancer; increased mortality in infants and young children; increased numbers of heart attacks, especially among the elderly and in people with heart conditions; inflammation of lung tissue in young, healthy adults; increased hospitalization for cardiovascular disease, including strokes and congestive heart failure; increased emergency room visits for patients suffering from acute respiratory ailments; increased hospitalization for asthma among children, and increased severity of asthma attacks in children. According to the American Lung Association, "The evidence warns that the death toll is high. Although no national tally exists, California just completed an analysis that estimates that 9,200 people in California die annually from breathing particle pollution..." (http://www.stateoftheair.org/2011/assets/SOTA2011.pdf) The EPA also conducted a thorough review of the current research on particle pollution in December 2009. The Clean Air Scientific Advisory Committee consisted of a panel of expert scientists, who concluded that particle pollution caused multiple, serious threats to health. They found that pollution causes early death (both short-term and long-term exposure), cardiovascular harm (heart attacks, strokes, heart disease, congestive heart failure), respiratory harm (worsened asthma, worsened COPD, inflammation), and may cause cancer and reproductive and developmental harm. (American Lung Association, State of the Air 2011) Puget Sound is also in particular danger from airborne pollutants. The National-Scale Air Toxics Assessment (NATA), a study also by the EPA, indicated that the Puget Sound region ranks in the country’s top 5% of risk for exposure to toxic air pollution, with risks including cancer, heart disease, lung damage, and nerve damage. "According to this study, diesel- and gasoline-powered engines account for over 90 percent of the risk from air toxics to Puget Sound residents," said Craig Kenworthy, Executive Director of the Puget Sound Clean Air Agency. "If we're serious about protecting public health, we must redouble our efforts as a region to reduce pollution from vehicles and diesel pollution in particular." http://www.pscleanair.org/news/newsroom/releases/2011/03_11_11_NATA.aspx Consistent with this view, the Puget Sound Clean Air Agency (representing King, Kitsap, Pierce, and Snohomish Counties) assembled the Particle Matter Health Committee, which felt that federal standards were not sufficiently protective for human health, and set goals for PM2.5 of 25ug/mm3 daily, and 15ug/mm3 annual average. (The 2006 EPA standards for PM2.5 are 35ug/mm3 daily, and 15ug/mm3 annual average.) It is noted that of the four represented counties, two violate the federal standards, and three violate the goals of the Puget Sound Clean Air Agency. (http://www.pscleanair.org) In summary, the adverse effects of air pollutants, which largely represent diesel combustion particular matter but would also include coal dust, are not hypothetical. There is a multitude of studies that show real and measureable effects, not only in high exposure areas (such as coal mines) but also with normal routine environmental exposures (even within federal guidelines), and in the Puget Sound area. These effects can be measured in many ways, and include direct measurements of inflammation in the lungs and pulmonary function tests, increased asthma attacks, increased ER visits, increased hospital admissions, and even increased mortality rates (including by cardiopulmonary causes, lung cancer, and remarkable, even overall mortality). The represented studies have statistically significant data, show a linear effect, and indicate that there is no purely safe threshold. This is not a hypothetical issue. The data indicates that adding additional large sources of diesel and particulate matter pollution in the Puget Sound region would exacerbate human health problems that are already documented to be present. References/Summaries of Studies: Mortality & Life Expectancy Pope, C. A. et al. 2009. Fine-particulate matter air pollution and life expectancy in the United States. New Engl J Med 360(4):376-386. The life expectancy of 51 metropolitan areas spread across the United States was compared from 19791983 and 1999-2000. During this time period, particle air pollution decreased by an average of 6.52 ug/mm3, and life expectancy increased 2.72 years. Prior indirect calculations reportedly showed a loss of 0.7 to 1.6 years of life expectancy due to long-term exposure to PM2.5 of 10 ug/mm3. In this study, after adjustment for socioeconomic, demographic, and proxy variables for smoking, a decrease of PM 2.5 of 10ug/mm3 was associated with an increase in life expectancy of 0.61 years. This study shows that public policy (enforcement of clean air standards) can have a measurable impact in life expectancy. Dockery, D. et al. 1993. An association between air pollution and mortality in six U.S. cities. New Engl J Med 329(24): 1753-1759. 8111 people living in 6 different cities were studied over a 14-16 year period (111,076 person-years). The 6 cities chosen have varying levels of pollution, which were stratified with 6 measurements (including particulate matter). Causes of death were analyzed. Increased mortality was associated with cigarette smoking (RR 1.59 for current smokers, 1.26 for a 25 pack-year history), obesity (RR 1.08), and ambient air pollution (RR 1.26 when comparing the most and least polluted cities, p< 0.001). The increased mortality was restricted to cardiopulmonary-related deaths (including lung cancer), persisted after controlling for hypertension, smoking, and occupational exposure, and showed a dose-response curve when examining the cities from least-polluted to most-polluted. There was not an increased risk of death due to non-cardiopulmonary causes. This study demonstrates that people living in more polluted cities have a significant mortality increase that is equivalent to a 25 pack-year smoking history. Pope, C. A. III et al. 1995. Particulate air pollution as a predictor of mortality in a prospective study of U.S. adults. Am J Respir Crit Care Med 151: 669-674. Data from 552,138 people living in 151 US metropolitan areas was used to determine relative risk for death by living in more polluted cities (as measured by particulate air pollution, predominantly generated by burning fossil fuels). Increased mortality due to cardiopulmonary causes was associated with current smoking (RR 2.28) and living in cities with higher particulate matter (RR 1.26 when measured by sulfite particles, and 1.31 when measured by elevated fine particles, p<0.001). The association with air pollution was consistent among smokers and nonsmokers. This corresponds to an increase of 8 to 10 deaths/year/100,000 people. This study confirms Dockery's observations that deaths due to air pollution in US communities can be measured. Ostro. B. et al. 2009. Long-term exposure to constituents of fine particulate air pollution and mortality: results from the California Teachers Study. Environ Health Perspect 118(3):363-369. Data from the California Teachers Study (encompassing 45,000 active and former teachers, with 2600 deaths, over a 5 year period) was analyzed to examine correlates between air pollution (with monthly averages of PM 2.5 constituents) and mortality causes. Long term exposure to PM 2.5 and constituents was associated with increased risk of all-cause and cardiopulmonary mortality. A 10 ug/mm3 increase in PM 2.5 was associated with a HR of 2.05. The ranges of PM 2.5 in this study are similar to those observed in the Seattle area. Pope, C. A. III et al. 2002 Lung cancer, cardiopulmonary mortality, and long-term exposure to fine particulate air pollution. JAMA 287: 1132-1141. This is a very large study encompassing 500,000 adults in 51 metropolitan areas of the US over 16 years. Causes of death were compared with measures of pollution. Elevated all-cause mortality, cardiopulmonary mortality, and lung cancer mortality was observed with statistical significance in more polluted areas, even after extensively controlling for smoking, BMI, diet, education, occupational exposure, and regional differences. No association with non-cardiopulmonary mortality was observed. The increase in mortality was found to be linear with elevated pollution, with each 10 ug/m3 increase in PM 2.5 (particulate matter <2.5 um) associated with a 4%, 6%, and 8% increased risk of all-cause, cardiopulmonary, and lung cancer mortality. The all-cause mortality risk was found to be comparable to moderate obesity. This study reaffirms prior findings of other studies that particulate matter is associated with a measureable increase in mortality in the U.S., and further defines a linear dose-response relationship. References/Summaries of Studies: Pulmonary development & effects Gauderman, W. et al. 2004. The effect of air pollution on lung development from 10 to 18 years of age. New Engl J Med 351(11):1057-1067 Children's Health Study: The lung function of 1759 adolescents (average age at start of study 10y) in 12 California communities was measured annually for eight years. This age is an important period of lung maturation, as measured by increases in FEV1 and FVC. Children living in the more polluted communities (as measured by particulate matter, O3, NO2, and airborne carbon) showed significant deficits in pulmonary development as compared to those living in less polluted communities (multiple parameters showed p<0.05). For example, children in the most polluted community had a 5x greater risk of having low FEV1 (using the clinical definition as < 80% predicted value) by the age of 18 (7.9% vs 1.6%). The effect was similar to exposure to passive smoking that was shown in prior studies, and less pronounced as a history of personal smoking. Exposure-response relationship nearly linear, with no discernable safe thresholds (review of study by Pope, NEJM 351(11):1132-1134.) This study indicates that current levels of pollution in some areas have a negative impact on lung development in adolescents. Thaller, E. et al. 2008. Moderate increases in ambient PM2.5 and ozone are associated with lung function decreases in beach lifeguards. J Occup Environ Med 50:202-211. The change in lung function (FVC and FEV1) in the morning vs afternoon was measured in 142 lifeguards, and correlated with daily pollution indices (primarily PM2.5 and ozone). Normally, pulmonary function increases throughout the day, but in this study the pulmonary indices declined with increasing pollution. The magnitude was not huge, but many measurements showed statistical significance. An important aspect of this study is that statistically significant decreases in pulmonary performance could be demonstrated in young healthy adults at exposures far below EPA Air Quality Standards. (EPA has an unhealthy level of PM2.5 at 35ug/mm3 for 24hr, and 15 ug/ml for annual exposure. The measurements in the study only exceeded 35ug/mm3 once over the three year study period, yet significant effects could be measured.) Ghio, A. J et al. 2000. Concentrated ambient air particles induce mild pulmonary inflammation in healthy human volunteers. Am J Respir Crit Care Med 162: 981-2000. 38 healthy young volunteers (average age 18-40, no history of allergies, asthma, or other pulmonary disease) were exposed to ambient air (control; 8) or concentrated air particles from ambient Chapel Hill air (30) for 2 hours. Exposure to the concentrated air particles was associated with measureable increases in inflammation, as determined by neutrophils counts on BAL specimens obtained 18 h after exposure (8.44 vs 2.29% for the bronchial fraction, and 4.20 vs 0.75% in the alveolar fractions). The data is statistically significant. The increases in inflammation were despite no reported symptoms or changes in pulmonary function tests. Although the exposures were to higher concentrations that are typically found in US polluted areas, it is noted that the exposure was for only 2 hr rather than years. This study shows that particulate matter can induce measurable pulmonary inflammation which may be asymptomatic or undetectable by PFTs. Slaughter, J. C. et al. 2003. Effects of ambient air pollution on symptom severity and medication use in children with asthma. Ann Allergy Asthma & Immunol 91:346-353. 133 children in the greater Seattle area with asthma were monitored for asthma attacks, which were correlated with daily pollution measurements over 28 to 122 days. Severity of attacks was recorded by subjective self report, as well as recording the dosage and puffs of medication. Pollution measurements consisted of particulate matter (PM) and carbon monoxide (CO) at 12 area stations. PM2.5 was found to correlate more with time than locale. Of note, the Seattle area appears to vary between 10 and 60 ug/m3, with most measurements between 10 and 40. Each 10ug/m3 increase was associated with a 1.2 fold increase chance of having a severe attack (including a prolonged attack lasting >2 hr), with a 1.08 fold increase in rescue inhaler use. Time spent indoors vs outdoors was not recorded, and thus the true impacts may be greater than the observed effects. References/Summaries of Studies: ER visits and hospitalization rates Norris, G. et al. 1999. An association between fine particles and asthma emergency department visits for children in Seattle. Environ Health Perspect. 107:489-493. The Seattle-King County Dept. of Public Health issued a report that showed that the hospitalization rate for children with asthma was >6x greater for children living in the inner city than in suburbs. Thus, this study was created to determine if an association with air pollution exists. Daily air pollution data was collected and correlated with data for ER visits in 6 Seattle area hospitals over 15 months. The majority of the ER visits were at Seattle Children's Hospital. Every increase in PM of 11 ug/mm3 was associated with a relative rate of 1.15 for ER visits. These changes were seen even when PM2.5 was below the National Ambient Air Quality Standards of 15ug/mm3. Lin, S. et al. 2002. Childhood asthma hospitalization and residential exposure to state route traffic. Environ Res Sect A 88:73-81. 417 children (age 0-14) who were hospitalized for asthma exacerbations were compared to 461 controls who were admitted for other reasons. After controlling for age, education and poverty levels, home addresses were analyzed for area traffic information. Children hospitalized for asthma were more likely to live on roads in the highest tertile of vehicle miles traveled. An odds ratio of 1.93 was associated with living within 200m of roads traveled by trucks and trailers, as compared to control subjects. It is also noted in the paper that heavy duty diesel trucks emit as much as 100x as much particulate matter as gasoline powered vehicles (reference not reviewed; Hildemann L. M. et al. 1991. Environ Sci Technol 14:138-152). Ostro, B. et al. The effects of fine particle components on respiratory hospital admissions in children. Environ. Health Perspect. 117(3):475-480. ICD-9 codes for admissions for children < 19 and <5 (for hospital admissions in 6 California counties from 2000-2003, in which county air pollution statics were available) were correlated with multiple pollutant levels. Children <5 were found to be particularly susceptible. Increased risks of 4-7% were observed for admissions for pneumonia, acute bronchitis, and asthma for each interquartile range. APPENDIX B: Health Impacts of Coal Dust The mining, processing and transport of raw coal will result in a certain proportion of that coal fracturing into dust and becoming airborne. Coal dust can become airborne in particle sizes smaller than 500 microns, with the fraction smaller than 10 microns (PM10) being particularly important, as particles in this size range can be inhaled into the respiratory alveoli. Several health problems can result from respirable coal dust, the most severe of which is Coal Worker’s Pneumoconiosis (CWP), commonly known as Black Lung Disease, a progressive, incurable, and often fatal disease (Hathaway et al 1991). Despite industry standards that have been in place since 1969, respirable coal dust from coal mining is currently responsible for the deaths of approximately 700 miners and ex-miners in the United States each year. To put this statistic in perspective, this is over 20 times the number killed in last year’s West Virginia coal mine explosion, a tragedy incidentally caused by the ignition of coal dust (Mine Safety and Health Administration briefing September 2010). Respirable coal dust can also exacerbate asthma and COPD, and cause chronic bronchitis even in non-smoking coal miners, at rates which approximate heavy smokers (Marine et al 1988). The health impacts of respirable coal dust on underground coal miners, exposed to high levels of coal dust for extended periods, are well known and incontrovertible. There may also be severe risks of exposure to lower levels of coal dust. A recent study by researchers from the University of West Virginia examined a population of relatively young miners who developed the most severe form of CWP, even while exposed to currently legal and well-regulated levels of coal dust (Wade, et al 2010). Animal studies suggest reasons for why this is so. Vincent et al (1987), using a rat model, examined the pulmonary burden throughout a wide range of coal dust exposures, and found that pulmonary clearance mechanisms tend to sequester the dust in lymphatic tissue and the interstitial space between alveoli. This sequestration renders the further clearance mechanisms of the lung inoperable, and facilitates the inflammatory cascade, similar to the pathogenesis of silicosis. Studies such as this suggest that our current ―threshold‖ model of allowing exposure up to a certain regulatory limit is likely to be in error, as pulmonary inflammation and the resultant fibrosis are found over the entire range of exposures. In addition, the synergy of respirable coal dust with other pollutants, such as diesel particulate matter, may accelerate the damage beyond what would be predicted by the epidemiological mine data (Karagianes 1981). Less well studied are the epidemiological effects of respirable coal dust in lower concentrations, or exposure for shorter periods, as can occur for individuals living in proximity to transport lines and processing centers such as proposed Gateway Pacific Terminal. The Burlington Northern Santa Fe (BNSF) Railroad has performed studies of fugitive coal dust emissions along their own rail lines, but these data have not been made public (Cornell Hatch Queensland Rail Study 2008). There are data from other sources on fugitive emissions from open-topped coal cars, such as the cars currently used by BNSF. A 1993 study on a West Virginia rail line, transporting bituminous coal similar to the coal from the Powder River Basin, showed loss of coal dust of up to a pound of coal per mile per car (Simpson Weather Associates, 1993). This loss occurs throughout the entire transport, as the mechanical fracturing of the coal continuously produces fugitive dust as the coal settles. There are even substantial coal dust emissions on the return trip, as the ―empty‖ cars actually contain a significant quantity of fine particles known as ―carry back‖ (Cornell Hatch 2008). In addition to the dust emission from coal cars, the terminal processing, storage, and shipping of coal, such as is planned for the Gateway Pacific Terminal, can lead to even higher fugitive emissions, approximating those of an open pit coal mine (Ghose and Majee, 2007). In this study of airborne monitoring around an open pit mine in India, and in the attendant transport corridor, PM10 episodically approached levels that would be considered in violation of OSHA standards in the United States, and the residential areas up to 2.5 km away from the mine boundary showed PM10 above baseline for the region. In the absence of data from proprietary internal studies conducted by BNSF, as noted above, it is difficult to accurately predict the airborne respirable dust load for our specific community from the proposed transport of coal to and from the Gateway Pacific Terminal. Quite apart from the respirable fraction, however, fugitive coal dust emissions are an undeniable and costly nuisance pollutant to businesses and residences along a rail line, or near a coal terminal, with substantial economic impact simply due to the need for frequent cleaning (Cope et al 1994, from a British Columbia study). Finally, coal dust in all size fractions contains varying amounts of heavy metal contaminant such as Lead, Mercury, Chromium (Sharma and Singh 1991) and Uranium, particularly in coals from the Powder River Basin. Whether this contamination will lead to a substantial health impact deserves further study, in the form of a formal assessment by the Department of Health, or within the context of a comprehensive environmental impact study. In summary, airborne fugitive coal dust emissions will occur from the transport of coal to and from the Gateway Pacific Terminal, the largest coal terminal ever proposed for the west coast of North America. These emissions will certainly result in nuisance pollution. The health effects for our community’s citizens can be predicted, but not known, for many years to come. Coal Dust References Hathaway GJ, Proctor NH, Hughes JP 1991. Proctor and Hughes’ chemical hazards of the workplace, 3rd Edition. New York, NY: Van Nostrand Reinhold Marine WM, Gurr D, Jacobsen M 1988. Clinically important respiratory effects of dust exposure and smoking in British coal miners. Am Rev Resp Dis. 137:106-112. Wade WA, Petsonk EL et al. 2010. Severe occupational pneumoconiosis among West Virginia coal miners: 138 cases of progressive massive fibrosis compensated between 20002009. Chest 139(6):1458-1463. Vincent JH, Jones AD, Johnston AL et al. 1987. Accumulation of inhaled mineral dust in the lungs and associated lymph nodes: implications for exposure and dose in occupational settings. Annals of Occupational Hygeine 31(3):375 – 393. Karagianes MT, Palmer RF, Busch RH 1981. The effects of inhaled diesel emissions and coal dust in rats. American Industrial Hygeine Journal. Volume 42(5):382 – 391 Queensland Government Environmental Protection Agency Report. 2008. Environmental evaluation of fugitive coal dust emissions from coal trains Goonyella, Blackwater, and Moura coal rail systems, Queensland rail limited. Connell Hatch and Co. Final Report. Simpson Weather Associates 1993. Norfolk southern rail emission study: consulting report prepared for Norfolk Southern Corporation. Charlottesville, VA Ghose MK, Majee SR. 2007. Characteristics of hazardous airborne dust around an Indian surface coal mining area. Environmental Monitoring and Assessment 130:17-25. Cope D, Wituschek W, Poon D et al. 1994. Report on the emission and control of fugitive coal dust from coal trains. Regional Program Report 86 – 11. Environmental Protection Service, Pacific Region British Columbia Canada. Sharma PK, Singh G. 1991. Distribution of suspended particulate matter with trace element composition and apportionment with possible sources in Raniganj coalfield India. Envrionmental Monitoring and Assessment 22:237 - 244. APPENDIX C: Cardiovascular Impacts of Airborne Pollutants (including particulate matter): Review of the scientific literature indicates that the human body, in particular the cardiopulmonary system, is not equipped to safely process the toxic side effects of air pollution any better than it is able to process cigarette smoke. Almost all of the same physiologic reactions that occur in response to cigarette smoke occur in response to exposure to air pollution, in particular the fine particulate matter of diesel exhaust. The cardiovascular impacts of airborne pollutants have been thoroughly documented in a recent comprehensive review by the American Heart Association, with 426 peer reviewed journal article references (Particulate Matter Air Pollution and Cardiovascular Disease: An update to the Scientific Statement from the American Heart Association. Circulation 121:23312378). The conclusions of the American Heart Association, which are based on numerous studies in major peer-reviewed journals, are summarized below: Short-term exposure to PM2.5 over a period of a few hours to weeks can trigger cardiovascular-related events and mortality, including myocardial infarction (heart attacks), heart failure, arrhythmias, and strokes. People particularly at risk include the elderly, patients with pre-existing coronary artery disease, those with diabetes or obesity, and perhaps women. Long-term exposure to PM2.5 appears to increase the risk even more than short-term exposure. Cardiovascular risk appears to extend below national standards, with no safe threshold (harmful effects extend to below the PM 2.5 15ug/mm3 standard). Long-term exposure to elevated concentrations of ambient PM 2.5 at levels encountered in the present day environment reduces life expectancy by several months to a few years. Most recent studies indicate that the absolute risk for mortality due to particulate matter is even greater for cardiovascular than for pulmonary diseases. (See Appendix A for the pulmonary impacts). American Heart Association comprehensive review: Particulate Matter Air Pollution and Cardiovascular Disease: An update to the Scientific Statement from the American Heart Association. Circulation 121:2331-2378 http://circ.ahajournals.org/content/121/21/2331.full.pdf APPENDIX D: Health Impacts of Noise Pollution Noise pollution is a growing health concern in this country and around the world. The World Health Organization has recognized it as a major threat to human health and well-being. Some of the well-documented adverse health effects include: I. Cardiovascular Disease: In adults, both short-term and long-term adverse health effects have been documented including increased blood pressure, increased heart rate, vasoconstriction, elevated stress hormones such as epinephrine and cortisol, arrhythmias, ischemic heart disease, and strokes. In children, increased stress-related hormones and elevated blood pressures have especially been seen in children with lower academic achievement. II. Cognitive Impairment in Children: Children exposed to increased noise have shown lower academic achievement in various forms including reading, learning, problem solving, concentration, social and emotional development, and motivation. III. Sleep Disturbance: Noise can have both auditory and non-auditory deleterious effects on human health. Auditory effects include delay in falling asleep, frequent night time awakenings, alteration in sleep stages with reduction of REM sleep, and decreased depth of sleep. Although there may be some acclimation to the auditory effects of noise over time, non-auditory effects including increased blood pressure, increased heart rate, vasoconstriction, changes in respiration, and arrhythmia continue to have delirious effects on human health even after the subject has 'gotten used' to the noise. There are also 'after affects' of decreased alertness resulting in increased rate of accidents, injuries and premature death. IV. Mental Health: Although not a causative agent, increased noise is known to accelerate and intensify development of latent mental health disorders including depression, mental instability, neurosis, hysteria, and psychosis. It is also a major environmental cause of annoyance leading to diminished quality of life. Noise Pollution References: Berglund B, Lindvall T. (eds.) WHO Document on Guidelines for Community Noise. 1999: 39-94. Suter AH. Noise and its effects. Adminstrative Conference of the United States. 1991 Goines L, Hagler L. Noise Pollution : A modern plague. South Med J. 2007;100(3):287-294 Babisch W. Noise and Health. Environ Health Perspect 2005; 113: A14-15. Ising H, Kruppa B. Health effects caused by noise: evidence from the literature from the past 25 years. Noise Health 2004; 6: 5-13. Evans GW, Lepore SJ. Non-auditory effects of noise on children: a critical review. Children’s Environments 1993; 10: 42-72. Selander J, Milsson ME, Bluhm G, Rosenlund M, Lindqvist, M Nise G, Pershagen G. Longterm exposure to road traffic noise and myocardial infarction. Epidemiology 2009; 20(2): 272-279. Willich SN, Wegscheider K, Stallmann M, et al. Noise burden and the risk of myocardial infarction. Eur Heart J 2006; 27: 276-282. . Sørensen M, Hvidberg M, Andersen ZJ, Nordsborg RB, Lillelund KG, Jakobsen J, Tjønneland A, Overvad K, and Raaschou-Nielsen O. Road traffic noise and stroke: a prospective cohort study. European Heart Journal 2011; 32(6): 737-744. Evans GW, Hygge S, Bullinger M. Chronic noise and psychological stress. Psychol Sci 1995; 6: 333–8 Haines MM, Stansfeld SA, Brentnall S, Head J, Berry B, Jiggins M, Hygge S. The West London School Study: The effects of chronic aircraft noise exposure on child health. Psychol Med 2001; 31: 1385–96 Evans GW. Ambient noise and cognitive process among primary schoolchildren. Environment and Behavior 2003, 35(6) 725-735 Cohen S, Evans GW, Krantz DS, Stokols D. Physiological, motivational and cognitive effects of aircraft noise on children: Moving from the laboratory to the field. Am Psychol 1980; 35: 231–43 Evans GW, Maxwell L. Chronic noise exposure and reading deficits: The mediating effects of language acquisition. Environ Behav 1997; 29: 638–56 Haines MM, Stansfeld SA, Job RFS, Berglund B, Head J. Chronic aircraft noise exposure, stress responses, mental health and cognitive performance in school children. Psychol Med 2001; 31: 265–77 Hygge S, Evans GW, Bullinger M. A prospective study of some effects of aircraft noise on cognitive performance in school children. Psychol Sci 2002; 13: 469–74 Stansfeld SA, Matheson MP. Noise pollution: non-auditory effects on health. Brit Med Bull 2003; 68: 243-257. Stansfeld SA, Berglund B, Clark C, et al. Aircraft and road traffic noise and children’s cognition and health: a cross national study. Lancet 2005; 365: 1942-1949. Ohrstrom E, Bjorkman M. Effects of noise-disturbed sleep: A laboratory study on habituation and subjective noise sensitivity. J Sound Vibration 1998; 122: 277-290. Carter NL. Transportation noise, sleep, and possible after-effects. Environ Int 1996; 22: 105116 Fidell S, Barber DS, and Schultz TJ. Updating a dosage-effect relationship for the prevalence of annoyance due to general transportation noise. J Acoust Soc Am. 1991, 89: 221-233. Hall F, Birnie S, Taylor SM, and Palmer J. Direct comparison of community response to road traffic noise and to aircraft noise. J Acoust Soc Am 1981, 70: 1690-1698. Bronzaft, AL., Dignan, E, Bat-Chava, Y, & Nadler NB. Intrusive community noises yield more complaints. Noise Rehabilitation Quarterly 2000, 25 : 16-22,34. APPENDIX E: Anticipated Impacts of Frequent Long Trains on Emergency Medical Service Response Times In the modern medical era, a five to ten minute delay in emergency medical service (EMS) response time can make the difference between life and death, particularly for cardiovascular events, respiratory emergencies, and trauma. The prospect of an additional eighteen trains per day – each 1.5 miles long—threatens to substantially increase the chances of critical delay in provision of emergency services to several areas in our county. Among the locations where citizens are at greatest risk of EMS delays are the arterial roads in western Whatcom County—particularly Birch Bay-Lynden Road and Slater Road. These roads are highly traveled by EMS and other vehicles. Thus, frequent prolonged closures could have a life-threatening impact. While there are alternative routes around any one crossing at these locations, the detours themselves are long and would still result in significantly prolonged emergency response times. Other affected locations include multiple highly visited areas along the Bellingham waterfront. Access to the downtown waterfront is significantly limited when D and F streets are simultaneously closed by rail traffic, as alternate routes are long and inconvenient. Boulevard Park, Fairhaven Harbor, and Marine Park are completely cut off when trains pass through the Fairhaven area. Similarly, several Chuckanut residential neighborhoods and parts of Larrabee Park are completely cut off from services while trains pass. While the impact of EMS delays is of considerable concern in Whatcom County, it may be an even greater problem for neighboring Skagit and Snohomish Counties that have a greater number of arterials that will be interrupted by rail traffic.


© Copyright 2026