
PARTICULATE MATTER AND CORONARY ARTERY DISEASE
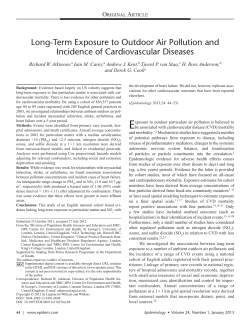
PARTICULATE MATTER AND CORONARY ARTERY DISEASE 1- Background 2- Health Effects 3- Vulnerable Population 4- Particulate Matter Standards 5- Discussion 6- Conclusion 1- Background Air pollution is the result of the emission of chemicals, particulate matter, and biologic material into the atmosphere causing subsequent repercussions on health and the environment. Air pollutant, on the other hand, is any substance in the air that may carry harm to humans or the environment. Some pollutants may be naturally made, however the vast majority are the result of human activities, especially from the exhaustion of fuels from trucks, cars, industry, and homes. Major air pollutants that carry concern to human health are carbon monoxide, nitrogen oxide, ozone, sulfur dioxide, chemical vapors, and particulate matter. This paper will focus on particulate matter, and the recent concern of its association with coronary artery disease. Particulate matter (PM), sometimes called black carbon pollution, is a mixture of solid and liquid components that form tiny particles that float in the air as a result of the combustion of fuel or organic material. These small particles are mainly composed of acids, like nitrates and sulfates, organic chemicals, and dust or soil particles. The size of the particles characterizes their ability to produce health problems. Particles larger than 50 micrometers (PM50) tend to settle out of the air, while those smaller than 50 but bigger than 10 mm are too large to reach the respiratory tract. Particulate matter greater than 10 mm is filtered through the nose and throat without ever reaching the lungs. The United States Environmental Protection Agency (EPA) is concerned more about particles less than 10 mm, called coarse particles or PM10, because of their ability to surpass the nose and throat and reach the lungs. PM smaller than 2.5 micrometers, called fine particles or PM2.5, are of major concern because they can penetrate deeper into the lungs and even get absorbed into the blood stream. Primary particles are formed from dust roads, elemental carbon, and wood combustion released directly into the atmosphere. Secondary particles are the result of an oxidative reaction of primary gases, like sulfur and nitrogen oxides, emitted from power plants, industrial facilities, automobiles, and trucks [1]. The exact composition of PM varies according to geographic areas, season, meteorological conditions, and particle size [2]. Coarse particles are mainly composed of crustal elements. These arise mostly from disrupted dust from roads, construction, demolition, and fly ash from fuel combustion. Fine particles, on the other hand, are composed of nitrates, sulfate, carbon compounds, ammonium, and metals like iron, nickel, lead, magnesium, and cadmium. Fossil fuel combustion, the burning of vegetation, and smelting are the major source of fine particles when 1 the gases formed are released in the form of vapors and condensed at high temperature. PM10 can travel up to 6 miles while PM2.5 can travel thousands of miles [1]. Particulate matter has been associated with several health problems including asthma and chronic respiratory illnesses, decreased lung function, increased mortality from coronary artery disease, and overall increased mortality. Despite the increasing effort of the U.S. Environmental Protection Agency (EPA) and several other federal and local organizations, several states and counties are still not fulfilling the current standards for reducing particle emission set by the EPA (see figure 1). 2- Health Effects Historically the association between air pollution and population health was first noticed after severe episodes of air pollution in crowded cities. In December of 1930, 63 deaths were attributed to air pollution in Meuse Valley, Belgium [3]. A similar phenomenon was noticed in Donora, Pennsylvania in 1948 [4]. Air pollution was also recognized as a major problem in London in 1952 when it was directly attributed to the death of 4,000 people [5]. Numerous studies have shown the association between daily mortality and short-term changes in particulate air pollution [6,7,8,9]. Although direct comparison between the published data is difficult due to different measurements used for PM levels, studies suggest that an increase of 10µg/m3 in PM10 is associated with an increase in daily mortality of 0.5% to 1.5% [10]. When the mortality was divided by cause of death, the results showed that most deaths were related to respiratory and heart issues [11,12]. Woodruff et al. linked PM10 levels with increased incidence of Sudden Infant Disease Syndrome (SIDS) [13]. Long-term exposure to particulate matter was also associated with increased mortality. Two large cross-sectional prospective studies comparing cities with high vs. minimal air pollution estimated attributed increase in mortality from fine particle exposure as anywhere from 15% to 25%. Long-term exposure to PM10 was associated with decreased lung function. The estimated association is that each increase of 10µg/m3 PM10 in the air is associated with a decrease of 2% in lung function [10]. Choudhury et al. established an association between asthma exacerbation, especially in children, and the increase in PM10 pollution [16]. Several epidemiologic studies have shown an association between exposure to pollution and the development of chronic respiratory illnesses like emphysema and chronic bronchitis [10,17,18]. A cohort study run by the American Cancer Society suggests that long-term exposure to elevated PM10 concentration is associated with an increased mortality from lung cancer [19]. Recent publications link the increase in cardiovascular mortality and morbidity with exposure to pollution particles. Although the exact mechanism by which PM increases mortality in patients with coronary artery disease is still under investigation, several mechanisms have been proposed. The inhalation of fine 2 particles might play a role in increasing blood pressure and heart rate [20]. PM may produce direct vascular injury by activating inflammatory and oxidative stress pathways leading to the release of fibrinogen, platelet activation factors, and endothelins, all of which are potent vasoconstrictors [21]. Increased exposure to PM2.5 was found to be associated with an increased risk of acute myocardial infarction [22]. Dominici et al. published an analysis in 2003 from the National Mortality and Morbidity Air Pollution Study based on the largest 90 cities in the United States. The analysis suggests that for each 10µg/m3 increase in PM10, there is an increase of 0.31% mortality from cardiovascular disease [23]. A recent study published in the New England Journal of Medicine by Miller et al. found that long term exposure to fine particles is associated with an increased mortality from cardiovascular disease in women, and that with each increase of 10µg/m3, the risk of cardiovascular events increased by 24% [24]. An increase in PM2.5 levels has been associated with ventricular arrhythmias in patients with a history of cardiovascular disease and implantable cardioverter defibrillator [25]. 3- Vulnerable Population People with asthma and chronic bronchitis are at an increased risk to develop exacerbation after exposure to particles because the PM10 and PM2.5 might irritate and induce inflammation in the respiratory tract mucosa, hence producing bronchial narrowing. Patients with heart conditions like coronary artery disease and congestive heart failure are vulnerable to PM exposure, which may induce worsening of symptoms and arrhythmias. The elderly are at increased risk of having respiratory and heart complications from exposure due to underlying and higher prevalence of coronary artery and lung disease. Children are at increased risk because they spend more time playing outside and breathe 50% more per kg weight than adults. Furthermore, they have higher rates of asthma and acute respiratory illnesses compared to adults, making them more vulnerable to developing cough and lungs problem after exposure to PM. 3- Particulate Matter Standards The U.S. Environmental Protection Agency (EPA) sets the National Ambient Air Quality Standards (NAAQS), which are required by the Clean Air Act. The EPA has set NAAQS for six air pollutants including carbon monoxide, lead, nitrogen oxide, ozone, sulfur dioxide, and particulate matter. There are two air quality standards, primary standards which set limits to protect public health, and secondary standards that protect public welfare including visibility, animals, crops, vegetation, and buildings. Below are the PM standards for air quality according to the EPA. 3 National Ambient Air Quality Standards for Particle Pollution Pollutant Primary Stds. Averaging Times Secondary Stds. (1) Revoked (1) Particulate Matter Annual (PM10) (Arithmetic Mean) 150 µg/m3 24-hour (2) 3 Same as Primary Particulate Matter 15.0 µg/m Annual (3) (PM2.5) (Arithmetic Mean) 35 µg/m3 24-hour (4) (see the complete table of National Ambient Air Quality Standards at http://www.epa.gov/air/criteria.html) 1) - Due to a lack of evidence linking health problems to long-term exposure to coarse particle pollution, the agency revoked the annual PM10 standard in 2006 (effective December 17, 2006). (2) - Not to be exceeded more than once per year on average over 3 years. (3) - To attain this standard, the 3-year average of the weighted annual mean PM2.5 concentrations from single or multiple 3 community-oriented monitors must not exceed 15.0 µg/m . (4) - To attain this standard, the 3-year average of the 98th percentile of 24-hour concentrations at each population3 oriented monitor within an area must not exceed 35 µg/m (effective December 17, 2006) 4- Discussion Skepticism related to the inherited limitations of epidemiologic studies that have linked PM and cardiovascular mortality has been raised, especially from lobbyist and multinational companies, mostly related to methodological and confounding bias. Nonetheless, it is unlikely that the association between PM and health effects overall is related to statistical and methodological biases, especially since most studies have used simple statistical analysis and the results were consistent across studies. Several confounders like smoking and/or socioeconomic status have been raised as limitation of the studies, however it is unlikely that these common confounders existed across all studies. Epidemiologic studies do not demonstrate biological plausibility or significance. However, with the increasing body of major epidemiologic studies and the consistency of results across these different studies, there should be significant concern as to the effect of PM on health and the need for further research to establish the pathophysiologic mechanisms of interaction. The link between health problems and particulate matter was established in the 1970s, however there remains disagreement about what levels are safe for human exposure. Studies have shown a linear increase in mortality and morbidity with increasing PM levels. Even levels below the current EPA standards might be harmful to human health, as discussed by Holland and colleagues [26, 27]. The first NAAQS were established in 1971, however inhaled particles were not included in the standards until 1987. After a lengthy review in 1997, the EPA changed standards to include particles smaller than 2.5 mm due to the increasing body of evidence showing that exposure to PM2.5 carried health problems related to cardiopulmonary disease. In 2006 the EPA reduced primary standards for 24 hr levels of PM 2.5 from 65 to 35µg/m3, while keeping the other standards the same. The EPA is currently revising the NAAQS for particulate 4 pollution [28]. The Clean Air Act requires each state to submit State Implementation Plans (SIPs) to achieve the standards implemented by the EPA. If the submission fails or is incomplete, a two year deadline is given before a Federal Implementation Plan (FIP) is established to provide basic programs required to fulfill the standards. According to the EPA website, several states and territories have failed to submit SIPs or have submitted incomplete certifications for PM2.5 as of 2006. For example, most of California is above the standards levels for PM10 and several urban areas exceed standards for PM2.5 (Figure 1). Since the EPA has implemented NAAQS and SIPs for PM in 1990, the average national levels of PM10 has decreased 28% between 1990 to 2007, and a 11% PM2.5 declined for the period of 2000 to 2007 [29]. SIPs is a collection of programs required under Section 110 of the CAA that include a monitoring program, air quality calculations and computer modeling, emission inventory by categories, control strategy studies, and periodic reviews of results programs. Fires, road dust, and electric generation account for the vast majority of PM2.5 emission, followed by industrial process, residential wood combustion, and nonroad equipments (Figure 2, 3). In northern states, where fires are less frequent, residential wood and fossil fuel combustion are the major contributors to PM2.5 emission. The EPA is reviewing the current PM standards after increasing criticism that the current standards still carry significant risk to health. A recent study published by Miller et al. found that the relative risk of death carried by each 10µg/m3 PM2.5 increase is 1.76 in women, which is substantially higher than that found by other studies [24]. This data might suggest that women are more vulnerable than males to the effect of PM [30]. Particulate matter are very complex compounds, with composition varying with source and metrological conditions. It is difficult to separate the health effects of PM from ozone and carbon monoxide in air pollution, which is another reason why more research is needed to establish and better characterize causality and plausibility. Several measures might be helpful in decreasing the emission of particulate matter and fulfilling the standards of the EPA. The main sources of emission from PM in the United States can be grouped into six categories including electricity generation, road dust, fossil fuel combustion, residential wood combustion, forest fires, and others. Nearly half of the electricity generated in the US is from coal, 20% from natural gas, and 20% nuclear. The first and least expensive measure is to involve the community through media campaigns aimed at decreasing the use of electricity. This could be achieve though maintaining the indoor temperature at a slightly lower level during the winter, using energy efficient light bulbs, and unplug 5 electric devices when they are not being used. Implementation of these measures is low cost and could decrease the pollution from electricity generation by up to 30%. Increasing utility of other more efficient and less polluting sources for generating electricity such as solar generators, wind power, and cleaner coal is paramount to decrease future emissions, especially with a growing population. Residential wood combustion is another major contributor to fine particle pollution. Ideas to reduce emission from this source include public awareness programs to stress the importance for inspections of old fireplaces and replacement of old woodstoves with those approved by the EPA. All newly installed woodstoves should fulfill EPA requirements. There should be mandatory restrictions to using woodstoves during periods with predictable high PM levels, limiting the number of new woodstoves per development, prohibiting the burning of material not appropriate for use in woodstoves, and controlling wood moisture content which prevents the full combustion of wood. It is also important to control non-agricultural burning by establishing restrictions during periods with high PM levels, setting limits for moisture levels, and prohibiting residential open burning. Research in developing special durable filters to decrease emission from woodstoves might also be helpful. Under the category of fossil fuel combustion, several sources can be included such as transportation, portable engines, and industrial processes. Transportation is one of the major contributors to PM especially in crowded cities where the levels of air pollution in general, and particularly PM, are elevated. The following steps can be taken to decrease particles emission from fuel combustion: raising public awareness promoting the use of environmental friendly forms of transportation such as bicycles, walking, and/or public transportation; providing government incentives to buy fuel-efficient and hybrid cars; and more research toward electric and fuel-efficient cars that maintain the same levels of high performance. It is estimated that diesel PM emission could contribute up to 1.8µg/m3. Emphasis on programs to decrease diesel emission like incentives to replace engines, ban new engines, and installing catalytic filters, traps, and special filters to decrease emission would be beneficial. Other advantageous factors include limiting ammonia nitrate emission from gaseous, liquid, and fossil fuel fired boilers, steam generators, process heaters, and petroleum refinery boiler, the use of electrostatic precipitators or fabric filters for boilers, limiting the emission of PM and ammonia from stationary gas turbines and commercial water heaters, and setting legislation to control PM ammonia and sulfur gases emission from small portable engines like snow blowers, jet skies, and motorcycles. Limiting emissions from residential water heaters and furnaces is also vital. Periodic inspections of residential furnaces and heaters with incentive tax breaks for changing older furnaces with new, more efficient EPA approved ones would be beneficial. Also, setting requirements to control 6 ammonium nitrate and secondary organic aerosols emission from architectural coating and solvent use can improve the issue. Road dust emission from tires, brakes, binders and mineral surface excluding engines is the major contributor to coarse particles emission. Construction and demolition is another important source for PM10 pollution. Legislation to regulate paved and unpaved roads, limiting speed, and requirements for demolition and earthmoving during construction should be established to limit dust emissions. Also, adding water and dust suppressant may help to decrease emission. Although forest fires are not predictable or evitable most times, early detection might prevent propagation of fires. Research about wireless monitoring systems to detect smoke and even satellite monitoring might be useful for early detection and extinction. Also, public campaigns in preventing littering could prevent some forest fires. A new area of concern is the indoor pollution related to the ability of fine particles to penetrate inside homes from the outside. Further research is required to address and study the effects of this pollution on health. The EPA has elaborated a Regulatory Impact Analysis on benefits and costs of meeting the current NAAQS for fine particles. According to the document from the EPA website, the estimated annual reduction in incidence of adverse health and welfare effects associated with achieving the current standards are as following: 1,200 to 13,000 premature deaths in people with heart or lung disease 2,600 cases of chronic bronchitis 5,000 nonfatal heart attacks 1,630 hospital admissions for cardiovascular or respiratory symptoms 1,200 emergency room visits for asthma 7,300 cases of acute bronchitis 97,000 cases of upper and lower respiratory symptoms 51,000 cases of aggravated asthma 350,000 days when people miss work or school 2 million days when people must restrict their activities because of particle pollution-related symptoms The overall estimated health benefit from achieving PM standards is about 17 billion dollars per year and the estimated total costs of engineering and programs are about 5.4 billion dollars. 7 5- Conclusion Exposure to particulate matter, especially fine particles, produces multiple public health and welfare problems including increased cardiopulmonary mortality and morbidity, eye irritation, and visibility problems. The effects of short and longterm exposure are different. Some of the measurements to decrease short-term exposure when Air Quality Forecasts shows levels above the standards include limiting outdoor activity, decreasing the use of cars and SUVs, and limiting woodstove emissions. Decreasing long-term exposure might be achieved by the development of cost efficient clean alternative energy sources and decreased energy consumption. Counties Exceeding Revised PM 2.5 Standards Based on 2003 -2005 Monitoring Data Legend County with monitor exceeding: Number of Counties both annual (15 µg/m3) and 24-hour (35 µg/m3) PM 2.5 standards 56 ONLY the 24 -hour PM 2.5 standard (35 µg/m3) 70 17 ONLY the annual PM 2.5 standard (15 µg/m3) Total Counties Exceeding 143 Data from AQS 7/10/2006 Data completeness computed per CFR 7/10/2006 EPA will not base designations for the new fine particle standards on these data. Figure 1: Counties Exceeding Revised PM 2.5 Standards 2003-2005. <www.epa.gov/air/tribal/attachmts/> 8 Figure 2: National PM2.5 Emission By source. <http://www.epa.gov/air/emissions/pm.htm#pmnat> Figure 3: National PM10 Emission By source. <http://www.epa.gov/air/emissions/pm.htm#pmnat> 9 References 1- The EPA Particulate Matter Home Page. April 04, 2009. EPA PM. January 15, 2009. <http://www.epa.gov/particles/index.html> 2- Synopsis of the temporal variation of particulate matter composition and size. Demerjian KL, Mohnen VA. J Air Waste Manag Assoc. 2008 Feb;58(2):216-33. 3- Firket J. The cause of the symptoms found in the Meuse Valley during the fog of December, 1930. Bull Acad R Med Belg 11:683-741 (1931). 4- Ciocco A, Thompson DJ. A Follow-up on Donora ten years after: methodology and findings. Am J Public Health 51:155-164 (1961). 5- Logan WPD. Mortality in London fog incident. Lancet 1:336-338 (1953). 6- Ostro BD. A search for a threshold in the relationship of air pollution to mortality: a reanalysis of data on London winters. Environ Health Perspect 58:397-399 (1984). 7- Mazumdar S, Sussman N. Relationships of air pollution to health: results from the Pittsburgh study. Arch Environ Health 38:17-24 (1983). 8- Schwartz J. Particulate air pollution and daily mortality in Detroit. Environ Res 56:204-213 (1991). 9- Schwartz J, Dockery DW. Particulate air pollution and daily mortality in Steubenville, Ohio. Am J Epidemiol 135:12-19 (1992). 10- Pope CA, Bates D, Raizenne M. Health Effects of Particulate Air Pollution: Time for Reassessment? Environ Health Perspec 1995; 103: 472-480. 11- Schwartz J, Dockery DW. Increased mortality in Philadelphia associated with daily air pollution concentrations. Am Rev Respir Dis 145:600-604 (1992). 12- Pope CA III, Schwartz J, Ransom MR. Daily mortality and PM10 pollution in Utah Valley. Arch Environ Health 47:211-217 (1992). 13- Woodruff T, et al. The Relationship between Select Causes of Postneonatal infant Mortality and Particulate Air Pollution in the United States. Environ Health Perspec 1997; 105(6): 608-612. 14- Dockery DW, Pope CA III, Xu X, Spengler JD, Ware JH, Fay ME, Ferris BG Jr, Speizer FE. Mortality risks of air pollution: a prospective cohort study. N Engl J Med 329: 1753-1759 (1993). 15- Pope CA III, Thun MJ, Namboodiri MM, Dockery DW, Evans JS, Speizer FE, Heath CW Jr. Particulate air pollution as a predictor of mortality in a prospective study of U.S. adults. Am J Respir Dis Critical Care Med 151:669-674 (1995). 16- Choudhury A, Gordian ME, Morris S. Associations Between Respiratory Illness and PM10 Air Pollution. Arch Environ health 1997; 54(2): 113-117. 17- Abbey DE, Hwang BL, Burchette RJ, Vancuren T, Milss PK. Estimated Long-Term Ambient Concentrations of PM10 and Development of Respiratory Symptoms in Nonsmoking Population. Arch Environ Health 1995; 50(2): 139-151. 10 18- Portney PR, Mullahy J. Urban air quality and chronic respiratory disease. Regional Sci Urban Econ 20:407-418 (1990). 19- Pope CA, Burnett RT, Thun MJ, et al. Lung cancer, cardiopulmonary mortality, and long-term exposure to fine particulate air pollution. 29. Nemmar A, Hoet PH, Vanquickenborne B, et al. Passage of inhaled 20- Bartoli CR et al. Mechanisms of inhaled fine particulate air pollution-induced arterial blood pressure changes. Environ Health Perspect. 2009 Mar;117(3):361-6. Epub 2008 Oct 6. 21- Brook RD, Franklin B, Cascio W, et al. Air pollution and cardiovascular disease: a statement for healthcare professionals from the Expert Panel on Population and Prevention Science of the American Heart Association. Circulation. 2004;109:2655-2671. 22- Peters A, Dockery DW, Muller JE, et al. Increased particulate air pollution and the triggering of myocardial infarction. Circulation. 2001; 103:2810 –2815. 37. Smith W, Anderson T, Anderson HA, et al. Nitrogen dioxide and carbon monoxide intoxication in an indoor ice arena: Wisconsin, 1992. MMWR 23- Dominici F, McDermott A, Daniels D, et al. Mortality among residents of 90 cities. In: Special Report: Revised Analyses of Time-Series Studies of Air Pollution and Health. Boston, Mass: Health Effects Institute; 2003: 9–24. 24- Miller KA, Siscovick DS, Sheppard L, et al. Long-term exposure to air pollution and incidence of cardiovascular events in women. N Engl J Med 2007;356:447-458. 25- Rich DQ et al. Association of short-term ambient air pollution concentrations and ventricular arrhythmias. American Journal of Epidemiology 2005 161(12):1123-1132; doi:10.1093/aje/kwi143 26- Holland WW, Bennett AE, Cameron IR, Florey CV, Leeder SR, Shilling RSF, Swan AV, Waller RE. Health effects of particulate pollution: reappraising the evidence. Am J Epidemiol 110:525-659 (1979). 27- Shy CM. Epidemiologic evidence and the United States air quality standards. Am J Epidemiol 110:661-671 (1979). 28- EPA PM Standards. April 10, 2009. Documents from the Current Review of the PM Standards. October 14th, 2008. <http://www.epa.gov/ttn/naaqs/standards/pm/s_pm_index.html> 29- EPA Particulate Matter. April 10, 2009. National Trends in Particulate Matter Levels. September 4, 2008. < http://www.epa.gov/airtrends/pm.html> 30- Chen LH, Knutsen SF, Shavlik D, et al. The association between fatal coronary heart disease and ambient particulate air pollution: are females at greater risk? Environ Health Perspect 2005;113:1723-1729. Erratum, Environ Health Perspect 2006;114:A21. 11


© Copyright 2026