
20
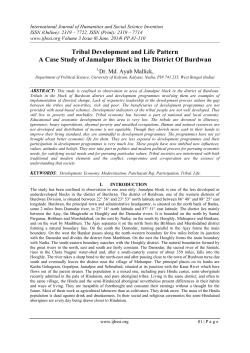
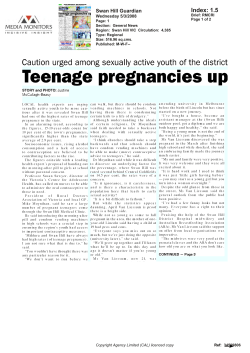
20
CHAPTER II
SPATIAL DISTRIBUTION PATTERN AND GROWTH OF
TRIBAL POPULATION
2.1
Introduction
The spatial distribution of population is one of the most
important topics of human geography. It is significantly important,
because man has brought tremendous change over the earth surface.
The term distribution refers to the way the people are spaced over the
earth’s surface; the emphasis is that, on the pattern of actual place
locations of a population (Chandana and Sidhu, 1980)
The spatial pattern of tribal distribution and their growth in
relation to the socio-physical aspect of the state is the main discourse
intends to comprehend. The state of Maharashtra is located in the
center of the country, lies between 72036’E to 80054’E longitude and
15045’ N to 2206’ N latitude. (Dikshit, 1986) The state is expanded from
west to east in conical shape with extending and increasing height from
sea level. The study intends that the tribals are almost founds in
geographically backward parts of the state for instance in the northwestern part and north-eastern parts of the state are comparatively
less developed, where on an average 25 per cent tribal population
concentrated.
Population and the natural resources are the most important
aspects of regional development. In this context distribution of tribal
population is an important aspect. India is having second largest
concentration of tribal population in the world. There are number of
tribal communities in India, known by different names such as the
Adivasis- the original inhabitants, Vanya Jati (live in forest), Adim
Jati- primitive people, etc. Tribal community is very primitive and
backward in India. Only those who have gone to urban centres to earn
their livelihood have to some extent got expenditure to the modern
21
culture and civilization. The Indian tribes display a very high degree of
ethnic diversity both in their racial composition and dialectal and
linguistic affinity. There are 285 different tribal communities, which
show an important index of their ethnic diversity. No less impressive is
the pattern of their spatial distribution, it has been commonly observed
that the tribes reveal strong tendencies of clustering and concentration
in the hilly, forested and the geographically inaccessible tracts of the
country (Ahmad, 2001). This is the main cause for their backwardness.
Tribal population is concentrated in geographically inaccessible areas
so one can say development of tribals mostly depends on the
distribution of population in relation to resources available in the
region.
As per the 1991 census the scheduled tribe population in India
was 6.78 crores, which constituted about 8.01 per cent of the total
population. According to 2001 census the scheduled tribes constituted
about 8 per cent in India. The largest concentration of scheduled tribe
is confined to central India particularly in Madhya Pradesh and in its
adjoining states like Maharashtra, Gujarat, Rajasthan, Andhra
Pradesh, Zarkhand, Orissa and Bihar.
In Maharashtra the scheduled tribe population was 73.18 lakhs
(1991), which constituted 9.27 per cent of the total population of the
state. It has now increased to 85.77 lakhs in 2001 but the proportion
has reduced to 8.85 per cent.
In Maharashtra, according to 1991 census, the concentration of
tribal population is mostly confined to north-eastern and north western
parts. In the north-western part of the state particularly Thane,
Nashik, Dhule and Nandurbar districts where more than 43 per cent
(43.09%) and in the eastern part (Wardha, Nagpur, Bhandara,
Chandrapur, and Gadchiroli districts), 21.69 per cent, concentration of
tribal population to the total tribal population of the state. It means
that the, more than 64 per cent tribal concentration is found in these
22
two pockets of the state. And in 2001, the figures for there parts were
43.10 per cent and 19.12 per cent of respectively.
In Maharashtra, Geographically the concentration of tribals is
confined in three traditional regions, i.e. 1) Sahyadri Region, 2)
Satpudas region, and 3) Gondwana region. The Sahyadri region is
comprises of Thane, Raigad, Nashik and Pune districts, where Warlis,
Kokanas, Thakurs, Mahadeo Kolis, Malhar Kolis, Dhor Kolis, Katkaris,
etc. tribal groups are found. The Satpudas region incorporates
Nandurbar, Dhule, Jalgaon, Aurangabad and Amravati districts and
particularly, Bhils, Kokanas, Dublas, Dhankas; Korkus are the main
tribal groups here. The Gondwana region includes districts like
Chandrapur, Gadchiroli, Bhandara, Yavatmal and Nagpur and Gonds,
Madia Gonds, Korkus, Kolams, Paradhans, Andhs, etc. are the main
tribal groups found in this region.
Distribution of Tribal Population, 1991
The scheduled caste and tribal populations constitute the most
downtrodden communities in India. The tribal population, which is the
main focus of the present study, constitutes 8.0 per cent in the country
as whole in 1991. As per the 1991 census, the proportion of tribal
population in the state of Maharashtra was 9.27 per cent, which has
declined to 8.85 per cent in 2001. Table 2.1 very categorically reveals
that there are as many as 17 districts, out of 30 in the state where the
proportion of this segment was below the average proportion of the
state (9.27%) and in the remaining 13 districts; the proportion is higher
than this state average. It indicates that the distribution is very much
uneven and mainly concentrated in NE & NW parts of the state. It is
found that there are as many as 5 districts viz., Sindhudurg, Sangli,
Kolhapur, Satara and Ratnagiri, where the proportion is less than 1
per cent, which is almost negligible in the state as a whole .It ranged
from a minimum of 0.47 per cent in Sindhudurg to a maximum of 40.88
23
percent in Dhule district. These wide ranges show an acute disparity in
their spatial distribution in the state.
It is further found that the region with very low proportion of
population is confined to the southern part of the state.
It is also found (Table 2.1) the low proportion of tribal population
was observed in 8 districts with less than 5 per cent tribal population.
There districts are Greater Mumbai, Beed, Solapur, Osmanabad,
Jalana, Latur Aurangabad, and Pune.
There are as many as five districts with 5 per cent to 10 per cent
tribal population. These districts are Buldhana Parbhani, Akola, and
Ahmednagar and Jalgaon. The districts with high proportion of tribal
population are five, i.e. Nanded, Raigarh, Nagpur, Amravati and
Bhandara, where the proportion ranged between more than 10 & 15
per cent.
The tribals in Wardha, Thane and Chandrapur are highly
concentrated, ranging from 15 to 20 per cent in these districts. In the
remaining 4 districts, for instance, in Yavatmal (21.18%) Gadchiroli
(38.10%) and Dhule (40.88%) the proportion was high.
The Figure 2.1 very clearly shows that they are confined to
northeast and northwest parts of the state. The entire central part of
state is with 1 to 10 per cent and southern part is almost having
negligible tribal population.
24
Table 2.1
Percentage of Tribal Population to Total Population, 1991
Sr. No.
State/District
Total
Population
Total Tribal
Population
% of Tribal
Population
1
Greater Mumbai
9925891
103775
1.05
2
Thane
5249126
951205
18.12
3
Raigarh
1824816
233953
12.82
4
Ratnagiri
1544057
14847
0.96
5
Sindhudurg
832152
3893
0.47
6
Nashik
3851352
931069
24.18
7
Dhule
2535715
1036491
40.88
8
Jalgaon
3187634
313551
9.84
9
Ahemednagar
3372935
240141
7.12
10
Pune
5532532
216336
3.91
11
Satara
2451372
18342
0.75
12
Sangli
2209448
10784
0.49
13
Solapur
3231057
48352
1.50
14
Kolhapur
2989507
14789
0.49
15
Aurangabad
2213779
83502
3.77
16
Jalana
1364425
28300
2.07
17
Parbhani
2117035
111470
5.27
18
Beed
1822072
20515
1.13
19
Nanded
2330374
275972
11.84
20
Osmanabad
1276337
22463
1.76
21
Latur
1676641
37527
2.24
22
Buldana
1886299
95389
5.06
23
Akola
2214271
155695
7.03
24
Amravati
2200057
316448
14.38
25
Yavatmal
2077144
445840
21.46
26
Wardha
1067357
166391
15.59
27
Nagpur
3287139
457715
13.92
28
Bhandara
2107629
309822
14.70
29
Chandrapur
1771994
349169
19.70
30
Gadchiroli
787010
304535
38.70
78937157
7318281
9.27
Maharashtra
(Source: census of India 1991)
25
Distribution of Tribal Population, 2001
The proportion of tribal population from 1991 to 2001 has
slashed down from 9.27 to 8.85 per cent in the state of Maharashtra.
This declination is attributed to detribalization of communities, under
enumeration of tribal population in 2001 and checking of tribal & caste
certificates, and debarred some communities from tribals to Special
Backward Caste (SBC). In 2001 the 30 districts of the state are divided
to six categories for showing the distribution in the state very
categorically.
Very Low
The proportion of tribal population in the state ranges from a
minimum of 0.57 per cent in Sindhudurg districts to the maximum of
38.31 per cent in Gadchiroli district. There are 5 districts, viz.,
Sindhudurg (0.46%), Kolhapur (0.47%), Sangli (0.66%), Satara (0.76%),
and Ratnagiri (0.76%) where the tribals are almost negligible and in
each of these districts the proportion was less than one per cent to total
population. In these districts the education and over all health facilities
and abundant employment opportunities are available, due to heavy
Industrilization and agricultural development, so far the migration is
also high especially reservation quota is more for ST candidates. So the
growth of ST population is ever increasing in these districts, but
numerically proportion of distribution of tribal population is very low.
Low
In this low category of tribal population the proportion ranged
from 1 to 5 per cent. It incorporates 9 districts, For instance, Mumbai
and Suburban (1.12%), Beed (1.17%), Solapur (1.79%), Osmanabad
(1.82%), Jalana (1.98%), Aurangabad (2.25%), Latur (3.45%), Pune
(3.61%), and Buldhana (4.85%). It means that almost south-central
part of the Maharashtra having less than 5 per cent tribal population
26
in each of the 9 districts. All these 9 districts are spread over southern
and extended to central part including the major Marathwada region,
excluding Mumbai and suburban district.
Medium
In the medium category of 5 – 10 per cent, there were as many as
4 districts with tribal population. These districts are Parbhani (5.15%),
Akola including Washim (6.45%), Ahmednagar (7.51%), and Jalgaon
(8.80%). In these districts tribals have made their fast relations among
themselves, to support the socio-cultural and economic development in
the peripheral region.
High
In this high category there are 7 districts having tribal
population 10 to 15 per cent. These districts are confined to northeast
and western parts of the state these are, Nanded (10.91%) and Raigad
(11.81%) districts and whereas, Nagpur (12.19%), Amravati in
Vidharbha region (12.46%), Bhandara including Gondiya (12.58%),
Wardha (13.66%), and Thane (14.75%). These districts are very close to
the core tribal pockets, where they were known as peripheries districts
of the tribal population in the state (Ramotra, Vadiyar, and Mote, June
2011)
Very High
Very high distribution of tribal population is found in the 5
districts viz. Chandrapur (18.12%), Yavatmal (19.26%), having above
18 per cent tribal population and in the remaining Nashik (23.92%)
Gadchiroli (38.31%), and Dhule including Nandurbar (43.16%) district
the proportion is very high i.e. above 23 per cent. So, the distribution is
very uneven. In this case also, there are two main regions of high
concentration of tribal population.
27
Table 2.2
Percentage of Tribal Population to Total Population 2001
Sr.
No.
1
2
State/District
Mumbai & Suburban
Thane
Total
Population
11978450
8131849
Total Tribal
Population
91120
1199290
% Of Tribal
Population
0.76
14.75
3
Raigarh
2207929
269124
12.19
4
Ratnagiri
1696777
20102
1.18
5
Sindhudurg
868825
4952
0.57
6
Nashik
4993796
1194271
23.92
7
8
Dhule & Nandurbar
Jalgaon
3019656
3682690
1303138
435951
43.16
11.84
9
Ahemadnagar
4040642
303255
7.51
10
Pune
7232555
261722
3.62
11
Satara
2808994
21896
0.78
12
Sangli
2583524
17855
0.69
13
Solapur
3849543
68989
1.79
14
Kolhapur
3523162
21387
0.61
15
Aurangabad
2897013
100416
3.47
16
Jalana
1612980
32103
1.99
17
18
Parbhani & Hingoli
Beed
2514875
2161250
122108
24193
4.86
1.12
19
Nanded
2876259
253596
8.82
20
Osmanabad
1486586
27857
1.87
21
Latur
2080285
47836
2.30
22
Buldana
2232480
115156
5.16
23
24
Akola & Washim
Amravati
2650455
2607160
171075
356533
6.45
13.68
25
Yavatmal
2458271
473370
19.26
26
Wardha
1236736
154415
12.49
27
Nagpur
4067637
444441
10.93
28
29
Bhandara & Gondiya
Chandrapur
2336853
2071101
294173
375256
12.59
18.12
30
Gadchiroli
970294
371696
38.31
96,878,627
8577276
8.85
Maharashtra
(Source: census of India 2001)
28
One is northeast, and another is northwestern part of the state.
These pockets are identified as core tribal pockets and it needs further
investigation for their development especially for education, health,
malnutrition and economic through employment. It is felt that they
need protection from exploitation by money lenders, and forest
contractors. The central and southern parts of the state are almost of
very low proportion of tribal population.
Concentration of Tribal Population (1991-2001)
Distribution and concentration differ from the location and
areal point of view. Distribution is known as their spatial spared of
population in the region and concentration explains the actual location
of the particular population in the region applying some statistical
techniques. Here the study intended to find out by calculating the
actual concentration of tribal population in the state through applying
location quotient index (Aslam Mehmood, 1998, 106) during 1991 and
2001. As per the location quotient index, the concentration of tribal
population in 1991, the high index value is found in the district of
Dhule (including Nandurbar), and Chandrapur (including Gadchiroli)
districts is 3.89, and followed by Nashik (2.75), thane (2.14), Wardha
(1.72), and Bhandara including Gondiya (1.68). These are the tribal
districts where the geographical condition is adverse and having low
literacy acquisition, therefore their mobility is very low.
In 2001, the concentration index value was slightly increased by
0.37; it is because of increase in tribal population in this decade by
12.59 Lakh. But actual growth of the tribals was shown negative i. e.
9.27 in 1991 to 8.85 per cent in 2001. According to 2001 census, the
high index value depicts was found in Dhule district (including
Nandurbar)
(4.26)
and
closely
Gadchiroli) by 2.78 index value.
followed
Chandrapur
(including
29
Table 2.3
District wise concentration of tribal Population in Maharashtra
Sr.No.
District
1991
2001
1
Sangli
0.05
0.05
2
Kolhapur
0.04
0.07
3
Satara
0.07
0.08
4
Ratnagiri & Sindudurg
0.00
0.01
5
Mumbai & Suburban
0.11
0.11
6
Beed
0.15
0.11
7
Solapur
0.02
0.18
8
Osmanabad & Latur
0.33
0.02
9
Aurangabad & Jalana
0.37
0.33
10
Pune
0.48
0.36
11
Nagpur
0.05
0.45
12
Buldhana
0.56
0.05
13
Parbhani & Hingoli
0.67
0.58
14
Akola & Washim
0.71
0.74
15
Ahmadnagar
0.10
0.89
16
Jalgaon
1.27
0.11
17
Nanded
1.22
1.34
18
Raigadh
1.43
1.20
19
Amravati
0.15
1.26
20
Bhandara & Gondiya
1.68
0.13
21
Wardha
1.72
1.55
22
Thane
2.14
1.46
23
Yavatmal
0.25
1.94
24
Nashik
2.75
0.24
25
Chandrapur& Gadchiroli
3.89
2.78
26
Dhule & Nandurbar
3.89
4.26
0.09
0.09
Maharashtra
(Source: census of India-1991 & 2001)
30
Adjoining district loosing their concentration, it was good sign,
because of the tribal sub plans have shown the impact on them as the
dispersion is taking place and spreading over other areas in the state
as well as in the country as a whole. This can be comprehended from
their declining location quotient index value from 1.94 to 0.01.
Growth rate of Tribal Population
The term growth of population is used in its broadest connotation
to cover change in population numbers inhabiting a territory during a
specific period of time, irrespective of the fact whether the change is
positive or negative. This change/ growth can be measured both in
terms of absolute numbers and percentages (Chandana and Sidhu,
1980)
Growth rate of Tribal Population-1961 – 2001
Table 2.4 shows the decadal growth in Maharashtra from 1961 to
2001, it seems that, from the 1961 to 1971 (5.83% and 5.86%) the rate
of growth was normal. The growth was looking abnormal and uneven
between 1971 to 1981 (9.19%) and 1981 to 1991 (9.27%), it can said that
this growth was because the large number of communities which
having similarities in their culture and societies where they reside, and
tried to enter in census records as tribal category to getting facilities
and benefits from government (Jain,1998). But in the 2001 (8.85%)
growth was decrease by 0.42 per cent. During the 1991 to 2001 decade
the caste validity process was applied in the state and some tribal
communities are shifted to Special Backward Caste i. e. SBC, therefore
the percentage of tribal was decreased.
31
Table 2.4
Growth in Tribal Population in Maharashtra, 1961 - 2001
Sr.
No.
1
2
3
4
5
Population
Total
Tribal
395.54
23.97
504.12
29.54
627.84
57.72
789.37
73.18
968.87
85.77
Year
1961
1971
1981
1991
2001
Growth of
Tribals (%)
5.83
5.86
9.19
9.27
8.85
(Source: Census of India1961 - 2001)
9.19
10
9.27
8.85
9
8
Growth in %
7
5.83
5.86
6
5
4
3
2
1
0
1961
1971
1981
1991
2001
Year
Fig. 2.1
Growth of Tribal Population (1981-1991)
The growth of tribal population in Maharashtra during 1981-91
was 26.79% which has been drastically declined to 17.20% in 1991-01.
It shows that the growth of the tribal population slashed down due to
the shift of some communities to other backward castes i.e. SBC
(Special backward caste) and some are debarred, because of fake
possession of documents during 1981–1991. The growth of the tribal
population is presented in Table 2.5 The districts where more than 40%
tribal population declined are Ratnagiri and Sindhudurg (-40.97)
Kolhapur (-45.85%) and Sangli (-30.58) and on the contrary in the next
32
decade 1991-2001 the same districts have shown high growth rate of
tribal population that increased to 33.69%, 27.20%, 44.61%, and 65.57%
in 1991-01 respectively.
Table 2.5
Growth of Tribal Population 1981-1991
Sr.
No
1
2
3
4
5
6
7
8
9
10
11
12
13
14
15
16
17
18
19
20
21
22
23
24
25
26
Total
Tribal
Dist
Population
In 1981
G.Bombay
84073
Thane
729424
Raigad
190210
Ratnagiri
31746
Nashik
701647
Dhule
831064
Jalgaon
216009
Ahmednagar
187656
Pune
158705
Satara
13060
Sangli
15535
Solapur
51577
Kolhapur
27311
Aurangabad
75663
Parbhani
78577
Beed
13405
Nanded
178238
Osmanbad
52013
Buldana
66457
Akola
114759
Amravati
241704
Yavataamal
370116
Waradha
142244
Nagpur
353303
Bhandara
298039
Chandrapur
549503
Maharashtra 5772038
Total
Growth of
Difference
Tribal
Tribal
Between
Population
Population
1981-1991
In 1991
(In %)
103775
19702
23.43
951205
221781
30.40
233953
43743
23.00
18740
-13006
-40.97
931069
229422
32.70
1036491
205427
24.72
313551
97542
45.16
240141
52485
27.97
216336
57631
36.31
18342
5282
40.44
10784
-4751
-30.58
48352
-3225
-6.25
14789
-12522
-45.85
111802
36139
47.76
111470
32893
41.86
20515
7110
53.04
275972
97734
54.83
59990
7977
15.34
95389
28932
43.53
155695
40936
35.67
316448
74744
30.92
445840
75724
20.46
166391
24147
16.98
457715
104412
29.55
309822
11783
3.95
653704
104201
18.96
7318281
1546243
26.79
(Source: census of India 1981 – 1991)
In the district where the major tribal concentration is high the
growth remained normal, the district viz. Wardha (-7.20%), Nagpur (2.90%), and Bhandara (-5.05%), growth shows negative, it is because of
33
these districts are adjoins to the Chhattisgarh state of India, where
tribals are seasonally migrated for collecting Tendu leaves for bidi
industries, therefore at the time of census processes mighty be these
seasonal migration take place. Normally this migration is taking place
Buster plateau of Chhattisgarh district, where thick forest is.
Growth of Tribal Population (1991-2001)
The growth of tribal population between 1991 and 2001 in the
state of Maharashtra was 17.20 per cent, which has comedown from
26.79 per cent in 1981 and 1991. The growth of tribal population in 5
districts viz., Mumbai (including Mumbai suburban), Nanded, Wardha,
Bhandara, including Gondiya, was categorically negative. It means
that the tribal populations from these districts have migrated to other
areas of the state and it is possible, as mentioned earlier, some of the
tribal communities have been denotified, and some of them shifted to
special backward caste (S.B.C.) or some of them have been debarred
due to the possession of fake certificates for tribal identity during 19912001. On the other hand, the growth of this community where it was
positive, it ranged from a minimum of 6.17 per cent in Yavatmal to a
maximum of 65.57 per cent in Sangli district. The low growth of tribal
population was recorded in about 9 districts, which are mostly confined
to the north eastern, central and western parts of the state, however,
the 6 districts forming a major region of a tribal growth ranging
between 5 and 20 per cent. In the medium category, there are as many
as 13 districts ranging with growth rate of 20 to 44 per cent more than
43 per cent of the districts fall in this category and they are mostly
confined to north western and western part and one in the north
eastern part of the state. It forms 3 regions of this kind of growth.
These
districts
are
Aurangabad,
Buldhana,
Pune,
Gadchiroli,
Osmanabad, Dhule (including Nandurbar), Thane, Ahmednagar,
Sindhudurg, Latur, Nashik, Ratnagiri and Jalgaon.
34
Table 2.6
Growth of Tribal Population 1991-2001
Sr.No.
State/ District
Total
Tribal
Population
In 1991
Total
Tribal
Population
In 2001
Difference
Between
1991-2001
Growth Of
Tribal
Population
(In %)
1
2
Greater Mumbai
Thane
103775
951205
91120
1199290
-12655
248085
-12.19
26.08
3
Raigarh
233953
269124
35171
15.03
4
Ratnagiri
14847
20102
5255
35.39
5
Sindhudurg
3893
4952
1059
27.20
6
Nashik
931069
1194271
263202
28.27
7
Dhule
1036491
1303138
266647
25.73
8
Jalgaon
313551
435951
122400
39.04
9
Ahemednagar
240141
303255
63114
26.28
10
Pune
216336
261722
45386
20.98
11
Satara
18342
21896
3554
19.38
12
Sangli
10784
17855
7071
65.57
13
Solapur
48352
68989
20637
42.68
14
Kolhapur
14789
21387
6598
44.61
15
Aurangabad
83502
100416
16914
20.26
16
Jalana
28300
32103
3803
13.44
17
Parbhani
111470
122108
10638
9.54
18
Beed
20515
24193
3678
17.93
19
Nanded
275972
253596
-22376
-8.11
20
Osmanabad
22463
27857
5394
24.01
21
Latur
37527
47836
10309
27.47
22
Buldana
95389
115156
19767
20.72
23
Akola
155695
171075
15380
9.88
24
Amravati
316448
356533
40085
12.67
25
Yavatmal
445840
473370
27530
6.17
26
Wardha
166391
154415
-11976
-7.20
27
Nagpur
457715
444441
-13274
-2.90
28
Bhandara
309822
294173
-15649
-5.05
29
Chandrapur
349169
375256
26087
7.47
30
Gadchiroli
304535
371696
67161
22.05
7318281
8577276
1258995
17.20
Maharashtra
(Source: census of India 1991 – 2001)
35
It is very astonishing to note that the growth in the remaining 3
districts is high and very high, which is much higher than the average
growth rate for the state as whole (17.20 per cent). The high growth is
recorded in Solapur (42.68 per cent) and Kolhapur (44.61 per cent).
The district of Sangli is identified with highest growth (65.57 per cent)
rate of tribal population in the state of Maharashtra. These 3 districts
are such districts where the proportion of tribal population is very low
in the state and even the migrations of few tribals to these districts
have shown a very high growth because of their small base. More over,
Kolhapur and Sangli districts Compare on important belt of sugarcane
cultivation which can provide opportunities to them to work as
labourers during the harvesting season of sugarcane.
Conclusion
It is concluded that, the decadal growth of tribal population from
1961 to 1991 has increased and in the 1991 to 2001 decade the growth
was slashed down because of exclusion of some tribal people possessing
fake certificates. In 1971 to 1981, there was abnormal growth which
needs to be investigated. It is also concluded that, Very high proportion
of tribal population in the north eastern and northwestern parts of the
state. The central part has shown very scant tribal population but the
very high growth rate is recorded in these districts, for example,
Kolhapur, Sangli, and Solapur where their proportion is very low. It is
also found that between 1991 and 2001 the growth rate was negative. It
means that the massive out migration has taken place to neighboring
districts in search of job opportunities and education. It is also found
that the growth rate has declined from 26.79 per cent between 1981
and 1991 to 17.20 per cent between 1991 and 2001. It is due to the fact
that some tribal communities have been detribalized, some of them
have been debarred and some of them shifted to special backward
category.
36
References
1.
Chandana, R. and Sidhu, M. J. (1980): Introduction to Population
Geography, Kalyani Publishers, 24, Daryaganj, New Delhi110002.
2.
Ahmad, A. (2001): Social Geography, Rawat Publication, New
Delhi pp. 122.
3.
Mahmood, A. (1998): Statistical Methods in Geographical
Studies, Rajesh Publication, 1, Ansari Road, Daryaganj, New
Delhi-110002
4.
Joshi, Vidyut, ed. (1998): Tribal Situation in India: Issues in
Development, Rawat Publications, Jaipur, 302 004 (India).Jain,
N. ‘Tribals in Maharashtra State: A Report’, p.91-104.
5.
Dikshit, K.R. (1986): 'Maharashtra in Maps, 'Maharashtra State
Board for Literature and culture, Mumbai.
37


© Copyright 2026