
Alma Mater Studiorum FARMING AND PROCESSING STATEGIES
Alma Mater Studiorum UNIVERSITÀ DI BOLOGNA DOTTORATO DI RICERCA IN SCIENZE E TECNOLOGIE AGRARIE, AMBIENTALI E ALIMENTARI Curriculum di Scienze e Biotecnologie degli Alimenti Ciclo XXVI Settore concorsuale di afferenza: 07/G1 Settore scientifico-disciplinare: AGR/20 FARMING AND PROCESSING STATEGIES FOR IMPROVING POULTRY MEAT QUALITY Coordinatore: Prof. Giovanni Dinelli Relatore: Presentata da: Dott. Massimiliano Petracci Dott. Simone Rimini Esame Finale anno 2014 INDICE CHAPTER 1 MEAT QUALITY TRAITS 1.1 Muscle tissue .................................................................................................................................................. 1 1.1.1 Skeletal muscle................................................................................................................................ 1 1.1.2 Cardiac muscle .............................................................................................................................. 2 1.1.3 Smooth muscle ............................................................................................................................... 3 1.2 Chemical composition of the skeletal muscle ........................................................................... 3 1.2.1 Water ..................................................................................................................................................... 4 1.2.2 Muscle proteins 1.2.3 Lipids ............................................................................................................................. 5 ................................................................................................................................................... 7 1.2.4 Carbohydrates .................................................................................................................................. 8 1.2.5 Minerals ............................................................................................................................................. 1.3 Muscle contraction ..................................................................................................................................... 9 10 1.4 Fibre type ........................................................................................................................................................... 13 1.5 Colour and pigment ................................................................................................................................... 14 1.5.1 Myoglobin .......................................................................................................................................... 15 1.5.2 Common fresh meat pigments 1.5.3 Cooked meat pigments .............................................................................................. 16 .............................................................................................................. 18 1.5.4 Cured meat pigments ................................................................................................................... 18 1.6 Meat pH ............................................................................................................................................................. 19 1.7 Water holding capacity (WHC) .......................................................................................................... 21 1.8 Solubility ........................................................................................................................................................... 24 1.9 Gelation .............................................................................................................................................................. 26 1.10 Emulsification .............................................................................................................................................. 28 1.11 Tenderness .................................................................................................................................................... 29 1.11.1 Meat tenderization ...................................................................................................................... 35 1.11.1.1 Biological tenderization ........................................................................................... 36 1.11.1.2 Chemical tenderization............................................................................................. 38 1.11.1.3 Mechanical tenderization ........................................................................................ 39 1.12 Flavour of poultry meat ....................................................................................................................... 40 1.12.1 Genetic type ..................................................................................................................................... 41 I 1.12.2 Meat components ........................................................................................................................ 42 1.12.3 Diet ........................................................................................................................................................ 44 1.12.4 Post processing process ............................................................................................................. 45 1.12.5 Cooking .............................................................................................................................................. 45 1.12.6 Additives............................................................................................................................................. 46 1.12.7 Irradiation and high pressure 1.13 Peroxidation of lipids ............................................................................................. 46 ............................................................................................................................. 47 CHAPTER 2 THE EXPERIMENTATION 2.1 Evaluation of the qualitative meat: analytical determination 2.1.1 Physical analyses ....................................... 51 .......................................................................................................................... 51 2.1.1.1 pH determination ........................................................................................................... 51 2.1.1.2 Colour measurements .................................................................................................. 51 2.1.1.3 Water holding capacity 2.1.1.3.1 Drip loss .............................................................................................. 53 ......................................................................................................... 53 2.1.1.3.2 Expressible moisture ............................................................................... 54 ........................................................................................ 54 ...................................................................................................... 54 2.1.1.3.3 Marinade uptake 2.1.1.3.4 Purge loss 2.1.1.3.5 Cooking loss and cooking yield .......................................................... 55 2.1.1.3.6 Water activity (Aw) .................................................................................... 56 2.1.1.3.7 NMR Relaxation measurements.......................................................... 56 2.1.1.3.8 Freezable water (FW) ............................................................................. 57 2.1.1.4 Texture ............................................................................................................................................... 58 2.1.1.4.1 Shear force .................................................................................................... 58 2.1.1.4.2 Texture Profile Analysis (TPA) ........................................................... 59 2.1.2 Chemical analysis 2.1.2.1 Moisture ......................................................................................................................... 61 .............................................................................................................................. 61 2.1.2.2 Total lipids ......................................................................................................................... 61 2.1.2.3 Proteins 2.1.2.4 Ash ................................................................................................................................ 62 ......................................................................................................................................... 2.1.2.5 Fatty acid composition ............................................................................................... II 63 63 2.1.2.6 Susceptibility to oxidation ......................................................................................... 64 2.1.2.6.1 Thiobarbituric acid reactive substances (TBARs) analysis ............................................................................................................................... 64 2.1.2.6.2 Determination of Peroxide Value (PV) ......................................... 65 2.1.2.7 Collagen .............................................................................................................................. 65 2.1.2.8 Sodium chloride ............................................................................................................... 67 2.1.3 Sensorial analysis ......................................................................................................................... 67 2.1.3.1 Thawing and preparation of sample .................................................................. 2.1.3.2 Description of the laboratory of sensory analysis 2.1.3.3 Triangle test ...................................... 67 68 ...................................................................................................................... 68 2.1.3.4 Consumer test .................................................................................................................. 69 2.2 Evaluation of qualitative traits of poultry meat ..................................................................... 71 2.2.1 Meat quality characteristics, oxidative stability and sensorial traits of chicken meat obtained from two different production systems: free range vs conventional ................................................................................................................................................. 71 2.2.1.1 Introduction ...................................................................................................................... 71 2.2.1.2 Materials and methods ............................................................................................... 73 2.2.1.3 Statistical analysis ........................................................................................................ 75 2.2.1.4 Results and discussion ................................................................................................ 76 2.2.1.5 Conclusions ...................................................................................................................... 87 2.2.2 Quality Characteristics of frozen broiler meat pretreated with increasing concentrations of sodium chloride ................................................................................................... 88 2.2.2.1 Introduction ...................................................................................................................... 88 2.2.2.2 Materials and methods ............................................................................................... 89 2.2.2.3 Statistical analysis ........................................................................................................ 90 2.2.2.4 Results and discussion ................................................................................................ 90 2.2.2.5 Conclusions ...................................................................................................................... 2.2.3 The use of sodium bicarbonate for marination of broiler breast meat ........ 94 95 2.2.3.1 Introduction ...................................................................................................................... 95 2.2.3.2 Materials and methods ................................................................................................ 97 2.2.3.2.1 Use of sodium bicarbonate in comparison with sodium tripolyphosphate for marination of broiler breast meat and phase (Experiment 1) ................................................................................................................ 97 2.2.3.2.2 Use of increasing levels of sodium bicarbonate (Experiment 2) ................................................................................................................ 98 III 2.2.3.3 Statistical analysis ...................................................................................................... 100 2.2.3.4 Results and discussion ............................................................................................. 100 2.2.3.4.1 Use of sodium bicarbonate in comparison with sodium tripolyphosphate for marination of broiler breast meat and phase (Experiment 1) .............................................................................................................. 100 2.2.3.4.2 Use of increasing levels of sodium bicarbonate (Experiment 2) .............................................................................................................. 106 2.2.3.5 Conclusions .................................................................................................................... 111 2.2.4 The use of thyme and orange essential oils mixture to improve chicken meat quality ................................................................................................................................................ 113 2.2.4.1 Introduction ................................................................................................................... 2.2.4.2 Materials and methods 113 ............................................................................................. 115 2.2.4.2.1 Quality traits and susceptibility to lipid oxidation of chicken meat marinated with thyme and orange essential oils mixture (Experiment 1) ............................................................................................ 115 2.2.4.2.2 Sensory traits of chicken meat marinated with thyme and orange essential oils mixture (Experiment 2) ............................................. 116 2.2.4.3 Statistical analysis ....................................................................................................... 117 2.2.4.4 Results and discussion ............................................................................................. 117 2.2.4.5 Conclusions .................................................................................................................... 124 2.3 Overall conclusions .................................................................................................................................. 124 2.3.1. Farming factors ......................................................................................................................... 2.3.2 Processing factors REFERENCES 126 ...................................................................................................................... 126 .................................................................................................................................................... 127 IV CHAPTER 1 MEAT QUALITY TRAITS 1.1 Muscle tissue Muscle tissue constitutes the largest part of edible poultry meat and for this reason it is very important for further processing. Usually, breast and legs of chicken and turkeys are classify, respectively, as white and dark meat because of the different colour due to different muscles that constitute its. Muscles show different shape and structure according to their different functions performed by live animal. Birds and animals in general, exert three main different activities that request three different types of muscles: skeletal (e.g. used in locomotion), cardiac (e.g. used for pumping blood) and smooth muscles (e.g. used by digestive system) (Barbut, 2002a). 1.1.1 Skeletal muscle Skeletal muscle is also classified as voluntary-type muscle, because its activity can be controlled completely in accordance to the will of the animal. Animals have a large number of different skeletal muscles. They can be relativity large like the biceps femoris or very small such as the ones responsible for closing the eyelids. Skeletal muscles look striated when painted and observed under a light microscope and for this reason they are known as striated muscles. This aspect is the consequence of the muscular fibres organization, which with their component, form the microstructure of the muscle (Aughey and Frye, 2001). Those types of muscles are made of various muscle bundles enveloped by epimysium. Between each muscle bundle, there is a layer of connective tissue known as perimysium. Another thinner coat of connective tissue, named endomisium, veils each small muscular fibres that compose the muscle bundle (Figure 1.1). The connective tissue performs a fundamental role. It provides to the muscular structure to fix the components of the muscle and allows the transmission of movement to generates from sarcomeres (the little units that form muscle). Between various muscle fibres you can also find several blood vessels and groups of nerves of different dimensions (usually are microscopic, but sometimes you can find a bigger nerve visible at naked eye) designated to control their contractions (Aughey and Frye, 2001). -1- Figure 1.1. Structure of skeletal muscle (Pearce et al., 2011). Muscular fibres are formed of several myofibrils composed of numerous myofilaments. The myofibrils show a striated pattern because of the repetitive structure obtained by the overlap of thin and thick filaments. In particular A-band is the dark area created by the superimposing of thin and thick filaments. The A-band includes the H-zone, a less dark area consisted of only thick filaments. The lightest area called I-band is composed of only thin filaments and it is divided by the Z-line. The thick filaments that shift to the Z-line, the sarcomer, become shorter, causing the muscle contraction, responsible for the movements (Barbut, 2002a; Swartz et al., 2009). 1.1.2 Cardiac muscle Similarly to the skeletal muscle cells, cells of cardiac muscle have a striated aspect, but they usually present only one nucleus per cell instead of several nuclei. These cells measure from 50 to 100 mm of length and about 15 mm of widths. The cardiac muscle is characterized by a unique rhythmic contraction. It begins from early embryonic stage and it is triggered from sino-atrial node. Fibres are branched and are intertwined like a mesh fabric. This particular structural characteristic grants the contraction of the cardiac muscle rooms by allowing the blood to be bumped forward the organism through the compressing of their volume. Heart cell has a characteristic structure called intercalated disks. Visible only with microscopic observation it is like a dense line that splits at regular intervals the cardiac fibres long the longitudinal axis. The function of those disks is to link firmly heart muscle fibres and to promote the contraction transmission force between different fibres. The movement of the heart is leaded by the sympathetic and parasympathetic nervous systems, partially independent of central nervous system. The dark red colour of the cardiac muscle -2- is due by the high muscular activity that requires also a large blood supply (Aughey and Frye, 2001). 1.1.3 Smooth muscle Smooth muscles are composed by relatively long (about 100 mm) and narrow (from 3 to 12 mm) fibres. Fibres present only one nucleus that is commonly placed on the centre. Cells from smooth muscles are responsible for the operation of the body involuntary systems (e.g., digestive system, walls of arteries and parts of the reproductive system). Smooth muscle shows a less organized structure of the sarcomeres than skeletal and cardiac muscle fibres, explaining why it has not a striated appearance. It can be organized in many layers sheaths, as it is possible to observe in the cross section of the digestive system. Those sheaths are organized in different directions (perpendicular and parallel) to the cut surface in order to allow muscle movements. This organization permits to elongate or contract the diameter and the length of the gut and consequently move the food onward (Aughey and Frye, 2001; Barbut, 2002a). 1.2 Chemical composition of the skeletal muscle In general and for the poultry species muscle chemical composition changes in function of several factors, for example specie, breed, gender, age, feeding and commercial cut. In order to assess the composition of muscles proximate analyses can be used to evaluate the quantity of moisture, protein, lipid, ash and carbohydrate. Whereas the mean values, the large part of the muscles contain about: 1% of ash that comprises mainly mineral like potassium, phosphorus, sodium, chloride, magnesium, calcium, and iron; 1% of carbohydrate predominantly glycogen ante mortem, and lactic acid post mortem; 5% of lipid; 21% of nitrogenous compounds (mostly proteins); and the rest 72% as moisture. These values are compared to the composition of fat and bone as shown in table 1.1 and figure 1.2. (Kauffman, 2012; Keeton and Eddy, 2004). a Table 1.1. Proximate analysis of muscle, fat and bonea (Kauffman, 2012). Muscle Fat Bone Moisture (%) 72 9 25 Nitrogenous Compound (%) 21 1 10 (primarily protein) Lipid (%) 5 90 20 Ash (%) 1 < 45 Carbohydrate (%) 1 < < a = Proximate analysis expressed on a fresh basis for mature, post mortem tissue representing various anatomical locations; < = less than 0.5%. -3- Meat shows an inverse relation with the percentage of fat and other meat components except carbohydrates. Practically, fat percentages increase with the decreasing amounts of moisture, protein and ash in muscle tissue. However, the amount of carbohydrates does not change significantly. The 99.0% of animal’s body composition is constituted by eleven primary chemical elements: 65.0% of oxygen, 18.0% of carbon, 10.0% of hydrogen, 3.0% of nitrogen, 1.5% of calcium, 1.0% of phosphorus, 0.35% of potassium, 0.25% of sulfur, 0.15% of sodium, 0.15% of chlorine and 0.05% of magnesium. The remaining part is constituted by 25 microelements: cobalt, copper, iodine, iron, manganese, molybdenum, selenium and zinc are required for normal metabolic function (essential elements), whereas barium, bromine, cadmium, chromium, fluorine and strontium are considered nonessential (Keeton and Eddy, 2004). Figure 1.2. Composition of skeletal muscle tissue (Keeton and Eddy, 2004). 1.2.1 Water Muscle tissue presents 75% of water content. The largest part of water is located inner the muscular structure and the muscle cells. In particular, water is located into muscle cells, myofibrils, between myofibrils and between myofibrils-sarcolemma (muscular cells membrane), between muscle cells and between muscle bundles. Water molecules could be attracted to charged species like proteins because their dipolar property. In muscle cells, water is sometimes very closely bonded to the proteins (Huff-Lonergan and Lonergan, 2005). In muscle tree main water categories are definite: bound, entrapped and free water. Bound water is the water that is directly linked to the other molecules (i.e. proteins). This is -4- the reason why it has low mobility, for example it is usually static and rarely goes away from its compartments. In fact, this water does not easily freeze with low temperatures or evaporates due to conventional heating. The bound water fraction located in the muscle cells represents a small part of the total water, about 0.5 g of water per gram of protein, less than the 10% of the total water in muscle. The bound water content is not affected at all by the post-rigor activity (Keeton and Osburn, 2010). Entrapped or immobilized water is the water fraction that is linked to the other molecules either by steric effects and/or by attraction to the bound water. This type of water is not directly bounded to the proteins even if it is located between the structure of the muscle (Huff-Lonergan and Lonergan, 2005). Entrapped water in live muscle does not flow freely from its compartment, but it may be evaporated easily by drying or heating process, and could be converted to ice through freezing process. Entrapped water is very sensible to the rigor process and all the reactions that lead the conversion of muscle to meat. This water could flow like purge as a result of the alteration of muscle structure and pH following. Free water is the water that can freely flow from one compartment to another. It is linked to muscle structure by weak surface forces. This water fraction is not contained on the pre-rigor muscle, but it is consequents due the conditions change that permit the shift of the entrapped water from its compartment (Huff-Lonergan and Lonergan, 2005; Keeton and Osburn, 2010). 1.2.2 Muscle proteins It is known that proteins are the essential building units of the muscle structure. About the 20% of the lean muscle weight are proteins, the remaining part is represented by about 75% water and about 5% fat. According to different levels of salt solubility muscle proteins could be classify in three different main groups (Table 1.2; Goll et al., 2008). Sarcoplasmic proteins are soluble in water or in low salt solutions (<50 mM) and are distributed entirely into the cells through the cellular fluid called sarcoplasm. They form about the 30% (w/w) of the total muscle tissue. All glycolytic enzymes and metabolic pathways enzymes are comprised in this protein class. They contain also myoglobin and the oxygen carrying molecule. Myofibrillar proteins are also called contractile or cytoskeletal proteins. They are about 60% (w/w) of total muscle tissue. This group of proteins is soluble in high salt solution (about 0.6 M). These proteins build up the myofibril of skeletal muscle that consists principally in myosin (thick filaments) and actin (thin filaments) (Smith, 2010). This group -5- of proteins, sited entirely into the cell, could be divided in three subgroups: muscle contraction protein (22% actin and 43% myosin), enzyme and proteins that lead the muscle contraction and cytoskeletal proteins that make up the cytoskeletal and are responsible for muscle cells integrity and rigidity (8% titin, 5% tropomyosin, 5% troponin, 3% nebulin, 2% C protein, 2% a-actinin, 2% M protein and <1% desmin (Barbut, 2002a; Smith, 2010). Stromal proteins are not soluble in water or in salt solutions. They mainly comprise the connective tissue (collagen and elastin) but also some membrane proteins may be included. Stromal proteins are extracellular molecules, which are about 10% of total muscle’s proteins. They constitute the connective tissue proper (perimysium, epimysium, endomysium), and supportive connective tissue (ligaments, tendons, and cartilage) (Keeton and Eddy, 2004). In general, collagen represents the most diffuse protein in animal’s body, because it is the most important protein that constitutes the connective tissue. Its quantity depending mostly of muscle’s physical activity and varies in function of different kind of muscles. For example higher collagen is content in muscles of leg, which do a higher activity and have the function to support body weight. The relatively high connective tissue rate makes leg meat less tender than more inactive muscles (Barbut, 2002a). Table 1.2. Muscle proteins are classified in three different main groups, according to the different levels of salt solubility (19% of total muscle protein amount) (Barbut, 2002a). Group Protein Amount (%) (5.5) Sarcoplasmic myoglobin hemoglobin cytochromes glycolytic enzymes creatine kinase Myofibrillar myosin actin tropomyosin troponin protein C α-actinin β-actinin Stromal collagen elastin mitochondrial -6- 0.2 0.6 0.2 2.2 0.5 (11.2) 5.5 2.5 0.6 0.6 0.3 0.3 0.3 (2.0) 1.0 0.05 0.95 1.2.3 Lipids Muscle tissue contains from 1.5% to 13% of fat. It presents mainly neutral lipids (triglycerides or triacylglycerols) and phospholipids. Other kind of lipids is the sterol esters (i.e. cholesterol) and cerebrosides. In general lipid performs different functions: as a reservoir of energy for the cell, as a functional and structural constituent of the cellular membrane, as isolation or preservation for vital organs, and as hormones and vitamins (A, D, E, K) solvent. Fats are 2.25 times more caloric then carbohydrates or proteins (energydense nutrient). (Keeton and Eddy, 2004; Wood et al., 2007). Triacylglycerols consist of a glycerol (i.e., three-carbon alcohol) base-structure bonded (ester bond) with three long-chain fatty acids that in muscle tissue they usually contain more than 10 fewer carbon (Figure 1.3). Triacylglycerol can be classified as simple (glycerol bonded with three identical fatty acids) or mixed (glycerol bonded with two or three different fatty acids). The large part of fatty acids in animal triacylglycerols is palmitic (16:0), stearic (18:0), and oleic acid (18:1n-9), in general consisting of 20–25%, 10–30%, and 30–55% of the total meat lipids. Animal triacylglycerols contain in minor amount also myristic (14:0), palmitoleic (16:1n-7), linoleic (18:2n-6), and α-linoleic acid (18:3n-3). Their concentrations depend of the different kind of species and diet. (Stephen and Tume, 2008). The large part of animal’s fatty acid shows a even number of carbon atoms. Fatty acids may be saturated (without double bonds carbon-carbon), monounsaturated (with only one double bond carbon-carbon), and polyunsaturated (with two or more double bonds carbon-carbon). Fat owns properties depending of the different fatty acids chemical characteristics (i.e. carbon chain length, number of double bonds, melting point, fluidity, hardness, susceptibility to lipid oxidation). The length of carbons chain and degree of saturation determine fats melting point. The most saturated fats, with higher melting points, are the internal fats that protect the organs, while the less saturated are the external subcutaneous fats. Saturated fatty acids with twelve fewer carbons are solids at body temperature. The main fatty acid in poultry is palmitic (C16, 26%), whereas in lamb, cattle and pigs it is oleic acid (C18:1, 20–47%) (Wood et al., 2007). The fat saturation degree from most saturated (hard fat) to least saturated (oily fat) is listed by species as follows: lamb > cattle > pigs > poultry > fish. In general polyunsaturated fatty acids are easily oxidized from oxygen, pursued by monounsaturated, while the saturated fatty acids are the less sensible to oxidation of lipid. (Keeton and Eddy, 2004). -7- Figura 1.3. Characteristics of swine triacylglycerol structure: oleic acid (sn-1); palmitic acid (sn-2); linoleic acid (sn-3). Sky-blue circles represent carbon, green circles, oxygen and purple circles, hydrogen. (Stephen and Tume, 2008). The fat saturation degree from most saturated (hard fat) to least saturated (oily fat) is listed by species as follows: lamb > cattle > pigs > poultry > fish. In general polyunsaturated fatty acids are easily oxidized from oxygen, pursued by monounsaturated, while the saturated fatty acids are the less sensible to oxidation of lipid. (Keeton and Eddy, 2004). Phospholipids (0.5-1% of muscle lipid) are located in the cell membranes where carry out the structural and functional activities. This fraction is more sensible to oxidation of lipid than neutral fatty acids fraction (triacylglycerols). Phosphoslipids have almost the same structure of triacylglycerols, but they present a phosphoric acid group interpolated between the glycerol ester and the third fatty acid. The lipid content of the skeletal muscle varies in function of species, age and diet. During animal’s life fat is accumulated in the subsequent order: around vital organs, under the skin (subcutaneous fat), between muscles (intermuscular fat) and in the end between muscle bundles (intramuscular fat or ‘marbling’) (Wood et al., 2007). 1.2.4 Carbohydrates When the animal is alive glycogen is the main carbohydrate of the skeletal muscle tissue (from 0.5% to 1.5%). This carbohydrate continent in the live muscle is important because it affects colour, texture, firmness, water-holding capacity, emulsifying capacity and shelf-life of the meat after rigor process. Glycogen can be a big molecule stored in the muscle cell like a glucose reserve. It is present in granules that could have a small molecular weight (proglycogen; 400,000 Da) and the “classic” glycogen or (macroglycogen; 10,000,000 Da). Glycogen in live tissue is a source of energy that allows muscle contraction. Animal’s tissue carbohydrates are also located in the extracellular -8- matrix of connective tissues (glycosaminoglycans and proteoglycans) and in plasma and blood (glycoproteins). Some hormones, glycolytic intermediates, nucleotides, nucleosides and the glycolipids are classified as carbohydrate (Claflin et al., 2008). 1.2.5 Minerals Minerals are typically expressed as percent ash. Ashes contain several kinds of minerals: oxides, sulfates, phosphates, nitrates, chlorides and other halides. In meat tissues ashes are about 1% and derive from the total mineral content of myoglobin, haemoglobin, enzymes, bone fragments, mechanically separated tissue, advanced meat recovery systems and in cases of adding ingredients during the processing like sodium chloride, potassium chloride, alkaline phosphates, lactate salts, spices, seasonings, batters, breading (Table 1.3). Table 1.3. Mineral composition of chicken, beef and ostrich (Sales and Hayes, 1996). Minerals (mg/100g) Chicken Beef Ostrich Sodium 77 61 43 Potassium 229 350 269 Calcium 12 7 6 Magnesium 25 20 22 Phosphorous 173 180 213 Iron 0.9 2.1 2.3 Copper 0.05 0.14 0.10 Zinc 1.5 4.3 2.0 Manganese 0.02 0.04 0.06 Muscle tissue presents low content of calcium (3-6 mg/g), but high contents of potassium (250-400 mg/g), phosphorus (167-216 mg/g), sodium (55-94 mg/g), magnesium (22-29 mg/g), zinc (1-5 mg/g), iron (1-3 mg/g) and copper (0.5-0.13 mg/g). Meat contains haem iron (about 50% of the total iron) that is easily absorbed as a nutrient. Calcium, only magnesium, sodium and potassium permit the muscle contraction in live animal, while magnesium and calcium allow the contraction of muscle fibre after slaughter. Sulfur (2.5 mg/g) is present in sulfur-containing amino acids, while chlorine (0.65 mg/g) is mostly present in salt form and located in soft tissues and intracellular fluids. Iron, copper, zinc, iodine, manganese, molybdenum, cobalt and selenium are diet essential microelements, while barium, bromine, cadmium, chromium and fluorine are microelements within meat tissues with specific functions. Aluminum, arsenic, boron, lead, lithium, nickel, rubidium, silicon, silver, strontium, titanium and vanadium are also present, but until now their function is not well-defined or maybe they could be environmental contaminants (Keeton and Eddy, 2004). -9- 1.3 Muscle contraction As previously mentioned, sarcomere is the smallest repetitive unit that forms the muscular fibre. It is an area comprised between two longitudinally contiguous Z-lines with one A-band and two half I-bands (Figure 1.4). Sarcomeres are linked end-to-end in order to create the myofibril. Sarcomere length could be ranged from 4 to 1 μm or less and it has a diameter of about 1 μm. It is normally enclosed with T-tubule and sarcoplasmic reticulum, the same intracellular membrane elements of the mitochondria. In the overlap region there is a space between the thick and thin filaments of about 25 nm depending of the sarcomere length. Sarcomere is a dynamic unit that can change its diameter with the addition or the subtraction of filament. It could also be divided and developed adding myofibrils to increase the cell diameter. Sarcomeres can also be used in order to increase the overall cell length (Swartz et al., 2009). Figure 1.4. Microstructure of skeletal muscle tissue: sarcomere (Kemp et al., 2010). Muscle contraction causes muscle movement and it consists of an extremely difficult succession of events. In general, several sarcomeres shift in unison causing a tension that results in a pressure in a definite part of the body. This process practically converts the chemical energy that is stored in the adenosine triphosphate (ATP) molecules as a highenergy bond, into physical movement (Swartz et al., 2009). Below, it will be briefly discussed the most important proteins implicated in muscle contraction, with their particular structure. - 10 - Myosin. The muscle part known as thick filaments is formed by myosin, which represents about 45% of the myofibrillar proteins. This protein presents an elevated molecular weight (around 450000 Da) and an extended rod-shape (Figure 1.5). It has two heavy (myosin’s heads) and two light chains, which is possible to divide subjecting myosin toward a particular proteolytic enzyme activity. Heavy chains subsist of myosin’s heads that are able to use chemical energy stored as ATP-bond molecule, splitting ATP into adenosine diphosphate and phosphate. They use this energy to modify their orientation (i.e., bend), to form cross bridges with the actin molecules and consequently generating movement (Smith, 2010). Actin. The thin filaments are formed by actin, a protein with lower molecular weight (42000 Da) when compared to myosin. It presents two chains of G-actin, in each one is formed from several F-actin molecules. The arrangement of the actin’s chain is favoured at a definite salt concentration. Double helix of actin molecules that forms the thin filament, is made by two actin’s chains rolled together (Smith, 2010). Figure 1.5. Molecule of myosin (Smith, 2010). Tropomyosin. It is about 5% of the total myofibrillar proteins; it is located around the actin double helix structure and shows a rod-like shape. Every seven molecules of actin you can find one molecule of tropomyosin molecule. It is located at the side of the actin molecule and is situated in the inner void space between the two actin filaments (helical structure). Troponin. This globular protein is, as tropomyosin, about 5% of the myofibrillar proteins. It is also situated in the groove inside the double helix of actin, located within the tropomyosin strands. Molecules of troponin are organized according to a recurring pattern alongside the actin filament. Three different types of troponin can be found: troponin-C (binds Ca), troponin-I (inhibits ATP) and troponin-T (binds tropomyosin) (Swartz et al., 2009). In order to explain the phenomenon of the muscle contraction more than one explanation has been proposed. The most suitable explanation is known like “slidingfilament theory”. This theory shows that thick filaments (myosin) move in the direction of - 11 - the Z-lines between thin filaments (actin). As previous cited, the releasing of energy that allows the operation of this process is provided by the molecular splitting of ATP in ADP, which is performed from myosin heads in their specific site. Using this energy myosin heads turn or entwine on actin filaments moving to the Z-line. The start signal that allows the beginning of muscular contraction comes from the brain and through the nervous system reaches the muscles. The depolarized membrane and the intern electrical potential variation (from 80 mV to 20 mV) allow the transmission of the signal via nerves. In the rest time, in order to maintain constant the potential difference among inside and outside of the cell, pumps located in the membrane of the nerve transfer positive sodium ions from inside to outside (Barbut, 2002a). After the message transmission (known as action potential), electrical potential returns very quickly at initial condition, it takes about one thousandth of a second to restore the original base situation. The signal is communicated from the nerve to the muscle, when it achieves the end of the nerve, by chemical means. The last part of the nerve releases acetylcholine and induces the depolarization of the cell’s membrane of the muscle. This chemical meaning is deactivated very rapidly by a specific enzyme named acetycholinesterase to avoid an incessant messaging to the muscle. The chemical signal cause the electrical depolarization of the membrane of the muscle cell and moves to the myofibrils through a specific way of T-tubules located in the sarcoplasmic reticulum (Swartz et al., 2009). Below it is showed schematically the mechanism of muscle contraction (Barbut, 2002a): 1 - calcium is released from the terminal cisternae of the sarcoplasmic reticulum to the sarcoplasm; 2 - troponin-C rapidly bonds free calcium molecules; 3 - this allows the loop operation that permits the tropomyosin to move from the actin binding sites; 4 - cross bridges between actin and myosin molecules are formed; 5 - cross bridges are submitted to a repetitive process of creation and breaking, as consequences thick filaments shift in direction of Z-line and, thus cause the shortening of the sarcomere; The chemical message coming from the nerve stops for the duration of the relaxation phase: 1 - re-polarization of the sarcolemma and the T-tubules prepared them to receive the subsequently chemical signal; 2 - calcium situated inside the sarcoplasmic reticulum is pumped back into the terminal cisternae by calcium pump; 3 - breaking of acto-myosin bridges; - 12 - 5 - tropomyosin molecules come back again to the binding sites of actin; 6 - filaments move passively and they came back to the initial position so sarcomeres come again to their relaxing status. The sarcoplasmic concentration of free calcium leads to muscle contraction. It is less than 10-8 mole/litre, for the relaxing period, but this concentration could increase until around 10-5 mole/litre with the releasing of free calcium. This is the reason why the troponin-C bond calcium causes the movement from myosin binding sites away to actin molecules of tropomyosin-troponin system. For all the duration of the relaxation time, free calcium is sequestered again, and its concentration returns around 10 -8 mole/litre (Swartz et al., 2009). 1.4 Fibre type Fibre of skeletal muscle is constituted of multinucleate, membrane-bound cells with a diameter that ranges from 10 to 100 μm and lengths that could range from less than 1 cm to more than 30 cm. Fibre type could be clearly different according to species and muscle types, depending on the function. Moreover, several aspects contribute to fibre type variation: sex, age, breed, hormones, and physical activity. These differences are affected by their molecular, metabolic, structural, and contractile properties. The diversity of the individual muscle fibres results in a different kind of skeletal muscle (Choi and Kim, 2009; Lee et al., 2010). Commercial poultry meat shows a clear division in white and dark meat. White meat consists almost entirely in the breast muscle from chicken and turkey, while dark meat consist principally in leg and back meats. Thus poultry meat is classified according to the colour. It is well known that this classification on chicken and turkey meat depends also in the different muscle amounts of red and white fibres. In general the large part of muscles is composed from a mixture of red and white fibres; only a small number of muscles contain all white or all red fibres. In fact, on chicken and turkey the meat that presents a high proportion of red fibres is darker and more red than the white meat (Barbut, 2002a). Red and white muscle fibres present some significant metabolic and functional differences. In general, the red muscle fibres present more red appearance due to the higher content of myoglobin. Red fibres make slower contractions than white fibres, but they can work for longer periods of time (Table 1.4; i.e., slower but sustained activity). Red fibres are able to work for longer time when compared with the white ones and for this reason they present bigger mitochondria and are presented in a more elevated number. Besides they also present a superior percentage of total lipids, which represents the energetic source. Muscles used to sustain the skeleton in an upright position present a high - 13 - percentage of red fibres. These muscles present a defined metabolism that allows them to be more resistant and less fatigable. Red fibres can be operated for a long period of time, but in order to work in the proper way, they need an excellent provision of oxygen and a large number of enzymes from the oxidative metabolism (Taylor, 2004; Choi and Kim, 2009). The content of myoglobin and the activity of the oxidative enzyme are lower in white fibres than in red. Fibres usually work utilizing the glycolytic metabolism, it can be operated with or without the presence of oxygen (i.e., aerobic and anaerobic metabolism). Muscles with high number of white fibres does not need a fast transport of nutrient therefore they present lower capillary density. These muscles are known to perform more rapidly contraction for a very short time (e.g., the quickly shake of the chicken wings) and they are more susceptible to the tiredness. It is interesting to note that various migratory wild type birds (i.e., ducks and geese) present a quite dark/red breast muscle due to a higher percentage of red fibres that allow the muscle to work for long periods of time. Another midway fibre type can also be found and presents an intermediate characteristic (Barbut, 2002a; Lee et al., 2010). Table 1.4. Muscular fibre classification (Schreurs, 2000). Fibre type Characteristics Oxidative (βR) Colour Red Intermediate (αR) Red Glycolytic (αW) White Myoglobin content High High Low Capillary density High Intermediate Low Fibre diameter Low Low/Intermediate High Number of mitochondria High Intermediate Low Speed of contraction Low High High Contractile action Tonic Phasic Phasic The existence of different muscle colours is very important for the market of meat product because it can influence consumer acceptability therefore also the market price. For example in North America white meat is more expensive than dark meat. On the contrary in some parts of Asia (Far East), dark poultry meat presents higher prices (Barbut, 2002a). 1.5 Colour and pigment The appearance and thus the colour is the first aspect that influences consumer’s decision when they are purchasing meat. Customers ascribe an intense red colour to raw meat, while they attribute brown-gray or tan colour to cooked meat. Pink colour is - 14 - characteristic of cured meat products. The most important pigment of meat is myoglobin, but sometimes a little bit of blood haemoglobin and other haem pigments could also be present. Raw meat presents three forms of myoglobin: (1) purple-red deoxymyoglobin (fresh meat and absence of air), (2) bright red oxymyoglobin (presence of oxygen), and (3) brown metmyoglobin (when myoglobin is oxidized). The brown-grey or tan colour of cooked meats is caused from the oxidation and heat-denaturing of the globin hemichrome pigment (Suman and Joseph, 2013). The pigment denatured globin haemochromes can be reduced and becomes pink. This reaction can occur in the anaerobic core of large roasts or meats packaged under vacuum, independently of the cooking level. It is important to notice that denatured globin haemochromes is not the same known as mononitrosylhaemochrome, which is another pink pigment typical of cured meats. It is the consequence of the reaction between pigments of the meat and nitrate or nitrite salts, or when the meat is smoked with nitrogen dioxide. Oxidation and/or microbial spoilage may promote the development of several green pigments: metsulfmyoglobin and cholemyoglobin in raw meats, and nitrimetmyoglobin in cured meats (Cornforth and Jayasingh, 2004). 1.5.1 Myoglobin As mentioned before the most important meat pigment is Myoglobin. It is a composite molecule formed by two different portions: protein globin and an haem prosthetic group. Eight helical segments, named from A to H make the globin polypeptide, which form the empty space containing the haem part (Figure 1.6). The haem group has a hydrophobic property and it is arranged in order to orient the vinyl groups in the direction of the hydrophobic core of the box formed by the protein portion around the prosthetic group. The main roles of the globin portion is to confer water solubility and protection from oxidation to the haem prosthetic group. The reason why myoglobin is able to absorb visible light (and reflect a range of red colours) is because of the resonant nature of the conjugated double bonds of haem (Castigliego et al., 2012). Haem ferrous iron (Fe2+) may form six coordinate bonds, one for each electron in its external orbital. It is fixed to the haem porphyrin ring through four bonds with pyrrole groups and to the globin through one bond with histidine F8 (also known as histidine 93 or proximal histidine). Moreover another amminoacid residue stabilizes (without bond) the haem group into the haem box the histidine E7 (also known as histidine 64 or distal histidine). The sixth position is vacant and could be used for binding oxygen or other small ligands such as carbon monoxide (CO) The formation of metmyoglobin is due by the - 15 - oxidation of ferrous iron (Fe2+) to the ferric form (Fe3+), which is physiologically inactive because haem ferric form is unable to bond oxygen. Myoglobin molecule is only polypeptide composed of 153 amino acid residues. Its molecular weights vary according to different species and it is about 17 kDa (Mancini, 2009; Castigliego et al., 2012). Figure 1.6. Molecule of myoglobin (Castigliego et al., 2012). 1.5.2 Common fresh meat pigments Myoglobin presents three different forms deoxy-, oxy-, and metmyoglobin, that are soluble in water. Oxymyoglobin confers to the fresh cut meat its typical colour (bright red). When raw cut meat is exposed to air, it goes toward the process of oxygenation called also ‘blooming’. Oxygen takes about 30 min to oxidize myoglobin and obtain oxymyoglobin, that presents ferrous state (Fe2+) haem iron. Metmyoglobin is obtained from the oxidation of the myoglobin haem iron. Luckily, when dioxygen is liberated from oxymyoglobin, it does not oxidize directly the haem iron. In fact if it would be the operation, oxymyoglobin would not function like storage molecule of oxygen. Nevertheless, oxygen represents an oxidizing agent in meat products, this oxidation is the cause of formation of metmyoglobin and one superoxide (one electron reduction product of dioxygen). In presence of oxygen (20%) the process of metmyoglobin formation in meat is slow (over days). This process could be much faster at concentrations of oxygen equal or less than 1%. Other factors that promote the metmyoglobin formation are: high temperatures, acid conditions (pH < 5.5), presence of oxidizing agents (i.e. sodium nitrite, potassium ferricyanide, sodium chloride). A successful inhibiting process of the metmyoglobin formation in meat is the vacuum packaging (Cornforth and Jayasingh, 2004; Castigliego et al., 2012). - 16 - Carboxymyoglobin. Carbon monoxide shows higher compatibility with haemoglobin than with oxygen (this is the reason why CO is toxic). The same happens also for meat myoglobin that after bond CO becomes carboxymyoglobin (bright red). It presents almost the same colour of oxymyoglobin. Carboxymyoglobin is less susceptible to oxidation than is oxymyoglobin, due to the more resistant binding between CO and the haem iron of myoglobin. Consequently, is enough to use low levels of carbon monoxide to preserve a stable bright red colour of fresh meat stored in modified-atmosphere packaging (MAP). For example a common gas composition for MAP system is about 0.4% CO, 40% carbon dioxide, and 59.6% nitrogen. Moreover the cooking process promotes the release of the CO bonded with the raw meat, thus cooked meat presents its typical colour (Mancini, 2009; Suman and Joseph, 2013). Sulfmyoglobin. Sulfmyoglobin is a green pigment., It is caused by the reaction between hydrogen sulfide and ferrous haem iron. Pseudomonas mephitica is sulfhydrylproducing bacterium responsible for the greening phenomenon. This organism produces hydrogen sulfide from sulfur-containing amino acids at low oxygen tension and high pH condition. Sulfmyoglobin can be oxidize in metsulfmyoglobin (colour red) by oxygen and ferricyanide (Castigliego et al., 2012). Other pigment myoglobin derived from raw meat. Acid Ferrimyoglobin Peroxide is a green pigment derivative from hydrogen peroxide-induced oxidation of myoglobin at low pH. The presence of hydrogen peroxide can be allowed from some microorganisms like Lactobacillus viridescens, Leuconostoc, Pediococcus. Furthermore, ferrimyoglobin Peroxide is a red pigment derivative from hydrogen peroxide-induced oxidation of myoglobin, but at a high pH (8.0). It is possible to have ferrocholemyoglobin (dull green pigment) when myoglobin oxidation incomes far enough in order to cause porphyrin ring cleavage. Green pigments sulfmyoglobin and hydroperoxymetmyoglobin are not completely oxidized, thus they can be transformed back to myoglobin using a reducing solution. Green ferrocholemyoglobin is totally oxidized and cannot be changed back to myoglobin (Mancini, 2009; Castigliego et al., 2012). Cytochrome C. Cytochrome C is a low-molecular-weight haemoprotein composed by 104 amino acids (13000 Da). It is not very common in meat and shows higher heat stability when compared with myoglobin. It may promote the formation of pink colour typical of the cooked turkey rolls (Cornforth and Jayasingh, 2004). - 17 - 1.5.3 Cooked meat pigments The meat cooking process resulting in a globin protein denaturation (unfolding), consequently the haem group is less protected from oxidation. This is the reason why denatured globin hemichrome, the typical grey–tan cooked meat pigment, is produced in presence of air. Pink denatured globin haemochromes can be obtained when meat is cooked without presence of oxygen (canned meats, vacuum bag in hot water).Because of protein’s denaturation and coagulation due cooking, those pigments are insoluble in water or buffers. Several pink haemochromes are achievable if haem iron is maintained in the reduced state (Fe+2). This can be possible if the globin bonds nicotinamide or other nitrogen-containing ligands. Even if cooked meats present the typical grey–tan colour sometimes it can still look pink. It happens because sometimes the coking process is not strong enough to denature completely the meat myoglobin and oxymyoglobin. Using a solution of sodium dithionite (high reducing ability) in presence of carbon monoxide is possible to obtain denatured globin-CO haemochrome (pink pigment). An easier way to achieve the pink denatured globin-CO haemochrome is cooking CO-treated meats using anaerobic conditions. Nevertheless, the pinkness quickly disappears when meat is expose to air (Barbut, 2002b; Mancini, 2009). 1.5.4 Cured meat pigments The typical cured meats pink pigment is called Mononitrosylhaemochrome. This pigment can be produced in three different pathways (Figure 1.7): (1) adding nitrate, or (2) nitrite salts in the meat, or (3) treating meat with nitrogen dioxide through smoking process. Regardless of the different curing pathways (nitrate, nitrite, nitrogen dioxide), the active molecule that bonds the myoglobin is nitrous acid. After oxidation myoglobin becomes brown metmyoglobin, and nitrous acid reduced to nitric oxide (NO), bonded to haem iron. Without the presence of oxygen is possible to have the formation of red NO-myoglobin. Cooking or heat treatment are responsible for the myoglobin denaturation and thus the production of mononitrosylhaemochrome, the typical pink colour of cured products. A small quantity of sodium nitrite could be enough to colour in pink the cured meat. For example, to obtain the typical cooked turkey breast pink colour is enough 2–14 ppm of sodium nitrite (Castigliego et al., 2012). The excessive use of nitrite (>1000 ppm) determines the formation of green nitrimetmyoglobin. This phenomenon called nitrite burn, is due to an unnecessary oxidation of myoglobin. In presence of air or light meat loses part of the pink colour and becomes grey–tan (cooked meat colour), this because the binding between NO and haem iron breaks in this condition. Therefore, in order to reduce this issue - 18 - is recommended to use opaque vacuum packaging (Cornforth and Jayasingh, 2004; Castigliego et al., 2012). Figure 1.7. Formation pathways of cured meat pigment: (Cornforth and Jayasingh, 2004). 1.6 Meat pH The pH value affects some meat quality characteristics as colour, water-holding capacity, flavour, tenderness and shelf-life. It is usually determined at different times post mortem. The ultimate pH is the value measured at rigor mortis. The pH of a solution represents the concentration of H+ that when reacts with a H2 O produces a hydroxonium ion (H3O+). pH is expressed as negative decimal base logarithm (log10) of the H+ ions in the solution. In water solutions pH varies from 0 (acid) to 14 (basic). Only water without any salts dissolved shows a pH value of 7.0 (Honikel, 2004). The formation of hydrogen ions in solution occurs when acids for example lactic acid (typical on meat; CH3–CHOH–COOH) dissociates as below (Barbut 2002a; Honikel, 2004): CH3–CHOH–COOH CH3–CHOH–COO− + H+ - 19 - pH changes during the process of transformation of muscle to meat, more precisely pH strongly decreases from alive muscle (about 7.0 – 7.2) to the final value measured in the carcass (about 5.3 – 5.8) known as ultimate pH (pHu). This pH downfall is determined by the development of lactic acid (about 0.1 mol/l) derived from anaerobic glycogenolytic pathway that uses glycogen to obtain glucose and consequently, energy. When the same amount of lactic acid is dissociated in a water solution the pH detected is around 2 units, instead of the pH 5.3–5.8 measured on meat. This difference (more than 3 units) is the consequence of the buffering capacity of some constituents in meat (amino acids side chains, peptides as carnosine and anserine, phosphate ions, etc.). The detection of the meat ultimate pH (pHu) is done in numerous times after slaughtering of animals according with species, kind of muscle and level of stress during the pre-slaughter period. In general values of pHu are: 5.5–5.8 in pork muscles after 6–8 h post mortem; 5.5–5.6 in beef muscles after 18–36 h post mortem; about 6.0 in chicken after 2–4 h post mortem (Figure 1.8) (Barbut 2002a; Honikel, 2004). Figure 1.8. pH drop of chicken fillets (muscle Pectoralis major) (Barbut, 2002a). Low ultimate pH value (5.5) maintain low and reduces the microbial growth, allowing the obtainment of more tender meat. Moreover, meat with lactic acid/lactate presents positive flavour component (Honikel, 2004). The speed of pH alteration post mortem is an important trait that affects meat quality. When pH value falls very fast, and the meat is still warm, meat proteins undergo to denaturation process, resulting in PSE meat. Meat practically becomes pale because of sarcoplasmic proteins that comprises myoglobin (meat pigment) and denatures. Furthermore, the intramuscular fluid is not held by the denatured protein membranes, and goes to the extracellular space. PSE meat produces a large amount of exudates (known as drip loss) and presents a very soft texture. The refrigeration of the PSE meat during the pH - 20 - downfall helps to reduce the protein denaturation, but sometimes it is not possible to apply, in those cases of PSE meat because of pig’s big dimension (Shen et al., 2009). Another anomaly, as a consequence of pre-slaughter stress responsible of the glycogen consumption, is the formation of dark, firm and dry meat (DFD). In this case pH downfall stops prematurely when pH achieves values around of 6.0 due to the end of glycogen reserves. In fact less glycogen content on meat results in lower content of lactic acid. In this case the high pH values promotes the obtainment of darker meat, with lower drip loss and less tender meat (Shen et al., 2009). The detection of pH (in different times of post mortem) is important to evaluate meat quality traits (Honikel, 2004). 1.7 Water-holding capacity (WHC) As previously wrote, water represents the largest portion of muscle tissue (about 75%) and it is organized in layers located around polar molecules and among stratums of cellular materials. Several forces control meat water movements (Pearce et al., 2011). Water-holding capacity is definite as the aptitude of meat to hold water (naturally present in meat or added) during the application of forces like heat and pressure. The portion of water that affects more the meat water-holding capacity (WHC) is located among miofibrillar proteins (actin and myosin) where it is detained in intermolecular spaces by capillary force. Factors that affect WHC are pH, ionic strength, osmotic pressure and sarcomere length, because they all influence the distance between myosin and actin/tropomyosin. This space can range from 320 Å to 570 Å and is preserved by electrostatic forces, which are active even for relatively long distances (Brewer, 2004; Pearce et al., 2011). Proteins (for example actin and myosin) are molecules formed by amino acids jointed among themselves by peptide bonds in order to form an amino acidic chain, that represents the primary structure (sequential order of amino acids). The polypeptide chain is structured in order to form a three-dimensional molecule, which represents the second and the third structure. Finally proteins can show a quaternary structure that explains the geometric organization between different polypeptide chains usually bonded with each other through no covalent bounds. Amino acids present several side chains that are externally located respect the main protein filament. They can be charged in different ways (neutral, positively or negatively) according to the type of amino acid and environmental pH. As previously mentioned, during the transformation of muscle to meat, pH decreases (Figure 1.7) as a result of the increase of the muscle lactic acid amount. This dramatic decreasing of pH value causes the reduction of the protein reactive charged groups, which represents the ones - 21 - able to bond free water. This variation of pH determines a relevant decrease of WHC values (Figure 1.9), it mainly depends of three factors explained below (Barbut, 2002c; Pearce et al., 2011): (a) Net charge effect. Definite as the total quantity of amino acidic charged groups able to bond water molecules. Meat pH, as a consequence of lactic acid accumulation, decreases until it reaches the isoelectric point (at this pH protein presents the same number of negatively and positively charged groups). In this way, for muscle proteins the pH is around 5.5. Figure 1.9. WHC trend according to meat pH due the influence of charged groups on filaments of fibre and the distance between them. (A) excess of positive charge, (B) same number of positive and negative charge, (C) excess of negative charge (Barbut, 2002c). In this conditions, only a few groups of the side chain are able to interact with water (net charge effect). When pH is around 7.0 (live muscle pH), muscle WHC presents higher value than after rigor-mortis with pH around 5.6. (Figure 1.8). This shows the possibility to obtain a better net charge at a higher pH and consequently proteins can held more molecules of water (Barbut, 2002c; Huff-Lonergan and Lonergan, 2005). (b) Steric effect. Definite as the repulsion observable fact noticeable between different side chains charged with a analogous charge. It is well known that charged groups with the same charge repulse themselves. This represents a positive phenomenon, especially for the meat processor, because more molecules of water can be held if bigger spaces between fibre filaments are formed. It can be possible at pH lower or higher according to the isoelectric point, where an elevated quantity of negatively or positively charged groups are present, resulting in more repulsion. WHC of post mortem meat is abridged, for the reason that the pH is near to isoelectric point. Post mortem meat WHC can be increased with the variation of meat pH using alkaline (e.g. phosphates) or acid ingredients (Huff-Lonergan and Lonergan, 2005). - 22 - (c) Ions exchange. Definite as the phenomenon that occurs when rigor mortis has been completed. during the process of aging, when ions are relocated after degradation of cell structure performed by enzymes located in myofibrillar proteins. Some divalent cations as Mg2+ or Ca2+ are replaced with monovalent cations like Na + and K+, resulting in the creation of free side groups charged of protein, which increases the meat WHC. Calcium (Ca2+) is a divalent cation that is released during post mortem process. It has the ability to bind and consequently neutralize two negatively charged side groups. When calcium is substituted by monovalent ions, proteins increase the number of free binding site to bind water (Barbut, 2002c; Pearce et al., 2011). Every chemical, physical or enzymatic process that increases the space between protein filaments improve the quantity of water to be held and thus increasing the WHC. This is possible because the large part of water in muscle is located in the space between thick (myosin) and thin (actin) filaments that form myofibrils. This is the reason why salt (NaCl or KCl) and phosphates are used to improve water holding capacity in meat product. Usually salt and phosphate in water solution are included into raw meat by injection, marination or tumbling, resulting in a higher juiciness and cooking yield of the product. Adding and retention of extraneous water are possible because salt and phosphate promote the expansion of myofibrils and therefore the oblique swelling (Albarracìn et al., 2011; Petracci et al., 2013). The effect of the addition of sodium chloride to a meat WHC is showed in Figure 1.8. It is possible to observe how the WHC curve is moved to the left. This is the consequence of myofibrillar proteins solubilisation and the addition of more negative chloride ions to the system. The increasing of WHC is promoted by an optimal salt rank. Adding of salt from 0 to 3% shows a dramatic effect on increasing water retention. On the other hand salt additions higher than 5% show the contrary effect (known as saltingout). Salting-out is define as the situation where high salt concentration is present that results in proteins folding (denaturation) that change the position of their protein-charged side groups (moving to the core of the protein structure). In this way, they will not be capable of holding water molecules (Albarracìn et al., 2011). Low concentrations of phosphates (pyrophosphate and tripolyphosphate; from 5 to 15 mmol/L), are able of breaking bonds between complex acto-myosin. Using phosphates (single or in different combinations) in processed meats, in concentrations not more than 0.5 g on 100 g of final product. When allowed by applicable law, this is a very a common practice. The addition of phosphate promotes the deterioration of myofibril structure allowing a larger diffusion of water molecules in spaces between filaments. In this way, water holding capacity increases. Phosphates have a synergic effect if used in combination with sodium chloride. In fact the inclusion of about 0.6 mol/L of NaCl without phosphate is - 23 - necessary in order to allow a considerable muscle fibre to swell, but is enough an addition of 0.4 mol l/L when salt is also added (Barbut, 2002c; Petracci et al., 2013). In order to estimate WHC in raw meat and in meat products the following methods are usually used: (1) applying pressure (mild to severe; by compression or centrifugation); (2) monitoring sample performance during regular processing such as cooking or storage; (3) watching meat product microstructure; (4) applying special technique like nuclear magnetic resonance (NMR) to check water molecules state and position; (5) using optical sensors (Barbut, 2002c). 1.8 Solubility Solubility of muscle proteins is define as the percentage w/w of the native protein dissolved in watering solution when specific extraction conditions is applied. In other words it represents the balance among protein (solute) and water (solvent). This property is very important in meat processing because it can affect several functional processes that depend on the protein, like gelation, emulsification, adhesion and water immobilization. These processes are fundamental to obtain meat products like comminuted and restructured muscle foods, resultant from interactions between soluble myofibrillar proteins and different meat components. Often the terms ‘protein solubility’ and ‘protein extractability’ are used as synonyms, because these proteins when solubilised they can also be easily extracted (Xiong, 2004). Solubility of proteins depends of protein structures- The ones with highest solubility are the sarcoplasmic proteins because of their small dimension and globular structure. Moreover they present several charged and non-charged polar amino acid side-chain groups on their external surface that in combination with high or low pH promotes the protein solubility (Figure 1.10) (Sathe, 2012). Sarcoplasmic proteins structure allows naturally dissolving in water, without the need of salt to modify the ionic strength. However, myofibrillar proteins form the myofibril, an extremely prearranged muscle structural unit. Because of their complex structural arrangement and the ability of the interaction between several segments of polypeptides with each other, myofibrillar proteins are not soluble without the help of salts which changes the physiology ionic strength. Collagen is the most hard protein to dissolve (Xiong, 2004). In fact it is not soluble in salt solution when regular meat process conditions are applied, but it is necessary to use a protracted heat process or a hydrolysis with acid or/and alkaline solution. Furthermore, ionic strength also affects protein solubility specially the myofibrillar proteins solubility. From 0.03 to 0.2 Γ is observed the minimum level of solubility because - 24 - protein surface charges are screened and surrounded by small ionic elements (sodium and calcium). Figure 1.10. Hypothetical curves of protein solubility: (A) characteristic bell-shaped; (B) protein in low pH that aggregates and insolubilize (Sathe, 2012). Protein solubility is higher when ionic strength is very low (0.0003 – 0.001 Γ), but those values are not common in the industrial process. In meat product processing, myofibrillar proteins extraction is accomplished by the addition of salt and polyphosphates to the meat formulation and by the increasing of meat pH using a basic solution, and by the extension of the incorporation of time through massaging, tumbling or chopping. Moreover, elevated concentrations of NaCl are able to decrease the isoelectric point of myosin and thus increase the net charge of meat in a normal pH interval (Totosaus et al., 2002; Shen and Swartz, 2010). Besides, the use of pyrophosphate and tripolyphosphate promotes the solubility of myofobrillar protein as explained below. When sodium pyrophosphate is added, protein extraction starts at the both ends of the A-band, instead of starting only in the centre. It works like ATP, leading the division between thick and thin myofilaments (acto-myosin) (Xiong, 2005; Shen and Swartz, 2010). In general, myofibrillar proteins from white fibres show higher solubility level compared with red fibres and they are also more affected by the phosphate treatment. This difference is ascribed to numerous factors, the principals are: (1) white and red myofibrils are histologically different (white myofibril contains slighter Z-disks than red myofibrils; they also present a different isoform of a-actinin, the most important structural protein in the Z-disk), (2) other minor structural proteins (e.g. M-protein, C-protein, H-protein and Xprotein) are also morphologically different among fibre types; (3) Z-disks in white muscles present some proteins that are more vulnerable to early post mortem proteolytic degradation especially when salt is added; (4) white and red fibre are constituted of different isoforms of - 25 - myosin that are fibre type-specific and different myosin isoforms show dissimilar physicochemical characteristics, morphology and solubility (Xiong, 2004). 1.9 Gelation The ability to form a gel is known as gelation and it represents one of the main physicchemical characteristics due to myofibrillar proteins during the preparation of meat product (Xiong, 2004). Gelation of muscle foods is made by unfold and extracted (soluble) proteins that subsequently bracket together to form filaments and agglomerates. The aggregation process proceed until the formation of a three-dimensional gel network structure, that is constituted by cross-linked peptides and aggregates with a great quantity of entrapped water (Colmenero, 2002; Totosaus et al., 2002). The formation of gels allows the binding between comminuted meat particles (adhesive property), entrapping emulsified fat globules, holding some meat ingredients like flavour compounds, and immobilization of water through the formation of a threedimensional network and a complex capillary system. Therefore, also the texture-related quality traits are affected by the protein gelation, especially in products like sausages, frankfurters, boneless hams, meat rolls, and various further meat products (Figure 1.11) (Colmenero, 2002; Totosaus et al., 2002). Figure 1.11. Examples of further meat products: (A) Restructured Chicken with whey protein, (B) Fresh Chicken Breakfast Sausage, (C) Restructured 60% Extended Ham with whey protein (Nelson, 2004). A B C Gelation is mainly caused by myofibrillar proteins that are also largely responsible for WHC and solubility. Even if sarcoplasmic proteins do not present high gelling properties, sometimes they increase the stability of the protein gels. Connective tissues do not significantly affect the gelation in meat and because collagen and elastin are not adequately hydrated and extracted during the ordinary meat process. However, collagen can be extract under particular conditions (heat > 60°C and low pH) and used to form a rubbery cold-set - 26 - gel. For example pregelatinized collagens (extracted from pork, chicken skins, finely munched connective tissue), are usually used in the production of cold meat products (Totosaus et al., 2002; Xiong, 2004). In general heat treatment promotes the formation of myofibrillar protein gels. Myofibrillar proteins can produce two different kind of gels: (1) myosin gel and (2) mixed myofibrillar protein gel. Myosin gelation occurs at low-salt condition, but it has not great practical implication. However, mixed myofibrillar protein gels (known also as: myofibrillar protein gels, or actomyosin gels, or salt-soluble protein gels), are the most common ones formed in processed meat products. Also in mixed myofibrillar protein gels the most important protein that allows the gelation is myosin. Protein gelation process that occurs applying ordinary meat processing conditions (0.5 – 0.6 mol/L NaCl, pH 6.0 – 6.5) is schematically explained below (using extracted myosin model, inducing gels formation with heat) (Xiong, 2004): 1) At 35°C myosin head (S-1 subfragment) unfold, starts to create dimers and oligomers via head–head interactions. 2) At 40°C heads associate with each other with their tails radiating to external space resulting in a spider shape structure. This structure agglomerate forms a globular mass. 3) At 45°C oligomers are formed. They start to agglomerate in more complex structures (two or more oligomers). 4) From 50 to 60°C those oligomers aggregate even more, also because the tails form cross-linking that bounds themselves together in order to form the constituent parts of the strands that make up the gel networks(Xiong, 2004). Gelation is affected also by meat processing protocols and production formulations, because gel formation is made up by ordered aggregation of soluble proteins, that depends of several factors that lead the extraction of myofibrillar proteins. In fact when myofibrillar protein concentration arguments, protein gel strength increases exponentially (Totosaus et al., 2002). The factors that promote the meat protein gel formation are: pH, temperature, ionic strength, muscle rigor state and post mortem aging time, polyphosphates and time of mixing meat with salt. Myofibrillar proteins usually show optimum gelling ability for pH values of about 6.0, with ionic strength compress between 0.6 – 0.8 Γ, and a temperature around 65°C. It is advisable to perform slow heating process because it consents to obtain a progressive protein denaturation and consequently an ordered protein–protein association (Colmenero, 2002; Totosaus et al., 2002). - 27 - Protein gelation depends on the different fibre type that forms the muscle. Using the similar processing conditions it is possible to observe how white fibres proteins present a better predisposition to gel upon heating than red fibres. Besides, its gel storage modulus (G', elastic component) is commonly higher when judged against proteins from red fibres. This divergence is ascribed to the structural and solubility dissimilarities showed by different myosin isomers that form white and red fibre (Totosaus et al., 2002; Xiong, 2004). 1.10 Emulsification Food products made from thinly cut or grinded meat with own or added fat are considered as emulsion-type items. Meat emulsion is made up by myofibrillar proteins (salt soluble), little pieces of muscle fibres and part of myofibrils, connective tissues, collagen fragments, and other several ingredients (Figure 1.12). This emulsion is completely different from the conventional emulsion, where fat globules are dispersed and stabilized in water. Therefore, meat emulsion presents generally multiphase, multi component nature and explaining why it is considered to be a ‘meat batter’ (Keeton and Osburn, 2010). Figure 1.12. Typical meat emulsion, called also meat batter (Xiong, 2004). Muscle proteins present both polar and non polar groups or structural sections (amphoteric properties) and these properties allow the ‘emulsification’ process. They work like a fat–water interface bonding fats with their hydrophobic groups and water with their hydrophilic groups. This structural organization is thermodynamically favoured as consequence of the decreasing of the meat batter total free energy. Moreover sluggish and continuous grinding process frequently the reduction of the fat globules size and consequently promote the emulsion stability performed by myosin or actomyosin (UgaldeBenítez, 2012). - 28 - In order to obtain emulsion stability it is fundamental the formation of a protein coating around the fat particle. Different proteins present different capabilities to stabilize meat butter according to the following order: myosin > actomyosin > sarcoplasmic proteins > actin > collagen. The greater emulsifying aptitude of myosin in respect to the other meat proteins, depends on the structural characteristics of the protein. In fact myosin is an excellent emulsifier because it presents a particular allocation of polar and non polar amino acids: a dominance of hydrophobic groups in the head section and a prevalence of hydrophilic amino acids in the tail region. This ability is also promoted from particular length-to-diameter ratio of myosin (very high, about 40:1) that encourages the interaction protein–protein and the flexibility of fat – water interface (Keeton and Osburn, 2010; Ugalde-Benítez, 2012). Collagens do not present high emulsify capability in meat emulsification process as a consequent of its insolubility. A small presence of collagen fibrils can promote the stability of meat butter, but when the product is submitted at heat process (over 60 °C) they affect negatively the stability of the emulsion matrix and break fat globules. Thus it is better not to have an excessive quantity of connective tissue on emulsified meat products (UgaldeBenítez, 2012). Fat drops are also physically restrained in protein matrix produced mainly through protein–protein interactions. It increases meat batters stability. In this way also fat globes without a complete protein covering can be stabilized. As a result, emulsion stability of munched meat products are enhanced by physicochemical and rheological characteristics of the membrane that surround the fat particle and the viscoelastic properties of an uninterrupted protein matrices (Ugalde-Benítez, 2012). 1.11 Tenderness Tenderness together with juiciness and flavour determine the palability of meat (Troy and Kerry, 2010). This attribute is strongly related to the overall acceptability and preference sensitivity of consumers. Tenderness is defined as the easiness which is possible to crash the meat during chomping. The opposite of tenderness is known as toughness, in other words the opposition of meat to be munching and chewing (Miller, 2004). Meat tenderness improving subsists in a multifarious process affected by several factors: structural design of muscle, integrity of muscle fibres, endogenous proteases activity, and influences of extracellular matrix (McCormick 2009). Meat is a complex biological tissue, which presents many structural and metabolic characteristics that are responsible for its toughness after cooking, when it is ready to be eaten. Some of those factors, listed in Table 1.5, are called “intrinsic determinants of - 29 - tenderness”. Several intrinsic determinants usually affect the tenderness of meat, and rarely depends of only one of them (Purchas, 2004). The main components of meat are: lean tissue, fat and connective tissue. As previously mentioned it is possible to find fat or adipose cells located intramuscularly, known as marbling. Marbling is responsible for the meat flavour, juiciness and tenderness. Meat tenderness is affected by intramuscular fat content, even if this connection is not always clear. In fact there are four different theories in disagreement discussing the relationship among meat fat contents and tenderness (Miller, 2004; Troy and Kerry, 2010). (a) Bulk density theory: because fat is not dense as heat-denatured meat proteins, meat that presents higher quantity of fat or soft tissue isles tough. In other words meat tenderness is superior when it presents elevated percentage of soft constituents (such as fat). (b) Theory of the lubrication effect: while meat is masticated, lipids store in adipose cells, that constitute marbling, are liberated and become available to lubricate the muscle fibres. In this way muscle fibres that show elevated quantity of lipid may be slide with less difficulty transversely each other, as consequence meat is perceived as more tender because of the less opposition at the chewing (Miller, 2004). (c) Insurance theory: practically fat alleviates the effects of strict heat-induced toughening of meat submitted to a cooking process. Cooking process, if very severe, can strongly denature meat protein and cause loses of part of the aptitude to hold water (cooking loss). The more concentrated the muscle fibre proteins, the less tender the meat. This is why it is important to limit the quantity of liquid lost during cooking in order to not concentrate muscle fibre proteins. Lipids alleviate the protein denaturation because they work like insulators, because heat is not effortlessly transferred through fat. In other words meat that contains elevated percentage of fat will decrease heat transmission during cooking. In this way heat is not applied quickly and strictly, an meat proteins can denature in a mild way, causing less cooking loss, producing a more tender meat (Miller, 2004). (d) Strain theory: marbling is located in connective tissues (perimysium); if adipose tissue augments, perimysial result destabilized and does not affect negatively the meat tenderness. Connective tissues are consequently stressed and meat is less tough. All those four theories are not easy to investigate and they depend from each other (Miller, 2004). Meat before considerable ageing can present different initial tenderness according with different muscles, individuals and species. Tenderness is also affected by features like muscle shortening, which is not usually easy to establish (Devine, 2004). - 30 - Table 1.5. Some intrinsic determinants of meat tenderness (Purchas, 2004). Intrinsic determinant Relationship with tenderness Relative importance, and situations in which it might be particularly important 1. Concentration of connective Other things being equal, meat Of medium importance. More tissue. This tissue consists containing more connective tissue important for comparisons primarily of the fibrous protein will be less tender, but this will between different muscles, collagen, but will also include depend on the nature of the between meat samples from older some elastin and other substances. connective tissue and the cooking animals, and when cooking conditions. conditions have been mild (i.e. when final internal temperatures are less than about 60 °C so that most collagen is not dissolved). 2. The extent of cross-linking Other things being equal, meat This is an important source of between peptide chains within containing collagen with fewer variation in tenderness if samples collagen molecules in meat. cross-links will be more tender vary widely in the level of crossbecause such collagen will linking, as might be expected if dissolve to form gelatin faster and they are from animals varying at lower temperatures. widely in age (crosslinking increases with increasing age). It is also more important for fast cooking methods such as frying 3. The ultimate pH (pHu) of the Other things being equal, an An important determinant of meat, as determined primarily by increase in pHu from about 5.5 tenderness in some situations the amount of lactic acid present, (the normal pHu for meat from a where the variability of pHu is which in turn is a function of the well-fed and unstressed animal) to high. In many situations it is of glycogen levels at the time of 6.1 will initially lead to tougher low importance because there is slaughter. meat. With further increases from little variation in pHu between about 6.2 to 7.0, tenderness animals. increases. 4. The extent to which muscle is Other things being equal, a greater Very important as a determinant of contracted when it sets in rigor degree of contraction (shorter tenderness under cold-shortening mortis, as assessed by the average sarcomere lengths) will be conditions when low temperatures sarcomere length. associated with tougher meat. This pre-rigor induce muscle relationship is not linear and contraction. Thaw-shortening of muscle shortened by more than meat frozen prior to the onset of about 40% of its resting length rigor mortis can also lead to very will actually be more tender due to tough meat. If shortening is structural damage. prevented in some way, this is not an important determinant. 5. The extent to which certain proteins in meat are broken down post mortem through the action of proteolytic enzymes such as the calpains and cathepsins. Other things being equal, a greater degree of protein breakdown is associated with more tender meat, but the extent of this effect will depend on the specific proteins that are cleaved. 6. The concentration of intramuscular fat (marbling) in muscle. Levels vary from less than 2% in many lean meat products through about 3% when the marbling first becomes clearly visible, up to levels of over 30% in very heavily marbled products. Other things being equal, more highly marbled meat will be somewhat more tender. The reasons for this are unclear, but probably include the fact that the meat will tend to be more juicy, that muscle fibres and connective tissue are diluted by fat, and a reduced likelihood of pre-rigor shortening. - 31 - An important determinant of the extent to which tenderness improves with ageing of meat at temperatures above freezing. It also accounts for some genetic differences in tenderness through varying levels of proteolytic enzymes (e.g. the calpains) and/or their inhibitors (e.g.calpastatin). This determinant seldom accounts for more than 10% of the variation in tenderness, but is likely to be more important when there is a wide variation in marbling level If meat is severely affected by muscle shortening, it does not age effectively and as a consequence remains still tough. The degree of cold shortening influences the tenderization process because it impedes the large part of the ageing chemical changes (calpain system, proteolysis). Sometimes cold-shortened meat still presents some changes in tenderness after a while due to the premature beginning of the rigor in several muscle fibres that allows a protection effect against cold-shortening. Other factors can add more variability, for example the different temperature crossways muscles. In some cases muscle’s sarcomere length depends also from the way that the carcass is hung. For example, it enhances considerably if carcass is suspended from pelvis rather than from Achilles tendon. In this way meat is ready to be consumed greatly earlier compared with traditional carcasses hanging. This results in a difference in tenderness (longer sarcomere allows more tender meat), but this divergence can also be compensated with a long ageing period (Devine, 2004; Juárez et al., 2012). If meat is severely affected by muscle shortening, it does not age effectively and as a consequence remains still tough. The degree of cold shortening influences the tenderization process because it impedes the large part of the ageing chemical changes (calpain system, proteolysis). Sometimes cold-shortened meat still presents some changes in tenderness after a while due to the premature beginning of the rigor in several muscle fibres that allows a protection effect against cold-shortening. Other factors can add more variability, for example the different temperature crossways muscles. In some cases muscle’s sarcomere length depends also from the way that the carcass is hung. For example, it enhances considerably if carcass is suspended from pelvis rather than from Achilles tendon. In this way meat is ready to be consumed greatly earlier compared with traditional carcasses hanging. This results in a difference in tenderness (longer sarcomere allows more tender meat), but this divergence can also be compensated with a long ageing period (Devine, 2004; Juárez et al., 2012). When pre-rigor meat is took away from carcass skeletal connections, during operation of hot or warm, boning rigor shortening can occur, resulting in less tender meat. This drawback occurs only if temperature falls under 10°C. Thus if temperatures around 10–20°C are maintained during rigor mortis, is possible to obtain hot-boned meat with similar ageing characteristics of meat leaved attached on skeletal. To promote aging process and to obtain more tender meat in a short time, it is possible to use electrical stimulation. This practice allows the earlier start of rigor for some fibres compared with no stimulated muscle resulting in a faster aging that occurs at high temperatures before cooling down (Devine, 2004; Juárez et al., 2012). Meat and meat batters rheological properties and tenderness depend from several changes performed by different proteins. Muscle texture is largely affected by the amount - 32 - of collagen and the number of its cross-linking, tissues morphological configuration of meat, muscle biochemical condition (pre and post rigor) and mechanical breakdown of the meat structure (Juárez et al., 2012). The tenderness of the muscle structure and the formation of collagen gels are affected by the changes that occur after the animal death (post mortem changes or aging) and the time –temperature management. When heat is applied on meat the below facts occur: (1) at 40–50°C meat tenderness decreases for the reason that actomyosin denatures; (2) at 60– 75°C meat tenderness further decreases because shrinkage of intramuscular collagens; (3) at 70–90°C meat presents further actomyosin shrinkage and dehydration and collagen gelatinization; (4) at superior temperatures the general effect of heating results in the softening of the intramuscular collagen fraction and in the hardening of myofibrillar proteins fraction (Figure 1.13; Palka, 2004;Juárez et al., 2012). Meat tenderness varies according to fibre size, sarcomere shortening grade (during rigor and during heating at 70°C) fibres type, numbers of collagen cross-linking. For example, endomysium during cooking shrinks and presses out the intramuscular water and as a consequence, it can produce a less tender meat with tightening structure. When meat undergoes through a long mild cooking process (4–48 h for 50–60°C) its tenderness improves, even if juiciness and flavour are negatively affected. Meat with elevated pH and low drip loss shows less cooking losses and it is less tough after heating (Palka, 2004; Juárez et al., 2012). Figure 1.13. Meat structure and tenderness changes with increasing cooking temperature (during one hour) (Devine, 2004) - 33 - As previously mentioned during meat pH decreasing, lateral electric charge of amino acids modifies until achieves the isoelectric point (some amounts of negative and positive charges). As a consequence myofibrillar structures filled with water shrink because negative and positive charges were attracted by themselves. This phenomenon causes the reduction of the space capable of holding the water (Pearce et al., 2011; Juárez et al., 2012). This water goes to the sarcoplasm, where it is not strongly held (only by the action of the cellular walls). Meat enzyme or mechanical action during process operations break cellular membranes, that make weaker the ‘bound’ water – intact cell membranes resulting in water loss when forces like gravity, pressure and vacuum are used. In a few words pH, shrinkage and breakdown of membranes reduce meat water-holding capacity and as a consequence also the tenderness decreases. During the aging period enzymatic action reduces the toughness of meat, breaking the cross-links between filaments, that are formed during post mortem period (meat presents the higher hardness values at the beginning of rigor mortis) (Juárez et al., 2012). Final tenderness of meat is extremely affected by the degree of alteration and deteriorating of myofibrillar fibre, explaining the increase in tenderness in aged meat compared to non-aged meat (Figure 1.14). The rupture at the junction between the I-band and Z-disk, in addition to the degradation of cytoskeletal proteins, the acto-myosin complex, and other myofibrillar proteins like titin, desmin, troponin-T, or nebulin, strongly influence the meat tenderization (Koohmaraie and Geesink, 2006). Figure 1.14. Representation of myofibrils after 14 days from animal’s death. (A) and (B) illustrate post mortem changes in normal lamb longissimus with I-band breaks (v), and loss of Z-line alignment. (C) and (D) illustrate callipyge longissimus without I-band breaks. (Koohmaraie and Geesink, 2006). A B C D Lysosomal cathepsins, calpain system and multicatalytic proteinase complex are the three endogenous proteolytic enzymatic systems that are responsible for the enzymatic meat - 34 - tenderization as a consequence of the myofibrillar degradation (Koohmaraie and Geesink, 2006). Cathepsins are situated in lysosomes. This group of enzymes (endo- and exopeptidases) was the first enzymatic system to be linked with post mortem mechanisms of meat tenderization, but this primary attention was later abandoned on basis of numerous observations (Kemp et al., 2010). Even though this observation, cathepsins show a proteolytic activity on nebulin, myosin, actin, and tropomyosin analyzed in vitro. However, the degradation of samples is still different when compared with the ones observed in post mortem muscles. Consequently, calpain and caspase systems seem to be responsible for proteolysis of the majority of myofibrillar proteins for the duration of the post mortem period (Koohmaraie and Geesink, 2006). The calpain system is leaded from minimum three calcium-activated proteases: μcalpain, m-calpain, and calpain 3. In this system is also important the role of calpastatin, the inhibitor of μ- and m-calpain. μ- and m-calpain are activated respectively by a micro- and millimolar concentration of calcium. m-calpain does not present a significant effect on meat tenderization because it is more stable than μ-calpain in post mortem muscles, where there is not enough calcium to activate m-calpain. Moreover, different studies on mice indicate an elevated effect of μ-calpain on protein degradation and meat tenderization, but almost nothing on calpain 3 (Kemp et al., 2010). μ-calpain and calpastatin interaction seems to be the most important cause of post mortem proteolysis and as a consequence, meat tenderization. Although the most common assumption of the significance influence of calpain system on meat tenderness, latest approaches propose that other processes and systems can contribute, for example caspases protease (Ouali et al., 2006). With the slaughter and exsanguinations processes, cells stay without oxygen and nutrients, during which caspases starts their catalytic pathways. Until now the role of caspases is still not well known and it is still under study. Some in vitro studies about degradation of myofibril proteins by caspases, sustain the hypothesis of an important interaction among calpain and caspase protease systems (Kemp et al., 2010). 1.11.1 Meat tenderization Below, there is a brief introduction of the methods more often applied in the industry in order to obtain tender meats, as well as some main disadvantages. Those methods can be classified in: biological, chemical and mechanical. Meat tenderness is a result of many steps of meat production, processing, value adding and cooking method performed in the preparation of the meat for consumer's consumption (Bolumar et al., 2013). - 35 - 1.11.1.1 Biological tenderization Biological methods are interventions based on the biochemistry of the muscle that try to manipulate the molecular events. Those manipulations are made by applying different situations during the conversion from muscle to meat, or later on in the subsequent reactions that take place in the meat with the objective to obtain a product more tender when compared to those from uncontrolled processes at slaughter or non-matured. Control of pH and temperature at slaughter. The control of pH and temperature in the muscle during pre-rigor stage is determinant to obtain tender meat. The myofibrillar shortening develops when pre-rigor muscle is maintained at either low or high temperatures. “Cold shortening” happens when muscle temperature is lower than 10-12°C, while its pH is above 6.0 causing a severe contraction. In contrast, if the muscle when pH reaches below 6.0 with temperature high, above 30-35°C (Thompson, 2002). In this last situation, a protein denaturation leading to PSE meat occurs, which causes higher drip loss and reduces aging ability. It is interesting to emphasize, that the rate of pH declines and that the rate of cooling of the muscle depends of variables because temperature affects the pH decrease, which can be controlled by the level of electrical stimulation applied to the carcass in such case. Between those two extremes, “cold shortening” and “heat shortening”, there are different conditions that affect the quality and therefore, the performance of effective control of temperature and pH declines in post mortem, and pre-rigor meat offers the opportunity to improve meat tenderness and more important, to achieve the quality attributes demanded by the market (Simmons et al., 2006). However, the control of pH and temperature of whole carcasses is extremely complex because of carcasses size and glycolytic rate that depends on genetic an environmental aspects (Thompson et al., 2006). Thereby processor in packing plants must be able to anticipate pH falls and to adapt chilling regime accordingly to practical terms, which could be a strong challenge taking into account the great variation among animals, particularly in beef livestock. Electrical stimulation. Simmons et al. (2008) revised the principles of electrical stimulation whose main commercial interest is to accelerate meat tenderization. Electrical stimulation of hot carcass immediately after slaughter is used by meat industry mainly to prevent cold shortening effect. This effect occurs in pre-rigor meats when a rapid cooling of the muscle compromises the ability of the sarcoplasmic reticulum and mitochondria to retain calcium. It leads to an increasing of calcium concentration in the sarcoplasm whereby muscle fibre contraction is stimulated and consequently toughness. The mechanism that results in beef tenderization occurs by the activation of the endogenous proteolytic system by a fast pH decline when the carcass is still warm (Simmons et al., 2008). Rigor mortis during electrical stimulation is developed more quickly avoiding cold shortening and likely triggering proteolysis to occur soon after. - 36 - These happen because beef carcasses, under the electrical stimulation, are submitted to a high or low electrical current voltage that causes muscle contraction and strongly accelerates the rate of glycolysis. While for small carcasses such as lambs, there is a higher possibility of suffering cold-shortening when in rapid chilling, the same is not observed in beef. Beef presents larger conformation or heavy carcass that are not easily chilled fast. Moreover, the rapid drop in pH by the excessive stimulation results in deleterious effects in meat quality parameters, such as colour and drip loss. In addition, the mechanism does not solve the tenderness problem because post aging period is required to achieve the tenderness expected by consumers. Therefore, it does not reduce completely time and costs associated with the traditional aging process and does not have significant effect on “tough” primals. Tenderstretch and “Tendercut”. Tenderstretch method is an alternative to hang carcasses from the pelvic or hip bone instead of the hind of the leg or Achilles tendon (conventional hanging). This method must be done in packing plants before carcasses reach rigor onset. It has been demonstrated to increase tenderness of muscles that are located around the area, because muscle stretching at the onset if rigor prevents fibre shortening and reduces sarcomere contraction from occurring (Bolumar et al., 2013). Tendercut is another alternative using also muscle stretching pre-rigor that allows muscle to complete rigor in the stretched state. It is performed by cutting bones and connective tissue in the id-loin and round/sirloin junction of carcass sides (Sørheim & Hildrum, 2002). However, pelvic suspension or tender cut of beef carcasses are not widely used in meat industry because it demands many changes in the design of the packing plant (i.e. more rooms needed in the chilling chamber). Moreover, it increases the labour time and cost, and it presents useful only for some limited muscles that undergo to the forced stretching. Besides, deformation of muscle conformation can also be recognized as a problem. Hot boning: improvement in muscle chilling and stretching. Hot boning are processes in the carcass that occurs before chilling when muscles are still in pre-rigor state. It reduces the carcasses into individual primal cuts facilitating chilling, stretching and forming interventions (Simmons et al., 2006). This reduction is important because chilling process of individual pieces occurs faster than in whole carcasses, which has been proved to be an effective way for reducing PSE meats. Moreover, this faster chilling allows better temperatures and pH controls favouring tenderness consistency and improving colour and drip loss. Besides chilling process can still be improved when performed with immersion in a liquid cooling system because it provides a much faster chilling than the air chilling system. - 37 - Furthermore, as meat is still in pre-rigor state, sarcomere lengths are not fixed and can still be extended by mechanical forces in a mechanism like Tenderstrech. And through the application of those forces, shaping can also be achieved. There are two main known commercial systems Pi-Vac® and SmartStretch used to perform those mechanisms. Although hot boning can present all those positive aspects, it is still difficult to implement in packing plants because it requires large investments in processing lines, high control degree in the time-course of the processing, high hygienic standards and more qualified and trained operators. Further, it gives important advantages in terms of reduced purge loss and improvement of colour stability, whereas the effect on tenderness is still limited and maturation is still needed to achieve consumer's expectations. Moreover, it does not have a satisfactory effect on “tough” primals (Bolumar et al., 2013). Traditional aging. Traditional aging system consists of keeping in a cooler chamber between 2 and 5°C either whole carcasses (dry aging) or primal cuts vacuum-packaged after deboned (wet aging). In the dry aging method, carcasses go under huge drip losses (3– 5% or even more), the reason why wet aging became the most common practice instead. The improvement in tenderness in aging systems occurs through natural enzymatic changes in muscles (i.e. rupture of structural muscle's protein by endogenous proteases) (Lonergan et al., 2010). In order to achieve tenderization, the meat must be chilled through a period between 7 to 21 days depending on the age of the animal and the meat cut may be also required. Beefs kept in higher temperatures tenderize faster, but it also may spoil and develop off-flavours. In this way, it is known that the main limitation of this process is the high time- and energy-consumption, resulting in high processing costs. Besides, it requires the accumulation of high stocks of meat and big rooms to storage at refrigerated conditions. 1.11.1.2 Chemical tenderization “Post-exsanguination vascular infusion” is the infusion of substances in the carcass just after blood removal and represents an important alternative intervention used to achieve and enhance protelysis and/or to improve water holding capacity or colour stability. Many different solutions infusions had been reported in literature, such as calcium chloride as an activator of the calpain system (Koohmaraie et al., 1998), mixtures including dextrose, maltose, glycerin and polyphosphates and/or containing saccharides, sodium chloride, phosphates, vitamins C and/or E (Hunt et al., 2003), and proteases like papain or actinidin (Han et al., 2009). Salt is another substance that when applied in certain concentrations increases meat tenderness by smoothing connective tissue proteins and collagen into a more tender form. For this reason, many chemical treatments contain salt in their brine injection composition. But, because nowadays there is a strong wave in the meat - 38 - industry of reduction on the use of salt because of its relation with health issues like cardiovascular diseases (Desmond, 2006), salt has been avoided. Moreover, negative aspects had strongly limited its commercial practical use regarding to packing plant lines, high microbial cross-contamination risk potential and appearance of off-flavours. Another solution that has been studied is the marination of the meat by immersion or injection usually in acidic solutions (acetic or lactic acid), that contains salts, phosphates, and other meat enhancers like flavourings and spices that improves tenderness and the overall acceptability of tough pieces (Berge et al., 2001; Brooks, 2007). This method has been strongly used by meat production because of its benefit in quality and production yields. Other substances used for chemical tenderization are calcium for example. Calcium accelerates meat tenderization by activating the endogenous protease system. Some exogenous proteolytic enzymes have also been tested to achieve meat tenderization as an alternative. However, enzyme activity demands an inactivation or it might cause problems like over-tenderization or off-flavours by the continuous action of the proteases. Chemical tenderization is also strongly affected according to the method applied to incorporate the chemicals in the meat, because it causes an important effect in their distribution through the meat. By immersion system, tenderization effects are usually limited to the meat surface or it demands long periods for the substances to penetrate. By contrast, injection by needle mechanism causes damages and high risk of microbial crosscontamination. Moreover, for a commercial point of view, it is very important to emphasize that no substances are legally allowed to be added in fresh meat under the ambit of the majority of the rules (Bolumar et al., 2013). From a commercial standpoint, it must be noted that no substances are legally allowed to be added to “fresh meat” under the scope of the majority of the regulations (i.e. The European Parliament and the Council of the European Union, 2004). And if any chemical is added, the meat immediately becomes classified as “prepared meat”, suffering commercial implications such as substantial price reduction (Bolumar et al., 2013).. 1.11.1.3. Mechanical tenderization There are many mechanical tenderization in the meat industry that has been used recently and has become more popular over consumer's acceptability. Grinding for example is one of the most common, easy and popular method that increase tenderness especially in beef. It is normally applied in tough meat cuts or in meat coming from old cattle. It shows to be very practical as by now no other effective and economically solution has been discovered for this type of meat. However, minced meat still loses great market value when compared to unprocessed meat (fresh meat, such as steak). - 39 - Blade and needle tenderization method is another system used. It acts in the connective tissue contained in the lean and it is very used in special tough meat cuts like round and chuck. However, it has many disadvantages because causes mechanical disruption that strongly affects the texture and appearance of steaks. Moreover, increases the hypothetical microbial cross-contamination and colour changes in the penetration area (Bolumar et al., 2013). Finally, there is HPP (high hydrostatic pressure processing) that improves tenderness by rupturing nature induced through pressure, causing a dissociation of the myofibrillar proteins (Sun and Holley, 2010). When performed in pre-rigor, it stops the metabolism of the conversion of muscle to meat that results in higher pH and higher tenderness score that can be only measurable when pressure and heat are combined (Sikes et al., 2010). But HPP causes colour changes because of the protein denaturalization, which makes HPP meat not acceptable in the category of fresh meat anymore. In addition, HPP method demands a high initial investment and with all those negative aspects, HPP has been excluded from industrial installations. 1.12 Flavour of poultry meat Meat products’ flavour, as for other foods, is one of the most important factors that determines its acceptance between consumers. Flavour is defined as a combination of two main senses: taste (perceived by tongue receptors) and aroma (perceived from olfactory receptors of the nose) (Farmer, 1999). The perception of flavour and taste is still not completely comprehended because it represents an extremely complex system that is influenced by numerous elements (e.g., flavour compounds composition and temperature of food). In Table 1.6 are reported the majors compounds that affect cooked poultry meat flavour. Taste is detected by tongue sensors able to notice four main sensations called salty, sweet, acid and bitter. Other feelings like “umami” (Japanese word that means very tastiness), astringency, metallic and painful (“hot” and “cooling” foods) are also noticed. Several studies have reported how tasty compounds contribute to meat flavour. The large part of the works are focused on red meat, but comparable results are estimated also for poultry meat. Meat Flavour is affected principally by genetic type, meat component, diet, post processing process, cooking, additives and use of irradiating and pressure (Jayasena et al, 2013). - 40 - Table 1.6. Mainly compounds that contributes to aroma on cooked poultry meat (Farmer, 1999). Compound Odour Character Sulfur-containing Compound 3,5(2)-Diethyl-2(6)methyl-pyrazine Odour Character Popcorn Sweet, roasted Hydrogen sulfide Sulfurous, eggy 2-Acetyl-pyrroline Dimethyltrisulfide Gassy, metallic Aldehydes, ketones and lactones Sulfurous 1-Octen-3-one Cooked potatoes trans-2-Nonenal Tallowy, fatty Nonanal Tallowy, green 3-Mercapto-2- pentanone Methional Furanthiols and disulfides Mushrooms 2-Methyl-3-furanthiol Meaty, sweet trans, trans-2,4Nonadienal Fatty 2,5-Dimethyl-3-furanthiol Meaty Decanal Green, aldehyde 2-Furanmethanethiol Roasty trans, trans-2,4Decadienal (and an isomer) Fatty tallowy 2-Methyl-3- (methylthio) furan Meaty, sweet 2-Undecenal Tallowy, sweet 2-Methyl-3-(ethylthio) furan Meaty γ-Decalactone Peach-like 2-Methyl-3methyldithiofuran Meaty, sweet γ-Dodecalactone Tallowy, fruity bis(2-Methyl-3-furyl) disulfide Meaty, roasted Other Other heterocyclic compounds 2,3-Butanedione Caramel 2-Formyl-5-methyl thiophene Sulfurous β-Ionone Violets Trimethylthiazole Earthy 14-Methyl- pentadecanal 2-Acetyl-2-thiazoline Roasty 14-Methyl- hexadecanal 2,5(6)-Dimethyl- pyrazine Coffee, roasted 15-Methyl- hexadecanal Fatty, tallowy, train-oil Fatty, tallowy, orangelike Fatty, tallowy 2,3-Dimethyl-pyrazine Meaty, roasted 4-Methylphenol Phenolic 2-Ethyl-3,5-dimethyl pyrazine Roasty 1.12.1. Genetic type It is known that chicken palatability is strongly influenced by its genetics, especially indigenous chickens when compared to broilers. For instance, in Japan there is a line called Hinai-jidori chickens that showed more palatable than broilers during a sensory analysis (Kiyohara, et al., 2011). In Korea, native-farm chickens also scored higher flavours in sensory essays compared to broilers (Jung et al., 2011). Yamaguchi (1991) showed that inosine-5′- monophosphate (IMP) is the main nucleotide presented in the muscle responsible for flavour in cooked meat. In this way, it has been found that Korean native chicken and Hinai-jidori had higher concentrations of IMP compared to broilers (Table - 41 - 1.7). Another genotype that scored more IMP than broilers, was the slow growing type from China (Tang et al., 2009). Tang et al. (2009) explains that the difference between IMP concentrations among genotypes could be due the effects of genotype, age, or even their interaction between themselves. Moreover IMP content depends on the muscle type. Breast meat presented significantly higher concentration than leg muscle (Tang et al., 2009). Different nucleotides presented in muscles can vary significantly according to species, breed, age, sex, etc. For instance, different breeds/strains contain different levels of flavour precursors, causing also different types and volatile compounds concentration (Vani et al., 2006). Lee et al. (2012) recently presented the components associated with flavour and taste in commercial broilers and Korean native chicken meat. Results assessed that Korean native chickens had more content of some components than broilers. For example, in thigh meat arachidonic acid and docosahexaenoic acid (DHA) content were higher than in broilers. DHA and eicosapentaenoic acid (EPA) are responsible in suppressing sourness and bitterness, and increase sweetness and umami characteristics (Koriyama et al., 2002). Table 1.7. Inosine-5’-monophosphate contents of different chicken genetics type. Genetic Type Inosine-5’-monophosphate (mg/g) Broilersa 1.44 Hinai-jidori chickena 1.57 Wenchangb 1.52 Xianjub 1.44 Avianb 0.95 Lingnanhuangb 0.97 Korean native chickenc 2.31 Broilersc 1.54 a Rikimaru and Takahashi (2010); b Tang et al. (2009); c Jung et al. (2011). 1.12.2. Meat components Lipid class and fatty acid composition. Lipids influences in meat flavours are due to the differences in fatty acids profiles and the resulting of carbonyls (Perez-Alvarez et al., 2010). Besides, precursors that are supplied by lean tissues are responsible for the meaty flavour presented in all cooked meats (Mottram, 1998). For instance, aldehydes produced during lipid degradation are characteristic of some species. 2-alkenals (hexenal, heptenal, octenal, nonenal, undecenal, and dodecenal) as well as aldehydes (octanal, nonanal, decanal, and decadienal) are all associated to chicken-specific aroma and flavour (Ramarathnam et al.,1993). Moreover, Calkins and Hodgen (2007) reported that poultry and pork muscles have higher contents of polyunsaturated fatty acids in the triglycerides than lamb or beef, which means they form more unsaturated volatile aldehydes (Table 1.8). Those components also - 42 - contribute to the specific aroma of chicken and pork (Noleau and Toulemonde, 1987; Mottram, 1991). Table 1.8 Fatty acid composition of the phospholipid and triglyceride fractions of chicken meat (adapted from Shi and Ho, 1994). Type of chicken meat Lipid type Fatty acid composition (%) Saturated Monounsaturated Polyunsaturated Breast Triglyceride 33.8 42.7 25.6 Phospholipid 35.3 21.1 41.4 Leg Triglyceride 33. 0 42.3 24.8 Phospholipid 39.1 16.4 43.5 Fatty acids such as linoleic and arachidonic acids auto-oxidize forming 2,4decadienal, 2-nonenal, 1- octen-3-one, 2,4-nonadienal, and 2-octenal through 9hydroperoxide and 11-hydroperoxide, respectively. 2-nonenal and 2,4-decadienal are known to contribute to a meaty flavour (Perez-Alvarez et al., 2010). However, trans-4,5epoxy-(E)-2-decenal, followed by 1-octen-3-one, 2,4-decadienal, 2,4,7-tridecatrienal, and hexanal are the most intense aroma components from the oxidation of arachidonic acid (Blank et al., 2001). Free amino acids and nucleotides contents. Free amino acids, glutamic acid, nucleotides, and IMP contents are associated with the chicken meat flavour (Takahashi et al., 2012). In fact Matsuishi et al. (2005) observed a better taste in soup made with conventional chicken meat than the one prepared with alternative chicken meat (Jidori genotype) because its more elevated concentration of free amino acid. In addition the research of Rikimaru and Takahashi (2010) analysing the meat chemical components demonstrated that free amino acids are able to improve the meat flavour during storage. In other hand, Fukunaga et al. (1989) has observed that phenylalanine content is closely related with bitter taste. One of the principals amino acids responsible to the chicken meat taste is glutamic acid, which confers umami sensation, playing alone or together with other taste-related compounds an important role in meat flavour (Kurihara, 1987). Also tiamine and, cysteine and ribose are a very important flavour precursor of cooked meat, the first is the responsible to the ‘roasted’and ‘vegetable soup' tastes, the other two are the responsible of the ‘chicken’ and ‘savoury’ tastes (Aliani and Farmer, 2005). Liu et al. (2012) reported that different protein and peptides (phosphoglucomutase 1, NRXN3 96 kDa protein, HSPB1 22 kDa protein, and TF 78 kDa protein), formed during the post mortem aging period, contribute to the typical flavour of cooked meat. It is well know that all the components that present umami taste (for example amino acids, inosine, IMP, and peptides) affect significantly the sensorial characteristics of meat (Jayasena et al, 2013). In addition it has been demonstrated that several volatile compounds are generated by the combination of different sugars with amino groups under different conditions. For - 43 - example when glucose bond cysteine sulphur compounds are principally formed, but the same reaction under oxidation conditions produce mainly pyrazines and furans (Jayasena et al, 2013). Moreover, at pH 6 and 8 sulphur-containing compounds (thiophenes, thiazoles, and cyclic polysulphides) are produced by the maillard volatile compounds from glutathione/glucose systems, but the same compounds at more acid pH form mainly furans. Again from the glutathione oxididation, glutathione sulphonic acid is obtained, which reacting with glucose form furans, carbonyls, pyrroles, and pyrazines, but because glutathione is oxidised, it is not possible obtain sulphur-containing compounds (Jayasena et al, 2013). 1.12.3. Diet Diet of poultry is also another important aspect that strongly influences the flavour of the meat (Perez-Alvarez et al., 2010). Besides, Fanatico et al. (2007) proved that by manipulating the diet, it is possible to improve the flavour of the chicken, as well as deteriorates it. For instance, Poste et al. (1900) supplemented poultry diet with fish meal in three different levels and determined that even in small percentages the additives affected negative the flavour of the cooked meat. Besides, birds fed with 8% of herring meal resulted in unpleasant rancid, fishy or stale flavoured raw meat. After cooking, off-flavour was less evident but increases after samples were kept overnight at 4°C and re-evaluated 24 h later. Another study using medical herb extract mix (0.3%) consisted of mulberry leaf, Japanese honeysuckle, and gold thread scored higher control meat (Jang et al., 2008). Moreover, diets supplemented with fat source, dl-α-tocopheryl acetate and ascorbic acid. However there are other studies that present positive results when manipulating diet. For instance, Huang et al. (1990) studied the effect of a dietary lipids on fatty acids composition in chicken muscle. The study was performed supplementing the diet with different percentages of menhaden oil. The results pointed an increase of DHA in thigh flesh without leaving fishy flavour by feeding up tp 3% of fish oil. Recently, also another study obtained positive results, using Hinaj-jidori chickens fed with diet containing high levels of arachidonic acid. Samples resulted in better sensory characteristics (total taste intensity, umami, kokimu, after-taste and saltiness; Kiyohara et al., 2011). This study was also later confirmed by Takahashi et al. (2012) but in broilers. Authors defended that arachidonic acid can be used as a flavour enhancer because it activates TRPM5 cation channel, which is considerable to be responsible for sweet, bitter and umami taste pathways of type II receptor cells. - 44 - 1.12.4. Post processing process pH. The pH in food is a very important parameter that strongly influence flavours in meat through Maillard reaction (Calkins and Hodgen, 2007). However, the effect of pH on this reaction has not been vastly investigated because fresh meat has a normal pH range (5.5-6.0) with a good buffering ability. Moreover, a study reported that one of the main volatile components of fried chicken (2,4,6-trimethylperhydro-1,3,5-dithiazines – thialdine), together with other dithiazines is influenced by pH. For example, at a pH at 1.6, thialdine exhibits weak flavour of comestible mushrooms, whereas at 2.5 it was possible to feel a sweet odour and at 3.5 and 8.1 medium roasted shrimp flavour (Shi and Ho, 1994). Aging. One of the most important factors that influences the final flavour of the meat has been pointed as post mortem aging, because it produces many chemical flavour components during this process ( sugars, organic acids, peptides, free amino acids, and metabolites of adenine nucleotide metabolism; Liu et al., 2012). Also Spanier et al. (2004) confirm that amino acids and peptide levels change according to post mortem aging in muscles. Moreover, Yano et al. (2005) reports that those components increase during aging. Besides, aging can lead in a flavour increase because of the correlation of free amino acids contents with chicken taste, which was also noticed in another study (Nishimura et al., 1988). It reported an increase in free amino acids that caused meaty taste. According to Spanier et al. (2004) those components serve directly as flavour components or as a pool of reactive flavour that mediates many characteristics of the meat flavour after cooking. 1.12.5. Cooking Cooking is another part of the quality meat that must be studied because it plays a very important role in consumers acceptability and also in volatile flavours in poultry meat (Sanudo et al., 2000). Besides, there are many flavoured components recently isolated that suffer transformations under storage and cooking process (Perez-Alvarez et al., 2010). A study investigated the relationship of amino acids, IMP and peptides in raw and cooked meat. The results showed that after cooking, those umami-relevant components decrease. Moreover there were also a decline in the taste, which could be explained by the leaching of these substances (Chikuni et al., 2002). High temperatures (above 100°C) facilitates the formation of a numerous heterocyclic components that are found in aroma of cooked meats (Melton, 1999). Those high temperatures can be easily achieved in many cooking methods such as roasting, grilling, frying, and pressure cooking. For instance, according to Shi and Ho (1994), pyrazines, pyridines, pyrroles and thiazoles have been found only in roasted or fried - 45 - chicken, but not in chicken broth. The generation of those compounds as known to be responsible for the flavours of chicken when prepared under those high temperatures. Further, it is also influenced by the concentration and characteristics of the components formed in Maillard reaction, lipid degradation and Maillard-lipid interactions (Melton, 1999). 1.12.6. Additives Additives as plant extracts have been used lately as an alternative mechanism in meat products in order to reduce lipid oxidation. It has been used as an alternative for toxicological concerns caused by the usage of synthetic antioxidants (Ahn et al., 1998). According to Jahan et al. (2005) there is a relationship between antioxidants α-tocopherol, omega-3 fatty acids, total polyunsaturated fatty acids (PUFAs) and flavour components from cooked chicken. PUFA and α- tocopherol contents were highly associated to total flavour, but no relationship with the abundance of nitrogen-rich components (pyrazines and pyridines) with PUFA was observed. On the other hand, glutathione peroxidase and glutathione reductase showed relation with chicken flavour component. Another study conducted by Rababah et al. (2006) used plants extracts with high content of antioxidants (grape seed extract, green tea pentanal and their combinations) in chicken meat. The results showed that they were very effective in reducing lipid oxidation products like pentanal and hexanal. In this way, those plant extracts may be able to reduce the appearance of off flavours in chicken meat. 1.12.7. Irradiation and high pressure The mechanism of irradiation in the meat directly influences its quality, including flavours and aromas, by the production of free radicals (Perez-Alvarez et al., 2010). Researchers found that the volatile compounds produced by irradiation responsible for the off-odours were aldehydes (hexanal, pentanal, heptanal, octanal, and nonanal) and sulphur volatiles (Patterson and Stevenson, 1995; Ahn et al., 2000; Ahn and Lee, 2002). In irradiated raw chicken meat, Heath et al. (1990) reported an exhale of bloody and sweet aroma. It seems to be caused by a radiolytic degradation of sulphur-containing amino acids (Ahn, 2002) and by lipid oxidation (Jo and Ahn, 2000). Those reactions were capable of producing a cabbage-like or putrid vegetable odours. Sulphur-containing amino acids has been reported as the main source of irradiation-induced odours. Because of this, the initial concentration of those amino acids in the meat directly affect odours results after irradiation. Chickens contain almost two times the total sulphur-containing amino acids - 46 - (cysteine + methionine; 1.58 g/100 g) when compared to beef, lamb, perch and salmon (0.87, 0.75, 0.97, and 0.89 g/100 g, respectively; Patterson and Stevenson, 1995). On the other hand, when samples before irradiation are submitted to different atmosphere packaging and different temperature situations (freezing), as well as added antioxidants, irradiation-associated odours were lower (Ahn et al., 1999; Jo et al., 2001). Moreover, those negative odour characteristics produced by irradiation can be reduced or even eliminated by allowing oxygen permeability in packaging after irradiation. For instance, vacuum packaged irradiated chicken meat produces sulphur-containing compounds, but when re-packed with an oxygen permeable material, sulphur compounds are dissipated (Nam and Ahn, 2003). When chicken meat is submitted under high pressure treatment there is a production of volatile compounds. Those compounds are responsible in the change of flavour and/or odours of the meat. Rivas-Canedo et al. 2008) submitted minced beef and chicken breast samples under 400 MPa and noticed a significant change in some volatile compounds levels. There were an increase in 2,3-butanedione and 2-butanone and a decrease in some alcohols and aldehydes. Those results show that this type of treatment can strongly affect chickens flavour and aroma. Besides, high pressure treatments can accelerate some reactions that impact in food flavour, such as the denaturation of muscle proteins or proteolytic enzyme activity in the muscle caused by pressure induced increase. According to Kurk et al. (2011) 300 MPa can already result in an improvement of taste and flavour. 1.13 Peroxidation of lipids Deterioration of odour, flavour, colour or texture are the main causes of meat spoilage. One of the most important fact that determines those changes is the oxidation. Oxidation is defined as the condition when electrons are lost, hydrogen ions are abstracted or unpaired electrons are streamed. Every meat chemical constituent could be affected by oxidation. Peroxidation of fatty acids causes the formation of rancid odours or flavours and ‘warmedover’ flavour in cooked meat. In addition, oxidation of meat pigments is the responsible for the brown meat discolouration. Finally, oxidation of meat proteins reduces the functional properties (gel-forming ability, meat binding ability, emulsification capacity, solubility, viscosity and water-holding capacity) (Aalhus and Dugan, 2004). Another very important element also responsible for meat and fish quality deterioration (flavour, odour, taste, colour, texture and appearance) is lipid peroxidation even if fat contents are reasonably low. Beef meat contains 2–4% of triacylglycerols (glycerol bonded with oleic, palmitic and stearic fatty acids) and 0.8–1% of phospholipids. Phospholipids represent structural fats because they form the membranes. They present - 47 - over 40% of polyunsaturated fatty acids (22% 18:2 n-6, linoleic acid; 2% 18:3 n-3, linolenic acid; 15% 20:4 n-6, arachidonic acid; 1% 20:5 n-3, eicosapentaenoic acid; and 2% 22:6 n-3, docosahexaenoic acid) (Aalhus and Dugan, 2004; Sun et al., 2011). In general, phospholipids are the first molecules involved on the oxidation reactions due to their high level of instauration and their closeness to the haem catalysts of mitochondria and microsomes. Poultry meat presents higher levels of polyunsaturated phospholipids and lower levels of antioxidants when compared with beef. This is the reason why it is more vulnerable to oxidation of lipids. Fish is even more inclined to oxidation due to the high amount of unsaturation (omega-3 fatty acids) (Aalhus and Dugan, 2004; Sun et al., 2011). In whole meat, lipids are located in specific compartments, where they are protected from propagators of oxidation. However, extended storage under adverse conditions could generate rancid odours, that are formed from products by autoxidation of unsaturated fatty acids (oleic, linoleic, linolenic and arachidonic). It is possible to describe the autoxidation process through three stages: initiation, propagation and termination (Figure1.15). Figure 1.15. Lipids oxidation pathway (Aalhus and Dugan, 2004). When unsaturated fatty acid and molecular oxygen (O2) reacts with each other a free radical is obtained, starting the initiation phase. Free radicals are formed when a labile hydrogen is removed from the carbon atom next to the double bond. Following, the free radical can react with oxygen in order to form a peroxyl radical. This molecule is very active and it is able to abstract another hydrogen from another fatty acid, causing the - 48 - propagation of a chain reaction. When two free radicals or two peroxyl radicals react together or when a peroxyl radical reacts with a free radical the termination phase takes place. This phase occurs also when radicals react with other meat constituents such as vitamins, amino acids, or dipeptides (Sun et al., 2011). Meat rancid flavour is mainly due to the aldehydes originated from the decompositions of hydroperoxides that are formed during propagation. For this reason rancidity level in fats is usually measured through the determination of malonaldehyde by its reaction with thiobarbituric acid (TBA) (Sun et al., 2011).Some intrinsic factors that affect lipid oxidation (vitamin E levels and animal age) can be directed by management practices, while others could be realized during post mortem period. It is known that an appropriate handling and packaging of refrigerated and frozen meat can prevent rancidity. Meat products oxidative stability is promoted by particular packaging system as low oxygen partial pressure atmospheres, vacuum, oxygen-free atmospheres and nitrogen or carbon dioxide atmosphere. Moreover using opaque packaging decreases the light exposure and as consequence retards the reaction of oxidation. Grinded meat (hamburger) looses the membrane integrity leaving its fats exposed to metal catalysts and thus more susceptible to oxidation. Also adequate temperatures manage can reduce the oxidation rate. In order to alleviate lipid peroxidation, meat should be frozen and stored at stable temperatures (-18°C or lower) in tight-fitting, moisture-proof packaging. Unfortunately, in order to allow the consumers to evaluate the appearance of fresh meat products, they are not stored (retail and home storage) in the best proper way to obtain the best conditions that maintain oxidative stability (Ahn et al., 2009; Sun et al., 2011). One of the most important causes of quality worsening in cooked precooked and refrigerated meat products is the Warmed-over flavour (WOF). WOF embraces both, formation of unwanted and loss of desirable flavours characteristics. The aromas and flavours as painty, rancid, stale and cardboard-like are frequently related to WOF. WOF can be quickly generated: less than 48 h in reheated or refrigerated meat and in a few days in pre-cooked and frozen meat. WOF are originated by the polyunsaturated fatty acids (PUFA) oxidation. PUFA are mostly located in cell walls as phospholipids. From the secondary products of lipid oxidation aldehydes like pentanal, pentenal, hexanal, hexenal and 2,4-decadienal are obtained. These volatile compounds are responsible for the WOF perception, also for small amounts (ppb). Therefore, meats with elevated percentage of PUFA are also the most inclined for WOF improvement. This is the reason why fish is the most susceptible one, followed by poultry, pork, beef and lamb in crescent order. PUFA oxidation rate can be affected from factors that promote oxidation of lipids, decreasing the energy (metals, singlet oxygen or enzymes) or adding energy (heat, light, oxidizingenzymes) that leads the reaction (Aalhus and Dugan, 2004; Ahn et al., 2009). - 49 - Cooking process promotes lipid oxidation because denature the protein as consequence releases free iron that comes into contact with oxidative substances (PUFA). Free iron in the reduced state readily converts to its oxidized state, supporting the formation of free radicals. Furthermore, strongly heating the meat increases the oxidation process. Iron-catalysed oxidation is also promoted by salt. Added transition metals (through the addition of water and spices) can promote lipid peroxidation. Those metals promote the generation of free radicals from PUFA in a similar way like iron. Another important fact that promotes lipid oxidation is the light, especially the blue/purple fluorescent and ultraviolet lights. Light increases the energy state of oxygen and meat pigments, augmenting their oxidative capability. This is the reason why it is very important to choose the correct light to use for the duration of meat products storage in retail display. The presence of oxygen plays a fundamental role in the WOF formation. As a consequence every process like mincing, chopping, boning, mixing and tumbling, that enhance oxygen content in the meat get worse the problem (Ahn et al., 2009; Sun et al., 2011). There are several factors are promoter of lipid oxidation and WOF formation, but fortunately there are also numerous ways to prevent or to retard those inconveniences: (1) use raw material with elevate quality, for example fresh meat (short time to go through enzymatic oxidation); (2) use antioxidants that protect PUFA from self oxidation; (3) add vitamin E isomer (a-tocopherol) or carotenoids on animal’s diet; carotenoids should be used with prudence because they also affect the colour of the final product (used in poultry and salmon); (4) use several synthetic phenolic substances, including butylated hydroxyanisole (BHA), butylated hydroxytoluene (BHT), tertiary butylhydroxyquinone (TBHQ) and propyl gallate (PG); (5) use natural herbs and spices with antioxidant properties (rosemary, marjoram, sage, thyme, mace, allspice and clove); (6) use nitrite that presents metal chelation ability; (7) use histidine that contains carnosine and anserine able to reduce the oxidation process (metal chelation and free radical scavenging); (8) use chelating agents such as citric acid, ethylenediaminetetracetic acid (EDTA) and sodium tripolyphosphate, sodium pyrophosphate or sodium hexametaphosphate; (9) use on cured meat oxygen scavengers like ascorbic acid and erythorbic acid: (10) avoid the contact with oxygen using physical means like vacuum tumbling, vacuum stuffing and vacuum packaging or covering pre-cooked products with liquids or sauces; (11) use red-orange tungsten halogen lights for illumination or avoid the use of light (Aalhus and Dugan, 2004; Ahn et al., 2009). - 50 - CHAPTER 2 THE EXPERIMENTATION 2.1 Evaluation of the qualitative meat: analytical determination 2.1.1 Physical analyses 2.1.1.1 pH determination The Jeacocke (1977) procedure of iodoacetate method was adapted and utilized to determine pH on raw, marinated and cooked chicken meat (breast, thigh and wing). Figure 2.1 shows where the meat used to measure pH was sampled. Figure 2.1. pH measurements: blue indicates the area where the sample was collected. From each sample about 2.5 g of meat was collected, manually minced, and homogenized with ultra-turrax for 30 s in 25 mL of iodoacetate (5 mM) and potassium chloride (150 mM) solution. The pH was determined on the homogenate using a pH-meter calibrated at pH 4.0 and 7.0. 2.1.1.2 Colour measurements As previously mentioned in chapter 1, colour is a subjective parameter that depends on the different consumer perceptions, but it is possible to use an objective method to show this sensation, using three different criteria: Lightness (L*) demonstrates the expression of the colour lightness (dark or light); Hue (H*) describes the specifics primary colour as red, blue or green; Crome (C*) indicates how much the colour is bright or opaque (Wyszecki & Stiles, 1967). - 51 - The method that allows the possibility to express objectively the colour of items trough tristimulus values was ideated in 1931 by CIE (Commission Internationale de l'Eclairage). It defines colour of object using a combination of three parameters that represent the red (X), green (Y) and blue (Z). However, in order to reproduce the colour perception of the human’s eyes, in addition to the chromaticity (expressed by the criterions of Hue and Chroma), it is necessary to define the Lightness. For this reason, all the colour measurement objective systems derived from the X, Y, Z system has to include also the Lightness parameter. The first method that was proposed is the “Yxz System” (CIE, 1931), which was based on three parameters: Lightness (Y) and 2 chromaticity coordinates (x = X/X+Y+Z and y = Y/X+Y+Z). Although this system results in a great colour objective description, it is not easy to be represented because the graphics representations of the colour are not very well correlated with the human’s perception. This is the reason why in 1976 CIE ideated and performed a new system called CIELAB (Figure 2.2). Figure 2.2. CIE (L*, a*, b*) system utilized to measure the colour of meat products. L*=100 Whyte +a* red -a* green L*=0 black CIELAB defines the colour of an item as a combination of Lightness (L*) and 2 chromaticity coordinates (a* describes the colours from green to red, and b* defines the colour from blue to yellow). Using a* and b* parameters, it is possible to calculate Hue (H* = tan -1b*/a*) and Chroma (C* = √a*2+b*2). In general, CIELAB system is the most common method used for the objective description of meat and food colour (Barbut, 2002a; MacDougall, 1982). During experiments performed during this thesis, the samples colour profile (L* – lightness, a* – redness and b* – yellowness) was obtained using the CIE (1976) system through a reflectance colorimeter (Minolta Chroma Meter CR-400) with C illuminant source. Colorimeter was calibrated with a reference colour standard white (Y = 93.9, x = 0.3130, and y = 0.3190) ceramic tile. Table 2.1 describes the procedures used for - 52 - the measurement of colour in muscle and skin of chicken breast, thigh and wing on raw, marinated and cooked samples. Table 2.1. Procedures for the measurement of colour on raw, marinated and cooked meat and skin of chicken breast, thigh and wing. Sample Breast Wing Thigh Meat colour measurement Skin colour measurement (on surface) (on surface) It was performed on Pectoralis major It was carried out averaging 3 measuremuscle averaging 3 measurements. It was ments on selected skin areas that did not detected on a free colour defect areas, that present obvious colour defects. may have affected uniform colour. It was determined on the thicker portion of the skin where the axial feathers were fixed. It was performed on Ilio tiblialis muscle It was carried out averaging 3 measureaveraging 3 measurements. It was measured ments on selected skin areas that did not on homogeneous areas without obvious present obvious colour defects. colour defects. 2.1.1.3 Water holding capacity The water holding capacity of fresh and marinated meat was assessed by the use of the following methods: - Drip loss; - Expressible moisture; - Marinade uptake; - Purge loss; - Cooking loss and cook yield; - Water activity (Aw); - NMR relaxation measurements; - Freezable water (FW) 2.1.1.3.1 Drip loss Each fillet (Pectoralis major) or its sample (7 × 3 × 2 cm, about 50 g) was individually weighed and kept suspended over a plastic grid in a covered plastic box at 2-4°C. After 48 hours, fillets were cleaned for the excess of superficial juices, weighted again, and drip loss determined as percentage of weight lost by the sample during refrigerated storage period (Petracci and Baeza, 2011) according with the formula below: Drip Loss (%) = (initial weight - weight after storage) / (initial weight) × 100 - 53 - For the tight, a sample from Ilio tibialis muscle was obtained (6 × 3 × 1.5 cm, about 30 g) and drip loss was assessed by the same procedure described below. 2.1.1.3.2 Expressible moisture Expressible moisture was determined using a TA.HDi Heavy Duty texture analyzer (Stable Micro Systems Ltd., Godalming, Surrey, UK) according with the procedure described by Parks et al. (2000). Breast samples were cut into 1 cm cubes with homogeneous direction of the muscular fibres and positioned between 4 sheets of 12.5 cm Whatman #1 filter papers (2 on the top and 2 on the bottom of the sample) in order to absorb expressed moisture. The texture analyzer TA.HDi was equipped with a flat disc accessory presenting 12.5 cm diameter in order to squeeze the sample, applying a pressure of maximum 400 N for 15 s. The speed of compression was of 100 mm/min, using a 50 kg load cell. Samples normally achieved a highness reduction of 88%. The sample was weighted before and after compression, and the expressible moisture was expressed as a percentage of the net weight difference from the initial weight. Expressible moisture (%) = (initial weight - squeezed weight) / (initial weight) × 100 2.1.1.3.3 Marinade uptake The quantity of marinade solution that is able to be absorbed by the meat during the marinating process is called “marinade uptake”. It was determined on different kinds of chicken cuts or samples (derived from them) listed above: - whole breast fillet (Pectoralis major); - whole wing; - cylindrical sample of breast (4 cm of diameter × 1 cm of high; about 15 g); The marinade uptake was calculated considering the difference between raw and marinated sample weight: Marinade uptake = (marinated sample weight - raw meat weight) / (marinated sample weight) × 100 2.1.1.3.4 Purge loss Purge loss evaluation was determined on different kinds of chicken cut or sample after marination (derived from them) listed below: - 54 - - whole breast fillet (Pectoralis major); - whole wing; - cylindrical sample of breast (4 cm of diameter × 1 cm of high; about 15 g); - parallelepiped sample of breast (8.5 × 5.5 × 2.5 cm). The samples were placed on a plastic rack inside a covered metallic or plastic bowl and maintained for 24 h at 2-3°C to facilitate the diffusion and the balance of the absorbed marinade in the muscle of the sample. After this, samples were weighed again and the percentage of purge loss was calculated as below: Purge loss (%) = (marinated sample weight – sample after storage weight) / (marinated sample weight) × 100 2.1.1.3.5 Cooking loss and Cooking yield Cooking loss evaluation was performed on different kind of chicken cut or sample (derived from them) list below: - whole breast (Pectoralis major); - breast (P. major) ground patty (8.5 cm of diameter × 1.5 cm of high; 70 g); - cylindrical sample of breast (4 cm of diameter × 1 cm of high; about 15 g); - parallelepiped sample of tight (Ilio tibialis; 6 × 3 × 1.5 cm, about 30 g); - parallelepiped sample of breast (P. major; 7 × 3 × 2 cm, about 50 g). Samples were cooked through 2 different methods: 1) in thermostated (80°C) water bath, prior under vacuum packaging in polyethylene bags; 2) in convection oven at 180°C. Regardless of the method used, cooking has been modulated considering the relationship between time and temperature in order achieve 80°C at the sample core (Honikel, 1998). Cooked samples were then cooled to room temperature (in some case with the help of a cold water bath), weighted again and cooking loss was determined as percentage of weight loss, as showed below: Cooking loss (%) = (raw sample weight - cooked sample weight) / (raw sample weight) × 100 For marinated sample also the cooking yield was determined. The marinated breasts were cut to parallelepiped shape (8.5 × 5.5 × 2.5 cm), while the marinated wings were cut to separate and utilize the two terminal pieces (wingette or flat and wing tip). After that, the samples were weighted, positioned in plastic cooking bags, vacuum packaged and cooked - 55 - until to achieve 75-80°C at the sample core using a 80-85°C water bath. The cooking yield was expressed in percentage of cooked weight divided by raw weight. Calculation for percentage of cooking yield was as follows: Cook yield (%)= cooked weight/raw weight × 100 2.1.1.3.6 Water activity (Aw) The water activity (Aw) was evaluated by a water activity meter model, Aqualab (Decagon Devices Inc., Pullman, USA) using a 25 ± 1°C constant temperature. The Aqualab measure is based on the chilled-mirror dew-point technique. Aw was detected in triple using raw, marinated and cooked breast meat samples. 2.1.1.3.7 NMR relaxation measurements The proton transverse relaxation (T2) decays in marinated and cooked breast meat sample, were detected using 20 MHz of operating frequency by a Bruker (Milan, Italy) Minispec PC/20 spectrometer utilizing standard Carr-Purcell-Meiboon-Gill (CPMG) pulse sequence (Meiboom and Gill, 1958). Approximately 600 mg of meat breast sample were sited inside a 10 mm (external diameter) tube used for the NMR analysis. Samples inside the tubes looked like small cylinders with a height not superior than the active area of the radio frequency coil. During each measurement 30,000 points were detected, using a 80 μs of time between subsequent 180° pulses (TAO-spacing) and 3.5 s of a relaxation delay. Constant temperature of 24°C was used for all the NMR measurements. The CPMG decays were divided to the corresponding sample weight in order to obtain normalized values and transformed into relaxograms (i.e. continuous distributions of relaxation times) through the program UPEN (Borgia et al., 1998; Figure 2.3). The relaxogram obtained was interpreted in agreement with Bertram et al. (2002) and Bianchi et al. (2004) that had previously carried out NMR analysis respectively on pork and turkey meat. - 56 - Figure 2.3. Two typical transverse relaxation time spectra (T2) obtained on the raw (blue line) and cooked (red line) meat samples. To allow for a direct comparison among the treatments, the intensities are scaled so that the total area equals 100 (Petracci et al., 2012). 2.1.1.3.8 Freezable water (FW) The quantity of freezable water was determined in triple using raw, marinated and cooked breast meat samples by a Pyris 6 Differential scanning calorimeter (DSC; Perkin Elmer Corporation, Wellesley, USA). The DSC was provided with a low-temperature cooling unit Intacooler II (Perkin Elmer Corporation, Wellesley, USA). Temperature was calibrated using as standard ion exchanged distilled water (m.p. 0.0°C), indium (m.p. 156.60°C) and zinc (m.p. 419.47°C). In order to calibrate the heat flow, it was used the heat of fusion of indium (Δh = 28.71 J/g). During the calibration the identical heating rate utilized for sample measurements was used and a flux of dry nitrogen gas (20 mL/min) was applied. Approximately 20 mg of meat sample were weighted in 50 μL aluminium pans using a small spatula. Pan was hermetically sealed and moved to the DSC instrument at room temperature together with an identical empty pan used as a reference. Hereafter, the breast samples were cooled until -60°C, using 5°C/min of heating rate, then held for 1h at the final temperature of -60°C, scanned increasing the temperature until 20°C at 5°C/min of heating rate according with Brake and Fennema (1999). FW was determined as: FW = ΔHm / ΔHw Where ΔHw (325 J/g) is the latent heat of melting for gram of pure water at 0°C (Roos, 1986) and ΔHm (J/g) is the measure latent heat of melting of water for gram of sample, obtained by the integration of the melting endothermic peak. FW amount was expressed as gram per gram of fresh sample weight. - 57 - 2.1.1.4. Texture 2.1.1.4.1. Shear force Meat shear force was determined using two devices: Allo-Kramer (AK) and Warner Bratzler (WB). The samples subjected to shear force analysis were prepared according to the following procedures: - Breast (Pectoralis major) or its samples were cooked in thermostatic water bath (8085°C), prior under vacuum packaging in polyethylene bags, or in convection oven (180°C), until to obtain 75-80°C at the sample core. The cooked samples were then cooled to room temperature and cut to obtain from the breast cranial part a parallelepiped shape (approximately 4 × 2 × 1 cm for AK and approximately 2 × 2 × 5 cm for WB). The samples were obtained through a parallel muscle fibres direction cutting. - Tight samples (Ilio tibialis) were cooked in convection oven (180°C) until to obtain 75-80°C at the sample core. The cooked samples were then cooled to room temperature and cut in a parallelepiped shape (approximately 3 × 2 × 0.7 cm for AK). The samples were cut parallel with the muscle fibres direction. - Wing samples were cooked in thermostatic water bath (80-85°C), prior under vacuum packaging in polyethylene bags, until to obtain 75-80°C at the sample core. The cooked samples were then cooled to room temperature and a parallelepiped was cut in the middle part of the wing (wingette or flat; approximately 1.5 × 1.5 × 5 for WB), respecting the muscle fibres direction as previous mentioned for breast and tight. Allo-Kramer. Shear force was evaluated by a TA.HDi Heavy Duty texture analyzer (Stable Micro Systems Ltd., Godalming, Surrey, UK) provided with an Allo-Kramer shear cell with 10 blades, using the procedure described by Sams et al. (1990). Samples were cut, weighed, and sheared with the 10 blades at a perpendicular angle to the fibres using a 250 kg load cell at 500 mm/min of rate. Shear values is expressed as kilograms force per gram of sample (Figure 2.4). Warner–Bratzler. Parallelepiped samples were sheared in a perpendicular direction respective to the muscle fibres using a triangular blade slot (Lyon and Lyon, 1991) attached to two different tools (Figure 2.5): 1) Warner–Bratzler shear machine (Bodine Electric Company Chicago 60618, USA); and 2) TA.HDi Heavy Duty texture analyzer (Stable Micro Systems Ltd., Godalming, Surrey, UK). Shear values is represented by the kg peak force necessary to cut the samples. - 58 - Figure 2.4. Ten blades Allo-Kramer (AK) cell and breast sample used for the shear force determination. Figure 2.5. Warner Bratzler (WB) probe used for the shear force determination. 2.1.1.4.2. Texture Profile Analysis (TPA) TPA values were evaluated on the central part of the breast samples with cylindrical shape presenting 3 cm of diameter and 0.8 cm of height (Figure 2.5). Samples were packaged in polyethylene bags vacuum sealed and cooked trough thermostatic water bath (80°C) until to obtain 75-80°C at the sample core. After cooking samples were cooled to room temperature and cut with a cylindrical probe. Then samples were axially compressed (compression speed of 1 mm/s) using a cylindrical tools with 5 cm of diameter to 50% of their initial height in a double compression cycle (Figure 2.6). TA.HDi Heavy Duty texture analyzer (Stable Micro Systems Ltd., Godalming, Surrey, UK) equipped with a 50 kg load cell was used. - 59 - Figure 2.6. sample used for the evaluation of the Texture Profile Analysis. TPA was performed by double compression cycle, with the purpose to reproduce the chewing activity. For each sample, the TPA parameters (hardness, cohesiveness, springiness, gumminess and chewiness) was obtained by the elaboration of the double compression curve (force/deformation) represented in Figure 2.7 (De Campos et al., 2008; Lyon et al., 2010). Figure 2.7. TPA general curve. Hardness is defined as the force required to compress the food between the teeth (molar). It is the maximum detected force value of the highest peak (first compression) of the TPA curve. It is expressed in grams. Cohesiveness corresponding to the amalgamating strength that maintains bounded distinct food parts. It represents the deformation degree to which a food is compressed between the teeth (molar) from the second bite, prior rupture. It is calculated as the relation between the two positive areas (A2/A1 where A1 and A2 are respectively the first and the second compression areas) in a TPA curve. It is an adimensional parameter. Springiness is the ability of the sample, once deformed, to recover - 60 - to its initial non-deformed condition, after the force application. It is calculated dividing D2/D1 where D1 and D2 represent, respectively, the initial and the second compression distance. It is an adimensional parameter. Gumminess is definite as the force necessary to disintegrate a semisolid food until the condition that permits to swallow it. It is calculated multiplying hardness × cohesiveness. Chewiness indicates the force needed to disintegrate a solid food until the condition that permits to swallow it. It is calculated multiplying hardness × cohesiveness × springiness. 2.1.2. Chemical analyses 2.1.2.1. Moisture The moisture analysis was performed on raw, marinated and cooked meats. For each sample the moisture content was determined using 5 g of meat finely chopped and placed in aluminium or glass crucible, previously heated to stabilize the weight for 1 h at 103°C, and dried in conventional oven for 16 hours at 103°C. The percentage of moisture was determined calculating the weight difference between the sample before and after drying: Moisture (%) = (initial weight – dry weight)/(initial weight) 100 2.1.2.2. Total lipids Five grams of frozen samples were grounded and homogenized with ultra-turrax for 3 min at 6,575 g/rfc (21,500 rpm) with 200 mL of a chloroform:methanol solution (1:1, v/v) in a 500 mL glass bottle with screw-cap. The bottle was placed in oven at 60°C for 20 min before adding 100 mL chloroform. After 2 min of homogenization with ultra-turrax (6,575 g/rfc or 21,500 rpm) the sample homogenized was filtered by filter paper in order to remove the solid residue, consisting for the main part of proteins. Following, 0.1 L of 1 M solution of KCl were added and carefully mixed to the filtrate. Potassium chloride (solution at 0.88%) was added at the homogenate (ratio 1:5) and then samples were left overnight at 2-4°C in order to separate the 2 different phases. The lower phase containing the lipids (chloroform-lipid phase) was collected, deposited into a flask and dried using a rotary evaporator. The fat content was determined gravimetrically. The lipid extractions were carried out in double for each sample. - 61 - 2.1.2.3. Proteins Protein content was performed according to the procedure reported by Kjeldahl method (AOAC, 1990). This method is based on the determination of the total nitrogen content (including protein, amine, ammonia and urea nitrogen fractions) through three different phases: digestion of the sample, distillation and titration of liberated ammonia. To obtain the percentage of proteins it is necessary to multiply the total nitrogen value by a coefficient that considers the amino acid composition of the sample. The method has two phases described below: Digestion phase: 0.5 g of meat sample, finely grounded, was digested at 400/420°C for 3 h into a glass tube with the addition of half tablet of Kjeltabs (3.5 g of K 2SO4 and 3.5 mg of selenium) and 12 mL of solution containing 96 % sulfuric acid and 4 % ortho-phosphoric acid. Digestion was carried out under hood using a digester and the temperature was increased by steps of 15 min from 80 to 420°C. When the meat was completely digested the solution appeared clear. Distillation – Titration phases: these two phases were carried out using a “Büchi 339” distil-titrator unit (Figure 2.8). Digested samples were cooled at room temperature and then moved to the distil-titrator where their ammonia was distilled in a current of steam and titrated to quantify the total content of nitrogen. Distillation stage was performed adding 50 mL of distilled water and 65 mL of sodium hydroxide (solution with 30% of NaOH) in order to neutralize the effect of the acid solution used in the mineralization phase. Titration of distilled ammonia was performed using 0.2 N hydrochloric acid (HCl). Protein content was obtained multiplying the concentration of nitrogen by the conversion factor of 6.25 (calculated for meat and meat product) and expressed as a percentage. Figure 2.8. Büchi 339 unit used to distillate and titrate the sample for the total protein determination (Kjeldal). - 62 - 2.1.2.4. Ash The ash content was evaluated using 5 g of meat finely minced weighted into a porcelain capsule, resistant to high temperatures, previously stabilized in muffle furnace for 1 h at 525°C. Capsules with meat were placed and dried in conventional oven for 2 h at 102°C. After that, samples were moved to the muffle furnace and left there for 1 h at 200°C. Finally the temperature was increased until 525°C and the samples were left at this condition for 4 h, until they were completely burned and transformed in white ashes. The percentage of ash was obtained calculating the weight difference between the sample before and after burning: Ash content (%) = (ash weight)/(initial weight) 100 2.1.3.5 Fatty acid composition Approximately 20 mg of lipid were extract, then methylated using 200 μL of diazomethane according to Fieser and Fieser (1967). As internal standard, tridecanoic acid methyl ester was used and added (1.01 mg) to the methylated lipids. This blend was transmethylated adding 40 μL of 2 N KOH solution in methanol (European Commission, 2002), agitated for 1 min with vortex, left to rest for 5 min, and separated through centrifuging at 1,620 x g of speed for 5 min. Liquid supernatant was moved to a vial and then injected into a gas chromatograph equipped with a flame ionization detector (GCFID). The GC-FID instrument was a GC8000 serie (Fisons Instruments, Milan, Italy), it was working interfaced with an automatic self-sampler system. The data acquisition was performed using a computerized system (Chromcard Data System, ver. 2.3.1, Fisons Instruments). In order to separate the different fatty acid a RTX 2330 fused-silica column (105 m x 0.25 mm x 0.2 μm film thickness; Restek, Bellefonte, PA), coated with 90% biscyanopropyl- and 10% cyanopropylphenyl-polysiloxane was used. Oven temperature was set from 60°C to 240°C at a rate of 10°C/min; for the last 30 min the final oven temperature was maintained at 240°C. Both injector and detector temperatures were programmed at 250°C. As a carrier gas, helium was utilized, applied at steady pressure of 260 KPa. The split ratio used was 1:50. The determination of fatty acid composition was performed in double. In order to obtain the quantification of fatty acid a tridecanoic acid methyl ester was utilized as internal standard. The identification of the fatty acid peak was performed through comparison of the peak retention times with those of the GLC 463 FAME standard mixture. Using the GLC 463 FAME standard mixture and the internal standard (C13:0) the GC response factor of each fatty acid was calculated. The detection limit (LOD) of FAMEs - 63 - was 0.0035 mg, while the quantification limit (LOQ) was 0.011 mg. Limit of detection and quantification were estimated as a signal-to-noise ratios equivalent to 3:1 and 10:1 respectively. 2.1.2.6. Susceptibility to lipid oxidation 2.1.2.6.1 Thiobarbituric acid reactive substances (TBARs) analysis TBARs analysis was conducted in double on meat sampled from different chicken cuts (breast, thigh and wing) to evaluate the susceptibility of lipid oxidation. Two different methods were used: with (breast and wing meats) and without induction (breast and tigh meats). Induced TBARs analysis. According to Kornbrust and Mavis (1980), the susceptibility of iron-induced lipid oxidation of muscle tissue homogenate was determined. First, for each sample 1 g of meat was weighted and placed in a 50 mL falcon tube with 9 mL of 1.15 % KCl at 2-4°C, then the contents of the falcon tubes were homogenized using ultra-turrax homogenizer. Second, 100 µL of the homogenate were added to test tubes (6 for each sample one for each incubation time: 0, 30, 60, 90, and 150 min) with 500 µL of buffer solution Trimalate, 200 µL Ferrous sulfate, 200 µL Ascorbic acid. Followed, the tubes were covered with screw-cap, agitated with vortex and placed into a 37°C water-bath. Falcon tubes with the remaining homogenate were frozen and stored be further used in protein determination. Then at fixed time intervals (0, 30, 60, 90, and 150 min) tubes were added with 2 mL of TBA-TCA-HCl solution, agitated with vortex and boiled for 15 min, then they were cooled down in an ice-melting water bath. Finally tubes were centrifuged for 10 min at 3,000 rpm and the supernatant liquid was moved to 3 mL cuvettes and the 2thiobarbituric acid-reactive substances (TBARS) were determined through spectrophotometer reading (wavelength 535 nm). Inducted TBARS was expressed as nmoles malonaldehyde (MDA)/mg protein. The TBARS analysis were tested on fresh and frozen (stored for 12 and 90 days) breast and wing meats and calculated as: TBARs (nmol MDA/mg protein) = (6.4102 ×1000 ×A^535)/(100 ×Protein (mg/ml)) According to the Lowry procedure (Lowry et al., 1951) the meat protein content was determined. For each sample 20 µL of meat solution (1 g meat plus 9 mL of 1.15 % KCl) were placed into test tubes with 980 µL of distilled water, 0.1 mL of 1N NaOH and 5.0 mL of Reagent C (Alkaline solution of Sodium Carbonate and Copper Sulfate). The tubes were agitated with vortex, added with 0.5 mL Reagent D (diluted Folin-Ciocalteau - 64 - solution by 50% of distilled water). Finally tubes were covered with screw-caps left in the dark for 30 min, and then the absorbance was read by spectrophotometer (wave length of 740 nm). Content of protein (mg/mL) were calculated as: Equation value / 20 µL × 1000 µL = mg/mL TBARs analysis. Secondary lipid oxidation products were evaluated by using the TBARs method of Tarladgis et al. (1960). In brief, for each samples 2 g of breast or thigh meat were placed into a 25 mL Sovirel tube with the additions of 8 mL of pH 7 buffer solution (phosphate and distilled water) and this mixture was homogenized by UltraTurrax® T 25 BASIC (Ika-Werke, Staufen, Germany). After that 2 mL of trichloroacetic acid (watery solution of 30 % v/v) were added to the homogenate, homogenized again and filtered. Then 5 mL of 0.02 M thiobarbituric acid solution of were added to 5 mL of the sample solution previously prepared in capped tubes, which were left at 90°C for 20 min and then cooled down at 4°C for 30 min. Finally the tube was centrifuged, and the absorbance of the supernatant liquid was measured by UV spectrophotometer (Jasco model V-550, Jasco International, Tokyo, Japan) at 530 nm. For the quantitative determination of TBARs it was necessary to make a 1,1,3,3-tetramethoxypropane standard calibration curve (concentration range of 0.03-2.26 μg/mL). TBARs was expressed as mg of MDA/kg of sample. 2.1.2.6.2. Determination of Peroxide Value (PV) The values of peroxide were evaluated using a modified version of the procedure described by Shantha and Decker (1994). In a few words, 20 mg of lipids were extracted before to be mixed with 9.8 mL of choloform:methanol (2:1, v/v) and 50 μL of thiocyanate/Fe2+ solution and then agitated using vortex. Five min of rest was performed in order to stabilize the samples and then the absorbance was measured at 500 nm using a double beam UV-VIS spectrophotometer (Jasco model V-550, Jasco International, Tokyo, Japan). Peroxide values were determined utilizing a Fe (III) standard calibration curve with 0.1-5 μg/mL (y = 0.0311x - 0.0375; r2 = 0.998) of concentration range. Peroxide value (PV) was executed in double and expressed as meq O2/kg fat. 2.1.2.7. Collagen Collagen content was evaluated using the modified colorimetric method (Kolar, 1990). Samples were subjected to hydrolysis with sulfuric acid and oxidation with - 65 - chloramines-T with the formation of a purple-red compound with 4-dimethylamino benzaldehyde. Meat was finely minced and 4 g of sample were carefully weighed in a 250 mL flask. After that, 30 mL of sulfuric acid were added and the sample was heated in convention oven for 16 h at 105°C in order to permit the acid hydrolysis of proteins (digestion). Followed this first operation, the hydrolyzate was diluted with distilled water until 500 mL and filtered with a paper filter to avoid the presence of meat particle, that can compromise the accuracy of the spectrophotometric reading. Then, 5 mL of filtrated were moved to a volumetric flask and diluted again to 100 mL. After that, 2 mL of the final dilution were deposited into test tubes and 1mL of oxidizing solution (chloramine T) was added. Tubes were agitated by vortexing and left to rest for 20 min at room temperature. After oxidation, 1 mL of colorimetric reagent was added, tubes were covered with aluminum foil and heated in a 60°C water-bath for 15 min. Finally the absorbance was read with UV-visible spectrophotometer (Shimadzu model UV – 1601, Shimadzu Italia S.r.l., Milano, Italy; Figure 2.9) at 558 nm of wavelength (). The hydroxyproline content (HYP) was calculated with the following formula: HYP (%) = ( h 2.5 ) / ( m V) Where h = HYP in g/mL of filtrate, derived from calibration curve, m = sample weight in grams, and V = mL of filtrate for the 100 mL dilution. The percentage of collagen was calculated by multiplying the percentage of hydroxyproline by 8. Figure 2.9. UV-visible spectrophotometer (Shimadzu model UV-1601) used for the determination of collagen - 66 - 2.1.2.8. Sodium chloride According to the international method described by AOAC (1995) it was determined the sodium chloride content (salt). Each breast fillet (Pectoralis major) was finely minced and 10 g were weighted and used to determine sodium chloride content through duplicate volumetric method. Sodium chloride content is expressed as percentage. 2.1.3 Sensorial analysis Sensorial analysis were evaluated on breast meat (Pectoralis major) and leg meat (thigh and drumstick) trough Triangle test and Consumer test. Samples were vacuum packaged and stored at -24°C until the sensory evaluation days. 2.1.3.1 Thawing and preparation of samples Samples (breasts and thighs) were thawed in a refrigerator at 0-4°C for 48 h to allow the operations of preparation and cooking. After that, breast muscles (Pectoralis major) from each experimental group were trimmed, to remove the surplus of fatty and connective tissues. The legs meat were separated from skin and bones, and then finely minced using a professional meat mincer (Figure 2.10) with a grinder plate with 6 mm of diameter holes. Ground thigh meat was used for the formation of hamburger measuring 12.5 cm of diameter and 1 cm of thickness (80 ± 5 g). Figure 2.10. Professional meat mincer equipped with a 6 mm grinder plate. Breast fillets and leg hamburgers were cooked in 2 different batches to avoid that cooking could interfere on the sensory characteristics (flavour contaminations). The cooking was carried out without the addition of any type of seasoning in two different ways: 1) part of the fillets and legs were baked in oven at 180°C until 80°C at the sample - 67 - core; 2) part of the breast was packaged in plastic bags, vacuum sealed and cooked using 80°C water bath waiting the time needed to obtain 80°C at the product core. Cooked samples were left to cool at room temperature, then from each fillet a parallelepiped samples (1 × 2 × 1 cm) were cut by hand, while thigh hamburgers were divided by hand into 8 equal wedges. Both fillet and thigh samples were used for a sensory evaluation (triangle and consumer test) in a laboratory equipped for sensory analysis. Samples were stored until the time of evaluation into hermetic containers placed in a 55°C water bath, which is a suitable temperature for meat consumption. The product was served to the panel members without salt or spices, together with natural water (room temperature) and unsalted crackers. The judges assessed the samples in a definite red light illuminated worksite, in order to exclude evaluation mistakes caused by different meat colour or meat colour defects. 2.1.3.2. Description of the laboratory of sensory analysis The laboratory dedicated to sensory analysis is located in Cesena (Department of Agricultural and Food Sciences of University of Bologna). It consists in one room divided in two separate zones: a hidden area (1) from the judges’ view, where the samples are stored until the evaluating time, an area (2) where samples are administered to the judges site in a dedicated workstations. Preparation and cooking of the samples were carried out in another room separated from the laboratory dedicated to sensory analysis in order to avoid odours and scenarios that may influence the judges during the test. The area where the samples remain before assessment (area 1) is equipped like a domestic kitchen with sink, table, kitchen counter, refrigerator and dishwasher. The judges’ workstations (area 2) are separated from one another by wooden dividers, to avoid interferences between testers. Each workstation is equipped with counter-table, small sink and independent light system. It was possible to use three different neon lights: white, green, or red, which are the most indicated for assess meat product. 2.1.3.3 Triangle test The aim of this test was to identify organoleptic differences between samples from free range and conventional chickens, considering the commercial categories of rotisserie and cut-up carcass. To achieve this goal 4 different comparisons were made: 1) breast meat from rotisserie carcass: conventional vs free range; 2) breast meat from cut-up carcass: conventional vs free range; 3) leg hamburger from rotisserie carcass: conventional vs free range; 4) leg hamburger from cut-up carcass: conventional vs free range. - 68 - According to Meilgaard et al. (1999) the number of judges was evaluated considering the effect of the I and II type of error and the percentage of right answer from untrained assessors. Consequently, the minimum number of judges required to perform the test was calculated, which is 40 (Meilgaard et al., 1999). For our test, 42 untrained assessors were used. Each judge tested the samples assessing in sequence 4 dishes, containing each one 3 samples (two identical and one different) (Figure 2.11). Samples were arranged according to a randomized block design. Figure 2.11. Random arrangement of the samples (each dish can present 6 different combinations): squares and triangles mean breast meat and leg hamburger, respectively. F and C means respectively from free range and conventional production system. These samples were assessed by 42 untrained judges (students, PhD and fellow workers) recruited at the Department of Agricultural and Food Sciences of University of Bologna located in Cesena. Each of the 42 untrained panellists was instructed to identify the “different sample” divergent in flavour, or texture, or some other attributes. Besides other information as age, gender, and the habit to eat chicken were collected. 2.1.3.4 Consumer test Consumer test was conducted to evaluate the organoleptic characteristics of different products: (1) breast fillet and thigh hamburger from rotisserie carcass raised by free range production system vs breast fillet and thigh hamburger from rotisserie carcass raised by conventional production system; (2) breast marinated with essential oil of thyme and orange vs breast marinated without essential oil. Each of 54 untrained panellists was instructed to evaluate each sample of breast fillet and thigh hamburger for tenderness, juiciness, flavour, odour, rancidity and overall acceptability using a 5 or 4 step hedonistic scale (Table 2). The minimum number of untrained judges suitable for consumer test was 50 (Porretta, 2000). They (students, PhD and fellow workers) were recruited as the triangle - 69 - test, from the Department of Agricultural and Food Sciences of University of Bologna located in Cesena. Four different sessions were conducted (Figure 2.12): the first was for evaluate the different content of salt in breast meat (6 samples for 6 different level of salt from 0 to 2%); the second was for evaluate free range and conventional breast from cut-up and rotisserie carcass (four samples); the third was for evaluate free range and conventional thigh hamburger from cut-up and rotisserie carcass (four samples) and the last was for evaluate marinated breast with or without time and orange essential oils (2 samples). For each session, one dish containing the samples was evaluated by assessors from left to right according to the hedonistic scale reported in Table 2.2. Samples were arranged according to a randomized block design. Table 2.2. Consumer test descriptors. Descriptors Description Tenderness The tenderness perception during chewing Juiciness The juiciness perception during chewing Flavour The likeability of flavour Odour The likeability of odour (aroma) Rancidity Overall acceptability The rancidity perception as oxidation flavour defects The overall likeability of poultry meat Scale From 1 = very tough to 5 = very tender From 1 = extremely tough to 8 = extremely tender From 1 = very dry to 5 = very juicy From 1 = extremely dry to 8 = extremely juicy From 1 = dislike extremely to 5 = like extremely From 1 = dislike extremely to 5 = like extremely From 1 = no detectable rancidity to 4 = very high level of rancidity From 1 = dislike extremely to 5 = like extremely Figure 2.12. Random arrangement of the samples: squares and triangles mean respectively breast meat and leg hamburger. Numbers mean the % of salt. F and C means respectively from free range and conventional production system. A and B means respectively only marinated and marinated with time and orange essential oils. . - 70 - 2.2 Evaluation of qualitative traits of poultry meat 2.2.1 Meat quality characteristics, oxidative stability and sensorial traits of chicken meat obtained from two different production systems: free range vs conventional 2.2.1.1 Introduction The importance of food safety and the impact of the food on the people’s health have increased more and more in the last ten years, changing the general concept of food in developed countries. Poultry production systems have been affected by the preferences of customers, for example chickens farmed with organic products without using antibiotics or synthetic chemicals are considered with more attention. An increasing interest exists in the direction of animal-friendly production systems, that could improve animal welfare in addition to assurance elevated qualitative standards relating to food safety, nutritional, and sensory characteristics. This phenomenon is caused because of the rising demand of consumers who are more sensible to the ethical and cultural sides of meat products (Castellini et al., 2008; Cavani et al., 2009). Processing and marketing standards to obtain poultry meat using alternative production systems are defined by EC Regulation 1538/91, which involves the use of extensive indoor/barn-reared, free-range, traditional free-range and free-range, total freedom. Instead, organic poultry production was regulated since 1999 with the EC Regulation 1804/99. Two of the main reasons that have promoted this development are: 1) the increasing of the population life expectancy and consequently more attentions about disease prevention; 2) the great influence of the media on public opinion and on the rapport among diet and health, (Jimènez-Colmenero et al., 2001). Moreover to understand the consumer risk perception and its impact on acquiring behaviour is another important issue for the reciprocal advantage of both customers and food company (Yeung et al., 2001). A strong relationship between elevated consumption of meat and some diseases (like obesity, cardio-vascular and cancer) is perceived by consumers. This issue has guided to a decreasing of red meat eating (Schönfeldt et al., 2008). During the last few decades, the companies working with poultry have oriented their politic and production in order to satisfy the consumer demands. Fortunately, poultry meat presents nutritional characteristics that fit well the current consumer request for a low-fat and healthy meat products (Barroeta, 2007). Furthermore, consumers are asking for meat with high nutritional values and from animals farmed respecting animal welfare and fed with an appropriate dietary plains (Bou et al., 2009; Gibbs et al., 2010). The majority of poultry meat and meat products that arrive at the marketplace are obtained using birds farmed through intensive conditions. These birds are produced using - 71 - genotypes which have been selected to obtain a rapid growth and feed efficiency. In addition, these birds are farmed indoors in poultry houses outfitted with severe environmental control (intensity of lightness, photoperiod, temperature and humidity, etc.; Cavani et al., 2009). The last studies carried out on the alternative housing systems showed that the product quality could be affected by the using of different stocking densities, the higher locomotor activity in both indoor housing and open-air pens and by the use of different feed resources from vegetation in outdoor places (Castellini et al., 2008). The most affected macronutrients of the meat is the lipid fraction and it is well known that lipid peroxidation and lipid oxidation are two of the main factors decreasing the quality of food (Esterbauer, 1993; Kanner, 2007). They represent also the main causes of poultry meat quality deterioration, in particular they could impact the meat and meat products shelf life. Wood et al. (2008) showed that in muscle foods the lipid peroxidation began and propagate first in the cell membrane phospholipid fraction, as a consequence of the high content of polyunsaturated fatty acids. Raw poultry meat contains lower iron rate when compared with beef or pork meat and for this reason it presents less susceptibility to oxidation of lipid (Rhee et al., 1996). Nowadays, consumers are more and more conscious about animal wellbeing issue, consequently the demand of poultry meat obtained from free-ranged birds is considerably increased. The importance and consequences of farming systems and supplementary feeding on quality of poultry meat have been studied in numerous researches. Chen et al. (2013) did not found any effect on growth performance and yield traits due to the outdoor access, but they observed that it may improve meat quality. Moreover genotypes with very different growth rates farmed with or without outdoor access presented relevant meat quality differences (Fanatico et al., 2005). Furthermore, Fanatico et al. (2008) observed significant differences between slowgrowing and fast-growing genotypes and discovered important information regarding the potential and the effectiveness of the alternative poultry production systems. Another study evidenced that meat functional characteristics of fast and medium growing genotypes are more preferred for both company and customer (lower drip and cook losses and higher tenderness) if compared with slow growing breeds. In the other hand, slow growing meat is considered healthier (less fat and higher content of n-3 PUFA) by nutritional approach, consequently may better coincide with the organic products expectations of consumers (Sirri et al., 2011). Besides the use of slow growing breeds results in a longer farming age, that could affect meat tenderness and other sensory characteristics and as a consequence their customer acceptability (Fanatico et al., 2007; Petracci et al., 2011). According to Wang et al (2009), birds farmed according to alternative housing systems present lower carcass fat depots and a superior content of polyunsaturated fatty acids that improve the - 72 - nutritional value of meat, but increase its oxidative susceptibility. Generally, free range farming systems permit the production of meat with elevated content of unsaturated fatty acid, in particular n-6. In fact, Kralik et al. (2005) observed that chickens raised outdoor present a considerably higher fraction of α-linolenic acid, linoleic, arachidonic acid and total PUFA n-6 acids, when compared with chickens farmed only indoor. On the other hand, earlier researches have not evaluated product quality characteristics of broilers present on the market, comparing alternative and conventional poultry production systems, as nowadays sold in Italy. Regarding the alternative farming systems, free range is still the most used. Its products had the largest market share and they are usually sold in whole carcass variety (rotisserie type) or in cut-up (Magdelaine et al., 2008; Cavani et al., 2009). Consequently, the aim of this study was to evaluate and compare the meat and meat products quality traits, organoleptic characteristics and oxidative stability from free ranged and conventionally farmed chickens in the forms that they actually are commercialized in the Italian retail market. 2.2.1.2 Materials and methods The research was performed using two flocks of chickens raised by either conventional (C) or alternative (free-range, FR) production system and slaughtered under commercial conditions with the intention to obtain comparable rotisserie-type (around 1.2 kg) and cut-up (around 2.1 kg) carcasses correspondingly to females and males birds respectively (table 2.3). Table 2.3. Farming and slaughtering commercial conditions used to obtain a comparable Conventional and Free Range commercial type. Conventional Free Range Ross 708 Isa Genetic type Female Male 18 10 - - Slaughtering age (days) 39 50 56 70 Slaughtering weight (kg) 1,9 3,1 1,8 2,8 Slaughtering yield (%) 65 71 62 68 1.2-1.3 2.2-2.3 1.1-1.2 1.9-2.0 Rotisserie Cut-up Rotisserie Cut-up Gender 2 Stock Density (birds/m ) Outdoor access (days) Carcass weight (kg) Commercial type Female Male 13 7 From 28 to 56 From 28 to 70 Male and female chickens of the conventional group were a fast-growing hybrid type (Ross 708), They were separately farmed applying controlled environmental conditions and using the same poultry house without the possibility to accede to the open - 73 - air runs. Birds diet was based on wheat and soybean, and changed according to the age of the chickens. Females were farmed until 39 days of age, necessary to obtain 1.9 kg of live weight and 1.2-1.3 kg rotisserie type carcasses. Whereas males were raised up until 50 days of age necessary to achieve 3.1 kg of live weight and produce 2.2-2.3 kg carcasses suitable for cut-up products. Male and female chickens belonging to the free-range stock were a mediumgrowing genetic type (Isa) and they were farmed following the EC Regulation 1538/91. Free range chicken were housed in the same condition of conventional chickens until 28 days of age. Moreover, they had a permanent outdoor access during the daylight time, and their stocking density inside the poultry house did not exceed 27.5 kg/sqm. The open air runs were covered for the large part by grass and vegetation and each bird had available 1 square meter for walk, play and do functional exercise. Free range chickens diet was based on corn and soybean and differed according to the age of the chickens. Females were raised until 56 days of age, that represents the minimum slaughter age requested by the EC Regulation 1538/91. In this time 1.8 kg of live weight was obtained, enough to produce 1.11.2 kg of rotisserie type carcasses. Whereas males were farmed for 70 days until obtain a 3.1 kg live weight, necessary to yield 1.9-2.0 kg carcasses, which used for cut-up products. Birds were fasted for 8-12 hours, including also 2-3 hours of lain age time at the slaughter house before be processed. After that, the chickens were slaughtered under commercial conditions using an electrical stunning system (120 V, 200 Hz) and cooled. After cooling, 12 carcasses for group were randomly selected and cut in order to obtain breast (Pectoralis major) and leg meat (thigh and drumstick) to be used for sensorial analysis (triangle and consumer test), before be vacuum packaged and stored at -24°C. In addition, other 20 rotisserie and 20 cut-up carcasses for each group were randomly selected and carcass yields were determined following the procedure reported by WPSA (1984) using the following formula: Carcass parts yield = (carcass part weight /carcass weight) × 100 Carcasses were also cut-up in order to obtain the main commercial parts (breast, thigh, drumstick, wing and frame (carcass without breast, wings, and legs; Fig. 2.13). In addition, 12 carcasses of each group (4) were utilized to evaluate quality characteristics and the susceptibility to oxidation of lipid of fillet and leg meat. The right Pectoralis major and Ilio tibilialis muscles were selected from each carcass and used to evaluate both skin and meat colour (CIELAB), ultimate pH, drip loss, cooking loss and shear force (Allo-Kramer). Whereas the corresponding left skinless fillets (Pectoralis major) and deboned thigh muscles (with skin and without the right Ilio tibialis) were minced, packed in plastic bags, - 74 - vacuum sealed, covered by aluminium foil, stored at –18°C and used to evaluate moisture, protein, lipid, ash and collagen contents, as well as fatty acid composition, peroxide value and TBARs. Analytical determination are summarized in table 2.4. Figure 2.13. Carcass Parts Table 2.4. Analytical determinations to evaluate the meat quality traits Analytical Determinations Paragraph of material and methods pH Paragraph 2.1.2.1 Colour Paragraph 2.1.2.2 Drip loss Paragraph 2.1.2.3.1 Cooking loss Paragraph 2.1.2.3.4 Shear force Paragraph 2.1.2.4.1 Moisture Paragraph 2.1.3.1 Total lipids Paragraph2.1.3.2 Proteins Paragraph 2.1.3.3 Ash Paragraph2.1.3.4 Fatty acid composition Paragraph 2.1.3.5 Thiobarbituric acid reactive substances (TBARs) analysis Paragraph 2.1.3.6.1 Determination of Peroxide Value (PV) Paragraph 2.1.3.6.2 Collagen Paragraph 2.1.3.7 Consumer test Paragraph 2.1.4.4 Triangle test Paragraph 2.1.4.3 2.2.1.3 Statistical analysis In order to test the production system effect (conventional vs. free-range) on carcass and meat quality traits within each market class (rotisserie and cut-up), the data collected were submitted to one-way-analysis of variance ANOVA (GLM/PASW procedure). Tukey’s test was used to test the overall differences between rearing means. It was - 75 - performed at 95% of confidence level and considered to be significant when P<0.05 (PASW Statistics, 17). Data collected from triangle test were analyzed according to the Roessler et al. (1978) method, that reports how to determine statistical significance based on the number of right answers. Data from consumer test were processed using χ² test. In case the value of the frequency was less than 5, the Fisher's exact test was used (Fleiss, 2003). 2.2.1.4 Results and discussion Carcass Parts Yield. The main differences are due to the different genotype background used for conventional (Ross 708) and free range (ISA) systems (Table 2.5). Free range rotisserie carcasses presented a remarkable lower proportion of breast (31.3 vs. 37.4%; P<0.01), as a consequence they showed higher yield of the other parts as legs (31.6 vs. 28.3%; P<0.01) and their parts (thighs and drumstick), wings (12.0 vs. 10.5%; P<0.01) and frame (25.1 vs. 23.8%; P<0.01). These notable differences were also confirmed in cut-up carcasses, with the exception of the drumstick proportion, that was higher than thigh in both production systems. In general, these results are in agreement with earlier studies that evaluated different genotypes (Fanatico et al., 2005; 2008; Wang et al., 2009; Sirri et al., 2011). Fanatico et al. (2008) observed that also production system (outdoor vs. indoor) promote the increasing of leg yield in both fast- and slow-growing chickens due to their superior activity when outdoor accesses are provided. Table 2.5. Carcass (rotisserie and cut-up) parts yield of chickens raised using conventional (C) and free range (FR) production systems (mean ± SEM) 1 with bone and skin; 2without bone and skin; A-B = P < 0.01; a-b = P < 0.05. Meat Quality. Tables 2.6 and 2.7 show the colour values of skin and meat. Colour represents characteristics of meat-product-appearance. As a consequence, it is an important parameter that can influence the customer’s choice of purchase (Fletcher, 2002). Obviously, the colour of skin is more important for the marketing of whole carcasses or skin-on parts (e.g. wings and legs). - 76 - The greatest differences were observed in yellow index (b*), which is noticeably higher in breast and thigh skin of both free range market classes. This evident dissimilarity is the consequence of different diets, that were characterize with a diverse carotenoids content. In fact, free ranged chicken were fed with a corn-based diet, with the purpose to obtain a marked golden skin, that contributes to discriminate free range products conferring a traditional appearance. On the other hand, conventional chickens were supplied with wheat-based diet, that confers to their skin a white colour that is more typical for the conventional production, even if in Italy some consumers prefer anyway yellow skin colour. Previous studies showed that the increase of skin yellowness can be also caused by the eating of vegetation that cover the outdoor spaces (Fanatico et al., 2007). Another important result is represented by the yellow index of both free range breast and thigh meat, which was also surprisingly higher. This fact is in agreement with Bianchi et al. (2007) who observed that the yellowness of the skin and breast meat are strongly related with each other. It may be supposed that feeding carotenoid pigments are deposited in both skin (epidermis and subcutaneous fat) and meat (in muscle intramuscular and intracellular lipids). This means that colour of fresh poultry meat could affect the consumer selection as well as the skin colour. In fact, this remarkable dissimilarity may highly promote the differentiation of free range products when marketed as whole carcass and skin-on parts, but also as skinless raw meat. This also demonstrates that diet composition and feeding nutritional profile are the most important external (non-genetic) factor that influence the animal commercial production (Zhao et al., 2012). Lightness (L*) and redness (a*) showed only slightly difference with a little practical importance. In general, free range chicken presented darker meat, except the cutup breast meat that did not show any difference between groups. Meat redness was significantly different only in breast meat, where it was higher in conventional products. Tables 2.5 and 2.6 report also the meat quality traits. Regarding the rotisserie carcasses, ultimate pH values were significantly higher in both breast and thigh meat from free ranged birds. It could be possible that these results depends to the thermogenesis for the energy expenditure (ATP metabolism), which is over-regulated in order to promote heat production to maintain the body temperature (Silva, 2006). In fact, free range chickens that are farmed outdoor are exposed to cool temperatures, and as a consequence they present a lower available post mortem ATP, resulting in a reduction in both pH and drip loss values (Schneider et al., 2012). Ultimate pH can be an important selection condition to improve meat quality traits, as well genetic selection, because ultimate pH value could be robustly related to colour, water holding capacity and texture of the meat (Le Bihan-Duval et al., 2008). - 77 - On the contrary, breast meat obtained from cut-up carcass presented an opposite trend of ultimate pH, and no differences of pH values were detected in thigh meat. This different behaviour may be depending to the dissimilar chicken gender and slaughtering age. An earlier research reported that conventional light birds (1.2 kg rotisserie carcass type) presented lower values of pH in breast meat when compared with both medium and heavy birds (respectively 1.6 and 2.4 kg; Bianchi et al., 2007). In addition, Berri et al. (2007) found that male birds with rapid growth genotype, selected to obtain a high breast meat yield, when processed at older age, they were inclined to produce meat with a higher ultimate pH. However, it is demonstrated that ultimate pH trend differences are strongly correlated with different water-holding capacity behaviours (Petracci et al., 2004). Despite these contradictory pH results, in general meats obtained from free ranged chickens showed significant inferior drip and cooking losses values. Consequently, the disparity of water holding capacities cannot be totally clarified by pH differences, but maybe caused because the different muscle characteristics. In fact, conventional products of both market classes were obtained using a fast-growing genotype, which is well-known to present muscle hypertrophy and high fiber diameter. Berri et al. (2007) have been studied the effect of muscle hypertrophy on Pectoralis major muscle and breast meat quality characteristics of broiler chickens. They observed a significant effect of gender for the majority on traits under evaluation. For that reason, it may be useful to evaluate the effect of improved dimension of tissue fibre diameter on muscle and meat characteristics muscles with comparable weights, when male and female birds are compared. The higher diameter of muscle fibre in females was connected with an increasing of plasma creatine kinase activity. As a consequence, it could be suggested that plasma creatine kinase activity may be correlated also to the protein turn-over, depending of the muscle growth rate. Besides, conventional broilers were processed younger and this could be related with a thinner and less cross-linked collagen layer (McCormick, 1999; An et al., 2010). These elements together may be the reason why conventional breast and thigh meat showed lower WHC. Even though, no significant differences were observed in shear force values (Allo-Kramer) determined in breast meat, free range thigh meat presented higher shear force in both rotisserie (2.54 vs. 1.89 kg/g; P<0.01) and cut-up carcasses (3.08 vs. 2.18 kg/g; P<0.01). These results are in according with the higher collagen content of both marked class carcasses (Table 2.8), which can be a consequence of the older slaughtering age that influences the thicker collagen layers, in particular at the perymisium level (An et al., 2010). - 78 - Table 2.6. Breast: skin and meat colour (L*a*b*) and quality characteristics of meat (Pectoralis major muscle) obtained from rotisserie and cut-up carcasses slaughtered from chickens raised under conventional (C) and alternative (free range; FR) production systems (mean ± SEM). Each value is the average of twelve replicates. L* = lightness; a* = redness; b* = yellowness. = P < 0.01; a-b = P < 0.05; ns= not significant A-B Table 2.7. Leg: skin and meat colour (L*a*b*) and quality characteristics of legs meat (Ilio tybialis muscle) obtained from rotisserie and cut-up carcasses slaughtered from chickens raised under conventional (C) and alternative (free range; FR) production systems (mean ± SEM). Each value is the average of twelve replicates. L* = lightness; a* = redness; b* = yellowness. A-B = P < 0.01; a-b = P < 0.05; ns= not significant Chemical Composition. Tables 2.8 and 2.9 report the breast meat (skin-off) and leg meat (skin-on) chemical composition (moisture, protein, lipid and ash) as affected by the farming systems. In both market classes (rotisserie and cut-up), conventional breast meat presented a significant more elevated content of lipid and moisture. Additionally, conventional cut-up carcasses showed a lower protein percentage. In contrast, the production system did not significantly affect chemical composition of leg meat, with the exception of the protein fraction which is more elevated in cut-up carcasses yielded from free range broilers. Wang et al. (2009) demonstrated that the water, protein, and fat contents of chicken muscle were not influenced (P > 0.05) by the free range production system, although this farming system reduced the amount of abdominal fat. Moreover, in another study it was observed that the percentage in breast muscle of dry matter, fat and ash were not affected (P > 0.05) by broilers genetics or outdoor access, as a prove that free range production system did not substantially affect the lipid content of breast meat (Fanatico et al., 2005). Previous researches reported that free range production system can promote higher energy consumption, improving lipogenesis and increasing locomotor activity that permits - 79 - to obtain carcass with less abdominal fat (Castellini et al., 2002; Wang et al., 2009). This fact could be explained taking into consideration that neutral lipids (triacylglycerol), for the large part formed with saturated and monounsaturated fatty acids, are located in intramuscular adipocytes (adipose tissue) of perimysium (Sanosaka et al., 2008). Pectoralis major meat presents more phospholipids than leg meat, which contains for the large part triacylglycerol lipids (Gonzalez-Esquerra et al., 2001). Nevertheless, literature reports a large discrepancy of results regarding to intramuscular lipid content of breast muscles. This may be ascribed to both sampling and analytical procedures used (Cortinas et al., 2004). The fat content of breast meat found in the present research is in agreement with Barroeta (2007) and Du et al. (2002). Besides, the data of the present study agree with recent researches that demonstrate how free range farming system can decrease muscle lipids content (Chen et al., 2013; Fanatico et al., 2007; Bogosavljevic-Boskovic et al., 2010). Table 2.8. Chemical composition and oxidative stability of breast meat (Pectoralis major muscle) obtained from rotisserie and cut-up carcasses slaughtered from chickens raised under conventional (C) and alternative (free range; FR) production systems (mean ± SEM). Each value is the average of twelve replicates. = P < 0.01; a-b = P < 0.05; ns = not significant A-B Table 2.9. Leg: chemical composition and oxidative stability of leg meat with skin obtained from rotisserie and cut-up carcasses slaughtered from chickens raised under conventional (C) and alternative (free range; FR) production systems (mean ± SEM). Each value is the average of twelve replicates. a-b = P < 0.05; ns = not significant Composition of Fatty Acid. The effects of farming system on the percentage of fatty acid composition of breast and thigh meat chicken are showed in Tables 2.10 and 2.11. Oleic - 80 - acid was the principal fatty acid presented in both rotisserie and cut-up breast meats, (~2628% and ~27-32% of total fatty acids). Linoleic acid was the second (~23-25% and ~2629%), pursued by palmitic (~20-23% and ~19-24%), and stearic acids (~9% and ~7-9%). The fatty acids proportion of leg meat from rotisserie and cut-up carcasses presented the same trend of the breast meat, but with different internal percentages. In fact, also in this case oleic acid is still the main fatty acid (~35-37% and ~34-35% of total FA) tagged along by linoleic (~26-30% and ~28-30%), palmitic (~18-21% and ~19-21%), and stearic acids (~6% and ~5-6%). Within long-chain polyunsaturated fatty acids (PUFA), arachidonic acid was the most profuse in rotisserie and cut-up breast meat (~5-7% and ~2-5% of total fatty acids) pursued by linolenic (~1-2% and ~2-3%) and docosahexaenoic (DHA) acids (< ~1%, in both categories). In contrast, leg meat showed different PUFA composition when compared with breast because the main long-chain polyunsaturated fatty acid was linolenic acid (~2-3% of total fatty acids), trailed by arachidonic (< ~1%) and docosahexaenoic (DHA) acids (~0.06%) in both categories (rotisserie and cut-up). Moreover, in breast meat, PUFA was the most abundant fatty acids fraction (~37-38% in both market classes), while saturated fatty acids (SFA) portion was ~30-33% and ~27-33%, and monounsaturated fatty acids (MUFA) percentages were ~30-33% and ~30-36% of total fatty acids in rotisserie and cut-up, respectively. In contrast, the most abundant category of fatty acids in thigh meat were MUFA (~40-42% and ~39-40% of total fatty acids, in rotisserie and cut-up, respectively), followed by PUFA (~30-34%) and SFA (~25-30%). Free-range method showed a more saturated fatty acid profile when compared with the conventional one (with the exception of the cut-up thigh meat; tables 2.9 and 2.10). This could be explained through the consequence of the higher content of palmitic acid. Alternatively, the higher content of oleic acid was the reason why breast and thigh meat obtained by carcasses yielded from conventional farmed chickens showed the higher MUFA percentage. Conventional and free range production systems influence in different ways breast and leg fatty acids composition in rotisserie and cut-up carcasses type in spite of the nature of the samples that produced an elevated data variability. In line with Ponte et al. (2008a), the fatty acids most present were oleic, palmitic, linoleic and linolenic acids, of which oleic fatty acid percentage was the highest and it was not affected (P>0.05) by the production system. Similar results were also reported by Givens et al. (2011). The statistical analysis of the single fatty acids contents (tables 2.9 and 2.10) reported that palmitic, arachidonic and DHA acids were significantly more elevated in free range than in conventional rearing system in both market classes of breast meat. Conventional production system caused a significantly higher quantity of linoleic and linolenic acids in breast meat from rotisserie carcasses, whereas the breast meat from cut-up carcasses presented significantly more elevated percentage of palmitoleic, stearic, oleic, linoleic and linolenic - 81 - acids. Free range production system presented significantly higher quantity of palmitic, arachidonic and DHA acids in breast meat sampled from cut-up carcasses. In thigh meat, the main proportion of fatty acids were MUFA followed by PUFA and SFA. While in breast meat the main percentage of fatty acids was PUFA which is typical of phospholipids as pointed out also by Ponte et al. (2008b). The composition of fatty acids significantly affected by the production system was found on leg meat (rotisserie category), as the quantity of palmitic, palmitoleic, stearic, oleic and arachidonic acids was higher in free ranged chickens, whereas the linoleic and linolenic acids were more presented in conventional leg samples. It may be interesting to observe that the conventional production system presented significant (P <0.05) higher level of linoleic and linolenic acids in breast and thigh meat than the free range one. In addition also n-3 PUFA fatty acids content was more elevated in leg meat obtained from broilers farmed by conventional system. However, leg meat obtained from the cut-up carcasses yielded from broilers raised by free range production system presented a significantly higher level of myristic and arachidonic acids, while conventional leg meat showed higher concentration of linolenic acid. A higher percentage of PUFA in breast meat when compared with the leg was also observed by Cortinas et al. (2004). These discrepancies may be attributed to the different function of fatty acids in these tissues and/or to the different percentage of phospholipids (Hulan et al., 1988; Ratnayake et al., 1989). In another study, performed in n-3-PUFAenriched chicken meat (skinless breast and thigh meat), it was assessed the fatty acids distribution among triacylglycerol (TAG) and phospholipid (PL) categories, discovering that linolenic acid was more deposited in the TAG portion (Betti et al., 2009a). Moreover the same authors (Betti et al., 2009a) were in agreement with the result of the present study, where the main PUFA n-3 is linolenic acid. The study of Gonzalez-Esquerra et al. (2001) demonstrated that linolenic acid is not stored in phospholipids membranes of chicken Pectoralis major. Fatty acids classes data, processed with statistical analysis, revealed that SFA, n-6/n-3, SFA/PUFA and Δdesaturase index showed higher values in free range production system, when compared with the conventional one in breast meat sampled from both carcass types. On the contrary, MUFA and UFA/SFA ratio presented more elevated values in breast meat obtained from both carcass types farmed using the conventional system. The production system influenced also the fatty acids composition of breast meat yielded from the cut-up carcasses; in fact, the conventional system promoted an inferior (P <0.05) content of SFA, mainly caused by the elevated content of palmitic acid, and the superior amount of MUFA when compared to those observed in meat from free range chickens. Leg meat obtained from rotisserie carcasses showed higher SFA, MUFA, n-6/n-3, SFA/PUFA and Δ-desaturase index in free range chickens and only UFA/SFA ratio was more elevated in the conventional chickens. - 82 - Meat sampled from legs of cut-up carcasses presented a significantly higher n-6/n-3, SFA/PUFA and Δ-desaturase index when produced by free range system, but the concentration of PUFA n-3 was higher in leg meat obtained through conventional system. Breast and leg PUFA n-6/n-3 ratios ranged from 8.7 to 10.2 and 9.7 to 12.7, respectively. Both of them are visibly higher than the recommended ratio (n-6/n-3 ratio < 4) for a healthy human diet, which is important especially because n-6/n-3 ratio reduces the risk (in both primary and secondary prevention) of coronary heart disease (Simopoulos, 2008). Δ-desaturase index, calculated as (C20:2 n-6 + C20:4 n-6 + C20:5 n-3 + C22:5 n-3 + C22:6 n-3/C18:2 n-6 + C18:3 n-3 + C20:2 n-6 + C20:4 n-6 + C20:5 n-3 + C22:5 n-3 + C22:6 n-3)*100, is important for the determination of both Δ 5 and Δ6-desaturases activity. Those enzymes promote a reaction that is the responsible for the formation of PUFA n-6 and n-3. The Δ-desaturase index of breast meat ranged from 22.5 to 28.9% in the rotisserie carcass type and from 11.4 to 23.0% in the cut-up one. It means that the enzymatic activity was more developed in breast meat than in leg meat, where the Δ-desaturase index varied from 3.6 to 4.5% and from 3.6 to 4.7% in the rotisserie and cutup carcasses, respectively. In this study Δ-desaturase activity percentage in leg meat appears 3-6 times lower in respect of breast meat. This phenomenon is possible because the linolenic acid restrains the bioconversion of arachidonic acid from linoleic acid (Garg et al., 1988). Another study showed a dramatic decrease of Δ 5-desaturases activity in poultry meat of birds fed with a flaxseed integrated diet (Betti et al., 2009a). Fatty acid composition of meat from conventional carcass type was different when compared to the free-range one. This dissimilarity can be attributed to numerous factors: 1) free-range and conventional broilers were fed with two different diets containing different portion of the principal ingredients. Furthermore, broilers farmed using the free-range system had access to outdoor spaces, where they may possibly have consumed grass, insects and worms. This aspect may partially elucidate some dissimilarities among the higher percentage of PUFA (like arachidonic acid) and more Δ-desaturase activity in meat obtained using free range production system, particularly in breast. Besides, linoleic and linolenic acids are essential fatty acids, that are not only absorbed, but also elongated and desaturated to create long-chain PUFA n-6 and n-3 (such as arachidonic and docosahexaenoic acids). - 83 - Table 2.10. Fatty acid composition (as % of total fatty acids) of breast meat of breast meat (Pectoralis major muscle) obtained from rotisserie and cut-up carcasses slaughtered from chickens raised under conventional (C) and alternative (free range; FR) production systems. Each value is the average of twelve replicates. a-b = P < 0.05; ns = not significant Table 2.11. Fatty acid composition (as % of total fatty acids) of leg meat of breast meat (Pectoralis major muscle) obtained from rotisserie and cut-up carcasses slaughtered from chickens raised under conventional (C) and alternative (free range; FR) production systems. Each value is the average of twelve replicates. a-b = P < 0.05; ns = not significant Lipid Oxidation. The effects of the production system on the peroxide value and thiobarbituric acid reactive substances (TBARs) of breast and leg meats are showed in Tables 2.8 and 2.9. Overall, the lipid oxidation level determined in all samples was not elevated and it was demonstrated by both parameters of primary and secondary oxidation products; our results agree with those described in literature (Betti et al., 2009b; Barroeta, 2007). In effect, in both breast and leg meats a low peroxide values was observed (0.79-1.06 and 0.30-1.29 meq O2/kg of lipids, respectively), regardless of the carcass type. Also TBARs values were not elevated in both breast (0.06-0.19 MDA/kg of sample) and leg (0.10-0.13 mg MDA/kg of sample) meats, irrespective of the carcass type (rotisserie or cut up). The oxidation parameters studied in the present study are strongly lower than the peroxide value level (20 meq O2/kg lipids) ascribed at the hint of oil rancidity and inferior to the TBARs level (1 mg MDA/kg of sample) attributed to the hint of rancidity in lamb meat (Ripoll et al., 2011). In rotisserie and cut-up carcass types, only the breast meat obtained with free range production system presented a significant more elevated TBARs level. In contrast, the conventional production system caused the increasing of peroxide value exclusively in leg meat sampled from rotisserie carcasses. In the cut-up carcass type, no significant differences due to farming system on the oxidative stability of thigh meat were found. Even - 84 - though, it is generally expected that chickens produced with conventional system are more stressed than their free ranged counterpart, samples from both categories of farming systems presented an excellent and comparable oxidative stability. Some previous studies reported that TBARs values are significantly influenced by the dietary polyunsaturation levels (Cortinas et al., 2005). Castellini et al. (2002) observed that organic chickens produce meat with great quantity of malondialdehyde even if better raising conditions enhance locomotor activity, promote the development of the muscle mass, decrease the level of undercutaneus-fat, increase animal’s activity and decrease the susceptibility to stressors. Thus, the oxidative status of organic birds may be also influenced by the strong locomotor activity as well as the increasing of free radical production as a consequence of the increasing of muscle oxidative metabolism. Another study showed higher TBARs content in Ross broilers when compared with the Kabir ones, because broilers with Ross genotype were generally more inactive and preferred to stay more time indoors then outdoors, without fully exploit the open air runs (Castellini et al., 2006). Sensory analysis. In triangle test, meat obtained from both rotisserie and cut up carcasses from broiler farmed with conventional and free range system were properly identified by untrained panellists in agreement with their organoleptic characteristics (P<0.05), with only the exclusion of breast meat obtained from cut-up carcasses (Figure 2.14). Thus, triangle test proved that free range products presented particular organoleptic characteristics that make it recognizable when compared with the conventional ones. Figure 2.14. Triangle Test on breast and leg meats obtained from rotisserie and cut up carcasses type (conventional vs free range production system). (all responses = 42; ** = P<0.01; * = P<0.05; NS = not significant) In contrast, consumer test panellists (Table 2.12) did not found any significant differences in organoleptic descriptors (tenderness, juiciness, flavour and overall acceptability) with the exception of breast meat that was assessed with higher score of - 85 - overall acceptability in free range rotisserie type carcasses. It should be considered that contemporary consumers are more used to eat conventional chicken meat and then prefer this kind of flavour which is not very tasty, which could partially explain the difficulty in the perception of characteristic flavours of meat produced using alternative farming system. Table 2.12. Consumer test evaluating tenderness, juiciness, flavor and overall acceptability on breast and leg meats obtained from rotisserie and cut up carcasses type (conventional vs free range production system). (all responses = 54; *** = P<0.001; * = P<0.05; ns = not significant) This can also elucidate why the consumer test did not give any distinctions in individual sensory descriptors, although the untrained panel was capable to differentiate free range sample products from conventional ones as observed in triangle test. In previous study, Owens et al. (2006) observed that untrained assessors were not able to find any particular sensory differences (appearance, texture and flavour) between meats obtained from broilers raised by conventional and alternative production systems. On the contrary, same authors found that by using trained assessors it was possible to detect some texture and flavour differences between meat products obtained using different production systems. Previous researches did not report any significant differences in meat flavor (Jahan et al., 2004; Fanatico et al., 2007) and tenderness (Fanatico et al., 2007) of free-range and conventional products, but Fanatico et al. (2007) observed that conventional chicken meat was juicier. Furthermore, the study of Lawlor et al. (2003) reported that customers have a preference for breast meat and leg hamburgers from broilers farmed with the conventional system. In agreement with numerous previous researches, it is possible to remark that the dissimilarities in sensory characteristics are not firmly ascribable to the farming system (for example conventional vs. free-range), but also to several other factors as genotype, gender, diet and slaughtering age of the birds. - 86 - 2.2.1.5 Conclusions In conclusion, free range products, when compared with conventional ones had very different appearance, because of the different conformation (more elevated portion of leg and wing meat at disadvantage of breast) and the yellower (> b*) colour of skin and meat, in addition to their notable higher capacity to hold water during refrigerated storage and cooking operation. Moreover, leg meat presented lower tenderness according to a superior percentage of collagen. This study demonstrated that commercialized free range products present some extrinsic characteristics, which are able to differentiate it when compared with conventional ones. Those peculiarities could be well identified by both sellers and customers, allowing the possibility to achieve several market segments (large scale retailers, small butcheries, food store, catering, etc.). This research also confirmed that free range production system can modify the quality of traits and fatty acids composition (more elevated PUFA n-6-/n-3 ratio) of chicken meat. Besides, it also remarketed the significance of the broiler genotype to choose nutritional strategies in order to improve the poultry meat properties (Jlali’s et al., 2012). Furthermore, products obtained with free range farming system showed better oxidative stability, that ensures more food-safety and quality characteristics demanded by customers. Finally, products obtained using a free range farming system were overall well distinct through triangle test performed with an untrained panel when compared with conventional ones, even if untrained consumer panel were not able to identify any variation in meat organoleptic descriptors (tenderness, juiciness, flavour and overall acceptability) with the only exception of overall acceptability (better in free range breast meat from rotisserie type carcasses). - 87 - 2.2.2. Quality characteristics of frozen broiler breast meat pretreated with increasing concentrations of sodium chloride 2.2.2.1 Introduction During the past 30 years, global production and consumption of poultry meat have dramatically grown. Besides in numerous countries in particular the developing ones, the “per capita consumption” of poultry meat still increases. Also poultry meat further products reflect this trade trend, in fact it has been remarkable increased during the last three decades (Cavani et al., 2009). In this context the market of freezing meat is developing more and more and it will play an important role in both storage and trading in raw materials (deboned, cut up, chopped, minced or mechanically separated (MSM) meats), marketing and in the improvement of shelf life of value-added products like ready to cook and readyto-eat foods. Actually, frozen storage is the best preservation system used to maintain elevated level of quality and safety during storage of poultry meat products (Fletcher, 2004; Kotrola and Mohyla, 2011). In order to improve the technological and quality traits, it is possible to add sodium chloride (salt; NaCl) previous to freeze poultry meat. Salt is the principal ingredient used for the production of meat and poultry meat products, because it performs three main mechanisms: 1) promotes the protein solubilisation, improving texture and water binding capacity; 2) reduces the microbial growth and consequently increases the shelf life of the products; 3) improves taste and enhances meat flavour (Barbut, 2002). The hypothesis that sodium chloride is able to improve meat water holding capacity (WHC) has been proved by Offer and Knight (1988), Ruusunen and Puolanne (2005) and Chen and Sun (2008). Sodium chloride divides into sodium (Na +) and chloride (Cl-) ions when it is solved in aqueous solution. In addition chloride anions affect more meat quality traits than sodium cations, because they are able to bound stronger to the meat proteins (Sebranek, 2009). Chloride anions are inclined to bind to the thick (myosin) and thin (actin) filaments and as a consequence increase the electrostatic repulsive forces among them. This causes the unfolding of the protein structure matrix, resulting in a transverse swelling between thick and thin filaments due to the increasing gaps among actin and myosin (Offer and Trinick, 1983; Hamm, 1986). Furthermore, the link of Cl - anions with positively charged amino acids of myosin causes the reallocation of the isoelectric point to lower values of pH. Consequently, more water could be bound without altering meat pH value, such as the movement of the isoelectric point from pH 5.2 to pH 5.0 that extends the difference between the isoelectric point and the pH of meat. With the increasing of this difference, the capillary effect of muscle fibres also increases and as a result the waterbinding and the water holding capacity of meat and meat products improve (Feiner, 2006). - 88 - Usually, in formulations of poultry meat products, a percentage comprise from 1.0 to 1.6% of sodium chloride is used. In the last few decades, it has raised the consumption of numerous processed foods, that contain an elevated level of sodium. For this reason the dietary salt introduction is currently considered, by some, to be a potential health hazard. In order to prevent disease due to an excessive use of salt, several countries have developed national plans with the aim to drastically reduce the foods’ sodium chloride content, in particular in processed foods and in domestic use (Doyle and Glass, 2010). Desmond (2006) estimated that Americans, Irish and Britons consume more than 20% of sodium per day through cured and processed meat. For this reason the addition of sodium chloride during the preparation of elaborated and cured meat products should be reduced (Ruusunen and Poulanne, 2005; Desmond, 2006). The effects of freezing temperature on quality and technological characteristics of meat has been well examined during the last decades (James and James, 2002), but on frozen meat quality traits previously added with sodium chloride only a few information is presented in literature. Thus the objective of this research was to describe the quality characteristics and sensory traits of frozen chicken breast meat treated with a progressive increasing of sodium chloride levels (from 0 to 2%) before freezing. 2.2.2.2 Materials and methods Samples were obtained using breast meat (Pectoralis major) from an homogenous flock of broilers (Cobb genotype) farmed for 44 days, growing both genders together, and slaughtered in commercial conditions at 2.55 kg of average weight. Fillets were randomly deboned and collected by hand directly after cooling. Following, 12 groups of breasts were treated with sodium chloride added by hand. Each group were salted with 0.0, 0.2, 0.4, 0.5, 0.6, 0.8, 1.0, 1.2, 1.4, 1.6, 1.8, 2.0% of sodium chloride, packaged in plastic bags containing about 7.5 kg of meat, promptly frozen at the processing plant and then transported to the scientific laboratory under freezing conditions to be later evaluated. Fillets were storage for 3 months at -24°C, placed in refrigerator (2-4°C) for 72 h to obtain thawed samples and submitted to the following analysis. Twelve intact fillets were used for each group to evaluate colour, pH, drip loss in raw and cooked meat, after cooking loss and shear force (Allo-Kramer) were evaluated. Whereas, other twelve samples per group were minced one by one and evaluated for cooking loss on hamburger, sodium chloride content and TBARS. Finally, residual samples from 0.0, 0.4, 0.8, 1.2, 1.6 and 2.0% groups were utilized to carry out the sensory analysis (consumer test). Analytical determinations are summarized in table 2.13. - 89 - Table 2.13. Analytical determinations to evaluate the meat quality traits Analytical Determinations Paragraph of material and methods pH Paragraph 2.1.2.1 Colour Paragraph 2.1.2.2 Drip loss Paragraph 2.1.2.3.1 Cooking loss Paragraph 2.1.2.3.4 Shear force Paragraph 2.1.2.4.1 Thiobarbituric acid reactive substances (TBARs) analysis Paragraph 2.1.3.6.1 Sodium chloride content Paragraph 2.1.3.8 Consumer test Paragraph 2.1.4.4 2.2.3.3 Statistical analysis Data elaboration were performed with GLM-ANOVA analysis (general linear models method), using SAS® software (SAS Institute, 1988) and salt group was tested as the main effect. Duncan multiple range test option of the GLM procedure (SAS Institute, 1988) was used to separate different means. 2.2.2.4 Results and discussion Table 2.14 shows sodium chloride (salt) content, pH values, drip loss, cooking loss and shear force (Allo-Kramer) of chicken meat from the twelve groups. Unsurprisingly, meat sodium chloride content significantly (P<0.01) increased with the increasing of sodium chloride concentration (from 0 to 2%). A very low variability between each group was calculated by ANOVA, proving that adding salt methods was efficient. Table 2.14. Effect of the increasing of sodium chloride concentration on salt content, pH, drip loss, cook loss and shear force on meat and meat hamburger of chicken breast (mean±SEM). Means with different letters on the same column within the same effect differ significantly (P<0.05). Analysis performed on 12 samples per group. - 90 - In general the addition of sodium chloride caused considerable pH rising on fillets meat (from 5.73 to 6.03; P<0.01). Only 0.2% of salt addition was enough to significantly influence meat pH. It is well investigated that salting meat with sodium chloride does not cause important effect on pH (Shults and Wierbicki, 1973; Sheard and Tali, 2004; Petracci et al., 2012), thus those results may be associated to the dissimilar liquid losses due to the thawing (data not shown). Indeed, control group presented the highest thaw loss (11.9%), which was dramatically reduced with the addition of salt. Actually, another study found that freezing and the related liquid losses can denature buffering compounds (for example: proteins, anserine, carnosine). They can also promote the release of hydrogen cations and consequently decrease pH (Leygonie et al., 2012). Same authors also theorized that the thaw loss of fluid might determine an augment in the concentration of meat solutes. As a result, meat pH decreases (Leygonie et al., 2012). Drip loss determination was significantly (P<0.01) affected by salt addition and it was possible to determine this effect (P<0.05) with 0.4% of sodium chloride concentration. Particularly, drip loss ranged from 0.86 to 0.97% in fillets with sodium chloride concentration from 0.4 to 1.0%, whereas inferior drip losses values (from 0.59 to 0.63%; P<0.05) were determinate for sodium chloride concentration more elevated than 1.0%. When the addition of sodium chloride was superior to 0.2%, whole fillets presented lower values of cooking losses. This decreasing followed a quite linear trend that was going from 0.4 to 2.0% group. Weight loss due to the cooking determined on hamburger (minced breast meat) showed a similar tendency, but the decreasing of liquid losses due to sodium chloride addition was more elevated: a reduction of about 14% of cooking loss was determined between control group and 2.0% group. Those results confirmed that gradually increases of sodium chloride concentration up to 2% improves water holding capacity of meat during storage and cooking (Shults and Wierbicki, 1973; Swatland and Barbut, 1999). As previous declared, the addition of sodium chloride on meat promotes the solubilisation of myofibrillar proteins (actin and myosin) and provides more negative chloride anions to the system (Offer and Trinick, 1983; Hamm, 1986). Both effects caused an increasing in the meat water holding capacity. Furthermore, throughout cooking myofibrillar extracted proteins coagulates, determining the union between meat particles, binding moisture (reduce cooking losses) and the appearance of an articulate meat matrix capable to incorporate melting fat (Barbut, 2002). In addition, the improvement of meat water holding capacity is also due to the rising of meat pH showed from 0.0% group until 2.0% group. This increasing of meat pH caused a more elevated number of negative net charge in proteins and consequently enhanced meat water holding capacity (Feiner, 2006). Thus, according to Petracci et al. (2004) the - 91 - increasing of water holding capacity emerged in this research could be elucidated by the coupled effect of sodium chloride addition and the increasing of pH. The instrumental tenderness was determined through Allo-Kramer shear force evaluation. In cooked meat, control group showed significant (P<0.05) more elevated values of shear force when compared with the other groups, which were added sodium chloride and presented no differences between each others. A previous research reported that long-term storage of chicken breast meat without salt increases meat toughness (Lee et al., 2008). Our data showed that a small addition of sodium chloride is enough to cause an enhancement of meat tenderness, these results are confirmed by the previous finding of Swatland and Barbut (1999) about the prevention of meat toughening caused by long-term sub zero storage. Colour (CIELAB L*, a* and b*) values of raw and cooked chicken breast meat are reported in Table 2.15. The increasing sodium chloride concentration significantly affected (P<0.01) lightness (L*) and yellowness (b*) colour coordinates, without influence redness (a*) values. The addition of different levels, 0 to 2% of sodium chloride, caused a significant drop in lightness and yellowness (L*; 55.7 to 45.9; b*; 10.7 to 6.4; P<0.01) values, beginning from 0.2% group. This indicates that salt addition confers a darker and less yellow colour to the breast meat. A similar trend in cooked fillet colour was detected, but moderate changes were measured, which may not be very important for practical or industrial aspect. Table 2.15. Effect of the increasing of sodium chloride concentration on meat colour of chicken breast (mean±SEM). Means with different letters on the same column within the same effect differ significantly (P<0.05). In general, this research agrees with Swatland and Barbut (1999) who found that progressive increases of sodium chloride reaching the maximum of 2% cause simultaneously decreases of the meat lightness. This result could be the consequence of the addition of salt, because it causes the reduction of free water on meat surface, resulting in a - 92 - lower light reflection and in a darker meat. Moreover this colour trend may be also due to pH effect. Actually it is well known that when meat presents lower values of pH it can also show less values of lightness (Petracci et al., 2009). About the treatment of sodium chloride to chicken breasts, it did not affect the susceptibility to lipid oxidation (Table 2.16). In other words, the addition of sodium chloride up to 2% did not affect negatively lipid peroxidation which is the main responsible for the rancidity formation. To conclude, sensory analysis showed that meat samples treated with 1.6 and 2.0% of sodium chloride were more tender and juicier. Thereby, tenderness score was in agreement with the objective evaluation performed by Allo-Kramer shear force method. In addition, overall likely improved with the increasing of sodium chloride levels (Table 2.17). Table 2.16. Effect of the increasing of sodium chloride concentration on susceptibility to lipid oxidation (TBARS value) of chicken breast (mean±SEM). Table 2.17. Effect of the increasing of sodium chloride concentration on sensory traits (tenderness, juiciness, overall likely) of chicken breast (mean±SEM). 1 from 1 (extremely tough) to 8 (extremely tender); 2from 1 (extremely dry) to 8 (extremely juicy); 3from 1 (dislike very much) to 5 (like very much); Means with different letters on the same column within the same effect differ significantly (P<0.05). - 93 - In this way, panel assessors were capable to notice the positive effects of sodium chloride treatment overall likely from the 0.8% group. However the most elevated values were achieved by groups 1.6 and 2.0%. Moreover, other previously research observed the same enhancing effect of sodium chloride addition on meat flavour and palatability (Barbut, 2002; Alvarado and McKee, 2007). This explains the high difficult in decreasing sodium chloride amounts in poultry processed foods without also interfering in the costumers general acceptance (Weiss et al., 2010). 2.2.2.5 Conclusions The results of the present research evidenced that treatment with sodium chloride, before freezing, affects significantly all general quality characteristics of frozen chicken breasts, especially pH, colour, water holding capacity and tenderness even in lower concentrations 0.2-0.4%. Moreover, the increasing of sodium chloride concentration caused more elevated pH values, inferior light colour, greater water holding capacity (measured by thaw, drip and cooking losses), and lower toughness (Allo-Kramer shear force). The most elevated improvement of water holding capacity was showed by groups with more than 1.2% of added sodium chloride. During sensory analysis, breasts treated with equal and higher levels of 0.8% of sodium chloride presented the best scores of overall likely. Furthermore it was observed more elevated scores of tenderness, juiciness and overall likely in samples treated with the highest sodium chloride percentages (from 1.6 to 2.0% groups), confirming the renowned positive effects of sodium chloride on meat organoleptic characteristics. - 94 - 2.2.3. The use of sodium bicarbonate for marination of broiler breast meat 2.2.3.1 Introduction The world poultry meat production and utilization have augmented quickly and, in different countries, per capita consumption of poultry meat still to be in expansion. The success of poultry meat is due also to the increased accessibility of “easy to cook” and “easy to eat” products (Fletcher, 2002). In order to obtain this kind of processed products, it is necessary to use meat with higher standards of quality, which allow the improvement of sensory and functional characteristics (Fletcher, 2002; Barbut et al., 2008). Moreover producers have to provide a good quality raw meat, paying attention to ante-mortem, postmortem and processing factors (Petracci et al., 2010; Petracci and Cavani, 2012). During further processing, it is possible to affect the meat quality using functional ingredients, which include several additives or ingredients with different functionalities (water and fat holding capacity, binding properties, texture modulation) from vegetable and animal sources (Petracci et al., 2013a). In addition, the use of functional ingredients allow the decreasing of formulation cost due to addition of water, increasing of processing yield or permitting the preparation of products formulated with cheaper meat sources (Barbut, 2002; Weiss et al., 2010; Petracci et al., 2013a). Marination is frequently utilized to improve meat and meat products value and it consists to add a solution of water, salt, and other ingredients in muscle trough injection or tumbling. This procedure is also used to improve meat products flavour and increase their shelf life, adding spices and extracts with antimicrobial and antioxidant properties in marinades (Alvarado and McKee, 2007). It has been well researched in literature that it is possible to inject or add nonmeat ingredients to improve the water holding capacity (WHC) of poultry meat products (Smith, 2010). Water is generally not consider as a functional ingredient in meat products, but even it is the main component of raw meat, water is usually added as a nonmeat ingredient during the preparation of the elaborated food (Sebranek, 2009). In general, when the meat pH with the isoelectric point of myofibrillar proteins (in chicken meat pH = 5.2–5.3) meat present the lowest values of water holding capacity. For this reason it is possible improve the WHC of meat products increasing the ionic strength trough regulating the pH (Barbut, 2002). In agreement with Offer and Trinick (1983), it could be possible to develop the water holding capacity with the marination, because muscle fibres swell as a consequence of electrostatic repulsion that allows the retention of more water in the myofibril network. It have been also established that numerous additives are able to improve the moisture retention of meat products and the most often used are sodium chloride and phosphates - 95 - (Alvarado and McKee, 2007). Actually using sodium chloride concentrations ranging from 4.6 to 5.8% are capable to achieve the maximum expansion of myofibrils corresponding with the maximum moisture uptake. It is well known that sodium chloride affect the solubilisation of myofibrillar proteins trough denaturation and aggregation, improving the moisture retention and the meat gels properties (Barbut, 2002). This mechanisms concerning the sodium chloride effects on meat WHC have been well reviewed by Offer and Knight (1988) and Ruusunen and Puolanne (2005). Moreover, also using phosphate salts (in particular pyrophosphate and tripolyphosphate) improve the water holding and binding capacities of meat. It is enough to use a concentration of about 0.3% of phosphate to obtain an effect on muscle proteins causing pH increasing, modify the ionic strength and particularly by promoting the formation of protein-bound Mg and Ca, with the consequent increasing of myosin and actin solubilisation (Xiong, 2004). In addition, Xiong et al. (2000) observed a strong synergistic effect in poultry meat, when sodium chloride and phosphates were used together. For this reason, marinades with of sodium chloride and polyphosphates are utilized to increase the quality (in particular texture and yield) of muscle food products (Young and Lyon, 1997; Xiong and Kupski, 1999a,b; Smith and Young, 2007). Even though phosphates have been shown to be able to positively affect meat quality, different countries have forbidden their use in raw meat production (Sebranek, 2009). For this reason some ingredients able to replace phosphates in meat products are under investigation. Only a few studies focused on using bicarbonate to minimize the problem of pale, soft, and exudative in pork (Kauffman et al., 1998; Van Laack et al., 1998; Wynveen et al., 2001) and poultry (Woelfel and Sams, 2001; Alvarado and Sams, 2003). Furthermore, recent studies observed that it was possible to reduce shear force and improve the yield of pork and poultry meat products using sodium bicarbonate (NaHCO3; Sheard and Tali, 2010; Sen et al., 2005; Petracci et al., 2009b). The more positive effect of bicarbonates could be the consequence of a higher buffering capacity and ionic strength when compared with phosphates (Wynveen et al., 2001). In disagreement to the more utilized development ingredients (sodium chloride and polyphosphates), the basic mechanisms of action of sodium bicarbonate are far from be understood in detail. Even if earlier researches have presented information about the effects in meat marinated with sodium chloride, polyphosphate, and bicarbonate, limited information has been obtained at this time concerning the marination effects on the interaction of water with the biopolymers inside the intra- and extra- myofibrillar spaces. Therefore, it may be very helpful to research water allocation and mobility using advanced techniques, like low-field nuclear magnetic resonance (LF-NMR) and differential scanning calorimetry (DSC). The detection of proton transverse relaxation time (T2) weighted signals, using LR-NMR, has been applied with success to investigate water allocation and water properties in meat. In fact - 96 - researches carried out on different meat as pork (Bertram et al., 2002), turkey (Bianchi et al., 2004), and rabbit (Petracci et al., 2009a) reported that weighted T2 signals permit to separately recognize water tightly connected to macromolecular constituents of muscle situated inside and outside of the myofibrils. The characteristics of these last two water fractions have been established to be firmly associated to WHC and other meat-quality features. Lately Bertram et al. (2008) observed that proton T2 is strictly associate with fibre swelling in pork induced by salt. They found that swelling exert the same influence of pH and ionic strength on proton NMR T2 relaxation characteristics of solubilised myofibrils. The bound water has been conventionally evaluated by DSC as the quantity of unfreezable moisture inside samples after being cooled at very low temperature (for example -70°C; Simatos et al., 1975). Theoretically, when the temperature of the frozen samples is constantly augmented using the calorimeter, the ice melting is recognized and recorded as an endothermic peak, which presents an area proportional to the quantity of ice. No-freezable water corresponds to the difference among the whole water content and the quantity of water noticed trough endothermic fusion (Cornillon, 2000). Differential scanning calorimetry has been exploited in order to observe the macroscopic phase changes of water in polymeric (Capitani et al., 2003) and in food systems (like meat; Venturi et al., 2007). The aims of this research were to study the performances of marination and the consequence on meat quality characteristics of sodium bicarbonate, 1) used alone or in combination with sodium chloride, when compared with sodium trypolyphosphate (experiment 1) and 2) used in different concentrations with a fixed level of sodium chloride (experiment 2). Water allocation and mobility changes induced by marination treatments was investigated using LF-NMR and DSC. 2.2.3.2 Materials and methods 2.2.3.2.1. Use of sodium bicarbonate in comparison with sodium trypolyphosphate for marination of broiler breast meat (Experiment 1) A group of 35 chicken breast (24 h post-mortem) was obtained growing and slaughtering under commercial conditions a batch of female broilers (Ross 708) at 47 days of age and 2.54 kg. From each fillets (Pectoralis major), four samples with cylindrical shape were cut using a tubular sharp probe. A total of 140 samples measuring about 1 cm of height and 4 cm of diameter (15 g) were obtained and subsequently separated in seven harmonized groups (20 samples/group) in agreement to their pH and colour (L*; a*;b*) and labelled to be identifiable during all the treatments. Six experimental groups were designated for following marination treatments, while the remnant group was set aside as a - 97 - non-marinated control. Samples were marinated trough vacuum tumbling using a 12% (wt/wt) water/meat ratio with 6 different marinades: Group (S) with 7.7% (wt/wt) of sodium chloride (NaCl); Group (P) with 2.3% (wt/wt) of sodium trypolyphosphate (Na4O7P2); Group (B) with 2.3% (wt/wt) of sodium bicarbonate (NaHCO3); Group (SP) with 7.7% (wt/wt) of sodium chloride (NaCl) and 2.3% (wt/wt) of sodium tripolyphosphate (Na4O7P2); Group (SB) with 7.7% (wt/wt) of sodium chloride (NaCl) and 2.3% (wt/wt) of sodium bicarbonate (NaHCO3); Group (SB) with 7.7% (wt/wt) of sodium chloride (NaCl) and 2.3% (wt/wt) of sodium bicarbonate (NaHCO3) and 2.3% (wt/wt) of sodium bicarbonate (NaHCO3); The salts concentration of products was expressed as g/100 g of meat and was of approximately 1% for sodium chloride (S treatment), and 0.3% for sodium tripolyphosphate and sodium bicarbonate (P and B treatments), according to the regular range utilized in chicken products. In order to reproduce the commercial marination, tumbling was performed via laboratory rotary evaporator (Heidolph, Germany) attached to a vacuum pump managed using a specially designed device capable to firmly control pressure during the treatment. Samples were put together with marinade solution in a 500-mL evaporator flask and vacuum (3 kPa) tumbled for 40 minutes under refrigerated conditions (2 ± 1°C). Samples quality traits were determined by the evaluation of pH and colour (L*;a*;b*) on raw and marinade and cooked meat, marinade uptake, drip loss, expressible moisture, and LR-NMR relaxation properties on uncooked meat and cooking loss, total moisture, and LR-NMR relaxation properties on cooked meat. From each group, 10 samples were used to the raw marinated meat determinations and the other ten for the cooked marinated meat determinations. Analytical determinations are summarized in Table 2.18. 2.2.3.2.2. Use of increasing levels of sodium bicarbonate (Experiment 2) A batch of breast fillets of chicken was bough from a local processing plant at 24h post mortem from a groups of female birds Cobb 500 farmed for 46 day and slaughtered at 2.48 kg under commercial conditions. From each breast (Pectoralis major), four samples presenting the same characteristics of the samples used in the phase one (cylindrical shape 1 cm of height and 4 cm of diameter) were cut in order to obtain seven groups (29 samples/group) uniform for pH and colour (L* a* b*). Samples were vacuum tumbled using the same condition of marination described before and used during the phase 1 with - 98 - seven different marinated solutions (12% wt/wt water/meat ration,) having a fixed sodium chloride concentration (7.7% wt/wt) and seven different sodium bicarbonate levels: Group (S) with 7.7% (wt/wt) of sodium chloride (NaCl) and 0.0% (wt/wt) of sodium bicarbonate (NaHCO3); Group (B05) with 7.7% (wt/wt) of sodium chloride (NaCl) and 0.4% (wt/wt) of sodium bicarbonate (NaHCO3); Group (B10) with 7.7% (wt/wt) of sodium chloride (NaCl) and 0.8% (wt/wt) of sodium bicarbonate (NaHCO3); Group (B20) with 7.7% (wt/wt) of sodium chloride (NaCl) and 1.6% (wt/wt) of sodium bicarbonate (NaHCO3); Group (B30) with 7.7% (wt/wt) of sodium chloride (NaCl) and 2.4% (wt/wt) of sodium bicarbonate (NaHCO3); Group (B40) with 7.7% (wt/wt) of sodium chloride (NaCl) and 3.2% (wt/wt) of sodium bicarbonate (NaHCO3); Group (B50) with 7.7% (wt/wt) of sodium chloride (NaCl) and 3.8% (wt/wt) of sodium bicarbonate (NaHCO3); The products salt concentration was about 1 g of sodium chloride per 100 g meat and ranged from 0 to 0.5 g of sodium bicarbonate per 100 g meat. Twenty samples per group were analyzed to evaluate meat quality traits by the determination of pH and colour (L* a* b*) on raw and marinade and cooked meat, marinade uptake, drip loss, expressible moisture, Aw, freezable water and LR-NMR relaxation properties on uncooked meat and cooking loss, total moisture, Aw, freezable water (FW) and LR-NMR relaxation properties on cooked meat. From each group, 10 samples were used to the raw marinated meat determinations and the other ten for the cooked marinated meat determinations. Furthermore nine samples after cooking per each group counting an extra un-marinated group of cooked samples were exclusively utilized to investigate texture profile analysis (TPA). Analytical determinations are summarized in Table 2.18. - 99 - Table 2.18. Analytical determinations to evaluate the meat quality traits Analytical Determinations Paragraph of material and methods pH Paragraph 2.1.2.1 Colour Paragraph 2.1.2.2 Drip loss Paragraph 2.1.2.3.1 Marinade uptake Paragraph 2.1.2.3.2 Cooking loss Paragraph 2.1.2.3.4 Expressible moisture Paragraph 2.1.2.3.6 Freezable water (FW) Paragraph 2.1.2.3.7 Water activity (Aw) Paragraph 2.1.2.3.8 NMR relaxation measurements Paragraph 2.1.2.3.9 Texture Profile Analysis (TPA) Paragraph 2.1.2.4.2 Moisture Paragraph 2.1.3.1 2.2.3.3. Statistical analysis Data collected from both experiments 1 and 2 were independently analyzed by one-way ANOVA, using SAS software (SAS Institute, 1988) and testing the effect of marinated solutions as the main effect. When the effect was significant, Duncan’s multiple range test was used to separate the means. 2.2.3.4. Results and discussion 2.2.3.4.1 Use of sodium bicarbonate in comparison with sodium trypolyphosphate for marination of broiler breast meat (Experiment 1) Table 2.19 reports the values of marinade solution pH, meat pH and colour, after tumbling and after cooking. Table 2.19. pH of marinade solution and pH and colour of raw, marinated and cooked chicken breasts 1. a–d Means within a row followed by different superscript letters differ significantly (P ≤ 0.05). C = control (non-marinated); S = salt; P = phosphate; B = bicarbonate; SP = salt and phosphate; SB = salt and bicarbonate; SPB = salt, phosphate, and bicarbonate. 2 For the data, n = 20. 3For the data, n = 10. ***P ≤ 0.001. 1 - 100 - The raw meat pH and colour were similar between groups, and this uniformity was essential because abnormal values of meat pH and colour have been shown to affect marinated uptake and cooking yield (Qiao et al., 2002; Barbut et al., 2005). As expected, pH of marinade solution with S was close to neutrality, while P and B used in single or in combination, caused the augment of pH (from 7.61 to 9.04). As a result, meat pH values were increased by the high pH of marinades. Samples treated using sodium bicarbonate alone (B) or blended (SB and SPB) increased (P < 0.05) meat pH for approximately 0.7 units in respect of the control. In addition sodium tripolyphosphate used alone (P) or together with salt (SP) significantly increased (P < 0.05) pH of 0.2 units. These results are in agreement with the ones observed by other authors for P and B (Alvarado and Sams, 2003; Sen et al., 2005). The dissimilar effects of P and B might be caused to differences in buffering capacity and ionic strength. Furthermore, it was also established that the use of S did not interfere with the alkaline effect of P and B. Differences in raw meat remained after cooking even if absolute differences with respect to the control group were of a lower extent. As for meat colour, samples after marination presented darker colour in comparison with control, with only one group exception, P. Moreover, samples marinated with the combinations of salts (SP, SB and SPB) also showed the darkest colours. The same results were also noticed in samples marinated with salts combination after cooking. However, lightness from S, P and B groups did not differ from the control. Lastly, redness and yellowness seem to be modified by marination, but they were not always consistent or necessarily remarkable, meaning it could present relatively little practical importance. Also in previously studies it was found that marination with different blends of salts (SP, SB, and SPB) caused the darkening in both raw and cooked meat (Alvarado and Sams, 2003; Sen et al., 2005), while Young and Lyon (1997) did not observed any effects of salt and phosphate treatment on meat lightness. It is implicit that uncooked meat with elevated pH present a darker colour due to its surface that scatters less light when compared with meat that having inferior ultimate pH (Swatland, 2008). In addition divergences in colour due to pH were also observed in cooked meat, according to Trout (1989), who found that elevated pH decreased myoglobin denaturation during cooking, therefore promoting the darkness augment. Earlier, Young and Lyon (1997) found that phosphates is able to reduce the redness of cooked chicken breast. Meat colour is extremely important for the choice of raw material (deboned and skinless meat) and for the ultimate assessment of numerous cooked products, for this reason the general consequence of sodium bicarbonate treatment on meat appearance must be appropriately modulated. - 101 - In regard to other parameters such as marinade uptake, drip loss, expressible moisture, cooking loss, yield and total moisture after cooking, they all exhibited significant differences throughout the treatments (P < 0.001; Table 2.20). Table 2.20 Performances of marination and cooking of marinated chicken breast1 a–f Means within a row followed by different superscript letters differ significantly (P ≤ 0.05). C = control (non-marinated); S = salt; P = phosphate; B = bicarbonate; SP = salt and phosphate; SB = salt and bicarbonate; SPB = salt, phosphate and bicarbonate. 2 For the data, n = 20/group. 3For the data, n = 10/group. ***P ≤ 0.001. 1 The percentage of marinade uptake observed was lower than typical values presented in industry, which is explained by the difference in equipments used. In this study, to perform tumbling it was used a laboratory rotary evaporator. The most noticeable result was seen in marinade combinations of B with S without or with P (SB and SPB) in which the highest marinade uptake values (10.2 and 11.6%, respectively) were presented. Besides, SPB samples also exhibited the lowest drip loss (0.74%). When used P or B alone, the results were the lowest for the marinade uptake and also exhibited a worse ability in retaining liquid, as assessed by expressible moisture when compared with samples marinated in S alone or in combinations with B or P (SP, SB, and SPB). Whereas samples marinated in S without or with P (S and SP) resulted in intermediate marinade uptakes. Results for cooking loss showed a large coverage range, from 9.2 to 25.4%. Samples marinated only with P exhibited the highest losses. Meanwhile, the lowest losses were noticed when S and B irrespective of the presence of P (SB and SPB) were used. Whereas the SP combination showed a reduced ability to retain liquid during cooking. SPB and SB samples after cooking demonstrated higher total moisture as a result of higher marinade uptake and lower cooking losses. Yields results can be seen in Table 2.17. All marinated samples had significantly higher yield values than the control (P < 0.05), except for P alone, which did not showed significantly differences from the control. The highest yield was observed in the combination containing all of the ingredients (SPB). However, S and B (SB) also obtained a very similar result. This result confirmed a significant increasing of WHC and yield of S group (1%) in respect with the control (Barbut, 2002). No difference of yield in comparison with the non marinated control were observed when 0.3% of P were used, because phosphates present scarce ability to retain liquid during cooking. Also Xiong et al. (2000) observed similar - 102 - results. In fact, they affirmed that phosphates show simply small effect on ionic strength when used in single, while a remarkable synergistic effect was detected if used together with sodium chloride. On the contrary, using the same concentration of B allowed a more elevated yield than control and P groups, but inferior than samples treated with sodium chloride. The higher performances of B could be associated to its more elevated alkalinity. Similarly, the mixture of 2 or more ingredients improved yield in respect of each ingredient used alone. The PS bland operated synergistically reducing cooking losses according with preceding studies that showed that adding salt (around 1%) together with phosphates to a meat product, proteins can hold elevated amount of added water (Young and Lyon, 1997; Xiong and Kupski, 1999a). However, a previous research showed that sodium chloride significantly reduced phosphate functionality when it was added in high concentrations (Xiong and Kupski, 1999b). The SB mixture presented more elevated aptitude to increase moisture uptake during marination and to alleviate cooking losses. As mentioned before, this latter may be principally associated to its alkalinity that effect the meat pH far from the isoelectric point of myofibrillar proteins and increased the net negative charge. Consequently, muscle fibres swell because the formation of electrostatic repulsion forces that permit more moisture to be entrapped in the myofibrillar network (Offer and Knight, 1988). On the other hand, the effect of P is mostly due to their capacities to promote protein-bound with Mg and Ca, resulting in more elevated actomyosin dissociation and depolymerisation of thick and thin filaments (Xiong, 2004). Both raw and cooked meat were investigated through LR-NMR. The proton pool with lower relaxation time, representing roughly 4% of the relaxogram’s signal, was assigned according to Bertram et al. (2002) to water tightly associated to proteins and macromolecular constituents of meat (bound water, T 2 < 20 ms); the main population, with a T2 between 20 and 60 ms, was assigned to myofibrillar water or water entrapped in the contractile protein reticulum. Finally, the population with a higher relaxation time was assigned to extramyofibrillar water or water physically located outside of the protein network (T2 > 60 ms). According to the two-site chemical exchange model described by Hills (1998), a significant contribution to the 3 proton pools is given also by the biopolymers’ protons chemically exchanging with the water located in the different sites. For this reason, from this section on, the 3 proton pools will be simply referred to as bound water, myofibrillar protons, and extramyofibrillar protons. Table 2.21 reports their T 2 and absolute values (% intensities). If no difference was observed in both the extramyofibrillar protons’ intensity and T2, water gain following marination with S (alone or in combination with the other studied compounds) generally increased the area of the peaks assigned to myofibrillar protons. Such an increase was accompanied by a movement toward a higher T2. - 103 - Table 2.21. Nuclear magnetic properties of marinated and cooked chicken breast (n = 10/group) 1,2. a–c Means within a row followed by different superscript letters differ significantly (P ≤ 0.05). To allow for a direct comparison among the treatments, the intensities are scaled so that the control samples’ total area equals 100. 2 C = control (non-marinated); S = salt; P = phosphate; B = bicarbonate; SP = salt and phosphate; SB = salt and bicarbonate; SPB = salt, phosphate and bicarbonate. **P ≤ 0.01; and ***P ≤ 0.001. 1 A comparison between marinated and cooked samples revealed that the major effect of cooking was the increase of the bound-water proton pool signal, which made the total signal higher in the cooked meat than in the marinated counterparts before cooking. This apparent contradiction was explained by considering that a part of the bound-water proton pool could not be observed through Carr-Purcell-Meiboon- Gill in the marinated samples because of the too-low T2, whereas the same protons could be seen in the cooked meat (Venturi et al., 2007). Due to this artefact, the bound-water proton pool will no longer be considered in the remaining part of the present discussion. Finally, among marinated cooked samples, only SB and SPB groups exhibited higher T2 than that of the control. Alteration on water allocation and mobility could be better explained by considering LR-NMR outcomes. Certainly, the data obtained by LR-NMR could be reorganized in agreement to the “two-site chemical exchange model” created by Hills (1998). At 20 MHz, the T2 smaller than that of H2O (≈1500 ms) primarily reveals the proton exchange among water and proteins (with a typical T2 of milliseconds). The T 2 of the protons relating to a compartment containing water can thus decrease when 1) the biopolymers/water ratio augments, and 2) the pH goes far from the biopolymers isoelectric point, as a result the number of exchangeable protons rise. When the sodium chloride marinade was used, it caused a significant moisture gain without modify the pH, thus the myofibrillar water peak increased, moving it toward more elevated T 2 values, which are related to a higher water mobility trough the meat structure due to the more water content determined by tumbling, according to Bertram et al. (2008). Nevertheless, when bicarbonate was used, the increased water content was followed by a pH increment, drifting away from the isoelectric point, allowing an increment of the protein sites of exchange. Lastly, cooking treatment decreased the meat water content, as a consequence also the corresponding peak decreased and moved toward lower T2. Data collected in the present research reported that water incoming into - 104 - the meat system beside marination largely reached the myofibrillar structure, as could be observed from both water peak intensity and T 2 of myofibrillar proteins. Cooking did not dry samples more than the original level. Sodium chloride, P, and B presented similar performance of marination and the mixtures (SP, SB, SPB) use promoted the improvement of the myofibrillar water content in the cooked meat. Meat Aw and FW after marination and after cooking, are shown in Table 2.2. The Aw of a fresh meat sample was 0.990, in agreement with previous data on raw meat (Chirife and Fontan, 1982), whereas the FW was 0.612 g/g of fresh sample weight, which means that in raw meat, about 90% of the total water had enough mobility to freeze. Compared with the non marinated control samples, only samples treated with S or in combination with B and P (SP, SB, and SPB) evidenced significantly lower Aw values. Actually, S, SB, and SPB samples showed values of 0.985, 0.984, and 0.985, respectively, whereas the Aw of the SP sample was 0.981. No differences were observed in terms of FW. Non marinated cooked control samples evidenced a slight reduction in Aw, but only sample P showed a significantly different, higher Aw value compared with that of the control and SP, SB, and SPB treatments. The cooking process did not produce any significant differences in the freezable water (FW) amount. In general, the parameters of water mobility determined by the DSC technique did not evidenced significant alterations for all of the considered marinating treatments (S, P, B, SP, SB, SPB). In agreement with Pearce et al., (2011), water in muscle is structurally located in layers close to polar molecules and among layers of cellular materials. About 5% of meat water is “true hydration water” that is absorbed by proteins. This water is known as unfreezable; it present an ice-like structure and it is unaffected by charges on the meat protein (pH), because it is not available to contribute in reactions. In this research freezable water (FW) results showed that not marinated samples presented about 10% of unfreezable water over the total amount and marination did not significant affect this outcome. This result is in agreement with the bound-water amount detected by the evaluation of the raw meat T2 peak intensity, that was about 4% of the total signal. In fact also Pearce et al. (2011) reviewed that NMR transverse relaxometry allows to understand better water allocation kinetics in the different compartments of muscle microstructures. - 105 - Table 2.22. Water activity (Aw) and freezable water content (FW) of marinated and cooked chicken meat (n = 3/group)1 a–c Means within a row followed by different superscript letters differ significantly (P ≤ 0.05). C = control (non-marinated); S = salt; P = phosphate; B = bicarbonate; SP = salt and phosphate; SB = salt and bicarbonate; SPB = salt, phosphate and bicarbonate. 2FW = fresh sample weight. NS = not significant, *P ≤ 0.05 and ***P ≤ 0.001. 1 The condition and mobility of water evidenced by LR-NMR was observed with difficulty by the Aw determination. In fact, only for samples treated with S, alone or blended with the other ingredients significantly affected Aw. These groups (S, SP, SB, and SPB) presented lower values (ranging between 0.981 and 0.985) of Aw than the ones of the control. They also presented significantly lower values of expressible moisture. In agreement to Barbut (2002), expressible moisture is principally represented by the water in the extracellular compartments, which is probable the water fraction more related with Aw. In accord to these discoveries, it appears that the total moisture increasing of marinated samples, it is principally due by the myofibril swelling, that is not correlated with the A w and FW values, even sometime encouraging their decrease. The simultaneous augments of salts concentrations, protein solubilisation and electrostatic interactions between actin and myosin and marinade ions (Xiong, 2004) may be the principal causes for the noticed Aw decrease. 2.2.3.4.2 Use of increasing levels of sodium bicarbonate (Experiment2) In Table 2.23, it is possible to analyze the relationship between pH of marination solution and solution of the meat. When added in a stepwise pattern, bicarbonate increased pH values from 7.05 to 8.31, which means, it presented a 0.17 pH unit increase per 0.1% unit addition of bicarbonate. A similar pH behaviour was also noticed in cooked meats with a slightly lower variation (0.67 units) between the zero control (S) and the maximum bicarbonate (B50). These results are in agreement with Petracci et al. (2012) and Sen et al. (2005), who demonstrated the high alkalinisation effect of bicarbonate. It is very important to emphasize that the use of sodium bicarbonate in poultry meat should be careful or even avoided, since high values of pH creates an opportunity for microbial growth (Allen et al., 1996). In this way, it could drastically limit product’s shelf-life. - 106 - Table 2.23. pH of marinade and in raw, marinated and cooked chicken breast (n = 10/group). S = Salt (1% wt/wt); B05 – B50 = Salt (1% wt/wt) and Bicarbonate with increasing concentration from 0.05 to 0.5% (wt/wt); *** = P≤0.001; ns = not significant; a-g Means within a row followed by different superscript letters differ significantly (P≤0.05) As for meat colour (Table 2.24), after marination and cooking the appearance of the meat was not affected by marination. However, it was noticed a darker colour over the zero bicarbonate control in the B50 samples. Many other studies found the same results (Alvarado and Sams, 2003; Sen et al., 2005; Petracci et al., 2012). In addition Trout (1989) noticed that higher pH values were capable to reduce heat denaturation of myoglobin during cooking leading to increased darkness. Other parameters also showed significant differences among treatments (P < 0.01) for marination such as: uptake, drip loss, expressible moisture, cooking loss, yield and total moisture (Table 2.25). Bicarbonate solution of 0.05% did not improve marinade uptake comparing to the use of salt alone. However, concentrations greater than 0.1% presented higher weight gains. The best marinade uptakes (11.4%) were observed in samples tumbled with 0.30% of bicarbonate solution, whereas higher concentrations (0.40 and 0.50%) demonstrated lower marinade uptakes that were similar to the results obtained for 0.100.20% bicarbonate solutions. As for drip loss, the results were not significantly higher than the S control with the exception of B30 and B50, which suggests those last samples are not as capable as the others to retain added water. Table 2.24. Colour (L*a*b*) of raw, marinated and cooked chicken breast (n =20/group). S = Salt (1% wt/wt); B05 – B50 = Salt (1% wt/wt) and Bicarbonate with increasing concentration from 0.05 to 0.5% (wt/wt). ** = P≤0.01; ns = not significant. a-c Means within a row followed by different superscript letters differ significantly (P≤0.05). - 107 - Table 2.25. Performances of marination and total moisture of marinated chicken breast. S = Salt (1% wt/wt); B05 – B50 = Salt (1% wt/wt) and Bicarbonate with increasing concentration from 0.05 to 0.5% (wt/wt). 1 n=20/group; 2 n=10/group. *** = P≤0.001. a-e Means within a row followed by different superscript letters differ significantly (P≤0.05). About moisture, it was possible to observe a decrease in samples treated with bicarbonate concentrations above 0.30%, while cooking loss presented a decreasing standard with the increase of bicarbonate levels. Still with the same bicarbonate concentration (0.30%), yields showed highest values for treatments. As for total moisture when compared with S groups under bicarbonate levels above 0.20%, it showed increase. It is expected from the alkaline effect that marinade uptake and ability of retention present higher percentages in bicarbonate samples, with the increasing of muscle pH and net negative charges. It leads to the expansion of muscle fibres (swelling) caused by electrostatic repulsion, allowing more immobilization of water into myofibrillar lattice (Offer and Knight, 1988). Bertram et al. (2008) also suggested that bicarbonate can induce a higher protein solubilisation after marination, decreasing the negative effects of protein denaturation during cooking. Proton transverse relaxation (T2) weighted signals acquired by means of NMR at 20 MHz allows the observation of three protons populations with T 2 below 1 ms, around 50 ms and around 100 ms respectively. The first population, represents roughly the 3% of the total signal and can be attributed to water tightly associated with macromolecules (Bertram et al., 2008), for the large part proteins, of the meat and it is commonly loosely defined as bound water. The second and third signals are commonly accepted due to water and biopolymers located inside and outside myofibrils respectively. The three protons populations were observed individually applying two steps approach created for other spatially heterogeneous food matrices (Davenel et al., 2002; Panarese et al., 2012). This approach was made by the inversion of the NMR signals towards a continuous distribution and then a discrete number of exponential curves. Table 2.26 presents for each proton pool the intensity and the average of T2 for each treatment used. The increase of bicarbonate concentrations did not significantly modified the signal from the spaces outside the fibrils. However, the signal from myofibrils reaches the maximum in treatment B20, decreasing again later on. Alongside, in both compartments a significant number of protons gets visible because pH distances from proteins isoelectric - 108 - point, resulting that the T 2 of both decreases. This effect was extensively described by Panarese et al. (2012). Table 2.26. Nuclear magnetic properties of marinated and cooked chicken breast (n = 10/group). S = Salt (1% wt/wt); B05 – B50 = Salt (1% wt/wt) and Bicarbonate with increasing concentration from 0.05 to 0.5% (wt/wt). ** = P≤0.01; ns = not significant. a-c Means within a row followed by different superscript letters differ significantly (P≤0.05). When compared cooked and marinated samples it is clearly possible to observe the plasticizing effect of cooking on proteins, with the consequent visibility of new protons. Actually, although cooking decreases the amount of water inside meat, the total signal from cooked samples is still 1-1.5% higher than the corresponding marinated sample. Such observation is reinforced by the separately observation of intra and extra-myofibrillar spaces. The signal from the latest decreases after cooking in agreement with the observations of Bertram et al. (2008). Moreover, the correlation between intramyofibrillar protons pool signal and bicarbonate treatments shows a parabolic standard with a maximum for treatments B20-B40. In Table 2.27, it is shown the results from meat Aw and FW before and after tumbling as well as after cooking. Aw of non-marinated meat samples was 0.991, also found in our previous experiment, whereas FW was 0.637 g/g of fresh sample weight, meaning that in raw meat, around the 90% of the total water had enough mobility to freeze. As for raw samples marinated only with salt (S), they did not show significant differences for Aw or FW in non-marinated groups, as occurred also for samples marinated with salt and low sodium bicarbonate levels (B05, B10 and B20). In samples treated with higher sodium bicarbonate amounts in the marinade, a significant decrease of Aw was obtained, being also observed for B30, B40 and B50. Although this difference is very limited, the decrease observed could still positively influence products stability and its shelf-life. It is also important to underline that those samples presented significantly lower values of expressible moisture (Table 2.22), which according to Barbut (2002), expressible - 109 - moisture is mainly represented by water in extracellular spaces, in other words, it is the water fraction more correlated with Aw. Table 2.27. Water activity (Aw) and freezable water content (FW) of marinated and cooked chicken meat (n = 3/group) NM = non-marinated meat; S = Salt (1% wt/wt); B05 – B50 = Salt (1% wt/wt) and Bicarbonate with increasing concentration from 0.05 to 0.5% (wt/wt). ** = P≤0.01; * = P≤0.05; ns = not significant. a-b Means within a row followed by different superscript letters differ significantly (P≤0.05). Normally, the total moisture increases of enhanced samples is not correlated to an increase in Aw, even when it promotes its decrease at highest sodium bicarbonate levels. The concomitant increases of solute concentration with humectant action, protein solubilisation (that increases their capacity of binding water) as well as electrostatic interactions between actin and myosin and marinated ions, they can all be the main causes for detection of Aw reduction. In terms of FW, only samples from B50 showed low values when compared with the control. For all the other samples, no FW reduction has been noticed. According to Pearce et al. (2011), water in meat is arranged structurally between layers of cellular materials and in layers around polar molecules. Around 5% of the water in muscles tissues is in the form as true hydration water, bounded in proteins by macromelecular of multimolecular adsorption. However, this water is not free; it presents an ice-like structure (liquid crystal), is not freezing and is not free to participate in reactions. In this study, the results from FW showed that in control samples, the content of not freezing water was around 10% of the total amount and that the changes caused by the marination were practically unnoticed. After cooking, Aw values of different samples with the exception of B50, they did not show significant differences. B50 showed the lowest value (0.985). In this experiment, we observed that cooking promoted a reduction of FW, but no significant differences were noticed in all the samples. Finally, the results obtained for the texture profile analysis of cooked meat samples are presented in Table 2.28. We noticed that all traits were affected by the treatment. For hardness and chewiness, samples marinated with the solution containing only sodium chloride the results were similar to the non-marinated samples, in the meantime samples - 110 - treated with sodium bicarbonate presented lower hardness and chewiness. In general, samples marinated with bicarbonate showed higher cohesiveness, less gumminess and less springiness compared to control group and to un-marinated samples. Those results were also found in other studies (Sheard and Tali, 2010), which demonstrated that sodium bicarbonate was able to reduce shear force. Sheard and Tali (2010) also hypothesized that the tenderizing effect in pork was also because of the releasing of carbon dioxide during cooking, resulting in changes in the structure of meat. Table 2.28. Textural parameters of cooked chicken meat (n = 9/group). NM = non-marinated meat; S = Salt (1% wt/wt); B05 – B50 = Salt (1% wt/wt) and Bicarbonate with increasing concentration from 0.05 to 0.5% (wt/wt). *** = P≤0.001; * = P≤0.05. a-d Means within a row followed by different superscript letters differ significantly (P≤0.05). 2.2.3.5. Conclusions In conclusion, experiment 1 showed that sodium bicarbonate in combination with sodium chloride was able to guarantee at least the same water binding ability and quality traits of marinated poultry meat in respect to phosphates.. The combination containing all of the ingredients (sodium chloride, sodium trypoliphosphate and sodium bicarbonate) produced the highest marinade performances; however, sodium bicarbonate was able to guarantee a better marinade uptake and water retention ability with respect to that of sodium trypoliphosphate). According to low-field nuclear magnetic resonance, the combined use of sodium trypoliphosphate and sodium bicarbonate with sodium chloride determined a remarkable increase in proportion of entrapped water into the myofibrillar spaces, while the extramyofibrillar water fraction was not modified. By testing the effect of different sodium bicarbonate concentrations (experiment 2), it was possible to ascertain that the largest marinade uptake was observed in samples tumbled with 0.30% bicarbonate solution. Cooking losses showed a decreasing trend with the increase of bicarbonate level by estimating a 1.8% decrease for 0.10% of bicarbonate addition. Overall appearance of meat was not changed, while the use of sodium bicarbonate was able to improve meat texture by decreasing hardness and chewiness. By using low-field Nuclear Magnetic Resonance analysis, it was observed that water seemed to exert a plasticizing effect on some biopolymers, so that the total NMR signal fluctuations were not always proportional to the water adsorption. - 111 - Overall, it was proven that that sodium bicarbonate is a superior marinating agent and greater marination performances are obtained when using a concentration no higher than 0.3%, so it can be exploited to develop processed poultry products with no added phosphates to match the request to avoid the nutritional drawbacks recently indicated with the use of phosphates. - 112 - 2.2.4 The use of thyme and orange essential oils mixture to improve chicken meat quality 2.2.4.1. Introduction Consumers' acceptability of food strongly depends on the appearance, aroma and taste characteristics of the food. Because nowadays there are an increasingly high demand for more convenient foods as a consequence of the production of ready-to-eat food category, a special attention has been drag for this subject. Ready-to-eat food are usually prepared with ingredients containing unsaturated fatty acids (Brewer, 2011), which makes it very susceptible to oxidative quality deterioration especially under stress situations such as high temperature or exposition to light and metal during storage. The oxidation of the lips is known to be the main cause of food spoilage because of rancidity and organoleptic deterioration. As a solution to avoid this issue is the use of antioxidants. Spices and aromatics herbs are some examples that have been studied lately with positive results because of their ability to prevent oxidation and microbiological spoilage of the food. They represent a better possibility when compared to many other currently used synthetic antioxidants. Antioxidants' properties are linked with many other substances (vitamins, flavonoids, terpenoids, carotenoids, phytoestrogens, and minerals), but also on their natural antioxidant compound content (Suhaj, 2004). It has also been demonstrated that consumers prefer products with labels indicating no presence of artificial ingredients (Brewer, 2011), or containing organic or natural food ingredients and additives with familiar names known to have healthy properties (Joppen, 2006). Knowing this, many companies are adapting many of their steps of their production system in order to address better consumer's demands regarding to sustainable sources of meat and ingredients and also for products that respect the environment (Berger, 2009). Meat is usually very sensitive to lipid oxidation during refrigerated and frozen storage, because it contains high content of unsaturated fatty acids (Cavani et al., 2009, Barroeta, 2007). Polyunsaturated fatty acid esters easily suffer oxidation through oxygen molecules, known as auto-oxidation proceeded by a free radical chain mechanism (Brewer, 2011). In order to finalize those chain reactions, free radical scavengers can be used, such as thyme and orange essential oils. They are potential natural antioxidants that can be applied to poultry meat. Thymus vulgaris, Thymus mastichina, Thymus caespititius and Thymus camphorate all present very high antioxidant activities such as α-tocopherol and BHT (Miguel et al., 2004). Youdim et al. (2002) reported that essential oil antioxidant activity ranks in the following order: thyme oil, thymol, carvacrol, γ-terpinene, myrcene, - 113 - linalool, pcymene, limonene, 1,8-cineole, α-pinene. Essential oil of thyme presents many free radical-scavenging abilities which contrast lipid oxidation induced by both Fe2+/ascorbate and Fe2+/H2O2 (Bozin et al., 2006). Moreover, although thymol ranks as one of the most effective antioxidant essential oil, because of its aroma compounds, thyme extracts is prone to add unwanted flavours to foods (Brewer, 2011). Another interesting substance for the food industry derived from citrus by-products is an isolated containing functional compounds (fibre and polyphenols). It retards oxidative changes in food promoting increased quality and nutritional value (Fernandez-Lopez et al., 2007). The mixture of citrus oils are formed by hundreds of compounds and they can be classified in three fractions: terpene hydrocarbons, oxygenated compounds, and nonvolatile compounds. Citrus peels and seeds contain high levels of phenolic compounds, especially phenolic acids and flavanoids (Yusof et al., 1990). In general, plants that present high level of polyphenols are classified as very important natural antioxidants. In order to improve meat quality traits (tenderness and juiciness) and add flavour ingredients, meat marination has been used by processing industries of poultry. According to Smith and Acton (2001), in the US chicken breasts without bone and skin are usually vacuum tumbled because this mechanical tumbling action promotes marinade uptake and is capable of improving meat quality. In this way, the objective of this study was to analyze the effects of thyme and orange essential oils blend (1:1) on quality and sensorial characteristics of broiler meat and also the oxidative stability of lipids in raw and frozen meat stored at -18°C for 12 and 90 days. In order to pursue this objective, two different experiments were performed during this study. The first study was conducted during the abroad PhD research experience (Internship/exchange student) at the Department of Poultry Science of the North Carolina State University (Raleigh, North Carolina, USA) and it was aimed to assess quality traits and susceptibility to lipid oxidation of chicken meat marinated with thyme and orange essential oil mixture (Experiment 1). The second study was carried out at the Department of Agricultural and Food Sciences, University of Bologna (Cesena) in order to evaluate ,sensory traits of chicken meat marinated with thyme and orange essential oils mixture (Experiment 2). - 114 - 2.2.4.2. Materials and methods 2.2.4.2.1 Quality traits and susceptibility to lipid oxidation of chicken meat marinated with thyme and orange essential oil mixture (Experiment 1) A blend (1:1) of thyme and orange essential oils (EO) was used to treat chicken breasts (from 120 to 275 g without bone and skin) and whole wings (from 75 to 110 g) in two replications to evaluate effect on quality traits and susceptibility to lipid oxidation. For each replicate, 24 chicken breast and 24 whole wings were bought from a common grocery store. Raw breasts and wings were purchased with the same use-by date (3-4 days post mortem). They were divided into 2 groups (for each replication 12 samples/group) presenting homogeneous value of pH and lightness (L*). Breasts and wings were tumbled under vacuum to evaluate the effect of the essential oils mixture, using two different type of marinades (solution/meat ratio 10%): Group C (control) with 6% (wt/wt) of sodium chloride (NaCl) and 3% of a commercial blend of polyphosphates BRIFISOL® 512 (BK Giulini Corporation, Simi Valley, CA-USA); Group EO with 6% (wt/wt) of sodium chloride (NaCl) and 3% of a commercial blend of polyphosphates BRIFISOL® 512 (BK Giulini Corporation, Simi Valley, CA-USA) plus the addition of the essential oils blend (1:1) of thyme and orange in order to obtain a final concentration of 0.5% (v/v) in the marinade solution. Final concentration on products was of 0.55% sodium chloride and 0.28% polyphosphate for C group and 0.55% sodium chloride, 0.28% polyphosphate and 0.05% p/v EO blend for EO group. For both replications, the marinade temperature ranged from 3.7 to 10.8°C and marinade pH ranged from 7.06 to 7.28. In order to closely reproduce the typical industry performances, marinade pH was not adjusted. Marinade was separately added to breasts and wings, which were vacuum (78 kPa) marinated using a lab-scale tumbler (model MC-25, Inject Star of Americas Inc., Brookfield, CT) at 20 rpm for 20 minutes at room temperature. Beside marination, samples were analyzed for pH, colour (L*, a*, b*), moisture absorption (marinade uptake), purge loss, cooking yield and moisture content. The pH, colour, and moisture content were measured in both raw and cooked meat. After cooking, shear force (Warner-Bratzler, WB) was assessed. From each marinated sample (breast and wing) an aliquot of meat was withdrew and utilized for determine the susceptibility to lipid oxidation (TBARs) on marinated meat, then the remaining part was individually packed in a plastic bag and frozen at -18°C until the TBARs determination on the frozen meat (12 and 90 days). Analytical determination are summarized in Table 2.29. - 115 - 2.2.4.2.2 Sensory traits of chicken meat marinated with thyme and orange essential oils mixture (Experiment 2) Experiment 2 had the aim to study deeply the meat quality traits of the chicken meat marinated with thyme and orange essential oils (experiment 1) evaluating also the sensory traits. The same mixture (1:1) of thyme and orange essential oils (EO) used on experiment 1 was also utilized to treat 64 chicken breasts in order to evaluate the influence on quality and sensorial characteristics. The 64 breast samples tested in this research were obtained from the same flock of chicken (Ross 708) farmed under intensive condition and slaughtered in a commercial processing plant. Weight of fresh breasts ranged from 150 to 260 g. After carefully removing fat and visible connective tissue, they were separated in 2 different groups (32 samples/group) showing homogeneous pH and lightness (L*) values. Samples were treated trough vacuum tumbling in order to test the influence of the essential oils mixture, using two different type of marinade (solution/meat ratio 10%): Group C (control) with 6% (wt/wt) of sodium chloride (NaCl) and 3% tripolyphosphatetripolyphosphate. Group EO with 6% (wt/wt) of sodium chloride (NaCl) and 3% tripolyphosphatetripolyphosphate plus the addition of the essential oils blend (1:1) of thyme and orange in order to obtain a final concentration of 0.5% (v/v) in the marinade solution. Final concentration on marinated breasts was of 0.55% sodium chloride and 0.28% polyphosphate for C group and 0.55% sodium chloride, 0.28% polyphosphate and 0.05% p/v mixture of essential oils for EO group. Vacuum tumbling were performed using a lab-scale tumbler able to closely reproduce the industrial marination conditions. Samples were vacuum tumbled (92.5 kPa) at 4°C for 20 minutes at 20 rpm. Beside marination, samples were analyzed for pH, colour (L*, a*, b*), moisture absorption (marinade uptake), purge loss, cooking yield and moisture content. The pH, colour, and moisture content were measured in both raw and cooked meat. After cooking, shear force (Warner-Bratzler, WB) was evaluated. The remaining 40 samples were frozen at -18°C and subjected to sensory analysis (consumer tests), 20 immediately after the marinade and 20 after 90 days. Analytical determinations are summarized in Table 2.29. - 116 - Table 2.29. Analytical determinations to evaluate the meat quality traits Analytical Determinations Paragraph of material and methods pH Paragraph 2.1.2.1 Colour Paragraph 2.1.2.2 Marinade uptake Paragraph 2.1.2.3.2 Purge loss Paragraph 2.1.2.3.3 Cooking yield Paragraph 2.1.2.3.5 Shear force Paragraph 2.1.2.4.1 Moisture Paragraph 2.1.3.1 Thiobarbituric acid reactive substances (TBARs) analysis Paragraph 2.1.3.6.1 Consumer test Paragraph 2.1.4.4 2.2.4.3. Statistical analysis The outcomes obtained from the experiment 1 were analyzed with two way ANOVA option using the GLM process of SAS software (GLM, SAS ® software, SAS Institute, 2000). The model evaluated the main effects of marination treatment solution (C and EO), replication, and the interaction term; interactions effect were not significant. It was used a significance level of P<0.05. The result obtained from the experiment 2 were subjected to ANOVA with a single criterion of classification (GLM/SAS) to assess the effect of the essential oils of thyme and orange on quality and sensorial characteristics of marinated chicken breast. 2.2.4.4. Results and discussion Tables 2.30 and 2.31 present the effects of thyme and orange essential oil blend (EO) on chicken breasts and wings quality traits respectively evaluated during the experiment 1. Whereas the data of the breast quality assessed during the experiment 2 are not reported in this thesis, because they generally shoved the same results of the experiment Because little information is available in the literature about the effects of essential oils and natural antioxidants added to chicken meat through marinade in regard to quality characteristics and lipid oxidation, the results from this study were compared with numerous previous experiments that also analyzed the effects of essential oils and natural antioxidants, but on different types of meat and meat products. The appearance and thus the colour is the first aspect that influences consumer’s decision when they are purchasing meat. Colour suffers strong interference from pH which changes its values along all the meat chain production, being important for the meat quality characteristics. Poultry meat colour and pH significantly affect the marinade performance - 117 - and water holding capacity (Petracci et al., 2004; Barbut et al., 2005). Therefore, this study analyzed those parameters in order to evaluate if EO could affect any of them. Non-marinated EO-breast did not show significant difference in lightness (L*) when compared with C samples and this means that there is no matrix difference effect on treatment (no DFD or PSE-like meat was used). Furthermore, after the tumbling treatment, no differences were found between EO and C groups (lightness, L*; redness, a*; yellowness, b*), with the exception of lower EO redness values for cooked (2.18 vs. 2.64, respectively; P ≤ 0.01). On the other hand, a redder skin colour (P ≤ 0.01) of non-marinated EO-wings was observed (2.85 vs. 2.27). Marinated EO wings did not presented significant differences for lightness, but they had higher redness (3.69 vs. 2.50) and yellowness (11.95 vs. 9.41). The redness values may have been affected by the a* index before marination and concerning the yellowness values (b*) the divergence may be due to the effect of the light yellow colour conferred by essential oils. Wings after cooking did not present differences in colour, rather in EO or C samples. Non-marinated meat pH values were the same for both EO and C samples (breast and wing). The relevance of these outcomes is to testimony that the meat from both groups (EO and C) presented the same inherent characteristics before be marinated, thus the marinated meat were not affected. In addition, EO-meat after vacuum tumbling and after cooking (breast and wing) did not show any difference when compared with the control. A previous research on bologna sausages reported no differences of pH or colour between meat formulas with or without citrus waste water and/or essential oils (Viuda-Martos et al., 2009). Also Mohamed and Mansour (2012) did not discover considerable changes of beef patty formula pH values due to the adding of natural herbal extracts. Another research demonstrated that turkey thighs pH processed with aqueous extract of rosemary, sage and thyme was not influenced by the marinade (Mielnik et al., 2008). Cooking yield and marinate uptake (amount of marinade absorbed by the samples during the tumbling) were not affected by marination. EO-samples (breast and wing) presented a remarkable lower purge loss values then C-samples (0.85 vs 1.29%, and 2.45 vs 4.57%, for breasts and wings respectively). Mielnik et al. (2008) proved that adding aqueous extracts of rosemary, sage and thyme to marinated turkey legs, did not affect purge loss or cooking loss. A different type of research was carried out to feed broilers with a mixture of oregano (Origanum vulgare), thyme (Thymus vulgaris) and cinnamon (Cinnamomum sp.); meat obtained from the treated birds did not present difference purge loss when compared with the control meat (Bobko et al., 2012). The diverse outcomes for purge and cooking loss observed in the current study were probably due to diverse species (chicken vs turkey) and different EO application (feeding vs marination) from the preceding researches. - 118 - The Warner Bratzler (WB) shear force values were the same between EO and Cbreast samples (Table 2.30). In contrast EO-wings were less tough than C-wings (2.4 vs 2.9 kg, respectively; Table 2.31). Table 2.30. Quality characteristics of chicken breast (Pectoralis major) marinated without (C) or with essential oils (EO) (n=24/group). Traits C mean sem EO mean sem P-value L* a* b* 54.68 0.49 1.78 0.22 11.96 0.57 54.48 0.56 1.88 0.24 13.19 0.43 ns ns ns - marinated meat L* a* b* 50.61 0.41 1.80 0.18 11.00 0.41 50.57 0.45 1.79 0.16 11.97 0.36 ns ns ns - cooked meat L* a* b* 79.25 0.27 2.64 0.12 17.04 0.43 79.35 0.28 2.18 0.13 17.29 0.30 ns ** ns pH - raw meat - marinated meat - cooked meat 5.92 0.02 6.26 0.02 6.27 0.01 5.92 0.02 6.24 0.04 6.30 0.02 ns ns ns Marinade uptake (%) 8.71 0.53 8.42 0.47 ns Purge loss (%) 1.29 0.09 0.85 0.05 *** 78.15 0.54 76.64 0.63 ns 1.43 0.06 1.57 0.06 ns Moisture (%) - raw meat 75.44 0.40 75.42 0.28 - marinated meat 77.10 0.36 76.81 0.35 - cooked meat 70.56 0.23 70.80 0.25 ns = not significant; **P ≤ 0.01; ***P ≤ 0.001. ns ns ns Colour - raw meat Cooking yield (%) WB shear force (kg) Breast and wing samples WB values observed in the present study were inferior than the upper limit for very tender meat reported by Lyon and Lyon (1991), which correspond at 3.6 kg. Wing meat shear force has not normally been evaluated trough WB, thus no study was found to straightly compare these results to preceding research. Somewhat dissimilar meat products have been evaluated for the influence of essential oils on objective texture. Mohamed and Mansour (2012) did not show any differences in juiciness or firmness detected on beef burger formulas made with natural antioxidants. Another study demonstrated that essential oils did not influence bologna sausage texture (Viuda-Martos et al., 2009). It was not possible directly compare these results to the current research, because differences in animal species and product forms (whole muscle vs ground meat). - 119 - Non-marinated, marinated and cooked EO-breasts and wings presented no difference in moisture percentage when compared with the C-ones (Tables 30 and 31). These result are in agreement with privies studies that did not shoved significant difference of moisture content on patties made with a mixture of beef and mechanically deboned poultry meats (Mohamed and Mansour, 2012). In contrast, Viuda-Martos et al. (2009) found less moisture content in sausage formulas made with citrus waste water, thyme and oregano essential oil then in the control, but this finding may have been caused by some soluble elements contained in the citrus waste water. Table 2.31. Quality traits of broiler wings marinated without (C) or with essential oils (EO) (n=24/group). Traits Colour - raw wing skin C mean sem EO mean sem P-value L* a* b* 74.71 0.31 74.57 0.27 2.27 0.41 2.85 0.57 9.61 0.63 10.15 0.35 ns * ns - marinated wing skin L* a* b* 74.25 0.27 75.00 0.35 2.50 0.43 3.69 0.61 9.41 0.67 11.95 0.50 ns *** *** - cooked wing skin L* a* b* 66.05 0.51 67.26 0.38 1.09 0.39 0.80 0.47 26.25 0.89 25.28 0.82 ns ns ns pH - raw meat - marinated meat - cooked meat 6.45 6.68 6.66 0.02 0.03 0.01 6.45 6.69 6.68 0.02 0.02 0.01 ns ns ns Marinade uptake (%) 7.48 0.21 7.74 0.40 ns Purge loss (%) 4.57 0.31 2.45 0.10 *** Cooking yield (%) 94.05 0.27 93.50 0.16 ns WB shear force (kg) 2.94 0.21 * Moisture (%) 74.70 0.42 74.49 0.44 - raw meat 77.26 0.39 77.05 0.52 - marinated meat 75.14 0.46 75.10 0.28 - cooked meat ns = not significant; *P ≤ 0.05; ***P ≤ 0.001. ns ns ns 0.24 2.42 TBARS analysis was performed only in the experiment 1. The susceptibility to lipid oxidation on both EO and C samples (breast and wing fresh or frozen for 12 or 90 d at 18°C), is reported in Tables 2.32 and 2.33, respectively. Samples treated with essential oils presented lower lipid oxidation susceptibility then the control for all the duration of the induced oxidation time intervals. - 120 - Table 2.32. Susceptibility to lipid oxidation (determined by TBARS analysis and expressed in nmoles of MDA per mg of protein) of fresh and frozen broiler breast meat (Pectoralis major) marinated without (C) or with essential oils (EO) (n=24/group). Time (min) C mean sem EO mean sem P-value 0.380 0.542 0.743 0.933 1.056 1.204 0.038 0.064 0.070 0.078 0.079 0.082 0.279 0.286 0.377 0.414 0.482 0.587 0.014 0.017 0.025 0.035 0.045 0.072 ** *** *** *** *** *** Frozen meat stored for 12 days 0 0.379 0.019 30 0.617 0.038 60 0.831 0.048 90 1.034 0.053 120 1.185 0.056 150 1.373 0.074 0.230 0.306 0.399 0.477 0.590 0.688 0.012 0.014 0.021 0.026 0.047 0.057 *** *** *** *** *** *** 0.304 0.413 0.508 0.607 0.695 0.792 0.014 0.020 0.019 0.020 0.028 0.034 *** *** *** *** *** *** Raw meat 0 30 60 90 120 150 Frozen meat stored for 90 days 0 0.604 0.057 30 1.110 0.124 60 1.451 0.141 90 1.675 0.157 120 1.841 0.154 150 2.013 0.145 **P ≤ 0.01; ***P ≤ 0.001. Table 2.33. Susceptibility to lipid oxidation (determined by TBARS analysis and expressed in nmoles of MDA per mg of protein) of fresh and frozen broiler wing marinated without (C) or with essential oils (EO) (n=24/group). Time (min) C mean sem EO mean sem P-value Raw meat 0 30 60 90 120 150 0.320 0.428 0.532 0.593 0.685 0.778 0.025 0.038 0.049 0.060 0.072 0.080 0.236 0.272 0.311 0.351 0.390 0.453 0.012 0.013 0.014 0.020 0.021 0.034 *** *** *** *** *** *** Frozen meat stored for 12 days 0 0.501 0.060 30 0.757 0.126 60 0.930 0.154 90 1.086 0.171 120 1.173 0.188 150 1.242 0.185 0.240 0.301 0.356 0.401 0.459 0.500 0.011 0.012 0.021 0.028 0.038 0.048 *** *** *** *** *** *** 0.278 0.523 0.642 0.744 0.842 0.870 0.025 0.067 0.085 0.102 0.121 0.121 *** *** *** *** *** *** Frozen meat stored for 90 days 0 0.495 0.059 30 0.874 0.135 60 1.060 0.154 90 1.244 0.170 120 1.377 0.185 150 1.494 0.197 ***P ≤ 0.001. - 121 - As should be expected fresh and 12 d frozen breast meat showed lower values of TBARS than the 90 d frozen breast meat. Also, the TBARS values collected in the current research were greatly inferior than the TBARS level attributed to the limiting threshold for acceptability of rancidity in beef and in lamb meats, respectively 1.00 (Ripoll et al., 2011) and 2.28 (Campo et al., 2006) mg MDA/kg of sample. These values continue to be lower even if the values in this research were presented as nanomols of MDA/mg of protein. Previous studies have reported that the addition of natural antioxidants to turkey, beef, pork, and fish reduced the oxidation level (Mielnik et al., 2008; Mielnik et al., 2003; Nam and Ahn, 2003; Formanek et al., 2001; Tang et al., 2001). Other natural compounds having antioxidant activity also alleviate oxidation in lamb and ground beef (McKenna et al., 2003; Mohamed et al., 2011). Several essential oils have been utilized to alleviate oxidations and TBARS values in bologna and beef patties made with or without mechanically deboned poultry meat (Viuda-Martos et al., 2009; Mohamed and Mansour, 2012). The peroxidation level on chicken meat kept at 4°C for three weeks was reduced trough the use of balm and thyme essential oils (Fratianni et al., 2010). Sensorial analysis were performed in the experiment 2. Overall, the un-trained assessors did not recognize any significant differences of sensorial characteristics between EO and C breast meat in both consumer tests performed at time 0 and after 90 days of storage at -18°C (Figures 2.15 and 2.16). Ad exclusion of the odour which was higher in 90 days stored OE-meat (3.96 vs. 3.54 , P ≤ 0.05). Figure 2.15. Sensory traits (Odour, Flavour and Overall acceptability) of frozen broiler breast (Pectoralis major) marinated without (C) or with essential oils (EO) (50 panellists). Ns = not significant - 122 - Figure 2.16. Sensory traits (Odour, Flavour and Overall acceptability) of frozen broiler breast (Pectoralis major) marinated without (C) or with essential oils (EO) stored for 90 days (50 panellists). *= P>0.05;Ns = not significant These results are in agreement with Mielnick et al. (2008) who found no difference in odour and flavour of turkey leg treated with thyme. Also Mohamed Mansour (2012) did not observe any significant difference on the flavour and overall acceptability. Also Mohamed and Mansour (2012) did not observe any significant difference in flavor and overall acceptability of beef meatballs treated with rosemary and marjoram essential oils, frozen and stored for 0 and 90 days. In agreement with our study the use of Quillaja saponaria extract on chicken meat has also shown an increased aroma attractiveness than the control group, while no significant differences of overall acceptability and flavour were observed (Fellenberg et al., 2011). The untrained panel did not find significant differences of meat rancidity after 90 days of storage. In addition, it should be emphasized that values close to 1 proved to the almost absence of perceptible development of unpleasant odours and flavours associated to rancidity (Figure 2.17). This result agrees with the low TBARS values detected on phase 1. Furthermore, comparing the results obtained at 0 and 90 days, we can say that the retention time did not impact negatively on other descriptors considered (pleasantness of the odour, pleasantness of taste and overall acceptability) who have similar values in the 2 tasting sessions. In contrast, Mielnick et al. (2008) showed significant differences of rancidity values of cooked turkey leg meat marinated with extracts of thyme after 5 days of storage at 4°C. This can be due to the fact that in the study of Mielnick et al. (2008) the meat has been cooked and this has supposedly led to a greater degree of lipids oxidations. - 123 - Figure 2.17. Rancidity of frozen broiler breast (Pectoralis major) marinated without (C) or with essential oils (EO) stored for 90 days (50 panelists). Ns = not significant 2.2.4.5. Conclusions In conclusion, fresh and frozen chicken meat (12 and 90 d) treated by tumbling with thyme and orange essential oil mixture showed inferior lipid susceptibility to oxidation (TBARS values) on both breast and wing samples. Data also reported that the blend of essential oils did not influence colour, pH, marinade uptake, cook yield and moisture content. Furthermore, sensorial analysis (consumer test) did not show any differences between the two experimental groups. Odour, flavour rancidity and overall acceptability in both T0 and T90 presented no significant differences. An only exception was noticed in the odour in T90 breast marinated with EO, that presented higher score level. Moreover it is possible to affirm that storage time did not affect negatively other descriptor, which showed very similar results if compared with T0. In conclusion, EO had a positive effect on broiler breast and wing lipid oxidation without negatively affecting technological quality and sensory traits of the meat. - 124 - 2.3 Overall conclusions During the last years, the changes occurred in consumer’s lifestyle in developed countries have led to dramatic shift in consumer preference toward processed and further processed products (“convenient food” or easy to prepare). Moreover, consumers are more interested to nutritional characteristics (low fat and cholesterol content, and optimal PUFA’s n-6 to n-3 ratio), but also to sensory properties of meat because of the growing hedonistic trend in food consumption. Beside the qualitative attributes, today more than in past, consumers wish to have further information about the origin and method of production of meat based food. In this context, studies that have been carried out during the PhD programme contributed to increase the scientific knowledge concerning the influence of some farming and processing factors on the quality characteristics of poultry meat in order to better exploit its intrinsic characteristics and reinforce its good healthy profile as perceived by the consumers. 2.3.1 Farming factors Poultry production systems have been affected by the preferences of customers in the few years. They have been more sensible to the ethical and cultural sides of meat production and products. Moreover, animal-friendly production systems could improve animal welfare and guarantee an elevated qualitative standards relating to food safety, nutritional, and sensory characteristics. Studies have been carried out during this PhD programme has demonstrated significant and interesting results on the quality of products yield from free-range farming system. The main results showed that free range farming system improved water holding capacity and oxidative shelf-life of the meat. In addition, carcass morphology has changed (more percentage of legs and less of breast than the conventional carcass). In another hand, even leg meat from free range birds was less tender with more collagen, but there was no relevant differences in tenderness when evaluated by consumer test, and the overall acceptability of free range breast was even better when compared with conventional one. In conclusion, free range products present some extrinsic characteristics, which are able to differentiate when compared with conventional ones. This distinctiveness could be well identified by both sellers and customers, allowing the possibility to achieve several market segments (large scale retailers, small butcheries, food store, catering, etc.). - 125 - 2.3.2 Processing factors Poultry meat industry usually includes different level of sodium chloride (1-1.6%) and phosphate (0.2-0.4%) to improve the technological and sensorial properties of processed meat products. In the last few decades, the consumption of numerous processed foods that contain high level of sodium has been raised. For this reason the dietary sodium intake is currently considered to be a potential health hazard. Recently, there are also some nutritional concerns about the use of phosphate. As a consequence, meat processors have developed innovative plans which aim to drastically reduce the contents of sodium chloride and phosphates. During PhD programme, some studies were used to evaluate the possibility to reduce the sodium content and to replace sodium polyphosphates with sodium bicarbonate in marinated meat. Overall results showed that there were several limitations to reduce sodium chloride usage in meat products, because sodium chloride has a vital role in improving both technological and organoleptic aspects. In fact, different formulations or salt/phosphates combinations that were used in our study showed that it was not possible to add less than 1.2% of NaCl without impairing the technological and sensorial traits. Even phosphates can be used as partial replacers of sodium chloride; however its use is also concerned because of bad consumer perception towards this type of additive. Therefore, a part of PhD programme was dedicated to evaluate the use of sodium bicarbonate as phosphate replacer in poultry meat formulations. It has been demonstrated that inclusion of 0.3% of sodium bicarbonate in combination with 1% of sodium chloride improved significantly the water holding capacity and the performance of marination of the meat in comparison to phosphate combinations. According to these results, phosphate free processed poultry products can be produced which can impart an added value by eliminating nutritional drawbacks that resulted by the use of phosphates. Additionally, it was also tested the use of natural antioxidants in order to improve lipid stability of marinated poultry meat. It has been found that chicken meat treated by tumbling with thyme and orange essential oil mixture showed inferior lipid susceptibility to oxidation (TBARS values) without negatively influence product quality and sensorial properties on both breast and wing samples. - 126 - REFERENCES A.O.A.C. Official Methods of Analysis (1990) – 15th Ed. Association of Official Analytical Chemists, pp. 147-152; 931, Washington, DC, USA. A.O.A.C. Official methods of analysis (1995) – Association of Official Analytical Chemists, Washington, DC, USA. Aalhus J.L. and Dugan M.E.R. (2004) – Oxidative and Enzymatic, 1330-1336. In: Encyclopedia of Meat Sciences. Edited by W.K. Jensen, C. Devine and M. Dikeman, Elsevier Ltd. Oxford, UK. Ahn D.U., Nam K.C and Lee E.J. (2009) – Lipid Oxidation and Flavor, 227-246. In: Applied Muscle Biology and Meat Science. Edited by M. Du and R. J. McCormick, CRC Press, New York. Ahn D.U. (2002) – Production of volatiles from amino acid homopolymers by irradiation. Journal of Food Science 67,419-426. Ahn D.U. and Lee E.J. (2002) – Production of off-odor volatiles from liposome-containing amino acid homopolymers by irradiation. Journal of Food Science 67,2659-2665. Ahn D.U., Jo C. and Olson D.G. (2000) – Analysis of volatile components and the sensory characteristics of irradiated raw pork. Meat Science 54,209-215. Ahn D.U., Olson D.G., Jo C., Chen X., Wu C. and Lee J.I. (1998) – Effect of muscle type, packaging, and irradiation on lipid oxidation, volatile production, and color in raw pork patties. Meat Science 47,27-39. Ahn D.U., Olson D.G., Jo C., Love J. and Jin S.K. (1999) – Volatiles production and lipid oxidation of irradiated cooked sausage with different fat content and packaging during storage. Meat Science 51,355-361. Albarracìn W., Sànchez I.C., Grau R. and Barat J.M. (2011) – Salt in food processing; usage and reduction: a review. International Journal of Food Science and Technology, 46,1329-1336. Aliani M. and Farmer L.J. (2005) – Precursors of chicken flavour II: Identification of key flavor precursors using sensory methods. Journal of Agricultural and Food Chemistry 53,6455-6462. Allen C.D., Fletcher D.L., Northcutt J.K., and Russell S.M. (1996) – The relationship of broiler breast color to meat quality and shelf-life. Poult. Sci., 77,361-366. Allen C.D., Russell S.M., and Fletcher D.L. (1997) – The relationship of broiler breast meat color and pH to shelf-life and odor development. Poult. Sci. 76,1042-1046. Alvarado C.Z. and McKee S. (2007) – Marination to improve functional properties and safety of poultry meat. Journal of Applied Poultry Research, 16,113-120. Alvarado C.Z., and Sams A.R. (2003) – Injection marination strategies for remediation of pale, exudative broiler breast meat. Poult. Sci, 82,1332-1336. An J.Y.,. Zheng J.X, Li J.Y., Zeng D., Qu L.J., Xu G.Y., and Yang N. (2010) – Effect of myofiber characteristics and thickness of perymisium and endomysium on meat tenderness of chickens. Poult. Sci. 89,1750-1754. Aughey E. and. Frye F.L (2001) – Muscle, 65-70. In: Comparative Veterinary Histology with Clinical Correlates. Manson Publishing, London, UK. - 127 - Barbut S. (2002a) – Meat color and Flavor, 429-465. In: Poultry products processing. An industry guide. CRC Press, New York. Barbut S. (2002b) – Basic anatomy and muscle biology, 31-60. In: Poultry products processing, an industry guide. CRC PRESS, Boca Raton, Florida. Barbut S. (2002c) – Measuring sensory and functional properties, 467-511. In: Poultry products processing. An industry guide. CRC Press, New York. Barbut S., Sosnicki A.A., Lonergan S.M., Knapp T., Ciobanu D.C., Gatcliffe L.J., HuffLonergan E., and Wilson E.W. (2008) – Progress in reducing the pale, soft and exudative PSE. problem in pork and poultry meat. Meat Sci., 79,46-63. Barbut S., Zhang L., and Marcone M. (2005) – Effects of pale, normal, and dark chicken breast meat on microstructure, extractable proteins, and cooking of marinated fillets. Poult. Sci. 84,797-802. Barroeta A.C. (2007) – Nutritive value of poultry meat: relationship between vitamin E and PUFA. World’s Poult. Sci. J. 63,277-284 Berge P., Ertbjerg P., Larsen L. M., Astruc T., Vignon, X. and Mùller, A.J. (2001) – Tenderization of beef by lactic acid injected at different times post mortem. Meat Science, 57,347-357. Berger R.G. (2009) – Biotechnology of flavours-the next generation. Biotech. Let. 31,1651-1659. Berri C., Le Bihan-Duval E., Debut M., Santé-Lhoutellier V., Baéza E., Gigaud V., Jégo Y., and Duclos M.J. (2007) – Consequence of muscle hypertrophy on characteristics of Pectoralis major muscle and breast meat quality of broiler chickens. J. Anim. Sci. 85,20052011. Bertram H.C., Purslow P.P. and Andersen H.J. (2002) – Relationship between meat structure, water mobility, and distribution: a low-field nuclear magnetic resonance study. Journal of Agriculture and Food Chemistry, 50,824-829. Bertram H.C., Rikke L.M., Zhiyun W., Xingfei Z. and Henrik J.A. (2008) – Water distribution and microstructure in enhanced pork. Journal of Agric. and Food Chem., 56,7201-7207. Betti M., Perez T.I., Zuidhof M.J., and Renema R.A. (2009a) – Omega-3-enriched broiler meat: 3. Fatty acid distribution between triacylglycerol and phospholipid classes. Poult. Sci. 88,1740-1754. Betti M., Schneider B.L., Wismer W.V., Carney V.L., Zuidhof M.J., and Renema R.A. (2009b). Omega-3-enriched broiler meat: 2. Functional properties, oxidative stability, and consumer acceptance. Poult. Sci. 88,1085-1095. Bianchi M., Capozzi F., Cremonini M.A., Laghi L., Petracci M., Placucci G. and Cavani C. (2004) – Influence of the season on the relationships between NMR transverserelaxation and WHC in turkey breast. Journal of Science Food Agriculture, 84,1535-1540. Bianchi M., Petracci M., Sirri F., Folegatti E., Franchini A., and Meluzzi A. (2007) – The influence of the season and market class of broiler chickens on breast meat quality traits. Poult. Sci. 86,959-963. Blank I., Lin J., Vera F.A. Welti D.H. and Fay L.B. (2001) – Identification of potent odorants formed by autoxidation of arachidonic acid: Structure elucidation and synthesis of (E,Z,Z)-2,4,7- tridecatrienal. Journal of Agricultural and Food Chemistry 49,2959-2965. - 128 - Bobko M., Haščík P., Bobková A., Kňazovická V., Tóth T., and Angelovičová M. (2012) – Influence of different plant supplements applied in chicken nutrition on quality of their meat. J. Microbiol. Biotechnol. Food Sci. 1,1020-1031. Bogosavljevic-Boskovic S., Mitrovic S., Djokovic R., Doskovic V., and Djermano V. (2010) – Chemical composition of chicken meat produced in extensive indoor and free range rearing systems. Afr. J. Biotechnol. 9,9069-9075. Bolumar T., Enneking M., Toepfl S. and Heinz V. (2013) – New developments in shockwave technology intended for meat tenderization: Opportunities and challenges. A review. Meat Science 95:931-939. Borgia G.C., Brown R.J.S. and Fantazzini P. (1998) – Uniform-penalty inversion of multiexponential decay data. Journal of Magnetic Resonance, 132,65-77. Boselli, E., V. Velazco, M. F. Caboni, and G. Lercker (2001) – Pressurized liquid extraction of lipids for the determination of oxysterols in egg-containing food. J. Chromatogr. A, 917:239-244. Bou R., Codony R., Tres A., Decker E.A., and Guardiola F. (2009) – Dietary strategies to improve nutritional value, oxidative stability and sensory properties of poultry products. Crit. Rev. Food Sci. 49,800-822 Bozin B., Mimica-Dukic N., Simin N., and Anackov G. (2006) – Characterization of the volatile composition of essential oils of some Lamiaceae spices and the antimicrobial and antioxidant activities of the entire oils. J. Agric. Food Chem. 54,1822-1828. Brake N.C. and Fennema O.R. (1999) – Glass transition values of muscle tissue. Journal of Food Science, 64,10-15. Brewer M.S. (2004) – Water-Holding Capacity, 238-242. In: Encyclopedia of Meat Sciences. Edited by W.K. Jensen, C. Devine and M. Dikeman, Elsevier Ltd. Oxford, UK. Brewer M.S. (2011) – Natural antioxidants: sources, compounds, mechanisms of action, and potential applications. Compr. Rev. Food Sci. F. 10,22-–247. Brooks C. (2007) – Marinating of beef for enhancement. Beef facts — Product enhancement. : Research Knowledge Management, National Cattlemen Beef Association (Available at: http://www.beefresearch.org/CMDocs/BeefResearch/Marinating%20of %20 Beef%20for%20Enhancement.pdf. Accessed 21/01/2012) C.I.E. (1976) – Recommendations on uniform color spaces, color differences, equations. Psychometric color terms. Supplement 2 to CIE Publication 15. Commission Internationale de l’Eclairage, Colorimetry, Paris, France. C.I.E. (1978) – International Commission on Illumination, Recommendations on uniform color space difference equations, Psychrometric color terms. C.I.E. publication, 15 (E-1. 3. 1) 1971/ (TO-1. 3) Paris. Calkins C.R. and Hodgen J.M. (2007) – A fresh look at meat flavour. Meat Science 77,6380. Campo M.M., Nute G.R., Hughes S.I., Enser M., Wood J.D., and Richardson R.I. (2006) – Flavour perception of oxidation in beef. Meat Sci.72,303-311. Capitani D., Mensitieri G., Porro F., Proietti N., and Segre A.L. (2003) – NMR and calorimetric investigation of water in a superabsorbing crosslinked network based on cellulose derivatives. Polymer (Guildf.) 44,6589-6598. - 129 - Castellini C., Berri C., Le Bihan-Duval E., and Martino G. (2008) – Qualitative attributes and consumer perception of organic and free-range poultry meat. World’s Poult. Sci. J. 64,500-512. Castellini C., Dal Bosco A., Mugnai C., and Pedrazzoli M. (2006) – Comparison of two chicken genotypes organically reared: oxidative stability and other qualitative traits of the meat. Ital. J. Anim. Sci. 5,355-368. Castellini C., Mugnai C., and Dal Bosco A. (2002) – Effect of organic production system on broiler carcass and meat quality. Meat Sci. 60,219-225. Castigliego L., Armani A., and Guidi A. (2012) – Meat color, 81-107. In: Handbook of Meat and Meat Processing, Second Editedion. Edited by Y.H. Hui, CRC Press, New York. Cavani C., Petracci M., Trocino A., and Xiccato G. (2009) – Advances in research on poultry and rabbit meat quality. Ital. J. Anim. Sci. 8,741-750 Chen X., Jiang W., Tan H.Z., Xu G.F., Zhang X.B., Wei S., and Wang X.Q. (2013) – Effects of outdoor access on growth performance, carcass composition, and meat characteristics of broiler chickens. Poult. Sci. 92,435-443 Cheng Q. and Sun D.W. (2008) – Factors affecting the water holding capacity of red meat products: a review of recent research advances. Critical Reviews in Food Science and Nutrition, 48,137-159. Chikuni K., Sasaki K., Emori T., Iwaki F., Tani F., Nakajima I., Muroya S. and Mitsumoto M. (2002) – Effect of cooking on the taste- and flavor-related compounds in pork. Japanese Journal of Swine Science 39,191-199. Chirife J., and Fontan C.F. (1982) – Water activity of fresh foods. J. Food Sci. 47,61-663. Choi Y.M. and Kim B.C. (2009) – Muscle fiber characteristics, myofibrillar protein isoforms, and meat quality. Livestock Science 122,105-118. Claflin A.E., Keeton J.T., and Benli H. (2008) – Carbohydrates, 263–277. In: Handbook of Muscle Foods Analysis. Edited by L.M.L . Nollet and F. Toldr, CRC Press, New York. Colmenero F.J. (2002) – Muscle protein gelation by combined use of high pressure/temperature, Trends in Food Science & Technology, 13,22–30. Cornforth D.P. and Jayasingh P. (2004) – Colour and Pigment, 249-256. In: Encyclopedia of Meat Sciences. Edited by W.K. Jensen, C. Devine and M. Dikeman, Elsevier Ltd. Oxford, UK. Cornillon P. (2000.) – Characterization of osmotic dehydrated apple by NMR and DSC. Lebensm-Wissu. Technol. 33,261-267. Cortinas L., Villaverde C., Galobart J., Baucells M., Codony R. and Barroeta A.C. (2004) – Fatty acid content in chicken thigh and breast as affected by dietary polyunsaturation level. Poult. Sci. 83,1155-1164. Cortinas L.,. Barroeta A.C., Villaverde C., Galobart J., Guardiola F., and Baucells M.D. (2005) – Influence of the dietary polyunsaturation level on chicken meat quality: lipid oxidation. Poult. Sci. 84,48-55. Davenel A., Schuck P., Mariette F. and Brulé G. (2002) – NMR relaxometry as a noninvasive tool to characterize milk powders. Dairy Science and Technology, 82,465-473. De Campos R.M. L., Terra N.N., and. Campagnol P.C.B (2008) – Sensory Aspects of Cooked Meats 549–560. In: Handbook of Muscle Foods Analysis. Edited by L.M.L. Nollet and F. Toldrà, CRC Press, New York. - 130 - Delgado C.L. (2003) – Rising consumption of meat and milk in developing countries has created a new food revolution. Journal of Nutrition, 133,3907S-3910S. Desmond E. (2006) – Reducing salt: A challenge for the meat industry. Meat Science, 74,188-196. Devine C.E. (2004) – Ageing, 330-338. In: Encyclopedia of Meat Sciences. Edited by W.K. Jensen, C. Devine and M. Dikeman, Elsevier Ltd. Oxford, UK. Doyle M. and Glass K.A. (2010) – Sodium reduction and its effect on food safety, food quality, and human health. Comprehensive Reviews in Food Science and Food Safety, 9,44-56. Du M., and Ahn D.U. (2002) – Effect of dietary conjugated linoleic acid on the growth rate of live birds and on the abdominal fat content and quality of broiler meat. Poult. Sci. 81,428-433. Esterbauer, H. (1993) – Cytotoxicity and genotoxicity of lipid-oxidation products. Am. J. Clin. Nutr. 57,779-786. European Commission (2002) – Allegate X. B. regulation L128/14. Off. J. Eur. Comm., May 15th 2002. Fanatico A.C., Cavitt L.C., Pillai P.B., Emmert J.L., and Owens C.M. (2005) – Evaluation of slow-growing broiler genotypes grown with and without outdoor access: Meat quality. Poult. Sci. 84,1785-1790. Fanatico A.C., Pillai P.B., Emmert J.L., and Owens C.M. (2007) – Meat quality of slowand fast growing chicken genotypes fed low-nutrient or standard diets and raised indoors or with outdoor access. Poult. Sci. 86,2245-2255. Fanatico A.C., Pillai P.B., Hester P.Y., Falcone C., Mench J.A., Owens C.M., and Emmert J.L. (2008) – Performance, livability, and carcass yield of slow- and fast-growing chicken genotypes fed low-nutrient or standard diets and raised indoors or with outdoor access. Poult. Sci. 87,1012-1021. Farmer L.J. (1999) – Poultry meat flavor, 127-159. In: Poultry meat science symposium. Edited by R.I. Richardson, and G.C. Mead. CABI Publ., Oxfordshire, UK. Feiner G. (2006) – Meat products handbook - Practical science and technology. Woodhead Publishing Limited. Cambridge. England. Fellenberg M.A., Espinoza A., Peña I., Alarcón J. (2011) – Antioxidant and Bacteriostatic Effects of the Addition of Extract of Quillay Polyphenols (Quillaja saponaria) in the Marinade of Broiler Chickens. Brazilian Journal of Poultry Science, 13,71-79. Fernandez-Lopez J., Viuda-Martos M., Sendra E., Sayas-Barbera E., Navarro C., and Perez-Alvarez J.A. (2007) – Orange fibre as potential functional ingredient for dry-cured sausages. Eur. Food Res. Technol. 226:1-6. Fieser L.F., and Fieser. M. (1967) – Reagents for Organic Chemistry. John Wiley & Sons Inc. New York. 191-192. Fleiss J. (2003) – Statistical methods for rates and proportions. Wiley, USA. Fletcher D.L. (2002) – Poultry meat quality. World’s Poult. Sci. J. 58,131-145. Fletcher D.L. (2004) – Further processing of poultry,108-134. In: Poultry Meat Processing and Quality edited by Mead G.C. CRC Press, Boca Raton, Florida, USA. Folch, J., M. Lees, and G. H. Sloane-Stanley (1957) – A simple method for the isolation and purification of total lipids from animal tissues. J. Biol. Chem. 226:497–509. - 131 - Formanek Z., Kerry J.P., Higgins F.M., Buckley D.J., Morrissery P.A., and Farkas J. (2001) – Addition of synthetic and natural antioxidants to alphatocopheryl acetate supplemented beef patties: Effects of antioxidants and packaging on lipid oxidation. Meat Sci. 58,337341. Fratianni F., De Martino L., Melone A., De Feo V., Coppola R., and Nazzaro F. (2010) – Preservation of chicken breast meat treated with thyme and balm essential oils. J. of Food Sci. 75,528-535. Fukunaga T., Koga K., Maita Y. and Matsuoka S. (1989) – Free amino acid, carnosine and 5'- inosinic acid contents in the breast and leg meats from the cross and tripe-cross chickens of Satsuma native fowl. Bulletin of the Faculty of Agriculture, Kagoshima University 39,223-232. Garg M.L., Sebokoba E., Wierzbicki A.A., Thomson A.B.R., and Clandin M.T. (1988) – Differential effects of dietary linoleic acid and α-linolenic acid in rat tissue. Lipids 23,847852. Gibbs R.A., Rymer C., and Givens D.I. (2010) – Postgraduate symposium long-539 chain n-3 PUFA: Intakes in the UK and the potential of a chicken meat prototype to increase them. Proc. Nutr. Soc., 69,144-155. Givens D.I., Gibbs R.A., Rymer C., and Brown R.H. (2011) – Effect of intensive vs. Free rang production on the fat and fatty acid composition of whole birds and edible portions of retail chickens in UK. Food Chem. 127,1549-1554. Goll D.E., Neti G., Mares S.W., and Thompson V.F. (2008) –Myofibrillar protein turnover: The proteasome and the calpains. Journal of Animal Science, 86,E19-E35. Gonzalez-Esquerra, R., and Leeson S. (2001) – Alternatives for enrichment of eggs and chicken meat with n-3 fatty acids. Can. J. Anim. Sci. 81,295-305. Gunstone, F.D., Harwood J.L., and Padley F.B. (1986) – The Lipid Handbook. Chapman & Hall, London-New York. 119-124, 453-457. Hamm R. (1986) – Functional properties of the myofibrillar system and their measurements, 135- 199. In: Muscle as food edited by P.J. Bechtel. Academic Press Inc. New York, USA.. Han J., Morton J.D., Bekhit A.E.D., and Sedcole, J.R. (2009) – Pre-rigor infusion withkiwifruit juice improves lamb tenderness. Meat Science, 82,324-330. Hills B.P. (1998) – Magnetic Resonance Imaging in Food Science. John Wiley & Sons, New York, NY. Honikel K.O. (1998). Reference methods for the assessment of physical characteristics of meat. Meat Science, 49,447-457. Honikel K.O. (2004) – pH Measurement, 238-242. In: Encyclopedia of Meat Sciences. Edited by W.K. Jensen, C. Devine and M. Dikeman, Elsevier Ltd. Oxford, UK. Huang Z.B., Leibovitz H., Lee C.M. and Millar R. (1990) – Effect of dietary fish oil on ω-3 fatty acid levels in chicken eggs and thigh flesh. Journal of Agricultural and Food Chemistry 38,743-747. Huff-Lonergan E., Lonergan S.M. (2005) – Mechanisms of water-holding capacity of meat: the role of postmortem biochemical and structural changes. Meat Science, 71, 194-204. Hulan H.W., Ackman R.G., Ratnayake W.M.N., and F. Proudfoot G. (1988) – Omega-3 fatty acid levels and performance of broiler chickens fed redfish meal or redfish oil. Can. J. Anim. Sci. 68,533-547. - 132 - Hunt M.C., Schoenbeck J.J., Yancey E.J., Dikeman M.E., Loughin T.M., and Addis, P.B. (2003) – Effects of post-exsanguination vascular infusion of carcasses with calciumchloride or a solution of saccharides, sodium chloride, and phosphates on beefdisplay-colour stability. Journal of Animal Science, 81,669-675. Jahan k., Alistar P., Piggott J.R. (2004) – Sensory quality in retailed organic, free range and corn-fed chicken breast. Food Research International 38, 495-503. James S.J. and James C. (2002) – Meat refrigeration. Woodhead Publishing Limited. Cambridge. England. Jang A., Liu X.D., Shin M.H., Lee B.D., Lee S.K., Lee J.H. and Jo C. (2008) – Antioxidative potential of raw breast meat from broiler chicks fed a dietary medicinal herb extract mix. Poultry Science 87,2382-2389. JAYASENA D.D., AHN D.U., NAM K.C. and JO C. (2013) – Factors affecting cooked chicken meat flavour: a review. World's Poultry Science Journal, 69,515-526. Jeacocke R.E. (1977) – Continuous measurement of the pH of beef muscle in intact beef carcasses. J. Food Technol. 12,375-386. Jimènez-Colmenero F., Carballo J., and Cofrades S. (2001) – Healthier meat and meat products: their role as functional foods. Meat Sci. 59,5-13. Jlali M., Gigaud V., Métayer-Coustard S., Sellier N., Tesseraud S., Le Bihan-Duval E., and Berri C. (2012) – Modulation of glycogen and breast meat processing ability by nutrition in chickens: Effect of crude protein level in 2 chicken genotypes. J. Anim. Sci. 90,447-455. Jo C. and Ahn D.U. (2000) – Production of volatile compounds from irradiated oil emulsion containing amino acids and proteins. Journal of Food Science 65,612-616. Jo, C., Ahn D.U. And Byun M.W. (2001) – Lipid oxidation and volatile production in irradiated raw pork batters prepared with commercial soybean oil containing vitamin E. Radiation Physics and Chemistry 61,41-47. Joppen L. (2006) – Taking out the chemistry. Food Eng. Ingred. 31,38-41. Juárez M., Aldai N., López-Campos Ó., Dugan M.E.R., Uttaro B., and Aalhus J.L. (2012) – Beef Texture and Juiciness, 177-206. In: Handbook of Meat and Meat Processing, Second Editedion. Edited by Y.H. Hui, CRC Press, New York. Jung Y., Jeon H.J., Jung S., Choe J.H., Lee J.H., Heo K.N., Kang B.S. And Jo C. (2011) – Comparison of quality traits of thigh meat from Korean native chickens and broilers. Korean Journal for Food Science of Animal Resources 31,684-692. Kanner J. (2007) – Dietary advanced lipid oxidation endproducts are risk factors to human health. Mol. Nutr. Food Res. 51,1094-1101. Kauffman R.G. (2012) – Meat Composition, 45-62. In: Meat Science and Applications. Edited by O. A . Young, Robert W. R., Y. H. Hui, and W.K. Nip, CRC Press, New York. Kauffman R.G., Laack R.L.J.M., Russell R.L,. Pospiech E., Cornelius C.A., Suckow C.E., and Greaser M.L. (1998) – Can Pale, Soft, Exudative pork be prevented by postmortem sodium bicarbonate injection? J. Anim. Sci. 76,3010-3015. Keeton J.T. and Eddy S. (2004) – Chemical Composition, 210-218. In: Encyclopedia of Meat Sciences. Edited by W.K. Jensen, C. Devine and M. Dikeman, Elsevier Ltd. Oxford, UK. - 133 - Keeton J.T. and Osburn W.N. (2010) – Formed and emulsion products, 245-278. In: Poultry Meat Processing, Second Editedion. Edited by C.M. Owens, C. Alvarado, and A.R. Sams, CRC Press, New York. Kemp C.M., Sensky P.L., Bardsley R.G., Buttery P.J., Parr T. (2010) – Tenderness - An enzymatic view. Meat Science, 84,248-256. Kiyohara R., Yamaguchi S., Rikimaru K. and Takahashi H. (2011) – Supplemental arachidonic acid-enriched oil improves the taste of thigh meat of Hinai-jidori chickens. Poultry Science 90,1817-1822. Kolar K. (1990) – Colorimetric Determination of Hydroxyproline as Measure of Collagen Content in Meat and Meat Products: NMKL Collaborative Study. Journal of Association of Official Analytical Chemists, 73, 54-57. Koohmaraie M., Geesink G.H. (2006) – Contribution of postmortem muscle biochemistry to the delivery of consistent meat quality with particular focus on the calpain system. Meat Science, 74,34-43. Koohmaraie M., Shackelford S.D., and Wheeler T.L. (1998) – Effect of pre-rigor freezingand post-rigor calcium chloride injection on the tenderness of callipygelongissimus. Journal of Animal Science, 76,1427-1432. Koriyama T., Wongso S., Watanabe K. and Abe H. (2002) – Fatty acid compositions of oil species affect the 5 basic taste perceptions. Journal of Food Science 67,868-873. Kornburst D.J., Mavis R.D. (1980) – Relative Susceptibility of Microsomes from Lung, Heart, Liver, Kidney, Brain, Tests to Lipid Peroxidation. Lipids, 15,315-322. Kotrola N.M. and Mohyla P. Quality and safety of frozen poultry and poultry products, 325-342. In: Handbook of frozen food processing and packaging, Second Edition edited by D.W. Sun, CRC press, Boca Raton. Kralik G., Ivanković S., and Škrtić Z. (2005) – Fatty acids composition of poultry meat produced in indoor and outdoor rearing systems. Agricult. 11,38-42. Kruk Z.A., Yun H., Rutley D.L., Lee E.J., Kim Y.J. and Jo C. (2011) – The effect of high pressure on microbial population, meat quality and sensory characteristics of chicken breast fillet. Food Control 22,6- 12. Kurihara K. (1987) Recent progress in the taste receptor pp. 3-39, in: Umami: A Basic Taste Y. edited by Kawamura and M.R. Kare, New York, Marcel Dekker. Lawlor J.B., Sheehan E.M., Delahunty C.M., Kerry J.P., Morrissey P.A. (2003) – Sensory characteristics and consumer preference for cooked chicken breasts from organic, corn-fed, free-range and conventionally reared animals. International Journal of Poultry Science 6,409-416 Le-Bihan-Duval E., Debut M., Berri M.C., Sellier N., Santè-Lhoutellier V., Jègo Y., and Beaumont C. (2008) – Chicken meat quality: genetic variability and relationship with growth and muscle characteristics. BMC Genet. 9,53-58. Lee S.H., Joo S.T. and Ryu Y.C. (2010) – Skeletal muscle fiber type and myofibrillar proteins in relation to meat quality. Meat Science, 86,166-170. Lee Y.S., Saha A., Xiong R., Owens C.M. and Meullenet J.F. (2008) – Changes in broiler breast fillet tenderness, water-holding capacity, and color attributes during long-term frozen storage. Journal of Food Science, 73,E162-E168. Leygonie C., Britz T.J. and Hoffman L.C. (2012) – Impact of freezing and thawing on the quality of meat: review. Meat Science, 91,93-98. - 134 - Liu X.D., Jayasena D.D., Jung Y., Jung S., Kang B.S., Heo K.N., Lee J.H. and Jo C. (2012) – Differential proteome analysis of breast and thigh muscles between Korean native chickens and commercial broilers. Asian-Australasian Journal of Animal Sciences 25,895902. Lonergan H.E., Zhang W., and Lonergan S.M. (2010) – Biochemistry of postmortem muscle— Lessons on mechanisms of meat tenderization. Meat Science, 86,184–-95. Lowry O.H., Rosebrough N.J., Lewis Farr A., Randall R.J. (1951) – Protein Measurement with the Folin-Phenol Reagents. Journal of Biological Chemistry, 193,265-275. Lyon B.G., and Lyon C.E. (1991) – Shear value ranges by InstronWarner-Bratzler and single-blade Allo-Kramer devices that correspond to sensory tenderness. Poultry Sci. 70,188-191. Lyon B.G., Lyon C.E., Meullenet J-F. and Lee Y.S (2010) – Meat quality: sensory and instrumental evaluations 124–175. In: Poultry meat processing Edited by C.M. Owens, C.Z. Alvarado and A.R. Sams, CRC Press. Boca Raton, Florida, USA. MacDougall D.B. (1982). Changes in the colour and opacity of meat. Food Chemistry, 9,75-88. Magdelaine P., Spiess M.P., Valceschini, E. (2008) – Poultry meat consumption trends in Europe. World's Poultry Science Journal, 64,53-64. Matsuishi M., Kato A., Ishige N., Hori T., Ishida Y., Kaneko S., Takenonaka M., Miyamura Y., Iwata T. And Okitani A. (2005) – Comparison of meat palatability factors of Nagoya Cochin with broiler and Aigamo. Nihon Chikusan Gakkaiho 76,423-430. McCormick R.J. (2009) – Collagen, 129-148. In: Applied Muscle Biology and Meat Science. M. Du, R.J. McCormick, CRC Press, Boca Raton, USA. McKenna D.R., Strachan D.S., Miller R.K., Acuff G.R., and Savell J.W. (2003) – Cranberry juice marinade improves sensory and microbiological properties of vacuumpackaged lamb chops. J. Muscle Foods. 14,207-220. Meiboom S. and Gill D. (1958) – Modified spin-echo method for measuring Nuclear Relaxation times. Rev. Sci. Instrum. 29,688-691. Meilgaard M.C., Carr T., Civille G. (1999) – Sensory Evaluation Techniques. CRC Press, New York, USA. Melton, S.L. (1999) – Current status of meat flavor, pp. 115-130, in: Quality Attributes of Muscle Foods edited by Xiong Y.L., Ho C.T. and Shahidi F. New York, Kluwer Academic/Plenum Publishers. Mielnik M.B., Aaby K., and Skrede G. (2003) – Commercial antioxidants control lipid oxidation in mechanically deboned turkey meat. Meat Sci. 65,1147-1155. Mielnik M.B., Signe S., Bjørg E., Skrede G. (2008) – By-products from herbs essential oil production as ingredient in marinade for turkey thighs. LWT - Food Sci. Technol. 41:93– 100 Miguel G., Simoes M., Figueiredo A.C., Barroso J.G., Pedro L.G., and Carvalho L. (2004) – Composition and antioxidant activities of the essential oils of Thymus caespititius, Thymus camphoratus and Thymus mastichina. Food Chem. 86,183-188. Miller R.K. (2004) – Palatability, 256-266. In: Encyclopedia of Meat Sciences. Edited by W.K. Jensen, C. Devine and M. Dikeman, Elsevier Ltd. Oxford, UK. - 135 - Mohamed H.M.H., Mansour H.A. (2012) – Incorporating essential oils of marjoram and rosemary in the formulation of beef patties manufactured with mechanically deboned poultry meat to improve the lipid stability and sensory attributes. J. Food Sci. Technol. 45:79–87. Mohamed H.M.H., Mansour H.A., and Farag M.D.E.H. (2011) – The use of natural herbal extracts for improving the lipid stability and sensory characteristics of irradiated ground beef. Meat Sci. 87,33-39. Mottram, D.S. (1991) – Meat, pp. 107- 177, in: Volatile Compounds in Foods and Beverages edited by Maarse, H., New York, Marcel Dekker. Mottram, D.S. (1998) – Flavour formation in meat and meat products: a review. Food Chemistry 62,415- 424. Nam K.C., and Ahn D.U. (2003) – Use of antioxidants to reduce lipid oxidation and offodor volatiles of irradiated pork homogenates and patties. Meat Sci. 63,1-8. Nelson K., (2004) – Processed meat and fish applications for whey and lactose products, 169-182. In: Reference Manual for U.S. Whey and Lactose Products. Edited by V. Lagrange, U.S. Dairy Export Council, Arlington, USA. Nishimura T., Rhue M.R., Okitani A. And Kato H. (1988) – Components contributing to the improvement of meat taste during storage. Agricultural and Biological Chemistry 52,2323-2330. Noleau I. and Toulemonde B. (1987) – Volatile components of roasted chicken fat. Lebensmittel-Wissenschaft und-Technologie 20,37-41. Offer G. and Trinick J. (1983) – On the mechanism of water holding in meat: the swelling and shrinking of myofibrils. Meat Science, 8,245-281. Offer G., and Knight P. (1988) – The structural basis of water holding in meat. Part 1. General principles and water uptake in meatn processing. Pages 63-171 in Developments in Meat Science. Edited by R.A. Lawrie, Elsevier Applied Sci. Publ., London, UK. Ouali A., Herrera-Mendez C.H., Coulis G., Becila S., Boudjellal A., Aubry L., Sentandreu M.A. (2006) – Revisiting the conversion of muscle into meat and the underlying mechanisms. Meat Science, 74,44-58. Owens C.M., Fanatico A.C., Pillai P.B., Meullenet J.F. And Emmert J.L. (2006) – Evaluation of alternative genotypes and production systems for natural and organic poultry markets in the U.S. Proceedings XII European Poultry Conference, Verona 10-14 September 2010. Palka K. (2004) – Physics and Chemistry, 567-560. In: Encyclopedia of Meat Sciences. Edited by W.K. Jensen, C. Devine and M. Dikeman, Elsevier Ltd. Oxford, UK. Panarese V., Laghi L., Pisi A., Tylewicz U., Dalla Rosa M., and Rocculi P. (2012) – Effect of osmotic dehydration on Actinidia deliciosa kiwifruit: A combined NMR and ultrastructural study. Food Chemistry, 132,1706-1712. Parks S.S., Reynolds A.E. and Wicke L. (2000) – Aqueous apple flavoring in breast muscle has physical, chemical, and sensory properties similar to those of phosphate-marinated controls. Poult. Sci., 79,1183-1188. Patterson R.L.S. And Stevenson M.H. (1995) – Ir radiation-induced off-odor in chicken and its possible control. British Poultry Science 36,425-441. - 136 - Pearce K.L., Rosenvold K., Andersen H.J., Hopkins D.L. (2011) – Water distribution and mobility in meat during the conversion of muscle to meat and ageing and the impacts on fresh quality attributes. Meat Science, 89,111-124. Perez-Alvarez J.A., Sendra-Nadal E., Sanchez-Zapata E.J. and Viuda-Martos, M. (2010) – Poultry flavour: General aspects and applications Vol. 2, pp. 339-357, in: Handbook of Poultry Science and Technology: Secondary Processing edited by Guerrero-Legarreta I. and Hui Y.H., New Jersey, John Wiley & Sons. Petracci M. and Baéza E. (2011) – Harmonization of methodologies for the assessment of poultry meat quality features. World Poult. Sci. J. 68,137-153. Petracci M., and Cavani C. (2012) Muscle growth and poultry meat quality issues. Nutrients, 4,1-12. Petracci M., Bianchi M. and Cavani C. (2009) – The European perspective on pale, soft, exudative conditions in poultry. Poultry Science, 88,1518-1523. Petracci M., Bianchi M. and Cavani C. (2010) – Preslaughter handling and slaughtering factors influencing poultry product quality. World’s Poultry Science Journal, 66,17-26. Petracci M., Bianchi M., Betti M. and Cavani C. (2004) – Color variation and characterization of broiler breast meat during processing in Italy. Poult. Sci. 83,2086-2092. Petracci M., Bianchi M., Franchini A., and C. Cavani. (2009a) - Technological characteristics of turkey breast rolls produced with fresh or thawed meat and different formulations. Proc. XVIII Eur. Symp. on the Quality of Poultry Meat and XIII Eur. Symp. on the Quality of Eggs and Egg Products, Turku, Finland. Petracci M., Bianchi M., Mudalal S. and Cavani C. (2013a) – Functional ingredients for poultry meat products. Trends in Food Science and Technology 33,27-39. Petracci M., Bianchi M., Venturi L., Cremonini M.A., and Cavani C. (2009b) – Effect of ante mortem journey and lairage at abattoir on rabbit meat quality. J. Muscle Foods 20,489500. Petracci M., Laghi L., Rocculi P., Rimini S., Panarese V., Cremonini M.A. and Cavani C. (2012) – The use of sodium bicarbonate for marination of broiler breast meat. Poultry Science, 91,526-534. Petracci M., Laghi L., Rocculi P., Rimini S., Panarese V., Cremonini M.A. and C. Cavani. (2012) – The use of sodium bicarbonate for marination of broiler breast meat. Poultry Science 91,526-534. Petracci M., Rimini S., Manfreda G., Cavani C. and Franchini A. (2011) – Meat quality characteristics of free range chickens. Proceedings of XIX European Symposium on the Quality of Poultry Meat and XVI European Symposium on the Quality of Eggs and Egg Products, Leipzing, Germany, 4-8 September 2011. Petracci M., Rimini S., Mulder R.W.A.W. and Cavani C. (2013b) – Quality characteristics of frozen broiler breast meat pretreated with increasing concentrations of sodium chloride. Journal of Poultry Science, 50,282-286. Petracci, M., Betti M., Bianchi M., and Cavani C. (2004) – Color variation and characterization of broiler breast meat during processing in Italy. Poultry Sci. 83,20862092. Ponte P.I.P., Alves S.P., Bessa R.J.B., Ferreira L.M.A., Gama L.T., Bràs J.L.A., Fontes C.M.G.A. and Prates J.A.M. (2008a) – Influence of pasture intake on the fatty acid - 137 - composition, and cholesterol, tocopherols, and tocotrienols content in meat from free-range broilers. Poult. Sci. 87,80-88. Ponte P.I.P., Prates J.A.M., Crespo J.P., Crespo D.G., Mourao J.L., Alves S.P., Bessa R.J.B., Chaveiro-Soares M.A., Gama L.T., Ferreira L.M.A., and. Fontes C.M.G.A. (2008b) – Restricting the intake of cereal-based feed in free-range-pastured poultry: effects onperfomance and meat quality. Poult. Sci. 87,2032-2042. Porretta S. (2000) – Elementi di Consumer Science, 237-292. In: Analisi Sensoriale & Consumer Science. Chiriotti, Pinerolo, Italia. Poste L.M. (1990) – A sensory perspective of effect of feeds on flavour in meats: Poultry meats. Journal of Animal Science 68,4414-4420. Purchas R.W. (2004) – Tenderness measurement, 1370-1376. In: Encyclopedia of Meat Sciences. Edited by W.K. Jensen, C. Devine and M. Dikeman, Elsevier Ltd. Oxford, UK. Qiao M., Fletcher D.L., Smith D.P., and Northcutt J.K. (2002) – Effects of raw broiler breast meat color variation on marination and cooked meat quality. Poult. Sci. 81,276-280. Rababah,T., Hettiarachchy N.S., Horax R., Cho M.J., Davis B. and Dickson J. (2006) – Thiobarbituric acid reactive substances and volatile compounds in chicken breast meat infused with plant extracts and subjected to electron beam irradiation. Poultry Science 85,1107-1113. Ramarathnam N., Rubin L.J. and Diosady L.L. (1993) – Studies on meat flavour: 4. Fractionation, characterisation, and quantitation of volatiles from uncured and cured beef and chicken. Journal of Agricultural and Food Chemistry 41,939-945. Ratnayake W.M.N., Ackman R.G. and Hulan H.W. (1989) – Effect of redfish meal enriched diets on the taste and n-3 PUFA of 42-day-old broiler chickens. J. Sci. Food Agric. 49,59-74. Rhee K.S., Anderson L.M., and Sams A.R. (1996) – Lipid oxidation potential of beef chicken, and pork. J. Food Sci. 61,8-12. Rikimaru K. and Takahashi H. (2010) – Evaluation of the meat from Hinai-jidori chickens and broilers: Analysis of general biochemical components, free amino acids, inosine 5’monophosphate, and fatty acids. The Journal of Applied Poultry Research 19,327-333. Ripoll G., Joy M. and Muñoz F. (2011) – Use of dietary vitamin E and selenium (Se) to increase the shelf life of modified atmosphere packaged light lamb meat. Meat Sci. 87,8893. Rivas-Canedo A., Fernandez-Garcia E. and Nunez M. (2008) – Volatile compounds in fresh meats subjected to high pressure processing: effect of the packaging material. Meat Science 81,321-328. Roessler, E.B., Pangborn R.M., Sidel J.L. and H. Stone (1978) – Expanded statistical tables for estimating significance in paired-preference, paired difference, duo-trio and triangle tests. Journal of Food Science 43,940-941. Roos Y.Y. (1986) – Melting-behaviour, denaturation and freeze-drying of reindeer meat. LWT-Food Science and Technology, 19,218-221. Ruusunen M. and Poulane E. (2005) – Reducing sodium intake from meat products. Meat Science, 70,531-541. Sales J. and Hayes J.P. (1986) – Proximate, amino acid and mineral composition of ostrich meat. Food Chemistry, 56,167-170. - 138 - Sams A.R., Janky D.M. and Woodward S.A. (1990) – Comparison of two shearing methods for objective tenderness evaluation and two sampling times for physical-characteristic analyses of early harvested broiler breast meat. Poultry Science, 69,348-353. Sanosaka M., Minashima T., Suzuki K., Watanabe K., Ohwada S., Hagino A., Rose M.T., Yamaguchi T. and Aso H. (2008) – A combination of octanoate and oleate promotes in vitro differentiation of porcine intramuscular adipocytes. Comp. Biochem. Physiol. 149,285-292. Sanudo C., Enser M.E., Campo M.M., Nute G.R., Maria G., Sierra I. and Wood J.D. (2000) – Fatty acid composition and sensory characteristics of lamb carcasses from Britain and Spain. Meat Science 54,339-346. SAS Institute (1988) – SAS/STAT Guide for Personal Computers. Version 6.03 ed. SAS Institute Inc. Cary, NC. SAS Institute. (2000) – SAS/STAT Guide for Personal Computers. 8th ed. SAS Inst. Inc., Cary, NC, USA. Sathe S.K. (2012) – Protein Solubility and Functionality, 95-124. In: Food Proteins and Peptides. Chemistry, Functionality, Interactions, and Commercialization. Edited by N.S. Hettiarachchy, K. Sato, M.R. Marshall, and A. Kannan, CRC Press, New York. Schneider B.L., Renema R.A., Betti M., Carney V.L., and Zuidhof M.J. (2012) – Effect of holding temperature, shackling, sex, and age on broiler breast meat quality. Poult. Sci. 91,468-477. Schönfeldt, H.C. and Gibson N. (2008) – Changes in the nutrient quality of meat in an obesity context. Meat Sci. 81,20-27. Sebranek J-G. (2009) – Basic curing ingredients,1-24. In: Ingredients in meat products edited by R. Tarté Springer. New York, USA. Sen A.R., Naveena B.M., Muthukumar M., Babji Y. and Murthy T.R.K. (2005) – Effect of chilling, polyphosphate and bicarbonate on quality characteristics of broiler breast meat. British Poultry Science, 46,451-456. Shantha N.C. and Decker E.A. (1994) – Rapid, sensitive, iron-based spectrophotometric method for determination of peroxide values of food lipids. J. AOAC Int. 77,421-424. Sheard P.R. and Tali A. (2010) – Injection of salt, tripolyphosphate and bicarbonate marinade solutions to improve the yield and tenderness of cooked pork loin. Meat Sci. 71,753-754. Shen Q.W. and Swartz D.R. (2010) – Influence of salt and pyrophosphate on bovine fast and slow myosin S1 dissociation from actin, Meat Science 84,364-370. Shen Q.W., Du M. and Means W.J. (2009) – Regulation of Postmortem Glycolysis and Meat Quality, 175-194. In: Applied Muscle Biology and Meat Science. Edited by M. Du and R.J. McCormick, CRC Press, New York. Shi H. and Ho C.T. (1994) – The flavour of poultry meat, pp. 52-69, in: Flavor of Meat and Meat Products , edited by Shahidi F. Glasgow, Blackie Academic and Professional. Shults G.W. and Wierbicki E. (1973) – Effects of sodium chloride and condensed phosphates on the water-holding capacity, pH and swelling of chicken muscle. Journal of Food Science, 38,991-994. Sikes A., Tornberg E., and Tume, R. (2010) – A proposed mechanism of tenderizing postrigor beef using high pressure-heat treatment. Meat Science, 84,390-399 - 139 - Silva J.E. (2006) – Thermogenic mechanisms and their hormonal regulation. Physiol. Rev. 86,435-464. Simatos D., Faure M., Bonjour E., and Couach. M. (1975) – The physical state of water at low temperatures in plasma with different water contents as studied by differential thermal analysis and differential scanning calorimetry. Crit. Rev. Food Sci. Nutr. 30,115-360. Simmons N.J., Daly C.C., Cummings T.L., Morgan S.K., Johnson N.V., and Lombard A. (2008) – Review: Reassessing the principles of electrical stimulation. Meat Science, 80,110-122. Simmons N.J., Daly C.C., Mudford C.R., Richards I., Jarvis G., and Pleiter H. (2006) – Integrated technologies to enhance meat quality — An Australasian perspective. MeatScience, 74,172-179 Simopoulos A.P. (1999) – Evolutionary aspects of omega-3 fatty acids in the food supply. Prostaglandins Leukot. Essent. Fatty Acids 60,421-429. Simopoulos A.P. (2008) – The omega-6/omega-3 fatty acid ratio, genetic variation, and cardiovascular disease. Asia Pac. J. Clin. Nutr. 17,131-134. Sirri F., Castellini C., Bianchi M., Petracci M., Meluzzi A., and Franchini A. (2011) – Effect of fast-,medium- and slow-growing strains on meat quality of chickens reared under the organic farming method. Animal 5,312-319. Smith D.M. (2010) - Functional properties of muscle proteins in processed poultry products, 231-234. In: Poultry Meat Processing, Second Editedion Edited by C.M. Owens, C. Alvarado and A.R. Sams, CRC Press, New York. Smith D.P., and Acton J.C. (2001) – Marination, cooking, and curing of poultry products. Pages 257-281, chapter 15 in Poultry Meat Processing. A. R. Sams. CRC Press, Boca Raton, FL, USA. Smith D.P., and Young L.L. (2007) – Marination pressure and phosphate effects on broiler breast fillet yield, tenderness, and color. Poult. Sci. 86,2666,2670. Smith S.B. and Tume R.K. (2008) – Triacylglycerols, 155–166. In: Handbook of Muscle Foods Analysis. Edited by L.M.L. Nollet and F. Toldr, CRC Press, New York. Sørheim O., and Hildrum K.I. (2002) – Muscle stretching techniques for improving meat tenderness. Trends in Food Science and Technology, 13,127-135. Spanier A.M., Flores, M., Toldrá, F., Aristoy, M.C., Bett, K.L., Bystricky, P. And Bland, J.M. (2004) – Meat flavour: contribution of proteins and peptides to the flavour of beef.Advances in Experimental Medicine and Biology 542,33-49. Suhaj M. (2004) – Spice antioxidant isolation and their antiradical activity: a review. J. Food Comp. Anal. 19,531-537. Suman S.P. and Joseph P. (2013) – Myoglobin chemistry and meat color. Annual Review of Food Science and Technology 4,79-99. Sun X.D. and Holley R.A. (2010) – High hydrostatic pressure effects on the texture of meat and meat products. Journal of Food Science, 75,R17-R23. Sun Y.E., Wang W.D, Chen H.W., and Li C. (2011) – Autoxidation of Unsaturated Lipids in Food Emulsion. Critical Reviews in Food Science and Nutrition, 51,453-466 Swartz D.R., Greaser M.L., and Cantino M.E. (2009) - Muscle Structure and Function, 146. In: Applied Muscle Biology and Meat Science. Edited by M. Du and R. J. McCormick, CRC Press, New York. - 140 - Swatland H.J. (2008) – How pH causes paleness or darkness in chicken breast meat. Meat Sci. 80,396-400. Swatland H.J. and Barbut S. (1999) – Sodium chloride levels in comminuted chicken muscle in relation to processing characteristics and Fresnel reflectance detected with a polirimetric probe. Meat Science, 51,377-381. Takahashi H., Rikimaru K., Kiyohara R. and Yamaguchi S. (2012) – Effect Of Arachidonic Acid-Enriched Oil Diet Supplementation On The Taste Of Broiler meat. AsianAustralasian Journal of Animal Sciences 25,845-851. Tang H., Gong Y.Z., Wu C.X. Jiang J., Wang Y. and Li, K. (2009) – Variation of meat quality traits among five genotypes of chicken. Poultry Science 88,2212-2218. Tang, S., Kerry J.P., Sheehan D., Bukley D.J., and Morrissey P.A. (2001) – Antioxidative effect of added tea catechins on susceptibility of cocked red meat, poultry and fish patties to lipid oxidation. Food Res. Int. 34,651-657. Tarladgis B.G., Watts B.M., Younathan M.T., and Jr. Dugan. L. (1960) – A distillation method for the quantitative determination of malonaldehyde in rancid foods. J. Am. Chem. Soc. 37,44-48. Taylor R.G. (2004) – Muscle fibre types and meat, 876-882. In: Encyclopedia of Meat Sciences. Edited by W.K. Jensen, C. Devine and M. Dikeman, Elsevier Ltd. Oxford, UK. The European Parliament and the Council of the European Union (2004). – Regulation (EC) No 853/2004 of the European Parliament and of the Council of 29 April 2004 laying down specific hygiene rules for on the hygiene of foodstuffs. Official Journal of the European Union, 139(55),1-155. Thompson J.M., Perry D., Daly B., Gardner G.E., Johnston D.J., and Pethick D.W. (2006) – Genetic and environmental effects on the muscle structure response ost-mortem. Meat Science, 74,59-65. Thompson, J.M. (2002) – Managing meat tenderness. Meat Science, 62,295-308. Totosaus A., Montejano J.G., Salazar J.A. and Guerrero I. (2002) – A review of physical and chemical protein-gel induction, International Journal of Food Science and Technology 37,589-601. Trout G.R. (1989) – Variation in myoglobin denaturation and color of cooked beef, pork, and turkey meat as influenced by pH, sodium chloride, sodium tripolyphosphate, and cooking temperature. J. Food Sci. 54,536-540. Troy D.J. and Kerry J.P. (2010) – Consumer perception and the role of science in the meat industry. Meat Science 86,214-226 Ugalde-Benítez V. (2012) – Meat Emulsions, 447-456. In: Handbook of Meat and Meat Processing, Second Editedion. Edited by Y.H. Hui, CRC Press, New York. Van Laack R.L.J., Kaufman R.G., Pospiech E., Greaser M.L., Lee S. and Solomon M.B. (1998) – The effects of pre-rigor sodium bicarbonate perfusion on the quality of porcine. J. Muscle Foods 9,185-191. Vani N.D., Modi V.K., Kavitha S., Sachindra N.M. and Mahendrakar N.S. (2006) – Degradation of inosine-5’-monophosphate in aqueous and in laying chicken muscle fibre system: Effect of pH and temperature. LWT-Journal of Food Science and Technology 39,627-632. Venturi L., Rocculi P., Cavani C., Placucci G., Dalla Rosa M., and Cremonini M.A. (2007) – Water absorption of freeze-dried meat at different water activities: A multianalytical - 141 - approach using sorption isotherm, differential scanning calorimetry, and nuclear magnetic resonance. J. Agric. Food Chem. 55,10572-10578. Viuda-Martos M., Ruiz-Navajas Y., Fernández-López J., and Pérez-Álvarez J.A. (2009) – Effect of adding citrus waste water, thyme and oregano essential oil on the chemical, physical and sensory characteristics of a bologna sausage. Innov. Food Sci. Emerg. 10,655660. Wang K.H., Shi S.R., Dou T.C. and Sun H.J. (2009) – Effect of a free-range 614 raising system on growth performance, carcass yield, and meat quality of slow-growing chicken. Poult. Sci. 88,2219-2223. Weiss J., Gibis M., Schuh V. and Salminen H. (2010) Advances in ingredient and processing systems for meat and meat products. Meat Science, 86,196-213. 2010. Woelfel R.L. and Sams A.R. (2001) – Marination performance of pale broiler breast meat. Poult. Sci. 80,1519-1522. Wood J.D. , Enser M., Whittington F.M. and Richardson R.I. (2007) – Fatty acids in meat and meat products, 87-107. In Fatty Acids in Foods and their Health Implications,Third Editedion Edited by C.K. Chow, CRC Press, New York. Wood J.D., Enser M., Fisher A.V., Nute G.R., Sheard P.R., Richardson R.I., Hughes S.I., and Whittington F.M. (2008) – Fat deposition, fatty acid composition and meat quality: A review. Meat Sci. 78,343-358 WPSA (1984) – World’s Poultry Science Association. Working Group No. 5. Method of dissection of broiler carcases and description of parts (ed. J Fris Jensen), Frederiksberg Copenhagen, Denmark, Papworth Everard, Cambridge, UK. Wynveen E.J., Browker A.L., Grant A.L., Lamkey J.M., Fennewalk K.J. Henson L. and Gerrard D.E. (2011) – Pork quality is affected by early post mortem phosphate and bicarbonate injection. J. Food Sci. 66,886-891. Wyszecki G. and Stiles W.S. (1967) – Color Science: concepts and methods, quantitative data and formulas, 229. John Wiley & Sons, Inc., New York. Xiong Y. L., and. Kupski D.R. (1999b) – Monitoring phosphate marinade penetration in tumbled chicken filets using a thin-slicing, dye-tracing method. Poult. Sci. 78,1048-1052. Xiong Y.L. (2004a) – Protein Functionality, 218-225. In: Encyclopedia of Meat Sciences. Edited by W.K. Jensen, C. Devine and M. Dikeman, Elsevier Ltd. Oxford, UK. Xiong Y.L. (2004b) – Muscle protein. Pages 100–122 in Proteins in Food Processing. Edited by R.Y. Yada, Woodhead Publ. Ltd., London, UK. Xiong Y.L. (2005) – Role of myofibrillar proteins in water-binding in brine-enhanced meats. Food Research International, 38,281-287. Xiong Y.L., and Kupski D.R. (1999a) – Time-dependent marinade absorption and retention, cooking yield, and palatability of chicken filets marinated in various phosphate solutions. Poult. Sci. 78,1053-1059. Xiong Y.L., Lou X.,. Harmon R.J, Wang C., and Moody W.G. (2000) – Salt- and pyrophosphate-induced structural changes in myofibrils from chicken red and white muscles. J. Sci. Food Agric. 80,1176-1182. Yamaguchi S. (1991) – Roles and efficacy of sensory evaluation in studies of taste. The Japanese Society of Food Science and Technology 38,972-978. - 142 - Yeung R.M.W. and Morris J. (2001) – Consumer perception of food risk in chicken meat. Nutr. Food Sci. 6,270-278 Youdim K.A., Deans S.G., and Finlayson H.J. (2002) – The antioxidant properties of thyme (Thymus zygis L.) essential oil: an inhibitor of lipid peroxidation and a free radical scavenger. J. Essen. Oil Res. 14,210-215. Young L.L., and Lyon C.E. (1997) – Effect of post chill aging and sodium tripolyphosphate on moisture binding properties, color, and Warner-Bratzler shear values of chicken breast meat. Poult. Sci. 76,1587-1590. Yusof S., Mohd G.H., and Swee K.G. (1990) – Naringin content in local citrus fruits. Food Chem. 7,113-121. Zhao J.P, Zhao G.P., Jiang R.R., Zheng M.Q., Chen J.L., Liu R.R. and Wen J. (2012) – Effects of diet-induced differences in growth rate on metabolic, histological, and meatquality properties of 2 muscles in male chickens of 2 distinct broiler breeds. Poult. Sci. 91,237-247. - 143 -


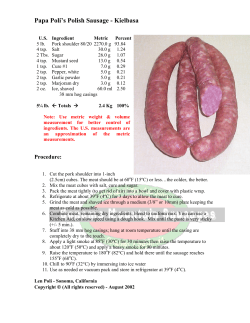
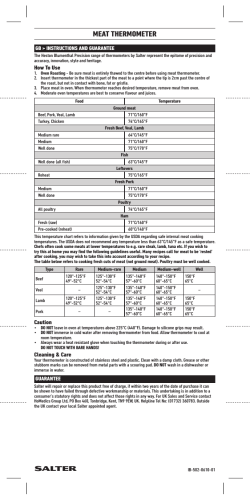

© Copyright 2026