
Community participation and after-school support to
Community participation and after-school support to improve learning outcomes and transition to secondary school among disadvantaged girls: A Pilot Study in Informal Urban Settlements in Nairobi, Kenya Benta Abuya Moses Ngware Njora Hungi Maurice Mutisya Milka Nyariro Gerald Mahuro Midterm Report November 2014 Table of Contents Table of Contents ..................................................................................................................... ii List of Tables ........................................................................................................................... iv List of Figures ........................................................................................................................... v Abbreviations .......................................................................................................................... vi Acknowledgements ................................................................................................................ vii Executive Summary ..............................................................................................................viii 1 2 Introduction .................................................................................................................... 12 1.1 Background .............................................................................................................. 12 1.2 Sampling procedures............................................................................................... 12 1.3 Data collection ......................................................................................................... 14 1.4 Training, pre-testing and data collection .............................................................. 16 1.5 Analysis .................................................................................................................... 16 1.6 The intervention ...................................................................................................... 17 1.7 Theory of change ..................................................................................................... 18 Midterm Impacts ............................................................................................................ 19 2.1 3 Characteristics of beneficiaries .............................................................................. 19 2.1.1 Background characteristics ............................................................................... 19 2.1.2 Extra tuition ....................................................................................................... 21 2.1.3 Homework .......................................................................................................... 23 2.2 Girls’ behavior and life-skills component ............................................................. 26 2.3 Girls’ achievement in literacy and numeracy ....................................................... 32 2.3.1 Changes in student scores for treatment and control groups ............................ 32 2.3.2 Changes in student scores for treatment and control groups by site ................. 34 2.3.3 Changes in student scores by content and cognitive domains ........................... 37 2.3.4 Effects of intervention on student scores ........................................................... 40 Community reflections of the education intervention ................................................. 43 3.1 Experience with and outcomes of the intervention .............................................. 43 3.1.1 Improvement in the general performance of girls ............................................. 43 3.1.2 Improved communication................................................................................... 46 3.1.3 Increased knowledge, motivation, positive attitude and initial indications of change in behaviour ......................................................................................................... 48 ii 3.1.4 3.2 Vital lessons learned during the course of the intervention ...................................... 53 3.2.1 4 Trickling effect of the life-skills and the counselling within the community ...... 52 Concerted effort in support of girls’ education by all the stakeholders ............ 53 Discussion ........................................................................................................................ 56 References ............................................................................................................................... 60 Appendices .............................................................................................................................. 61 iii List of Tables Table 2.1.1: Distribution of the beneficiaries ....................................................................................... 19 Table 2.1.2: Dropout, repetition and transition between 2013 and 2014 .............................................. 20 Table 2.1.3: Proportion of girls receiving homework and support within households ......................... 24 Table 2.2.1: Girls’ behavior and schooling ........................................................................................... 28 Table 2.2.2: Substance use and sexual related activities ....................................................................... 30 Table 2.3.1: Changes in mean mathematics and literacy scores ........................................................... 33 Table 2.3.2: Mean scores for mathematics by treatment and survey site.............................................. 35 Table 2.3.3: Mean scores for literacy by treatment and site ................................................................. 35 Table 2.3.4: Mean scores for mathematics content areas by treatment................................................. 38 Table 2.3.5: Mean scores for mathematics cognitive areas by treatment ............................................. 39 Table 2.3.6: Mean scores for literacy content areas by treatment ......................................................... 40 Table 2.3.7: Regression models for mathematics achievement ............................................................ 41 Table 2.3.8: Regression models for literacy achievement .................................................................... 42 iv List of Figures Figure 2.1.1: Transition to secondary school by wealth index ............................................................. 21 Figure 2.1.2: Proportion of girls receiving extra tuition as reported by the girls .................................. 22 Figure 22.1.3: Proportion of girls receiving extra tuition as reported by the parents or guardians....... 23 Figure 2-42.3: Mean baseline and midterm mathematics and literacy scores ...................................... 36 v Abbreviations HIV/AIDS Human Immunodeficiency Virus/Acquired Immune Deficiency Syndrome APHRC African Population and Health Research Center FGD Focus Group Discussion IDI In-depth Interview ISH Individual Schooling History KCPE Kenya Certificate of Primary Education NGO Non-governmental Organization NUHDSS Nairobi Urban Health Demographic System PGI Parent Guardian Involvement PTA Parents Teachers Association vi Acknowledgements This midterm report provides data and analysis resulting from a midterm evaluation study of learning outcomes and transition to secondary schools among disadvantaged girls by the APHRC Education Research Program. It benefited immensely from the participation of all Education Research Program staff at various stages, including review and updating of study tools, data collection and analysis that led to the production of this report. Much appreciation to the study participants for agreeing to take part in the midterm evaluation of this study. Special thanks go to Alex Ezeh for his leadership and review of this report. We also thank the anonymous donors whose funding through the Education Research Program enabled this study to be conducted. The views presented in this report are those of the authors and not necessarily shared by those mentioned. vii Executive Summary The overall goal of this study is to improve learning outcomes and transition to secondary school through community participation and after-school support among disadvantaged girls in urban informal settlements of Nairobi. The improving learning outcomes and transition to secondary school study is a three-year intervention study which started in 2013 and ends in 2015. The study is being implemented in two informal urban settlement of Nairobi, Kenya called Korogocho and Viwandani, by CSOs/NGOs Miss Korogocho and U-Tena respectively. The evaluation is being conducted by APHRC. The baseline survey was conducted in June 2013, and the intervention started in July of the same year. This is to be achieved through increasing access and transition to quality secondary education among girls living in the urban informal settlements, and through parental and community support. The expected outcomes of the study are increased attendance, improved learning outcomes, and transition to secondary schools for girls in grades 6, seven and eight from poor households. Between the baseline and midterm evaluations, girls in grades seven and eight were exposed to 12 months of after-school support and mentoring, while their parents were exposed to guidance and counseling over the same period. The midterm evaluation was conducted with the aim of enumerating the short term outcomes of the study during the year, specifically, the progress of the intervention, and achievements. The results of the midterm evaluation will inform the processes of the intervention in the third year of implementation. The midterm evaluation study sought to answer the following questions: 1) does the after-school learning support and mentoring lead to improved learning outcomes; 2) does the promise of subsidizing the cost of secondary first grade entry increase the transition of girls to secondary schools; and 3) how does increased awareness about the challenges of girl’s education in the community by parents and community leaders lead to increased support for and improved learning outcomes among girls. Key highlights Overall the proportion of girls reporting receiving any form of extra tuition, defined as extra-curricular academic support, increased significantly by 10 percentage points. Specifically, a significantly higher proportion (87%) of girls in Treatment 1 (afterschool support and girls mentoring in life-skills combined with parental counselling) received extra tuition as compared to 78% in the control. Treatment 2 (after-school support and girls mentoring in life-skills) had the least number of girls receiving extra tuition and this was significantly lower than Treatment 1 and the control groups. viii There was a significant association between the number of days girls take school work home and both data collection points by treatment group. For instance, the proportion of girls with homework for at least three days in a week increased significantly from about 83% in baseline to about 94% in the midterm. Homework support at home was highest among Treatment 2, with about 38% percent of the parents reporting that either someone in the household always or usually supports the girl with her homework as compared with 19% and 24% of the Treatment 1 and control parents. Transition to secondary school was highest in the control group (70%) compared with Treatment 1 (58%) and Treatment 2 (52%). Do you know why? The midterm evaluation results show that in Treatment 1 and control groups, transition to secondary school was significantly higher among the least poor households than the middle poor (27 and 16% percentage point difference respectively). The most poor, across the groups, had higher transition than the middle poor. In Treatment 2, transition was more less the same across the wealth index. The intervention package that had no parental component (Treatment 2) seemed to work well in improvement of literacy scores. The two intervention packages show short term positive impacts on mathematics scores in Viwandani slums. On the contrary, the intervention packages are not showing any short term impacts in Korogocho slums. The effect of the after-school support without parental involvement was significant at 5% level even after taking into account student achievement at baseline and other key predictors of achievement such as age, home wealth background and grade level. Girls in the parental counselling intervention group (Treatment 1) had significantly higher aspirations compared to those in life-skills and after-school support package (Treatment 2), and those in the control groups. The parental counselling intervention (Treatment 1) had an advantage on girls’ selfconfidence over and above life-skills counselling provided directly to the girls. Girls in Treatment 1 were also more confidence than those in the control group. In terms of social behavior, there is no significant difference between the two treatment arms. However, the girls enjoying parental component are significantly different from those in the control arm. The girls with the parental counselling intervention reported significantly higher interest in schooling, an indication that parents could be reinforcing such interest as this ix is evident because no difference is noted between Treatment 2 (with no component) and control groups. The qualitative findings from the narratives of community leaders and parents show that one year after the onset of the intervention they observe a general improvements in girls’ lives. Parents note an improvement in math and literacy as a result of the afterschool support. The findings show that the after-school support sessions have inculcated into the girls a sense of commitment and hard work. The commitment and hard work has been demonstrated among girls who are currently in the project, motivated by those who made a transition to secondary school. There is improved communication among the parents and their daughters. Improvement in communication was an outcome of the parental interaction with the counselors during the counselling sessions As a result of parental counselling, parents developed a positive attitude towards their daughters and towards girls’ education. As a result, parents have taken it upon themselves to counsel and encourage other parents in order to sustain some of the key messages that they learn at the sessions, particularly on the need to take their daughters to school. Most importantly, there was an observed trickling effect of the tenets of counseling among parents and life skills into the households. The trickling effect can be attributed to the positive attitudes that both parents and their daughters adopted after attending both counseling sessions and after-school support sessions respectively. x Map of Nairobi showing the two study sites: Korogocho and Viwandani, Nairobi, Kenya xi 1 Introduction 1.1 Background The three-year intervention study started in 2013 with the baseline survey being conducted in the month of June 2014 and thereafter the intervention began in July of the same year. The overall goal of this study was to improve learning outcomes and transition to secondary school through community participation and after-school support among disadvantaged girls in urban informal settlements of Nairobi. This is to be achieved through increasing access and transition to quality secondary education among girls living in the urban informal settlements and through parental and community support. Subsequently, the expected outcomes were increased attendance, improved learning outcomes and finally transition to secondary schools for girls in grades 6, 7 and eight from poor household. Between the baseline and midterm girls were exposed to 12 months of afterschool support and mentoring, while their parents were exposed to guidance and counseling for the same period. The midterm study was conducted with the aim of showing short term outcomes of the study during the year. Specifically, with the aim of evaluating the progress of the intervention was to measure short term outcomes, and give recommendations on the future orientation and emphasis of the project during its remaining implementation phase, running up to December 2015. The results of the midterm study will be useful in informing the processes of the intervention in the third year of the study. Specifically, the midterm study sought to answer the following questions: 1) Does the after-school learning support and mentoring lead to improved learning outcomes; does subsidizing the cost of secondary first grade entry increase the transition of girls to secondary schools; and how does increased awareness about the challenges of girl’s education in the community by parents and community leaders lead to increased support for and improved learning outcomes among girls. During the midterm review, the girls in grades seven and eight who were still in the program were assessed in numeracy and literacy. The assessed was to show whether their learning outcomes had improved. In addition to the assessment, the evaluation team administered quantitative and qualitative study tools to the participants. 1.2 Sampling procedures The midterm review involved tracking the girls recruited during baseline. The baseline was conducted in June 2013. In total, 1271 girls had been recruited at baseline. A baseline list of all 12 the girls was generated for the midterm, and their status updated during midterm data collection. During midterm, 1181 (93%) girls had their information updated through a checklist. Those whose information was not updated had either migrated out of the study sites or their households could not be traced. Recruitment during baseline included all households with girls aged between 12 and 19 years and in grades six, seven and eight and within the two sites under the Nairobi Urban Health and Demographic Surveillance System Nairobi Urban Health Demographic Surveillance System (NUHDSS). In addition to the quantitative study, qualitative component of the evaluation was also done during the midterm, in which data was collected using Focus Group Discussions and In-depth Interviews. Parents were mobilized to participate in the focus group discussions using the populated list of recruited households from the baseline data extracted from NUHDSS. Additional participants (mentors, counselors and girls) in the qualitative study were added at midterm to capture experiences, lessons learned, challenges, and their mitigations during the first 12 months of the intervention. Six focus group discussions were conducted with parents (2 in Treatment 1 (T1), 2 in Treatment 2 (T2) and 2 in Control ( C)), two FGDs with mentors and one FGD with counselors from Korogocho. In addition to the FGDs, six in-depth interviews were conducted with community leaders, 18 girls and two counselors from Viwandani. Anticipated focus group discussion with counselors in Viwandani did not materialized despite two attempts of mobilization and intervention from the host implementing partner. This was because the counselors are engaged in other income-generating activities, so adjustments were made to conduct IDIs. The FGD protocol of questions for the counselors was the same one that was used to guide the in-depth interviews, and the information gathered from the FGD and the IDIs was therefore standardized. In total, nine FGDs and 26 IDIs were conducted in the two study sites. However, we only present the perceptions of community leaders and parents of the intervention group in this report. This is to reflect on the changing perceptions of parents and community members at midterm compared to their perceptions at baseline Selection of parents: A list of parents in the three treatment zones (T1, T2 and C) were generated in each site, categorized by gender and a random selection of 18 parents was made from each category to constitute either a male or a female only FGD in each zone. Following the baseline allocation criteria of which site was to produce which category of parents, this was alternated at 13 midterm. The expected categories of FGDs were three male and three female. However, this was not the case as in some cases the male parents opted to send their spouses to represent them. As a there were three mixed gender FGDs in Viwandani and three female only FGDs in Korogocho. This did not introduce any bias because, as in the case of FGDs one advantage of using FGDs is to highlight the group interaction as part of the method of collecting data. The moderators explored both the female and the male participants’ perceptions in regard to their daughters’ education. Selection of girls: The sampling of girls was done at various levels. The first level was to select girls from each category of treatment and control. One girl was randomly selected from grade seven and eight each and the third one selected randomly from either grade seven or eight. Indepth interviews with girls were conducted within their schools after seeking the consent from the school head teachers. Selection of community leaders: Community leaders included the village elders and the local area chiefs. The chiefs from the two sites were included in the study. In addition, four IDIs were done with the village elders in both Korogocho and Viwandani. 1.3 Data collection Six survey instruments and five protocol of questions were used to collect data from the girls, their parents/guardians, community gatekeepers, and other participants in the program. Household questionnaires were administered to 1181 girls, inclusive of the 329 girls who transited to secondary in the current year in control and treatment zones. In addition, numeracy and literacy tests were administered to girls who are currently in grades seven and eight. The tools are described below. Individual schooling update questionnaire: This questionnaire focused on collecting data on the girls schooling history and school attendance. It also collected information on the type of school that the girls were attending at the time of data collection and any previously attended, their location(s), reasons for changing schools, class repetition, and reasons for repetition. Individual behavior/life skills questionnaire This questionnaire sought information on the educational goals of the girls and their aspirations, levels of their self-confidence, personal behavior, substance abuse, sexual activity, source of information on sex, drugs, smoking and alcohol, knowledge about HIV/AIDS and other sexually transmitted diseases. This tool also sought 14 to dismiss myths about puberty, sex, and HIV/AIDS. At midterm, this tool was updated to capture if menstruation was a reason for girls absenteeism from school, and to evaluate the effectiveness of the program in equipping the girls with the required life skills to go through puberty. Parental / guardian involvement questionnaire: This questionnaire sought information on parental support in regard to provision for learning materials and focusing on communication and life skills guidance and counselling for girls. This tool was designed to investigate parental understanding of their role and that of the community in educating their daughters, and their awareness of the challenges that affect the girls’ education. Literacy test: This was assessed through a one-on-one tool aimed at evaluating four literacy skills– listening, writing, reading, and speaking. In addition, a whole-class composition exercise assessed the students’ skills in reading, writing, grammar, and vocabulary. This assessment tool remained standard at baseline and midterm evaluation to avoid bias. Numeracy test: The aim of the tool was to assess three learning domains in numeracy: knowledge, comprehension, and application. The same numeracy tool was used at baseline and midterm to ensure consistency. It focused on the curricular outcome areas of numbers and operations, patterns and algebra, geometry, measurement, and basic statistics. Community leaders’ interview guide: The aim of this tool was to investigate the community gatekeepers’ perceptions with the intervention, understanding of their roles and those of the community towards the education of girls. Parents’ FGD protocol of questions: This tool was to investigate parental understanding of their role and that of the community towards the education of their daughters and to understand the challenges that affect girls’ education in the two urban informal settlements where an education intervention is being implemented. In addition, the tool highlighted the perception of the parents with the intervention after one year. Girls’ interview guide: The in-depth interview guide for girls was to investigate the girls’ understanding of their role and that of the community towards their education and how they have benefitted from the project so far. Moreover, the tool also captured challenges that girls encounter in the project. 15 Counsellors’ protocol of questions: This protocol solicited information on the counsellors’ understanding of their role and that of the community towards girls’ education. The protocol also sought to understand challenges affecting the counsellors’ work and how to mitigate these challenges in order to improve on the sensitization of the parents. Mentors protocol of questions: This protocol investigated mentors’ understanding of their role and that of the community towards the education of girls and also to identify the challenges that they face as mentors and ways of mitigation to enhance their work. 1.4 Training, pre-testing and data collection Training for field interviewers was done for three days from 28th to 30th May 2014. At the end of the training, four field interviewers who participated in the baseline qualitative data collection were selected to conduct the FGD and IDI interviews during the midterm evaluation study. They were taken through all the protocol questions for FGDs and in-depth interviews. In addition, they were sensitized on techniques of conducting an effective qualitative data collection and how to use voice recorders. Finally, we used role plays and practiced using the voice recorders to improve on fluency in conducting interviews. 1.5 Analysis We used descriptive, bivariate, and difference-in-difference (DID) statistics to analyze the quantitative midterm data. The descriptive analysis included 1) mean achievement in mathematics and literacy and their standard deviations as well as latent variables (section 0 describes in in-depth on how the latent variables were generated). The latent variables measured schooling aspirations, schooling preference and risky behavior among others; and 2) frequencies, percentages, and proportions for the categorical variables. The bivariate analysis involved cross-tabulations of categorical variables by the study groups and testing for association using the Chi-square or Fishers test, and TTEST for continuous variables. We undertook a DID, commonly known as the double difference estimation, in order to assess the midterm impacts of the intervention. The analysis involved comparing each of the treatment groups with the control group (T1 Vs C & T2 Vs C) as well as between the two treatment groups (T1 Vs T2). The DID, was applied to assess the midterm impacts of the study. In addition, for the categorical variables, we tested whether the changes in 16 proportion between baseline and midterm varied significantly between the study groups. Latent variables were generated by calculating the mean scores of the different item for each of the respondents. The items mostly attracted a Likert scale of 5 points ranging from strongly agree denoted by 1 to strongly disagree denoted by 5. Item reliability was checked using the Cronbach’s Alpha. For the literacy and numeracy tools, pupil scores were calculated using Rasch measurement procedures as described later under section 2.3. Analysis of the qualitative data involved generation of codes both inductively and deductively. The deductive coding was largely based on the research questions guiding the midterm study, while inductive coding involved relevant concepts that emerged but were not defined in the initial research questions. These codes were mainly generated after listening to voice records of the proceedings and also reading the first set of transcripts. Vital moments in the data were identified and coded before beginning the process of interpretation (Fereday & Cochrane, 2006). The codes were subsequently categorized into themes as described in Rice and Ezzy (1999). 1.6 The intervention The study deployed a multi-pronged education intervention approach: 1) after-school support and mentoring for girls, 2) a subsidized primary to secondary school transition; and 3) a parent and community leader sensitization on girl’s education. After-school learning/homework support and mentoring: After-school support and life skills mentoring to girls ages 12 to 19 years and enrolled in grades seven and eight is one of the arms of the intervention. In the second year of the intervention, girls are exposed to after-school support in numeracy and literacy for two hours once every week while they are exposed to mentoring for one hour once every month. In the first year of the intervention, 31 numeracy, 31 literacy, and 12 life skills sessions were offered to the girls as outlined in the proposal covering all the targeted number of sessions. In year two of the intervention, the girls are to be exposed to 48 numeracy, 48 literacy and 12 life skills sessions. At the time of this report, 36 numeracy, 36 literacy and 9 life skills sessions had been conducted. The remaining sessions will be covered by the end of the year as stipulated in the work plans of the implementing partners. 17 Primary-to-secondary transition subsidy: Subsidizing the cost of secondary school first entry is a sub-component of the intervention that rewards those girls who were recruited in the program, have consistently participated, and attained at least 250 out of 500 marks in Kenya Certificate of Primary Education (KCPE) which was the project pass mark to qualify for the school subsidy for joining secondary one. Of the first cohort of 139 girls in grade eight from both sites, 73 scored at least 250 marks and transited to secondary schools after being awarded the subsidy that catered for personal effects and non-tuition costs. Of those, three girls transitioned to prestigious girls’ national schools in the country. In Kenya, public secondary schools are categorized into national, county, and sub-county schools. National schools are the best-resourced and admit the highperforming students from across all counties in Kenya. Others were admitted to county and subcounty schools across the country. Parental and community intervention: Parental guidance and counselling is another component of the intervention that exposes parents in treatment zone one in both study sites to sensitization on how to increase engagement in their daughters’ education. The counselors are using the revised and updated guide which contains nine topics. The parental sensitization sessions are held once every quarter in the second year of the intervention. So far, three sessions have been conducted with parents from treatment one zones in the two sites, the fourth and the last session is planned to take place in December 2014. 1.7 Theory of change Our theory of change holds that addressing low educational participation among poor and marginalised girls in informal urban settlements requires a comprehensive awareness and understanding of social and economic drivers. The interventions will improve learning and the quality of education by providing after-school support, enhancing educational aspirations, and increasing parent and community support for girls’ education. Change is demonstrated by more girls completing primary, transitioning to secondary school, and improving test scores in 2013 Kenya Certificate of Primary Education test scores. 18 2 Midterm Impacts 2.1 Characteristics of beneficiaries 2.1.1 Background characteristics This section provides key social background characteristics of the sampled girls and households. In addition, the section presents some key descriptive results of the study. Control of the midline with the baseline indicators is undertaken to determine whether there are significant changes between the two time points. Table 2.1.1: Distribution of the beneficiaries Grade/Level Treat 1 (n=350) Treat 2 (n=505) Control (n=416) Total (n=1271) <=6* 3.1 2.4 1.4 2.3 7 32.0 34.3 33.9 33.5 eight 33.7 28.3 34.4 31.8 Secondary Commercial College 17.7 15.4 20.4 17.7 0.3 1.2 0.5 0.7 Not in school 4.6 5.9 3.1 4.6 Not updated/traced 8.6 12.5 6.3 9.4 Total 27.5 39.7 32.7 100.0 * 1 pupil transferred school and taken back to grade four, while another two were taken to grade five. Table 2.1.1 presents the distribution of the girls in terms of the grades they were enrolled in during the midterm data collection. Those in grade six and below repeated lower grades. About 9.4% (90 girls) of the girls’ whereabouts were unknown (not traced). Among those whose status was updated, 17 transferred to schools outside the study area. Table 2.1.2Table 2.1.2 shows some of the key indicators of the project include ding: proportion of girls who either dropped out, repeated or transitioned to secondary school. Dropout was calculated as function of girls in classes six and seven in 2013 and their schooling status in 2014. Dropout was very minimal and did not differ by the treatment groups. The calculation of grade repetition was restricted to those in primary school in 2014 irrespective of their grade in 2013. Overall, 11% of the girls repeated, and this is three percentage points lower than the national average for grade 19 six reported by Southern Africa Consortium for Monitoring Educational Quality, SACMEQ (Hungi, 2010). Repetition varied by study sites, with 16%, 8% and 10% of girls in treatments 1, 2 and control, respectively, reporting to have repeated their grade. Half of the girls were enrolled in low-cost private schools while the other half in government schools. Enrolment did not differ significantly by treatment type. During baseline, 45%, 50% and 54% of girls in the treatments 1, 2 and control groups, respectively, were enrolled in public government schools. Table 2.1.2: Dropout, repetition and transition between 2013 and 2014 Treat 1 Treat 2 Control Total P-Value Enrolled/Dropout* (n=869) Primary (enrolled) 93 93 96 94 0.803 Not in school (dropped) 2 1 1 1 not traced 5 6 3 5 Repetition+ (n=871) Progressed 84 92 90 89 0.004 Repeated 16 8 10 11 # Transition (n=395) Primary (enrolled) 19.5 8.9 10.4 12.4 0.013 Secondary (enrolled) 58.4 52.2 70.4 59.7 Commercial College 0.9 3.8 1.6 2.3 Not in school 11.5 17.8 8.0 12.9 not traced 9.7 17.2 9.6 12.7 Type of secondary school enrolled Government 51.6 68.3 54.6 58.6 0.081 Private 48.4 31.7 45.4 41.4 Type of primary school enrolled Government 47 51 51 50 0.56 Private 53 49 49 50 * Calculation of dropout restricted to those who were in class six and seven in 2013; + Calculation of progression (repetition) restricted to those with updates information in 2014, and in primary school in 2014 and includes some class eight pupils of 2013 who repeated grade eight; # there were 395 girls in class 8 in 2013 out of which 50 had unknown status in 2014 (status not known). In terms of transition, 60% of the girls who were in class eight transitioned to secondary school, and 12% repeated. This transition rate is below the national average of 72% as at 2010 (MoE, 2012). The control had the highest transition rates at 70%. Among the girls who transited to 20 secondary schools, 41% transited to private secondary schools. This is high compared with the national average of 10% of secondary school students enrolled in private secondary schools (MoE, 2012). The results on transition to secondary school was further stratified by wealth index as shown in Error! Reference source not found.Figure 2.1.1. The stratified results shows no significant difference in transitions between the study groups. Overall, transition was high among the least poor households that the poorest. In Treatment 1, transition to secondary school was significantly higher among the least poor households than the middle poor (27 percentage point difference). In Treatment 2, transition was more less the same across the wealth index. In control the poorest had a high transition rate compared to the middle poor. Figure 2.1.1: Transition to secondary school by wealth index 90 Poorest 80 70 Middle poor 81 76 70 Percentage 60 50 40 54 48 Least poor 65 56 52 48 30 20 10 0 Treat 1 Treat 2 Comparision 2.1.2 Extra tuition One of the key objectives of this study is to assess the impact of after-school support among girls from poor communities. To assess this, we asked girls whether they are currently receiving any extra tuition, defined as extra-curricular academic support. In addition, their parents were also asked the same question in order to triangulate the results. Figure 2.1.2 and In addition, respondents were asked to state who provides the extra tuition. While in the baseline, 97% stated the tuition is provided in schools, and only 0.13% provided by NGOs, 21 the midterm data shows that about 86% is provided through schools while 12% by NGOs. This can be a reflection, of the after-school support being provided in the community to girls. The proportion provided in schools is still high. The after-school support in this study is provided in classes within the schools and therefore some of the girls might not have clearly distinguished the two. Figure 22.1.3 present results on the proportion of girls receiving extra tuition at mid-term and baseline, as well as comparing the treatment groups during midterm as reported by girls and their parents. The baseline data showed no significant association between treatment group and extra-tuition. However, during midterm, overall the proportion of girls reporting receiving extra tuition increased significantly by 10 percentage points. In addition, a significantly higher proportion (87%) of girls in Treatment 1 received extra tuition as compared to 78% in the control. Treatment 2 had the least number of girls receiving extra tuition and this was significantly lower than Treatment 1 and the control groups. Figure 2.1.2: Proportion of girls receiving extra tuition as reported by the girls 100 90 % attending extra tuition 80 87 70 60 50 78 73 63 59 40 30 20 10 0 Baseline (r) Midterm* Treat 1* Overall Treat 2* Comparison (r) Midline * P< 5%; r=reference In In addition, respondents were asked to state who provides the extra tuition. While in the baseline, 97% stated the tuition is provided in schools, and only 0.13% provided by NGOs, the 22 midterm data shows that about 86% is provided through schools while 12% by NGOs. This can be a reflection, of the after-school support being provided in the community to girls. The proportion provided in schools is still high. The after-school support in this study is provided in classes within the schools and therefore some of the girls might not have clearly distinguished the two. Figure 22.1.3, results as responded by parents mirror those reported by the girls. The midterm results show increased uptake of extra tuition especially in Treatment 1 as compared with the Treatment 2 and the control. In addition, respondents were asked to state who provides the extra tuition. While in the baseline, 97% stated the tuition is provided in schools, and only 0.13% provided by NGOs, the midterm data shows that about 86% is provided through schools while 12% by NGOs. This can be a reflection, of the after-school support being provided in the community to girls. The proportion provided in schools is still high. The after-school support in this study is provided in classes within the schools and therefore some of the girls might not have clearly distinguished the two. Figure 22.1.3: Proportion of girls receiving extra tuition as reported by the parents or guardians 90 80 79 % attending extra tuition 70 50 73 69 60 58 55 40 30 20 10 0 Baseline (r) Midterm* Treat 1* Overall Treat 2* Comparison (r) Midterm * P< 5%; r=reference 2.1.3 Homework Homework support is a measure of how households are involved in their girls schooling. While the Treatment 1 group, which has added parental component, is expected to have the highest proportion of households supporting their girls, the results shows otherwise. Homework support 23 was highest among treatment group 2, with about 38% percent of the parents reporting that someone in the household always or usually supports the girl in her homework as compared to 19% and 24% of the Treatment 1 and control parents. The control group had the highest proportion of parents (42%) reporting ‘never’ to support their girls with homework. This may be a result of the parents in treatment group one being aware that the girls are being supported by mentors in their homework and have a trust with the program; this is clearly shown by the high proportion (about 44%) of parents in the Treatment 1 reporting to sometimes support their girls (29% Treatment 2 and 33% control). One important element of the current study is supporting girls in their homework as well as encouraging parents in Treatment 1 to support their girls schooling. The proportion of parents reporting that girls come home with homework reduced insignificantly by about 3% between baseline and midterm (Table 2.1.3). Significantly more parents in the Treatment 2 reported their girls receiving homework as compared to Treatment 1 and the control groups. There is a significant association between number of days girls take home work and treatment groups. For instance, the proportion of girls coming home with homework for at least three days in a week increased from about 83% in baseline to about 94% in the midterm. At midterm, Treatment 2 had the highest proportion of girls receiving homework: every day of the school week. Table 2.1.3: Proportion of girls receiving homework and support within households Baseline Midterm P Value Overall Overall Treat 1 Treat 2 Control 0.004 89.64 86.56 84.48 91.14 83.09 Homework (% yes) Homework days 0.001 At least 3 days 82.71 93.59 93.67 96.03 90.98 At least 4 days 68.77 74.6 69.02 82.12 72.23 At least 5 days 60.72 58.12 51.41 66.89 55.56 Homework support 0.001 Always 4.64 5.89 2.17 6.55 8.18 Usually 11.61 22.68 16.85 32.36 15.45 Sometimes 30.63 34.02 44.02 28.36 32.73 Never 52.68 36.67 36.41 32.73 41.82 Missing 0.45 0.74 0.54 0.00 1.82 24 25 2.2 Girls’ behavior and life-skills component In this section, we present the findings of the impact of the parental counselling combined with life-skills and after-school support (T1), and life-skills and after-school support package alone (T1) on girls’ behavior. The behaviors under consideration include peer influence, sexual exploitation, substance use, and sexual activity. The section also reports whether the interventions had any impact on source of information that influences behavior and knowledge of HIV/AIDS and STIs. In social science, behavioral contexts are hardly quantified since they are intangible. However, it is possible to create a latent variable based on a number of observable factors perceived to form it. This is usually done through data reduction statistical methods, and especially principal component analysis. Before reduction, examination of the internal reliability of the items is established, and if the items meet a certain threshold, they are combined, else presented individually. In addition, after data reduction, an examination of internal consistency within the items is done to ensure that the factors measure what they are supposed to measure. The latent variables included aspiration, self-confidence, social behavior, schooling interest, school friendliness and peer influence. In our analysis of behavior items, we dropped those that had relatively low correlation coefficients; the remaining factors had Cronbach Alpha values that were greater than 0.56. Table 2.2.1 shows the time of exposure, and treatment effects, and intervention impact between Treatment 1 and Treatment 2; Treatment 1 and control; and, Treatment 2 and control groups. The time effects shows the difference in scores between baseline and midterm while the treatment effects are shown by the difference between the pair of groups being compared e.g. Treatment 1 and control. Aspiration: Girls’ aspiration was captured using items that focused on school completion, transition to university, job prospects, better health and living conditions, and future family life on a scale with categories of low, average, and high. From the computation of the standardized aspiration scores, lower scores indicate higher aspirations, therefore the lower the score, the higher the aspiration. From the analysis, girls in Treatment 2 and the control had significantly lower aspirations compared to those in Treatment 1 by 0.13 and 0.08 units respectively. This implies that the girls in Treatment 1 significantly benefit from the parental counselling. When comparing the Treatment 2 and control groups, the aspirations were not statistically different. 26 Self-confidence: To measure self-confidence, we asked the girls to rate how good they felt about themselves using a Likert- type scale ranging from 1 (strongly agree/always) to 5 (strongly disagree/never) where low scores implies high self-confidence and vice-versa. Results show that girls in Treatment 2 have significantly lower self-confidence compared to those in Treatment 1 by 0.32 units; however, they are significantly more self-confident than those in the control group by 0.26 units. This implies that the parental counselling is correlated with girls’ self-reported confidence scores. Social behavior: The girls’ social behavior was assessed using nine items including whether their parents knew where and who they spent their free time with, what they do during their free time, their media exposure, type of reading materials, and how they spent their money and who their friends were. The respondents used a Likert-type scale with three anchors of 1 (never know), 2 (sometimes know), 3 (usually know) and a not applicable option to rate their responses. Low scores obtained indicated low knowledge (awareness) and reverse is true. From the analysis, there is no significant difference in social behavior between the two treatment arms, although the girls enjoying parental component feel that their parents’ knowledge of their social activities is higher than those in the control arm by 0.13 units (α=0.05). Schooling interest: Girls’ interest in schooling was observed using four items focusing on how well they like school, how they get along with teachers, how much effort they put in school work and whether doing well in school has any implications in their future. A Likert-type scale with anchors ranging from 1 (strongly agree) to 5 (strongly disagree) was used to rate their interest in school. The findings indicate that girls in the Treatment 1 have significantly higher schooling interests than girls from either Treatment 2 or control arms. The findings do not show significant differences between Treatment 2 and control arms. School friendliness: The girls were asked to evaluate how friendly their school was in terms of discipline, remedial support by teachers, pupils respect to colleagues and teachers, harassment by fellow pupils and teachers and substance use by pupils in school. A Likert-type scale with responses ranging from 1 (strongly agree) to 5 (strongly disagree) was used to rate their school friendliness. Based on the girl’s ratings, a perception score on school friendliness rating/score for each girl was created. High scores meant that the school was friendly. There are observed 27 significant differences on school friendliness between any pair of treatment arm. Girls in Treatment 2 felt their schools are significantly unfriendly compared to those in Treatment 1, while on the other hand, those in control arm felt that their schools are significantly unfriendly than those in the Treatment 1. This implies that the parental component (T1) has significant impact on the girls’ perception of school friendliness. Table 2.2.1: Girls’ behavior and schooling Cons Site Time effect Aspiration T1 vs T2 1.21 -0.09* 0.1 (0.07 ; 0.13)* 1.16 -0.03* 0.05 (0.02 ; 0.09) T1 vs C T2 Vs C 1.18 0.09* 0.05 (0.02 ; 0.09)* Self-confidence Treatment effect Intervention impact -0.04 (-0.07 ; 0.00)* -0.01 (-0.05 ; 0.03) 0.03 (-0.01 ; 0.06) -0.13 (-0.17 ; -0.08)* -0.08 (-0.13 ; -0.03)* 0.04 (-0.01 ; 0.09) -0.09 -0.19 (-0.3 ; -0.08)* -0.1 (-0.23 ; 0.02) 0.32 (0.15 ; 0.49)* T1 vs T2 2.5 2.46 0.06 0.07 (-0.05 ; 0.2) -0.1 (-0.23 ; 0.03) 0.06 (-0.12 ; 0.25) T1 vs C 0.07 (-0.06 ; 0.2) -0.01 (-0.13 ; 0.11) -0.26 (-0.43 ; -0.09)* T2 Vs C 2.49 -0.05 Girls’ social behavior 0.13 (0.04 ; 0.21)* 0.23 (0.13 ; 0.32)* 0.05 (-0.08 ; 0.19) T1 vs T2 2.31 0.01 2.56 0.14* 0.05 (-0.03 ; 0.12) -0.06 (-0.14 ; 0.01) 0.13 (0.03 ; 0.24)* T1 vs C 0.05 (-0.04 ; 0.14) -0.29 (-0.38 ; -0.2)* 0.08 (-0.04 ; 0.2) T2 Vs C 2.61 -0.02 Girls’ schooling interests 0.03 (-0.01 ; 0.07) -0.15 (-0.21 ; -0.1)* T1 vs T2 1.09 -0.07* 0.07 (0.03 ; 0.11)* 1.07 0.07 (0.02 ; 0.11)* 0.03 (-0.02 ; 0.08)* -0.15 (-0.22 ; -0.08)* T1 vs C -0.01 (-0.06 ; 0.04) 0 (-0.07 ; 0.07) T2 Vs C 1.08 -0.001 0.07 (0.02 ; 0.12)* School friendliness -0.07 (-0.15 ; 0.02) 0.3 (0.19 ; 0.41)* T1 vs T2 4.14 0.13* 0.09 (0.02 ; 0.16)* 4.19 0.07* -0.11 (-0.18 ; -0.04)* -0.1 (-0.18 ; -0.01)* 0.5 (0.39 ; 0.61)* T1 vs C 0.2 (0.1 ; 0.31)* T2 Vs C 4.26 -0.12* -0.11 (-0.19 ; -0.04)* 0 (-0.07 ; 0.08) Peer influence 0.01 (-0.04 ; 0.05) 0.05 (-0.02 ; 0.11) T1 vs T2 1.39 -0.11* 0.00 (-0.04 ; 0.04) 1.38 -0.09* 0.04 (-0.01 ; 0.08) 0.01 (-0.04 ; 0.06) 0.01 (-0.06 ; 0.08) T1 vs C 0.00 (-0.05 ; 0.04) -0.04 (-0.09 ; 0.02) T2 Vs C 1.37 -0.07* 0.04 (0 ; 0.08) Sexual exploitation -0.08 (-0.14 ; -0.03)* -0.07 (-0.13 ; 0)* -0.02 (-0.1 ; 0.05) T1 vs T2 1.19 -0.01 1.13 0.00 -0.06 (-0.11 ; -0.02)* -0.01 (-0.07 ; 0.05) -0.04 (-0.11 ; 0.02) T1 vs C -0.07 (-0.12 ; -0.01)* 0.05 (-0.02 ; 0.12) -0.02 (-0.1 ; 0.06) T2 Vs C 1.13 0.02 Notes: T1=Treatment 1; T2=Treatment 2; C=Control; * Significant at alpha=0.05. Peer influence: This attribute was measured using ten items that focused on how well their friends engage with substance use, school assessment, school discipline, trouble with police, sexual activity, aspiring to transit to secondary and university, sporting activities and attending religious 28 institutions. A Likert-type scale with four responses was used to create a peer influence score. The ratings ranged from 1 (none), 2 (some), 3(most), and 4 (all). From the analysis, there were no statistically significant differences between any of the two groups (T1 and T2, T1 and control, T2 and control). This means that the interventions (T1 and T2) had no measurable effect on peer influence. Sexual exploitation: Girls’ sexual exploitation was evaluated using eight items rated from 1 (strongly agree) to 5 (strongly disagree). These items included how to observe personal safety, avoiding idleness, keeping good friends, avoiding alcohol and substance, not being submissive and seeking protection from adults. We found that there were no statistically significant differences between any two groups (T1 and T2, T1 and control, T2 and control). This means that the interventions did not have any effect on perceived incidences of sexual exploitation among the girls. Substance use: The girls were asked whether they have ever used any of the following substances (pills, bhang, miraa, glue, alcohol, or cigarettes) in their lifetime. It is notable that the proportion of girls in any of the groups who have ever used a substance was about one percent. From Table 2.2.2 there is no significant difference between any two groups (T1 and T2, T1 and control, T2 and control) in regard to the proportion of girls who had ever used at least one type of substance in their lifetime. One year after the implementation, the situation on the substance usage remains the same. Sexual-related activities: Sexual-related activities were observed by asking the girls if they have ever been involved or had experience in kissing, fondling, foreplay, heavy petting, or sex. From our analysis there was no statistically significant difference between any two groups (T1 and T2, T1 and control, T2 and control) on self-reported incidences of sexual related activities. This implies that the interventions may not have had a significant effect on girls’ sexual-related activities. 29 Table 2.2.2: Substance use and sexual related activities Wave Treatment groups Study site Substance Use (pills, bhang, miraa, glue, alcohol or cigarettes) Baseline Midline T1 T2 Control Korogocho Viwandani 1257 1092 650 912 787 1448 901 N 99% 98% 100% 98% 99% 99% 100% None 1% 1% 0% 1% 1% 1% 0% One type 0.978 (T1 vs T2 =0.99), T1 VS C=0.9) 0.0013* p-value Sexual activity (kissing, fondling, foreplay, heavy petting or ever had sex) 96% 93% 96% 92% 97% 93% 97% None 3% 3% 2% 4% 2% 4% 3% One activity 1% 1% 1% 1% 0% 1% 0% Two activities 0% 3% 1% 3% 1% 2% 0% More than two activities 0.999 (T1 vs T2 =0.77), T1 VS 0.000* p-value C=0.15) Source of information on sex, drugs, smoking and alcohol: Girls were asked to indicate their main source of information on sex, drugs, smoking and alcohol. The respondents were provide with options on the sources of information and were required to indicate the main one. Our results show that teachers were the main source of information (see Appendix 1). Despite the parental counselling intervention and their expected role in guiding their children, it is only in smoking that they were mostly cited (15 percent) by girls as the main source of information. However there was no statistically significant difference between any two groups (T1 and T2, T1 and control, T2 and control) on source of information. Knowledge about HIV/AIDS and other sexually transmitted infections (STI): The girls in the evaluation were asked to indicate if they had any knowledge on HIV/AIDS and STIs by responding to a series of knowledge, attitude and perception (KAP) type of items (Appendix 2). The responses to the items were binary (Yes/No). All the girls in the study acknowledged that they have ever heard of HIV/AIDS. Despite the interventions sensitizing girls and their parents on aspect of HIV/AIDS and STIs, there was no statistically significant difference between any two groups (T1 and T2, T1 and control, T2 and control) on KAP. However there are indications that the girls are knowledgeable on HIV/AIDS and STIs. 30 Dispelling myths about HIV/AIDS and STIs: The evaluation also examined girls’ opinion on myths regarding HIV/AIDS and STIs. They expressed their opinion by responding to a series of items focusing on different ways in which an individual can be infected by HIV and STI (Appendix 3). The responses to the items were binary (Yes/No). At least 56% of the girls responding to any of the items in Appendix 3 demonstrated an acceptable understanding of the mode of infection; with knowledge on mode of infection for pregnant mother to unborn baby being the most inappropriately responded. There was no statistically significant difference between any two groups (T1 and T2, T1 and control, T2 and control) on girls’ understanding of the mode of infection. Perhaps an indication that the girls in the study had prior information on the modes of infection and so far the intervention have not changed their understanding on how an individual can get infected. 31 2.3 Girls’ achievement in literacy and numeracy This section focuses on the changes in student mathematics and literacy scores between baseline and midterm. The section utilizes data from only those girls who have both baseline and midterm scores for each subject (mathematics or literacy). The total number of girls who have both baseline and midterm scores for mathematics and literacy are 329 and 353, respectively. These are girls who were in grade 6 or grade 7 during the baseline study in 2013 and could be traced. By design, the grade 8 girls who took the tests in 2013 during baseline were not assessed during midterm because these girls had already exited the study. The number of girls involved in the analyses presented in this chapter for each subject by group, study site and grade can be found in Appendix 4. The results presented in this chapter were derived from English literacy and Mathematics tests that were based on a careful analysis of the official primary school curriculum in Kenya. For each subject, the same test was used across grade levels, between baseline and midterm. During baseline, test data for each subject were analyzed using Rasch measurement techniques in a manner that allow valid control of scores across study sites as well as across specific subject content and cognitive domains. During baseline, the test scores for each subject were transformed into a common scale with a mean of 400 and a standard deviation of 100. During midterm, the baseline item parameters for each subject were anchored in order to estimate student midterm scores for the subject. Therefore, within the same subject, valid controls in student scores can also be made between baseline and midterm. 2.3.1 Changes in student scores for treatment and control groups The mean baseline and midterm student mathematics and literacy scores by intervention method are displayed in Table 2.3.1, together with the standard errors (SE) associated with the mean scores. Also displayed in this table are the mean changes in scores between baseline and midterm for the students in each of the two treatment (T1 and T2) groups and control (C) group. Of main interest in assessing the effects of the interventions in this study are the differences in the mean changes in student scores across treatment and control groups, which are displayed in the shaded 32 cells in Error! Reference source not found.1. A single asterisk (*) and two asterisks (**) are used in his table to flag the statistically significant change in differences at 10% and 5% significance levels, respectively. Table 2.3.1: Changes in mean mathematics and literacy scores a) Mathematics Treatment 1 Treatment 2 Control Mean Difference Mean (T1) SE Mean (T2) SE Mean (Co) SE T1-T2 T1-Co T2-Co Baseline (B) 366.4 7.9 366.9 6.2 375.2 7.3 -0.5 -8.8 -8.3 Midterm (M) 426.3 9.1 428.1 8.2 416.2 10.6 -1.8 10.1 11.9 59.9 6.5 61.2 5.6 41.0 8.3 -1.3 18.9* 20.2** Change (M-B) b) Literacy Treatment 1 Treatment 2 Control Mean Difference Mean (T1) SE Mean (T2) SE Mean (Co) SE T1-T2 T1-Co T2-Co Baseline (B) 405.4 9.4 375.0 8.9 370.7 11.8 30.4 34.7 4.3 Midterm (M) 435.8 10.2 446.3 8.8 424.7 11.7 -10.5 11.1 21.6 30.5 6.8 71.3 5.5 54.0 Change (M-B) 8.7 -40.8** -23.5** 17.3* For mathematics, the results in Table 2.3.1Error! Reference source not found. indicate that the difference in the mean changes in performance of girls (to be referred to as “double difference” or DD) in the two treatments groups was small but negative (-1.3) and that this DD was not statistically significance. This implies that the effects of the two treatments on student mathematics scores were roughly the same. Put in other words, with respect to gains in mathematics achievement, it did not matter much which intervention package the student received. The results further shows that the DD between T1 and C groups (18.9) was positive and significant at 10% 1 In impact evaluation literature, these changes in the differences are commonly referred to as difference-indifferences or double differences (DD). 33 level while that between T2 and C groups (20.2) was also positive but significant at 5% level. Thus, the interventions were clearly helpful in accelerating student mathematics achievement; and more so the second intervention concerning life skills mentoring and after-school homework support without parental involvement. For literacy, the results in Table 2.3.1 are mixed and show that the mean gain in literacy achievement among the girls in the T2 group was significantly higher than the corresponding gain among girls in the T1 group (at 5% significance level) or among girls in the C group (at 10% significance level). This is interpreted to mean that the intervention involving mentoring and afterschool homework support alone (T2) was clearly useful in accelerating student literacy achievement when compared to the intervention involving mentoring and after-school homework support coupled with parental involvement (T1) or no intervention at all (C). Surprisingly, the results also indicate that the mean gain in literacy achievement was significantly higher (at 5% level) among girls in the control group than among girls in the first treatment group. This finding should be worrying to the implementers because it implies that the first intervention package may not be working well in improvement literacy achievement. This might also mean that something is wrong with the implementation of the first intervention in respect to literacy especially bearing in mind that this intervention seemed to work reasonably well in respect to mathematics achievement. It could be that the after-school homework support sessions focus more on mathematics than in literacy. It will be important for the implementers to re-examine their implementation approach with a view of improving it before the final evaluation in 2015. 2.3.2 Changes in student scores for treatment and control groups by site The mean baseline and midterm scores by survey sites and the type of intervention allocated to the students are shown in Table 2.3.2 and Table 2.3.3 for mathematics and literacy, respectively, together with the double differences of these scores across intervention types. 34 Table 2.3.2: Mean scores for mathematics by treatment and survey site a) Korogocho Treatment 1 Mean (T1) SE Baseline (B) 382.8 8.6 Midterm (M) 434.5 10.2 Change (M-B)51.7 7.5 Treatment 2 Mean (T2) SE 365.1 10.3 422.8 11.8 57.7 8.2 Control Mean (C) 398.3 447.0 48.7 SE 11.1 16.4 14.2 Mean Difference T1-T2 T1-C T2-C 17.7 -15.6 -33.3 11.7 -12.5 -24.2 -6.0 3.0 9.0 Treatment 2 Mean (T2) SE 368.1 7.8 431.5 11.2 63.4 7.6 Control Mean (C) 355.1 389.4 34.3 SE 9.0 12.9 9.4 Mean Difference T1-T2 T1-C T2-C -35.9 -22.9 13.0 -22.2 19.9 42.1 13.7 42.8 **29.1 ** b) Viwandani Treatment 1 Mean (T1) SE Baseline (B) 332.2 15.1 Midterm (M) 409.3 18.1 Change (M-B)77.1 12.1 Table 2.3.3: Mean scores for literacy by treatment and site a) Korogocho Baseline (B) Midterm (M) Change (M-B) Treatment 1 Mean (T1) SE 411.1 10.6 437.7 11.4 26.6 8.7 Treatment 2 Mean (T2) SE 390.1 15.4 451.4 14.4 61.3 8.7 Control Mean (C) 396.1 451.1 55.0 Treatment 1 Mean (T1) SE 390.7 20.0 431.1 22.1 40.4 9.4 Treatment 2 Mean (T2) SE 364.7 10.6 442.8 11.2 78.1 7.1 Control Mean (C) 347.6 400.6 53.0 SE 18.6 17.0 15.8 Mean Difference T1-T2 T1-C T2-C 21.0 15.0 -6.0 -13.7 -13.4 0.3 -34.7 **-28.4 6.3 SE 14.3 15.6 8.5 Mean Difference T1-T2 T1-Co T2-C 26.0 43.1 17.1 -11.7 30.5 42.2 -37.7 **-12.6 25.1 ** b) Viwandani Baseline (B) Midterm (M) Change (M-B) For the Viwandani data set, the double differences in Table 2.3.2 indicate that (a) effects of the two intervention packages on mathematics performance were roughly the same and (b) each of the two intervention packages was clearly helpful in accelerating student achievement in mathematics. These results are consistent with what was reported in section 2.3.1 regarding gains in mathematics achievement using combined data set from the two study sites. However, for Korogocho, the results show that, in terms of gains in mathematics scores, there was no much advantage associated with being in either of the two treatment groups or control group. This could imply that the 35 interventions are working better in Viwandani than in Korogocho, or it could mean the math improvements are due to confounding. For literacy, the results in Table 2.3.3 for Viwandani data set indicate that there were clear advantages associated with receiving the second intervention package when compared to receiving either the first package or not receiving any intervention at all. However, for the same data set, there was no much advantage associated with receiving the first intervention package over not receiving any intervention at all. For Korogocho data set, in terms of literacy achievement, the results show that the advantage of receiving the second intervention package over the first package was quite obvious. Nevertheless, when compared to the control group, there was no much advantage associated with receiving either of the two treatments. In other words, none of the two packages seemed to be working well in improving student literacy scores in Korogocho. Again, these results tend to emphasize that the interventions were working better in Viwandani than Korogocho in improving learning outcomes among girls. The mean baseline and midterm scores for mathematics and literacy have been depicted in Figure 2-4 for the two study sites. For both subjects, it is evident that, compared to the control group, the changes in scores among treatment groups were generally more evident in Viwandani than in Korogocho. Figure 2-4: Mean baseline and midterm mathematics and literacy scores Mathem atics Treatment 1 Literacy Treatment 2 Control Treatment 1 460 460 440 440 420 420 400 400 380 380 360 360 340 340 320 Treatment 2 Control 320 2013 2014 Korogocho 2013 2014 2013 Viw andani 2014 Korogocho 36 2013 2014 Viw andani 2.3.3 Changes in student scores by content and cognitive domains The mathematics and literacy data were further analyzed using content domains (curriculum or specific subject areas) tested as well as using Bloom’s cognitive domains. For mathematics, four content domains (namely numbers and operations; measurement; space and data) and four cognitive domains (namely knowledge; comprehension; application and analysis) are considered. For literacy, the content domains considered are reading, speaking and listening. The original literacy test also had writing items but a writing domain is not considered in this chapter because a considerable number of students (104) did not complete the writing section of the test during midterm. Cognitive domains for literacy are not considered included in the analysis because the items in the literacy test were not mutually exclusive and they could fall in more than cognitive domain. The results for mathematics content and cognitive domains are shown in Table 2.3.4 and Table 2.3.5 respectively, while the results for literacy content domains are displayed in Table 2.3.6. Depictions of these mean baseline and midterm scores for the content and cognitive domains can be found in Appendix 5. For mathematics content domains of measurement as well as space and data, the results in Table 2.3.4 show that, in terms of gain in achievement, there were clear advantages associated with being in the first treatment group over the control group. In addition, there were some advantages associated in being in the second treatment group over being in the control group in terms of improvement in number and operation scores. For cognitive domain of comprehension, there were obvious merits associated with being in the second treatment group when compared to being in the control group. For the analysis cognitive domain, there were some benefits associated in receiving either of the two intervention package when compared to not receiving any intervention at all. For literacy, the results in Table 2.3.6 indicate that receiving the second intervention package was of clear advantage in improvement of reading scores but not in the improvement of speaking or listening scores. Strangely, the results also show that receiving the first intervention was, if anything, more disadvantageous than receiving no intervention at all in improvement of reading, 37 speaking or listening scores. These results are generally consistent with what was observed earlier when analyzing overall literacy scores across groups. Table 2.3.4: Mean scores for mathematics content areas by treatment a) Number and operations Treatment 1 Mean (T1) SE Baseline (B) 370.8 10.2 Midterm (M) 427.2 10.5 Change (M-B) 56.4 9.1 Treatment 2 Mean (T2) SE 360.4 8.3 433.1 9.9 72.7 6.4 Control Mean (C) 368.0 420.3 52.3 SE 9.4 12.4 10.1 Mean Difference T1-T2 T1-C T2-C 10.4 2.8 -7.6 -5.9 6.9 12.8 -16.3 4.1 20.4 * Treatment 1 Mean (T1) SE 363.9 9.1 427.8 8.9 63.9 8.6 Treatment 2 Mean (T2) SE 373.9 6.8 423.7 9.0 49.9 8.9 Control Mean (C) 389.0 419.4 30.3 SE 8.2 10.5 11.0 Mean Difference T1-T2 T1-C T2-C -10.0 -25.1 -15.1 4.1 8.4 4.3 14.0 33.6 ** 19.6 Treatment 1 Mean (T1) SE 356.2 11.4 419.9 11.3 63.7 11.7 Treatment 2 Mean (T2) SE 373.6 8.2 422.5 10.7 48.9 11.3 Control Mean (C) 375.6 405.3 29.6 SE 8.4 11.7 10.0 Mean Difference T1-T2 T1-C T2-C -17.4 -19.4 -2.0 -2.6 14.6 17.2 14.8 34.1 ** 19.3 b) Measurement Baseline (B) Midterm (M) Change (M-B) c) Space and data Baseline (B) Midterm (M) Change (M-B) 38 Table 2.3.5: Mean scores for mathematics cognitive areas by treatment a) Knowledge Treatment 1 Mean (T1) SE Baseline (B) 365.2 9.0 Midterm (M) 419.3 10.3 Change (M-B)54.2 9.9 Treatment 2 Mean (T2) SE 366.0 9.4 405.7 9.4 39.8 10.5 Control Mean (C) 369.0 402.1 33.1 SE 9.7 11.3 11.9 Mean Difference T1-T2 T1-C T2-C -0.8 -3.8 -3.0 13.6 17.2 3.6 14.4 21.1 6.7 b) Comprehension Treatment 1 Mean (T1) SE Baseline (B) 366.5 9.7 Midterm (M) 432.4 9.8 Change (M-B)65.9 8.1 Treatment 2 Mean (T2) SE 366.8 7.4 440.7 8.9 73.9 7.4 Control Mean (C) 372.6 418.8 46.3 SE 9.0 10.9 9.5 Mean Difference T1-T2 T1-C T2-C -0.3 -6.1 -5.8 -8.3 13.6 21.9 -8.0 19.6 27.6 ** Treatment 2 Mean (T2) SE 365.0 7.4 426.9 9.3 61.9 8.4 Control Mean (C) 375.4 419.4 44.0 SE 8.8 12.1 10.7 Mean Difference T1-T2 T1-C T2-C -0.3 -10.7 -10.4 -7.0 0.5 7.5 -6.7 11.2 17.9 Treatment 2 Mean (T2) SE 382.0 9.1 415.5 10.0 33.5 10.8 Control Mean (C) 398.2 401.8 3.7 Mean Difference SE T1-T2 T1-C T2-C 10.2 0.2 -16.0 -16.2 11.8 12.7 26.4 13.7 11.9 12.5 42.3 **29.8 * c) Application Treatment 1 Mean (T1) SE Baseline (B) 364.7 8.9 Midterm (M) 419.9 11.1 Change (M-B)55.2 11.1 d) Analysis Treatment 1 Mean (T1) SE Baseline (B) 382.2 11.3 Midterm (M) 428.2 12.4 Change (M-B)46.0 13.9 39 Table 2.3.6: Mean scores for literacy content areas by treatment a) Reading Baseline (B) Midterm (M) Change (M-B) Treatment 1 Mean (T1) SE 403.0 10.1 435.2 10.3 32.3 7.0 Treatment 2 Mean (T2) SE 370.5 9.2 448.6 9.3 78.1 5.6 Control Mean (C) 370.7 421.9 51.3 Treatment 1 Mean (T1) SE 388.4 9.0 415.9 9.8 27.5 9.8 Treatment 2 Mean (T2) SE 376.4 9.3 410.1 8.3 33.7 9.3 Control Mean (C) 359.2 404.9 45.8 Treatment 1 Mean (T1) SE 409.3 10.3 410.2 11.0 0.8 12.9 Treatment 2 Mean (T2) SE 389.3 9.0 415.2 8.1 25.9 9.3 Control Mean (C) 364.4 419.3 54.9 SE 12.3 12.0 8.7 Mean Difference T1-T2 T1-C T2-C 32.5 32.3 -0.2 -13.4 13.3 26.7 -45.8 **-19.0 * 26.8 ** SE 12.0 10.2 11.8 Mean Difference T1-T2 T1-C T2-C 12.0 29.2 17.2 5.8 11.0 5.2 -6.2 -18.3 -12.1 SE 10.9 11.2 12.1 Mean Difference T1-T2 T1-C T2-C 20.0 44.9 24.9 -5.0 -9.1 -4.1 -25.1 -54.1 **-29.0 * b) Speaking Baseline (B) Midterm (M) Change (M-B) c) Listening Baseline (B) Midterm (M) Change (M-B) 2.3.4 Effects of intervention on student scores The effects of the interventions on student mathematics and literacy scores were further examined in multiple regression models, controlling for key potential intervening factors that might not have been perfectly balanced across treatment and control groups and are known to be predictors of learning outcomes. For each subject, three separate regression models were run to make controls across three groups of students – C, T1 and T2. In the first regression model (to be called “Model 1”), C group was compared with T1 group; in the second model (“Model 2”), C group was compared with T2 group, and; in the third model (“Model 3”), the two treatment groups (T1,T2) were compared. The outcome variables in these regression models were student midterm scores in mathematics or literacy. In each model for each subject, controls were made for student baseline score, student home wealth background, student age, grade level and site. The results for the regression analyses for the three models for mathematics and literacy are shown on Table 2.3.7 and Table 2.3.8 , respectively. For mathematics, the results in Table 2.3.7 indicate 40 that, after taking into account student achievement at baseline and other key predictors of learning achievement, there was no significant difference between Treatment 1 and the control group. However, the girls in the second intervention group significantly outperformed the girls in the control group at 5% significance level. These regression results are more or less consistent with the mathematics results reported earlier using DD approach. For literacy, as was observed using the DD approach, the regression results in Table 2.3.8 also indicate that the girls in the first intervention group were significantly (at 10% level) outperformed by their counterparts in the control group. In addition, the results show that the girls in the second intervention group significantly outperformed both the girls in the control group and those in the first intervention group at 5% significance levels. Again, these literacy regression results are consistent with the results obtained using the DD approach. Table 2.3.7: Regression models for mathematics achievement Model 1: Treatment 1 vs Model 2: Treatment 2 vs Model 3: Treatment 1 vs Control Control Treatment 2 (N=197) (N=233) (N=228) Metric Coef. Variable# (Constant) Student math baseline score Student home wealth index Being from Viwandani Being in Treatment 1 group Being in Treatment 2 group Being in Control group Student age in years B Std'ze d Coef. SE (Beta) 194.7 70.0 6 8 Metric Coef. pvalue 0.006 * 0.81 0.08 0.62 0.000* B Std'ze d Coef. SE (Beta) Metric Coef. pvalue B SE 225.3 67.0 6 5 0.001 89.85 54.92 * 0.83 0.07 0.60 0.000* 0.88 0.06 Std'zed Coef. Beta pvalue 0.103 * 0.71 0.000* -0.61 4.96 -0.01 0.902 -2.31 4.45 -0.04 0.604 -2.60 4.63 15.9 - 14.3 -6.39 4 -0.03 0.689 10.36 8 -0.05 0.472 17.68 14.92 11.0 12.42 2 0.06 0.261 * 19.59 9.69 0.10 0.044* 0.67 9.09 -0.05 0.575 -6.78 4.55 -0.09 0.137 -9.80 4.21 -0.13 0.021 0.63 3.72 11.5 * 11.5 * Being in Standard 8 27.62 5 0.14 0.018* 39.52 0 0.20 0.001* 13.53 9.80 R Square 0.46 0.50 0.53 0.01 0.866 41 0.10 0.238 0.00 0.942 0.07 0.169 Table 2.3.8: Regression models for literacy achievement Model 1: Treatment 1 vs Model 2: Treatment 2 vs Model 3: Treatment 1 vs Control Control Treatment 2 (N=214) (N=246) (N=246) Std'ze Std'ze Metric d Metric d Metric Std'zed Coef. Coef. Coef. Coef. Coef. Coef. (Beta) p(Beta) ppB SE value B SE value B SE (Beta) value Variable 214.7 66.9 253.5 59.0 (Constant) 8 0 0.002 9 9 0.000 133.47 53.04 0.013 Student literacy * * * 0.76 0.05 0.74 0.000* 0.72 0.04 0.72 0.000* 0.80 0.04 0.78 0.000* baseline score Student home wealth * 11.11 5.07 -0.15 0.030* -0.90 4.44 -0.01 0.839 -6.33 4.64 -0.10 0.174 index Being from 16.1 14.4 18.36 3 0.08 0.256 -8.43 1 -0.04 0.559 24.88 15.07 0.12 0.100* Viwandani Being in Treatment 1 - 10.9 group 18.88 7 -0.08 0.087* Being in Treatment 2 * * group 19.54 9.37 0.09 0.038* 35.00 8.89 0.17 0.000* Being in Control group Student age in years -4.22 4.58 -0.05 0.358 -8.04 3.98 -0.09 0.045 -1.81 3.57 -0.02 0.613 11.0 10.3 * * Being in Standard 8 16.59 5 0.07 0.135 36.17 0 0.16 0.001* 20.47 9.11 0.10 0.026* R Square 0.56 0.61 0.63 Notes: * Significant at 10% level; ** Significant at 5% level; Variable is not available for inclusion in this model; # More details about the predictor variables can be found in Appendix 6. 42 3 Community reflections of the education intervention This section highlights parental and community reflections with the education intervention one year after the program was rolled out in two informal urban settlements in Nairobi, Kenya. Reflections were narrated in focus group discussions (FGDs) and in-depth interviews with parents of girls in grades 7 and 8, and community gatekeepers in both Korogocho and Viwandani. In this section, we highlight community gatekeepers’ and parents reflections on the outcomes of the intervention, and secondly, we will highlight community gatekeepers and parents reflections on lessons learned during the intervention period. 3.1 Experience with and outcomes of the intervention The community gatekeepers in this study were the chiefs of both Korogocho and Viwandani and their respective elders, who assist them in running of the day to day activities in the two sites. The parents whose perceptions are shared in this section, were parents of girls in classes 7, and 8 who are part of the study sample. The main purpose of this subsection is to document the impacts of the education intervention, one year after the onset of the intervention. This is being done from the reflections of the parents whose daughters are in the program, and from interviews with the chiefs and village elders. Under the outcome of the intervention we identified six thematic categories that show the midterm impacts of the intervention. These include: improvement in the general performance of girls; improved communication; increased knowledge, motivation, positive attitude and aspects behavior change among girls and parents; and trickling effect of the life-skills into the households. Some community gatekeepers, and parents particularly in Korogocho spoke very enthusiastically about their experience and perceived benefits of the program at the midterm. 3.1.1 Improvement in the general performance of girls One of the intended outcomes of this intervention was to improve the performance of girls in literacy and numeracy. The underlying assumption was that girls who come from poor backgrounds such as Korogocho and Viwandani lose out on the opportunity to learn as a result of inadequate time to study in school, and inadequate parental support at home. Lack of parental support was, in part, due to parents’ unavailability to help with homework and girls’ higher burden of domestic work as compared to their male peers. Inadequate time spent on school work rendered girls unable to perform well in their studies. The reflections of the community gatekeepers give a ray of hope in the two communities of Korogocho and Viwandani. For instance, the community 43 gatekeepers explain that girls are beginning to improve in their schoolwork. The improvement is a result of parents beginning to give girls time to read, do their homework, and listen to their daughters more. As a result of all this, girls in the program are becoming more confident and are able to compete favorably with the boys. The chief explains: …I would say that girls are no longer weak like people used to assume. They have shown through their performance…Parents never used to give the girls time to revise and read but now the parents are actually listening to the girls…I have seen girls do very well and even compete with the boys…Now we are seeing girls getting 380 and the boys do not even get that. Girls have realized they are capable of doing well just like the boys… The community gatekeepers also lauded the network of the volunteers in the community who have been brought together as a result of the partnership between the African Population and Health Research Center (APHRC) and Miss Korogocho who have intensified the after-school support sessions in pursuit of excellence in Mathematics and English. In the views of the community gatekeepers, and particularly the chiefs, the mode of the after-school support is unique. The chief of Korogocho had this to say: Girls do their homework and are assisted in English and Mathematics during the weekends…We have mentorship and after-school coaching which helps the girls to do their homework and also to develop a liking to the subjects…like mathematics and English. These are subjects that girls did not like before…In this community, we have community teachers who are volunteering to teach them during weekends, holidays and after-school to encourage them to have that need of passing the exams. So, we have done it differently by coaching them in the evening or weekends… According to the village elders, parents are responsible for ensuring that girls attend school. A year ago, the community leaders had underscored their role as ensuring girls’ school attendance, and they held parents accountable. A year later the community leaders report that it is parents who have taken the initiative to counsel fellow parents and motivate them to take their daughters to school. The Korogocho chief had this to say: …They also have their own meetings either in groups at the village level to discuss parents who are in one way or the other unable to take girls to school or those who do not want to 44 take girls to school. So, they warn them, encourage them and tell them what the policy of the government is… Parents explained their responsibility to ensure that girls improve in their studies by making constant follow-up with their daughters and the teachers. This move was to ensure that the teachers are teaching and the girls are learning. During the baseline, parents had emphasized on girls’ school attendance, timely home return from school, and completion of their school work. Whereas the follow-up was evident in Korogocho at baseline, the emphasis on following up with teachers to ensure that they were teaching, and girls were learning was evident in both treatment enumeration areas of Korogocho and Viwandani. This is what a parent attending a female FGD in Korogocho in a treatment zone said: Follow up your child to know, what the teacher taught, the homework the teacher gave her….then sit to do homework. Check what the teacher is teaching your child, and if you don’t understand anything, go to the school and see the teacher and sit and talk and agree. Likewise the parents in the treatment zone in Viwandani recognized the general improvement of girls in the exams done at school level, in addition to being aware of the happenings within their surroundings. The female parent in an FGD explained, if she sees anything bad …she comes and tells me. So, I see that these teachers are teaching them very well. And even in exams, last term she did very well. She got good marks and was in a good position. Moreover, parents in Viwandani noted some improvements in mathematics and literacy as a result of the after-school. The parents in Viwandani explained that girls are constantly improving in mathematics and reading. This is the excerpt from a parental FGD in Viwandani in a treatment site explaining the progress in math and reading: …Math was stressing her, but now when she comes home from school, she does her math well and, I do not even see her asking the one who is in secondary school. She picks her books and does it on her own…I can see that the child is doing well; she used to have reading problems. If you told her to read a sentence she would have difficulties but now she has improved and can read. Moreover, the after-school support sessions were lauded by the parents as having inculcated into the girls a sense of commitment and hard work. Girls would go for their studies in school and 45 thereafter, proceed to attend the afternoon sessions. Girls became occupied with the after-school support sessions and there was hardly time to loiter around in the community. A parent in Viwandani who representing Treatment site had this to say: …I see that they have been helped…there are those who are in the schools for tuition now and they will leave at 1pm, in the afternoon they should not be loitering…but because of that tuition (meaning after-school support) they are occupied. So, I see that they have been helped by being committed… 3.1.2 Improved communication At the baseline, parents and community elders were of the opinion that schools could not do it alone in respect of girls’ education. Schools needed the support of the other stakeholders—parents and community members. At baseline parents, as members of the community proposed a collaborative model involving schools, teachers, girls, and the communities around the schools. Both parents and community stakeholders thought that a communication model—“communitycommunication-knowledge”—would be ideal in forging collective responsibility towards girls’ education. The key message from the parents pointed to the importance of communication among each of the stakeholders who are engaged with girls’ education. Parental narratives at midterm underscored the importance that communication between parents and their daughters in the household. The importance lies in improving the flow of information between parents and their daughters, thereby enhancing girls’ school performance. The importance of communication was a common-thread throughout the discussions during the FGDs in both treatment zones of Korogocho and Viwandani. Improvement in communication was noted several months after the start of the intervention in the process of the monitoring. At midterm, parents, particularly in the Treatment 1, who receive both the after-school support and the parental counseling component, described a process that has enabled them to feel empowered to effectively communicate with their daughters. Parents, have been able to effectively talk to their daughters, and avoid being harsh to their daughters, a phenomenon that was pushing their daughters farther away from the parents. The consequence of the harshness was that girls were continually missing out on the critical parental warmth and 46 support. This is a representation of what parents as members of the Korogocho community thought in regard to the role that communication has played in making them effective parents, enabling them to play a critical role in the lives of their daughters in respect to their schooling. A parent attending an FGD in Treatment 1 in Korogocho had this to say: …Used to be very harsh and all the time I used to quarrel them….Having been taught here, I discovered that I was going wrong. So, when she goes to school her school marks… used to be low, but nowadays it has improved and she is continuing to do well and she is reading [emphasis added]… and I am taught not to make noise, because this girl may be having something that is disturbing her, and I don’t know what is disturbing her….Here she is called and talked to and she listens. So, I have seen that it has helped us a lot on how to motivate them in their studies, now she is studying and doing her homework [emphasis added]. As a result of the open communication channels, girls have become more open with information to their parents and can easily hold candid conversations without hiding any information from their parents. A parent attending an FGD from Treatment 1 in Viwandani explained: Nowadays they don’t hide….when she comes she will not hide but tell you, mama it was this and that…Based on how they are taught there, they are taught well on the Saturday…They are taught good things on how they are able to stay and live and to learn. From the parental narratives, the challenges of slum life have reinforced their belief in the community social capital that they expressed at baseline, in order to sustain the dream for their daughters educational opportunities. Parental guidance and counselling has enhanced parental belief in the potential of their daughters. Parental guidance and counselling has demonstrated that open communication between girls and their parents is critical towards building an academically supportive relationship. Parental narratives show that open communication was extended to between parents living within the same community, so as to monitor, mentor and guide girls in the absence of their own parents and guardians. A parent attending an FGD from Treatment 1 in Korogocho said: “ …then agree with these parents…when your child is within range of the other parents, and if your child is moving in the wrong direction, she will be called, and made to sit down 47 and be talked to like their own child…So, if anything happens to one of the children, and if she cannot tell the parents, your child will come and tell you…You will go to the parent…sit down …with your daughter and talk to her or you give the children the morale to work hard. So, when one wants to do something bad, the others will warn the other, and tell her that you know your mum will know… The community leaders expressed confidence and satisfaction with the outcome of the parental component of the intervention. They explained that parents have taken it upon themselves to counsel and encourage other parents in order to sustain some of the key messages that they learn at the sessions, particularly on the need to take their daughters to school. The chief of Korogocho explained it in this way. They also have their own meetings either in groups at the village level to discuss parents who are in one way or the other unable to take the girls to school, or those who do not want to take the girls to school. So, they warn them, encourage them, and tell them what the policy of the government is… 3.1.3 Increased knowledge, motivation, positive attitude and initial indications of change in behaviour Increased knowledge, motivation and initial indications of change in behaviour among both girls and parents was a short term outcome of the intervention, as exposed by parents who were, and whose daughters were exposed to the intervention. Parents appreciated the knowledge that girls had acquired from interacting with mentors in the after-school support sessions. They were of the opinion that girls had learned skills that they did not previously know. Moreover, aspects of the skills learned had encouraged girls to think differently, was motivating them in their school work, and to do things differently in the households. Parents in Korogocho and in a treatment site had this to say: …R4: I am grateful because when she came here, she has been taught a lot of things that she didn’t know about …R4: And now she knows and this will help her. But, if they had left them alone she wouldn’t know anything. So, I am thankful for the start of the project, it is educating our children, it motivates them, and makes them think. 48 In Viwandani, parents explained that their daughters had shown a lot of changes in terms of their behavior. They perceived that their daughters’ behavior was different as compared to what they had been observing in the previous months. This was attributed to learning received at the afterschool support centers. A Parent who was part of an FGD in Viwandani in Treatment 1 explained this initial indications of positive change in behavior in this way: I have seen that they are changed…based on the education, and how they are progressing, it is not bad. There is a difference in the past months. Even my own child, I see that she has changed; she is not the same she used to be… In addition, parents identified specific ways in which tendencies in change of behaviour among girls was occurring as a result of this intervention. This is included and not limited to changes in the company of peers that their daughters kept; girls stopped loitering within the community; those girls who were formerly not obedient to their parents were now more obedient. Therefore, parents registered a great deal of satisfaction with the changes that were being exhibited by their daughters. A parent in attending a FGD in a treatment site in Viwandani explained: …She has changed the bad company that she had, and she is no longer with them…She has moved to the good company. So, if she is changed like this, even in her studies, she will do well…R3:This tuition helps because the child has no time to loiter, when she leaves tuition she comes to the house to do her homework and she no longer has time for loitering and that has helped a lot…R4:Even mine has changed, in the past, at times, you would send her and she would refuse to go but now she does work well, remembers her homework, and all is well and she is doing very well… Parents also appreciated the knowledge that they had acquired from interacting with the counselors during the counseling sessions. They felt that as parents they had learned skills that had enabled them to acquire knowledge on various aspects of parenting that empowered them as parents to deal with issues affecting their daughters. Moreover, aspects of the skills learned had encouraged parents to think differently, motivating them to treat their daughters in a manner that that they would feel encouraged to continue with their schooling. This was explained well by parents who had undergone both parental counseling and whose daughters had also attended the after-school support sessions. This is what a parent attending an FGD in Korogocho intimated: 49 …on my part, I can say this of Miss Korogocho…they have helped a lot. I had not known how to stay with girls, but it has helped me a lot. It has taught me on how to stay and talk to girls [emphasis added] whereas previously I did not know. I was very harsh, but since I started coming here, I have learned how to talk to my daughter and she has also known which good words to use. When I was growing up, I didn’t know anything…our parents never sat us down and talked to us [emphasis added]. But, I want to praise this project, it has helped my child who is a girl. So, that she grows knowing how life is…Parents have been counseled and learned ways of dealing with their daughters [emphasis added]. I thank Miss Korogocho as they have taught me how to stay with a girl child. They have made me understand a situation that I would not have known, and I have known based on the studies that I have got from here at Miss Korogocho [emphasis added]. In addition, parents in Korogocho underscored the positive attitude that counseling sessions has instilled in most of them. As a result of the positive attitude, and what they have learned the parents have begun to advocate for the learning to be extended to other parents within and beyond Korogocho community. The excitement of what parents have learned is motivating them to want to share this information with other parents. This is how the parents described what should happen, as a result of what they have learned, which has transformed their attitude to being one that is positive towards their daughters’ education. This what a parent in an FGD in the treatment site in Korogocho said: …And they should teach more parents …We who are here, and have been taught, if you meet another parent who has not been taught yet and is going in a direction that is not understood, be a teacher to her, explain to her and if she does not hear you, later she will sit down and think I was told this by this parent but I did not listen; instead of leaving her as she destroys her home and you sit laughing and badmouthing her, you haven’t helped her in any way. The community leaders also appreciated and underscored the positive attitude that was an outcome of the counselling sessions. They observed that as a result of the positive attitude, parents had seen the need to counsel other parents, in order to motivate and encourage them to take their daughters to school. The chief of Korogocho explained it in this way: 50 They also have their own meetings either in groups at the village level to discuss parents who are in one way or the other unable to take the girls in school or those who do not want to take the girls to school so they warn them, they encourage them and tell them what the policy of the government is… Moreover, parents in Korogocho also expressed the need to use what they had learned in the counseling sessions to help trigger change in behavior among girls. With the same excitement that they had learned skills in the counseling sessions, parents felt motivated to share this information with their daughters, and daughters of other parents in the same community. This is how a parent echoing the thoughts of other parents described what they should do with the information that they received to trigger change among girls in the community: …Sit with her and explain it to her, and solve the issue that she has. If it is a neighbor’s child, sit with her and talk to her. Also, call her parent and talk to her. Instruct her on the path that she can use to make this child talk. Because you were freely given, you should do the same and give out freely, instead of sitting and not helping out your neighbor, and you sit and laugh at her as her house burns… Parental narratives also showed that the outcomes of the intervention in the first year and particularly, among girls who made a transition to secondary school was a great motivator to the current cohort of girls in the intervention. Motivation as an outcome of the intervention was explicitly expressed by parents attending FGDs in Korogocho. In their own opinion, the success exhibited by the two organizations—Miss Korogocho and the African Population and Health Research Center (APHRC)—of ensuring girls who attained the 250 marks were able to join secondary school, and this a great motivator to those girls who were still in the program. Parents were optimistic that the current cohort of girls would perform even better. A parent explained: …I didn’t know that my child could join secondary school, because, I didn’t have money…But when they called us in the meeting and gave me money…my child is in school and is now studying. I have never seen any other project other than this one by Miss Korogocho, where I got help. …In this project they came and took our children…and the promises that they made...So, when Miss Korogocho promised them, if they get 250 and above marks…they kept their promise…So, it motivates this current class eight to do much 51 better. Because the other class was doing it just as a trial, but once they got it, the ones that are following them will want to do even much better… 3.1.4 Trickling effect of the life-skills and the counselling within the community Parents and community leaders’ narratives also highlighted the important aspect of the outcome of the intervention, which was the trickling effects of aspects of the intervention to other community members. The trickling effect can be attributed to the positive attitudes that both girls and their parents adopted after attending both after-school support and counselling sessions. Girls transferred the skills that they had learned in the life skills sessions to their siblings in the households. A parent attending an FGD in Viwandani had this to say: “The way she is taught is the same way I see her teaching the younger one. She tells her we have been taught like this and we are supposed to stay like this” The parents also contributed to the trickling effect of the intervention to other parents within the community. Driven by the excitement of what they had learned during the counseling sessions, parents were eager to share with other parents, ways to motivate their daughters, in order to keep them in school. One of the parents attending an FGD in a treatment zone in Korogocho said: …And they should teach more parents …We who are here, and have been taught, if you meet another parent who has not been taught yet and is going in a direction that is not understood, be a teacher to her, explain to her and if she does not hear you, later she will sit down and think I was told this by this parent but I did not listen; instead of leaving her as she destroys her home and you sit laughing and badmouthing her, you haven’t helped her in any way. The community leader in Korogocho attested to the strides that have been made in Korogocho in terms of some parents holding meetings and taking time to explain to other parents the importance of this education intervention, and thereby motivating other parents to take their daughters to school. The chief of Korogocho echoed this sentiment: They also have their own meetings either in groups at the village level to discuss parents who are in one way or the other unable to take the girls in school or those who do not want to take the girls to school so they warn them, they encourage them and tell them what the policy of the government is… 52 3.2 Vital lessons learned during the course of the intervention This section covers vital lessons that have been learned and shared as part of the community leaders and the parents’ reflections with the intervention. One of the outstanding lessons that have been learned in the process of the intervention is concerted effort in support of girls’ education by all the stakeholders, whether public and private. 3.2.1 Concerted effort in support of girls’ education by all the stakeholders The theme concerted effort in support of girls’ education has come out very strongly one year after the onset of the intervention espoused by the community leaders, particularly in Korogocho. At the baseline, parents had pointed out the need for unity of purpose and collaboration in ensuring that girls attend, and continue with school. Consequently they had proposed a multipronged approach—with parents, the community, and teachers forging a close working relationship with their children—if success was to be attained in terms of access to school for girls. One year later the community leaders led by the chief as the gatekeepers of the Korogocho community point out the existence of a concerted effort that goes beyond the existence of Miss Korogocho and APHRC that is keeping a sustained effort to ensure that girls are getting the education they deserve. This is the way in which the chief of Korogocho explained the phenomenon of the concerted effort: …So, I would like to congratulate APHRC, Miss Korogocho, Ujamaa who is giving loans, the teachers, the community leaders, and also the national administration for becoming actors to ensure that the girls are getting education like any other child… In the Chief’s opinion, this concerted effort has been possible through constant communication among the stakeholders facilitated by the chief. The communication has been very instrumental in facilitating resolution of conflicts among parents, their daughters, and teachers. Thereby fulfilling, the wish of parents at baseline for a multipronged approach in tackling issues related to girls education—with parents, the community, girls and teachers forging a close working relationship. The Korogocho Chief put it this way: … We are in constant communication with the headmaster and management of the school. Any time there is conflict between a girl and a teacher, or a girl and a parent, we quickly intervene to resolve the conflict, to assist the girl to continue with her education. That is why I told you one of my roles is resolving conflicts… 53 In addition, the community gatekeepers have advocated for targeted communication to the relevant stakeholders to ensure that girls not only attend school, but get targeted information that is relevant in tackling one of the major challenges that had been identified at the onset of the intervention. From the perspective of the community gatekeeper, this is what they have done so far to ensure that girls get an education: …ask the parents and the teachers to give the information to these girls. Tell them the dangers of early pregnancy, and dangers of early marriage…So we teach them as parents, as teachers in church we have programs that talk about reproductive health but we also have some NGOs like the one I mentioned of Miss Korogocho they also teach them about reproductive health. The Viwandani chief was also categorical that as government representatives, they have also learned that their role is to constantly sensitize the parents, community members so that they can work closely with other government departments to ensure that girls attend school. In so doing, the community can begin to chip away at some of the challenges that plague girls’ education. This is what the Viwandani chief said, “…what we are supposed to do is to keep on encouraging them (meaning parents and community members) to deal closely with the other departments...” Moreover, the concerted effort has been made possible by the community gatekeepers—the chiefs attending the Parents and Teachers Association (PTA) meeting and holding baraza’s to underscore the importance of education of girls among the parents in their respective communities of Korogocho and Viwandani. In the meetings the community gatekeepers continually talk to the parents about the importance of education for their daughters. In both Korogocho and Viwandani, the community gatekeepers have continually sensitized the parents on the need to keep their daughters in school. The chief of Korogocho explained their role as community gatekeepers: …So, we have talked to the parents and we continually talk to them. I attend all the PTA meetings when schools are closing. I speak to them during these meetings about education. I also speak to them in the community meetings and even in the baraza still on education… The parents’ narratives also echoed similar sentiments of the community gatekeepers by calling for concerted effort among parents. That parents should be able role models to one another, teach those parents who are yet to internalize the importance of their daughters education. Parents 54 intimated that it is only with parents forming a closely knit group that they can be useful to one another and in turn help their daughters to navigate the challenges of schooling. Be a role model and show other parents in the right way…And they should teach more parents …We who are here, and have been taught, if you meet another parent who has not been taught yet and is going in a direction that is not understood, be a teacher to her. Explain to her and if she does not hear you, later she will sit down and remember. I was told this by this parent but I did not listen, instead of leaving her to destroy her home and you sit, laugh and badmouth her. You have not helped her in any way. If it is a neighbor’s child sit with her and talk to her. Also, call her parent and talk to her, instructing them on the path that he/she can use to make this child talk. Because, you were freely given (referring to the counseling sessions), you should do the same and give out freely, instead of sitting not wanting to help out your neighbor but you sit laughing at her as her house burns… The narratives of parents and community leaders also pointed to the need for developing partnership by all the key stakeholders, whether public or private. At the baseline, parents had called for partnerships the community of parents around the school, nongovernmental organizations, and the government. This was as a result of the prevalent of other problems affecting the education of girls outside the households. The community leaders acknowledge the presence of several actors that have become interested in education of girls. If well managed, this partnership can motivate girls to go beyond primary school. 55 4 Discussion The improving learning outcomes and transition to secondary school is a three year intervention study which started in 2013 with the baseline survey being conducted in the month of June 2013, with the intervention kicking off in July of the same year. The overall goal of this study is to improve learning outcomes and transition to secondary school through community participation and after-school support among disadvantaged girls in urban informal settlements of Nairobi. This is to be achieved through increasing access and transition to quality secondary education among girls living in the urban informal settlements, and through parental and community support. The expected outcomes of the study are increased attendance, improved learning outcomes and transition to secondary schools for girls in grades 6, 7 and 8 from poor households. Between the baseline and midterm girls in grades 7 and 8 were exposed to 12 months of after-school support and mentoring, while their parents were exposed to guidance and counseling for the same period. The midterm evaluation was conducted with the aim of enumerating the short term outcomes of the study during the year, specifically, evaluating the progress of the intervention, and achievements. The results of the midterm evaluation will be used to inform the processes of the intervention in the third year of implementation. The midterm evaluation study sought to answer the following questions: 1) Does the after-school learning support and mentoring lead to improved learning outcomes; 2) Does subsidizing the cost of first secondary grade entry increase the transition of girls to secondary schools; and 3) How does increased awareness about the challenges of girl’s education in the community by parents and community leaders lead to increased support for and improved learning outcomes among girls. The results show that in Treatment 1 (that receives both the after-school support component and the parental component), transition to secondary school was significantly higher among the least poor households than the middle poor (27 percentage point difference). In Treatment 2, transition was more less the same across the wealth index. A plausible explanation could be that the subsidy provided to parents at the point that their daughters exit grade 8, may be too late in the day for the poor parents, in changing the wealth status of the households. In future scale up, the subsidy should be accompanied by direct cash transfer into the household particularly for poor parents. In terms of extra tuition, the proportion of girls reporting receiving extra tuition increased significantly by 10 percentage points. For instance, a significantly a higher proportion (87%) of girls in Treatment 56 1 received extra tuition as compared to 78% in the control group. Treatment 2 had the least number of girls receiving extra tuition and this was significantly lower than Treatment 1 and the control groups. Moreover, findings show a significant association between number of days girls take home work and treatment groups. For instance, the proportion of girls coming home with homework for at least 3 days in a week increased from about 83% in baseline to about 94% in the midterm. Homework support was highest among treatment group 2, with about 38% percent of the parents reporting they at least usually someone in the households supports the girl in her homework as compared with 19% and 24% of the treatment one and control parents. We think that this is as a result of the parents in the Treatment 1 being aware that girls are being supported by mentors in their homework and have a trust with the program. This is clearly shown by the high proportion (about 44%) of parents in the Treatment 1 reporting to sometimes support their girls with homework compared to 29% in Treatment 2 and 33% in control group. The results of analysis using combined data from Viwandani and Korogocho revealed that the two intervention packages are working well to improve student mathematics scores. However, the intervention package without the parental component (T2) seemed to work well in improvement of literacy scores. The analyses of the data by site revealed that both interventions (the after-school support, and the after-school support and the community component) are showing short term impacts on improved math scores in Viwandani. The analyses also revealed that second intervention was working well in improvement of literacy scores in Viwandani but the first intervention was not. On the contrary, the intervention packages are not showing any short term impacts in Korogocho. Therefore, it is recommended that the implementation approaches of the two intervention packages in Korogocho be examined with a view of making them work in this site. The implementer in Korogocho can perhaps learn from implementation strategies in Viwandani where the interventions, especially the after-school support without parental involvement seem to be working quite well for both subjects. Finally, it is worth noting that, for both Mathematics and English, the effects of the after-school support without parental component (T2) was significant at 5% level even after taking into account student achievement at baseline and other key predictors of achievement such as age, home wealth background and grade level in regression analyses. Put in other words, even after taking into 57 account the imbalances between the treatment and controlgroups, the impact of the second treatment was still clearly evident. The midterm evaluation also sought to the effects of the interventions on girls behavior and consequently on achievement. Girls in the parental counselling intervention group had higher aspirations significantly compared to those in life-skills and after-school support package, and those in the control groups. Additionally, the parental counselling intervention did have an advantage on girls’ self-confidence over and above life-skills counselling provided directly to the girls and those in the control group. On social behavior activities, there is no significant differences between the two treatment arms, although the girls enjoying parental counselling component are significantly well behaved than those in the control arm. The girls with the parental counselling intervention reported significantly higher interest in schooling, an indication that parents could be reinforcing such interest. Girls in Treatment 2 felt their school is significantly unfriendly compared to those in Treatment 1, while on the other hand, those in control arm felt that their school are significantly unfriendly than those in the Treatment 1. This implies that the parental component has significant impact on the girls’ school friendliness among girls over those in Treatment 2 and control arms. The results reveal that there was no statistically significant difference between any two groups (i. parental counselling, life-skill counselling and after-school support; ii. life-skill support and after-school support; and, iii. control) in respect to, peer influence, sexual exploitation, substance use, sexual related activities, source of information on substance use, modes of infection and knowledge on HIV/AIDS and STIs. The qualitative findings show that community leaders and parents have observed a general improvement in girls’ lives, one year after the onset of the intervention. Parents note an improvement in math and literacy as a result of the after-school support. This finding corroborates the quantitative findings in both Viwandani and Korogocho, where the two intervention packages are working well to improve student mathematics scores. Moreover, the findings showed that the after-school support sessions have inculcated into the girls a sense of commitment and hard work. The commitment and hard work has been demonstrated among girls who are currently in the project, motivated by those who made a transition to secondary school. In addition, the narratives of the parents show that there was improved communication among the parents and their daughters. Improvement in communication was an outcome of the parental interaction with the 58 counselors during the counselling sessions. Consequently, parents, have been able to effectively talk to their daughters, and avoid being harsh, a phenomenon that was pushing their daughters farther away from them. Open communication has been extended between parents living within the same community, so as to monitor, mentor and guide girls in the absence of their own parents and guardians. The narratives show that as a result of parental counselling, parents developed a positive attitude towards their daughters and towards girls’ education. As a result, parents have taken it upon themselves to counsel and encourage other parents in order to sustain some of the key messages that they learn at the sessions, particularly on the need to take their daughters to school. As a result of the positive attitude, and parents wanting to be advocates, is key to the sustainability of the project outcomes beyond the duration of the project. Moreover, parents stated that they had learned skills, and acquired knowledge on various aspects of parenting that empowered them as parents to deal with issues affecting their daughters. Most importantly, there was an observed trickling effect of the tenets of counseling among parents and life skills into the households. The trickling effect can be attributed to the positive attitudes that both parents and their daughters adopted after attending both after-school support and counselling sessions. On the part of the girls, they transferred the skills that they had learned in the life skills sessions to their siblings in the households. On the part of the parents, they acted as motivators to fellow parents to take their daughters to school. The narratives underscored the existence of a concerted effort among the stakeholders in order to sustain the efforts of ensuring girls get the education they deserve. In conclusion, though some results are mixed, the midterm review show some short term positive outcomes of the intervention, particularly the arm with the parental component. It is important to inform and actively involve parents if one wishes to improve the learning outcomes among girls from poor urban households such as those in Korogocho and Viwandani slums. The intervention has also important implication for the program implementation in the last year. Some of the results of the mid-term review will be shared with the implementing partners to ensure that they tighten the implementation in 2015. It will be interesting to see how the results look at end-term evaluation in 2015. 59 References Fereday, J., & Muir-Cochrane, E. (2006). Demonstrating rigor using thematic analysis: A hybrid approach of inductive and deductive coding and thematic development. International Journal of Qualitative Research, 5(1), 1-11. Hungi, N. 2010. What are the levels and tends in grade repetition. SACMEQ Policy Issues Series, Number 5, September, 2010. Paris, France. Retrieved on 21/10/2014 from http://www.sacmeq.org/sites/default/files/sacmeq/reports/sacmeq-iii/policy-issue-series/005sacmeqpolicyissuesseries-graderepetition.pdf Ministry of Education, Kenya. (2012). A Policy Framework for Education: Aligning Education and Training to the Constitution of Kenya (2010) and Kenya Vision 2030 and beyond, Nairobi, Kenya. Rice, P., & Ezzy, D. (1999). Qualitative research methods: A health focus. Melbourne, Australia: Oxford University Press. 60 Appendices Appendix 1: Main source of information on sex, drugs, smoking and alcohol Wave Baseline Midline 1257 1092 N Main source of information on sex Treatment groups T1 T2 650 912 Control 787 Study site Korogocho 1448 Viwandani 901 42% 51%* Teachers 20% 13% Television 14% 7% Radio 7% 13% Parents 10% 9% Friends 5% 4% Seminars 2% 0% Others 0% 1% Newspapers 1% 2% None Main source of information on drugs 52% 15% 12% 8% 8% 2% 1% 1% 1% 31% 25% 11% 13% 12% 5% 0% 0% 2% 58% 10% 10% 7% 7% 6% 1% 0% 1% 47% 16% 12% 9% 11% 4% 1% 0% 1% 45% 19% 9% 11% 7% 4% 1% 1% 2% 47% 50%* 51% Teachers 22% 20% 19% Television 8% 11% 9% Parents 11% 7% 10% Radio 6% 3% 5% Friends 3% 6% 2% Seminars 2% 2% 2% Newspapers Main source of information on smoking 41% 23% 11% 11% 6% 6% 1% 55% 21% 7% 6% 3% 5% 2% 46% 24% 8% 10% 4% 5% 2% 53% 16% 11% 8% 6% 4% 1% 48% 49%* 50% Teachers 17% 13% 14% Television 12% 10% 13% Radio 7% 15% 12% Parents 9% 4% 6% Friends 3% 6% 1% Seminars 2% 1% 2% Newspapers 1% 1% 1% None Main source of information on alcohol 42% 17% 13% 12% 7% 6% 2% 1% 55% 14% 7% 8% 7% 5% 1% 1% 45% 17% 13% 11% 7% 5% 1% 1% 54% 12% 8% 11% 8% 3% 3% 1% 38% 19% 14% 13% 8% 5% 2% 1% 54% 15% 8% 9% 7% 5% 0% 1% 43% 20% 10% 12% 7% 5% 1% 1% 53% 14% 12% 8% 7% 3% 2% 1% Teachers Television Parents Radio Friends Seminars None Newspapers 44% 18% 9% 14% 9% 3% 1% 1% 50%* 17% 13% 7% 5% 5% 2% 1% 50% 19% 10% 9% 7% 2% 2% 1% 61 Appendix 2: Knowledge about HIV/AIDS and STIs N Wave Basel Midline ine 1257 1092 Treatment groups T1 T2 Control Study site Korogocho Viwandani 650 100 100% 100% Heard of diseases % called HIV/AIDS? Heard of diseases 86% 98% 94% called STIs? Can a person get HIV/AIDS from (response=‘Yes’) Holding hands with 2% 1% 3% someone? Sharing needles used to inject (shoot up) 91% 90% 95% drugs? Being bitten by mosquitoes or other 14% 4% 5% insects? Using public toilets? 8% 10% 5% Having sexual intercourse without a 96% 91% 94% condom (rubber)? Being in the same class with a student who has HIV/AIDS 2% 2% 2% infection? Can a person get STIs from (response=‘Yes’) Holding hands with 1% 1% 1% someone Sharing needles used to inject (shoot up) 53% 61% 74% drugs? Being bitten by mosquitoes or other 11% 3% 4% insects? Using public toilets? 8% 10% 5% Having sexual intercourse without a 96% 91% 94% condom (rubber)? Being in the same class with a student 2% 2% 2% who has STIs? 62 912 787 1448 901 100% 100% 100% 100% 91% 89% 92% 90% 1% 1% 1% 1% 84% 93% 87% 96% 12% 15% 10% 6% 7% 4% 14% 18% 97% 90% 92% 97% 2% 1% 1% 3% 1% 1% 1% 1% 41% 62% 53% 63% 9% 15% 8% 6% 7% 4% 8% 18% 97% 90% 92% 97% 2% 1% 1% 3% Appendix 3: Dispelling myths about HIV/AIDS and STIs Wave Treatment groups Base Midl Treat line ine 1 1257 1092 650 N Treat 2 912 Cont rol 787 Study site Koro Viwanda gocho ni 1448 901 In your opinion (response=‘Yes’) Can you tell if people are infected with the AIDS virus (HIV) just by looking at them? Can a person who has the AIDS infect someone else during sexual intercourse? Can a pregnant woman who has AIDS infect her unborn baby with the virus? Is there a cure for HIV/AIDS? 11% 8% 6% 11% 11% 10% 9% 87% 83% 86% 82% 87% 91% 75% 71% 72% 63% 80% 68% 81% 56% 10% 6% 5% 10% 9% 10% 5% 7% 11% 7% 10% 11% 10% 8% 74% 83% 81% 76% 78% 84% 69% 43% 58% 46% 52% 51% 57% 39% 47% 72% 51% 62% 59% 59% 57% In your opinion (response=‘Yes’) Can you tell if people are infected with the STIs virus just by looking at them? Can a person who has the STI infect someone else during sexual intercourse? Can a pregnant woman who has STI infect her unborn baby with the virus? Is there a cure for STI? Appendix 4: Number of cases involved in mathematics and literacy data sets Mathematics Literacy Treat 1 Treat 2 Control All Treat 1 Treat 2 Control All Korogocho 65 52 47 164 77 56 51 184 Viwandani 31 80 54 165 30 83 56 169 96 132 101 329 107 139 107 353 Standard 7 43 77 50 170 55 83 54 192 Standard 8 53 55 51 159 52 56 53 161 96 132 101 329 107 139 107 353 Site Total Grade in 2014 Total 63 Appendix 5: Mean baseline and midterm scores by content and cognitive areas a) Mathematics scores by content areas Treatment 1 Treatment 2 Control 460 440 420 400 380 360 340 Baseline Midterm Baseline Mathematics Midterm Baseline Number Midterm Measurement Baseline Midterm Space & Data b) Mathematics scores by cognitive areas Treatment 1 Treatment 2 Control 460 440 420 400 380 360 340 Baseline Midterm Knowledge Baseline Midterm Baseline Comprehension Midterm Application Baseline Midterm Analysis c) Literacy scores by content areas Treatment 1 Treatment 2 Control 460 440 420 400 380 360 340 Baseline Midterm Literacy Baseline Midterm Reading Baseline Midterm Speaking 64 Baseline Midterm Listening Appendix 6: Predictor variables involved in the regression models Variable Notes Student baseline score# Mean=400; Standard deviation=100 Student home wealth index Mean=3; Standard deviation=1.6 Being from Viwandani Viwandani=1; Korogocho=0 Being in Treatment 1 group T1=1; Else=0 Being in Treatment 2 group T2=1; Else=0 Being in Controlgroup T1=1; Else=0 Student age in years Mean=14; Standard deviation=1.28 Being in Standard 8 Standard 8=1; Standard 7=0) Note: # Mathematics scores in the mathematics model and literacy scores in the literacy models 65


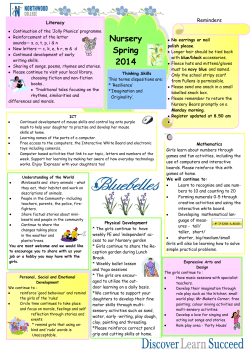


© Copyright 2026