
Child protection Australia 2013â14
• there were 143,000 children, a rate of 27.2 per 1,000 children, receiving child protection services (investigation, care and protection order and/or in out-of-home care).
• three-quarters (72%) of these children had previously been the subject of an investigation, care and protection order and/or out-of-home care placement.
• Aboriginal and Torres Strait Islander children were 7 times as likely as non-Indigenous children to be receiving child protection services.
Child protection Australia 2013–14
This report contains comprehensive information on state
and territory child protection and support services in
2013–14, and the characteristics of Australian children
within the child protection system. This report shows that:
Child protection Australia
2013–14
AIHW
Child welfare series No. 61
CHILD WELFARE SERIES
Number 61
Child protection Australia
2013–14
Australian Institute of Health and Welfare
Canberra
Cat. no. CWS 52
The Australian Institute of Health and Welfare is a major national agency
which provides reliable, regular and relevant information and statistics
on Australia’s health and welfare. The Institute’s mission is
authoritative information and statistics to promote better health and wellbeing.
© Australian Institute of Health and Welfare 2015
This product, excluding the AIHW logo, Commonwealth Coat of Arms and any material owned by a
third party or protected by a trademark, has been released under a Creative Commons BY 3.0
(CC-BY 3.0) licence. Excluded material owned by third parties may include, for example, design and
layout, images obtained under licence from third parties and signatures. We have made all reasonable
efforts to identify and label material owned by third parties.
You may distribute, remix and build upon this work. However, you must attribute the AIHW as the
copyright holder of the work in compliance with our attribution policy available at
<www.aihw.gov.au/copyright/>. The full terms and conditions of this licence are available at
<http://creativecommons.org/licenses/by/3.0/au/>.
Enquiries relating to copyright should be addressed to the Head of the Digital and Media
Communications Unit, Australian Institute of Health and Welfare, GPO Box 570, Canberra ACT 2601.
This publication is part of the Australian Institute of Health and Welfare’s Child Welfare series. A
complete list of the Institute’s publications is available from the Institute’s website <www.aihw.gov.au>.
ISSN 1320-081X
ISBN 978-1-74249-709-9 (PDF)
ISBN 978-1-74249-710-5 (Print)
Suggested citation
Australian Institute of Health and Welfare 2015. Child protection Australia: 2013–14. Child Welfare
series no. 61. Cat. no. CWS 52. Canberra: AIHW.
Australian Institute of Health and Welfare
Board Chair
Dr Mukesh C Haikerwal AO
Acting Director
Ms Kerry Flanagan PSM
Any enquiries about or comments on this publication should be directed to:
Digital and Media Communications Unit
Australian Institute of Health and Welfare
GPO Box 570
Canberra ACT 2601
Tel: (02) 6244 1000
Email: [email protected]
Published by the Australian Institute of Health and Welfare
This publication is printed in accordance with ISO 14001
(Environmental Management Systems) and ISO 9001 (Quality
Management Systems). The paper is sourced from sustainably
managed certified forests.
Please note that there is the potential for minor revisions of data in this report.
Please check the online version at <www.aihw.gov.au> for any amendments.
Contents
Acknowledgments............................................................................................................................... v
Abbreviations ...................................................................................................................................... vi
Symbols ............................................................................................................................................... vii
Technical notes .................................................................................................................................. vii
Summary ........................................................................................................................................... viii
1
Introduction....................................................................................................................................1
1.1 Child protection overview .....................................................................................................1
1.2 Child protection data components .......................................................................................6
2
Children receiving child protection services ...........................................................................9
2.1 Overview and key statistics ...................................................................................................9
2.2 Child protection services received......................................................................................10
2.3 Characteristics of child protection clients ..........................................................................13
3
Notifications, investigations and substantiations ................................................................17
3.1 Overview and key statistics .................................................................................................17
3.2 Cases and the children involved .........................................................................................19
3.3 National trends ......................................................................................................................27
4
Care and protection orders ........................................................................................................33
4.1 Overview and key statistics .................................................................................................33
4.2 Types of orders issued..........................................................................................................35
4.3 Children and orders..............................................................................................................35
4.4 National trends ......................................................................................................................41
5
Out-of-home care.........................................................................................................................45
5.1 Overview and key statistics .................................................................................................45
5.2 Children ..................................................................................................................................46
5.3 National trends ......................................................................................................................52
6
Carers .............................................................................................................................................56
6.1 Overview and key statistics .................................................................................................56
6.2 Foster carer households .......................................................................................................57
6.3 Relative/kinship carer households ....................................................................................59
7
Intensive family support services ............................................................................................61
7.1 Overview and key statistics .................................................................................................61
7.2 Children commencing services ...........................................................................................62
iii
Appendix A:
Detailed tables ........................................................................................................64
Children receiving child protection services ............................................................................64
Notifications, investigations and substantiations ....................................................................68
Care and protection orders .........................................................................................................83
Out-of-home care .........................................................................................................................94
Foster and relative/kinship carers...........................................................................................102
Intensive family support services ............................................................................................104
National trend data ....................................................................................................................105
Population data ..........................................................................................................................111
Appendix B:
Technical notes .....................................................................................................114
Population data ..........................................................................................................................114
Age ...............................................................................................................................................115
Average and median..................................................................................................................116
Identification of Indigenous status ..........................................................................................116
Points of analysis ........................................................................................................................117
Appendix C:
Data quality statement: Child Protection National Minimum Data Set....120
Summary of key issues ..............................................................................................................120
Glossary..............................................................................................................................................126
References ..........................................................................................................................................134
List of tables ......................................................................................................................................137
List of figures ....................................................................................................................................141
Related publications ........................................................................................................................143
iv
Acknowledgments
The authors of this report were Kristy Raithel and Rachel Kilo. Tim Beard, Justine Boland,
Merryl Uebel-Yan and members of the Child Welfare and Prisoner Health Unit provided
valuable input and feedback.
The Australian Institute of Health and Welfare would also like to acknowledge the valuable
contribution of the technical experts from each jurisdiction. Thanks are extended to the state
and territory departments that provided data for this report:
•
Department of Family and Community Services, New South Wales
•
Department of Health and Human Services, Victoria
•
Department of Communities, Child Safety and Disability Services, Queensland
•
Department for Child Protection and Family Support, Western Australia
•
Department for Education and Child Development, South Australia
•
Department of Health and Human Services, Tasmania
•
Community Services Directorate, Australian Capital Territory
•
Department of Children and Families, Northern Territory.
v
Abbreviations
ABS
Australian Bureau of Statistics
ACT
Australian Capital Territory
AIHW
Australian Institute of Health and Welfare
CDSMAC
Community and Disability Services Ministers’ Advisory Council
COAG
Council of Australian Governments
CP NMDS Child Protection National Minimum Data Set
IRSAD
Index of Relative Socio-Economic Advantage and Disadvantage
NCSIIA
National Community Services Information Infrastructure Agreement
NFIWG
National Framework Implementation Working Group
NMDS
National Minimum Data Set
NSW
New South Wales
NT
Northern Territory
Qld
Queensland
SA
South Australia
SCCDSAC Standing Council on Community and Disability Services Advisory Council
SCCDS
Standing Council on Community and Disability Services
SCRGSP
Steering Committee for the Review of Government Service Provision
SEIFA
Socio-Economic Indexes for Areas
SEIFI
Socio-Economic Index for Individuals
SES
socioeconomic status
Tas
Tasmania
Vic
Victoria
WA
Western Australia
vi
Symbols
—
nil or rounded to zero
..
not applicable
n.a.
not available
n.p.
not publishable because of small numbers, confidentiality or other concerns
about the quality of the data
Technical notes
1.
Percentages in tables may exclude unknowns.
2.
Percentages in tables may not add to 100 due to rounding.
vii
Summary
Child protection Australia 2013–14 is the eighteenth annual comprehensive report on child
protection. This report includes detailed statistical information on state and territory child
protection and support services, and some of the characteristics of the children receiving
these services. Key findings are outlined below.
1 in 37 children received child protection services, with 73% being repeat clients
•
In 2013–14, 143,023 children received child protection services. This is 1 in 37 Australian
children aged 0–17 who had an investigation, care and protection order and/or were
placed in out-of-home care.
•
This was a 6% rise over the past 12 months, from 135,193 children in 2012–13.
•
Almost 3 in 5 (59%) of these children were the subject of an investigation only (that is,
they were not subsequently placed on an order or in out-of-home care), while 8% were
involved in all 3 components of the system.
•
Almost three-quarters (73%) of these children were repeat clients in 2013–14; that is, they
had been the subject of an investigation, care and protection order and or out-of-home
care placement in a previous financial year.
Substantiation rates were stable despite longer-term increases in numbers
•
Rates of substantiated child abuse and neglect have remained stable since 2012–13 at 7.8
per 1,000 children. This is despite an increase in the number of children who were the
subject of substantiations, rising by 31%—from 31,295 in 2009–10 to 40,844 in 2013–14.
•
As in 2012–13, 1 in 5 children were the subjects of multiple substantiations in 2013–14.
Rates of children on care and protection orders and in out-of-home care continued to rise
•
From 30 June 2010 to 30 June 2014, the rate of children aged 0–17 on orders rose from 7.5
to 8.7 per 1,000. There were over 55,000 children on a care and protection order at 30 June
2014.
•
Over the same period, the rate of children in out-of-home care increased from 7.1 to 8.1
per 1,000. There were over 51,500 children in out-of-home care at 30 June 2014.
Aboriginal and Torres Strait Islander children continued to be over-represented
•
In 2013–14, Aboriginal and Torres Strait Islander children were 7 times as likely as
non-Indigenous children to be receiving child protection services (136.6 per 1,000
children compared with 19.0 for non-Indigenous children).
Emotional abuse and neglect were the most common types of abuse/neglect
•
Emotional abuse and neglect were the most common primary types of substantiated
abuse and neglect. They were also the most likely types of co-occurring abuse or neglect,
with an average co-occurrence of 29% and 26% respectively.
Large proportions of carer households had multiple children placed
•
During 2013–14, there were 12,860 foster carer households and 15,099 relative/kinship
carer households with a placement.
•
Nearly half (49%) of foster carer households and almost two-fifths (39%) of relativekinship carer households had more than one child placed with them at 30 June 2014.
viii
1
Introduction
1.1 Child protection overview
In Australia, statutory child protection is the responsibility of state and territory
governments. Each state and territory department responsible for child protection provides
assistance to vulnerable children who have been, or are at risk of being, abused, neglected or
otherwise harmed, or whose parents are unable to provide adequate care or protection.
Children and young people are defined as those aged less than 18. This includes unborn
children in jurisdictions where they are covered under the child protection legislation.
Unborn children are reported as a separate age group in tables disaggregated by age (where
applicable).
A number of government and non-government organisations share a common duty of care
towards the protection of children and young people. Departments responsible for child
protection investigate, process and oversee the management of child protection cases.
Assistance is provided to children and their families through the provision of, or referral to, a
wide range of services.
The national recurrent expenditure on child protection and out-of-home care services was
about $3.3 billion in 2013–14, a real increase of $77.8 million (2.4%) from 2012–13 (SCRGSP
2015).
Child protection processes
Across Australia, the broad processes in child protection systems are similar. A simplified
version of the main processes used is shown in Figure 1.1. These processes are outlined in
more detail in the sections that follow.
Child protection intake processes
Child concern reports
Children in need of protection can come into contact with departments responsible for child
protection through a number of avenues. Reports of concern about a child may be made by
community members; professionals (for example, police, school personnel or health
practitioners); organisations; the children themselves; their parent(s); or another relative.
These reports may relate to abuse and neglect or to broader family concerns, such as
economic problems or social isolation.
Child protection intake services across jurisdictions screen incoming reports to determine
whether further action is required. The defined threshold for intervention varies across
jurisdictions and this can lead to jurisdictional differences in the responses taken to initial
reports. Reports that are deemed to require further action are generally classified as either a
‘family support issue’ or a ‘child protection notification’.
Reports classified as requiring family support are further reviewed and may be referred to
support services. The national child protection data collection does not include those reports
that are not classified as child protection notifications.
Child protection Australia 2013–14
1
Report to state and territory child protection and support services
Universal prevention
servicesb
Report concerns the
welfare of a child
(intake)
Other (advice and
referrals as required)
Child protection
notification
Child protection
notification not
recorded (advice and
referrals as required)
Investigation
Not investigated (dealt
with by other means)
Substantiation
Not substantiated
Secondary support
servicesb
Is the child
safe?
Yes
Provision of case
management and/or
referrals as required
No
Care and protection order
and case management
Out-of-home
care
Intensive family support
servicesb
Other (including
independent living,
living at home)
If the child is safe,
case closed and exit
from system
Notes
1.
Shaded boxes are items for which data are collected nationally.
2.
Dashed lines indicate that clients may or may not receive these services, depending on need, service availability and client willingness to
participate in what are voluntary services.
3.
Support services include family preservation and reunification services provided by government departments responsible for child protection
and other agencies. Children and families move in and out of these services and the statutory child protection system, and might also be in
the statutory child protection system while receiving support services.
Figure 1.1: The child protection process in Australia
Child protection statutory processes
Notifications, investigations and substantiations
Child protection notifications are assessed to determine whether an investigation is required;
if referral to support services is more appropriate; or if no further protective action is
necessary. The aim of an investigation is to obtain more detailed information about a child
who is the subject of a notification and to determine whether the notification is
2
Child protection Australia 2013–14
‘substantiated’ or ‘not substantiated’. A substantiation indicates there is sufficient reason
(after an investigation) to believe the child has been, is being or is likely to be, abused,
neglected or otherwise harmed. The relevant department will then attempt to ensure the
safety of the child or children through an appropriate level of continued involvement,
including the provision of support services to the child and family.
Care and protection orders
In situations where further intervention is required, the department may apply to the
relevant court to place the child on a care and protection order. Court is usually a last
resort—for example, where the families are unable to provide safe care, where other avenues
for resolution of the situation have been exhausted, or where the extended family is unable
to provide safe alternatives for care of children. The level of departmental involvement that a
care and protection order mandates will vary depending on the type of order. See Box 4.2 for
the national categories of care and protection orders.
Out-of-home care
Some children are placed in out-of-home care because they were the subject of a child
protection substantiation and require a more protective environment. Other situations in
which a child may be placed in out-of-home care include those where parents are incapable
of providing adequate care for the child, or where alternative accommodation is needed
during times of family conflict. However, there are no national data available on the reasons
children are placed in out-of-home care. See Box 5.2 for the national categories of
out-of-home care.
Out-of-home care is considered an intervention of last resort, with the current emphasis
being to keep children with their families wherever possible. Where children need to be
placed in out-of-home care, an attempt is made to reunite children with their families. If it is
necessary to remove a child from their family, then placement within the wider family or
community is preferred. This is particularly the case with Aboriginal and Torres Strait
Islander children, and is outlined in the Aboriginal Child Placement Principle (see Section
5.2).
Family support services
At any point in the child protection process, children and their families may be referred to
family support services. Family support services include programs that seek to prevent the
occurrence of family dysfunction and child maltreatment; that provide treatment, support
and advice to families; and more intensive programs to assist the most vulnerable families
(COAG 2009). Family support services may be used instead of, or as a complementary
service to, a statutory child protection response. Examples include parenting and household
skills development; therapeutic care; and family reunification services. Information on
intensive family support services (one type of treatment and/or support service) can be
found in Chapter 7.
Child protection policies and practices
Child protection policies and practices are under continual development on a jurisdiction-byjurisdiction basis. In recent years there has been increasing national focus on early
intervention and family support services to help prevent families entering or re-entering the
child protection system and to help minimise the need for more intrusive interventions
(AIFS: Bromfield & Holzer 2008).
Child protection Australia 2013–14
3
Most jurisdictions have enacted strategies which attempt to assist families in a more holistic
way, by coordinating service delivery and providing better access to different types of child
and family services (COAG 2014).
Jurisdictional policy context
Although the processes that each jurisdiction uses to protect children are broadly similar
(AIFS: Bromfield & Higgins 2005; Figure 1.1), there are some important differences between
jurisdictions’ child protection policies and practices that should be taken into account when
making cross-jurisdiction comparisons. Key differences across jurisdictional policy are
briefly discussed here. Further details relating to each jurisdiction’s policy and practice are in
Appendixes D–I (online) <http://www.aihw.gov.au/publication-detail/?id=60129550762>.
Mandatory reporting
All jurisdictions have legislative requirements governing the reporting of suspected child
abuse. In some jurisdictions, only those in selected professions are mandated to report
suspected child abuse or neglect, whereas in others anyone who suspects child abuse or
neglect is legally obliged to report it to the appropriate authority. Commonwealth
legislation—the Family Law Act 1975 and the Family Law Legislation Amendment (Family
Violence and Other Measures) Act, 2011 also contains provisions mandating certain court
personnel to report suspected incidences of child abuse to a prescribed child welfare
authority. Further details about mandatory reporting requirements in each state and territory
are in Appendixes D–I (online) <http://www.aihw.gov.au/publicationdetail/?id=60129550762>.
Notifications
The policies that provide the model for assessing child protection notifications vary broadly
across jurisdictions. For example, in some jurisdictions, all contacts to the authorised
department regarding concerns for children (and child protection reports) are considered to
be a notification (‘caller-defined’). In other jurisdictions, the initial report is subject to an
assessment and considered a notification only when the information received suggests that a
child needs care or protection (‘agency-defined’). This may result in higher levels of
notifications being recorded in jurisdictions where all reports are recorded as notifications.
Investigations
Between initial reports and substantiation, a range of activities take place that are broadly
categorised as investigations. The nature of the activities varies according to whether the
initial report was screened or assessed in some way. In those jurisdictions where a
preliminary assessment has occurred, activities tend to assess risk of significant harm and
focus on formal investigation. In jurisdictions that record all initial contacts as notifications, a
preliminary assessment will often occur to determine the need for formal investigation,
followed by a formal investigation if it is concluded that a child may have been or is at risk of
harm. Formal investigation, as conducted in each jurisdiction, will determine whether the
notification has been substantiated.
Substantiation threshold
Thresholds for what is substantiated vary—some jurisdictions substantiate the harm or risk
of harm to the child, and others substantiate actions by parents or incidents that cause harm.
In considering harm to the child, the focus of the child protection systems in many
jurisdictions has shifted away from the actions of parents to the outcomes for the child.
4
Child protection Australia 2013–14
In addition to variation in policy at the jurisdictional level, the definition of what constitutes
child abuse and neglect has also broadened at a national level over time (AIFS: Holzer &
Bromfield 2008). These changes affect the comparability of data included in this report.
Legislative, policy and definitional differences between jurisdictions and detailed
information on recent policy and practices changes are outlined in Appendixes D–I (online)
<http://www.aihw.gov.au/publication-detail/?id=60129550762>.
National policy context
The National Framework for Protecting Australia’s Children 2009–2020 (COAG 2009) aims to
ensure Australia’s children are safe and well. As a measure of this outcome, a target of ‘a
substantial and sustained reduction in child abuse and neglect in Australia’ has been set. The
fourth annual report to COAG was released in 2014 (COAG 2014). The third action plan, due
to commence in mid-2015, is under development.
Development and implementation of National Standards for Out-of-Home Care is a priority
area under the second plan. These standards were designed to deliver consistency and drive
improvements in the quality of care provided to children and young people (FaHCSIA 2011).
Available data for a subset of measures were reported in the 2010–11, 2011–12 and 2012–13
annual reports to COAG on the National Framework (COAG 2012, 2013, 2014). Work is
currently underway to progress a number of measures including the development of carerrelated indicators.
On 11 January 2013, the then Governor-General, Her Excellency Quentin Bryce, appointed a
6-member Royal Commission to investigate Institutional Responses to Child Sexual Abuse.
The Royal Commission released an interim report on 30 June 2014 (Royal Commission into
Institutional Responses to Child Sexual Abuse 2015a). Related research released later in 2014
included reports relating to: child protection legislation; residential care; and previous
inquiries into institutions providing care for children in Australia (Royal Commission into
Institutional Responses to Child Sexual Abuse 2015b).
The effects of sexual abuse for victims are broad, including physical effects and impacts on
their social and emotional functioning. Analysis of information disclosed by survivors and
others in private sessions that the Royal Commission conducted indicates that:
•
•
90% of perpetrators of institutional child sexual abuse were male
25% of perpetrators were members of the clergy, although foster carers and teachers
were also reported
• on average females were around age 9 at the time of the first abuse and males were aged
10
• environmental and situational factors within institutions can provide opportunities for
sexual abuse to occur (Royal Commission into Institutional Responses to Child Sexual
Abuse 2015a).
Out-of-home care, as defined in this collection, is an institution for the purposes of the Royal
Commission. A public hearing was held from 10–20 March 2015 to examine child sexual
abuse in out-of-home care. Some jurisdictions include cases of alleged abuse in care in the
data in this report for the number of notifications, investigations and substantiations; see
Appendix H in Appendixes D–I (online) <http://www.aihw.gov.au/publicationdetail/?id=60129550762>. However, these cases are not able to be separately identified in the
national data.
The work of the Royal Commission was initially due for completion by the end of 2015;
however, additional funding has been granted to 15 December 2017.
Child protection Australia 2013–14
5
1.2 Child protection data components
Data sources
National child protection data
The state and territory departments and the AIHW jointly fund the annual collation, analysis
and publication of child protection data. Data in this report are largely drawn from the Child
Protection National Minimum Data Set (CP NMDS), implemented for reporting from
2012–13. The CP NMDS consists of a number of unit record (child-level) files extracted from
state and territory child protection administrative data sets according to nationally agreed
definitions and technical specifications. The CP NMDS, by definition, includes all items that
jurisdictions have agreed to provide to the AIHW for national child protection reporting.
More information about the development and implementation of the CP NMDS can be
found in the AIHW working paper A new approach to national child protection data:
implementation of the Child Protection National Minimum Data Set (AIHW 2014a).
The AIHW, in collaboration with jurisdictions, annually reviews the national technical
specifications and definitional materials associated with the CP NMDS. The AIHW and the
states and territories then agree to any required changes. The jurisdictions provide data to
the AIHW across 7 broad components:
•
notifications, investigations and substantiations
•
care and protection orders
•
out-of-home care
•
foster carers
•
relative/kinship carers
•
intensive family support services
•
national standards for out-of-home care.
Data for these components have been based on unit record level data for all jurisdictions
except New South Wales and Queensland (data from New South Wales and Queensland are
based on aggregate data using the methodology from previous years). Other jurisdictions
also supplied data in aggregate format for tables where unit record data were not available.
This includes all data relating to the use of intensive family support services for all
jurisdictions.
National child protection data are analysed and published annually in:
•
Child protection Australia (this report)
•
the annual report on the progress of implementing the National Framework for Protecting
Australia’s Children 2009–2020
•
the Productivity Commission’s Report on Government Services (RoGS) (SCRGSP 2015). For
all jurisdictions except New South Wales and Queensland, data reported for 2013–14 in
the Report on Government Services 2015 were produced from the CP NMDS for that report.
Data for New South Wales and Queensland were based on aggregate data that they
supplied to the Productivity Commission. Some data included in this report may not
match data reported in the RoGS due to retrospective updates to state/territory data and
differences in the data extraction and analysis methodologies.
6
Child protection Australia 2013–14
Population estimates used for rate calculations
All rates in this report, including historical rates, have been calculated using revised
population estimates based on the 2011 Census. This may have resulted in revisions to rates
published in previous editions of Child protection Australia. The population estimates used in
the calculation of historical rates are available in online supplementary tables (tables S1 and
S2). These can be downloaded free of charge from the AIHW website
<http://www.aihw.gov.au/publication-detail/?id=60129550762&tab=3>.
Indigenous populations and associated rates presented in this report are calculated using the
revised Indigenous population estimates and projections based on the 2011 Census. See Box
1.1 for further details.
Box 1.1 Indigenous population and rates
On 30 April 2014, the ABS released new Indigenous population estimates based on the 2011
Census. These included revised back-cast estimates of the Indigenous population for the
years prior to 2012, as well as population projections for 2012 onwards. There was an
increase in estimates of the number of Indigenous Australians between the estimates based
on the 2011 Census compared with the 2006 Census-based estimates. This means that any
rates calculated with Indigenous population estimates based on the 2011 Census are lower
than those based on the 2006 Census.
Following a review of the impact of the revised Indigenous population projections, the
AIHW has adopted a methodology for reporting Indigenous populations and their
associated rates which uses the Series B Indigenous population projections for reporting
from 2011 onwards and back-casts historical trend data using the 2011 Census-based series
of back-cast estimates for the Indigenous population. See Appendix B for more information
regarding the calculation of rates.
All Indigenous rates in this report are calculated using the revised Indigenous population
estimates and projections, based on the 2011 Census, and should not be compared with
rates calculated using populations or projections based on previous Censuses.
Scope and limitations of the CP NMDS
National child protection data are based on those cases reported to departments responsible
for child protection and, therefore, are likely to understate the true prevalence of child abuse
and neglect across Australia. Further, notifications made to other organisations, such as the
police or non-government welfare agencies, are only included if these notifications were also
referred to departments responsible for child protection.
For child–based counts in this report, children are counted only once in the relevant table
regardless of the number of contacts the child had with the component of child protection
being reported. For example, if a child was the subject of more than one substantiation
during the reporting period, they are only counted once in tables reporting the number of
children in substantiations. However, there may be some small level of double-counting due
to inter-jurisdictional movement.
Not all jurisdictions were able to supply unit record level data for all tables included in this
report. As such, some tables include aggregated data provided by jurisdictions. Footnotes
have been included to identify tables where aggregate data are included (in addition to NSW
and Qld data, which were based entirely on aggregate data sources in 2013–14).
Child protection Australia 2013–14
7
The practices used to identify and record the Indigenous status of children in the child
protection system vary across states and territories. Over the last few years, several
jurisdictions have introduced measures to improve the identification of Indigenous clients
(AIHW 2012). However, in some jurisdictions, the high proportion of children whose
Indigenous status is unknown still affects the quality of data on Aboriginal and Torres Strait
Islander children.
The data systems that jurisdictions use can be upgraded and changed between reporting
cycles. Details regarding jurisdictions’ data systems and any key changes from the previous
year are in Appendixes D–I (online) <http://www.aihw.gov.au/publicationdetail/?id=60129550762>.
‘Average day’ measures have been included for children on orders (Box 4.1, Table A15) or in
out-of-home care (Box 5.1, Table A25) and for carer households approved/authorised to
provide funded out-of-home care placements (Table 6.1, Table A34). Average day measures
are calculated by summing the number of days each person was subject to the same event
during the year and dividing this total by the number of days in the financial year. This
provides a view of the data that accounts for each day during the year, rather than a
snapshot for a single day (for example, 30 June which is typically reported). These data are
presented in boxes and appendix tables only due to known issues with data availability and
quality.
8
Child protection Australia 2013–14
2
Children receiving child protection
services
For the purpose of this report, children receiving child protection services are defined as
those children who in the reporting period were:
•
the subject of an investigation of a notification; and/or
•
on a care and protection order; and/or
•
in out-of-home care.
2.1 Overview and key statistics
In 2013–14, 143,023 children received child protection services—99,210 were the subject of an
investigation; 55,067 were on a care and protection order; and 51,539 were in out-of-home
care (Figure 2.1). Please note, individual components do not sum to the total children
receiving child protection services (refer to Note 2).
Children receiving child protection services
143,023
Children who were the subject of investigations
99,210
Children who were
the subjects of
substantiations
40,844
Children who were
the subjects of
non-substantiated
cases
51,340
Children with
investigations in
process or closed
with no outcome
possible
7,026
Children on
care and protection orders
55,067
Admitted
13,171
Discharged
10,275
At 30 June
45,746
Children in
out-of-home care
51,539
Admitted
11,085
Discharged
8,409
At 30 June
43,009
Notes
1.
Numbers presented in this figure refer to protection services during 2013–14 except for two counts: children on care and protection orders
at 30 June 2014; and children in out-of-home care at 30 June 2014.
2.
Children may be involved in more than one component of the system. As such, the components do not sum to the total children receiving
child protection services.
3.
Children may be the subject of multiple investigations and decisions to substantiate or not substantiate within the reporting period. However,
the numbers reported for ‘children who were the subjects of substantiations’ and ‘children who were the subjects of non-substantiated
cases’ are mutually exclusive—children can only be counted for the highest level of intervention provided in the period (that is,
substantiation or not a substantiation).
4.
Refer to the Glossary for definitions.
Source: Tables 2.1, A6, 4.1 and 5.1.
Figure 2.1: Children receiving child protection services in Australia during 2013–14
Child protection Australia 2013–14
9
2.2 Child protection services received
In 2013–14, 143,023 children received child protection services (Figure 2.1), a rate of 27.2 per
1,000 children aged 0–17 in the general population. The number of children receiving child
protection services has risen by around 6% from 135,139 children in 2012–13 (AIHW 2014b).
Of children receiving child protection services in 2013–14, 99,210 were the subject of an
investigation (18.9 per 1,000), 55,067 were on a care and protection order (10.5 per 1,000) and
51,539 were in out-of-home care (9.8 per 1,000). These rates varied across jurisdictions (Table
2.1). Children may be involved in more than one component of the system. As such, the
components do not sum to the total children receiving child protection services (see Figure
2.2 for the overlap of services received).
Children who were only the subject of a notification which was not subsequently
investigated have not been included in this analysis. This is because, apart from an initial
risk assessment, it is expected that the department responsible for child protection would
have a limited level of involvement with these children and their families. Children who
only received intensive family support services have not been included in this section as unit
record level data were not available for national reporting. See Chapter 7 for information
about children receiving intensive family support services.
10
Child protection Australia 2013–14
Table 2.1: Children receiving child protection services, states and territories, by number and
number per 1,000 children, 2013–14
NSW
Vic
Qld
WA
SA
Tas
ACT
NT
Total
Number
Children who were the
subject of an
investigation of a
notification
38,107
19,206
20,229
11,292
4,334
1,303
974
3,765
99,210
Children on care and
protection orders
19,358
12,899
10,886
5,211
3,248
1,468
812
1,185
55,067
Children in out-of-home
care
20,520
10,041
10,239
4,484
3,089
1,273
776
1,117
51,539
Children receiving
child protection
services
53,250
28,949
29,585
15,385
7,083
2,609
1,635
4,527
143,023
Number per 1,000 children
Children who were the
subject of an
investigation of a
notification
22.7
15.2
18.2
19.4
12.1
11.3
11.5
59.3
18.9
Children on care and
protection orders
11.5
10.2
9.8
9.0
9.1
12.8
9.6
18.7
10.5
Children in out-of-home
care
12.2
7.9
9.2
7.7
8.6
11.1
9.2
17.6
9.8
Children receiving
child protection
services
31.7
22.9
26.6
26.5
19.8
22.7
19.3
71.3
27.2
Notes
1.
‘Children receiving child protection services’ is defined as one or more of the following occurring within the reporting period: an investigation
of a notification, being on a care and protection order, or being in out-of-home care. It is not a total count of these 3 areas; it is a count of
unique children across the 3 areas.
2.
Refer to Table A46 for the population data.
3.
Rates were calculated using revised population estimates based on the 2011 Census and should not be compared with rates calculated
using populations or projections based on previous Censuses, including those published in previous editions of Child protection Australia.
Source: AIHW Child Protection Collection 2014.
Children may receive a combination of child protection services and as such there are links
and overlaps between the data for the notification, investigation and substantiation; care and
protection orders; and out-of-home care data collections. The overlap between the separate
data collections has been analysed, drawing on unit record data from the majority of
jurisdictions (and aggregate information specifically provided by NSW and Qld).
Figure 2.2 shows that over half (59%) of children receiving child protection services during
2013–14 were the subject of an investigation only. One-quarter (25%) of children were both
on an order and in out-of-home care. Overall, 8% of children were involved in all 3
components of the system. These findings are similar to 2012–13 (AIHW 2014b).
Child protection Australia 2013–14
11
Investigation
58.7%
1.7%
1.1%
7.8%
Care and protection
order
3.5%
Out-of-home care
1.7%
25.4%
Source: Table A1.
Figure 2.2: Children receiving child protection services by components of service received, 2013–14
Children who were the subject of an investigation only represent a large component of the
analysis of unique children receiving services. Note that almost two-thirds (61%) of these
children were not the subjects of substantiations in 2013–14 (Table 2.2). However this varied
markedly across jurisdictions, with higher proportions of substantiations in Victoria, South
Australia and Tasmania (54%, 51% and 57% respectively).
Table 2.2: Children who were the subject of a finalised investigation only in 2013–14, by
investigation outcome
Investigation outcome
NSW
Vic
Qld
WA
SA
Tas
ACT
NT
Total
Number
Substantiated
11,499
7,719
4,885
2,171
1,737
565
178
1,074
29,828
Not substantiated
19,618
6,503
11,031
6,294
1,665
423
477
1,453
47,464
Total children in finalised
investigations
31,117
14,222
15,916
8,465
3,402
988
655
2,527
77,292
%
Substantiated
37.0
54.3
30.7
25.6
51.1
57.2
27.2
42.5
38.6
Not substantiated
63.0
45.7
69.3
74.4
48.9
42.8
72.8
57.5
61.4
Total children in finalised
investigations
100.0
100.0
100.0
100.0
100.0
100.0
100.0
100.0
100.0
Total children who
were the subject of an
investigation only
31,803
15,183
18,044
9,991
3,729
1,116
746
3,342
83,954
Notes
1.
12
This table includes children whose only contact with child protection services during 2013–14 was an investigation. It excludes those
children who had an investigation and involvement in another area of the system such as care and protection orders and/or out-of-home
care. These data are further restricted to only include those for whom an investigation was finalised in the reporting period, thus excluding
investigations in process or closed with no outcome possible.
Child protection Australia 2013–14
The CP NMDS will be used in future to provide more detailed analyses regarding the
movement of children within the child protection system. For example, identifying the
number of children who are the subject of a substantiation who are subsequently placed on
care and protection orders and/or in out-of-home care.
2.3 Characteristics of child protection clients
New and repeat clients
The definitions of new and repeat clients are provided in Box 2.1.
Box 2.1 Preliminary analysis of new and repeat clients
•
‘New clients’ are defined as those children or young people who have never
previously been the subject of: an investigation; any type of care and protection order
(as per the scope of this collection); or funded out-of-home care placement (excluding
respite placements lasting less than 7 days) within the jurisdiction.
•
‘Repeat clients’ are children or young people who have previously been the subject of
an investigation; or were discharged (according to national specifications) from any
type of care and protection order or funded out-of-home care placement (excluding
respite placements lasting less than 7 days); or whose earliest order and/or placement
in the current reporting period is part of a preceding continuous episode of care.
Data for determining whether children were new or repeat clients of the reporting
jurisdiction were available for 6 jurisdictions in 2013–14, representing about 80% of children
receiving child protection services. Examining these data provides some insight into whether
new children or those with a prior involvement with child protection primarily receive child
protection services, and whether this differs across the system components.
In 2013–14, almost three-quarters (73%) of children receiving child protection services were
repeat clients (Figure 2.3). However, the proportion of repeat clients was substantially higher
for those on an order or in out-of-home care (around 95% each) compared with those who
were the subject of investigations (62%).
Child protection Australia 2013–14
13
Per cent
100
New client of child protection services
90
Repeat client of child protection services
80
70
60
50
40
30
20
10
0
Children receiving child
protection services
Children who were
subjects of investigations
of notifications
Children on care and
protection orders
Children in out-of-home
care
Notes
1.
Due to data availability and quality issues, data reported excludes Queensland and the Australian Capital Territory.
2.
‘Children receiving child protection services’ is defined as one or more of the following occurring within the reporting period: an investigation
of a notification; being on a care and protection order; or being in out-of-home care. It is not a total count of the above 3 areas; it is a count
of unique children across the 3 areas.
3.
New clients are children or young people who have not ever previously been the subject of: an investigation; any type of care and protection
order (as per the scope of this collection); or funded out-of-home care placement (including only those respite placements of 7 days or
more) within the jurisdiction.
4.
Repeat clients are children or young people who have previously been the subject of an investigation or were discharged (according to
national specifications) from any type of care and protection order or funded out-of-home care placement (including only those respite
placements of 7 days or more), or whose earliest order and/or placement in the current reporting period is part of a preceding continuous
episode of care. Refer to Box 2.1 for definitions of new and repeat clients.
Source: Table A2.
Figure 2.3: New and repeat clients receiving child protection services, by service type, 2013–14
Age
Across Australia in 2013–14, infants (children aged under 1) were most likely (33.4 per 1,000
children) to be receiving child protection services and those aged 15–17 were least likely
(18.7 per 1,000 children). This pattern was consistent across all jurisdictions, except New
South Wales where children aged 5–9 were most likely to be receiving child protection
services (33 per 1,000 children, Table 2.3). The median age of children receiving services
was 7.
These findings reflect the fact that younger children are regarded as the most vulnerable, and
most jurisdictions have specific policies and procedures in place to protect them. There has
also been an increased focus nationally on early intervention and the provision of services
early in a child’s life to improve long-term outcomes and reduce the negative impacts of
trauma and harm (COAG 2009; FaHCSIA 2012).
14
Child protection Australia 2013–14
Table 2.3: Rates of children receiving child protection services during 2013–14, by age group, states
and territories (number per 1,000 children)
NSW
Vic
Qld
WA(a)
SA
Tas
ACT
NT
Total
<1
29.5
36.3
32.8
29.7
39.2
28.4
27.7
100.6
33.4
1–4
29.6
23.1
27.9
27.3
21.3
23.8
18.2
85.1
27.2
5–9
33.0
23.3
27.8
29.5
21.4
23.8
20.5
72.0
28.4
10–14
32.2
23.1
25.7
26.1
18.1
22.3
19.2
70.5
27.0
15–17
24.3
16.6
16.6
15.5
11.8
14.7
15.1
37.3
18.7
0–17
30.4
22.9
25.7
25.8
19.8
22.0
19.2
71.2
26.5
All children
31.7
22.9
26.6
26.5
19.8
22.7
19.3
71.3
27.2
53,250
28,949
29,585
15,385
7,083
2,609
1,635
4,527
143,023
Age group (years)
Children receiving
child protection
services
Notes
1.
Refer to Table A3 for numbers of children receiving child protection services for this table and to Table A48 for population data.
2.
Unborn children may be covered under the child protection legislation and are therefore included in this report. However, they are excluded
in rate calculations for the ‘less than 1’ and ‘0–17’ categories. Unborn children are included in the ‘All children’ rates.
3.
‘All children’ includes children of unknown age.
4.
Rates were calculated using revised population estimates based on the 2011 Census and should not be compared with rates calculated
using populations or projections based on previous Censuses, including those published in previous editions of Child protection Australia.
Source: AIHW Child Protection Collection 2014.
Aboriginal and Torres Strait Islander children
During 2013–14, 39,716 Aboriginal and Torres Strait Islander children received child
protection services—a rate of 136.6 per 1,000 children. Overall, Indigenous children were
7 times as likely as non-Indigenous children to be receiving child protection services
(compared with a rate of 19.0 per 1,000 for non-Indigenous children). However, there was
substantial variation across the jurisdictions in the rate ratio—with Indigenous children from
3 times as likely as non-Indigenous children to be receiving child protection services in
Tasmania to nearly 14 times as likely in Western Australia (Figure 2.4).
Child protection Australia 2013–14
15
Rate (Number per 1,000)
Indigenous
Non-Indigenous
Rate ratio
Rate ratio (diamonds)
250.0
15
200.0
10
150.0
100.0
5
50.0
0.0
0
NSW
Vic
Qld
WA
SA
Tas
ACT
NT
Total
States and territories
Notes
1.
Rate calculations include unborn children and children of unknown age but exclude children of unknown Indigenous status.
2.
Rates were calculated using revised population estimates based on the 2011 Census and should not be compared with rates calculated
using populations or projections based on previous Censuses, including those published in previous editions of Child protection Australia.
3.
Rate ratios are calculated by dividing the unrounded rate of Aboriginal and Torres Strait Islander children who received child protection
services by the unrounded rate of non-Indigenous children who received child protection services. The resulting number is a measure of
how many Aboriginal and Torres Strait Islander children received child protection services for every non-Indigenous child who received child
protection services. Children whose Indigenous status is unknown are excluded from the calculations.
Source: Tables A3 and A46.
Figure 2.4: Children receiving child protection services by Indigenous status, states and territories,
2013–14 (rate and rate ratio)
On average, Indigenous children receiving child protection services were slightly younger
than non–Indigenous children, with median ages of 7 and 8 respectively. Additionally, 62%
of Indigenous children were aged under 10 compared to 58% of non-Indigenous children
(Figure 2.5).
Per cent
Indigenous
Non-Indigenous
35
30
25
20
15
10
5
0
<1 year
1–4
5–9
10–14
15–17
Age group
Source: Table A3.
Figure 2.5: Children receiving child protection services by age group and Indigenous status,
2013–14
16
Child protection Australia 2013–14
3
Notifications, investigations and
substantiations
This chapter contains information on the number of notifications, investigations and
substantiations (see Box 3.1) and the number of children who were the subject of these.
‘Children and young people’ are defined as those under the age of 18. In some jurisdictions,
this may include pregnant women where there are concerns about their unborn children
(where unborn children are covered under the child protection legislation).
The data in this chapter relate to notifications that departments responsible for child
protection received between 1 July 2013 and 30 June 2014. See Box 3.1 for further details.
3.1 Overview and key statistics
In 2013–14, there were 304,097 notifications involving 198,966 children, a rate of 37.8 per
1,000 children in Australia. The number of children in notifications is higher than the unique
number of children receiving child protection services reported in Chapter 2. This is because
the unique count of children receiving child protection services does not include children in
notifications who did not have a subsequent investigation. These children are included in the
count of all children in notifications.
Of the notifications, 45% (137,585) were investigated, with 54,438 substantiations (after
investigation) relating to 40,844 children—a rate of 7.8 per 1,000 children (Figure 3.1).
Notifications
304,097 (cases)
198,966 (children), 37.8 per 1,000 (rate)
Investigations
137,585 (cases)
99,210 (children), 18.9 per 1,000 (rate)
Substantiations
54,438 (cases)
40,844 (children)
7.8 per 1,000
(rate)
Notes
1.
Notifications, investigations and substantiations data are for children aged 0–17 and include, where available, unborn children.
2.
Investigations include all notifications that were investigated during 2013–14, including those that were ‘finalised’, ‘closed—no outcome
possible’ and ‘in process’ at 31 August 2014.
3.
Rates were calculated using revised population estimates based on the 2011 Census and should not be compared with rates calculated
using populations or projections based on previous Censuses, including those published in previous editions of Child protection Australia.
Source: Tables 2.1, 3.1 and A38.
Figure 3.1: Key notifications, investigations and substantiations statistics, 2013–14
Child protection Australia 2013–14
17
Box 3.1: Notifications, investigations and substantiations
•
Notifications consist of contacts made to an authorised department by persons
or other bodies making allegations of child abuse or neglect, child maltreatment
or harm to a child. The national child protection data collection does not include
those reports that are not classified as child protection notifications.
A notification can only involve 1 child. Where it is claimed that 2 children have
been abused or neglected or harmed, this is counted as 2 notifications, even if
the children are from 1 family. Where there is more than 1 notification about the
same ‘event’ involving a child, this is counted as 1 notification. Where there is
more than 1 notification between 1 July 2013 and 30 June 2014, but relating to
different events, these are counted as separate notifications.
•
Investigations are the process whereby the relevant department obtains more
detailed information about a child who is the subject of a notification received
between 1 July 2013 and 30 June 2014. Departmental staff make an assessment
about the harm or degree of harm to the child and their protective needs. An
investigation includes sighting or interviewing the child where it is practical to
do so.
•
Finalised investigations are those notifications made during 2013–14 that were
investigated and had an outcome of either ‘substantiated’ or ‘not substantiated’
recorded by 31 August 2014. The cut-off point of 31 August is applied to allow
time for investigating notifications made close to the end of the financial year.
The outcomes of investigations that are still in process after this cut-off (4%, or
5,981, in 2013–14) are not reported in the data for this or subsequent reporting
periods. It is important to note that substantiations as reported here (that is,
substantiations of notifications received during the year) are therefore an
under-count of the actual number of substantiations made during the year, due
to the use of this methodology in preceding reporting periods.
•
Substantiations of notifications received during the current reporting year refer
to child protection notifications made to relevant authorities during the year
ended 30 June 2014 that were investigated, the investigation was finalised by 31
August 2014, and it was concluded that there was reasonable cause to believe
that the child had been, was being, or was likely to be, abused, neglected or
otherwise harmed. Substantiations may also include cases where there is no
suitable caregiver, such as children who have been abandoned or whose parents
are deceased.
Instances of alleged abuse or neglect by family members (other than parents/
guardians) and non-family members are generally included in the count of
notifications if the notification was referred to the state and territory departments
responsible for child protection. These cases are only included in counts of
investigations and substantiations where there has been a finding or allegation of a
failure to protect by the parent or guardian.
18
Child protection Australia 2013–14
3.2 Cases and the children involved
Of the 304,097 notifications in 2013–14, 45% (137,585) were assessed as requiring further
investigation while the remaining 55% (166,512) were dealt with by other means, such as
being referred to a support service. The number of notifications and the percentage of those
notifications investigated are not comparable across jurisdictions. This is because legislation
and the policies that provide the framework for assessing child protection notifications vary
broadly across jurisdictions.
For investigations in 2013–14, the most common source of the related notification was police
(24%), followed by school personnel (18%). Nationally, only 0.3% of notifications came
directly from the child involved (Table A5). Notifications to departments responsible for
child protection come from a range of sources, and legislation relating to mandatory
reporting varies across jurisdictions. This should be taken into consideration when
interpreting these data (see Appendixes D–I (online)
<http://www.aihw.gov.au/publication-detail/?id=60129550762>, for details).
Overall, 44% of the 92,184 children in finalised investigations were the subjects of
substantiations in 2013–14. The proportion varied across the jurisdictions, from 32% in
Western Australia to 63% in Victoria (Figure 3.2).
Per cent
Substantiated
Not substantiated
80
70
60
50
40
30
20
10
0
NSW
Vic
Qld
WA
SA
Tas
ACT
NT
Total
States and territories
Source: Table A6.
Figure 3.2: Children who were the subjects of finalised investigations by outcome, states and
territories, 2013–14
Children within the child protection system may be involved in multiple statutory child
protection cases during any given year. Across Australia in 2013–14, the total number of
notifications (304,097) and substantiations (54,438) involved 198,966 and 40,844 children,
respectively (Table 3.1).
Child protection Australia 2013–14
19
Table 3.1: Number of notifications, substantiations of notifications and number of children who
were the subject of a notification and/or substantiation of a notification, states and territories,
2013–14
NSW
Vic
Qld
WA(a)
SA
Tas
ACT
NT
73,678
56,516
20,229
14,120
12,656
8,309
5,519
7,939
198,966
125,994
82,056
23,256
16,801
19,578
12,862
10,600
12,950
304,097
Children in substantiations
15,074
11,395
6,685
3,053
2,190
712
341
1,394
40,844
Total substantiations
26,215
11,952
7,406
3,267
2,737
778
449
1,634
54,438
Children in notifications
Total notifications
(a)
Total
In Western Australia, notifications where the primary concern at notification was emotional/psychological, physical, sexual abuse, or neglect
are counted as notifications in this table.
Source: AIHW Child Protection Collection 2014.
These data reflect the fact that a number of children were the subject of more than 1
notification and/or substantiation. Table 3.2 shows that about 1 in 5 children (20%) who
were the subject of any substantiation during the year were the subject of more than 1
substantiation.
Table 3.2: Number of substantiations per child, 2013–14 (%)
Number of
substantiations
NSW
Vic
Qld
WA
SA
Tas
ACT
NT
Total
1
61.5
95.3
90.1
93.3
80.8
90.7
76.5
85.9
80.5
2
20.8
4.6
9.2
6.4
14.5
9.3
17.6
11.7
12.4
3
9.2
0.2
0.7
0.3
4.0
0.0
3.5
1.9
3.9
4+
8.5
0.0
0.1
0.0
0.8
0.0
2.3
0.5
3.2
100.0
100.0
100.0
100.0
100.0
100.0
100.0
100.0
100.0
15,074
11,395
6,685
3,053
2,190
712
341
1,394
40,844
Total
Children in
substantiations
Source: AIHW Child Protection Collection 2014.
Types of abuse and neglect
Nationally, emotional abuse was the most common primary type of abuse or neglect
substantiated for children (40%), followed by neglect (28%). However, there was some
variation between jurisdictions, with neglect being the most common type substantiated for
children in Queensland, South Australia, the Australian Capital Territory and the Northern
Territory (Figure 3.3).
Across Australia, physical abuse was the primary type substantiated for 19% of children who
were the subject of substantiations. This ranged from 12% in the Australian Capital Territory
to 26% in Victoria. Sexual abuse was the reason for substantiation for 14% of children
(Figure 3.3).
20
Child protection Australia 2013–14
Per cent
Physical
Sexual
Emotional
Neglect
60
50
40
30
20
10
0
NSW
Vic
Qld
WA
SA
Tas
States and territories
ACT
NT
Total
Notes
1.
Only the abuse type for the first substantiation in the year that is most likely to place the child at risk or be most severe in the short term is
reported.
2.
Percentages exclude cases where the type of abuse was not stated/inadequately described.
Source: Table A7.
Figure 3.3: Children who were the subjects of substantiations of notifications received during
2013–14, by primary type of abuse or neglect, states and territories
This reporting of substantiated type of abuse or neglect is based on the type of abuse or
neglect that is considered most likely to place the child at risk or be most severe in the short
term—generally known as the ‘primary’ type of abuse or neglect. Other types of abuse or
neglect may also be recorded as part of the substantiation. The co-occurrence of abuse and
neglect refers to substantiations where both primary and other types of abuse are recorded.
Table 3.3 shows the co-occurrence of primary types of abuse or neglect with other types of
abuse or neglect that were recorded. Along with being the most common primary types
reported, emotional abuse and neglect were also the most likely types to co-occur, with
average co-occurrences of 29% and 26% respectively. Emotional abuse co-occurred in nearly
half (47%) of all substantiations where physical abuse was the primary type of substantiated
abuse or neglect and in just over one-quarter (26%) of substantiations where sexual abuse
was the primary type. Neglect co-occurred in 30% of cases where emotional abuse was the
primary type of substantiated abuse and in one-quarter (25%) of substantiations where
physical abuse was the primary type. The co-occurrence of sexual abuse was much lower
than all other types of abuse or neglect, with an average co-occurrence of less than 2% (Table
3.3).
Child protection Australia 2013–14
21
Table 3.3: Co-occurrence of substantiated types of abuse and neglect, 2013–14 (%)
Co-occurring type of abuse or neglect(a)(b)(c)
Primary type of
abuse or neglect
Physical abuse
Sexual abuse
Emotional abuse
Neglect
Average cooccurrence(d)
Physical
abuse
Sexual abuse
Emotional
abuse
Neglect
Total
substantiations
..
2.2
46.9
24.8
9,198
7.1
..
25.5
13.4
6,805
19.2
1.9
..
30.4
18,012
4.7
1.1
17.6
..
12,941
12.0
1.7
28.8
25.5
47,032
(a)
Excludes Queensland as data were not available. As such, the total number of substantiations reported does not match the number
reported in Table 3.1.
(b)
Excludes 6,621 cases for NSW where the same type of abuse/neglect was recorded as both a primary and co-occurring type of
abuse/neglect.
(c)
Not all jurisdictions were able to provide data for all types of co-occurring abuse or neglect—some jurisdictions are only able to report
primary and secondary types. Therefore the proportion of co-occurring abuse types may be understated.
(d)
‘Average co-occurrence’ is equal to the number of cases where the type of abuse or neglect of interest was identified as co-occurring,
divided by the number of cases where the given type of abuse or neglect was not the primary type.
Source: AIHW Child Protection Collection 2014.
Characteristics of children
Age
Age is one of the factors that child protection workers take into consideration when
determining the time taken to respond to a notification, the type of response and whether a
notification will be substantiated.
Across Australia in 2013–14, children in younger age groups were more likely to be the
subjects of substantiations than those in older age groups. Infants (children aged under 1)
were most likely (14.7 per 1,000 children) to be the subjects of substantiations and those aged
15–17 were least likely (3.5 per 1,000 children). This pattern was consistent across all
jurisdictions (Table 3.4).
The rate of infants who were the subjects of substantiations ranged from 7.4 per 1,000
children in Western Australia to 42.8 in the Northern Territory. Overall, the Northern
Territory rates were higher than other jurisdictions for all age categories, while Western
Australia had the lowest rates for the ‘less than 1’ category and the Australian Capital
Territory had the lowest rates for all other categories (Table 3.4).
22
Child protection Australia 2013–14
Table 3.4: Rates of children aged 0–17 who were the subjects of substantiations of notifications
received during 2013–14, by age group, states and territories (number per 1,000 children)
Age group
(years)
NSW
Vic
Qld
WA
SA
Tas
ACT
NT
Total
<1
14.9
20.5
9.0
7.4
18.7
12.0
10.1
42.8
14.7
1–4
9.6
9.8
6.4
5.1
7.2
7.3
4.5
29.3
8.4
5–9
9.2
9.0
6.2
5.5
6.3
6.7
4.0
22.0
7.9
10–14
8.1
8.6
5.5
5.6
5.1
5.0
3.4
18.6
7.2
15–17
4.4
4.4
2.4
2.6
2.0
2.4
1.6
7.8
3.5
0–17
8.5
9.0
5.6
5.1
6.1
5.9
4.0
21.9
7.5
All children
9.0
9.0
6.0
5.2
6.1
6.2
4.0
21.9
7.8
15,074
11,395
6,685
3,053
2,190
712
341
1,394
40,844
Children in
substantiations
Notes
1.
Refer to Table A8 for numbers of substantiations for this table and to Table A48 for population data.
2.
Unborn children may be covered under the child protection legislation and are therefore included in this report. However, they are excluded
in rate calculations for the ‘less than 1’ and ‘0–17’ categories. Unborn children are included in the ‘All children’ rates.
3.
‘All children’ includes children of unknown age.
4.
Finalised investigations, and thus substantiations, refer only to cases that were notified during the year and finalised by 31 August 2014.
This excludes finalised investigations that were notified in a previous reporting period (see also Box 3.1 for the definition of a finalised
investigation).
5.
Rates were calculated using revised population estimates based on the 2011 Census and should not be compared with rates calculated
using populations or projections based on previous Censuses, including those published in previous editions of Child protection Australia.
Source: AIHW Child Protection Collection 2014.
Sex
Overall, just over half (51%) of children who were the subjects of substantiations were girls
(20,697 compared with 19,732 boys). However, in Victoria, Queensland, South Australia and
the Australian Capital Territory, slightly more boys than girls were the subjects of
substantiations (Table A7).
In all jurisdictions, girls were more likely to be the subjects of substantiations of sexual abuse
than boys (18% and 10%, respectively) (Figure 3.4). This is consistent with recorded crime
statistics for sexual assault (ABS 2014d).
In contrast, boys were more likely to be the subjects of substantiations of physical abuse in all
jurisdictions except the Northern Territory. Nationally, boys also had slightly higher
proportions of substantiations for neglect and emotional abuse (29% and 40% respectively,
compared to 26% and 39% for girls), although this varied at the jurisdictional level (Table
A7).
Child protection Australia 2013–14
23
Per cent
Boys
Girls
50
45
40
35
30
25
20
15
10
5
0
Physical
Sexual
Emotional
Neglect
Type of abuse/ neglect
Note: Only the abuse type for the first substantiation in the year that is most likely to place the child at risk or be most severe in the short term is
reported.
Source: Table A7.
Figure 3.4: Children who were the subjects of substantiations of notifications received during
2013–14, by type of abuse or neglect and sex
Family characteristics
There is limited evidence about whether some family structures expose children to a higher
risk of child maltreatment, and the available research has produced ambiguous and
conflicting results (AIFS: Hunter & Price-Robertson 2012). The data in the following sections
need to be interpreted with caution due to variations in data systems and methodologies
used across jurisdictions.
Socioeconomic status
Across jurisdictions with available data (representing 38% of children in substantiations),
about two–fifths (42%) of children who were the subjects of substantiations were from the
areas of the lowest socioeconomic status (SES) (based on postcode at the time of the first
notification that was substantiated) (Figure 3.5). Indigenous children were far more likely to
be from areas of the lowest SES—57% compared to 37% for non-Indigenous children.
24
Child protection Australia 2013–14
Per cent
70
Indigenous
Non-Indigenous
60
50
40
30
20
10
0
1
Lowest
2
3
4
5
Highest
Socioeconomic status
Notes
1.
Information on SES can be recorded at different times: at the time the abuse or neglect took place, or at the time of the notification,
investigation, or substantiation.
2.
Socioeconomic data exclude New South Wales, Queensland and Western Australia because location data were not available.
Source: Table A9.
Figure 3.5: Children who were the subjects of substantiations, by socioeconomic status at
notification, 2013–14
Family type
Table A10 indicates that intact two-parent families and female single-parent families had the
highest proportions of substantiations. However, data relating to family type were only
available for 31% of children in substantiations and should be interpreted with caution due
to data quality limitations.
Aboriginal and Torres Strait Islander children
Children in substantiations
In 2013–14, 11,270 (38.8 per 1,000) Aboriginal and Torres Strait Islander children were the
subject of a child protection substantiation—7 times the rate of non-Indigenous children
(5.7 per 1,000) (Table 3.5). This is consistent with previous years (see Figure 3.11).
The reasons for the over-representation of Indigenous children in child protection
substantiations are complex. The legacy of past policies of forced removal; intergenerational
effects of previous separations from family and culture; lower SES; and perceptions arising
from cultural differences in child-rearing practices are all underlying causes for their
over-representation in the child welfare system (HREOC 1997). Drug and alcohol abuse and
family violence may also be contributing factors (Scott & Nair 2013). Indigenous children are
also over-represented in other areas related to child safety including hospital admissions for
Child protection Australia 2013–14
25
injuries and assault, experiences of homelessness and involvement in the youth justice
system (AIHW 2014c).
Table 3.5: Children aged 0–17 who were the subjects of substantiations of notifications received
during 2013–14, by Indigenous status, states and territories (number and number per 1,000
children)
Number of children
State/
territory
Number per 1,000 children
Rate ratio
Indigenous/
nonIndigenous
Indigenous
NonIndigenous
Unknown
All
children
Indigenous
NonIndigenous
All
children
NSW
4,677
10,323
74
15,074
51.2
6.5
9.0
7.9
Vic
1,249
10,145
1
11,395
60.3
8.1
9.0
7.4
2,200
4,234
251
6,685
25.5
4.1
6.0
6.2
1,070
1,182
801
3,053
29.0
2.2
5.2
13.3
691
1,398
101
2,190
43.4
4.1
6.1
10.6
86
430
196
712
8.1
4.1
6.2
2.0
66
275
—
341
27.4
3.3
4.0
8.2
1,231
162
1
1,394
46.1
4.4
21.9
10.5
11,270
28,149
1,425
40,844
38.8
5.7
7.8
6.8
Qld
(a)
WA
SA
Tas
(a)
ACT
NT
Total
(a)
In Western Australia and Tasmania the higher proportion of children with unknown Indigenous status may affect the reliability of the rate
ratio calculation. Rate ratios should therefore be interpreted with caution.
Notes
1.
Rates were calculated using revised population estimates based on the 2011 Census and should not be compared with rates calculated
using populations or projections based on previous Censuses, including those published in previous editions of Child protection Australia.
Refer to Table A46 for the populations used in the calculation of rates.
2.
Rate calculations include unborn children and children of unknown age.
3.
Legislation and practice differs across jurisdictions in relation to children aged 17. In some jurisdictions, children aged 17 are not
substantiated and this means the number per 1,000 children who were the subjects of substantiations may be lower for those jurisdictions.
4.
Rate ratios are calculated by dividing the unrounded rate of Aboriginal and Torres Strait Islander children who were the subject of
substantiations by the unrounded rate of non-Indigenous children who were the subject of substantiations. The resulting number is a
measure of how many Aboriginal and Torres Strait Islander children were the subjects of substantiations for every non-Indigenous child who
was the subject of substantiation.
Source: AIHW Child Protection Collection 2014.
Abuse and neglect type
Overall, the most common type of substantiated abuse for Aboriginal and Torres Strait
Islander children was neglect, which represented 41% of substantiations (compared with
22% for non-Indigenous children). The proportion of substantiations for all other abuse types
was accordingly higher for non-Indigenous children (Figure 3.6). Nationally, the second
most common substantiation type for Indigenous children was emotional abuse, which was
34% compared with 42% for non-Indigenous children.
There was significant variation across jurisdictions in the proportion of Indigenous children
substantiated for neglect—ranging from 7% in Victoria to 56% in South Australia and the
Australian Capital Territory (Table A11). Variation across jurisdictions was also reflected in
the proportions of Indigenous children substantiated for emotional abuse—ranging from
29% in Queensland and South Australia to 62% in Victoria.
Across all jurisdictions, sexual abuse was the least common type of substantiation for
Indigenous children (9%). Sexual abuse was also the least common type of substantiation for
26
Child protection Australia 2013–14
non-Indigenous children in all jurisdictions except New South Wales, Victoria and Western
Australia.
Per cent
50
Indigenous
Non-Indigenous
45
40
35
30
25
20
15
10
5
0
Physical
Sexual
Emotional
Neglect
Type of abuse/ neglect
Note: For each child, the type of abuse/neglect reported is the type identified for their first substantiation in the year. Where multiple types of abuse
were reported in the same substantiation, the data reflect the abuse type that is most likely to place the child at risk or be most severe in the short
term.
Source: Table A11.
Figure 3.6: Children who were the subjects of substantiations of notifications received during
2013–14, by Indigenous status and type of abuse (%).
3.3 National trends
Trends in number of cases
Overall, since 2009–10 the numbers of notifications and substantiations have risen, while the
number of investigations has dropped. The numbers of notifications and substantiations fell
between 2009–10 and 2010–11. This was followed by an increase in the number of
notifications (from 237,273 to 304,097) and substantiations (from 40,466 to 54,438) between
2010–11 and 2013–14. There was a downward trend for investigations until 2011–12,
followed by a 12% rise in the past 12 months (Figure 3.7).
Although nationally there was an increase in notifications and substantiations over the 5
years, the size and direction of change varied across jurisdictions (Tables A12 and A13).
The decline in investigations since 2009–10, coupled with a rise in substantiations,
particularly over the past 3 years, has narrowed the gap between the number of
investigations and substantiations.
Child protection Australia 2013–14
27
Number
Notifications
350,000
Investigations
Substantiations
300,000
250,000
200,000
150,000
100,000
50,000
0
2009–10
2010–11
2011–12
Year
2012–13
2013–14
Source: Table A38.
Figure 3.7: Number of notifications, investigations and substantiations, 2009–10 to 2013–14
Trends relating to children
The rate of children who were the subjects of notifications decreased from 37.2 per 1,000
children in 2009–10 to 32.3 per 1,000 in 2010–11. However, this downward trend then
reversed between 2010–11 and 2013–14, with the rate of children who were the subjects of
notifications in 2013–14 (37.8 per 1,000 children) returning to a level similar to 2009–10
(Figure 3.8).
The rate of children who were the subjects of substantiations remained stable between
2009–10 and 2010–11 at 6.2 per 1,000 children. The rate then rose to 7.4 per 1,000 in 2011–12
and 7.8 per 1,000 in 2012–13, remaining stable in 2013–14. Over the 5-year period there has
been a 31% increase in the number of children who were the subjects of substantiations,
rising from 31,295 in 2009–10 to 40,844 in 2013–14 (Table A38).
Legislative changes, enhanced public awareness and inquiries into child protection
processes, along with real rises in abuse and neglect could influence increases in the number
of notifications and substantiations, and the children who were the subject of them.
Additionally, recent increases could be related to an increased focus on providing statutory
responses to those who are most likely to need intervention and protection. This may have
resulted in a more targeted approach to investigations and a rise in the number of children
who were the subjects of substantiations.
Information on state and territory policies and practices and the various inquiries into state
and territory child protection services that may have enhanced public awareness is provided
in Appendixes D–I (online)
<http://www.aihw.gov.au/publicationdetail/?id=60129550762>.
28
Child protection Australia 2013–14
Number per 1,000
Children subject to notifications
45.0
40.0
35.0
30.0
25.0
20.0
15.0
10.0
5.0
0.0
2009–10
2010–11
2011–12
2012–13
2013–14
Year
Number per 1,000
Children subject to
substantiations
9.0
8.0
7.0
6.0
5.0
4.0
3.0
2.0
1.0
0.0
2009–10
2010–11
2011–12
2012–13
2013–14
Year
Note: Rates were calculated using revised population estimates based on the 2011 Census and should not be compared with rates calculated
using populations or projections based on previous Censuses, including those published in previous editions of Child protection Australia.
Source: Tables A38 and S1.
Figure 3.8: Children who were the subjects of child protection notifications and substantiations,
2009–10 to 2013–14 (rate)
Across states and territories, rates of children who were the subjects of substantiations have
fluctuated over the past 5 years. Since 2009–10, rates have increased overall for all
jurisdictions except for Tasmania and the Australian Capital Territory. The largest increase
over this period was for the Northern Territory (from 16.7 per 1,000 children in 2009–10 to
21.9 in 2013–14). Over the past 12 months, rates have risen in Victoria, Western Australia,
South Australia and the Northern Territory and dropped in New South Wales, Queensland,
Tasmania and the Australian Capital Territory (Table A14).
Child protection Australia 2013–14
29
Age profile
Over the 5 years since 2009–10, the rate of children aged under 1 who were the subjects of
substantiations has increased. Between 2009–10 and 2010–11, the rate of children aged under
1 who were the subjects of substantiations decreased (from 13.3 to 12.2 per 1,000 children).
However, over the past 3 years the rate has risen from 12.2 in 2010–11 to 14.7 in 2013–14. In
line with increasing rates overall, other age groups have also showed increases over the 5year period. For most age groups rates were stable from 2009–10 to 2010–11, rose between
2010–11 and 2012–13, and remained fairly stable between 2012–13 and 2013–14 (Figure 3.9).
Number per 1,000
<1
1–4
5–9
10–14
15–17
16.0
14.0
12.0
10.0
8.0
6.0
4.0
2.0
0.0
2009–10
2010–11
2011–12
2012–13
2013–14
Year
Notes
1.
Unborn children may be covered under the child protection legislation and are therefore included elsewhere in this report. However, they are
excluded from the less than 1 year age group in this figure.
2.
Rates were calculated using revised population estimates based on the 2011 Census and should not be compared with rates calculated
using populations or projections based on previous Censuses, including those published in previous editions of Child protection Australia.
Source: Tables A40 and S1.
Figure 3.9: Children aged 0–17 who were subjects of child protection substantiations by age group,
2009–10 to 2013–14 (rate)
Abuse and neglect type
From 2009–10 to 2013–14, the rates of children who were the subjects of substantiations have
increased for all types of abuse and neglect, although the size and pattern of the change
varied. Rates for emotional abuse dropped between 2009–10 and 2010–11, with a
considerable rise evident over the past 3 years (from a rate of 2.2 in 2010–11 to 3.1 in
2013–14). Rates for neglect were stable between 2009–10 and 2010–11, increasing to 2.1 per
1,000 in 2011–12 and have remained fairly stable for the past 3 years. The rate for sexual
abuse has risen slightly from a rate of 0.8 in 2009–10 to 1.1 in 2013–14, while the rate for
physical abuse has remained relatively stable, at around 1.5 over the same period (Figure
3.10).
30
Child protection Australia 2013–14
Number per 1,000
children
Physical abuse
Sexual abuse
Emotional abuse
Neglect
4.0
3.0
2.0
1.0
0.0
2009–10
2010–11
2011–12
2012–13
2013–14
Year
Note: Rates were calculated using revised population estimates based on the 2011 Census and should not be compared with rates calculated
using populations or projections based on previous Censuses, including those published in previous editions of Child protection Australia.
Source: Tables A41 and S1.
Figure 3.10: Children who were the subjects of child protection substantiations, by abuse type,
2009–10 to 2013–14 (rate)
Aboriginal and Torres Strait Islander children
Over the past 5 years, the substantiation rates for Indigenous and non-Indigenous children
have both increased, from 29.5 to 38.8 per 1,000 and from 4.7 to 5.7 per 1,000, respectively.
The rate ratio of Indigenous to non-Indigenous children has risen since 2009–10 from 6.3 to
6.8 in 2013–14 (Figure 3.11).
The revised methodology that the ABS used to obtain estimates of the resident population
for Indigenous and non-Indigenous children in 2013–14 resulted in an increase in estimates
of the number of Indigenous Australians based on the 2011 Census compared with those
based on the 2006 Census. This means that rates calculated with the 2011 Indigenous
population estimates are lower than those based on the 2006 Census. To maintain
consistency in the denominator and allow comparisons over time, all rates for the period
2009–10 to 2013–14 have been calculated using the 2011 Census-based population estimates,
including back-cast historical estimates. Therefore, rates presented in this report are not
comparable to rates calculated using estimates based on the 2006 Census, including those
published in previous editions of Child protection Australia.
Child protection Australia 2013–14
31
Rate ratio (diamonds)
10
Number per 1,000
45.0
40.0
8
35.0
30.0
6
25.0
20.0
4
15.0
10.0
2
5.0
0.0
0
2009–10
2010–11
2011–12
2012–13
2013–14
Year
Indigenous
Non-Indigenous
Rate ratio
Notes
1.
Rates were calculated using revised population estimates based on the 2011 Census and should not be compared with rates calculated
using populations or projections based on previous Censuses, including those published in previous editions of Child protection Australia.
2.
Rate ratios are calculated by dividing the un-rounded rate of Aboriginal and Torres Strait Islander children who received child protection
services by the un-rounded rate of non-Indigenous children who received child protection services. The resulting number is a measure of
how many Aboriginal and Torres Strait Islander children were the subjects of substantiation for every non-Indigenous child who was the
subject of a substantiation. Children whose Indigenous status is unknown are excluded from the calculations.
Source: Tables A39 and S1.
Figure 3.11: Children who were the subjects of child protection substantiations, by Indigenous
status, 2009–10 to 2013–14 (rate and rate ratio)
32
Child protection Australia 2013–14
4
Care and protection orders
4.1 Overview and key statistics
Care and protection orders are legal orders or arrangements that give child protection
departments some responsibility for a child’s welfare (see Box 4.2 for national categories).
In 2013–14, there were 37,354 care and protection orders issued across jurisdictions, with
13,171 children admitted to an order during that time. Nationally, in 2013–14, more children
were admitted to care and protection orders (13,171) than were discharged from
orders (10,275). At 30 June 2014, 45,746 children were on a care and protection order—a rate
of 8.7 per 1,000 Australian children (Table 4.1).
Table 4.1: Key care and protection order statistics, 2013–14
Rate (number per
Number
1,000 children)
Care and protection orders issued (during 2013–14)
37,354
..
Children admitted to an order (during 2013–14)
13,171
2.5
Children discharged from an order (during 2013–14)
10,275
2.0
Children on a care and protection order (during 2013–14)
55,067
10.5
Children on a care and protection order (as at 30 June 2014)
45,746
8.7
Source: AIHW Child Protection Collection 2014.
The number of children on a care and protection order on an average day (for jurisdictions
with available data) is reported in Box 4.1.
Box 4.1 Children on an order on an average day in 2013–14
Average day measures are calculated by summing the number of days each person was
subject to the same event during the year and dividing this total by the number of days in
the financial year. This provides a view of the data that accounts for each day during the
year, rather than a snapshot for a single day (for example, 30 June which is typically
reported). See Appendix B Technical notes for more detail.
Average day analyses for 2013–14 exclude NSW and Qld. For all other jurisdictions, on an
average day in 2013–14 there were 19,237 children on a care and protection order. This
compares with 19,373 children at 30 June 2014 (excluding NSW and Qld). Similar to counts
of orders at 30 June 2014, on an average day in 2013–14 the largest number were on
guardianship or custody orders (61%), followed by finalised third-party parental
responsibility orders (15%) (Table A15). Data quality issues for some jurisdictions may
impact on these results.
For this report, children are counted only once, even if they were admitted to, or discharged
from, more than one order, or were on more than one order at 30 June 2014. If a child was on
more than one order at 30 June 2014 then the child is counted as being on the order that
implies the highest level of intervention by the department (with finalised guardianship or
custody orders being the most interventionist, and interim and temporary orders the least
interventionist).
Child protection Australia 2013–14
33
Box 4.2: National care and protection order types
•
Finalised guardianship or custody orders: Guardianship orders involve the transfer of
legal guardianship to the relevant state or territory department or non-government
agency. These orders involve considerable intervention in the child’s life and that of
their family, and are sought only as a last resort.
Custody orders generally refer to orders that place children in the custody of the state
or territory department responsible for child protection or a non-government agency.
These orders usually involve the child protection department being responsible for the
daily care and requirements of the child, while the parent retains legal guardianship.
•
Finalised third-party parental responsibility: Orders transferring all duties, powers,
responsibilities and authority parents are entitled to by law, to a nominated person(s)
whom the court considers appropriate. The nominated person may be an individual
such as a relative or an officer of the state or territory department.
•
Finalised supervisory orders: Under these orders, the department supervises and/or
directs the level and type of care that is to be provided to the child. Children under
supervisory orders are generally under the responsibility of their parents and the
guardianship or custody of the child is unaffected.
•
Interim and temporary orders: Orders covering the provisions of a limited period of
supervision and/or placement of a child. Parental responsibility under these orders
may reside with the parents or with the department responsible for child protection.
•
Administrative arrangements: Agreements with child protection departments, which
have the same effect as a court order of transferring custody or guardianship. These
arrangements can also allow a child to be placed in out-of-home care without going
through the courts.
Children are counted in the state or territory where the order is operative, regardless of
where the child is residing. The following are excluded from the collection:
•
children on offence orders, unless they are also on a care and protection order (as
defined above)
•
34
administrative and voluntary arrangements with the departments responsible for child
protection that do not have the effect of transferring custody or guardianship.
Child protection Australia 2013–14
4.2 Types of orders issued
Of the 37,354 care and protection orders issued in 2013–14, most were interim and temporary
orders (64%, or 23,744) or finalised guardianship or custody orders (23%, or 8,609)
(Figure 4.1). The types of care and protection orders issued varied across jurisdictions,
reflecting both the different types of orders available and the different policies and practices
putting them into effect. In all jurisdictions except New South Wales and Western Australia,
interim and temporary orders were the most commonly issued type of order (comprising
about 44% to 84% of orders issued). In New South Wales and Western Australia, finalised
guardianship or custody orders were the most common (44% and 51% respectively).
Per cent
Finalised guardianship or custody orders
Finalised third-party parental responsibility orders
100
Finalised supervisory orders
90
Interim and temporary orders
Administrative arrangements
80
70
60
50
40
30
20
10
0
NSW
Vic
Qld
WA
SA
Tas
ACT
NT
Total
States and territories
Note: In Victoria, prior to 2013–14 third-party parental responsibility orders were included in finalised guardianship or custody orders and only a
small minority of Victoria's interim and temporary orders were reported.
Source: Table A16.
Figure 4.1: Care and protection orders issued, by type of order, 2013–14
4.3 Children and orders
Children admitted to, and discharged from, orders
A total of 13,171 children were admitted to orders in 2013–14. Among this group, two-thirds
(66%) were admitted to an order for the first time. The proportion of children admitted for
the first time ranged from 36% in Queensland to 88% in the Australian Capital Territory
(Table 4.2).
Child protection Australia 2013–14
35
Table 4.2: Children admitted to, and discharged from, care and protection orders, states and
territories, 2013–14
NSW(a)
Vic
Qld(b)
WA
SA
Tas
ACT
NT
Total
2,995
4,210
3,808
908
457
282
141
370
13,171
Children admitted for the first
time
2,539
3,056
1,376
767
396
183
124
278
8,719
Percentage of all admissions
84.8
72.6
36.1
84.5
86.7
64.9
87.9
75.1
66.2
2,052
4,154
2,091
770
494
381
111
222
10,275
Children admitted to orders
Children discharged from
orders
(a)
New South Wales data do not include children on finalised supervisory orders. New South Wales is working to improve the way it counts
admissions to care and protection orders, but currently does not strictly conform to the national counting rules.
(b)
In Queensland, previous admissions to care and protection orders in other jurisdictions could not be counted.
Notes
1.
Data may include children who were discharged on their 18th birthday.
2.
If a new care and protection order is applied in 5 days or less of the discharge of another order (regardless of the type of order), neither an
admission nor discharge are counted.
3.
A renewal of an existing order is not counted as an admission.
4.
If a child is on multiple care and protection orders/arrangements, all orders/arrangements must be discharged before a discharge for the
purposes of this table is counted.
5.
If a child is admitted to, or discharged from, multiple care and protection orders/arrangements, the child is only counted for one admission
and/or one discharge for the year.
Source: AIHW Child Protection Collection 2014.
Children may be admitted (or re-admitted) to a care and protection order for a number of
reasons, including substantiated abuse; irretrievable breakdown in the relationship between
the child and their parents; or where parents were unwilling and/or unable to adequately
care for the child. The proportion of children who were the subject of substantiation in
2012–13, and who were subsequently placed on a care and protection order within 12
months, ranged from 21% in the Northern Territory to 35% in Victoria (Table A17).
Almost half (47%) of children admitted to orders in 2013–14 were aged between 0 and 4,
reflecting the previously noted view that younger children are regarded as the most
vulnerable. This ranged from 44% in Queensland to 56% in the Australian Capital Territory
(Figure 4.2). The median age of children admitted to orders was 5. Age patterns were similar
to those for substantiations of notifications, with a decreasing proportion as age increased
(Table A8).
36
Child protection Australia 2013–14
Per cent
100
0–4 years
5–9 years
10–14 years
15–17 years
90
80
70
60
50
40
30
20
10
0
NSW
Vic
Qld
WA
SA
Tas
ACT
NT
Total
States and territories
Source: Table A18.
Figure 4.2: Children admitted to care and protection orders, by age group, states and territories,
2013–14
Length of time on an order at discharge
Almost two-thirds (62%) of the children discharged from care and protection orders in
2013–14 had been continuously on an order for 1 year or more (Figure 4.3). This pattern was
consistent across most jurisdictions, with lower proportions reported for Victoria (55%) and
the Northern Territory (27%) (Table A19).
In 2013–14, 15% of children who were discharged had been on an order continuously for less
than 3 months, which ranged from 3% of children discharged in Western Australia to 56% in
the Northern Territory. Some of these children may have been on interim or temporary
orders and have had more permanent order arrangements applied later.
At the other end of the spectrum, 12% of children who were discharged from an order had
been continuously on an order for 8 years or more. There was considerable variation across
jurisdictions—ranging from no children in the Northern Territory to 27% of children in New
South Wales (Table A19).
Child protection Australia 2013–14
37
Per cent
30
25
20
15
10
5
0
<3 months
3 to <6 months
6 to <12
months
1 to <2 years
2 to <4 years
4 to <8 years
8+ years
Length of time on an order at discharge
Source: Table A19.
Figure 4.3: Children discharged from care and protection orders, by length of time on an order,
2013–14
Children on orders
Of the 45,746 children who were on care and protection orders at 30 June 2014, almost
two-thirds (65%, or 29,631) were on finalised guardianship or custody orders (Table 4.3).
Across states and territories, the proportion ranged from 37% in Victoria to 92% in South
Australia.
For the other types of orders children were on at 30 June 2014, there was also considerable
variation among the jurisdictions. In New South Wales and Victoria, 23–24% of children
were on finalised third-party parental responsibility arrangements compared with 15% or
less in other jurisdictions. Additionally, Victoria had higher proportions of children on
finalised supervisory orders (21% compared with 5% overall) and interim and temporary
orders (20% compared with 12% overall). South Australia had lower proportions of children
on all other types of orders, with the exception of administrative arrangements. Overall, only
a small proportion of children (less than 1%) were on administrative arrangements that did
not require court intervention.
38
Child protection Australia 2013–14
Table 4.3: Children on care and protection orders, by type of order, states and territories, 30 June
2014
Type of order
NSW(a)
Vic(b)
Qld
WA
SA
Tas
ACT
NT
Total
Number
Finalised guardianship/
custody
11,410
3,374
6,679
3,403
2,548
872
520
825
29,631
Finalised third-party parental
responsibility orders
4,079
2,126
1,392
425
107
181
67
..
8,377
Finalised supervisory orders
n.a.
1,906
306
53
19
10
43
1
2,338
Interim and temporary orders
1,659
1,827
754
590
98
124
73
158
5,283
Administrative arrangements
94
..
..
..
14
1
2
6
117
Not stated
..
0
..
0
0
0
0
0
0
17,242
9,233
9,131
4,471
2,786
1,188
705
990
45,746
Total
%
Finalised guardianship/
custody
66.2
36.5
73.1
76.1
91.5
73.4
73.8
83.3
64.8
Finalised third-party parental
responsibility orders
23.7
23.0
15.2
9.5
3.8
15.2
9.5
..
18.3
Finalised supervisory orders
n.a.
20.6
3.4
1.2
0.7
0.8
6.1
0.1
5.1
Interim and temporary orders
9.6
19.8
8.3
13.2
3.5
10.4
10.4
16.0
11.5
Administrative arrangements
0.5
..
..
..
0.5
0.1
0.3
0.6
0.3
100.0
100.0
100.0
100.0
100.0
100.0
100.0
100.0
100.0
Total
(a)
New South Wales data do not include children on finalised supervisory orders.
(b)
Prior to 2013–14 third-party parental responsibility orders were included in finalised guardianship or custody orders and only a small
minority of Victoria’s interim and temporary orders were reported.
Note: Percentages in the table may not add to 100 due to rounding.
Source: AIHW Child Protection Collection 2014.
Living arrangements
At 30 June 2014, the majority of children on orders lived in funded out-of-home care, either
with relative/kinship carers or in foster care (40% and 38% of children, respectively). A
relatively smaller proportion of children on orders were living with their parents (8%) or in
residential care (5%) (Figure 4.4).
The living arrangements of children on orders generally reflected the expected living
arrangements given the age of the child (Table A21). Across Australia, 97% of children on
orders who were living independently were aged 15–17, while 96% of children on orders
who were under 5 were living in family care or home-based care.
Child protection Australia 2013–14
39
Per cent
45
40
35
30
25
20
15
10
5
0
Foster care
Relative/kinship
Parents
Residential care
Other/unknown
Living arrangement
Notes
1.
‘Relative/kinship’ category includes relatives/kin who are paid and relatives/kin who are not paid.
2.
‘Other/unknown’ category includes ‘other home-based care’, ‘family group homes’, ‘independent living’ and ‘other/unknown’.
Source: Table A20.
Figure 4.4: Children on care and protection orders, by living arrangements, 30 June 2014
Age and sex
The age profile of children on orders was similar across all jurisdictions. Of all children on
care and protection orders, the proportion who were under 5 ranged from 20% in Tasmania
to 27% in the Australian Capital Territory. The proportion of children aged 15–17 ranged
from 13% in Western Australia to 17% in Victoria (Table A22).
The age distribution of children admitted to orders during 2013–14 was considerably
younger than that for all children on orders at 30 June 2014—47% of children admitted to
orders were under 5, compared with 23% of children on orders at 30 June. Conversely, only
6% of children admitted to orders were aged 15–17, compared with 15% of children on
orders at 30 June. These differences can be attributed to the inclusion in the 30 June count of
children who were admitted during previous years and remained on an order in 2014 (tables
A18 and A22).
Overall, there were slightly more boys (51%) than girls (49%) on care and protection orders
(Table A23). This was consistent across all jurisdictions, except the Northern Territory (where
51% were girls).
Aboriginal and Torres Strait Islander children
At 30 June 2014, the rate of Aboriginal and Torres Strait Islander children on orders was
almost 9 times that of non-Indigenous children. In all jurisdictions, the rate of Indigenous
children on orders was higher than the rate for non-Indigenous children, with rate ratios
ranging from 3.0 in Tasmania to 14.9 in Western Australia (Table 4.4).
40
Child protection Australia 2013–14
Table 4.4: Children on care and protection orders, by number and number per 1,000 children aged
0–17 and Indigenous status, states and territories, 30 June 2014
Number of children
Number per 1,000 children
Indigenous
NonIndigenous
Unknown
All
children
Indigenous
NonIndigenous
All
children
Rate ratio
Indigenous/
nonIndigenous
NSW(a)
6,022
11,219
1
17,242
65.8
7.1
10.2
9.3
Vic
1,507
7,718
8
9,233
72.3
6.1
7.2
11.8
Qld
3,659
5,404
68
9,131
42.2
5.2
8.2
8.1
WA
2,215
2,201
55
4,471
59.8
4.0
7.6
14.9
SA
812
1,940
34
2,786
50.7
5.7
7.8
9.0
Tas
267
880
41
1,188
25.1
8.5
10.4
3.0
ACT
182
523
0
705
75.1
6.3
8.3
11.9
State/
territory
NT
Total
(a)
840
149
1
990
31.5
4.0
15.5
7.8
15,504
30,034
208
45,746
53.1
6.0
8.7
8.8
New South Wales data do not include children on finalised supervisory orders.
Notes
1.
Rates were calculated using revised population estimates based on the 2011 Census and should not be compared with rates calculated
using populations or projections based on previous Censuses, including those published in previous editions of Child protection Australia.
Refer to Table A47 for the populations used in the calculation of rates.
2.
Rate ratios are calculated by dividing the unrounded rate of Aboriginal and Torres Strait Islander children who were on a care and protection
order by the unrounded rate of non-Indigenous children who were on a care and protection order. The resulting number is a measure of how
many Aboriginal and Torres Strait Islander children were on a care and protection order for every non-Indigenous child who was on a care
and protection order.
Source: AIHW Child Protection Collection 2014.
Indigenous and non-Indigenous children were generally on similar types of orders, with
most on finalised guardianship and custody orders at 30 June 2014 (Table A24). The
proportion of Indigenous children on finalised guardianship and custody orders was higher
than the proportion for non-Indigenous children (71% compared to 62%). However,
Indigenous children were less likely to be on all other types of orders (Table A24).
4.4 National trends
Children admitted to, and discharged from, orders
The number of children admitted to, and discharged from, orders has fluctuated over the
past 5 years. Between 2009–10 and 2010–11, the number of children admitted to orders fell by
5%—from 14,564 to 13,830. In 2011–12, there was a smaller increase (3%); followed by a 7%
decrease in 2012–13. Over the past year, the number of children admitted to orders has
remained relatively stable at around 13,100 children.
Despite this national stability, during the past 12 months the trends varied across
jurisdictions. There was a rise in the number of children admitted to orders in New South
Wales, Victoria, the Australian Capital Territory and the Northern Territory, with reductions
for all other jurisdictions (Table A43).
Child protection Australia 2013–14
41
The number of children discharged from orders has been increasing since 2010–11. Between
2012–13 and 2013–14, the number of children discharged from orders rose by 5% from 9,795
to 10,275. Changes in the numbers of children discharged in individual jurisdictions varied
considerably—the number of discharges remained relatively stable for New South Wales;
there were large falls in the Australian Capital and the Northern Territory; and there were
small to moderate increases across all other jurisdictions (Table A44).
Between 2009–10 and 2013–14, the number of children admitted to orders has remained
consistently higher than the number discharged (Figure 4.5); however, over the past 5 years,
the difference has decreased. In 2009–10, there were 6,773 more children admitted than
discharged, whereas in 2013–14, 2,896 more children were admitted than were discharged
(tables A43 and A44).
Number
Children admitted to orders
Children discharged from orders
16,000
14,000
12,000
10,000
8,000
6,000
4,000
2,000
0
2009–10
2010–11
2011–12
2012–13
2013–14
Year
Note: Rates were calculated using revised population estimates based on the 2011 Census (see Table S2) and should not be compared with rates
calculated using populations or projections based on previous Censuses, including those published in previous editions of Child protection
Australia.
Source: Tables A43 and A44.
Figure 4.5: Children admitted to, and discharged from, care and protection orders, 2009–10 to
2013–14
42
Child protection Australia 2013–14
Children on care and protection orders
From 30 June 2010 to 30 June 2014, the rate of children aged 0–17 on orders increased from
7.5 to 8.7 per 1,000 (Table 4.5). There were increases in all jurisdictions, with the largest
increase in the Northern Territory (from 11.1 per 1,000 in 2010 to 15.5 in 2014).
Although the number of non-Indigenous children on orders increased slightly over this
period, the substantial increase in the number of Aboriginal and Torres Strait Islander
children on orders has largely driven the rise in the overall number of children (see Table
A39).
Table 4.5: Rates of children on care and protection orders, states and territories, 30 June 2010 to 30
June 2014 (number per 1,000)
Year
NSW(a)
Vic
Qld
WA(b)
SA
Tas
ACT
NT
Total
2010
9.0
5.4
7.6
6.4
7.2
9.5
8.2
11.1
7.5
2011
9.3
5.5
7.9
6.0
7.4
10.2
9.0
11.6
7.7
2012
9.7
5.9
8.1
6.2
7.5
10.2
8.8
12.4
7.9
2013
9.8
6.2
8.3
7.4
7.8
10.9
8.1
12.8
8.2
2014
10.2
7.2
8.2
7.6
7.8
10.4
8.3
15.5
8.7
(a)
New South Wales data do not include children on finalised supervisory orders.
(b)
Data for 2009–10 for Western Australia are not comparable with other years due to the introduction of a new client information system in
March 2010. Proxy data were provided for that year.
Notes
1.
Some rates may not match those published in previous Child protection Australia publications due to retrospective updates to data.
2.
Rates were calculated using revised population estimates based on the 2011 Census (see Table S2), and should not be compared with
rates calculated using populations or projections based on previous Censuses, including those published in previous editions of Child
protection Australia. Refer to Table A42 for the numbers used to calculate these rates.
Source: AIHW Child Protection Collection 2014.
Aboriginal and Torres Strait Islander children
From 30 June 2010 to 30 June 2014, the rate of Aboriginal and Torres Strait Islander children
on care and protection orders has risen steadily (from 40.3 to 53.1 per 1,000), while the nonIndigenous rate has remained relatively stable (increasing slightly from 5.5 to 6.0 per 1,000)
(Figure 4.6).
Child protection Australia 2013–14
43
Indigenous
Number per 1,000
Non-Indigenous
60.0
50.0
40.0
30.0
20.0
10.0
0.0
2009–10
2010–11
2011–12
2012–13
2013–14
Year
Notes
1.
Rate calculations exclude children whose Indigenous status is unknown.
2.
Rates were calculated using revised population estimates based on the 2011 Census and should not be compared with rates calculated
using populations or projections based on previous Censuses, including those published in previous editions of Child protection Australia.
Source: Tables A39 and S2.
Figure 4.6: Children aged 0–17 on care and protection orders, by Indigenous status, 30 June 2010 to
30 June 2014 (rate)
44
Child protection Australia 2013–14
5
Out-of-home care
Out-of-home care is overnight care for children aged 0–17 years, where the state or territory
makes a financial payment or where a financial payment has been offered but has been
declined by the carer (see Box 5.2 for types of out-of-home care).
5.1 Overview and key statistics
In 2013–14, 11,085 children were admitted to out-of-home care, while 8,409 children were
discharged. At 30 June 2014, there were 43,009 children in out-of-home care—a rate of 8.1 per
1,000 Australian children (Table 5.1).
Table 5.1: Key out-of-home care statistics, 2013–14
Number
Number per 1,000 children
11,085
2.1
8,409
1.6
Children in out-of-home care during 2013–14
51,539
9.8
Children in out-of-home care (at 30 June)
43,009
8.1
Children admitted to out-of-home care (during 2013–14)
Children discharged from out-of-home care (during 2013–14)
Source: AIHW Child Protection Collection 2014.
The number of children in out-of-home care on an average day is reported in Box 5.1.
Box 5.1 Children in out-of-home care on an average day in 2013–14
‘Average day’ measures are calculated by summing the number of days each person was
subject to the same event during the year and dividing this total by the number of days in
the financial year. This provides a view of the data that accounts for each day during the
year, rather than a snapshot for a single day (for example, 30 June which is typically
reported).
Average day analyses for 2013–14 exclude NSW and Qld. For all other jurisdictions, on an
average day in 2013–14 there were 15,858 children in out-of-home care. This compares with
16,632 children at 30 June 2014 (excluding NSW and Qld). Most children were placed with
relative/kinship carers (45%) or in foster care (37%) (Table A25). These proportions are
similar to those for children in out-of-home care at 30 June 2014 (45% and 35%, respectively,
excluding NSW and Qld). Data quality issues for some jurisdictions may impact on these
results.
Child protection Australia 2013–14
45
Box 5.2: Types of out-of-home care
•
Residential care—where placement is in a residential building whose purpose is to
provide placements for children and where there are paid staff.
•
Family group homes—homes for children provided by a department or
community-sector agency which have live-in, non-salaried carers who are reimbursed
and/or subsidised for the provision of care.
•
Home-based care—placement in the home of a carer who is reimbursed (or who has
been offered but declined reimbursement) for expenses for the care of the child. This is
broken down into 3 subcategories: relative/kinship care, foster care and other homebased out-of-home care.
•
Independent living—including private board and lead tenant households.
•
Other—includes placements that do not fit into the above categories and unknown
placement types. This includes boarding schools, hospitals, hotels/motels and the
defence forces.
Placements for the purpose of respite are included. Respite care is used to provide
short-term accommodation for children and young people where the intention is for the
child to return to their prior place of residence. This includes respite from birth family and
respite from placement.
Placements solely funded by disability services, medical or psychiatric services, juvenile
justice facilities, overnight child care services or supported accommodation assistance
placements, and children in placements with parents where the jurisdiction makes a financial
payment are excluded.
5.2 Children
Children admitted to, and discharged from, out-of-home care
Of the 11,085 children admitted to out-of-home care during 2013–14, 4,924 (44%) were aged
under 5. Almost one-quarter (24%, or 2,654) were aged between 5 and 9 and a further 22%
(or 2,385 children) were between 10 and 14. Children aged 15–17 represented 10% (1,121) of
all children admitted to out-of-home care in 2013–14 (Table A26). The median age of children
admitted to out-of-home care was 6 years.
The age distribution of children discharged from out-of-home care was older than that of
children admitted to out-of-home care—the median age of children discharged was 11 years.
Nationally, 37% of those discharged were aged 15–17 (Table A27), compared with 10%
admitted to out-of-home care (Figure 5.1). This reflects children being admitted to out-ofhome care at a younger age and remaining there for longer, as well as children leaving outof-home care once they turn 18.
46
Child protection Australia 2013–14
Per cent
<1 year
40
1–4 years
35
5–9 years
30
10–14 years
25
15–17 years
20
15
10
5
0
Admitted to out-of-home care
Discharged from out-of-home care
Source: Tables A26 and A27.
Figure 5.1: Children admitted to, and discharged from, out-of-home care, by age group, 2013–14
Children in out-of-home care
Nationally, the rate of children in out-of-home care at 30 June 2014 was 8.1 per 1,000
children, ranging from 6.0 per 1,000 in Victoria to 14.3 in the Northern Territory (Figure 5.2).
Number per 1,000
children
16.0
14.0
12.0
10.0
8.0
6.0
4.0
2.0
0.0
NSW
Vic
Qld
WA
SA
Tas
ACT
NT
Total
States and territories
Source: Table 5.4.
Figure 5.2: Children in out-of-home care, states and territories, 30 June 2014 (rate)
Child protection Australia 2013–14
47
Types of placement
The vast majority of children (93%) in out-of-home care at 30 June 2014 were in home-based
care—41% in foster care, 49% in relative/kinship care and 4% in other types of home-based
care (Table A28). The proportions varied across jurisdictions; for example, the proportion of
children in foster care ranged from 28% in Victoria to 52% in Queensland (Figure 5.3).
Nationally, around 1 in 20 children in out-of-home care were living in residential care
(Figure 5.3). Higher proportions than the national level of children in residential care were
reported for all jurisdictions except New South Wales, Western Australia and Tasmania.
Residential care is mainly used for children who have complex needs. However, in many
jurisdictions, priority is given to keeping siblings together, which sometimes results in
periods of residential care for larger family groups.
Per cent
Foster care
Relative/kinship
Residential care
Other/unknown
60
50
40
30
20
10
0
NSW
Vic
Qld
WA
SA
Tas
ACT
NT
Total
States and territories
Notes
1.
In Victoria, the ‘foster care’ category includes children in permanent care placements. These placements are different to foster care as they
involve granting permanent guardianship and custody of a child to a third party via a permanent care order. Unlike adoptions, permanent
care orders do not change the legal status of the child and they expire when the child turns 18 or marries.
2.
In Tasmania, children under third-party guardianship orders are counted under ‘Other’ living arrangements.
3.
In the Northern Territory’s client information system, the majority of children in a relative/kinship placement are captured in the foster care
placement type. Approximately 45% of children in the above ‘foster care’ placement type are placed in a relative/kinship household.
4.
Where a child is placed with a relative who is also fully registered to provide foster care for other children, they are counted in the ‘foster
care’ category for Victoria and Western Australia, whereas they are counted in the ‘relatives/kin' category in Queensland and South
Australia. Relatives/kin in some jurisdictions undergo assessment, registration and review processes similar to foster carers under the
national definition, and are considered as (relative) foster carers in local practice, policy and reporting.
Source: Table A28.
Figure 5.3: Children in out-of-home care, by living arrangements, states and territories, 30 June 2014
Length of time continuously in care
Nationally, at 30 June 2014, about 4 in 5 children (82%) had been continuously in out-ofhome care for more than 1 year—ranging from 74% of children in Victoria to 88% in South
Australia. More than one-quarter (28%) had been in out-of-home care for between 2 and 5
years, while a further 41% had been in out-of-home care for 5 years or more (Table 5.2).
Eighteen per cent of children had been in out-of-home care for less than 1 year.
48
Child protection Australia 2013–14
Table 5.2: Children in out-of-home care, by length of time continuously in care, states and
territories, 30 June 2014
Time in continuous
placement
NSW
Qld
Vic
WA
SA
Tas
ACT
NT
Total
Number
(a)
<1 month
289
265
178
76
41
8
17
30
904
1 month to <6 months
1,115
887
616
422
156
61
48
120
3,425
6 months to <1 year
1,254
823
614
319
122
75
43
113
3,363
1 year to <2 years
1,886
1,172
1,118
599
307
141
66
148
5,437
2 years to <5 years
5,183
2,053
2,250
1,060
763
322
168
393
12,192
5 years or more
8,465
2,510
3,409
1,247
1,242
447
264
104
17,688
18,192
7,710
8,185
3,723
2,631
1,054
606
908
43,009
Total
%
<1 month
1.6
3.4
2.2
2.0
1.6
0.8
2.8
3.3
2.1
1 month to <6 months
6.1
11.5
7.5
11.3
5.9
5.8
7.9
13.2
8.0
6 months to <1 year
6.9
10.7
7.5
8.6
4.6
7.1
7.1
12.4
7.8
1 year to <2 years
10.4
15.2
13.7
16.1
11.7
13.4
10.9
16.3
12.6
2 years to <5 years
28.5
26.6
27.5
28.5
29.0
30.6
27.7
43.3
28.3
5 years or more
46.5
32.6
41.6
33.5
47.2
42.4
43.6
11.5
41.1
100.0
100.0
100.0
100.0
100.0
100.0
100.0
100.0
100.0
Total
(a)
Not all jurisdictions were able to identify whether children were in respite care. However, where it was known that children were in respite
care, they were included in the relevant time category.
Notes
1.
If a child has a return home or break of less than 60 days before returning to the same or different placement, they are considered to be
continuously in care during this period.
2.
Percentages exclude cases where the length of time in a continuous placement was unknown or not stated.
3.
Percentages in the table may not add to 100 due to rounding.
Source: AIHW Child Protection Collection 2014.
Children on a care and protection order
Nationally, 93% of children in out-of-home care were also on care and protection orders. In
the Northern Territory, all children in out-of-home care are required to be on care and
protection orders. In other jurisdictions, the proportion of children in out-of-home care who
were on care and protection orders ranged from 86% in Victoria to 99% in Tasmania and the
Australian Capital Territory (Table 5.3). In Western Australia, South Australia and the
Australian Capital Territory, a small proportion of children in out-of-home care were on
orders other than care and protection orders (for example, offence orders).
Child protection Australia 2013–14
49
Table 5.3: Children in out-of-home care, order status, states and territories, 30 June 2014
Order status
NSW
Vic
Qld
WA(a)
SA
Tas
ACT
NT
Total
Number
On care and protection order
16,535
6,647
7,989
3,502
2,561
1,038
593
908
39,773
0
0
0
6
69
0
6
0
81
16,535
6,647
7,989
3,508
2,630
1,038
599
908
39,854
1,657
1,063
196
215
1
16
7
0
3,155
18,192
7,710
8,185
3,723
2,631
1,054
606
908
43,009
On another type of order
Total children on orders
Not on an order
Total
%
On care and protection order
90.9
86.2
97.6
94.1
97.3
98.5
97.9
100.0
92.5
On another type of order
0.0
0.0
0.0
0.2
2.6
0.0
1.0
0.0
0.2
Total children on orders
90.9
86.2
97.6
94.2
100.0
98.5
98.8
100.0
92.7
Not on an order
Total
(a)
9.1
13.8
2.4
5.8
—
1.5
1.2
0.0
7.3
100.0
100.0
100.0
100.0
100.0
100.0
100.0
100.0
100.0
Children not on an order are children in negotiated placements, placement service and those awaiting prospective adoption.
Source: AIHW Child Protection Collection 2014.
Age and sex profile
Almost one-third (32%) of children in out-of-home care were aged 5‒9 and a similar
proportion (31%) were aged 10‒14 (Table A29). The median age of children in out-of-home
care was 9 years. In line with the general population distribution, just over half (52%) of all
children in out-of-home care were boys (Table A30).
Living arrangements for children in out-of-home care were similar across age groups to
children on care and protection orders. Children in residential care were older than children
in home-based care—83% of children in residential care or family group homes were aged 10
or older, with a median age of 13. The corresponding proportion of children aged over 10 in
home-based care was 43% (Table A31), with a median age of 8 years. Four per cent of
children in residential care or family group homes in Australia were aged under 5, compared
with 23% of those in home-based care.
Aboriginal and Torres Strait Islander children
At 30 June 2014, there were 14,991 Aboriginal and Torres Strait Islander children in
out-of-home care, a rate of 51.4 per 1,000 children. These rates ranged from 21.8 per 1,000 in
Tasmania to 71.3 per 1,000 in New South Wales (Table 5.4).
Nationally, the rate of Indigenous children in out-of-home care was 9 times the rate for
non-Indigenous children. In all jurisdictions, the rate of Indigenous children in out-of-home
care was higher than for non-Indigenous children, with rate ratios ranging from 2.9 in
Tasmania to 15.5 in Western Australia.
Indigenous children in out-of-home care were over-represented across all age groups and
this was particularly evident for Indigenous children aged under 10. For example,
Indigenous children aged 1–4 were 11 times as likely as non-Indigenous children to be in
out-of-home care at 30 June 2014 (Table A32).
50
Child protection Australia 2013–14
Table 5.4: Children in out-of-home care, by number and number per 1,000 children aged 0–17 and
Indigenous status, states and territories, 30 June 2014
Number of children
Number per 1,000 children
Indigenous
NonIndigenous
Unknown
All
children(a)
Indigenous
NonIndigenous
All
children(a)
Rate ratio
Indigenous/
nonIndigenous
NSW
6,520
11,667
5
18,192
71.3
7.3
10.8
9.7
Vic
1,308
6,393
9
7,710
62.7
5.1
6.0
12.3
Qld
3,336
4,783
66
8,185
38.5
4.6
7.3
8.3
WA
1,882
1,800
41
3,723
50.8
3.3
6.3
15.5
SA
787
1,811
33
2,631
49.2
5.3
7.3
9.3
Tas
232
786
36
1,054
21.8
7.6
9.2
2.9
ACT
152
454
0
606
62.7
5.5
7.1
11.4
NT
774
133
1
908
29.0
3.6
14.3
8.1
14,991
27,827
191
43,009
51.4
5.6
8.1
9.2
State/
territory
Total
(a)
‘All children’ includes children whose Indigenous status was unknown.
Notes
1.
Rates were calculated using revised population estimates based on the 2011 Census and should not be compared with rates calculated
using populations or projections based on previous Censuses, including those published in previous editions of Child protection Australia.
Refer to Table A47 for the populations used in the calculation of rates.
2.
Rate ratios are calculated by dividing the un-rounded rate of Aboriginal and Torres Strait Islander children who were in out-of-home care by
the unrounded rate of non-Indigenous children who were in out-of-home care. The resulting number is a measure of how many Aboriginal
and Torres Strait Islander children were in out-of-home care for every non-Indigenous child who was in out-of-home care. Children whose
Indigenous status is unknown are excluded from the calculations.
Source: AIHW Child Protection Collection 2014.
Box 5.3: The Aboriginal Child Placement Principle
The Aboriginal Child Placement Principle outlines a preference for the placement of
Aboriginal and Torres Strait Islander children with other Aboriginal and Torres Strait Islander
people when they are placed outside their family (Lock 1997:50). The Principle has the
following order of preference for the placement of Indigenous children:
•
with the child’s extended family
•
within the child’s Indigenous community
•
with other Indigenous people.
The Principle is just one of the many considerations taken into account when making decisions
on placements for Indigenous children. Where placement options outlined in the Principle are
not optimal for a child’s safety and wellbeing, the child may be placed in an alternative care
arrangement. This is usually only done after extensive consultation with Aboriginal and
Torres Strait Islander individuals and/or organisations.
All jurisdictions have adopted the Aboriginal Child Placement Principle in legislation and
policy. The impact of the Principle is reflected in the relatively high proportions of
Indigenous children who were placed either with Indigenous caregivers or with relatives in
many jurisdictions (Figure 4.4). Across Australia in 2013–14, 67% of Indigenous children
were placed with relatives/kin, other Indigenous caregivers or in Indigenous residential
care; this proportion is similar to that reported in previous years.
Child protection Australia 2013–14
51
Per cent
100
Total placed with relatives/kin, other Indigenous caregivers or in Indigenous residential care
Total placed with other non-Indigenous caregivers or in non-Indigenous residential care
90
80
70
60
50
40
30
20
10
0
NSW
Vic
Qld
WA
SA
Tas
ACT
NT
Total
States and territories
Note: Aggregate data were provided for New South Wales, Queensland and the Northern Territory.
Source: Table A33.
Figure 5.4: Aboriginal and Torres Strait Islander children in out-of-home care, by Indigenous status
and relationship of carer, states and territories, 30 June 2014
5.3 National trends
Children admitted to, and discharged from, out-of-home care
Between 2009–10 and 2012–13, the number of children discharged from out-of-home care
remained relatively stable while the number of children admitted fluctuated. However, over
the past year, admissions and discharges have both decreased (by 2% and 10%, respectively).
The number of admissions has consistently outnumbered discharges; however, with the
larger decrease in discharges in 2013–14, the gap has increased with 2,676 more children
admitted to out-of-home care than were discharged (Figure 5.5).
52
Child protection Australia 2013–14
Number
Children admitted
Children discharged
16,000
14,000
12,000
10,000
8,000
6,000
4,000
2,000
0
2009–10
2010–11
2011–12
Year
2012–13
2013–14
Source: Tables 5.5 and A45.
Figure 5.5: Children admitted to and discharged from out-of-home care, 2009–10 to 2013–14
The decrease in the number of children discharged from out-of-home care over the past year
was evident in all jurisdictions except South Australia, with decreases ranging from 3% in
Queensland to 25% in the Northern Territory (Table 5.5).
Table 5.5: Children discharged from out-of-home care, states and territories, 2009–10 to 2013–14
Year
NSW
Vic
Qld
WA(a)
SA
Tas
ACT
NT
Total
2009–10
2,981
2,972
1,658
701
405
246
92
275
9,330
2010–11
3,034
2,944
1,628
557
376
222
140
282
9,183
2011–12
2,981
3,123
1,350
710
361
241
168
370
9,304
2012–13
2,762
2,950
1,564
884
440
241
209
310
9,360
2013–14
2,467
2,487
1,520
817
485
220
179
234
8,409
(a)
Data for 2009–10 for Western Australia are not comparable with other years due to the introduction of a new client information system in
March 2010. Proxy data were provided for that year.
Notes
1.
The data for children exiting care include those who left care and had not returned in less than 60 days.
2.
If a child has more than one discharge from care, the child is only counted for one discharge for the year.
3.
Data may include children who were discharged on their 18th birthday.
Source: AIHW Child Protection Collections 2009–10 to 2013–14.
Child protection Australia 2013–14
53
Children in out-of-home care
Nationally, the rate of children in out-of-home care in Australia at 30 June rose between 2010
and 2014, from 7.1 to 8.1 per 1,000 (Table 5.6). Overall, 7,114 more children (an increase of
20%) were in out-of-home care at 30 June 2014 compared with 30 June 2010.
Increases in the rate of children in out-of-home care may reflect the cumulative impact of
children being admitted to, and remaining in, out-of-home care. This is evident in the fall in
the number of children discharged from out-of-home care in 2013–14, as discussed in the
previous section. As with the number of children on care and protection orders (see Chapter
4), the steady rise in the number of Aboriginal and Torres Strait Islander children in out-ofhome care has largely driven the overall increase in the number of children in out-of-home
care.
Table 5.6: Children aged 0–17 in out-of-home care, states and territories, 30 June 2010 to 30 June
2014 (number and number per 1,000)
Year
NSW
Vic
WA(a)
Qld
SA(b)
Tas
ACT
NT
Total
Number
2010
16,175
5,469
7,350
2,737
2,188
893
532
551
35,895
2011
16,740
5,678
7,602
3,120
2,368
966
540
634
37,648
2012
17,192
6,207
7,999
3,400
2,548
1,009
566
700
39,621
2013
17,422
6,542
8,136
3,425
2,657
1,067
558
742
40,549
2014
18,192
7,710
8,185
3,723
2,631
1,054
606
908
43,009
Number per 1,000 children
2010
9.9
4.5
6.9
5.1
6.2
7.6
6.7
8.8
7.1
2011
10.2
4.6
7.1
5.7
6.7
8.3
6.7
10.2
7.4
2012
10.4
5.0
7.3
6.1
7.2
8.7
6.9
11.1
7.7
2013
10.4
5.2
7.4
5.9
7.4
9.3
6.7
11.6
7.7
2014
10.8
6.0
7.3
6.3
7.3
9.2
7.1
14.3
8.1
(a)
Data for 2009–10 for Western Australia are not comparable with other years due to the introduction of a new client information system in
March 2010. Proxy data were provided for that year.
(b)
South Australia could only provide the number of children in out-of-home care where the Department is making a financial contribution to
the care of a child.
Notes
1.
Some numbers and rates may not match those published in previous publications of Child protection Australia due to retrospective updates
to data.
2.
Rates were calculated using revised population estimates based on the 2011 Census and should not be compared with rates calculated
using populations or projections based on previous Censuses, including those published in previous editions of Child protection Australia.
Refer to tables A47 and S2 for the populations used in the calculation of rates.
Source: AIHW Child Protection Collection 2014.
Aboriginal and Torres Strait Islander children
The rate of Aboriginal and Torres Strait Islander children placed in out-of-home care has
risen steadily since 2010, from 40.4 to 51.4 per 1,000 children, while the non-Indigenous rate
has risen slightly from 5.1 to 5.6 per 1,000 children (Figure 5.6).
54
Child protection Australia 2013–14
Indigenous
Non-Indigenous
Number per 1,000
60.0
50.0
40.0
30.0
20.0
10.0
0.0
2009–10
2010–11
2011–12
2012–13
2013–14
Year
Notes
1.
Rate calculations exclude children whose Indigenous status is unknown.
2.
Rates were calculated using revised population estimates based on the 2011 Census and should not be compared with rates calculated
using populations or projections based on previous Censuses, including those published in previous editions of Child protection Australia.
Source: Tables A39 and S2.
Figure 5.6: Children aged 0–17 in out-of-home care by Indigenous status, 30 June 2010 to 30 June
2014 (rate)
Child protection Australia 2013–14
55
6
Carers
Across Australia, the vast majority (93%) of children in out-of-home care are placed in
home-based care, primarily with foster carers or with relatives/kin (see Chapter 5). This
chapter focuses on these carers and their households. Foster care and relative/kinship care
are forms of overnight care provided by one or more adults in a private household to a child
who is living apart from his/her natural or adoptive parents (see Box 6.2).
6.1 Overview and key statistics
At 30 June 2014, there were 9,932 foster carer households and 12,583 relative/kinship
households that had one or more children placed with them (Table 6.1).
Table 6.1: Key foster and relative/kinship carer statistics, at 30 June 2014 and during 2013–14
Number
Foster carer household with a placement at 30 June 2014
9,932
Foster carer households with a placement during 2013–14
12,860
Relative/kinship carer household with a placement at 30 June 2014
12,583
Relative/kinship carer households with a placement during 2013–14
15,099
Per cent
Foster carer households with multiple children in placements at 30 June 2014
49%
Relative/kinship carer households with multiple children in placements at 30 June 2014
39%
Source: AIHW Child Protection Collection 2014.
The number of households approved/authorised to provide funded out-of-home care
placements on an average day is reported in Box 6.1.
Box 6.1 Approved/authorised carer households on an average day in 2013–14
‘Average day’ measures are calculated by summing the number of days each household
was subject to the same event during the year and dividing this total by the number of days
in the financial year. This provides a view of the data that accounts for each day during the
year, rather than a snapshot for a single day (for example, 30 June which is typically
reported).
Average day analyses for 2013–14 exclude NSW and Qld. For all other jurisdictions, on an
average day in 2013–14 there were 12,038 households approved/authorised to provide
out-of-home care. Most of these households were approved/authorised to provide foster or
relative/kinship care (Table A34). Data quality issues for some jurisdictions may impact on
these results.
56
Child protection Australia 2013–14
Box 6.2: Foster and relative/kinship care
•
Foster care is where the caregiver is authorised and reimbursed (or was offered but
declined reimbursement) by the state/territory for the care of the child. These substitute
parents are generally called ‘foster carers’. There are varying degrees of reimbursement
made to foster carers.
•
Relative/kinship care is where the caregiver is a relative (other than parents),
considered to be family or a close friend, or is a member of the child or young person’s
community (in accordance with their culture) who is reimbursed (or who has been
offered but declined reimbursement) by the state/territory for the care of the child.
The information in this chapter describes foster and relative/kinship carer households at
30 June 2014 and commencements and exits during 2013–14. State and territory differences in
policies and practices in relation to foster care and relative/kinship care should be taken into
account when interpreting the data. Some notable differences include:
•
There are varying degrees of reimbursement made to foster carers. For example, some
carers are paid a wage beyond the reimbursement of expenses.
•
Where a carer is authorised to provide both foster and relative/kinship care, they may
be included in the count of both foster and relative/kinship carers.
•
In some jurisdictions, respite carers known to the department are registered as either
‘general foster carers’ or ‘relative carers’ and therefore may be included in the scope of
these collections.
6.2 Foster carer households
At 30 June 2014, there were 9,932 households with one or more foster care placements (Table
6.2). Nationally, during 2013–14 there were 12,860 households that had one or more foster
care placements at some point during the year (Table 6.2).
Table 6.2: Foster carer households with a placement, states and territories, at 30 June 2014 and
during 2013–14
NSW(a)
Vic
Qld(b)
WA
SA
Tas
ACT
NT(c)
Total
Households with a placement at 30 June
2014
4,036
1,549
2,368
725
655
196
119
284
9,932
Household with a placement during
2013–14
4,934
2,281
2,905
963
918
270
195
394
12,860
Households
(a)
In New South Wales, the total number of foster carer households are those that had a placement in the past 2 years. ‘Households with a
placement at 30 June’ includes those households that only had a short-term respite placement during the year. Counts of foster carer
households are slightly understated as complete information is not available for some non-government agencies.
(b)
Queensland data exclude provisionally approved carer households.
(c)
Aggregate data were provided for the Northern Territory.
Source: AIHW Child Protection Collection 2014.
Number of children in placements
Across jurisdictions, 51% of foster carer households with a placement had 1 child placed
with them at 30 June 2014 and 49% had multiple children placed. These findings are similar
to 2012–13 (AIHW 2014b).
Child protection Australia 2013–14
57
The proportion of carer households with 1 child placed with them ranged from 43% in
Western Australia and Queensland to 72% in Victoria. Most households with multiple
placements had between 2 and 4 foster children placed, while nearly 4% had 5 or more
children (Figure 6.1). Households with multiple children placed with them may partially
reflect the fact that in many jurisdictions priority is given to keeping siblings together.
Per cent
100
1 child
2 children
3–4 children
5+ children
90
80
70
60
50
40
30
20
10
0
NSW
Vic
Qld
WA
SA
Tas
ACT
NT
Total
States and territories
Source: Table A35.
Figure 6.1: Foster carer households with a placement at 30 June 2014, by number of foster children
placed
Household commencements and exits
Among jurisdictions with available data, 2,208 households commenced foster care and 1,755
exited foster care in 2013–14 (Table 6.3). In the previous year, most jurisdictions had a greater
number of households commencing than exiting foster care (AIHW 2014b). However, in
2013–14, this was only evident for Western Australia and the Northern Territory. With the
need for foster carers increasing, the attraction and retention of appropriately skilled foster
carers is a high priority across Australia (COAG 2009).
58
Child protection Australia 2013–14
Table 6.3: Number of households commencing and exiting foster care, 2013–14
NSW(a)
Vic
Qld(b)
WA
SA
Tas(c)
ACT
NT(d)
Total
Households commencing foster care
689
400
475
239
145
58
30
172
2,208
Households exiting foster care
n.a.
610
484
187
241
71
32
130
1,755
Households
(a)
New South Wales data include Community Services and non-government agency foster carer households. This count excludes some nongovernment agency carer households because there is no information collected on their commencement date. For households exiting foster
care, New South Wales was unable to provide data for 2013–14.
(b)
Queensland data do not include provisionally approved carer households that have started providing foster care but are yet to receive
approval as a foster carer.
(c)
In Tasmania, delays in administrative processes can result in carers being maintained as approved in the system when they are no longer
accepting child placements. For the purpose of reporting households exiting foster care, if no termination date is recorded, a foster carer
household that has not had a placement in 12 months is considered to have exited.
(d)
Aggregate data were provided for the Northern Territory.
Source: AIHW Child Protection Collection 2014.
6.3 Relative/kinship carer households
At 30 June 2014, there were 12,583 households with 1 or more relative/kinship care
placements (Table 6.4). There were 15,099 households that had a relative/kinship placement
during 2013–14 (for jurisdictions where data were available).
Table 6.4: Relative/kinship carer households with a placement, state and territories, at 30 June 2014
and during 2013–14
NSW(a)
Vic
Qld(b)
WA
SA
Tas(c)
ACT
NT(d)
Total
Households with a placement at 30 June
2014
6,299
2,672
1,284
1,031
760
202
201
134
12,583
Household with a placement during
2013–14
7,585
4,249
n.a.
1,390
1,149
300
239
187
15,099
Households
(a)
In New South Wales, the total number of relative/kinship carer households are those who had a placement in the past 2 years. ‘Households
with a placement at 30 June’ includes those households that only had a short-term respite placement during the year.
(b)
Queensland data exclude provisionally approved carer households.
(c)
In Tasmania, delays in administrative processes can result in carers being maintained as approved in the system when they are no longer
accepting child placements. As such, the number of relative/kinship carer households reported in this table is considered to be higher than
the actual number. For the purpose of reporting active relative/kinship care households, if no termination date is recorded, a relative/kinship
care household that has not had a placement in 12 months is considered to be no longer active.
(d)
Aggregate data were provided for the Northern Territory.
Source: AIHW Child Protection Collection 2014.
Number of children in placements
For jurisdictions with available data, 61% of relative/kinship carer households with a
placement had 1 child placed with them at 30 June 2014, compared to 51% of foster carer
households. These findings are similar to 2012–13 (AIHW 2014b).
The proportion of relative/kinship carer households with 1 child ranged from 57% in
Queensland to 71% in Victoria. Across Australia, 37% of households with a placement had
between 2 and 4 children placed and 2% had 5 or more (Figure 6.2).
Child protection Australia 2013–14
59
Per cent
1 child
2 children
5+ children
3–4 children
100
90
80
70
60
50
40
30
20
10
0
NSW
Vic
Qld
WA
SA
Tas
ACT
NT
Total
States and territories
Source: Table A36.
Figure 6.2: Relative/kinship carer households with a placement at 30 June 2014, by number of
children placed
Household commencements and exits
Among those jurisdictions with available data, 4,413 households commenced
relative/kinship care and 2,820 exited relative/kinship care in 2013–14. In all jurisdictions
except Queensland and Tasmania, a greater number of households commenced than exited
relative/kinship care (Table 6.5).
Table 6.5: Number of households commencing and exiting relative/kinship care, 2013–14
Households
Households commencing relative/kinship
care
Households exiting relative/kinship care
NSW(a)
Vic
Qld(b)
WA
SA
Tas(c)
ACT
NT(d)
Total
1,224
1,789
266
553
288
135
55
103
4,413
n.a
1,525
565
445
62
142
9
72
2,820
(a)
New South Wales data include Community Services and non-government agency relative/kinship carer households. New South Wales was
unable to provide data for 2013–14 for ‘Households exiting relative/kinship care’.
(b)
Queensland data do not include provisionally approved carer households that have started providing relative/kinship care but are yet to
receive approval as a relative/kinship carer.
(c)
In Tasmania, delays in administrative processes can result in carers being maintained as approved in the system when they are no longer
accepting child placements. For the purpose of reporting households exiting relative/kinship care, if no termination date is recorded, a
relative/kinship carer household that has not had a placement in 12 months is considered to have exited.
(d)
Aggregate data were provided for the Northern Territory.
Source: AIHW Child Protection Collection 2014.
60
Child protection Australia 2013–14
7
Intensive family support services
This chapter provides information on children commencing intensive family support
services in 2013–14 that the state and territory departments responsible for child protection
funds. Currently, the national data collection is limited to intensive family support services
and does not include other types of family support services that do not meet the criteria for
intensive family support services (see Box 7.1). Intensive family support services aim to
prevent imminent separation of children from their primary caregivers due to child
protection concerns, and to reunify families where separation has already occurred.
7.1 Overview and key statistics
Key statistics
In 2013–14, there were 296 intensive family support service providers nationally (Table 7.1).
The services were delivered across 320 locations, most of which (80%) were in capital cities
or other urban centres (AIHW IFSS Aggregate Collection 2013–14). Nationally, 21,908
children commenced intensive family support services during 2013–14 (Table 7.1).
Table 7.1: Key intensive family support services statistics, 2013–14
Number
Number of intensive family support services
Number of children commencing intensive family support services
296
21,908
Source: AIHW Child Protection Collection 2014.
Box 7.1: Intensive family support services
To be included in the intensive family support services data collection, services must meet
all the following criteria:
•
They are provided explicitly to work to prevent separation or to reunify families.
•
A range of services are provided as part of an integrated strategy focusing on
improving family functioning and skills, rather than just one type of service, such as
emergency or respite care.
•
They are intensive in nature, averaging at least 4 hours of service provision per week
for a specified short-term period (usually less than 180 days).
•
Generally referrals will come from the statutory agency and will have been identified
through the child protection process. Most cases will have been the subject of a child
protection substantiation.
Child protection Australia 2013–14
61
7.2 Children commencing services
Age profile
Almost half (47%) of children commencing intensive family support services were aged
under 5 (among those jurisdictions with available data). However, the age distribution
varied across jurisdictions—the proportion of children aged 0–4 commencing intensive
family support services ranged from 30% in the Australian Capital Territory to 55% in New
South Wales (Table 7.2).
Table 7.2: Number of children aged 0–17 commencing intensive family support services, by age at
commencement of service, states and territories, 2013–14
Age group
(years)
NSW(a)
Vic
Qld
SA(b)
WA
Tas(c)
ACT
NT(b)
Total(d)
Number
0–4
4,831
2,286
1,722
416
n.a.
521
80
n.a.
9,856
5–9
2,437
1,411
1,259
284
n.a.
515
73
n.a.
5,979
10–17
1,492
1,595
1,072
234
n.a.
625
114
n.a.
5,132
11
26
10
0
703
0
36
150
936
8,771
5,318
4,063
934
703
1,661
303
150
21,903
Unknown
Total
%
0–4
55.1
43.2
42.5
44.5
..
31.4
30.0
..
47.0
5–9
27.8
26.7
31.1
30.4
..
31.0
27.3
..
28.5
10–17
17.0
30.1
26.4
25.1
..
37.6
42.7
..
24.5
Total
100.0
100.0
100.0
100.0
..
100.0
100.0
..
100.0
(a)
Limited information was available for some services in New South Wales in 2013–14.
(b)
South Australia and the Northern Territory were not able to provide an age breakdown.
(c)
Caution is required when interpreting this data for Tasmania as services are provided under the title of ‘Integrated Family Support Services’
rather than ‘Intensive Family Support Services’. For this report, aggregate data submitted by providers of Integrated Family Support
Services has not been validated for the purpose of ensuring consistency of compliance with national definitions.
(d)
The total reported in this table differs from that reported in Table 7.1, as Table 7.1 includes 5 children aged 18 and over from Western
Australia, which are excluded from this table.
Notes
1.
Percentages exclude children of unknown age.
2.
Percentages in the table may not add to 100 due to rounding.
Source: AIHW Child Protection Collection 2014.
The vast majority (88%) of children who commenced an intensive family support service
were living with their parents. For those jurisdictions with available data, this ranged from
69% of children in Queensland to 97% of children in New South Wales (Figure 7.1).
In Queensland, a substantially higher proportion of children in out-of-home care used
intensive family support services—26% compared with 8% overall.
62
Child protection Australia 2013–14
Per cent
100
Child living with parent(s)
Child living with other relatives/kin
90
Child in out-of-home care
80
Child in shared care
Other
70
60
50
40
30
20
10
0
NSW
Vic
Qld
WA
SA
Tas
ACT
NT
States and territories
Note: South Australia and Tasmania were not able to provide these data for 2013–14.
Source: Table A37.
Figure 7.1: Children commencing intensive family support services, by living arrangements at
commencement of service, states and territories, 2013–14
Child protection Australia 2013–14
63
Appendix A: Detailed tables
Children receiving child protection services
Table A1: Number of children receiving child protection services, by components of service, states
and territories, 2013–14
Service component
NSW
Vic
Qld
WA
SA
Tas
ACT
NT
Total
Number
Investigation only
31,803
15,183
18,044
9,991
3,729
1,116
746
3,342
83,954
On an order and in
out-of-home care
12,981
7,077
8,227
3,243
2,496
1,119
507
711
36,361
5,450
2,097
1,357
1,058
487
129
192
406
11,176
614
2,185
1,016
776
162
176
90
51
5,070
1,548
481
113
74
91
11
64
0
2,382
Investigation and
out-of-home care
541
386
542
109
15
14
13
0
1,620
Investigation and care
and protection order
313
1,540
286
134
103
44
23
17
2,460
Investigation, order
and out-of-home care
Care and protection
order only
Out-of-home care only
%
Investigation only
59.7
52.4
61.0
64.9
52.6
42.8
45.6
73.8
58.7
On an order and in
out-of-home care
24.4
24.4
27.8
21.1
35.2
42.9
31.0
15.7
25.4
Investigation, order
and out-of-home care
10.2
7.2
4.6
6.9
6.9
4.9
11.8
9.0
7.8
Care and protection
order only
1.2
7.5
3.4
5.0
2.3
6.7
5.5
1.1
3.5
Out-of-home care only
2.9
1.7
0.4
0.5
1.3
0.4
3.9
0.0
1.7
Investigation and
out-of-home care
1.0
1.3
1.8
0.7
0.2
0.5
0.8
0.0
1.1
Investigation and care
and protection order
0.6
5.3
1.0
0.9
1.5
1.7
1.4
0.4
1.7
53,250
28,949
29,585
15,385
7,083
2,609
1,635
4,527
143,023
Number of children
receiving child
protection services
Source: AIHW Child Protection Collection 2014.
64
Child protection Australia 2013–14
Table A2: New and repeat clients receiving child protection services, by service type, 2013–14
Client type
Children receiving
child protection
services
Children who were
the subject of an
investigation of a
notification
Children on care and
protection orders
Children in
out-of-home care
Number
New client
30,128
30,015
2,386
2,025
Repeat client
81,675
47,992
40,983
38,499
1,634
973
812
776
113,437
78,980
44,181
41,300
Unknown
Total
%
New client
26.9
38.5
5.5
5.0
Repeat client
73.1
61.5
94.5
95.0
100.0
100.0
100.0
100.0
Total
Notes
1.
Due to data availability and quality issues, data reported excludes Queensland and the Australian Capital Territory.
2.
‘Children receiving child protection services’ is defined as one or more of the following occurring within the reporting period: an investigation
of a notification; being on a care and protection order; or being in out-of-home care. It is not a total count of the above 3 areas; it is a count
of unique children across the 3 areas.
3.
New clients are children or young people who have not ever previously been the subject of an investigation: any type of care and protection
order (as per the scope of this collection); or funded out-of-home care placement (including only those respite placements of 7 days or
more) within the jurisdiction.
4.
Repeat clients are children or young people who have previously been the subject of an investigation or were discharged (according to
national specifications) from any type of care and protection order or funded out-of-home care placement (including only those respite
placements of 7 days or more), or whose earliest order and/or placement in the current reporting period is part of a preceding continuous
episode of care.
5.
Percentages exclude children for whom new/repeat client status was unknown.
Source: AIHW Child Protection Collection 2014.
Child protection Australia 2013–14
65
Table A3: Number of children receiving child protection services by age group and Indigenous
status, states and territories, 2013–14
Age group
(years)
NSW
Vic
Qld
WA
SA
Tas
ACT
NT
Total
Indigenous children
Unborn
612
0
345
114
2
7
2
..
1,082
<1 year
927
383
685
305
209
18
41
341
2,909
1–4
3,545
903
2,480
1,138
499
92
84
1,100
9,841
5–9
4,500
995
2,797
1,638
608
143
115
1,046
11,842
10–14
3,973
845
2,338
1,381
512
146
82
965
10,242
15–17
1,665
347
800
439
198
50
35
245
3,779
0
0
17
0
1
0
0
3
21
15,222
3,473
9,462
5,015
2,029
456
359
3,700
39,716
Unknown
Total
Non–Indigenous children
Unborn
1,089
0
401
100
0
12
4
..
1,606
<1 year
1,867
2,320
1,170
269
493
65
96
54
6,334
1–4
7,688
5,910
4,220
1,156
1,117
396
259
186
20,932
5–9
10,618
7,211
5,594
1,845
1,458
536
327
240
27,829
10–14
10,097
6,871
5,125
1,687
1,215
492
293
230
26,010
15–17
4,792
3,099
2,138
677
516
229
145
113
11,709
Unknown
Total
0
0
19
0
0
0
0
0
19
36,151
25,411
18,667
5,734
4,799
1,730
1,124
823
94,439
Unknown Indigenous status
Unborn
519
0
214
153
0
59
0
..
945
<1 year
124
10
204
444
79
88
17
0
966
1–4
330
14
369
1,404
90
112
37
0
2,356
5–9
354
22
310
1,329
46
79
41
1
2,182
10–14
348
15
231
949
29
69
36
1
1,678
15–17
202
4
91
356
7
16
21
1
698
0
0
37
1
4
0
0
1
43
1,877
65
1,456
4,636
255
423
152
4
8,868
Unknown
Total
(continued)
66
Child protection Australia 2013–14
Table A3 (continued): Number of children receiving child protection services by age group and
Indigenous status, states and territories, 2013–14
Age group
(years)
NSW
Vic
Qld
WA
SA
Tas
ACT
NT
Total
All children
Unborn
2,220
0
960
367
2
78
6
..
3,633
<1 year
2,918
2,713
2,059
1,018
781
171
154
395
10,209
1–4
11,563
6,827
7,069
3,698
1,706
600
380
1,286
33,129
5–9
15,472
8,228
8,701
4,812
2,112
758
483
1,287
41,853
10–14
14,418
7,731
7,694
4,017
1,756
707
411
1,196
37,930
15–17
6,659
3,450
3,029
1,472
721
295
201
359
16,186
0
0
73
1
5
0
0
4
83
53,250
28,949
29,585
15,385
7,083
2,609
1,635
4,527
143,023
Unknown
Total
Notes
1.
‘Children receiving child protection services’ is defined as one or more of the following occurring within the reporting period: an investigation
of a notification, being on a care and protection order, or being in out-of-home care. It is not a total count of these 3 areas; it is a count of
unique children across the 3 areas.
2.
‘All children’ includes children of unknown Indigenous status.
3.
Age is calculated as at the start of the financial year (that is, 1 July 2013) if the first contact began before the start of the financial year (that
is, children continuing on an order or in out-of-home care into the financial year); otherwise, age is calculated as at the date of first contact
during the period (that is, date of notification, order start or placement start for children whose contact occurred during the period).
Source: AIHW Child Protection Collection 2014.
Child protection Australia 2013–14
67
Notifications, investigations and substantiations
Table A4: Notifications, by type of action, states and territories, 2013–14(a)
Type of action
NSW(b)
Vic(c)
Qld(d)
WA(e)
SA
Tas
ACT
NT
Total
Number
Investigations finalised(f)
64,383
20,001
20,516
10,862
5,857
1,278
1,172
3,545
127,614
Investigation closed—no
outcome possible
1,078
0
910
848
303
117
116
618
3,990
65,461
20,001
21,426
11,710
6,160
1,395
1,288
4,163
131,604
376
1,242
1,830
1,277
380
74
56
746
5,981
65,837
21,243
23,256
12,987
6,540
1,469
1,344
4,909
137,585
242
25
0
112
89
39
0
0
507
Notifications resolved
without investigation
59,915
60,788
0
3,702
12,949
11,354
9,256
8,041
166,005
Total dealt with by other
means(h)
60,157
60,813
0
3,814
13,038
11,393
9,256
8,041
166,512
125,994
82,056
23,256
16,801
19,578
12,862
10,600
12,950
304,097
Investigations finalised(f)
51.1
24.4
88.2
64.7
29.9
9.9
11.1
27.4
42.0
Investigation closed—no
outcome possible
0.9
0.0
3.9
5.0
1.5
0.9
1.1
4.8
1.3
52.0
24.4
92.1
69.7
31.5
10.8
12.2
32.1
43.3
0.3
1.5
7.9
7.6
1.9
0.6
0.5
5.8
2.0
52.3
25.9
100.0
77.3
33.4
11.4
12.7
37.9
45.2
0.2
0.0
0.0
0.7
0.5
0.3
0.0
0.0
0.2
Notifications resolved
without investigation
47.6
74.1
0.0
22.0
66.1
88.3
87.3
62.1
54.6
Total dealt with by other
means(h)
47.7
74.1
0.0
22.7
66.6
88.6
87.3
62.1
54.8
100.0
100.0
100.0
100.0
100.0
100.0
100.0
100.0
100.0
Total closed
investigations
Investigations in
process(g)
Total investigations
Notifications in process
Total notifications
%
Total closed
investigations
Investigations in
process(g)
Total investigations
Notifications in process
Total
(a)
The number of notifications and the percentage of those notifications investigated are not comparable across jurisdictions. This is because
legislation and the policies that provide the framework for assessing child protection notifications vary broadly across jurisdictions.
(b)
New South Wales figures are not comparable with those of other jurisdictions. New South Wales has a differential investigation response
whereby an investigation can be undertaken over two stages (stage 1—information gathering; stage 2—assessment). Only the more
serious cases, which receive the higher-level response, may lead to a recorded substantiation outcome.
(c)
In Victoria, there is not category identified as ‘dealt with by other means’. All notifications are either ‘investigations’, ‘investigations in
process’ or ‘resolved without investigation’. For the purposes of national reporting ‘dealt with by other means’ is the total of ‘notifications in
process’ and ‘notifications resolved without investigations’.
(d)
In Queensland, ‘investigation closed—no outcome possible’ is considered to be a finalised investigation. This category includes notifications
where there was insufficient information to enable an assessment outcome of ‘substantiated’ or ‘unsubstantiated’ to be determined. This
may occur in situations where the family was unable to be identified or located or has moved overseas and the investigation is considered
finalised and closed.
(e)
In Western Australia, notifications where the primary concern at notification was emotional/psychological, physical, sexual abuse or neglect
are counted as notifications in this table.
(f)
‘Investigations finalised’ are investigations that were completed and an outcome of ‘substantiated’ or ‘not substantiated’ recorded by 31
August 2014.
(g)
‘Investigations in process’ are investigations that were begun, but not completed, by 31 August 2014.
68
Child protection Australia 2013–14
(h)
‘Total dealt with by other means’ includes notifications that were responded to by means other than an investigation, such as referral to
police, referral to family services or provision of advice. ‘Dealt with by other means’ also includes some cases that were previously reported
as ‘no investigation possible/no action’.
Note: Percentages in the table may not add to 100 due to rounding.
Source: AIHW Child Protection Collection 2014.
Child protection Australia 2013–14
69
Table A5: Number of investigations, by source of notification, states and territories, 2013–14
Source of notification
NSW(a)
Vic
Qld
WA
SA(b)
Tas(c)
ACT
NT
Total
Police
11,863
6,247
7,048
3,349
n.a.
378
249
1,764
30,898
School personnel
12,102
3,778
3,812
1,894
n.a.
278
167
740
22,771
Hospital/health centre
3,739
72
..
500
n.a.
0
205
771
5,287
Parent/guardian
3,316
1,103
1,332
814
n.a.
33
40
82
6,720
Non-government
organisation
3,603
2,243
1,228
n.a.
n.a.
5
187
291
7,557
Sibling/other relative
3,909
1,195
1,681
857
n.a.
59
95
211
8,007
Other
2,232
584
1,080
1,293
n.a.
31
92
197
5,509
Anonymous
4,298
0
565
0
n.a.
34
0
48
4,945
Friend/neighbour
3,181
662
1,326
320
n.a.
48
49
139
5,725
11,033
745
..
1,438
n.a.
455
19
19
13,709
Medical practitioner
1,288
954
3,791
552
n.a.
41
11
88
6,725
Departmental officer
2,263
0
928
893
n.a.
5
177
398
4,664
Other health personnel
1,835
1,116
..
188
n.a.
91
19
143
3,392
Child care personnel
1,007
196
271
53
n.a.
10
6
17
1,560
168
0
153
64
n.a.
1
11
1
398
0
2,348
41
772
n.a.
0
17
0
3,178
65,837
21,243
23,256
12,987
6,540
1,469
1,344
4,909
137,585
(d)
Social worker
Subject child
Not stated
Total
(a)
New South Wales figures are not comparable with those of other jurisdictions. New South Wales has a differential investigation response
whereby an investigation can be undertaken over two stages (stage 1—information gathering; stage 2—assessment).
(b)
Data for source of notification were not available for South Australia for 2013–14. As such, South Australia are excluded from the row totals,
but are included in the total number of investigations.
(c)
Data reported for Tasmania aligns with the AIHW technical specifications except in the case of notifications received from departmental
officers, which could also be classified in another category (for example, social worker). Notifications from departmental officers were
assigned to the category of ‘departmental officer’ regardless of whether the source of notification could be classified in other categories.
(d)
‘Other’ category may include the person responsible.
Notes
1.
Investigations include ‘investigations finalised’, ‘investigations in process’ and ‘investigations closed—no outcome possible’.
Source: AIHW Child Protection Collection 2014.
70
Child protection Australia 2013–14
Table A6: Children who were the subjects of investigations by outcome, states and territories,
2013–14 (number)
NSW(a)
Vic
Qld
WA
SA
Tas
ACT
NT
Total
Substantiated
15,074
11,395
6,685
3,053
2,190
712
341
1,394
40,844
Not substantiated
22,320
6,801
11,322
6,631
1,760
451
529
1,526
51,340
Total finalised
investigations
37,394
18,196
18,007
9,684
3,950
1,163
870
2,920
92,184
Investigations in process
152
1,010
1,524
1,018
194
57
38
627
4,620
Investigation closed—no
outcome possible
561
0
698
590
190
83
66
218
2,406
38,107
19,206
20,229
11,292
4,334
1,303
974
3,765
99,210
Children in
investigations
(a)
New South Wales figures are not comparable with those of other jurisdictions. New South Wales has a differential investigation response
whereby an investigation can be undertaken over two stages (stage 1—information gathering; stage 2—assessment). Only the more
serious cases, which receive the higher-level response, may lead to a recorded substantiation outcome.
Note: Finalised investigations, and thus substantiations, refer only to cases that were notified during the year, not to the total number of
investigations finalised by 31 August 2014.
Source: AIHW Child Protection Collection 2014.
Child protection Australia 2013–14
71
Table A7: Children who were the subjects of substantiations of notifications received during
2013–14, by type of abuse or neglect and sex, states and territories
Type of abuse or
neglect
NSW
Vic
Qld
WA
SA(a)
Tas(a)
ACT(a)
NT(b)
Total
Number
Boys
Physical
1,396
1,553
556
235
192
57
18
128
4,135
876
654
89
146
83
15
3
8
1,874
Emotional
2,284
3,249
1,192
479
310
165
54
226
7,959
Neglect
2,385
317
1,468
499
549
102
76
331
5,727
0
0
0
0
1
8
28
0
37
6,941
5,773
3,305
1,359
1,135
347
179
693
19,732
Sexual
Not stated
Total
Girls
Physical
1,269
1,369
464
232
175
54
15
131
3,709
Sexual
1,994
787
251
445
125
41
11
25
3,679
Emotional
2,388
3,193
1,222
491
289
145
43
211
7,982
Neglect
2,265
254
1,365
446
459
105
66
334
5,294
0
0
0
0
0
6
27
0
33
7,916
5,603
3,302
1,614
1,048
351
162
701
20,697
Not stated
Total
Not stated
Physical
21
5
20
13
0
3
0
0
62
Sexual
11
2
2
12
0
1
0
0
28
Emotional
95
11
6
33
2
5
0
0
152
Neglect
90
1
50
22
5
5
0
0
173
0
0
0
0
0
0
0
0
0
217
19
78
80
7
14
0
0
415
Not stated
Total
All children
Physical
2,686
2,927
1,040
480
367
114
33
259
7,906
Sexual
2,881
1,443
342
603
208
57
14
33
5,581
Emotional
4,767
6,453
2,420
1,003
601
315
97
437
16,093
Neglect
4,740
572
2,883
967
1,013
212
142
665
11,194
0
0
0
0
1
14
55
0
70
15,074
11,395
6,685
3,053
2,190
712
341
1,394
40,844
Not stated
Total
(continued)
72
Child protection Australia 2013–14
Table A7 (continued): Children who were the subjects of substantiations of notifications received
during 2013–14, by type of abuse or neglect and sex, states and territories
Type of abuse or
neglect
NSW
Vic
Qld
WA
SA(a)
Tas(a)
ACT(a)
NT(b)
Total
%
Boys
Physical
20.1
26.9
16.8
17.3
16.9
16.8
11.9
18.5
21.0
Sexual
12.6
11.3
2.7
10.7
7.3
4.4
2.0
1.2
9.5
Emotional
32.9
56.3
36.1
35.2
27.3
48.7
35.8
32.6
40.4
Neglect
34.4
5.5
44.4
36.7
48.4
30.1
50.3
47.8
29.1
100.0
100.0
100.0
100.0
100.0
100.0
100.0
100.0
100.0
Total
Girls
Physical
16.0
24.4
14.1
14.4
16.7
15.7
11.1
18.7
17.9
Sexual
25.2
14.0
7.6
27.6
11.9
11.9
8.1
3.6
17.8
Emotional
30.2
57.0
37.0
30.4
27.6
42.0
31.9
30.1
38.6
Neglect
28.6
4.5
41.3
27.6
43.8
30.4
48.9
47.6
25.6
100.0
100.0
100.0
100.0
100.0
100.0
100.0
100.0
100.0
Total
All children
Physical
17.8
25.7
15.6
15.7
16.8
16.3
11.5
18.6
19.4
Sexual
19.1
12.7
5.1
19.8
9.5
8.2
4.9
2.4
13.7
Emotional
31.6
56.6
36.2
32.9
27.5
45.1
33.9
31.3
39.5
Neglect
31.4
5.0
43.1
31.7
46.3
30.4
49.7
47.7
27.5
100.0
100.0
100.0
100.0
100.0
100.0
100.0
100.0
100.0
Total
(a)
In South Australia, Tasmania and the Australian Capital Territory, the abuse type for some substantiations was recorded as ‘not stated’ and
could not be mapped to physical, sexual, emotional or neglect. These substantiations are included in the totals: as such, totals may not
equal the sum of categories.
(b)
In the Northern Territory, due to recording issues, sexual exploitation is under-reported. This has been addressed and it is expected
numbers in this area will be similar to other jurisdictions in future years.
Notes
1.
Finalised investigations, and thus substantiations, refer only to cases that were notified during the year, not to the total number of
investigations finalised by 31 August 2014.
2.
If a child was the subject of more than one type of abuse or neglect as part of the same notification, the type of abuse or neglect reported is
the one considered by the child protection workers to cause the most harm to the child. Where a child is the subject of more than one
substantiation during the year, the type of abuse or neglect reported is the one associated with the first substantiation decision relating to
the earliest notification during the year. As such, only the abuse type for the first substantiation in the year that is most likely to place the
child at risk, or be most severe in the short term, is reported.
Source: AIHW Child Protection Collection 2014.
Child protection Australia 2013–14
73
Table A8: Children who were the subjects of substantiations of notifications received during
2013–14, by age group and Indigenous status, states and territories
Age group
(years)
NSW
Vic
Qld
WA(a)
SA
Tas(a)
ACT
NT
Total
Indigenous children
Unborn
260
0
191
52
1
2
0
..
506
<1
520
209
207
94
118
7
14
158
1,327
1–4
1,248
358
600
228
188
22
24
408
3,076
5–9
1,322
338
618
313
195
30
16
347
3,179
10–14
1,027
282
469
310
144
20
12
263
2,527
15–17
299
62
111
73
44
5
0
55
649
1
0
4
0
1
0
0
0
6
4,677
1,249
2,200
1,070
691
86
66
1,231
11,270
Not stated
Total
Non-Indigenous children
Unborn
423
0
188
33
0
7
3
..
654
<1
946
1,320
328
85
223
26
42
10
2,980
1–4
2,499
2,534
970
265
356
106
70
34
6,834
5–9
2,977
2,848
1,293
365
407
141
78
46
8,155
10–14
2,574
2,591
1,144
340
337
113
61
52
7,212
15–17
902
852
309
94
75
37
21
20
2,310
Not stated
Total
2
0
2
0
0
0
0
0
4
10,323
10,145
4,234
1,182
1,398
430
275
162
28,149
Unknown Indigenous status
Unborn
56
0
48
11
0
26
0
..
141
<1
6
0
29
75
32
39
0
0
181
1–4
3
0
63
204
32
56
0
0
358
5–9
1
0
45
223
20
42
0
0
331
10–14
4
1
47
207
13
27
0
1
300
15–17
1
0
16
81
2
6
0
0
106
Not stated
3
0
3
0
2
0
0
0
8
74
1
251
801
101
196
0
1
1,425
Total
(continued)
74
Child protection Australia 2013–14
Table A8 (continued): Children who were the subjects of substantiations of notifications received
during 2013–14, by age group and Indigenous status, states and territories
Age group
(years)
NSW
Vic
Qld
WA(a)
SA
Tas(a)
ACT
NT
Total
All children
Unborn
739
0
427
96
1
35
3
..
1,301
<1
1,472
1,529
564
254
373
72
56
168
4,488
1–4
3,750
2,892
1,633
697
576
184
94
442
10,268
5–9
4,300
3,186
1,956
901
622
213
94
393
11,665
10–14
3,605
2,874
1,660
857
494
160
73
316
10,039
15–17
1,202
914
436
248
121
48
21
75
3,065
6
0
9
0
3
0
0
0
18
15,074
11,395
6,685
3,053
2,190
712
341
1,394
40,844
Not stated
Total
(a)
In Western Australia and Tasmania, the proportion of substantiations for children with an unknown Indigenous status affects the reliability of
these data.
Notes
1.
Finalised investigations, and thus substantiations, refer only to cases that were notified during the year, not to the total number of
investigations finalised by 31 August 2014.
Source: AIHW Child Protection Collection 2014.
Child protection Australia 2013–14
75
Table A9: Number of children who were the subjects of substantiations by socioeconomic status
and Indigenous status, 2013–14
Socioeconomic status
Indigenous
Non-Indigenous
Not stated
Total
Number
1 Lowest SES
1,816
4,491
175
6,482
2
517
3,275
35
3,827
3
480
2,119
16
2,615
4
228
1,570
25
1,823
5 Highest SES
132
735
6
873
3,173
12,190
257
15,620
Total
%
1 Lowest SES
57.2
36.8
68.1
41.5
2
16.3
26.9
13.6
24.5
3
15.1
17.4
6.2
16.7
4
7.2
12.9
9.7
11.7
5 Highest SES
4.2
6.0
2.3
5.6
100.0
100.0
100.0
100.0
Total
Notes
1.
The Index of Relative Socio-Economic Advantage and disadvantage (IRSAD), used here as a measure of SES, broadly assesses ‘people’s
access to material and social resources, and their ability to participate in society’ (ABS 2013b). For more information see Appendix B or
ABS 2013b.
2.
Socioeconomic data exclude New South Wales, Queensland and Western Australia because location data were not available.
3.
Of jurisdictions that provided data, 412 records were excluded either due to missing location data, or because they were unable to be
mapped to geographical areas to calculate the index.
Source: AIHW Child Protection Collection 2014.
76
Child protection Australia 2013–14
Table A10: Children who were the subjects of substantiations during 2013–14, by type of family in
which the child was residing, states and territories
Family type
NSW(a)
Vic(b)
Qld(c)
WA(d)
SA(b)
Tas(e)
ACT
NT
Total
Number
Two parent—intact
n.a.
237
2,599
1,209
425
149
114
691
5,424
Two parent—step or
blended
n.a.
67
1,471
280
239
126
35
64
2,282
Single parent—female
n.a.
226
2,621
n.a.
704
295
157
281
4,284
Single parent—male
n.a.
33
329
n.a.
60
28
3
52
505
Other relatives/kin
n.a.
47
89
68
0
54
10
68
336
Foster
n.a.
8
..
12
0
15
16
11
62
Other
n.a.
20
291
1,461
13
44
5
40
1,874
Not stated
n.a.
10,757
6
23
749
1
1
187
11,724
15,074
11,395
7,406
3,053
2,190
712
341
1,394
41,565
Total
%
Two parent—intact
..
n.p.
35.1
39.9
n.p.
21.0
33.5
57.2
37.5
Two parent—step or
blended
..
n.p.
19.9
9.2
n.p.
17.7
10.3
5.3
15.6
Single parent—female
..
n.p.
35.4
..
n.p.
41.5
46.2
23.3
26.4
Single parent—male
..
n.p.
4.4
..
n.p.
3.9
0.9
4.3
3.2
Other relatives/kin
..
n.p.
1.2
2.2
n.p.
7.6
2.9
5.6
2.3
Foster
..
n.p.
..
0.4
n.p.
2.1
4.7
0.9
0.4
Other
..
n.p.
3.9
48.2
n.p.
6.2
1.5
3.3
14.5
Total
..
n.p.
100.0
100.0
n.p.
100.0
100.0
100.0
100.0
(a)
New South Wales was not able to provide data for this measure.
(b)
Family type percentages for Victoria and South Australia are not published due to a high proportion of ‘not stated’.
(c)
Data for Queensland represent substantiations rather than children in substantiations. Queensland does not have a category of ‘foster care’.
Relevant substantiations would be recorded in ‘other’.
(d)
Western Australia does not have the categories ‘single parent male’ or ‘single parent female’. ‘Single person with children’ is used and these
have been grouped under ‘other’.
(e)
Due to the introduction of a new Child Protection Information System in Tasmania in 2010, the family type at the time of notification has not
been entered correctly for a significant number of substantiations. For many of these cases, if the child was placed in care either during the
investigation or at finalisation, then a family type of ‘foster’ was recorded even though the abuse or neglect did not occur in foster care. For
this reason the substantiations with a family type of ‘foster’ reported above is considerably over-inflated for Tasmania and the relevant figure
in this table is an incorrect representation of the true number of substantiated notifications where the abuse or neglect occurred in foster
care.
Notes
1.
The type of family in which the child was living is recorded at different points for each jurisdiction. In Queensland, the Northern Territory and
the Australian Capital Territory, it is categorised as where the child was living at the time of the investigation. In Tasmania, it is categorised
as where the child was living when the abuse, neglect or harm occurred. In Western Australia, it is at the time of the notification. For Victoria
and South Australia, it is at the time of the substantiation.
2.
Percentages exclude cases where the family type was not stated.
3.
Percentages in the table may not add to 100 due to rounding.
Source: AIHW Child Protection Collection 2014.
Child protection Australia 2013–14
77
Table A11: Children aged 0–17 who were the subjects of substantiations of notifications received
during 2013–14, by type of abuse or neglect and Indigenous status, states and territories
Type of abuse or
neglect
NSW
Vic
Qld
WA
SA(a)
Tas(a)
ACT(a)
NT(b)
Total
Number
Indigenous children
Physical
813
290
342
147
74
9
4
224
1,903
Sexual
645
93
73
129
30
9
0
19
998
Emotional
1,407
773
629
353
199
37
21
371
3,790
Neglect
1,812
93
1,156
441
387
29
32
617
4,567
0
0
0
0
1
2
9
0
12
4,677
1,249
2,200
1,070
691
86
66
1,231
11,270
Not stated
Total
Non-Indigenous children
Physical
1,869
2,637
653
209
271
77
29
35
5,780
Sexual
2,223
1,349
257
227
173
35
14
14
4,292
Emotional
3,331
5,680
1,696
385
375
194
76
66
11,803
Neglect
2,900
479
1,628
361
579
116
110
47
6,220
0
0
0
0
0
8
46
0
54
10,323
10,145
4,234
1,182
1,398
430
275
162
28,149
Not stated
Total
Unknown Indigenous status
Physical
4
0
45
124
22
28
0
0
223
Sexual
13
1
12
247
5
13
0
0
291
Emotional
29
0
95
265
27
84
0
0
500
Neglect
28
0
99
165
47
67
0
1
407
0
0
0
0
0
4
0
0
4
74
1
251
801
101
196
0
1
1,425
Not stated
Total
All children
Physical
2,686
2,927
1,040
480
367
114
33
259
7,906
Sexual
2,881
1,443
342
603
208
57
14
33
5,581
Emotional
4,767
6,453
2,420
1,003
601
315
97
437
16,093
Neglect
4,740
572
2,883
967
1,013
212
142
665
11,194
0
0
0
0
1
14
55
0
70
15,074
11,395
6,685
3,053
2,190
712
341
1,394
40,844
Not stated
Total
(continued)
78
Child protection Australia 2013–14
Table A11 (continued): Children aged 0–17 who were the subjects of substantiations of
notifications received during 2013–14, by type of abuse or neglect and Indigenous status, states and
territories
Type of abuse or neglect
NSW
Vic
Qld
SA(a)
WA
Tas(a)
ACT(a)
NT(b)
Total
%
Indigenous children
Physical
17.4
23.2
15.5
13.7
10.7
10.7
7.0
18.2
16.9
Sexual
13.8
7.4
3.3
12.1
4.3
10.7
0.0
1.5
8.9
Emotional
30.1
61.9
28.6
33.0
28.8
44.0
36.8
30.1
33.7
Neglect
38.7
7.4
52.5
41.2
56.1
34.5
56.1
50.1
40.6
100.0
100.0
100.0
100.0
100.0
100.0
100.0
100.0
100.0
Total
Non-Indigenous children
Physical
18.1
26.0
15.4
17.7
19.4
18.2
12.7
21.6
20.6
Sexual
21.5
13.3
6.1
19.2
12.4
8.3
6.1
8.6
15.3
Emotional
32.3
56.0
40.1
32.6
26.8
46.0
33.2
40.7
42.0
Neglect
28.1
4.7
38.5
30.5
41.4
27.5
48.0
29.0
22.1
100.0
100.0
100.0
100.0
100.0
100.0
100.0
100.0
100.0
Total
All children
Physical
17.8
25.7
15.6
15.7
16.8
16.3
11.5
18.6
19.4
Sexual
19.1
12.7
5.1
19.8
9.5
8.2
4.9
2.4
13.7
Emotional
31.6
56.6
36.2
32.9
27.5
45.1
33.9
31.3
39.5
Neglect
31.4
5.0
43.1
31.7
46.3
30.4
49.7
47.7
27.5
100.0
100.0
100.0
100.0
100.0
100.0
100.0
100.0
100.0
Total
(a)
In South Australia, Tasmania and the Australian Capital Territory, the abuse type for some substantiations was recorded as ‘not stated’ and
could not be mapped to physical, sexual, emotional or neglect. These substantiations are included in the totals; as such, totals may not
equal the sum of categories. The proportion of substantiations for children with an unknown Indigenous status affects the reliability of these
data. As such, comparisons to previous year’s data should be made with caution.
(b)
In the Northern Territory, due to recording issues, sexual exploitation is under-reported. This has been addressed and it is expected
numbers in this area will be similar to other jurisdictions in future years.
Notes
1.
Finalised investigations, and thus substantiations, refer only to cases that were notified during the year, not to the total number of
investigations finalised by 31 August 2014.
2.
If a child was the subject of more than one type of abuse or neglect as part of the same notification, then the abuse and/or neglect reported
is the one considered by the child protection workers to cause the most harm to the child. Where a child is the subject of more than one
substantiation during the year, then the type of abuse reported in this table is the type of abuse and/or neglect associated with the
substantiation decision relating to the earliest notification during the year.
3.
In Tasmania and the Australian Capital Territory, the proportion of Aboriginal and Torres Strait Islander children who were the subjects of
substantiations should be interpreted with caution due to small numbers.
4.
Percentages include children whose Indigenous status was unknown.
5.
Percentages in the table may not add to 100 due to rounding.
Source: AIHW Child Protection Collection 2014.
Child protection Australia 2013–14
79
Table A12: Number of notifications, states and territories, 2009–10 to 2013–14
NSW(a)
Vic
Qld
WA(b)(c)
SA(d)
Tas
ACT
NT
Total
2009–10
156,465
48,369
21,885
12,160
20,298
9,895
10,780
6,585
286,437
2010–11
98,845
55,718
21,655
10,976
21,145
10,689
11,712
6,533
237,273
2011–12
99,283
63,830
24,823
13,745
19,056
11,836
12,419
7,970
252,962
2012–13
104,817
73,265
24,763
15,201
19,120
12,311
13,518
9,985
272,980
2013–14
125,994
82,056
23,256
16,801
19,578
12,862
10,600
12,950
304,097
Year
(a)
New South Wales figures are not comparable with those of other jurisdictions. New South Wales has a differential investigation response
whereby an investigation can be undertaken over two stages (stage 1—information gathering; stage 2—assessment). Following the New
South Wales ‘Keep Them Safe’ reforms, the 2010–11 data reflect the first full year of reporting under legislative changes to the New South
Wales Children and Young Persons (Care and Protection) Act 1998, proclaimed on 24 January 2010. This includes raising the reporting
threshold from ‘risk of harm’ to the new ‘risk of significant harm’.
(b)
Data for 2009–10 for Western Australia are not comparable with other years due to the introduction of a new client information system in
March 2010. Proxy data were provided for that year.
(c)
In Western Australia, notifications where the primary concern at notification was emotional/psychological, physical, sexual abuse or neglect
are counted as notifications in this table.
(d)
During 2009–10, South Australia implemented a new client information system and this was accompanied by policy and practice changes.
Therefore, data for this year are not fully comparable with previous years’ data.
Source: AIHW Child Protection Collections 2009–10 to 2013–14.
80
Child protection Australia 2013–14
Table A13: Number of substantiations of notifications received during the relevant year, states and
territories, 2009–10 to 2013–14
Year
NSW(a)
Vic
Qld(b)
WA(c)
SA
Tas
ACT
NT
Total
2009–10
26,248
6,603
6,922
1,652
1,815
963
741
1,243
46,187
2010–11
18,596
7,643
6,598
1,907
2,220
1,225
636
1,641
40,466
2011–12
23,175
9,075
7,681
2,759
2,139
1,025
861
1,705
48,420
2012–13
26,860
10,489
8,069
2,915
2,221
1,035
720
1,357
53,666
2013–14
26,215
11,952
7,406
3,267
2,737
778
449
1,634
54,438
(a)
New South Wales figures are not comparable with those of other jurisdictions. New South Wales has a differential investigation response
whereby an investigation can be undertaken over two stages (stage 1—information gathering; stage 2—assessment). Only the more
serious cases that receive the higher level response may lead to a recorded substantiation outcome. Following the New South Wales ‘Keep
Them Safe’ reforms, the 2010–11 data reflect the first full year of reporting under legislative changes to the New South Wales Children and
Young Persons (Care and Protection) Act 1998, proclaimed on 24 January 2010. This includes raising the reporting threshold from ‘risk of
harm’ to the new ‘risk of significant harm’.
(b)
During 2011–12, additional staff focused on investigations and assessments were deployed across Queensland. This resulted in a decrease
in the number of investigations not yet finalised, and an increase in the number of investigations with a finalised outcome of ‘substantiated’,
‘unsubstantiated’ or ‘no investigation and assessment’ outcome.
(c)
Data for 2009–10 for Western Australia are not comparable with other years due to the introduction of a new client information system in
March 2010. Proxy data were provided for that year.
Source: AIHW Child Protection Collections 2009–10 to 2013–14.
Child protection Australia 2013–14
81
Table A14: Rates of children who were the subjects of substantiations of notifications received
during the relevant year, states and territories, 2009–10 to 2013–14 (number per 1,000 children)
NSW(a)
Vic
Qld(b)
WA(c)
SA(d)
Tas
ACT
NT
Total
2009–10
8.1
5.3
5.9
2.9
4.3
7.5
6.9
16.7
6.2
2010–11
7.0
6.0
5.6
3.5
5.2
9.7
5.8
22.9
6.2
2011–12
8.9
7.1
6.5
4.7
5.1
8.1
6.8
24.2
7.4
2012–13
9.8
8.0
6.5
4.7
5.2
8.0
6.0
19.0
7.8
2013–14
9.0
9.0
6.0
5.2
6.1
6.2
4.0
21.9
7.8
Year
(a)
New South Wales figures are not comparable with those of other jurisdictions. New South Wales has a differential investigation response
whereby an investigation can be undertaken over two stages (stage 1—information gathering; stage 2—assessment). Only the more
serious cases that receive the higher level response may lead to a recorded substantiation outcome. Following the New South Wales ‘Keep
Them Safe’ reforms, the 2010–11 data reflect the first full year of reporting under legislative changes to the New South Wales Children and
Young Persons (Care and Protection) Act 1998, proclaimed on 24 January 2010. This includes raising the reporting threshold from ‘risk of
harm’ to the new ‘risk of significant harm’.
(b)
During 2011–12, additional staff focused on investigations and assessments were deployed across Queensland. This resulted in a decrease
in the number of investigations not yet finalised, and an increase in the number of investigations with a finalised outcome of ‘substantiated’,
‘unsubstantiated’ or ‘no investigation and assessment’ outcome.
(c)
Data for 2009–10 for Western Australia are not comparable with other years due to the introduction of a new client information system in
March 2010. Proxy data were provided for that year.
(d)
During 2009–10, South Australia implemented a new client information system and this was accompanied by policy and practice changes.
Therefore, data for this year are not fully comparable with previous years’ data.
Notes
1.
Unborn children are included in rate calculations.
2.
Children may have been the subject of more than one substantiation.
3.
Rates were calculated using revised population estimates based on the 2011 Census and should not be compared with rates calculated
using populations or projections based on previous Censuses, including those published in previous editions of Child protection Australia.
Source: AIHW Child Protection Collections 2009–10 to 2013–14 and Table S1.
82
Child protection Australia 2013–14
Care and protection orders
Table A15: Children on care and protection orders, on an average day, by type of
order, 2013–14
Type of order
Number
%
11,639
60.5
Finalised third-party parental responsibility orders
2,803
14.6
Finalised supervisory orders
2,180
11.3
Interim and temporary orders
2,626
13.7
Administrative arrangements
38
0.2
Assessment order
16
0.1
0
—
19,237
..
Finalised guardianship/custody
Not stated
Total children on an order on an average day
Notes
1.
Excludes New South Wales and Queensland.
2.
The number of children by type of order on an average day does not sum to the total number of children, as children may be on more than
one type of order at the same time.
3.
Data quality issues for some jurisdictions may impact on these results.
Source: AIHW Child Protection Collection 2014.
Child protection Australia 2013–14
83
Table A16: Care and protection orders issued, by type of order, states and territories, 2013–14
Type of order
NSW(a)
Vic(b)
Qld(c)
WA
SA
Tas
ACT
NT
Total
Number
Finalised guardianship or
custody orders
2,270
1,299
2,605
1,045
638
311
121
320
8,609
Finalised third-party parental
responsibility orders
381
302
195
71
31
40
12
..
1,032
Finalised supervisory orders
n.a.
2,595
507
63
22
18
29
2
3,236
Interim and temporary orders
2,083
13,150
2,646
872
1,964
550
258
2,221
23,744
Administrative arrangements
482
..
..
..
113
11
33
94
733
5,216
17,346
5,953
2,051
2,768
930
453
2,637
37,354
Total
%
Finalised guardianship or
custody orders
43.5
7.5
43.8
51.0
23.0
33.4
26.7
12.1
23.0
Finalised third-party parental
responsibility orders
7.3
1.7
3.3
3.5
1.1
4.3
2.6
..
2.8
Finalised supervisory orders
..
15.0
8.5
3.1
0.8
1.9
6.4
0.1
8.7
Interim and temporary orders
39.9
75.8
44.4
42.5
71.0
59.1
57.0
84.2
63.6
Administrative arrangements
9.2
..
..
..
4.1
1.2
7.3
3.6
2.0
100.0
100.0
100.0
100.0
100.0
100.0
100.0
100.0
100.0
Total
(a)
New South Wales data do not include children on finalised supervisory orders.
(b)
Prior to 2013–14 third-party parental responsibility orders were included in finalised guardianship or custody orders and only a small
minority of Victoria’s interim and temporary orders were reported.
(c)
Data on ‘Administrative arrangements’ is not applicable for Queensland.
Note: Percentages in the table may not add to 100 due to rounding.
Source: AIHW Child Protection Collection 2014.
84
Child protection Australia 2013–14
Table A17: Children substantiated in 2012–13 and subsequently placed on care and protection
orders within 12 months, states and territories
Number subsequently placed on a
care and protection order
Percentage of all children
substantiated in 2012–13
n.a.
..
Victoria
3,560
34.6
Queensland
2,011
25.6
Western Australia
746
27.0
South Australia
470
22.2
Tasmania
240
26.7
Australian Capital Territory
133
27.0
Northern Territory
240
21.3
7,400
28.9
State/territory
New South Wales(a)
Total
(a)
New South Wales was unable to provide these data.
Source: AIHW Child Protection Collection 2014.
Child protection Australia 2013–14
85
Table A18: Children admitted to care and protection orders, by age group, states and territories,
2013–14
Age group
(years)
NSW(a)
Qld(b)
Vic
WA
SA
Tas
ACT
NT
Total
Number
<1
671
747
461
231
111
44
42
63
2,370
1–4
828
1,132
1,216
266
107
94
37
108
3,788
5–9
766
1,119
1,163
236
123
88
28
79
3,602
10–14
528
888
779
160
96
46
25
99
2,621
15–17
202
324
189
15
20
10
9
20
789
0
0
0
0
0
0
0
1
1
2,995
4,210
3,808
908
457
282
141
370
13,171
Unknown
Total
%
<1
22.4
17.7
12.1
25.4
24.3
15.6
29.8
17.1
18.0
1–4
27.6
26.9
31.9
29.3
23.4
33.3
26.2
29.3
28.8
5–9
25.6
26.6
30.5
26.0
26.9
31.2
19.9
21.4
27.4
10–14
17.6
21.1
20.5
17.6
21.0
16.3
17.7
26.8
19.9
15–17
Total
6.7
7.7
5.0
1.7
4.4
3.5
6.4
5.4
6.0
100.0
100.0
100.0
100.0
100.0
100.0
100.0
100.0
100.0
(a)
New South Wales data do not include children on finalised supervisory orders.
(b)
In Queensland, previous admissions to care and protection orders in other jurisdictions could not be counted.
Notes
1.
A renewal of an existing order is not counted as an admission.
2.
Children are counted for only one admission and discharge during the year. However, a change to an order is counted as an admission.
3.
Percentages exclude children of unknown age.
4.
Percentages in the table may not add to 100 due to rounding.
Source: AIHW Child Protection Collection 2014.
86
Child protection Australia 2013–14
Table A19: Children discharged from care and protection orders, by length of time on an order,
states and territories, 2013–14
Length of time continually on an order at time of discharge
Months
State/territory
<3
3 to <6
Years
6 to <12
1 to <2
2 to <4
4 to <8
8 or more
Total
Number
New South Wales
(a)
421
100
128
279
258
315
551
2,052
Victoria
449
551
861
1,204
612
281
196
4,154
Queensland
315
98
333
371
452
247
275
2,091
21
33
38
158
392
90
38
770
135
18
22
107
61
66
85
494
Tasmania
92
20
29
124
59
23
34
381
Australian Capital Territory
19
7
5
6
42
20
12
111
125
19
18
29
23
8
–
222
1,577
846
1,434
2,278
1,899
1,050
1,191
10,275
Western Australia
South Australia
Northern Territory
Total
%
New South Wales
20.5
4.9
6.2
13.6
12.6
15.4
26.9
100.0
Victoria
10.8
13.3
20.7
29.0
14.7
6.8
4.7
100.0
Queensland
15.1
4.7
15.9
17.7
21.6
11.8
13.2
100.0
2.7
4.3
4.9
20.5
50.9
11.7
4.9
100.0
South Australia
27.3
3.6
4.5
21.7
12.3
13.4
17.2
100.0
Tasmania
24.1
5.2
7.6
32.5
15.5
6.0
8.9
100.0
Australian Capital Territory
17.1
6.3
4.5
5.4
37.8
18.0
10.8
100.0
Northern Territory
56.3
8.6
8.1
13.1
10.4
3.6
0.0
100.0
Total
15.3
8.2
14.0
22.2
18.5
10.2
11.6
100.0
Western Australia
(a)
New South Wales data do not include children on finalised supervisory orders.
Notes
1.
If a child is discharged from an order and a new care and protection order/arrangement is applied in 5 days or less of the discharge, the
orders are deemed to be consecutive (that is, the length of time continuously on an order will include both orders).
2.
If a child is on multiple care and protection orders/arrangements, all orders/arrangements must be discharged before a discharge, for the
purposes of this table, is counted.
3.
The length of time continuously on an order is counted only for the first order/arrangement from which the child is discharged during the
year.
4.
Percentages in the table may not add to 100 due to rounding.
Source: AIHW Child Protection Collection 2014.
Child protection Australia 2013–14
87
Table A20: Children on care and protection orders, by living arrangements, states and territories,
30 June 2014
Living
arrangements
NSW(a)
Vic
Qld
SA(b)
WA
Tas(c)
ACT
NT(d)
Total
Number
Parents
525
2,050
733
257
n.a.
100
92
53
3,810
0
0
0
0
n.a.
4
4
28
36
525
2,050
733
257
n.a.
104
96
81
3,846
7,506
1,992
4,088
1,464
1,104
399
213
472
17,238
8,457
3,077
3,281
1,715
1,103
296
313
17
18,259
0
1,055
0
0
0
253
33
261
1,602
15,963
6,124
7,369
3,179
2,207
948
559
750
37,099
503
477
620
155
333
47
33
90
2,258
Family group
homes
14
0
0
168
0
29
0
9
220
Independent
living(h)
181
45
49
16
21
18
3
5
338
56
537
360
696
225
42
14
55
1,985
17,242
9,233
9,131
4,471
2,786
1,188
705
990
45,746
(e)
Relatives/kin
Total family care
(f)
Foster care
(f)(g)
Relatives/kin
Other
Total home-based
care
Residential care
Other/unknown
Total
%
Parents
3.0
22.2
8.0
5.7
..
8.4
13.0
5.4
8.3
Relatives/kin
0.0
0.0
0.0
0.0
..
0.3
0.6
2.8
0.1
Total family care
3.0
22.2
8.0
5.7
..
8.8
13.6
8.2
8.4
43.5
21.6
44.8
32.7
39.6
33.6
30.2
47.7
37.7
49.0
33.3
35.9
38.4
39.6
24.9
44.4
1.7
39.9
0.0
11.4
0.0
0.0
0.0
21.3
4.7
26.4
3.5
92.6
66.3
80.7
71.1
79.2
79.8
79.3
75.8
81.1
Residential care
2.9
5.2
6.8
3.5
12.0
4.0
4.7
9.1
4.9
Family group
homes
0.1
0.0
0.0
3.8
0.0
2.4
0.0
0.9
0.5
Independent
living(h)
1.0
0.5
0.5
0.4
0.8
1.5
0.4
0.5
0.7
Other/unknown
0.3
5.8
3.9
15.6
8.1
3.5
2.0
5.6
4.3
100.0
100.0
100.0
100.0
100.0
100.0
100.0
100.0
100.0
(e)
(f)
Foster care
Relatives/kin
(f)(g)
Other
Total home-based
care
Total
(a)
New South Wales data do not include children on finalised supervisory orders and only include funded out-of-home care placements. The
‘other/unknown’ category for New South Wales includes children on orders for whom a living arrangement was not provided.
(b)
Data for South Australia only include funded out-of-home care placements. The ‘other/unknown’ category for South Australia includes
children on orders for whom a living arrangement was not provided.
(c)
In Tasmania, children under third-party guardianship orders are counted under ‘other home-based care’ living arrangements.
(d)
In the Northern Territory’s client information system, the majority of children in a relative/kinship placement are captured in the ‘foster care’
placement type. Approximately 45% of children in the ‘foster care’ placement type are placed in a relative/kinship household.
(e)
This category includes relatives/kin, other than parents, who were not reimbursed.
(f)
Some foster carers may be relatives of the child being cared for and some relative carers may actually be fully assessed as registered foster
carers.
(g)
This category includes relatives/kin, other than parents, who were reimbursed.
(h)
’Independent living’ includes private board.
Note: Percentages in the table may not add to 100 due to rounding.
Source: AIHW Child Protection Collection 2014.
88
Child protection Australia 2013–14
Table A21: Children on care and protection orders, by age group and living arrangements, 30 June
2014
Family
care(a)
Homebased outof-home
care(b)
Residential
care
Family
group
homes
Independent
living(c)
Other
Total
242
1,151
3
0
0
63
1,459
1–4
1,078
7,589
79
14
0
235
8,995
5–9
1,117
12,770
222
85
1
378
14,573
10–14
924
11,275
886
85
8
534
13,712
15–17
485
4,314
1,068
36
329
775
7,007
0
0
0
0
0
0
0
3,846
37,099
2,258
220
338
1,985
45,746
Age group
(years)
<1
Unknown
Total
%
<1
6.3
3.1
0.1
0.0
0.0
3.2
3.2
1–4
28.0
20.5
3.5
6.4
0.0
11.8
19.7
5–9
29.0
34.4
9.8
38.6
0.3
19.0
31.9
10–14
24.0
30.4
39.2
38.6
2.4
26.9
30.0
15–17
12.6
11.6
47.3
16.4
97.3
39.0
15.3
Total
100.0
100.0
100.0
100.0
100.0
100.0
100.0
8.4
81.1
4.9
0.5
0.7
4.3
100.0
Total living
arrangements
(a)
This category includes relatives/kin, other than parents, who were not reimbursed.
(b)
This category includes relatives/kin, other than parents, who were reimbursed.
(c)
This category includes private board.
Notes
1.
Percentages exclude children of unknown age.
2.
Percentages in the table may not add to 100 due to rounding.
Source: AIHW Child Protection Collection 2014.
Child protection Australia 2013–14
89
Table A22: Children on care and protection orders, by age group, states and territories, 30 June 2014
Age group
(years)
NSW(a)
Vic
Qld
WA
SA
Tas
ACT
NT
Total
Number
<1
446
448
234
170
72
25
35
29
1,459
1–4
3,207
2,007
1,729
963
509
217
155
208
8,995
5–9
5,740
2,684
2,895
1,459
907
385
208
295
14,573
10–14
5,289
2,524
2,852
1,310
865
365
205
302
13,712
15–17
2,560
1,570
1,421
569
433
196
102
156
7,007
0
0
0
0
0
0
0
0
0
17,242
9,233
9,131
4,471
2,786
1,188
705
990
45,746
Unknown
Total
%
<1
2.6
4.9
2.6
3.8
2.6
2.1
5.0
2.9
3.2
1–4
18.6
21.7
18.9
21.5
18.3
18.3
22.0
21.0
19.7
5–9
33.3
29.1
31.7
32.6
32.6
32.4
29.5
29.8
31.9
10–14
30.7
27.3
31.2
29.3
31.0
30.7
29.1
30.5
30.0
15–17
14.8
17.0
15.6
12.7
15.5
16.5
14.5
15.8
15.3
Total
100.0
100.0
100.0
100.0
100.0
100.0
100.0
100.0
100.0
(a)
New South Wales data do not include children on finalised supervisory orders.
Notes
1.
Percentages exclude children of unknown age.
2.
Percentages in the table may not add to 100 due to rounding.
Source: AIHW Child Protection Collection 2014.
90
Child protection Australia 2013–14
Table A23: Children on care and protection orders, by sex, states and territories, 30 June 2014
NSW(a)
Sex
Vic
Qld
WA
SA
Tas
ACT
NT
Total
Number
Boys
8,977
4,675
4,650
2,299
1,449
617
375
484
23,526
Girls
8,265
4,553
4,481
2,171
1,337
570
330
506
22,213
Unknown
0
5
0
1
0
1
0
0
7
Persons
17,242
9,233
9,131
4,471
2,786
1,188
705
990
45,746
%
Boys
52.1
50.7
50.9
51.4
52.0
52.0
53.2
48.9
51.4
Girls
47.9
49.3
49.1
48.6
48.0
48.0
46.8
51.1
48.6
100.0
100.0
100.0
100.0
100.0
100.0
100.0
100.0
100.0
Persons
(a)
New South Wales data do not include children on finalised supervisory orders.
Notes
1.
Percentages exclude children of unknown sex.
2.
Percentages in the table may not add to 100 due to rounding.
Source: AIHW Child Protection Collection 2014.
Child protection Australia 2013–14
91
Table A24: Children on care and protection orders, by type of order and Indigenous status, states
and territories, 30 June 2014
Type of order
NSW(a)
Vic(b)
Qld
WA
SA
Tas
ACT
NT
Total
Number
Indigenous children
Finalised guardianship or
custody orders
4,078
717
2,731
1,694
769
208
146
696
11,039
Finalised third-party parental
responsibility orders
1,383
223
474
210
13
35
14
..
2,352
Finalised supervisory orders
n.a.
287
87
19
5
0
13
1
412
Interim and temporary orders
540
280
367
292
22
24
9
139
1,673
Administrative arrangements
21
..
..
..
3
0
0
4
28
Not stated
..
0
..
0
0
0
0
0
0
6,022
1,507
3,659
2,215
812
267
182
840
15,504
Total
Non-Indigenous children
Finalised guardianship or
custody orders
7,331
2,654
3,907
1,687
1,752
642
374
129
18,476
Finalised third-party parental
responsibility orders
2,696
1,899
915
215
94
145
53
..
6,017
Finalised supervisory orders
n.a.
1,618
212
30
14
10
30
0
1,914
Interim and temporary orders
1,119
1,547
370
269
72
82
64
18
3,541
Administrative arrangements
73
..
..
0
8
1
2
2
86
Not stated
..
0
..
0
0
0
0
0
0
11,219
7,718
5,404
2,201
1,940
880
523
149
30,034
Total
Unknown Indigenous status
Finalised guardianship or
custody orders
1
3
41
22
27
22
0
0
116
Finalised third-party parental
responsibility orders
0
4
3
0
0
1
0
..
8
Finalised supervisory orders
n.a.
1
7
4
0
0
0
0
12
Interim and temporary orders
0
0
17
29
4
18
0
1
68
Administrative arrangements
0
..
..
..
3
0
0
0
3
Not stated
..
0
..
0
0
0
0
0
0
Total
1
8
68
55
34
41
0
1
208
All children
Finalised guardianship or
custody orders
11,410
3,374
6,679
3,403
2,548
872
520
825
29,631
Finalised third-party parental
responsibility orders
4,079
2,126
1,392
425
107
181
67
..
8,377
Finalised supervisory orders
n.a.
1,906
306
53
19
10
43
1
2,338
Interim and temporary orders
1,659
1,827
754
590
98
124
73
158
5,283
Administrative arrangements
94
..
..
0
14
1
2
6
117
0
0
0
0
0
0
0
0
0
17,242
9,233
9,131
4,471
2,786
1,188
705
990
45,746
Not stated
Total
(continued)
92
Child protection Australia 2013–14
Table A24 (continued): Children on care and protection orders, by type of order and Indigenous
status, states and territories, 30 June 2014
Type of order
NSW(a)
Vic(b)
Qld
WA
SA
Tas
ACT
NT
Total
%
Indigenous children
Finalised guardianship or
custody orders
67.7
47.6
74.6
76.5
94.7
77.9
80.2
82.9
71.2
Finalised third-party
parental responsibility
orders
23.0
14.8
13.0
9.5
1.6
13.1
7.7
..
15.2
Finalised supervisory
orders
..
19.0
2.4
0.9
0.6
0.0
7.1
0.1
2.7
Interim and temporary
orders
9.0
18.6
10.0
13.2
2.7
9.0
4.9
16.5
10.8
Administrative
arrangements
0.3
..
..
..
0.4
0.0
0.0
0.5
0.2
100.0
100.0
100.0
100.0
100.0
100.0
100.0
100.0
100.0
Total
Non-Indigenous children
Finalised guardianship or
custody orders
65.3
34.4
72.3
76.6
90.3
73.0
71.5
86.6
61.5
Finalised third-party
parental responsibility
orders
24.0
24.6
16.9
9.8
4.8
16.5
10.1
..
20.0
Finalised supervisory
orders
..
21.0
3.9
1.4
0.7
1.1
5.7
0.0
6.4
10.0
20.0
6.8
12.2
3.7
9.3
12.2
12.1
11.8
0.7
..
..
..
0.4
0.1
0.4
1.3
0.3
100.0
100.0
100.0
100.0
100.0
100.0
100.0
100.0
100.0
Interim and temporary
orders
Administrative
arrangements
Total
All children
Finalised guardianship or
custody orders
66.2
36.5
73.1
76.1
91.5
73.4
73.8
83.3
64.8
Finalised third-party
parental responsibility
orders
23.7
23.0
15.2
9.5
3.8
15.2
9.5
..
18.3
Finalised supervisory
orders
..
20.6
3.4
1.2
0.7
0.8
6.1
0.1
5.1
Interim and temporary
orders
9.6
19.8
8.3
13.2
3.5
10.4
10.4
16.0
11.5
Administrative
arrangements
0.5
..
..
..
0.5
0.1
0.3
0.6
0.3
100.0
100.0
100.0
100.0
100.0
100.0
100.0
100.0
100.0
Total
(a)
New South Wales data do not include children on finalised supervisory orders.
(b)
Prior to 2013–14 third-party parental responsibility orders were included in finalised guardianship or custody orders and only a small
minority of Victoria’s interim and temporary orders were reported.
Note: Percentages in the table may not add to 100 due to rounding.
Source: AIHW Child Protection Collection 2014.
Child protection Australia 2013–14
93
Out-of-home care
Table A25: Children in out-of-home care, on an average day, by living arrangements, 2013–14
Living arrangements
Number
%
Foster care
5,916
37.3
Relatives/kin
7,147
45.1
Other home-based care
1,603
10.1
Total home-based care
14,665
92.5
223
1.4
1,157
7.3
Independent living
70
0.4
Other/unknown
65
0.4
15,858
..
Family group homes
Residential care
Total children in out-of-home care on an average day
Notes
1.
Excludes New South Wales and Queensland.
2.
The number of children by living arrangement on an average day does not sum to the total number of children, as children may have more
than one living arrangement recorded at the same time. This may also affect sub-totals reported on this table.
3.
Data quality issues for some jurisdictions may impact on these results.
Source: AIHW Child Protection Collection 2014.
94
Child protection Australia 2013–14
Table A26: Children admitted to out-of-home care, by age group, states and territories, 2013–14
Age group
(years)
NSW
Vic
Qld
WA
SA
Tas
ACT
NT
Total
Number
<1
674
520
426
235
102
37
39
63
2,096
1–4
875
822
542
283
93
60
47
106
2,828
5–9
816
761
515
261
113
60
46
82
2,654
10–14
646
718
505
234
92
34
49
107
2,385
15–17
237
389
278
87
45
17
33
35
1,121
0
0
0
0
0
0
0
1
1
3,248
3,210
2,266
1,100
445
208
214
394
11,085
Unknown
Total
%
<1
20.8
16.2
18.8
21.4
22.9
17.8
18.2
16.0
18.9
1–4
26.9
25.6
23.9
25.7
20.9
28.8
22.0
27.0
25.5
5–9
25.1
23.7
22.7
23.7
25.4
28.8
21.5
20.9
23.9
10–14
19.9
22.4
22.3
21.3
20.7
16.3
22.9
27.2
21.5
15–17
Total
7.3
12.1
12.3
7.9
10.1
8.2
15.4
8.9
10.1
100.0
100.0
100.0
100.0
100.0
100.0
100.0
100.0
100.0
Notes
1.
The table includes all children admitted to out-of-home care for the first time, as well as those children returning to care who had exited care
60 days or more previously. Children admitted to out-of-home care more than once during the year were only counted at the first admission.
2.
Percentages exclude children of unknown age.
3.
Percentages in the table may not add to 100 due to rounding.
Source: AIHW Child Protection Collection 2014.
Child protection Australia 2013–14
95
Table A27: Children discharged from out-of-home care, by age group, states and territories, 2013–14
Age group
(years)
Total
NSW
Vic
Qld
WA
SA
Tas
ACT
NT
Number
<1
95
177
62
47
21
9
5
22
438
1–4
335
552
283
166
76
42
37
49
1,540
5–9
365
462
287
165
88
59
33
35
1,494
10–14
513
490
322
232
95
49
45
66
1,812
15–17
1,159
806
566
207
205
61
59
61
3,124
0
0
0
0
0
0
0
1
1
2,467
2,487
1,520
817
485
220
179
234
8,409
Unknown
Total
%
<1
3.9
7.1
4.1
5.8
4.3
4.1
2.8
9.4
5.2
1–4
13.6
22.2
18.6
20.3
15.7
19.1
20.7
21.0
18.3
5–9
14.8
18.6
18.9
20.2
18.1
26.8
18.4
15.0
17.8
10–14
20.8
19.7
21.2
28.4
19.6
22.3
25.1
28.3
21.6
15–17
47.0
32.4
37.2
25.3
42.3
27.7
33.0
26.2
37.2
Total
100.0
100.0
100.0
100.0
100.0
100.0
100.0
100.0
100.0
Notes
1.
The data for children exiting care include those who left care and had not returned in less than 60 days. Where a child exits care more than
once during the year, the last discharge is counted.
2.
Children who were discharged from care on their 18th birthday are included in the 15–17 age category.
3.
Percentages exclude children of unknown age.
4.
Percentages in the table may not add to 100 due to rounding.
Source: AIHW Child Protection Collection 2014.
96
Child protection Australia 2013–14
Table A28: Children in out-of-home care, by type of placement, states and territories, 30 June 2014
Type of placement
NSW
Vic(a)
Qld
WA
SA
Tas(b)
ACT
NT(c)
Total
Number
(d)
Foster care
7,550
2,132
4,223
1,549
1,114
401
213
472
17,654
10,044
3,877
3,306
1,821
1,162
302
318
17
20,847
Other home-based care
0
1,136
0
0
0
255
36
261
1,688
Total home-based care
17,594
7,145
7,529
3,370
2,276
958
567
750
40,189
14
0
0
185
n.a.
29
0
9
237
507
515
656
168
334
48
38
90
2,356
Independent living
66
49
0
0
21
1
0
5
142
Other/unknown
11
1
0
0
n.a.
18
1
54
85
18,192
7,710
8,185
3,723
2,631
1,054
606
908
43,009
(d)
Relatives/kin
Family group homes
Residential care
Total
%
Foster care
41.5
27.7
51.6
41.6
42.3
38.0
35.1
52.0
41.0
Relatives/kin
55.2
50.3
40.4
48.9
44.2
28.7
52.5
1.9
48.5
Other home-based care
0.0
14.7
0.0
0.0
0.0
24.2
5.9
28.7
3.9
Total home-based care
96.7
92.7
92.0
90.5
86.5
90.9
93.6
82.6
93.4
Family group homes
0.1
0.0
0.0
5.0
..
2.8
0.0
1.0
0.6
Residential care
2.8
6.7
8.0
4.5
12.7
4.6
6.3
9.9
5.5
Independent living
0.4
0.6
0.0
0.0
0.8
0.1
0.0
0.6
0.3
Other/unknown
0.1
—
0.0
0.0
..
1.7
0.2
5.9
0.2
100.0
100.0
100.0
100.0
100.0
100.0
100.0
100.0
100.0
Total
(a)
In Victoria, the ‘foster care’ category includes children in permanent care placements. These placements are different to foster care as they
involve granting permanent guardianship and custody of a child to a third party via a permanent care order. Unlike adoptions, permanent
care orders do not change the legal status of the child and they expire when the child turns 18 or marries.
(b)
In Tasmania, children under third-party guardianship orders are counted under ‘Other home-based care’ living arrangements.
(c)
In the Northern Territory’s client information system, the majority of children in a relative/kinship placement are captured in the ‘foster care’
placement type. Approximately 45% of children in the ‘foster care’ placement type are placed in a relative/kinship household.
(d)
Where a child is placed with a relative who is also fully registered to provide foster care for other children, they are counted in the ‘foster
care’ category for Victoria and Western Australia, whereas they are counted in the ‘relatives/kin' category in Queensland and South
Australia. Relatives/kin in some jurisdictions undergo assessment, registration and review processes similar to foster carers under the
national definition, and are considered as (relative) foster carers in local practice, policy and reporting.
Notes
1.
Percentages include children with ‘other/unknown’ living arrangements.
2.
Percentages in the table may not add to 100 due to rounding.
Source: AIHW Child Protection Collection 2014.
Child protection Australia 2013–14
97
Table A29: Children in out-of-home care, by age group, states and territories, 30 June 2014
Age group
(years)
NSW
Vic
Qld
WA
SA
Tas
ACT
NT
Total
Number
<1
432
256
234
161
67
20
30
29
1,229
1–4
3,210
1,496
1,585
878
484
194
124
202
8,173
5–9
5,993
2,278
2,679
1,278
888
355
188
277
13,936
10–14
5,819
2,259
2,620
1,050
836
334
181
271
13,370
15–17
2,738
1,421
1,067
356
356
151
83
129
6,301
0
0
0
0
0
0
0
0
0
18,192
7,710
8,185
3,723
2,631
1,054
606
908
43,009
Unknown
Total
%
<1
2.4
3.3
2.9
4.3
2.5
1.9
5.0
3.2
2.9
1–4
17.6
19.4
19.4
23.6
18.4
18.4
20.5
22.2
19.0
5–9
32.9
29.5
32.7
34.3
33.8
33.7
31.0
30.5
32.4
10–14
32.0
29.3
32.0
28.2
31.8
31.7
29.9
29.8
31.1
15–17
15.1
18.4
13.0
9.6
13.5
14.3
13.7
14.2
14.7
Total
100.0
100.0
100.0
100.0
100.0
100.0
100.0
100.0
100.0
Notes
1.
Percentages exclude children of unknown age.
2.
Percentages in the table may not add to 100 due to rounding.
Source: AIHW Child Protection Collection 2014.
Table A30: Children in out-of-home care, by sex, states and territories, 30 June 2014
Sex
NSW
Vic
Qld
WA
SA
Tas
ACT
NT
Total
Number
Boys
9,431
3,920
4,162
1,941
1,374
538
330
447
22,143
Girls
8,760
3,788
4,023
1,782
1,257
515
276
461
20,862
Unknown
1
2
0
0
0
1
0
0
4
Persons
18,192
7,710
8,185
3,723
2,631
1,054
606
908
43,009
%
Boys
51.8
50.9
50.8
52.1
52.2
51.1
54.5
49.2
51.5
Girls
48.2
49.1
49.2
47.9
47.8
48.9
45.5
50.8
48.5
100.0
100.0
100.0
100.0
100.0
100.0
100.0
100.0
100.0
Persons
Notes
1.
Percentages exclude children of unknown sex.
2.
Percentages in the table may not add to 100 due to rounding.
Source: AIHW Child Protection Collection 2014.
98
Child protection Australia 2013–14
Table A31: Children in out-of-home care, by age group and type of placement, 30 June 2014 (%)
Age group
(years)
NSW
Vic
Qld
WA
SA
Tas
ACT
NT
Total
Home-based
<1
2.5
3.5
3.1
4.8
2.9
2.1
5.3
3.7
3.0
1–4
18.2
20.8
20.9
25.2
20.2
19.7
21.7
25.7
20.1
5–9
33.9
31.3
34.9
35.1
35.2
35.3
33.0
33.9
33.8
10–14
31.9
29.1
31.1
26.8
31.0
31.3
28.7
28.8
30.7
15–17
13.4
15.3
10.1
8.2
10.8
11.6
11.3
7.9
12.4
Total
100.0
100.0
100.0
100.0
100.0
100.0
100.0
100.0
100.0
Residential (including family group homes)
<1
0.0
0.4
0.2
0.0
0.3
0.0
0.0
0.0
0.2
1–4
0.2
2.3
2.1
8.5
7.5
6.5
2.6
8.1
3.7
5–9
4.0
8.0
7.9
27.2
25.7
18.2
2.6
19.2
12.7
37.6
35.5
43.0
41.9
39.2
32.5
44.7
43.4
39.5
10–14
15–17
58.2
53.8
46.8
22.4
27.2
42.9
50.0
29.3
43.9
Total
100.0
100.0
100.0
100.0
100.0
100.0
100.0
100.0
100.0
Notes
1.
Percentages exclude children who were living independently or whose living arrangements were classified as ‘other’ (including unknown);
and children of unknown age.
2.
Percentages in the table may not add to 100 due to rounding.
Source: AIHW Child Protection Collection 2014.
Child protection Australia 2013–14
99
Table A32: Children in out-of-home care, by Indigenous status and age group, 30 June 2014
Indigenous Status
<1(a)
1–4
5–9
10–14
15–17
0–17(b)
Number
Indigenous
437
3,159
5,129
4,547
1,719
14,991
Non-Indigenous
738
4,940
8,778
8,799
4,572
27,827
54
74
29
24
10
191
1,229
8,173
13,936
13,370
6,301
43,009
Not stated
(c)
All children
Number per 1,000 children
Indigenous
24.8
47.4
62.0
58.2
36.8
51.4
Non-Indigenous
2.6
4.3
6.2
6.6
5.6
5.6
All children
4.1
6.7
9.4
9.5
7.3
8.1
Rate ratio
Indigenous/NonIndigenous
9.5
11.1
9.9
8.8
6.6
9.2
(a)
The ‘less than 1’ category excludes unborn children.
(b)
Total for the 0–17 age group includes children of unknown age and may not equal the sum of age categories.
(c)
‘All children’ includes children whose Indigenous status was unknown.
Notes
1.
Rates were calculated using revised population estimates based on the 2011 Census and should not be compared with rates calculated
using populations or projections based on previous Censuses, including those published in previous editions of Child protection Australia.
Refer to Table A50 for the populations used in the calculation of rates.
2.
Rate ratios are calculated by dividing the un-rounded rate of Aboriginal and Torres Strait Islander children who were in out-of-home care by
the unrounded rate of non-Indigenous children who were in out-of-home care for each age group. The resulting number is a measure of
how many Aboriginal and Torres Strait Islander children in each age group were in out-of-home care for every non-Indigenous child who
was in out-of-home care in that age group. Children whose Indigenous status is unknown are excluded from the calculations.
Source: AIHW Child Protection Collection 2014.
100
Child protection Australia 2013–14
Table A33: Aboriginal and Torres Strait Islander children in out-of-home care, by Indigenous
status and relationship of carer, states and territories, 30 June 2014
Relationship
NSW(a)
Vic(b)
Qld(a)
WA
SA
Tas
ACT
NT(a)
Total
Number
Indigenous relative/kin
2,994
371
775
821
274
13
38
262
5,548
Other Indigenous caregiver
1,282
65
565
197
103
29
3
70
2,314
Other relative/kin
1,012
245
499
222
148
52
43
0
2,221
Total placed with relatives/kin,
other Indigenous caregivers or
in Indigenous residential care
5,288
681
1,839
1,240
525
94
84
332
10,083
Other caregiver
1,208
623
1,497
642
256
138
68
447
4,879
Total not placed with
relatives/kin, other Indigenous
caregivers or in Indigenous
residential care
1,208
623
1,497
642
256
138
68
447
4,879
Total
6,496
1,304
3,336
1,882
781
232
152
779
14,962
%
Indigenous relative/kin
46.1
28.5
23.2
43.6
35.1
5.6
25.0
33.6
37.1
Other Indigenous caregiver
19.7
5.0
16.9
10.5
13.2
12.5
2.0
9.0
15.5
Other relative/kin
15.6
18.8
15.0
11.8
19.0
22.4
28.3
0.0
14.8
Total placed with relatives/kin,
other Indigenous caregivers or
in Indigenous residential care
81.4
52.2
55.1
65.9
67.2
40.5
55.3
42.6
67.4
Other caregiver
18.6
47.8
44.9
34.1
32.8
59.5
44.7
57.4
32.6
Total not placed with
relatives/kin, other Indigenous
caregivers or in Indigenous
residential care
18.6
47.8
44.9
34.1
32.8
59.5
44.7
57.4
32.6
100.0
100.0
100.0
100.0
100.0
100.0
100.0
100.0
100.0
Total
(a)
Aggregate data were provided by New South Wales, Queensland and the Northern Territory for this table.
(b)
For Victoria, 286 children for whom relationship of carer and/or their Indigenous status were unknown are included in the categories ‘Other
caregiver’ and ‘Total not placed with relatives/kin, other Indigenous caregivers or in Indigenous residential care’.
Notes
1.
This table does not include Aboriginal and Torres Strait Islander children who were living independently or for whom relationship of carer
and/or their Indigenous status were unknown.
2.
Percentages in the table may not add to 100 due to rounding.
3
Family group homes and residential care are reported under ‘other caregiver’.
Source: AIHW Child Protection Collection 2014.
Child protection Australia 2013–14
101
Foster and relative/kinship carers
Table A34: Overview of funded out-of-home carer households, on an average day during 2013–14
Authorisation type
Number
%
Foster carer
5,483
45.7
Relative/kinship carer
6,022
50.2
Both foster and relative/kinship carer
216
1.8
Respite-only carer
261
2.2
Long-term guardianship
20
0.2
Not stated
37
—
12,038
100.0
Total carer households on an average day
Notes
1.
‘Not stated’ are excluded from the total when calculating proportions.
2.
Excludes New South Wales and Queensland.
3.
Data quality issues for some jurisdictions may impact on these results.
4.
The number of approved/authorised carer households on an average day by authorisation type does not sum to the total number of
households, as households may have more than one authorisation type recorded at the same time.
Source: AIHW Child Protection Collection 2014.
Table A35: Foster carer households with a placement at 30 June 2014, by number of foster
children placed
Number of children
NSW
Vic
Qld(a)
WA
SA
Tas
ACT
NT(b)
Total
Number
1 child
1,916
1,114
1,007
313
351
90
64
168
5,023
2 children
1,179
346
666
226
203
51
38
69
2,778
3–4 children
796
87
531
145
93
45
13
41
1,751
5+ children
145
2
164
41
8
10
4
6
380
4,036
1,549
2,368
725
655
196
119
284
9,932
Total households with a placement
%
1 child
47.5
71.9
42.5
43.2
53.6
45.9
53.8
59.2
50.6
2 children
29.2
22.3
28.1
31.2
31.0
26.0
31.9
24.3
28.0
3–4 children
19.7
5.6
22.4
20.0
14.2
23.0
10.9
14.4
17.6
5+ children
3.6
0.1
6.9
5.7
1.2
5.1
3.4
2.1
3.8
100.0
100.0
100.0
100.0
100.0
100.0
100.0
100.0
100.0
Total households with a placement
(a)
Queensland data exclude provisionally approved carer households.
(b)
Aggregate data were provided for the Northern Territory.
Notes
1.
Percentages exclude households where the number of children placed was unknown.
2.
Percentages in the table may not add to 100 due to rounding.
Source: AIHW Child Protection Collection 2014.
102
Child protection Australia 2013–14
Table A36: Relative/kinship carer households with a placement at 30 June 2014, by number of
children placed
Number of
children
NSW
Vic
Qld(a)
WA
SA
Tas
ACT
NT(b)
Total
Number
1 child
3,662
1,889
727
600
477
131
129
81
7,696
2 children
1,603
511
326
254
201
54
48
28
3,025
3–4 children
895
252
207
148
75
15
21
23
1,636
5+ children
139
20
24
29
7
2
3
2
226
6,299
2,672
1,284
1,031
760
202
201
134
12,583
Total
households
%
1 child
58.1
70.7
56.6
58.2
62.8
64.9
64.2
60.4
61.2
2 children
25.4
19.1
25.4
24.6
26.4
26.7
23.9
20.9
24.0
3–4 children
14.2
9.4
16.1
14.4
9.9
7.4
10.4
17.2
13.0
5+ children
2.2
0.7
1.9
2.8
0.9
1.0
1.5
1.5
1.8
100.0
100.0
100.0
100.0
100.0
100.0
100.0
100.0
100.0
Total
households
(a)
Queensland data exclude provisionally approved carer households. Queensland data only include those kinship carers where there is an
‘open placement’ event for a child on the reference date. In some cases, a child can have more than one open placement event (for
example, as part of respite care arrangements where more than one kin is approved to care for the child).
(b)
Aggregate data were provided for the Northern Territory.
Note: Percentages in the table may not add to 100 due to rounding.
Source: AIHW Child Protection Collection 2014.
Child protection Australia 2013–14
103
Intensive family support services
Table A37: Children commencing intensive family support services, by living arrangements at
commencement of service, states and territories, 2013–14 (%)
Living situation
NSW (a)
Vic
Qld
WA(b)
SA(c)
Family care
Tas(c)(d)
ACT
NT(b)
Total
..
..
96.6
90.4
69.0
84.8
..
..
84.1
92.7
88.3
0.1
0.3
4.8
4.4
..
..
4.3
2.7
1.5
Children in out-of-home care
3.3
0.1
25.6
9.8
..
..
10.6
4.7
7.6
Children in shared care
0.0
0.0
0.4
1.0
..
..
0.0
0.0
0.1
Other
0.0
9.1
0.3
0.1
..
..
1.0
0.0
2.5
Total
100.0
100.0
100.0
100.0
..
..
100.0
100.0
100.0
Children living with parents
Children living with other
relatives/kin
(a)
Limited information was available for some services in New South Wales in 2013–14.
(b)
Data for Western Australia includes 5 children aged 18 and over.
(c)
South Australia and Tasmania were not able to provide these data for 2013–14.
(d)
Services in Tasmania are provided under the title of Integrated Family Support Services.
Notes
1.
Percentages exclude children whose living arrangement was not available.
2.
Percentages in the table may not add to 100 due to rounding.
Source: AIHW Child Protection Collection 2014.
104
Child protection Australia 2013–14
National trend data
Table A38: National child protection trend data, 2009–10 to 2013–14(a)
2009–10
2010–11
2011–12
2012–13
2013–14
Number
Notifications
286,437
237,273
252,962
272,980
304,097
Investigations
162,321
127,759
116,528
122,496
137,585
46,187
40,466
48,420
53,666
54,438
187,314
163,767
173,502
184,216
198,966
31,295
31,527
37,781
40,571
40,844
37,730
39,058
40,962
43,136
45,746
35,895
37,648
39,621
40,549
43,009
Substantiations
Children in notifications
Children in substantiations
Children on care and protection orders(b)
(b)
Children in out-of-home care
Number per 1,000 children
Notifications
..
..
..
..
..
Investigations
..
..
..
..
..
Substantiations
..
..
..
..
..
37.2
32.3
33.8
35.4
37.8
6.2
6.2
7.4
7.8
7.8
7.5
7.7
7.9
8.2
8.7
7.1
7.4
7.7
7.7
8.1
Children in notifications
Children in substantiations
Children on care and protection orders
(b)
(b)
Children in out-of-home care
(a)
Rates were calculated using revised population estimates based on the 2011 Census (see tables S1 and S2) and should not be compared
with rates calculated using populations or projections based on previous Censuses, including those published in previous editions of Child
protection Australia.
(b)
Children on care and protection orders and in out-of-home care are measured as at 30 June each year.
Source: AIHW Child Protection Collections 2009–10 to 2013–14.
Child protection Australia 2013–14
105
Table A39: Children in the child protection system, by Indigenous status, 2010 to 2014
2010
2011
2012
2013
2014
Number
Indigenous children
Children in substantiations
(a)
Children on care and protection orders
(b)
(b)
Children in out-of-home care
8,334
8,231
10,058
10,991
11,270
11,451
12,280
13,268
14,455
15,504
11,468
12,358
13,299
13,952
14,991
Non-Indigenous children
Children in substantiations
(a)
Children on care and protection orders
(b)
(b)
Children in out-of-home care
22,335
22,144
26,183
28,106
28,149
26,215
26,531
27,531
28,480
30,034
24,279
24,929
26,127
26,422
27,827
All children
Children in substantiations
(a)
Children on care and protection orders
(b)
(b)
Children in out-of-home care
(c)
31,295
31,527
37,781
40,571
40,844
37,730
39,058
40,962
43,136
45,746
35,895
37,648
39,621
40,549
43,009
Number per 1,000 children
Indigenous children
Children in substantiations(a)
Children on care and protection orders
(b)
(b)
Children in out-of-home care
29.5
28.9
35.1
38.1
38.8
40.3
43.0
46.1
49.9
53.1
40.4
43.2
46.2
48.2
51.4
Non-Indigenous children
Children in substantiations
(a)
Children on care and protection orders
(b)
(b)
Children in out-of-home care
4.7
4.6
5.4
5.7
5.7
5.5
5.5
5.6
5.8
6.0
5.1
5.2
5.4
5.3
5.6
All children
Children in substantiations
(a)
Children on care and protection orders
(b)
(b)
Children in out-of-home care
(c)
6.2
6.2
7.4
7.8
7.8
7.5
7.7
7.9
8.2
8.7
7.1
7.4
7.7
7.7
8.1
(a)
Children in substantiations are measured in financial years (2009–10, 2010–11, 2011–12, 2012–13 and 2013–14).
(b)
Children on care and protection orders and in out-of-home care are measured as at 30 June each year.
(c)
‘All children’ includes children of unknown Indigenous status: as such, total may not equal the sum of categories.
Notes
1.
‘Children in substantiations’ includes unborn children and children of unknown age.
2.
‘Children on care and protection orders’ and ‘children in out-of-home care’ include children of unknown age.
3.
Rates were calculated using revised population estimates based on the 2011 Census (see tables S1 and S2) and should not be compared
with rates calculated using populations or projections based on previous Censuses, including those published in previous editions of Child
protection Australia.
Source: AIHW Child Protection Collections 2009–10 to 2013–14.
106
Child protection Australia 2013–14
Table A40: Children who were the subjects of substantiations, by age group, 2009–10 to
2013–14
Age group (years)
2009–10
2010–11
2011–12
2012–13
2013–14
<1
3,919
3,562
3,862
4,356
4,488
1–4
7,935
8,054
9,908
10,368
10,268
5–9
8,227
8,338
10,380
11,192
11,665
10–14
8,263
8,130
9,381
10,205
10,039
15–17
2,405
2,536
2,771
2,997
3,065
0–17
31,295
31,527
37,781
40,571
40,844
Notes
1.
Some data may not match those published in previous Child protection Australia publications due to retrospective updates to data.
2.
The ‘less than 1’ category excludes unborn children.
3.
Total for the 0–17 age group includes children of unknown age and may not equal the sum of age categories.
Source: AIHW Child Protection Collections 2009–10 to 2013–14.
Child protection Australia 2013–14
107
Table A41: Children who were the subjects of substantiations, by abuse type and sex, 2009–10 to
2013–14
Type of abuse or neglect
2009–10
2010–11
2011–12
2012–13
2013–14
Boys
Physical abuse
3,652
3,681
4,065
4,299
4,135
Sexual abuse
1,134
1,305
1,525
1,842
1,874
Emotional abuse
5,823
5,571
6,940
7,627
7,959
Neglect
4,416
4,473
5,587
5,745
5,727
Girls
Physical abuse
3,473
3,442
3,848
3,848
3,709
Sexual abuse
3,010
3,101
3,250
3,563
3,679
Emotional abuse
5,658
5,646
6,991
7,712
7,982
Neglect
3,927
4,008
5,231
5,385
5,294
All children
(a)
Physical abuse
7,169
7,186
7,980
8,214
7,906
Sexual abuse
4,155
4,427
4,801
5,421
5,581
11,549
11,290
14,024
15,464
16,093
8,422
8,570
10,936
11,303
11,194
Emotional abuse
Neglect
(a)
‘All children’ includes children whose sex was unknown.
Source: AIHW Child Protection Collections 2009–10 to 2013–14.
108
Child protection Australia 2013–14
Table A42: Trends in children on care and protection orders, states and territories, 30 June 2010
to 30 June 2014
NSW(a)
Year
Vic
Qld
WA(b)
SA
Tas(c)
ACT
NT
Total
Number
2010
14,689
6,515
8,090
3,432
2,543
1,112
653
696
37,730
2011
15,339
6,735
8,456
3,277
2,620
1,186
723
722
39,058
2012
15,981
7,262
8,863
3,492
2,680
1,185
719
780
40,962
2013
16,373
7,751
9,211
4,260
2,798
1,253
674
816
43,136
2014
17,242
9,233
9,131
4,471
2,786
1,188
705
990
45,746
(a)
New South Wales data do not include children on finalised supervisory orders.
(b)
Data for 2009–10 for Western Australia are not comparable with other years due to the introduction of a new client information system in
March 2010. Proxy data were provided for that year.
(c)
Data for Tasmania may not be comparable year to year due to considerable data lag with the recording of order status.
Note: Some data may not match those published in previous Child protection Australia publications due to retrospective updates to data.
Source: AIHW Child Protection Collections 2009–10 to 2013–14.
Table A43: Trends in children admitted to care and protection orders, states and territories,
2009–10 to 2013–14
NSW(a)
Vic
Qld(b)
WA(c)
SA
Tas
ACT
NT
Total
2009–10
3,381
3,057
4,318
1,364
1,095
622
331
396
14,564
2010–11
3,006
3,151
4,353
1,238
966
570
207
339
13,830
2011–12
3,017
3,118
4,282
1,619
936
638
183
398
14,191
2012–13
2,756
3,741
4,368
926
513
381
128
333
13,146
2013–14
2,995
4,210
3,808
908
457
282
141
370
13,171
Year
(d)
(a)
New South Wales data do not include children on finalised supervisory orders. New South Wales is working to improve the way it counts
admissions to care and protection orders. New South Wales currently does not strictly conform to the national counting rules.
(b)
In Queensland, previous admissions to care and protection orders in other jurisdictions could not be counted.
(c)
Data for 2009–10 for Western Australia are not comparable with other years due to the introduction of a new client information system in
March 2010. Proxy data were provided for that year.
(d)
Data prior to 2012–13 may not be comparable to subsequent years due to a difference in the methodology used for determining admissions
from 2012–13 onwards.
Notes
1.
A renewal of an existing order is not counted as an admission. If a new care and protection order is applied in 5 days or less of the
discharge of another order (regardless of the type of order), an admission is not counted.
2.
Each child is counted for one admission for the year
Source: AIHW Child Protection Collections 2009–10 to 2013–14.
Child protection Australia 2013–14
109
Table A44: Trends in children discharged from care and protection orders, states and territories,
2009–10 to 2013–14
NSW(a)
Vic
Qld(b)
WA(c)
SA
Tas(d)
ACT
NT
Total
2009–10
2,003
1,663
2,363
627
495
188
160
292
7,791
2010–11
2,086
1,662
2,185
397
512
221
128
289
7,480
2011–12
2,238
3,017
2,603
361
420
356
134
349
9,478
2012–13
2,060
3,680
2,018
713
465
375
175
309
9,795
2013–14
2,052
4,154
2,091
770
494
381
111
222
10,275
Year
(a)
New South Wales data do not include children on finalised supervisory orders.
(b)
In Queensland during 2012–13, reporting on children subject to an order continued under Section 99 of the Child Protection Act 1999 was
enhanced. When a child is subject to an order granting custody or guardianship to the Chief Executive or to a member of the child’s family,
Section 99 allows for the original order to continue until an application is decided by the court for an extension or for another order.
Previously, some children subject to orders continued under Section 99 were not included in the count. As a result, the number of children
discharged from orders has decreased and is not comparable to previous years.
(c)
Data for 2009–10 for Western Australia are not comparable with other years due to the introduction of a new client information system in
March 2010. Proxy data were provided for that year.
(d)
Data for Tasmania may not be comparable year to year due to considerable data lag with the recording of order status.
Note: For the purposes of this table, if a child is on multiple care and protection orders/arrangements, all orders/arrangements must be discharged
before a discharge is counted. If a new care and protection order is applied in 5 days or less of the discharge of another order (regardless of
the type of order), a discharge is not counted.
Source: AIHW Child Protection Collections 2009–10 to 2013–14.
Table A45: Trends in children admitted to out-of-home care, states and territories, 2009–10 to
2013–14
Year
NSW
Vic
Qld
WA(a)
SA
Tas
ACT
NT
Total
2009–10
3,922
3,112
2,618
838
644
334
168
366
12,002
2010–11
3,542
3,067
2,644
879
583
298
244
356
11,613
2011–12
3,407
3,526
2,671
1,088
618
284
247
399
12,240
2012–13
3,038
3,204
2,551
1,107
569
304
203
365
11,341
2013–14
3,248
3,210
2,266
1,100
445
208
214
394
11,085
(a)
Data for 2009–10 for Western Australia are not comparable with other years due to the introduction of a new client information system in
March 2010. Proxy data were provided for that year.
Note: This table includes all children admitted to out-of-home care for the first time in the period, as well as those children returning to care who
had exited care 60 days or more previously. Children admitted to out-of-home care more than once during the year were only counted at the
first admission.
Source: AIHW Child Protection Collections 2009–10 to 2013–14.
110
Child protection Australia 2013–14
Population data
Table A46: Population of children aged 0–17, by age group and Indigenous status, December 2013
Age group
(years)
NSW
Vic
Qld
WA
SA
Tas
ACT
NT
Total
Indigenous children
0–4
26,253
6,163
25,567
10,333
4,568
3,035
772
7,230
83,948
5–9
25,640
5,708
24,299
10,624
4,467
2,991
618
7,740
82,111
10–14
24,297
5,490
22,907
10,190
4,277
2,797
630
7,517
78,133
15–17
15,087
3,341
13,406
5,805
2,597
1,744
392
4,206
46,596
0–17
91,276
20,701
86,179
36,951
15,908
10,567
2,410
26,693
290,787
Non-Indigenous children
0–4
463,186
364,593
290,877
159,529
95,611
28,156
25,615
11,806
1,439,496
5–9
443,708
348,150
288,999
152,711
94,141
28,886
22,928
10,134
1,389,785
10–14
423,405
329,020
276,873
143,427
92,970
28,929
20,822
9,457
1,325,056
15–17
258,768
204,132
169,510
88,970
58,757
18,305
12,836
5,430
816,800
1,589,066
1,245,894
1,026,259
544,636
341,478
104,276
82,199
36,827
4,971,136
0–17
All children
0–4
489,438
370,755
316,444
169,862
100,178
31,191
26,386
19,036
1,523,444
5–9
469,347
353,857
313,298
163,334
98,607
31,876
23,545
17,873
1,471,895
10–14
447,701
334,509
299,779
153,617
97,247
31,726
21,451
16,974
1,403,189
15–17
273,855
207,473
182,916
94,774
61,354
20,049
13,227
9,636
863,395
1,680,341
1,266,594
1,112,437
581,587
357,386
114,842
84,609
63,519
5,261,923
0–17
Notes
1.
The December 2013 populations for Indigenous children is the average of 30 June 2013 and 30 June 2014 population projections. This
methodology may result in the sum of age groups not equalling the total due to rounding.
2.
Totals are not equal to the sum of the state/territory populations as external territories have been included in the totals.
Sources: ABS 2014a, 2014c.
Child protection Australia 2013–14
111
Table A47: Population of children aged 0–17, by age group and Indigenous status, June 2014
Age group
(years)
NSW
Vic
Qld
WA
SA
Tas
ACT
NT
Total
Indigenous children
0–4
26,396
6,235
25,706
10,360
4,595
3,036
784
7,226
84,369
5–9
25,848
5,757
24,579
10,675
4,495
3,056
611
7,690
82,738
10–14
24,150
5,466
23,050
10,160
4,278
2,778
638
7,566
78,114
15–17
15,078
3,396
13,349
5,834
2,634
1,763
391
4,220
46,685
0–17
91,472
20,854
86,684
37,029
16,002
10,633
2,424
26,702
291,906
Non-Indigenous children
0–4
459,397
368,846
291,274
161,351
96,226
27,948
26,086
11,912
1,443,169
5–9
448,420
352,240
292,344
154,829
94,925
29,117
23,186
10,240
1,405,432
10–14
424,667
330,730
277,909
143,887
92,799
28,672
20,831
9,413
1,329,064
15–17
258,728
203,954
169,652
89,267
58,643
18,323
12,770
5,451
816,878
1,591,212
1,255,770
1,031,179
549,334
342,593
104,060
82,873
37,016
4,994,543
0–17
All children
0–4
485,793
375,081
316,980
171,711
100,821
30,984
26,870
19,138
1,527,538
5–9
474,268
357,997
316,923
165,504
99,420
32,173
23,797
17,930
1,488,170
10–14
448,817
336,196
300,959
154,047
97,077
31,450
21,469
16,979
1,407,178
15–17
273,806
207,350
183,001
95,101
61,277
20,086
13,161
9,671
863,563
1,682,684
1,276,624
1,117,863
586,363
358,595
114,693
85,297
63,718
5,286,449
0–17
Note: Totals are not equal to the sum of the state/territory populations as external territories have been included in the totals.
Sources: ABS 2014b, 2014c.
112
Child protection Australia 2013–14
Table A48: Population of all children aged 0–17, by age group, December 2013
Age group
(years)
NSW
Vic
Qld
WA
SA
Tas
ACT
NT
Total
<1
98,810
74,666
62,852
34,228
19,943
6,011
5,563
3,928
306,031
1–4
390,628
296,089
253,592
135,634
80,235
25,180
20,823
15,108
1,217,413
5–9
469,347
353,857
313,298
163,334
98,607
31,876
23,545
17,873
1,471,895
10–14
447,701
334,509
299,779
153,617
97,247
31,726
21,451
16,974
1,403,189
15–17
273,855
207,473
182,916
94,774
61,354
20,049
13,227
9,636
863,395
1,680,341
1,266,594
1,112,437
581,587
357,386
114,842
84,609
63,519
5,261,923
All children
0–17
Note: Totals are not equal to the sum of the state/territory populations as external territories have been included in the totals.
Source: ABS 2014a.
Table A49: Population of all children aged 0–17, by age group, June 2014
Age group
(years)
NSW
Vic
Qld
WA
SA
Tas
ACT
NT
Total
<1
92,679
75,113
62,146
34,648
19,985
5,999
5,690
3,981
300,275
1–4
393,114
299,968
254,834
137,063
80,836
24,985
21,180
15,157
1,227,263
5–9
474,268
357,997
316,923
165,504
99,420
32,173
23,797
17,930
1,488,170
10–14
448,817
336,196
300,959
154,047
97,077
31,450
21,469
16,979
1,407,178
15–17
273,806
207,350
183,001
95,101
61,277
20,086
13,161
9,671
863,563
1,682,684
1,276,624
1,117,863
586,363
358,595
114,693
85,297
63,718
5,286,449
All children
0–17
Note: Totals are not equal to the sum of the state/territory populations as external territories have been included in the totals.
Source: ABS 2014b.
Table A50: Population of children aged 0–17, by Indigenous status and age group, June 2014
Indigenous status
<1
1–4
5–9
10–14
15–17
0–17
17,654
66,715
82,738
78,114
46,685
291,906
Non-Indigenous
282,621
1,160,548
1,405,432
1,329,064
816,878
4,994,543
All children
300,275
1,227,263
1,488,170
1,407,178
863,563
5,286,449
Indigenous
Source: ABS 2014b.
Child protection Australia 2013–14
113
Appendix B: Technical notes
Population data
The ABS has recently revised the methodology used to obtain estimates of the resident
population for Indigenous and non-Indigenous children. This resulted in an increase in
estimates of the number of Indigenous Australians based on the 2011 Census compared with
those based on the 2006 Census (see ABS 2013a). Consequently this means that rates
calculated with the 2011 Indigenous population estimates are lower than those based on the
2006 Census.
To maintain consistency in the denominator and allow comparisons over time, all rates for
the period 2009–10 to 2013–14 have been calculated using the 2011 Census-based population
estimates, including back-cast historical estimates. Therefore, rates presented in this report
are not comparable to rates calculated using estimates based on the 2006 Census, including
those published in previous editions of Child protection Australia.
Calculation of rates
Rates for ‘All children’
The rates for ‘All children’ on care and protection orders and ‘All children’ in out-of-home
care were calculated using the ABS most recent population estimates for 30 June 2014 (ABS
2014b). The rate of ‘All children’ who were the subjects of child protection substantiations
during 2013–14 were calculated using the ABS population estimates for 31 December 2013
(ABS 2014a).
Rates of children on care and protection orders were calculated in the following way:
Number of children aged 0–17 on care and protection orders at 30 June 2014
× 1,000
ABS estimated population of children aged 0–17 at 30 June 2014
Rates of children in out-of-home care were calculated in the following way:
Number of children aged 0–17 in out-of-home care at 30 June 2014
× 1,000
ABS estimated population of children aged 0–17 at 30 June 2014
Rates of children who were the subjects of child protection substantiations were
calculated in the following way:
Number of children aged 0–17 who were the subjects of substantiations in 2013–14
× 1,000
ABS estimated population aged 0–17 at 31 December 2013
Note that legislation and practice differs across jurisdictions in relation to children aged 17.
In some jurisdictions, children aged 17 are not substantiated and this means the number per
1,000 children who were the subjects of substantiations may be lower for those jurisdictions.
Where substantiation rates are calculated for the ‘less than 1’ and ‘0–17’ age groups, unborn
children are excluded; these children are included in the calculation of substantiation rates
for ‘All children’. As population estimates do not include unborn children, the ‘All children’
rate may represent a slight overestimate.
114
Child protection Australia 2013–14
Rates for ‘Indigenous’ and ‘non-Indigenous’ children
The same basic method outlined above was used to calculate the rates for Indigenous and
non-Indigenous children; however, different methodologies were used to determine the
denominators.
Rates for Indigenous children on care and protection orders and Indigenous children in
out-of-home care were calculated using the Indigenous population estimates for 30 June 2014
(ABS 2014c).
The rate of Indigenous children who were the subjects of child protection substantiations
during 2013–14 was calculated using the average of the 30 June 2013 and 30 June 2014
Indigenous population estimates (ABS 2014c), as a proxy for 31 December 2013.
Non-Indigenous population estimates are derived by subtracting the Indigenous population
estimates from the ‘All children’ population estimates.
Rates for states and territories with small numbers of children in their child protection data
and small Indigenous populations (notably the Australian Capital Territory and Tasmania)
should be interpreted carefully. Small changes in the numbers of Indigenous children in the
child protection systems, or in population estimates, can have a large impact on rates.
Rate ratio
Rates can be compared using a rate ratio, which is the ratio of 2 rates. Rate ratios should be
interpreted with caution where there are small denominators or a large proportion of data is
recorded as ‘unknown’. In Child protection Australia reporting, rate ratios are mainly used to
compare Indigenous and non-Indigenous rates and to provide a measure of the level of
Indigenous over-representation. Rates are also presented to guide interpretation.
Rate ratios are not calculated where one or both of the rates have fewer than 5 young people
in the numerator.
Age
Age is always calculated in complete years. For example, a child who was 5 years and 9
months old is recorded as being 5 years of age.
Throughout Child protection Australia 2013–14, the AIHW has calculated age at different
points in time for a child, depending on the analysis in question.
•
For 30 June analyses, age is calculated as at 30 June 2014.
•
For analyses of events occurring during the year, age is calculated at the relevant point in
time during 2013–14:
•
–
For analyses of children who were the subject of a child protection notification or
substantiation, age is calculated at the earliest date of notification during the period.
–
For analyses of children who were admitted to, or discharged from, a care and
protection order or an out-of-home care placement, age is calculated at the date of
first admission and first discharge during the period.
For analyses of children receiving child protection services, age is calculated at the
earliest point of contact during 2013–14 or at 1 July 2013 if the child was on an ongoing
care and protection order or in an ongoing out-of-home care placement at the beginning
of the period.
Child protection Australia 2013–14
115
•
For ‘average day’ analyses, age is calculated on each day of the event being analysed.
This means that a child or young person can potentially contribute to the reported
averages for two different ages if the event being analysed spanned either side of their
birthday. For example, a 4 year old child, whose birthday is 19 May, is placed on a care
and protection order on 1 May until 31 May. For the days prior to their birthday the
child would contribute to the reported average with an age of 4. From the day of their
birthday until the end of the order, the child would contribute to the reported average
with an age of 5.
Average and median
Two measures of ‘central tendency’ (the central value or typical value for a probability
distribution) are reported in Child protection Australia 2013–14:
•
Average (mean)—the average, or mean, is calculated by summing all of the values and
dividing by the number of observations. In Child protection Australia, averages are used in
the reporting of ‘average day’ numbers (see below) and the average co-occurrence of
abuse and neglect.
•
Median—the middle value of a set of observations, when arranged in order of value.
Medians are often reported where data are not normally distributed, or include extreme
values that would distort the average. In Child protection Australia, median age is
reported for several aspects of the child protection system, including children receiving
child protection services and children admitted to, and discharged from, out-of-home
care.
Identification of Indigenous status
Children
The practices used to identify and record the Indigenous status of children vary across states
and territories, with some jurisdictions recording large numbers of unknowns. No state or
territory can validate the data on Indigenous children by other means and the quality of the
data is therefore unknown.
In this collection, children are counted as Indigenous if they are identified as such in the state
and territory data collections. Children whose Indigenous status is recorded as ‘unknown’
are excluded, where possible, from calculations of rates and proportions. The counts for
Indigenous children are therefore likely to be an underestimate of the actual number of
Indigenous children in the child protection system.
Prior to 2009–10, notifications, investigations and substantiations data for non-Indigenous
children included children of unknown Indigenous status. The compilation of time series
data using previously published reports should acknowledge a break in the time series
between 2008–09 and 2009–10 when reporting by Indigenous status.
Caregivers
In the out-of-home care data collection, the Indigenous status of caregivers was collected as
well as the Indigenous status of children in out-of-home care. Carers who are identified as
Aboriginal and Torres Strait Islander Australians are included in the Indigenous category.
116
Child protection Australia 2013–14
Where the Indigenous children were living in facility-based care specifically for Indigenous
children, the caregiver was counted as Indigenous. Where children were living in other types
of facility-based care, the caregiver was not counted as Indigenous.
Points of analysis
Average day
Counts of people subject to an event (such as a type of child protection order) on an average
day are calculated by summing the number of days each person was subject to the same
event during the year and dividing this total by the number of days in the financial year.
For example, the number of children and young people subject to a finalised guardianship or
custody order on an average day is calculated by summing the number of days each child or
young person was on this order type during the year and dividing this total by the number
of days in the financial year.
For the number on an average day, components may not sum to the total as:
•
people can experience different types of events on the same day (for example, 2 different,
consecutive child protection orders).
•
a person may change age part way through an event.
•
the number on an average day is rounded to the nearest whole person.
For example, if there are 3.4 girls on an average day and 3.4 boys on an average day, the total
is 6.8 children and young people. When these numbers are rounded, the corresponding table
would show a count of 3 girls, 3 boys and a total of 7 children and young people.
During the year
Counts of people during the year are calculated by counting each distinct person subject to
the event of interest during the financial year. Each person is counted only once, even if they
had multiple occurrences of the event during the year. For example, when calculating the
number of children and young people who were the subjects of substantiations of child
protection notifications during the year, a child or young person will be counted if a
notification received during the financial year was substantiated, but will only contribute a
count of 1 regardless of how many notification were substantiated for them in the financial
year.
30 June (at the end of the financial year)
Counts of people at 30 June are calculated by counting each distinct person for whom the
event of interest was ongoing at the end of the financial year. Each person is counted only
once, even if they had multiple occurrences of the event ongoing at 30 June. In instances
where a child or young person has multiple child protection orders ongoing at 30 June, the
child or young person is counted against the national order type that represented the highest
level of intervention. In instances where a child or young person has multiple living
arrangements ongoing at 30 June, the child or young person is counted against the living
arrangement type that is considered their usual placement.
For example, when calculating the number of children and young people on a care and
protection order at 30 June, a child or young person will be counted if they were on a care
Child protection Australia 2013–14
117
and protection order during the reporting period and the order had not ended, or ended
after 30 June. If the child or young person had an ongoing finalised guardianship order and
an ongoing interim order at 30 June, they would be counted in the finalised guardianship
order category, as this represents the higher level of intervention of the 2 orders.
Socioeconomic status
Child protection Australia reporting uses the Socio-Economic Indexes for Areas (SEIFA),
developed by ABS to analyse SES (ABS 2013b).
The SEIFA comprises 4 indexes that are constructed using information from the 5-yearly
Census of Population and Housing. These 4 indexes are the Index of Relative
Socio-Economic Disadvantage; the Index of Relative Socio-Economic Advantage and
Disadvantage; the Index of Economic Resources; and the Index of Education and
Occupation.
The Index of Relative Socio-Economic Advantage and Disadvantage (IRSAD) is used to
compare the average level of socioeconomic advantage and disadvantage. IRSAD is the
SEIFA index used in this report, ranking geographic areas on a continuum from ‘most
disadvantaged’ to ‘least disadvantaged’ using a combination of income, education,
employment, occupation, housing and other Census variables (ABS 2013b). These Census
variables relate to both advantage and disadvantage, including low levels of income and
education, as well as high levels of education and income. This index can be used to measure
both disadvantage and advantage. A high score indicates a relatively high level of advantage
and a relatively low level of disadvantage. An area containing some relatively disadvantaged
people and some relatively advantaged people may have a low score on the Index of Relative
Socio-Economic Disadvantage, due to the levels of disadvantage, but a relatively high score
on the IRSAD, due to the existence of both advantage and disadvantage. Population-based
quintiles are used.
SES is measured by allocating the relevant SEIFA population-based (2011 population)
quintile score to postcode information available for the child or young person. Invalid,
missing or unknown postcodes of last known home address were excluded from the
analysis.
Some postcode areas were split between 2 or more areas with different SEIFA scores. Where
this was the case, the data were weighted according to the proportion of the population of
the postcode area in each SEIFA area.
The SEIFA represents the average of all people living in the area, and not the SES of a
particular individual living in the area. Therefore, socioeconomic analyses in Child protection
Australia reporting indicate the level of socioeconomic advantage and disadvantage in the
area corresponding to the postcode information available for the child or young person, not
the level of socioeconomic advantage and disadvantage of the child or young person or their
family.
If inferences are made about individuals in an area based purely on SEIFA (the
characteristics of the area in which they live) they could be misleading. This brings the
potential for error in any conclusions, referred to as the ecological fallacy. Area-level and
individual-level socioeconomic disadvantage are interrelated but distinct concepts, and thus
are measured differently. Using their Socio-Economic Index for Individuals (SEIFI), the ABS
has found that the Northern Territory and the Australian Capital Territory have the greatest
proportions of highly socioeconomically diverse neighbourhoods, and, as an aggregate
118
Child protection Australia 2013–14
measure, SEIFA only captures a fraction of the true level of disadvantage being experienced
in these jurisdictions. SEIFA information used at a suburb or postcode level can have the
effect of minimising the actual levels of disadvantage in some areas (ABS 2011).
Child protection Australia 2013–14
119
Appendix C: Data quality statement: Child
Protection National Minimum Data Set
Summary of key issues
•
The Child Protection National Minimum Data Set (CP NMDS), implemented for
reporting from 2012–13, was the main data source for this report.
•
The CP NMDS contains information on:
–
notifications, investigations and substantiations
–
care and protection orders
–
out-of-home care
–
foster carers
–
relative/kinship carers.
Data relating to intensive family support services are also reported in Child protection
Australia, but are based on a separate aggregate collection.
•
The AIHW compiles the national collection each year using data extracted from the
administrative systems of the state and territory departments responsible for child
protection. Data represent a ‘snapshot’ of the data at the time of extraction and may not
include retrospective updates made to data held by state/territory departments. As
such, national data included in this report may not match state/territory data.
•
Unit record level data were not available for New South Wales and Queensland in
2013–14; aggregate data have been reported.
•
Overall, the quality and coverage of data in the child protection data collection are good.
However, data availability issues mean a small number of tables in the collection do not
provide fully national data; and in relation to substantiated child abuse and neglect, in
some jurisdictions, there is a high proportion of children whose Indigenous status is
unknown for some jurisdictions.
•
Differences in jurisdictional policy, practice, legislation and data systems must be taken
into consideration when interpreting all child protection data (see Appendixes D–I
(online) <http://www.aihw.gov.au/publication-detail/?id=60129550762> of Child
protection Australia 2013–14).
•
All rates in this report were calculated using the 2011 Census-based population
estimates, including back-cast historical estimates. Therefore, rates presented in this
report are not comparable to rates calculated using estimates based on the 2006 Census,
including those published in previous editions of Child protection Australia.
•
Some data included in this report may not match data reported in the RoGS due to
retrospective updates to state/territory data and differences in the data extraction and
analysis methodologies.
Description
In Australia, statutory child protection is the responsibility of state and territory
governments. Each state and territory department responsible for child protection provides
120
Child protection Australia 2013–14
assistance to vulnerable children who are suspected of being abused, neglected, or otherwise
harmed, or whose parents are unable to provide adequate care or protection.
A number of government and non-government organisations share a common duty of care
towards the protection of children and young people. Departments responsible for child
protection investigate, process and oversee the handling of child protection cases. Assistance
is provided to children and their families through the provision of, or referral to, a wide
range of services.
The data for this collection are collected from each of the 8 state and territory departments
responsible for child protection, and the AIHW collates and analyses these data. The CP
NMDS was implemented in 2012–13. The data are extracted from the administrative systems
of the state and territory departments according to definitions and technical specifications to
which those departments and the AIHW have agreed. This data collection represents the
only national source of child protection data.
The collection is a part of the child welfare series of reporting. Ongoing funding of this series
is specified in the Memorandum of Understanding between the AIHW and state and
territory departments responsible for children and families services and the associated 3-year
Schedule (2014–2016) for national child protection work. Work is overseen by informal
working groups, including the Children and Families Data Network.
Institutional environment
The AIHW is a major national agency set up by the Australian Government under the
Australian Institute of Health and Welfare Act 1987 to provide reliable, regular and relevant
information and statistics on Australia's health and welfare. It is an independent corporate
Commonwealth entity established in 1987, governed by a management board and
accountable to the Australian Parliament through the Health and Ageing portfolio.
The AIHW aims to improve the health and wellbeing of Australians through better health
and welfare information and statistics. It collects and reports information on a wide range of
topics and issues, ranging from health and welfare expenditure, hospitals, disease and
injury, and mental health, to ageing, homelessness, disability and child protection.
The Institute also plays a role in developing and maintaining national metadata standards.
This work contributes to improving the quality and consistency of national health and
welfare statistics. The Institute works closely with governments and non-government
organisations to achieve greater adherence to these standards in administrative data
collections to promote national consistency and comparability of data and reporting.
One of the main functions of the AIHW is to work with the states and territories to improve
the quality of administrative data and, where possible, to compile national data sets based on
data from each jurisdiction, to analyse these data sets and disseminate information and
statistics.
The Australian Institute of Health and Welfare Act 1987, in compliance with the Privacy Act 1988
(Cth), ensures that the data collections managed by the AIHW are kept securely and under
the strictest conditions with respect to privacy and confidentiality.
For further information see the AIHW website <www.aihw.gov.au>.
Child protection Australia 2013–14
121
Timeliness
The reference period for the 2013–14 Child Protection Collection is from 1 July 2013 to
30 June 2014. Data relating to child protection investigations includes investigation outcomes
recorded up until 31 August 2014, to maximise the currency of these data items.
The state and territory departments responsible for child protection provide data to the
AIHW annually, after the end of each financial year. For the 2013–14 collection, the first
iteration of data was due to the AIHW by 31 October 2014, and data were finalised for all
states and territories in December 2014. Data from the 2013–14 Child Protection Collection
were published in May 2015.
The data for each collection period are released in the AIHW’s Child protection Australia
annual publication.
Accessibility
Publications containing national child protection data, including the annual Child protection
Australia reports, are available on the AIHW website <http://www.aihw.gov.au/childprotection/>. These reports are available free of charge. Concurrent with the annual
publication, key findings are also presented online.
Requests for unpublished data can be made by contacting the AIHW. See
<http://www.aihw.gov.au/data/>. A cost-recovery charge may apply to requests that take
substantial resources to compile. Depending on the nature of the request, requests for access
to unpublished data may require approval from the state and territory data custodians
and/or the AIHW Ethics Committee.
General inquiries about AIHW publications can be made to the Digital and Media
Communications Unit on (02) 6244 1032 or via email to [email protected].
Interpretability
Supporting information on relevant mandatory reporting requirements, legislation,
jurisdictional policy and data systems are presented in the Appendixes D–I (online)
<http://www.aihw.gov.au/publication-detail/?id=60129550762> of the Child protection
Australia reports. Supporting information is also provided in the footnotes accompanying
tables and the report Glossary. Chapter 1 of the report provides an overview of the child
protection process and data collection. Readers are advised to consider all supporting and
contextual information to ensure appropriate interpretation of analyses that the AIHW
presents.
Metadata for the Child Protection Collection is currently being updated for entry on to
METeOR, the AIHW’s online metadata repository.
Relevance
The Child Protection Collection is the authoritative source of national Australian child
protection data.
The collection includes several modules on notifications, investigations and substantiations;
care and protection orders; out-of-home care, foster and relative/kinship carers; and
intensive family support services. Where available, these collections provide information on
122
Child protection Australia 2013–14
children within each system and the child protection cases, placements and households
relating to children.
The overlaps between the 3 primary modules (notifications, investigations and
substantiations; care and protection orders; and out-of-home care) have also been analysed at
the national level. The collection has a range of information about children who come into
contact with the child protection system, including their age, sex, Indigenous status and
living arrangements. Data are also collected on the main type of substantiated abuse or
neglect that has occurred: physical abuse, sexual abuse, emotional abuse or neglect and the
co-occurrence of these types of abuse or neglect.
The collection also includes numbers of admissions to, and discharges from, care and
protection orders and out-of-home care; and information on households providing foster and
relative/kinship care placements.
In addition to providing information on the current collection period, the collection also
enables some trends to be examined, providing a valuable source of data for monitoring
various components of the child protection system. Overall, these data give a detailed view
of statutory child protection in Australia.
Data sourced from national child protection collections are used for reporting under the
National Framework for Protecting Australia’s Children 2009–2020 and in the annual Report on
Government Services (RoGS) for most jurisdictions.
Accuracy
Data for the child protection collections are extracted each year from the administrative
systems of the state and territory departments responsible for child protection in Australia,
according to definitions and technical specifications agreed to by the departments and the
AIHW. Data represent a ‘snapshot’ of the data at the time of extraction and may not include
retrospective updates made to data held by state/territory departments. As such, national
data included in this report may not match state/territory data.
Some data included in this report may not match data reported in the RoGS due to
retrospective updates to state/territory data and differences in the data extraction and
analysis methodologies.
Scope and coverage
National child protection data are based only on those cases reported to departments
responsible for child protection and therefore are likely to understate the true prevalence of
child abuse and neglect across Australia. Further, notifications made to other organisations,
such as the police or non-government welfare agencies, are only included if they were also
referred to departments responsible for child protection.
As children may receive a combination of child protection services there are important links
and overlaps between the notifications, investigations and substantiations; care and
protection orders; and out-of-home care data modules. For example, children who are the
subjects of substantiations may be placed on care and protection orders, and many children
on care and protection orders are also in out-of-home care. The overall number of children
receiving child protection services, along with the overlaps between the separate data
modules, were reported for the first time in 2012–13.
Child protection Australia 2013–14
123
Each year a number of children are the subjects of more than 1 notification and/or
substantiation during the year. The proportion of children who were the subject of more than
1 substantiation in the year was reported for the first time in 2012–13.
Ongoing work is being undertaken on the CP NMDS to broaden the scope of the national
data collection and to improve comparability of data across jurisdictions.
Data quality
Overall, the quality and coverage of the child protection data collection are good. However,
data availability affects the interpretability of some data presented.
•
Number of investigations by source of notification was not available for South Australia for
2013–14.
•
For data on Children who were the subjects of substantiations, by type of family in which the
child was residing, 2013–14:
–
Victoria and South Australia reported a large proportion of family types in the ‘not
stated’ category (94% and 34%, respectively) and these have not been included in the
total.
–
Data were not available for New South Wales.
–
Western Australia recorded single-parent families in the ‘other’ category.
•
Information on family type and SES can be recorded at different times: at the time the
abuse or neglect took place, or at the time of the notification, investigation or
substantiation.
•
Children aged 0–17 who were the subjects of substantiations of notifications received during
2013–14, by Indigenous status should be interpreted with caution due to the high
proportion of children whose Indigenous status was unknown in Western Australia and
Tasmania (26% and 28%, respectively).
•
Children substantiated in 2012–13, and who were subsequently placed on care and
protection orders within 12 months, was not available for New South Wales.
•
Households exiting foster care and relative/kinship care were not available for New
South Wales.
•
Relative/kinship carer households with a placement during the year was not available
for Queensland.
•
The age of children commencing intensive family support services was not available for
South Australia and the Northern Territory.
•
The living arrangements of children commencing intensive family support services were
not available for South Australia and Tasmania.
Coherence
National child protection data have been provided to the AIHW since 1993 under the
agreement between the Australian Government, the states and territories and the AIHW
concerning the provision of data on welfare services. In 1993, separate reports were
published on child abuse and neglect (Child abuse and neglect Australia 1990–91), and care and
protection orders (Children under care and protection orders Australia 1990–91).
Child protection Australia 1996–97 contained consolidated information on several child
protection data modules (notifications, investigations, substantiations; care and protection
124
Child protection Australia 2013–14
orders; and out-of-home care) for the first time. Child protection Australia has subsequently
been released as an annual report in that format. Limited data on intensive family support
services were included for the first time in Child protection Australia 2003–04. Data on foster
carer households were included for the first time in Child protection Australia 2009–10 and
relative/kinship carer data were included for the first time in Child protection Australia
2010–11. New analyses included for the first time in Child protection Australia 2012–13 related
to:
•
unique children receiving child protection services in each jurisdiction
•
the number of substantiations per child
•
co-occurring types of abuse and neglect
•
SES
•
average day measures of children on orders; children in out-of-home care; and carer
households approved/authorised to provide funded out-of-home care placements.
The ability to replicate and expand on existing national reporting was the primary focus of
the new unit record level collection following the implementation of the CP NMDS in
2012–13. Existing national technical specifications were retained and clarified as part of this
process.
It is standard practice to present 5-year trends in data, as changes in state and territory
legislation, policy/practice and information management systems reduce the ability to
accurately compare data over longer periods. Changes that have an impact on the data are
provided as caveats to the data and in relevant appendixes to Child protection Australia
reports.
Notifications, investigations and substantiations data for non-Indigenous children before
2009–10 included children of unknown Indigenous status. Following improvements to the
data collection methodology in 2009–10, these children are able to be separately identified
and excluded from the non-Indigenous count. Therefore, there is a break in the time series
for children in substantiations by Indigenous status between 2008–09 and 2009–10.
The revised methodology used by the ABS to obtain estimates of the resident population for
Indigenous and non-Indigenous children in 2013–14 resulted in an increase in estimates of
the number of Indigenous Australians based on the 2011 Census compared with those based
on the 2006 Census (see ABS 2013a). This means that rates calculated with the 2011
Indigenous population estimates are lower than those based on the 2006 Census. To maintain
consistency in the denominator and allow comparisons over time, all rates for the period
2009–10 to 2013–14 have been calculated using the 2011 Census-based population estimates,
including back-cast historical estimates. Therefore, rates presented in this report are not
comparable to rates calculated using estimates based on the 2006 Census, including those
published in previous editions of Child protection Australia.
Child protection Australia 2013–14
125
Glossary
administrative arrangements: Agreements with the child protection departments, which
have the same effect as a court order of transferring custody or guardianship. These
arrangements can also allow a child to be placed in out-of-home care without going through
the courts.
age: The age of a person in completed years, or ‘unborn’ for those in utero and ‘less than 1
year’ where age is between live birth and less than 1 year. The tables containing information
for notifications, investigations and substantiations show age at the time of notification. The
tables containing information on children on orders by type of living arrangements and
children in out-of-home care at 30 June show age at 30 June 2014. Tables containing
information on admissions or discharges show age at the time of first admission or
discharge. For intensive family support services, age is shown as at the commencement of
the service.
agency: A body funded by state and territory departments responsible for child protection to
provide services.
anonymous: Of unknown name.
capital city: A state or territory capital city.
care and protection orders: Legal orders or arrangements that give child protection
departments some responsibility for a child’s welfare. See also finalised guardianship or
custody orders; finalised third-party parental responsibility orders; finalised supervisory
orders; interim and temporary orders; and administrative arrangements.
child: A young person aged 0–17.
child care personnel: Those engaged in providing occasional, part-time or full-time day care
for children.
child concern reports: Reports to community services departments regarding concerns about
a child, where there is no indication that a child may have been, or is at risk of being, harmed
through abuse or neglect. This may include concerns about a child’s welfare related to the
quality of his or her home environment or the standard of care that he or she is receiving.
child protection and support services: Those departments in each state and territory that are
responsible for child protection matters.
children receiving child protection services: Children who are the subjects of an
investigation of a notification; on a care and protection order; and/or in out-of-home care.
children subject to orders: Children aged 0–17 on a care and protection order or other
formal arrangement, or children aged 18 or under who were discharged from those care and
protection orders/arrangements. See also care and protection orders.
custody orders: See finalised guardianship or custody orders.
dealt with by other means: A notification that was responded to by means other than an
investigation, such as the provision of advice or referral to services. Notifications dealt with
by other means are divided into 2 categories: notifications in process and notifications
resolved without investigation.
126
Child protection Australia 2013–14
departmental officer: Any person who is employed by a state or territory department
responsible for child protection who is not classified under any other ‘source of notification’
category.
emotional abuse: Any act by a person having the care of a child that results in the child
suffering any kind of significant emotional deprivation or trauma. Children affected by
exposure to family violence are also included in this category.
family care: Where the child is residing with parents (natural or adoptive) or other
relatives/kin (other than parents) who are not reimbursed. See also two parent—intact; two
parent—step or blended; single parent—female; single parent—male; and relatives or kin
(other than parents) who are not reimbursed.
family group homes: Homes for children provided by a department or community-sector
agency which have live-in, non-salaried carers who are reimbursed and/or subsidised for
the provision of care.
family of residence: The family type where a child is living at the time of notification of
child abuse or neglect. The family type of a child is classified into 8 main categories: two
parent—intact; two parent—step or blended; single parent—female; single parent—male;
other relatives/kin; foster care; other; and not stated.
finalised guardianship or custody orders: Orders involving the transfer of legal
guardianship to the relevant state or territory department or non-government agency. These
orders involve considerable intervention in the child’s life and that of their family, and are
sought only as a last resort. Guardianship orders convey responsibility for the welfare of the
child to the guardian (for example, regarding the child’s education, health, religion,
accommodation and financial matters). They do not necessarily grant the right to the daily
care and control of the child, or the right to make decisions about the daily care and control
of the child, which are granted under custody orders.
Custody orders generally refer to orders that place children in the custody of the state or
territory department responsible for child protection or non-government agency. These
orders usually involve the child protection department being responsible for the daily care
and requirements of the child, while the parent retains legal guardianship. Custody alone
does not bestow any responsibility regarding the long-term welfare of the child.
finalised investigation: A notification received between 1 July 2013 and 30 June 2014 that
was investigated, and where the investigation was completed and an outcome recorded by
31 August 2014. The cut-off point of 31 August is applied to allow time for investigating
notifications made close to the end of the financial year. The ‘outcomes of finalised
investigations’ are classified into two categories: substantiated and not substantiated.
finalised supervisory orders: Orders giving the department responsible for child protection
some responsibility for a child’s welfare. Under these orders, the department supervises
and/or directs the level and type of care that is to be provided to the child.
Children under supervisory orders are generally under the responsibility of their parents
and the guardianship or custody of the child is unaffected. Finalised supervisory orders are
therefore less interventionist than finalised guardianship or custody orders, but require the
child’s parent or guardian to meet specified conditions, such as medical care of the child.
finalised third-party parental responsibility orders: Orders transferring all duties, powers,
responsibilities and authority parents are entitled to by law, to a nominated person(s) whom
the court considers appropriate. The nominated person may be an individual such as a
Child protection Australia 2013–14
127
relative or an officer of the state or territory department. Third-party parental responsibility
may be ordered in the event that a parent is unable to care for a child, and as such parental
responsibility is transferred to a relative.
‘Permanent care orders’ are an example of a third-party parental responsibility order and
involve the transfer of guardianship to a third-party carer. Such orders can also be applied to
the achievement of a stable arrangement under a long-term guardianship order to the age of
18 without guardianships being transferred to a third party. These orders are only applicable
in some jurisdictions.
foster care: A form of out-of-home care where the caregiver is authorised and reimbursed (or
was offered but declined reimbursement) by the state/territory for the care of the child. (This
category excludes relatives/kin who are reimbursed). There are varying degrees of
reimbursement made to foster carers.
formal shared care: Where a case plan exists for children to live in family care and to have
regular planned periods in out-of-home care.
foster carer household: A private household containing one or more foster carers:
•
who have undergone the relevant screening/selection and approval process
•
who have received authorisation from the relevant department or agency to enable a
child to be placed in their care
•
for whom reimbursement is available from the state or territory government for
expenses incurred in caring for the child (there are varying degrees of reimbursement
made to foster carers)
•
who are part of an ongoing review process.
friend/neighbour: An unrelated person or acquaintance who is known to, or lives in close
proximity to, the subject child or their family, or to the person believed to be responsible for
the abuse or neglect.
guardianship orders: See finalised guardianship or custody orders.
home-based out-of-home care: Where placement is in the home of a carer who is reimbursed
(or who has been offered but declined reimbursement) for the cost of care of the child. There
are 3 categories of home-based out-of-home care: relatives/kin who are reimbursed; foster
care; and other home-based out-of-home care.
hospital/health centre personnel: Any person not elsewhere classified who is employed at a
public or private hospital or other health centre or clinic.
households commencing care: Includes all carer households that, during the year ended 30
June, received authorisation from the relevant department or agency to enable a child to be
placed in their care, regardless of whether they actually had a child placed in their care in
that period. This includes households that received provisional authorisation (which may be
in order to facilitate a placement), whilst formal approval/registration was being finalised—
these households are only included once, at the time of provisional authorisation (and not
again when full authorisation is received). Households commencing care for the first time
are included. Households whose existing authorisation has been renewed as part of a
standard ongoing review process are excluded. Households receiving authorisation to
provide respite care only (and not also authorisation to provide general foster or
relative/kinship care) are excluded.
128
Child protection Australia 2013–14
households exiting care: Includes any carer household that, at some point during the year
ended 30 June, were no longer authorised by the relevant department or agency to have a
child placed in their care. For example, the carer household may have voluntarily
withdrawn/deregistered, or the relevant department or agency may have formally revoked
their authorisation. Households changing from provisional authorisation to full
authorisation are excluded.
independent living: Accommodation including private board and lead tenant households.
Indigenous status: Whether a person identifies as an Aboriginal or Torres Strait Islander and
is accepted as such by the community in which he or she lives. See also Indigenous, nonIndigenous and unknown Indigenous status.
Indigenous: Includes children of Aboriginal or Torres Strait Island descent who identify and
are identified as an Aboriginal or Torres Strait Islander.
intensive family support services: Services that aim to prevent imminent separation of
children from their primary caregivers because of child protection concerns, and those
services that aim to reunify families where separation has already occurred.
interim and temporary orders: Orders covering the provision of a limited period of
supervision and/or placement of a child. Parental responsibility under these orders may
reside with the parents or with the department responsible for child protection. ‘Unfinalised
orders’ (such as applications to the court for care and protection orders) are also included in
this category, unless another finalised order is in place.
investigation: Investigations are the process whereby the relevant department obtains more
detailed information about a child who is the subject of a notification received between 1 July
2013 and 30 June 2014. Departmental staff make an assessment about the harm or degree of
harm to the child and their protective needs. An investigation includes sighting or
interviewing the child where it is practical to do so. See also investigation in process;
investigation closed—no outcome possible; and finalised investigation.
investigation in process: A notification received between 1 July 2013 and 30 June 2014 that
was investigated, but where the investigation was not completed and an investigation
outcome was not recorded by 31 August 2014.
investigation closed—no outcome possible: A notification made between 1 July 2013 and
30 June 2014 that was investigated, but where the investigation was not able to be finalised in
order to reach the outcome of ‘substantiated’ or ‘not substantiated’ and files were closed for
administrative purposes. This may happen, for example, in cases where the family has
relocated. These investigations were completed between 1 July 2013 and 30 June 2014.
living arrangements: The type of care in which a child on an order was residing. See also
residential care, foster care, family group homes, home-based out-of-home care and family
care.
living situation: The type of care in which the child or children in the family at the time of
case commencement for intensive family support services. See also family care; out-of-home
care; formal shared care; and other living arrangement.
location: The site at which the intensive family support service workers are based. If an
agency has more than one location, each location must be counted.
medical practitioner: Registered medical practitioners. This includes both general
practitioners and specialists in hospitals or in the community.
Child protection Australia 2013–14
129
neglect: Any serious acts or omissions by a person having the care of a child that, within the
bounds of cultural tradition, constitute a failure to provide conditions that are essential for
the healthy physical and emotional development of a child.
non-government organisation: Any non-government organisation that provides services to
the community on a non-profit-making basis, not classified under any other ‘source of
notification’ category.
non-Indigenous: Includes children who have not been identified as being of Aboriginal or
Torres Strait Islander descent; this excludes children of unknown Indigenous status.
notifications: Contacts made to an authorised department by persons or other bodies
making allegations of child abuse or neglect, child maltreatment or harm to a child.
notifications in process: Notifications where the decision to investigate has not been
reached.
notifications resolved without investigation: Notifications that were responded to by
means other than an investigation such as provision of advice or referral to services.
not stated: Where information was unknown or not recorded.
not substantiated: A notification received between 1 July 2013 and 30 June 2014 where an
investigation concluded that there was no reasonable cause to suspect prior, current or
future abuse, neglect or harm to the child.
other family of residence: Family of residence not otherwise categorised. This includes nonfamily situations, such as hostels and institutional accommodation.
other health personnel: Any person engaged in supplementary, paramedical and/or
ancillary medical services. This includes nurses, infant welfare sisters, dentists,
radiographers, physiotherapists, pharmacists, and so forth. It does not include social workers
and non-medical hospital/health centre personnel.
other home-based out-of-home care: Where the child was in home–based out-of-home care,
other than with relatives/kin who are reimbursed or in foster care.
other living arrangements: Living arrangements not otherwise classified, including
unknown living arrangements. For children on orders, this also includes any placements
made in disability services; psychiatric services; juvenile justice facilities; specialist
homelessness services and overnight child care services; boarding schools; hospitals;
hotels/motels; and the defence forces. These living arrangements may have rostered and/or
paid staff, and are generally not a home-like environment.
other out-of-home care: Out-of-home care placements that are not otherwise categorised,
including unknown placement types. This includes boarding schools; hospitals;
hotels/motels; and the defence forces.
other relative/kin: Relatives of the child (other than parents), including grandparents, aunts,
uncles or cousins. The relationship can be full, half or step, or through adoption, and can be
traced through, or to, a person whose parents were not married to each other at the time of
his or her birth. This category also includes members of Indigenous communities who are
accepted by that community as being related to the child.
other source of notification: All other persons or organisations not classified by any other
source of notification category (for example, ministers of religion or government agencies
and instrumentalities not classified above).
130
Child protection Australia 2013–14
other urban: Cities and towns other than the capital city.
out-of-home care: Overnight care for children aged 0–17, where the state makes a financial
payment or where a financial payment has been offered but has been declined by the carer.
See also residential care; family group homes; foster care; relative/kinship care;
independent living; and other out-of-home care.
parent/guardian: A natural or substitute parent; spouse of a natural parent; adoptive parent
or spouse of an adoptive parent; or any other person who has an ongoing legal responsibility
for the care and protection of a child.
permanent care orders: See finalised third-party parental responsibility orders.
physical abuse: Any non-accidental physical act inflicted upon a child by a person having
the care of a child.
police: Any member of a Commonwealth, state or territory law enforcement agency.
prevention services: Services specifically aimed at assisting families in order to prevent
imminent separation of children from their primary caregivers for child protection reasons.
relative kinship care: A form of out-of-home care where the caregiver is:
•
a relative (other than parents)
•
considered to be family or a close friend
•
a member of the child or young person’s community (in accordance with their culture)
•
who is reimbursed by the state/territory for the care of the child (or who has been
offered but declined reimbursement).
For Aboriginal and Torres Strait Islander children, a kinship carer may be another
Indigenous person who is a member of their community, a compatible community or from
the same language group.
relative/kinship carer household: A private household containing one or more
relative/kinship carers:
•
who have undergone the relevant screening/selection and approval process
•
who have received authorisation from the relevant department or agency to enable a
relative/kinship child to be placed in their care
•
for whom reimbursement is available from a government authority or non-government
organisation for expenses incurred in caring for the child (there are varying degrees of
reimbursement made to relative/kinship carers)
•
who are part of an ongoing review process.
relatives/kin who are not reimbursed: Relatives/kin (other than parents) who are not
reimbursed by the state/territory for the care of the child.
relatives/kin who are reimbursed: Where the caregiver is:
•
a relative (other than parents)
•
considered to be family or a close friend
•
a member of the child or young person’s community (in accordance with their culture)
•
who is reimbursed by the state/territory for the care of the child (or who has been
offered but declined reimbursement).
Child protection Australia 2013–14
131
For Aboriginal and Torres Strait Islander children, a kinship carer may be another
Indigenous person who is a member of their community, a compatible community or from
the same language group.
residential care: Where the placement is in a residential building whose purpose is to
provide placements for children and where there are paid staff.
respite care: Respite care is a form of out-of-home care used to provide short-term
accommodation for children and young people where the intention is for the child to return
to their prior place of residence. Respite placements include:
•
respite from birth family, where a child is placed in out-of-home care on a temporary
basis for reasons other than child protection (for example, the child’s parents are ill or
unable to care for them on a temporary basis; as a family support mechanism to prevent
entry into full-time care; as part of the reunification process; or as a shared care
arrangement)
•
respite from placement, where a child spends regular, short and agreed periods of time
with another carer other than their primary carer.
reunification services: Services that seek to reunify families where separation of children
from their primary caregivers has already occurred for child protection reasons.
rural or remote: Areas outside the cities and towns.
school personnel: Any appropriately trained person involved in the instruction of, or
imparting of knowledge to, children, or providing direct support for this education. This
includes teachers, teachers’ aides, school principals and counsellors who work in preschool,
kindergarten, primary, secondary, technical, sporting or art-and-crafts education.
sexual abuse: Any act by a person, having the care of a child, that exposes the child to, or
involves the child in, sexual processes beyond his or her understanding or contrary to
accepted community standards.
sibling: A brother or half-brother, sister or half-sister, whether natural (that is, biological),
adopted or foster.
single parent—female: Families with a female single parent, whether biological, step or
adoptive.
single parent—male: Families with a male single parent, whether biological, step or
adoptive.
social worker/welfare worker/psychologist/other trained welfare worker: Any person
engaged in providing a social- or welfare-work service in the community.
source of notification: The person or organisation that initially made a child protection
notification to the relevant authority. The source is classified according to the relationship to
the child allegedly abused, neglected or harmed. The source of notification is reported into
16 categories: parent/guardian; sibling; other relative; friend/neighbour; medical
practitioner; other health personnel; hospital/health centre personnel; social
worker/welfare worker/psychologist/other trained welfare worker; school personnel; child
care personnel; police; departmental officer; non-government organisation; anonymous;
other; and not stated.
substantiations of notifications: Substantiations of notifications received during the current
reporting year refer to child protection notifications made to relevant authorities between 1
132
Child protection Australia 2013–14
July 2013 and 30 June 2014, which were investigated and the investigation was finalised by
31 August 2014, and where it was concluded that there was reasonable cause to believe that
the child had been, was being, or was likely to be, abused, neglected or otherwise harmed.
Substantiation does not necessarily require sufficient evidence for a successful prosecution
and does not imply that treatment or case management was provided. Substantiations may
also include cases where there is no suitable caregiver, such as children who have been
abandoned or whose parents are deceased.
third-party parental responsibility orders: See finalised third-party parental responsibility
orders.
two parent—intact: Two-parent families where both parents are either the biological or
adoptive parents of the child.
two parent—step or blended: Blended and reconstituted families (one biological parent and
one step-parent).
type of abuse or neglect: Substantiations are classified into 4 categories: physical abuse,
sexual abuse, emotional abuse and neglect. Each category includes findings of actual harm or
significant risk of harm. Where more than one type of abuse or neglect has occurred, the
substantiation should be classified to the type likely to be the most severe in the short term
or to place the child at risk in the short term—or, if such an assessment is not possible,
classified to the most obvious form of abuse or neglect. See also physical abuse, sexual
abuse, emotional abuse and neglect.
type of action for notifications: Actions taken by the department responsible for child
protection in response to notifications. See also investigation and dealt with by other
means.
type of placement: The type of out-of-home care in which a child was residing. See also
residential care; family group homes; home-based out-of-home care; independent living;
and other out-of-home care.
unknown Indigenous status: Includes children whose Indigenous status was unknown.
Child protection Australia 2013–14
133
References
ABS (Australian Bureau of Statistics) 2011. Socio-economic indexes for areas: getting a
handle on individual diversity within areas. ABS cat. no.1351.0.55.036. Canberra: ABS.
ABS 2013a. Census of Population and Housing: Understanding the Increase in Aboriginal
and Torres Strait Islander Counts, 2006–2011. ABS cat. no. 2077.0. Canberra: ABS.
ABS 2013b. Socio-economic indexes for areas (SEIFA), Australia, 2011. ABS cat. no.
2033.0.55.001. Canberra: ABS.
ABS 2014a. Australian Demographic Statistics, Dec 2013. ABS cat. no. 3101.0. Canberra: ABS.
ABS 2014b. Australian Demographic Statistics, Jun 2014. ABS cat. no. 3101.0. Canberra: ABS.
ABS 2014c. Estimates and projections, Aboriginal and Torres Strait Islander Australians, 2001
to 2026 (Series B). ABS cat. no. 3238.0. Canberra: ABS.
ABS 2014d. Recorded crime – victims, Australia, 2013. ABS cat. no. 4510.0. Canberra: ABS.
AIFS (Australian Institute of Family Studies): Bromfield L & Higgins DJ 2005. National
comparison of child protection systems. Melbourne: AIFS.
AIFS: Bromfield, L & Holzer P 2008. A national approach for child protection: project report.
Melbourne: AIFS.
AIFS: Holzer P & Bromfield L & 2008. NCPASS comparability of child protection data:
project report. Melbourne: AIFS.
AIFS: Hunter C & Price-Robertson R 2012. Family structure and child maltreatment: do some
family types place children at greater risk? CFCA Paper No. 10. Melbourne: AIFS.
Australian Institute of Health and Welfare 2011. Educational outcomes of children on
guardianship or custody orders: a pilot study, stage 2. Child welfare series no. 49. Cat. no.
CWS 37. Canberra: AIHW.
AIHW 2012. Aboriginal and Torres Strait Islander identification in community services data
collections: an updated data quality report. Cat. no. IHW 80. Canberra: AIHW.
AIHW 2013a. National Framework for Protecting Australia's Children 2009–2020: technical
paper on operational definitions and data issues for key national indicators. Cat. no. CWS 44.
Canberra: AIHW.
AIHW 2013b. Scoping reportable measures for the National Framework for Protecting
Australia's Children 2009–2020: supporting outcome 1. Cat. no. CWS 45. Canberra: AIHW.
AIHW 2014a. A new approach to national child protection data: implementation of the Child
Protection National Minimum Data Set. Child welfare series no. 59. Cat. no. CWS 50.
Canberra: AIHW.
AIHW 2014b. Child protection Australia 2012–13. Child welfare series 58. Cat. no. CWS 49.
Canberra: AIHW.
AIHW 2014c. Indigenous child safety. Cat. no. IHW 127. Canberra: AIHW.
COAG (Council of Australian Governments) 2009. Protecting children is everyone’s
business: National Framework for Protecting Australia’s Children 2009–2020. Canberra:
Commonwealth of Australia.
134
Child protection Australia 2013–14
COAG 2012. Protecting children is everyone’s business: National Framework for Protecting
Australia’s Children 2009–2020. Annual report to the Council of Australian Governments
2010–11. Canberra: Commonwealth of Australia.
COAG 2013. Protecting children is everyone’s business: National Framework for Protecting
Australia’s Children 2009–2020. Annual report to the Council of Australian Governments
2011–12. Canberra: COAG.
COAG 2014. Protecting children is everyone’s business: National Framework for Protecting
Australia’s Children 2009–2020. Annual report to the Council of Australian Governments
2012–13. Canberra: COAG.
Commissioner for Children Tasmania 2010. Inquiry into the circumstances of a 12 year old
child under Guardianship of the Secretary: Final Report. Tasmania: Commissioner for
Children.
Commissioner for Public Administration 2004a. The Territory as a parent: a review of the
safety of children in care in the ACT and of ACT Child Protection management. Canberra:
Commissioner for Public Administration.
Commissioner for Public Administration 2004b. The Territory’s children: ensuring safety and
quality of care for children and young people. Report on the audit and case review.
Canberra: Commissioner for Public Administration.
Crime and Misconduct Commission 2004. Protecting children: an inquiry into the abuse of
children in foster care. Brisbane: CMC.
DHS (Department of Human Services) 2012. Protecting children, changing lives: a new way
of working. Melbourne: Victorian Government DHS.
FaHCSIA (Department of Families, Housing, Community Services and Indigenous Affairs)
2011. An outline of National Standards for out-of-home care: a priority project under the
National Framework for Protecting Australia’s Children 2009–2020. Canberra:
Commonwealth of Australia.
FaHCSIA 2012. Protecting children is everyone’s business. National Framework for
Protecting Australia’s Children 2009–2020: second three-year action plan. Canberra:
FaHSCIA.
HREOC (Human Rights and Equal Opportunity Commission) 1997. Bringing them home.
Report of the national inquiry into the separation of Aboriginal and Torres Strait Islander
children from their families. Sydney: HREOC.
Jacob A & Fanning D 2006. Report on child protection services in Tasmania. Hobart:
Tasmanian Department of Health and Human Services and the Commissioner for Children.
Lock JA 1997. The Aboriginal Child Placement Principle: research project no. 7. Sydney: New
South Wales Law Reform Commission.
Mullighan EP 2008a. Children in state care: commission of inquiry. Adelaide: Office of the
Commissioner.
Mullighan EP 2008b. Children on Anangu Pitjantjatjara Yankunytjatjara (APY) lands:
commission of inquiry. Adelaide: Office of the Commissioner.
New South Wales Ombudsman 2011. Keep Them Safe? A special report to Parliament under
s31 of the Ombudsman Act 1974. Sydney: NSW Ombudsman.
Child protection Australia 2013–14
135
New South Wales Ombudsman 2012. Responding to child sexual assault in Aboriginal
communities: A report under Part 6A of the Community Services (Complaints, Reviews and
Monitoring) Act 1993. Sydney: NSW Ombudsman.
Northern Territory Government 2010. Growing them strong, together: promoting the safety
and wellbeing of the Northern Territory’s children. Report of the Board of Inquiry into the
child protection system in the Northern Territory 2010. Darwin: Northern Territory
Government.
Parliament of Tasmania 2011. Select Committee on Child Protection: final report. Hobart:
Parliament of Tasmania.
Queensland Child Protection Commission of Inquiry 2013.Taking responsibility: a roadmap
for Queensland Child Protection. Queensland: Queensland Child Protection Commission of
Inquiry.
Royal Commission into Institutional Responses to Child Sexual Abuse 2015a. Sydney:
Commonwealth of Australia. Viewed 9 January 2015,
< www.childabuseroyalcommission.gov.au/about-us/our-reports/>.
Royal Commission into Institutional Responses to Child Sexual Abuse 2015b. Sydney:
Commonwealth of Australia. Viewed 9 January 2015,
<www.childabuseroyalcommission.gov.au/policy-and-research/published-research/>.
Scott D & Nair L 2013. Child protection statistics for Aboriginal and Torres Strait Islander
children. Melbourne: AIFS. Viewed 10 June 2014,
<http://www.aifs.gov.au/nch/pubs/sheets/rs10/rs10.html>.
SCRGSP (Steering Committee for the Review of Government Service Provision) 2015. Report
on Government Services 2015. Canberra: Productivity Commission.
State Government of Victoria 2012. Report of the Protecting Victoria’s Vulnerable Children
Inquiry. Melbourne: Victorian Department of Premier and Cabinet.
Victorian Government 2012. Victoria’s vulnerable children—our shared responsibility
directions paper. Melbourne: Victorian Government.
Wood J 2008. Report of the Special Commission of Inquiry into Child Protection Services in
NSW. Sydney: State of NSW through the Special Commission of Inquiry into Child
Protection Services in NSW.
136
Child protection Australia 2013–14
List of tables
Table 2.1:
Children receiving child protection services, states and territories, by number and
number per 1,000 children, 2013–14 ........................................................................................... 11
Table 2.2:
Children who were the subject of a finalised investigation only in 2013–14, by
investigation outcome .................................................................................................................. 12
Table 2.3:
Rates of children receiving child protection services during 2013–14, by age group,
states and territories (number per 1,000 children) ................................................................... 15
Table 3.1:
Number of notifications, substantiations of notifications and number of children
who were the subject of a notification and/or substantiation of a notification, states
and territories, 2013–14 ................................................................................................................ 20
Table 3.2:
Number of substantiations per child, 2013–14 (%)................................................................... 20
Table 3.3:
Co-occurrence of substantiated types of abuse and neglect, 2013–14 (%) ............................ 22
Table 3.4:
Rates of children aged 0–17 who were the subjects of substantiations of
notifications received during 2013–14, by age group, states and territories
(number per 1,000 children) ........................................................................................................ 23
Table 3.5:
Children aged 0–17 who were the subjects of substantiations of notifications
received during 2013–14, by Indigenous status, states and territories (number and
number per 1,000 children) ......................................................................................................... 26
Table 4.1:
Key care and protection order statistics, 2013–14..................................................................... 33
Table 4.2:
Children admitted to, and discharged from, care and protection orders, states and
territories, 2013–14 ........................................................................................................................ 36
Table 4.3:
Children on care and protection orders, by type of order, states and territories,
30 June 2014 ................................................................................................................................... 39
Table 4.4:
Children on care and protection orders, by number and number per 1,000 children
aged 0–17 and Indigenous status, states and territories, 30 June 2014 .................................. 41
Table 4.5:
Rates of children on care and protection orders, states and territories, 30 June
2010 to 30 June 2014 (number per 1,000) ................................................................................... 43
Table 5.1:
Key out-of-home care statistics, 2013–14 ................................................................................... 45
Table 5.2:
Children in out-of-home care, by length of time in continuous placement, states
and territories, 30 June 2014 ........................................................................................................ 49
Table 5.3:
Children in out-of-home care, order status, states and territories, 30 June 2014 ................. 50
Table 5.4:
Children in out-of-home care, by number and number per 1,000 children aged
0–17 and Indigenous status, states and territories, 30 June 2014 ........................................... 51
Table 5.5:
Children discharged from out-of-home care, states and territories, 2009–10 to
2013–14 ........................................................................................................................................... 53
Table 5.6:
Children aged 0–17 in out-of-home care, states and territories, 30 June 2010
to 30 June 2014 (number and number per 1,000) ...................................................................... 54
Table 6.1:
Key foster and relative/kinship carer statistics, at 30 June 2014 and during 2013–14 ........ 56
Table 6.2:
Foster carer households with a placement, states and territories, at 30 June 2014
and during 2013–14 ...................................................................................................................... 57
Table 6.3:
Number of households commencing and exiting foster care, 2013–14 ................................. 59
Child protection Australia 2013–14
137
Table 6.4:
Relative/kinship carer households with a placement, state and territories,
at 30 June 2014 and during 2013–14 ........................................................................................... 59
Table 6.5:
Number of households commencing and exiting relative/kinship care, 2013–14 .............. 60
Table 7.1:
Key intensive family support services statistics, 2013–14 ....................................................... 61
Table 7.2:
Number of children aged 0–17 commencing intensive family support services,
by age at commencement of service, states and territories, 2013–14 ..................................... 62
Table A1:
Number of children receiving child protection services, by components of service,
states and territories, 2013–14 ..................................................................................................... 64
Table A2:
New and repeat clients receiving child protection services, by service type, 2013–14 ....... 65
Table A3:
Number of children receiving child protection services by age group and
Indigenous status, states and territories, 2013–14 .................................................................... 66
Table A4:
Notifications, by type of action, states and territories, 2013–14 ............................................. 68
Table A5:
Number of investigations, by source of notification, states and territories, 2013–14 .......... 70
Table A6:
Children who were the subjects of investigations by outcome, states and
territories, 2013–14 (number) ...................................................................................................... 71
Table A7:
Children who were the subjects of substantiations of notifications received
during 2013–14, by type of abuse or neglect and sex, states and territories ......................... 72
Table A8:
Children who were the subjects of substantiations of notifications received
during 2013–14, by age group and Indigenous status, states and territories ....................... 74
Table A9:
Number of children who were the subjects of substantiations by socioeconomic
status and Indigenous status, 2013–14 ....................................................................................... 76
Table A10: Children who were the subjects of substantiations during 2013–14, by type of
family in which the child was residing, states and territories ................................................ 77
Table A11: Children aged 0–17 who were the subjects of substantiations of notifications
received during 2013–14, by type of abuse or neglect and Indigenous status,
states and territories ..................................................................................................................... 78
Table A12: Number of notifications, states and territories, 2009–10 to 2013–14 ...................................... 80
Table A13: Number of substantiations of notifications received during the relevant year,
states and territories, 2009–10 to 2013–14 .................................................................................. 81
Table A14: Rates of children who were the subjects of substantiations of notifications
received during the relevant year, states and territories, 2009–10 to 2013–14
(number per 1,000 children) ........................................................................................................ 82
Table A15: Children on care and protection orders, on an average day, by type of order,
2013–14 ........................................................................................................................................... 83
Table A16: Care and protection orders issued, by type of order, states and territories, 2013–14 ......... 84
Table A17: Children substantiated in 2012–13 and subsequently placed on care and
protection orders within 12 months, states and territories ..................................................... 85
Table A18: Children admitted to care and protection orders, by age group, states and
territories, 2013–14 ........................................................................................................................ 86
Table A19: Children discharged from care and protection orders, by length of time on an
order, states and territories, 2013–14.......................................................................................... 87
Table A20: Children on care and protection orders, by living arrangements, states and
territories, 30 June 2014 ............................................................................................................... 88
138
Child protection Australia 2013–14
Table A21: Children on care and protection orders, by age group and living arrangements,
30 June 2014 ................................................................................................................................... 89
Table A22: Children on care and protection orders, by age group, states and territories,
30 June 2014 ................................................................................................................................... 90
Table A23: Children on care and protection orders, by sex, states and territories,
30 June 2014 ................................................................................................................................... 91
Table A24: Children on care and protection orders, by type of order and Indigenous
status, states and territories, 30 June 2014 ................................................................................. 92
Table A25: Children in out-of-home care, on an average day, by living arrangements,
2013–14 ........................................................................................................................................... 94
Table A26: Children admitted to out-of-home care, by age group, states and territories,
2013–14 ........................................................................................................................................... 95
Table A27: Children discharged from out-of-home care, by age group, states and territories,
2013–14 ........................................................................................................................................... 96
Table A28: Children in out-of-home care, by type of placement, states and territories,
30 June 2014 ................................................................................................................................... 97
Table A29: Children in out-of-home care, by age group, states and territories, 30 June 2014 ............... 98
Table A30: Children in out-of-home care, by sex, states and territories, 30 June 2014 ........................... 98
Table A31: Children in out-of-home care, by age group and type of placement,
30 June 2014 (%) ............................................................................................................................ 99
Table A32: Children in out-of-home care, by Indigenous status and age group, 30 June 2014 ........... 100
Table A33: Aboriginal and Torres Strait Islander children in out-of-home care, by
Indigenous status and relationship of carer, states and territories, 30 June 2014 .............. 101
Table A34: Overview of funded out-of-home carer households, on an average day during
2013–14 ......................................................................................................................................... 102
Table A35: Foster carer households with a placement at 30 June 2014, by number of foster
children placed ............................................................................................................................ 102
Table A36: Relative/kinship carer households with a placement at 30 June 2014, by
number of children placed ........................................................................................................ 103
Table A37: Children commencing intensive family support services, by living arrangements
at commencement of service, states and territories, 2013–14 (%)......................................... 104
Table A38: National child protection trend data, 2009–10 to 2013–14 .................................................... 105
Table A39: Children in the child protection system, by Indigenous status, 2010 to 2014 .................... 106
Table A40: Children who were the subjects of substantiations, by age group, 2009–10 to
2013–14 ......................................................................................................................................... 107
Table A41: Children who were the subjects of substantiations, by abuse type and sex,
2009–10 to 2013–14...................................................................................................................... 108
Table A42: Trends in children on care and protection orders, states and territories,
30 June 2010 to 30 June 2014 ..................................................................................................... 109
Table A43: Trends in children admitted to care and protection orders, states and territories,
2009–10 to 2013–14 ...................................................................................................................... 109
Table A44: Trends in children discharged from care and protection orders, states and
territories, 2009–10 to 2013–14 .................................................................................................. 110
Child protection Australia 2013–14
139
Table A45: Trends in children admitted to out-of-home care, states and territories,
2009–10 to 2013–14 ...................................................................................................................... 110
Table A46: Population of children aged 0–17, by age group and Indigenous status,
December 2013 ............................................................................................................................ 111
Table A47: Population of children aged 0–17, by age group and Indigenous status, June 2014 ......... 112
Table A48: Population of all children aged 0–17, by age group, December 2013 .................................. 113
Table A49: Population of all children aged 0–17, by age group, June 2014 ............................................ 113
Table A50: Population of children aged 0–17, by Indigenous status and age group, June 2014 ......... 113
140
Child protection Australia 2013–14
List of figures
Figure 1.1:
The child protection process in Australia .................................................................................... 2
Figure 2.1:
Children receiving child protection services in Australia during 2013–14 ............................. 9
Figure 2.2:
Children receiving child protection services by components of service received,
2013–14 ........................................................................................................................................... 12
Figure 2.3:
New and repeat clients receiving child protection services, by service type,
2013–14 ........................................................................................................................................... 14
Figure 2.4:
Children receiving child protection services by Indigenous status, states and
territories, 2013–14 (rate and rate ratio) ..................................................................................... 16
Figure 2.5:
Children receiving child protection services by age group and Indigenous status,
2013–14 ........................................................................................................................................... 16
Figure 3.1:
Key notifications, investigations and substantiations statistics, 2013–14 ............................. 17
Figure 3.2:
Children who were the subjects of finalised investigations by outcome, states and
territories, 2013–14 ........................................................................................................................ 19
Figure 3.3:
Children who were the subjects of substantiations of notifications received during
2013–14, by primary type of abuse or neglect, states and territories ..................................... 21
Figure 3.4:
Children who were the subjects of substantiations of notifications received during
2013–14, by type of abuse or neglect and sex ............................................................................ 24
Figure 3.5:
Children who were the subjects of substantiations, by socioeconomic status at
notification, 2013–14 ..................................................................................................................... 25
Figure 3.6:
Children who were the subjects of substantiations of notifications received during
2013–14, by Indigenous status and type of abuse (%). ............................................................ 27
Figure 3.7:
Number of notifications, investigations and substantiations, 2009–10 to 2013–14 .............. 28
Figure 3.8:
Children who were the subjects of child protection notifications and substantiations,
2009–10 to 2013–14 (rate) ............................................................................................................. 29
Figure 3.9:
Children aged 0–17 who were subjects of child protection substantiations by
age group, 2009–10 to 2013–14 (rate).......................................................................................... 30
Figure 3.10: Children who were the subjects of child protection substantiations, by abuse type,
2009–10 to 2013–14 (rate) ............................................................................................................. 31
Figure 3.11: Children who were the subjects of child protection substantiations, by Indigenous
status, 2009–10 to 2013–14 (rate and rate ratio) ........................................................................ 32
Figure 4.1:
Care and protection orders issued, by type of order, 2013–14 ............................................... 35
Figure 4.2:
Children admitted to care and protection orders, by age group, states and territories,
2013–14 ........................................................................................................................................... 37
Figure 4.3:
Children discharged from care and protection orders, by length of time on an
order, 2013–14 ............................................................................................................................... 38
Figure 4.4:
Children on care and protection orders, by living arrangements, 30 June 2014 .................. 40
Figure 4.5:
Children admitted to, and discharged from, care and protection orders,
2009–10 to 2013–14........................................................................................................................ 42
Figure 4.6:
Children aged 0–17 on care and protection orders, by Indigenous status,
30 June 2010 to 30 June 2014 (rate) ............................................................................................. 44
Child protection Australia 2013–14
141
Figure 5.1:
Children admitted to, and discharged from, out-of-home care, by age group,
2013–14 ........................................................................................................................................... 47
Figure 5.2:
Children in out-of-home care, states and territories, 30 June 2014 (rate) .............................. 47
Figure 5.3:
Children in out-of-home care, by living arrangements, states and territories,
30 June 2014 ................................................................................................................................... 48
Figure 5.4:
Aboriginal and Torres Strait Islander children in out-of-home care, by
Indigenous status and relationship of carer, states and territories, 30 June 2014 ................ 52
Figure 5.5:
Children admitted to and discharged from out-of-home care, 2009–10 to 2013–14 ............ 53
Figure 5.6:
Children aged 0–17 in out-of-home care by Indigenous status, 30 June 2010 to
30 June 2014 (rate) ......................................................................................................................... 55
Figure 6.1:
Foster carer households with a placement at 30 June 2014, by number of foster
children placed .............................................................................................................................. 58
Figure 6.2:
Relative/kinship carer households with a placement at 30 June 2014, by number
of children placed ......................................................................................................................... 60
Figure 7.1:
Children commencing intensive family support services, by living arrangements
at commencement of service, states and territories, 2013–14 ................................................. 63
142
Child protection Australia 2013–14
Related publications
This report, Child protection Australia 2013–14, is part of an annual series. Supplementary
population data tables (those with a prefix of S) are part of the Child protection Australia
2013–14 release. These tables as well as earlier editions of the report can be downloaded for
free from the AIHW website: <http://www.aihw.gov.au/child-protection-publications/>.
The website also includes information on ordering printed copies.
The following AIHW publications relating to children, youth and families might also be of
interest:
•
AIHW 2014. A new approach to national child protection data: implementation of the
Child Protection National Minimum Data Set. Child welfare series no. 59. Cat. no. CWS
50. Canberra: AIHW.
•
AIHW 2014. Hospitalised injury in children and young people 2011–12. Injury research
and statistics series no. 91. Cat. no. INJCAT 167. Canberra: AIHW.
•
AIHW 2014. Indigenous child safety. Cat. no. IHW 127. Canberra: AIHW.
•
AIHW 2013. Australia’s welfare 2013. Australia’s welfare no. 11. Cat. no. AUS 174.
Canberra: AIHW.
•
AIHW 2013. Development of an ongoing national data collection on the educational
outcomes of children in child protection services: a working paper. Child welfare series
56. Cat. no. CWS 46. Canberra: AIHW.
•
AIHW 2013. National Framework for Protecting Australia's Children 2009–2020:
technical paper on operational definitions and data issues for key national indicators.
Cat. no. CWS 44. Canberra: AIHW.
•
AIHW 2013. Scoping reportable measures for the National Framework for Protecting
Australia's Children 2009–2020: supporting outcome 1. Cat. no. CWS 45. Canberra:
AIHW.
•
AIHW 2012. A picture of Australia’s children 2012. Cat. no. PHE 167. Canberra: AIHW.
•
AIHW 2011. Educational outcomes of children under guardianship or custody orders: a
pilot study, Stage 2. Child welfare series no. 49. Cat. no. CWS 37. Canberra: AIHW.
•
AIHW 2011. Headline indicators for children’s health, development and wellbeing, 2011.
Cat. no. PHE 144. Canberra: AIHW.
•
AIHW 2011. National outcome measures for early childhood development: development
of indicator based reporting framework. Cat. no. PHE 134. Canberra: AIHW.
•
AIHW 2011. Young Australians: their health and wellbeing 2011. Cat. no. PHE 140.
Canberra: AIHW.
Child protection Australia 2013–14
143
• around 143,000 children, a rate of 27.2 per 1,000 children,
received child protection services (investigation, care and
protection order and/or in out-of-home care).
• three-quarters (73%) of these children had previously been
the subject of an investigation, care and protection order
and/or out-of-home care placement.
• Aboriginal and Torres Strait Islander children were 7 times
as likely as non-Indigenous children to be receiving child
protection services.
Child protection Australia 2013–14
This report contains comprehensive information on state and
territory child protection and support services in 2013–14,
and the characteristics of Australian children within the child
protection system. This report shows that:
Child protection Australia
2013–14
AIHW
Child welfare series No. 61


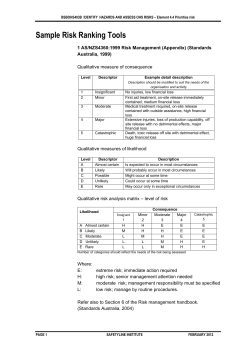
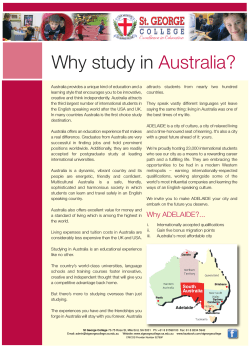
© Copyright 2026